Embed Size (px)
Citation preview

Carbon Footprint for Buildings - Part 1
5.0 PDH/ 4 CE Hours/ 5 AIA LU/HSW
AIAPDH150
PDH Academy PO Box 449
Pewaukee, WI 53072 www.pdhacademy.com
[email protected] 888-564-9098
1
Carbon Footprint – Part I Final Exam
1) Identify the Agreement that aims “to keep the global temperature rise this century well below 2 degrees Celsius above pre-industrial levels.” a. Kyoto Protocol b. Paris Agreement c. Montreal Protocol
d. None of the above
2) Which one of the following is not included in the Greenhouse Gas (GHG) reporting under
Kyoto Protocol?
a. Carbon dioxide (CO2) b. Methane (CH4) c. Carbon monoxide (CO)
d. Nitrous oxide (N2O)
3) refers to the total amount of Greenhouse Gases that are emitted into the atmosphere each year by a person, family, building, organization, orcompany. a. Carbon Footprint b. Carbon Sequestration c. Carbon Capture d. Carbon Cycle
4) The total life cycle energy use of low-energy buildings is less than the conventional buildings, however the embodied energy of materials used in such buildings are generally higher.
a. True b. False

2
5) stage of building life-cycle Includes processes from the practical completion of construction works to the point of deconstruction or demolition of building. Includes emissions from use, maintenance, repair, replacement, refurbishment, operational energy andwater use. a. Product b. Construction c. Use
d. End-of-Life
6) According to GHG Protocol, there are three distinct Greenhouse Gas accounting scopes namely: Scope 1, Scope 2, and Scope 3. accounts direct Greenhouse Gas emissions or removals a. Scope 1 b. Scope 2
c. Scope 3 d. None of the above
7) A building that uses no fossil fuel, Greenhouse Gas emitting energy to operate is referred to as . a. Zero Net Carbon Building b. Carbon Neutral Building c. Carbon Negative Building
d. Zero Carbon Building
8) A highly energy efficient building that produces on-site, or procures, enough carbon-free renewable energy to meet building operations energy consumption annually is referred to as . a. Zero Net Carbon Building b. Carbon Neutral Building c. Carbon Negative Building d. Zero Carbon Building
9) The Carbon Carbon Metric proposed by the United Nations Environment Program – Sustainable
Buildings and Climate Initiative (UNEP – SBCI) is consistent with which one of the following ISO Standards? a. ISO 14040/44:2006: Environmental Management – Life Cycle Assessment – Principles and
Procedures; and Requirements and Guidelines. b. ISO 21930: 2007: Sustainability in Building Construction – Environmental Declarations of
Building Products. c. ISO 15392: 2008: Sustainability in Building Construction: GeneralPrinciples. d. None of the above
3
10) The major aspects of carbon footprint have been incorporated widely in prevalent multi-attribute rating systems such as LEED from U.S. Green Building Council (USGBC), Living Building Challenge from International Living Future Institute (ILFI) U.S., Green Globes from Green Building Initiative (GBI), BREAM from Building Research Establishment (BRE) U.K., Green Star form Green Building Council Australia (GBCA), Passive House Institute U.S. (PHIUS) – to name a few. Yet, there is no rating system assessing and certifying carbon footprint of buildings.
a. True b. False

Carbon Footprint of Buildings – Part I
Course Description The manufacture of building materials, and the construction, use and deconstruction of buildings are, among others, the major cause of greenhouse gas emissions. In this age of climate change, it is critical to assess the environmental impacts of such materials and buildings. This course presents Carbon Footprint, a term used to discuss the amount of greenhouse gases that when emitted exacerbate the global warming of the planet. After a discussion of the background of Carbon Footprint, this course discusses the various concepts of terminologies and provides a deeper understanding of the environmental standards, the standards related to Carbon Footprint, the use of Carbon Footprint in volunteer building certification programs such as LEED, Green Globes, BREEAM, etc. After review of all course material, a final exam (included with course) must be completed. A score of 70% or better must be achieved to pass the assessment and receive the certificate of completion.
Learning Objectives Learning Objective 1: Define Carbon Footprint in the context of buildings and materials used Learning Objective 2: Classify and describe various Carbon Footprint concepts such as Zero Net Carbon Buildings, Low Carbon Buildings, Carbon Neutrality, etc. Learning Objective 3: Describe Carbon Footprint and express its importance in the age of climate change. Learning Objective 4: Recognize Carbon Footprint standards as well as how they can be applied in volunteer certification programs such as LEED, Green Globes, BREEAM, etc.
Course Outline
1. Introduction a. International Consortiums and Agreements b. Basic Terminologies c. Greenhouse Gases d. Climate Change Indicators e. Climate Risk
2. Background a. Building and Its Impact to Climate Change b. What is Carbon Footprint? c. Difference between Carbon Footprint and Life Cycle Assessment d. Why Carbon Footprint is Important for Architects and Engineers
3. Concepts a. Zero Net Carbon Buildings b. Low Carbon Buildings c. Carbon Neutral Buildings d. Carbon Negative Buildings e. Carbon Offset
4. Standards a. Environmental Standards b. Standards Related to Carbon Footprint c. Building Rating Systems and Carbon Footprint d. Necessity for a Global Environmental Standard for Buildings

About Authors
Ravi Srinivasan is an Assistant Professor of Low / Net Zero Energy Buildings at the M.E. Rinker, Sr. School of Construction Management at the University of Florida. Dr. Srinivasan received his Ph.D. and M.S. in Architecture (Building Technology) from the University of Pennsylvania; M.S in Civil Engineering from the University of Florida and B.Architecture from National Institute of Technology, India. He is a Certified Energy Manager, LEED AP, and Green Globes Professional. Dr. Srinivasan is the author of The Hierarchy of Energy in Architecture: Emergy Analysis, PocketArchitecture Technical Series (Routledge, Taylor & Francis, 2015) with Kiel Moe, Harvard University. He is the co-editor of Smart Cities: Foundations, Principles and Applications (Wiley & Sons, 2017). He has contributed to over 60 technical articles published in peer-reviewed international journals (impact factor > 2), chapters and conference proceedings. He is an active reviewer for reputed journals such as Building and Environment, and Energy and Buildings. He is a consultant on several green building projects worldwide, particularly in the field of building energy modeling. He frequently participates in international conferences, scientific workshops, and policy support meetings. Dr. Srinivasan’s current research focuses on the development of Dynamic Sustainability Information Modeling (Dynamic-SIM) Workbench with integrative three- dimensional building modeling, simulation and visualization platform using extensible virtual environments for net zero campuses and cities. More info: https://built-ecologist.com/
Jaya Lakshmanan is an independent voice in the area of Energy and Environmental Accounting research, a stand-alone sub-discipline of accounting research. She has a Master of Accounting degree from Fisher School of Accounting, University of Florida. After a fling with a thought-provoking audit career, Jaya's focus amalgamated into finding solutions for pressing environmental issues related to Climate Change. Thus, evolved Silpa Inc. < http://silpainc.com/ >, a firm that focuses on complex problem-solving in the field of energy and environmental accounting. Jaya has played an integral role in establishing an open source sustainability information modeling and decision support system that helps in measuring and reducing environmental impacts of buildings. She has worked on numerous projects of all sizes in the area of building energy modeling and sustainability using environmental frameworks to account and reduce carbon emissions, energy use, water use and waste generation and recommend off-setting strategies. She has co-authored six scientific research papers on Sustainability, Energy and Environment that were published in reputed International Conference Proceedings and / or Journal Publication. She is a certified Leadership in Energy and Environmental Design Accredited Professional (LEED AP).
For questions or comments, please contact [email protected]

Page
1
1.0 Introduction Cities are facing unprecedented growth with an increase in population and urbanization. The
United Nations estimates that the global population will increase to 9.3 billion by 2050, which is an increase of 30% compared to the population in 2011. Also, over the same period, urban area will grow faster and are anticipated to increase by 2.6 billion people.1 Urbanization requires development of extensive infrastructure that imposes heavy loads on the environment in various forms, namely depletion of resources and contamination of air, water, and land. Furthermore, with an increase in migration of people from rural areas to cities, levels of wealth, style of living conditions, and changes to household sizes, a larger increase in greenhouse gas emissions looms.
Similar to any stable body, the Earth attempts to maintain an energy balance, i.e., a balance between the incoming and outgoing radiation from the sun. To elaborate, only 71% of sun’s visible and Ultraviolet (UV) enters the atmosphere; 23% of this radiation is absorbed by water vapor, aerosols, and ozone, while the remaining 43% is absorbed by the Earth’ surface and re-radiated as Infrared (IR) heat.
From NASA’s Global Climate Change – Vital Signs of the Planet website <https://climate.nasa.gov/causes >
“A layer of greenhouse gases – primarily water vapor, and including much smaller amounts of carbon dioxide,
methane and nitrous oxide – acts as a thermal blanket for the Earth, absorbing heat and warming the surface to a
life-supporting average of 59 degrees Fahrenheit (15 degrees Celsius).”
1 Kolter, J. Z., and Ferreira, J. (2011). "A Large-Scale Study on Predicting and Contextualizing Building Energy Usage."
While the Information contained in this course has been presented with all due care, the authors do not warrant or represent that the Information is free from errors or omission. The authors accept no liability whatsoever for, or in respect of any use or reliance upon this publication by any party. Authors: Ravi Srinivasan and Jaya Lakshmanan

P a g e 2 | 24
While the bulk of Earth’s atmosphere namely Oxygen and Nitrogen absorb this outgoing reflected radiation, there are other gases in the atmosphere namely carbon dioxide (CO2), methane (CH4), nitrous oxide (N2O) and other gases trap this outgoing reflected energy and radiate in all directions impacting the energy balance. These gases are referred to as ‘greenhouse gases.’
The long-term shift (extended period of time, e.g., several decades or longer) in weather as a result of changes in the atmosphere-ocean-land system that affects a region’s weather is referred to as the Climate Change (American Chemical Society, 2011). Some notable impacts of such energy imbalance results in increase in Earth’s surface temperature; increase in sea level (also referred to as sea level rise which is due to the melting of the polar icebergs and increase in ocean temperature expands sea water thereby resulting in sea level rise); changes to weather patterns and precipitation, etc. Effects of global warming are rampant in coastal cities inundated with constant flooding of seawater.
At this juncture, it is crucial to measure and mitigate greenhouse gas emission. The potential loss to human health and the environment due to green-house gas emissions prompted formation of international collaborations, consortia, and conferences. Particularly, with the building sector consuming over 40% of all energy used globally, a deeper understanding of the concepts of building energy and carbon is a necessity.
In the viewpoint of Climate Change,
- The first section of this chapter provides an overview of international consortiums and agreements. The discussion will present the foremost authority in the field of climate change and ratifying agreements that has prevailed over the years among United Nation members.
- The second section of this chapter provides basic terminologies as it pertains to Climate, Climate
or Earth System, Radiation, Greenhouse Gas, Greenhouse Effect, Global Temperatures and Concentrations, Emissions and Removals, Mitigation and Adaptation, and Carbon.
- The third section of this chapter provides an overview of Greenhouse Gases such as Carbon
dioxide, Methane, Nitrous Oxide and Fluorinated Gases, along with Gases covered under Montreal Protocol.
- The forth section of this chapter provides an overview of Climate Change indicators as it relates
to greenhouse gases, weather and climate, oceans, snow and ice, health and society and ecosystems.
- The fifth section of this chapter provides an overview of Climate Risk and discusses key determinants of Climate Impact.

P a g e 3 | 24
"if left unchecked, from 2000 and 2100, global average temperatures increases of 2 to 5 degree Celcius and sea level rise of 2 to 4 feet are likely, and much larger increases are possible."
- IPCC 2013 Report
1.1. INTERNATIONAL CONSORTIUMS AND AGREEMENTS
The Intergovernmental Panel on Climate Change (IPCC) was setup in 1988 by two United Nation (UN) organizations, the World Meteorological Organization (WMO) and the United Nations Environment Programme (UNEP). IPCC is the foremost authoritative international body for assessing the science related to climate change, its impacts and future risks, and options for adaptation and mitigation.
Assessment Reports prepared by IPCC provide the state of scientific, technical and socio- economic knowledge on climate change, its causes, potential impacts and response strategies2. As of writing this course, the IPCC is currently in its Sixth Assessment cycle. In addition to the development of the Sixth Assessment Report (AR6), IPCC will produce three Special Reports, a Methodology Report on national greenhouse gas inventories.
• IPCC First Assessment Report 1990: This comprises of three individual Working Groups namely 'Scientific Assessment of Climate Change,' 'Impacts Assessment of Climate Change,' and 'The IPCC Response Strategies.'
• IPCC Second Assessment Report 1995: Similar to the First AR, the Second AR comprises 'The Science of Climate Change,' 'Impacts, Adaptations and Mitigation of Climate Change: Scientific- Technical Analyses.' and 'Economic and Social Dimensions of Climate Change.'
• IPCC Third Assessment Report 2001: The three Working Group reports are 'The Scientific Basis,' 'Impacts, Adaptation and Vulnerability,' and 'Mitigation.'
• IPCC Fourth Assessment Report 2007: This comprises of 'The Physical Science Basis,' 'Impacts, Adaptation and Vulnerability,' and 'Mitigation of Climate Change.'
• IPCC Fifth Assessment Report 2013-2014: This comprises of 'Climate Change 2013: The Physical Science Basis,' 'Climate Change 2014: Impacts, Adaptation, and Vulnerability,' and 'Climate Change 2014: Mitigation of Climate Change.'
IPCC assessment reports assist policymakers worldwide to develop climate-related policies, and
they underlie the negotiations at the UN Climate Conference – the United Nations Framework Convention on Climate Change (UNFCCC). 3
The United Nations Framework Convention on Climate Change (UNFCCC), adopted in 1992, is an international environmental treaty with the objective to "stabilize greenhouse gas concentrations in the atmosphere at a level that would prevent dangerous anthropogenic [i.e., human-induced] interference with the climate system".4 Although the framework does not have any enforcement mechanisms, it outlines the potential "protocols" or "agreements" that may be negotiated to prevent dangerous
2 https://www.ipcc.ch/activities/activities.shtml 3 https://www.ipcc.ch/news_and_events/docs/factsheets/FS_what_ipcc.pdf 4 http://unfccc.int/files/essential_background/background_publications_htmlpdf/application/pdf/conveng.pdf

P a g e 4 | 24
anthropogenic interference with the climate system. Examples of such agreements include the Kyoto Protocol and Paris Agreement.
From NASA’s Global Climate Change – Vital Signs of the Planet website
<https://climate.nasa.gov/climate_resources/26/ >
“The above graphic lists four highlights from the Intergovernmental Panel on Climate Change's (IPCC) Fifth Assessment Report Summary for Policy Makers, released September 27, 2013, which more than 25
NASA scientists helped author and review. The report is the work of 209 lead authors and 50 review editors from 39 countries, and over 600 contributing authors from 32 countries.”

P a g e 5 | 24
“to reduce greenhouse gas emissions, based on the fact that (a) global warming exists and (b) human-made CO2 emissions have caused it.”
“ to strengthen the global response to the threat of climate change by keeping a global temperature rise this century well below 2 degrees Celsius above pre-industrial levels and to
pursue efforts to limit the temperature increase even further to 1.5 degrees Celsius.”
Kyoto Protocol
The Kyoto Protocol is an international treaty that extends the 1992 UNFCCC’s commitment to reduce greenhouse gas emissions. This protocol deals with reducing greenhouse gas concentrations in the atmosphere to a “level that would prevent dangerous anthropogenic interference with the climate system.” 5 This Protocol was adopted in 1997, and as of December 2012, 192 parties have ratified this Protocol. It is to be noted that U.S. has not ratified this Protocol as of 2016.
The central aim of Kyoto Protocol is:
Although there are some criticisms to this Protocol, this Protocol is a “small but essential first
step towards stabilizing atmospheric concentrations of greenhouse gases.6” This Protocol excludes emissions due to international aviation and shipping.
Paris Agreement
The Paris Agreement deals with greenhouse gas emissions mitigation, adaptation, and finance mechanisms. Although this Agreement, within the United National Framework Convention on Climate Change (UNFCCC), was signed by 195 countries globally, it was ratified i.e., confirmed the agreement for adoption by 148 countries as of June 2017.
The central goal of the Paris Agreement is,
Paris Agreement was enforced on 4th November, 2016 after at least 55 Parties to the Convention - accounting for at least an estimated 55% of the total global greenhouse gas emissions - deposited their instruments of ratification, acceptance, approval or accession with the Depository.7
Although voluntary, the United States has submitted a report titled, 'Mid-Century Strategy for Deep Decarbonization' in November 2016.8 This report listed three major categories of action to achieve deep economy-wide net greenhouse gas emissions reduction:
"I. Transitioning to a low-carbon energy system, by cutting energy waste, decarbonizing the electricity system and deploying clean electricity and low carbon fuels in the transportation, buildings, and industrial sectors.
5 http://unfccc.int/resource/docs/convkp/kpeng.pdf 6 Joint statement made by seventeen national science academies. 7 http://unfccc.int/focus/ndc_registry/items/9433.php 8 https://unfccc.int/files/focus/long-term_strategies/application/pdf/mid_century_strategy_report-final_red.pdf

P a g e 6 | 24
“to protect the ozone layer by phasing out the production of numerous substances that are
responsible for ozone depletion.”
II. Sequestering carbon through forests, soils, and CO2 removal technologies, by bolstering the amount of carbon stored and sequestered in U.S. lands (“the land sink”) and deploying CO2 removal technologies like carbon beneficial bioenergy with carbon capture and storage (BECCS), which can provide “negative emissions”; and
III. Reducing non-CO2 emissions, such as methane, nitrous oxide, and fluorinated gases, which result mainly from fossil fuel production, agriculture, waste, and refrigerants."
However, at the time of writing this chapter, U.S. has exited the Paris Agreement as of June 2017.
Montreal Protocol on Substances that Deplete the Ozone Layer (Montreal Protocol)
The Montreal Protocol is an international treaty that deals with substances that deplete the stratospheric ozone layer by phasing out the production of ozone depleting substances. This Protocol was agreed in 1987 and enforced on 1st January, 1989. This Protocol has been ratified by 197 countries making it the first international treaty of the United Nations that achieved a universal ratification and considered by many as the most successful global action on an environmental issue.
The central aim of Montreal Protocol is:
In particular, this treaty focused on ozone depleting substances that contain either chlorine or bromine, and implemented Phase-out Management Plans for (1) Chloro-Fluoro-Carbons (CFCs), (2) Hydro-Chloro-Fluoro-Carbons (HCFCs), and (3) Hydro-Fluoro-Carbons (HFCs). Studies have shown that since the treaty was signed in 1987, the atmospheric concentrations of ozone depleting substances that contain chlorine has decreased or levelled-off. In the U.S., it is estimated that over 280 million cases of skin cancer, 1.5 million skin cancer deaths, and 45 million cataracts were prevented thanks to the Montreal Protocol (US EPA 2015). 9
9 Updating Ozone Calculations and Emissions Profiles for Use in the Atmospheric and Health Effects Framework Model http://www.epa.gov/ozone/science/effects/AHEF_2015_Update_Report-FINAL_508.pdf

P a g e 7 | 24
1.2. BASIC TERMINOLOGIES
A fundamental understanding of the basic terms are necessary for a contextual and technical application of Carbon Footprint concept. The US Environmental Protection Agency (EPA) has complied a clear and succinct terms in their glossary of Climate Change.10 A selective group of terms are reprinted here under 5 categories, namely (1) Climate, (2) Climate or Earth System, (3) Radiation, (4) Greenhouse Gas, Greenhouse Effect, Global Temperatures and Concentrations, and (5) Emissions and Removals, Vulnerability, Mitigations and Adaptation.
Basic terminologies related to Climate
Climate Climate in a narrow sense is usually defined as the "average weather," or more rigorously, as the statistical description in terms of the mean and variability of relevant quantities over a period of time ranging from months to thousands of years. The classical period is 3 decades, as defined by the World Meteorological Organization (WMO). These quantities are most often surface variables such as temperature, precipitation, and wind. Climate in a wider sense is the state, including a statistical description, of the climate system.
Climate Change Climate change refers to any significant change in the measures of climate lasting for an extended period of time. In other words, climate change includes major changes in temperature, precipitation, or wind patterns, among others, that occur over several decades or longer.
Climate Feedback A process that acts to amplify or reduce direct warming or cooling effects. Climate Lag The delay that occurs in climate change as a result of some factor that
changes only very slowly. For example, the effects of releasing more carbon dioxide into the atmosphere occur gradually over time because the ocean takes a long time to warm up in response to a change in radiation.
Climate Model A quantitative way of representing the interactions of the atmosphere, oceans, land surface, and ice. Models can range from relatively simple to quite comprehensive.
Climate Sensitivity Model
In Intergovernmental Panel on Climate Change (IPCC) reports, equilibrium climate sensitivity refers to the equilibrium change in global mean surface temperature following a doubling of the atmospheric (equivalent) CO2 concentration. More generally, equilibrium climate sensitivity refers to the equilibrium change in surface air temperature following a unit change in radiative forcing (degrees Celsius, per watts per square meter, (C/Wm-2). One method of evaluating the equilibrium climate sensitivity requires very long simulations with Coupled General Circulation Models (Climate model). The effective climate sensitivity is a related measure that circumvents this requirement. It is evaluated from model output for evolving non-equilibrium conditions. It is a measure of the strengths of the feedbacks at a particular time and may vary with forcing history and climate state.
10 See glossary of Climate Change at https://www3.epa.gov/climatechange/glossary.html. Refer the website for a comprehensive list of terms related to Climate change.
P a g e 8 | 24
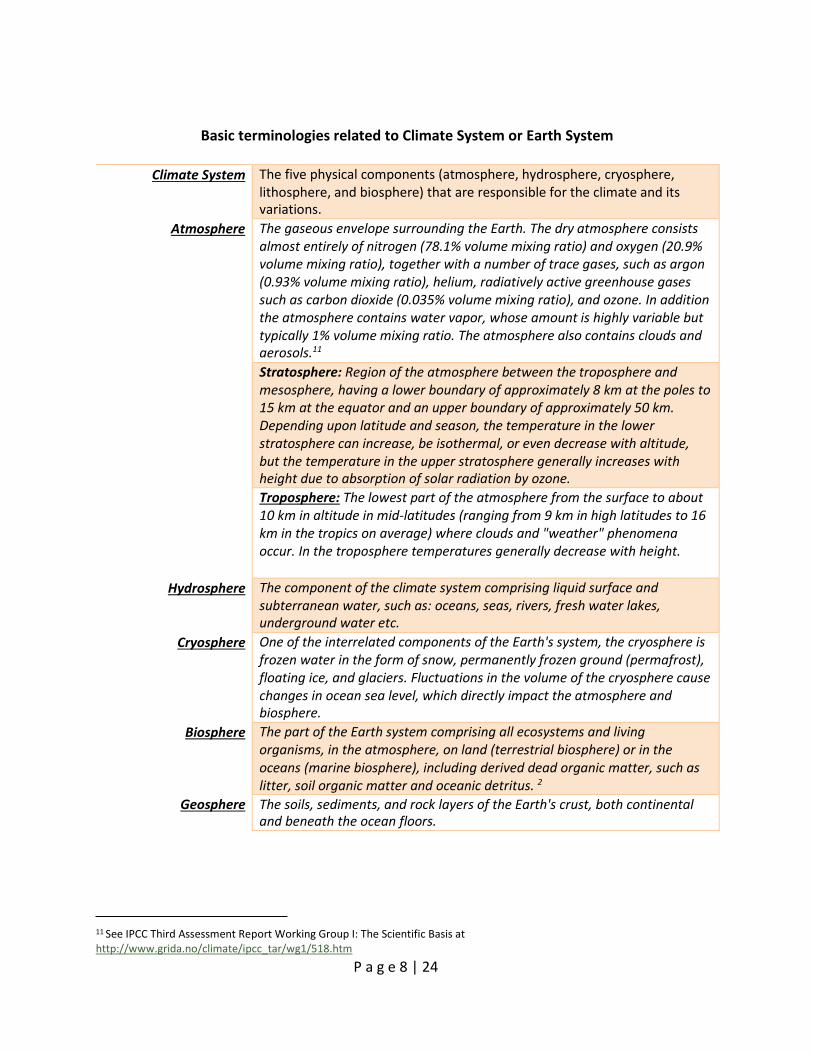
Basic terminologies related to Climate System or Earth System
Climate System The five physical components (atmosphere, hydrosphere, cryosphere,
lithosphere, and biosphere) that are responsible for the climate and its variations.
Atmosphere The gaseous envelope surrounding the Earth. The dry atmosphere consists almost entirely of nitrogen (78.1% volume mixing ratio) and oxygen (20.9% volume mixing ratio), together with a number of trace gases, such as argon (0.93% volume mixing ratio), helium, radiatively active greenhouse gases such as carbon dioxide (0.035% volume mixing ratio), and ozone. In addition the atmosphere contains water vapor, whose amount is highly variable but typically 1% volume mixing ratio. The atmosphere also contains clouds and aerosols.11
Stratosphere: Region of the atmosphere between the troposphere and mesosphere, having a lower boundary of approximately 8 km at the poles to 15 km at the equator and an upper boundary of approximately 50 km. Depending upon latitude and season, the temperature in the lower stratosphere can increase, be isothermal, or even decrease with altitude, but the temperature in the upper stratosphere generally increases with height due to absorption of solar radiation by ozone.
Troposphere: The lowest part of the atmosphere from the surface to about 10 km in altitude in mid-latitudes (ranging from 9 km in high latitudes to 16 km in the tropics on average) where clouds and "weather" phenomena occur. In the troposphere temperatures generally decrease with height.
Hydrosphere The component of the climate system comprising liquid surface and subterranean water, such as: oceans, seas, rivers, fresh water lakes, underground water etc.
Cryosphere One of the interrelated components of the Earth's system, the cryosphere is frozen water in the form of snow, permanently frozen ground (permafrost), floating ice, and glaciers. Fluctuations in the volume of the cryosphere cause changes in ocean sea level, which directly impact the atmosphere and biosphere.
Biosphere The part of the Earth system comprising all ecosystems and living organisms, in the atmosphere, on land (terrestrial biosphere) or in the oceans (marine biosphere), including derived dead organic matter, such as litter, soil organic matter and oceanic detritus. 2
Geosphere The soils, sediments, and rock layers of the Earth's crust, both continental and beneath the ocean floors.
11 See IPCC Third Assessment Report Working Group I: The Scientific Basis at http://www.grida.no/climate/ipcc_tar/wg1/518.htm
P a g e 9 | 24
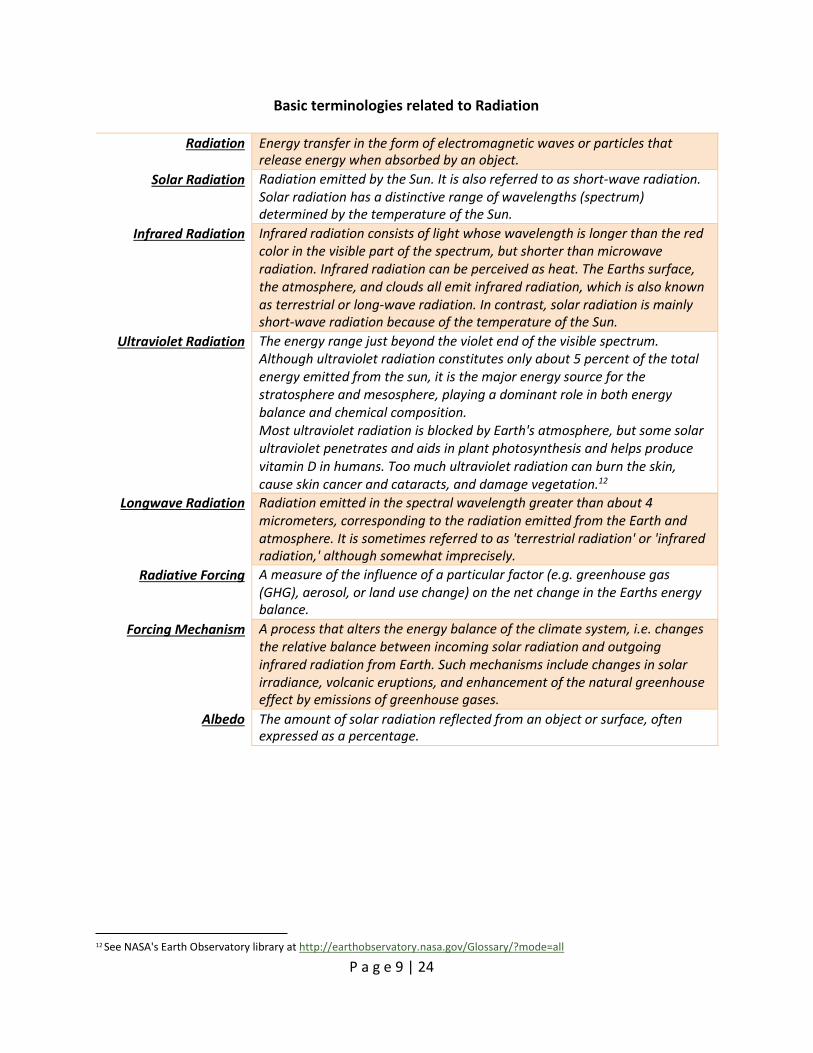
Basic terminologies related to Radiation
Radiation Energy transfer in the form of electromagnetic waves or particles that release energy when absorbed by an object.
Solar Radiation Radiation emitted by the Sun. It is also referred to as short-wave radiation. Solar radiation has a distinctive range of wavelengths (spectrum) determined by the temperature of the Sun.
Infrared Radiation Infrared radiation consists of light whose wavelength is longer than the red color in the visible part of the spectrum, but shorter than microwave radiation. Infrared radiation can be perceived as heat. The Earths surface, the atmosphere, and clouds all emit infrared radiation, which is also known as terrestrial or long-wave radiation. In contrast, solar radiation is mainly short-wave radiation because of the temperature of the Sun.
Ultraviolet Radiation The energy range just beyond the violet end of the visible spectrum. Although ultraviolet radiation constitutes only about 5 percent of the total energy emitted from the sun, it is the major energy source for the stratosphere and mesosphere, playing a dominant role in both energy balance and chemical composition. Most ultraviolet radiation is blocked by Earth's atmosphere, but some solar ultraviolet penetrates and aids in plant photosynthesis and helps produce vitamin D in humans. Too much ultraviolet radiation can burn the skin, cause skin cancer and cataracts, and damage vegetation.12
Longwave Radiation Radiation emitted in the spectral wavelength greater than about 4 micrometers, corresponding to the radiation emitted from the Earth and atmosphere. It is sometimes referred to as 'terrestrial radiation' or 'infrared radiation,' although somewhat imprecisely.
Radiative Forcing A measure of the influence of a particular factor (e.g. greenhouse gas (GHG), aerosol, or land use change) on the net change in the Earths energy balance.
Forcing Mechanism A process that alters the energy balance of the climate system, i.e. changes the relative balance between incoming solar radiation and outgoing infrared radiation from Earth. Such mechanisms include changes in solar irradiance, volcanic eruptions, and enhancement of the natural greenhouse effect by emissions of greenhouse gases.
Albedo The amount of solar radiation reflected from an object or surface, often expressed as a percentage.
12 See NASA's Earth Observatory library at http://earthobservatory.nasa.gov/Glossary/?mode=all

P a g e 10 | 24
Basic terminologies related to Greenhouse Gas, Greenhouse Effect, Global Temperatures and Concentrations
Greenhouse Gas (GHG) Any gas that absorbs infrared radiation in the atmosphere. Greenhouse gases include, carbon dioxide, methane, nitrous oxide, ozone, chlorofluorocarbons, hydrochlorofluorocarbons, hydrofluorocarbons, perfluorocarbons, sulfur hexafluoride.
Greenhouse Effect Trapping and build-up of heat in the atmosphere (troposphere) near the Earths surface. Some of the heat flowing back toward space from the Earth's surface is absorbed by water vapor, carbon dioxide, ozone, and several other gases in the atmosphere and then reradiated back toward the Earths surface. If the atmospheric concentrations of these greenhouse gases rise, the average temperature of the lower atmosphere will gradually increase.
Enhanced Greenhouse
Effect
The concept that the natural greenhouse effect has been enhanced by increased atmospheric concentrations of greenhouse gases (such as CO2 and methane) emitted as a result of human activities. These added greenhouse gases cause the earth to warm.
Global Average Temperature
An estimate of Earths mean surface air temperature averaged over the entire planet.
Global Warming The recent and ongoing global average increase in temperature near the Earths surface.
Global Warming Potential
A measure of the total energy that a gas absorbs over a particular period of time (usually 100 years), compared to carbon dioxide.
Concentration Amount of a chemical in a particular volume or weight of air, water, soil, or other medium.
Parts Per Million (ppm) Number of parts of a chemical found in one million parts of a particular gas, liquid, or solid.
Parts Per Billion (ppb) Number of parts of a chemical found in one billion parts of a particular gas, liquid, or solid mixture.
Parts Per Trillion (ppt) Number of parts of a chemical found in one trillion parts of a particular gas, liquid or solid.

P a g e 11 | 24
Basic terminologies related to Emissions and Removals, Vulnerability, Mitigation and Adaptation
Emissions The release of a substance (usually a gas when referring to the subject of
climate change) into the atmosphere. Indirect Emissions Indirect emissions from a building, home or business are those emissions of
greenhouse gases that occur as a result of the generation of electricity used in that building. These emissions are called "indirect" because the actual emissions occur at the power plant which generates the electricity, not at the building using the electricity.
Emissions Factor A unique value for scaling emissions to activity data in terms of a standard rate of emissions per unit of activity (e.g., grams of carbon dioxide emitted per barrel of fossil fuel consumed, or per pound of product produced).
Anthropogenic Made by people or resulting from human activities. Usually used in the context of emissions that are produced as a result of human activities.13
Atmospheric Lifetimes Atmospheric lifetime is the average time that a molecule resides in the atmosphere before it is removed by chemical reaction or deposition. This can also be thought of as the time that it takes after the human-caused emission of a gas for the concentrations of that gas in the atmosphere to return to natural levels. Greenhouse gas lifetimes can range from a few years to a few thousand years.
Metric Ton Common international measurement for the quantity of greenhouse gas emissions. A metric ton is equal to 2205 lbs or 1.1 short tons.
Short Ton Common measurement for a ton in the United States. A short ton is equal to 2,000 lbs or 0.907 metric tons.
Sink (or Removals) Any process, activity or mechanism which removes a greenhouse gas, an aerosol or a precursor of a greenhouse gas or aerosol from the atmosphere.
Vulnerability The degree to which a system is susceptible to, or unable to cope with, adverse effects of climate change, including climate variability and extremes. Vulnerability is a function of the character, magnitude, and rate of climate variation to which a system is exposed; its sensitivity; and its adaptive capacity.
Mitigation A human intervention to reduce the human impact on the climate system; it includes strategies to reduce greenhouse gas sources and emissions and enhancing greenhouse gas sinks.
Adaptation Adjustment or preparation of natural or human systems to a new or changing environment which moderates harm or exploits beneficial opportunities.
Adaptive Capacity The ability of a system to adjust to climate change (including climate variability and extremes) to moderate potential damages, to take advantage of opportunities, or to cope with the consequences.
13 See NASA's Earth Observatory library at http://earthobservatory.nasa.gov/Glossary/?mode=all

P a g e 12 | 24
Basic terminologies related to Carbon
Carbon Cycle All parts (reservoirs) and fluxes of carbon. The cycle is usually thought of as four main reservoirs of carbon interconnected by pathways of exchange. The reservoirs are the atmosphere, terrestrial biosphere (usually includes freshwater systems), oceans, and sediments (includes fossil fuels). The annual movements of carbon, the carbon exchanges between reservoirs, occur because of various chemical, physical, geological, and biological processes. The ocean contains the largest pool of carbon near the surface of the Earth, but most of that pool is not involved with rapid exchange with the atmosphere.
Carbon Dioxide A naturally occurring gas, and also a by-product of burning fossil fuels and biomass, as well as land-use changes and other industrial processes. It is the principal human caused greenhouse gas that affects the Earth's radiative balance. It is the reference gas against which other greenhouse gases are measured and therefore has a Global Warming Potential of 1.
Carbon Dioxide Equivalent
A metric measure used to compare the emissions from various greenhouse gases based upon their global warming potential (GWP). Carbon dioxide equivalents are commonly expressed as "million metric tons of carbon dioxide equivalents (MMTCO2Eq)." The carbon dioxide equivalent for a gas is derived by multiplying the tons of the gas by the associated GWP.
MMTCO2Eq = (million metric tons of a gas) * (GWP of the gas)
Carbon Footprint The total amount of greenhouse gases that are emitted into the atmosphere each year by a person, family, building, organization, or company. A persons carbon footprint includes greenhouse gas emissions from fuel that an individual burns directly, such as by heating a home or riding in a car. It also includes greenhouse gases that come from producing the goods or services that the individual uses, including emissions from power plants that make electricity, factories that make products, and landfills where trash gets sent.
Carbon Sequestration Terrestrial, or biologic, carbon sequestration is the process by which trees and plants absorb carbon dioxide, release the oxygen, and store the carbon. Geologic sequestration is one step in the process of carbon capture and sequestration (CCS), and involves injecting carbon dioxide deep underground where it stays permanently.
Carbon Capture and Sequestration
Carbon capture and sequestration (CCS) is a set of technologies that can greatly reduce carbon dioxide emissions from new and existing coal- and gas-fired power plants, industrial processes, and other stationary sources of carbon dioxide. It is a three-step process that includes capture of carbon dioxide from power plants or industrial sources; transport of the captured and compressed carbon dioxide (usually in pipelines); and underground injection and geologic sequestration, or permanent storage, of that carbon dioxide in rock formations that contain tiny openings or pores that trap and hold the carbon dioxide.

P a g e 13 | 24
1.3. GREENHOUSE GASES
There are seven major greenhouse gas emitted from human activities that when trapped in the atmosphere causes global warming and forces the climate to change. These gases come in the purport of greenhouse gases under the Kyoto Protocol and are included in Greenhouse Gas (GHG) reporting protocol.
The seven greenhouse gases, their atmospheric life time, global warming potentials in terms of CO2e, tropospheric concentrations, increase in radiative forcing, and sources and sinks of emissions and removals are discussed below.
1. Carbon dioxide (CO2):
Carbon dioxide is the first major contributor of Greenhouse Gas emissions. CO2 is the reference gas to compare the global warming impacts of all other greenhouse gases and therefore has a global warming potential of 1 irrespective of the time scale. Its atmospheric life time is very difficult to estimate due to its intertwining with the natural carbon cycle but typically it is estimated to be between 100 and 300 years (Table 8.A.1 in IPCC 2013). The units of CO2 measurement is ‘parts per million’ or ppm. Direct atmospheric carbon dioxide concentration was measured from the 1950s; it was the first greenhouse gas measured. CO2 level rose from approximately 280 ppm in pre-1750 tropospheric concentration (Chapter 8.3.2 of IPCC 2013) to 399.5 ppm in 2015 (www.esrl.noaa.gov). The increased radiative forcing for Carbon dioxide is 1.94 W/m2 as of 2015 per Carbon Dioxide Information analysis center at Oak Ridge National Laboratory.
According to U.S EPA (2014) report14, the U.S. CO2 emissions by source are: 37% from Electricity, 31% from Transportation, 15% from Industry, 10% from Residential & Commercial and 6% from Other Non-Fossil Fuel Combustion.
CO2 is sequestered or removed by biological (peat production, urban forestry, wetland restoration, agriculture, ocean related), chemical (mineral carbonation, industrial use, chemical scrubbers) and physical (Carbon capture and storage, ocean storage, geological sequestration) processes.15
Plants and soils on land play a significant role in absorbing carbon from the atmosphere. This was proved through measurements of absorption of carbon by plants and soils on land, also referred to as the 'spring drawdown' effect observed by NASA's Orbiting Carbon Observatory 2.
On 2nd July, 2014, National Aeronautics and Space Administration (NASA) launched a dedicated Earth remote sensing satellite, the Orbiting Carbon Observatory 2 (OCO-2), to study atmospheric carbon dioxide from space. Since its launch, OCO-2 has been collecting space-based global measurements of atmospheric CO2 so as to characterize sources and sinks on regional scales. It flies in the near-polar orbit, i.e., the satellite flies near both the poles, and it takes 16 days to scan the entire Earth and understand the global carbon cycle. The measurements from OCO-2 and ground-based sensors show staring differences in carbon concentrations during the seasons, particularly for the northern hemisphere. Carbon concentrations in winter were higher due to the steady absorption of carbon by
14 https://www.epa.gov/ghgemissions/overview-greenhouse-gases 15 Energy Terms Glossary - Nebraska Energy Office

P a g e 14 | 24
plants and soils on land. Figures below show the carbon concentration changes that occurred in 2014; September showed less carbon concentration while May showed the highest carbon concentration.
From NASA’s Orbiting Carbon Observatory OCO – 2 website < https://www.nasa.gov/feature/jpl/excitement-grows-as-nasa-carbon-sleuth-begins-year-two >
2. Methane (CH4):
Methane is the second major contributor of Greenhouse Gas emissions with a Global Warming Potential 28 times greater than that of CO2 when compared over a 100-year time scale and has an estimated atmospheric lifetime of 12.4 years (Table 8.A.1 in IPCC 2013). Studies have shown that methane accounts for 10% of the greenhouse gas effect. Direct atmospheric methane concentration was measured from the 1970s. The units of methane is ‘parts per billion’ or ppb. Methane concentration rose from 722 ppb in pre-1750 tropospheric concentration (Chapter 8.3.2 of IPCC 2013) to 1834 ppb in 2016 (www.esrl.noaa.gov). The increased radiative forcing for Carbon dioxide is 0.50 W/m2 as of 2015 per Carbon Dioxide Information analysis center at Oak Ridge National Laboratory.

P a g e 15 | 24
Methane is produced through anaerobic (without oxygen) decomposition of waste in landfills, animal digestion, decomposition of animal wastes, production and distribution of natural gas and petroleum, coal production, and incomplete fossil fuel combustion.
According to U.S EPA (2014) report16, the U.S. CO2 emissions by source are: 33% from Natural Gas & Petroleum Systems, 23% from Enteric Fermentation, 20% from Landfills, 9% from Coal Mining, 8% from Manure Management and 6% from other sources.
Methane can be removed using chemical or biological decomposition.
3. Nitrous Oxide (N2O):
Nitrous Oxide is the third major contributor of Greenhouse Gas emissions with a Global Warming Potential 265 times greater than that of CO2 when compared over a 100-year time scale and has an estimated atmospheric lifetime of 121 years (Table 8.A.1 in IPCC 2013). The units for nitrous oxide is ‘parts per billion’ or ppb. The concentration of nitrous oxide in the atmosphere was 270 ppb in pre-1750 tropospheric concentration (Chapter 8.3.2 of IPCC 2013) to 328 ppb in 2016 (www.esrl.noaa.gov). The increased radiative forcing for Carbon dioxide is 0.20 W/m2 as of 2015 per Carbon Dioxide Information analysis center at Oak Ridge National Laboratory.
The primary cause of nitrous oxide is the increased use of synthetic fertilizers. Besides, other causes of increased nitrous oxide are industrial processes such as fossil fuel-fired power plants, nylon production, nitric acid production, and vehicle emissions.
According to U.S EPA (2014) report17, the U.S. N2O emissions by source are: 79% from Agricultural Soil Management, 6% from Stationary Combustion, 5% from Industry or Chemical Production, 4% from Transportation, 4% from Manure Management and 2% from Other Sources.
Nitrous oxide is mainly removed from the atmosphere through destruction in the stratosphere by ultraviolet radiation and associated chemical reactions, but it can also be consumed by certain types of bacteria in soils.18
4. Fluorinated Gases (F-Gases):
Fluorinated Gases, also called F-gases or by a brand name Freon, are high potent greenhouse gases that are exclusively man-made and emitted from several industrial processes. These gases if released, can stay in the atmosphere for hundreds or thousands of years causing significant global warming. Even though the quantity that is emitted is low, the potency of these gases are very high, and so they are called high global warming potential gases (high GWPs).
According to U.S EPA (2014) report19, the U.S. F-Gases emissions by source are: 90% from Substitution of Ozone Depleting Substances, 3% from Electrical Transmissions & Distribution, 3% from HCFC-22 Production, 3% from Semiconductor Manufacture and 2% from Production and Processing of
16 17 19 https://www.epa.gov/ghgemissions/overview-greenhouse-gases
18 US Environmental Protection Agency Glossary

P a g e 16 | 24
Aluminum & Magnesium. In buildings, the main sources of F-gases are from certain types of electrical refrigerators and foamed insulation. There are no means to sequester these gases from the atmosphere.
There are four main categories of Fluorinated Gases:
• Hydrofluorocarbons (HFCs):
Hydrofluorocarbons are manufactured Greenhouse Gases with a Global Warming Potential 12– 14,800 times greater than that of CO2 when compared over a 100-year time scale and has an estimated atmospheric lifetime of 1–270 years. HFCs have been mainly developed to substitute Ozone Depleting Substances such as CFC, HCFC in refrigerants. They are ozone friendly, safe to public and energy efficient, however if released can stay in the atmosphere for centuries contributing significantly to global warming.
• Perfluorocarbons (PFCs):
Perfluorocarbons are manufactured Greenhouse Gases with a Global Warming Potential 7,390– 12,200 times greater than that of CO2 when compared over a 100-year time scale and has an estimated atmospheric lifetime of 2,600–50,000 years. The major source of Perfluorocarbons release is during production of aluminum and in a smaller quantity from manufacture of semi-conductors and refrigeration equipment.
• Nitrogen trifluoride (NF3):
Nitrogen trifluoride is a manufactured Greenhouse Gas with a Global Warming Potential 17,200 times greater than that of CO2 when compared over a 100-year time scale and has an estimated atmospheric lifetime of 740 years. Major Sources of Nitrogen trifluoride release include large scale production of thin film solar cells, manufacture of LCD panels, chemical lasers and production of DRAM computer memory. Nitrogen trifluoride is a recent addition to the Kyoto Protocol.
• Sulfur hexafluoride (SF6):
Sulfur hexafluoride is an extremely potent and long-lived Greenhouse Gas with a Global Warming Potential 22,800 times greater than that of CO2 when compared over a 100-year time scale and has an estimated atmospheric lifetime of 3,200 years. The major source of Sulfur hexafluoride release is leakages from gas-insulated high-voltage switch gears, circuit breakers and substations. Even a small amount of leakage will result in significant impact due to its high global warming potential and very long life span in an un-degraded state.
There are six types of Ozone Depleting Substances (ODS) that also have global warming potential and controlled by the Montreal Protocol:
The Montreal Protocol on Substances that Deplete the Ozone Layer20 was instituted in 1989 and has been successful in gradually eliminating the production and use of substances that has been depleting the stratospheric ozone layer that naturally occurs in the upper atmosphere. This is the good ozone layer21 that forms a shield from the sun’s harmful ultraviolet rays.
20 http://ozone.unep.org/en/treaties-and-decisions/montreal-protocol-substances-deplete-ozone-layer 21 For difference between Good and Bad Ozone, refer https://cfpub.epa.gov/airnow/index.cfm?action=gooduphigh.index

P a g e 17 | 24
From NASA’s Goddard Media Studios website < https://svs.gsfc.nasa.gov/11648 >
“Minimum concentration of ozone in the southern hemisphere for each year from 1979-2013 (there is no data from 1995). Each image is the day of the year with the lowest concentration of ozone. A graph of
the lowest ozone amount for each year is shown.
Data is taken from http://ozonewatch.gsfc.nasa.gov/.”
The following refrigerants has been identified to damage the stratospheric ozone layer and has been the focus of the Montreal Protocol since 1989. These gases also have high global warming potential if released into the atmosphere.
• Chlorofluorocarbon (CFCs) • Halons • Carbon tetrachloride • Methyl bromide • Methyl chloroform • Hydrochlorofluorocarbons (HCFCs)
Recently in 2016, an amendment has been made to the Montreal Protocol to include phase-out of HFCs after an agreement of 170 nations – however the amendment is yet to be enforced.
There are few other High-GWP GHGs that are yet to be considered significant
There are other Greenhouse Gases such as Fluorinated ethers, Perfluoropolyethers, Other Hydrocarbons and compounds not included above that have a high GWP per IPCC, however, these are not yet considered significant to include in the reporting protocols.
P a g e 18 | 24
1.4. CLIMATE CHANGE INDICATORS
Indicators can be used to track and communicate causes and effects of climate change. US Environmental Protection Agency identified 37 climate change indicators to understand changes observed from long-term records related to the causes and effects of climate change, the significance of these changes, and their possible consequences for people, the environment, and society. These indicators focus on U.S. greenhouse gas emissions. EPA’s indicators generally cover broad geographic scales and many years of data, as this is the most appropriate way to view trends relevant to climate change.22 The following is a list of these climate change indicators along with the status.
Greenhouse Gases
Greenhouse gases have been found to be the most significant drivers of climate change, and among others carbon dioxide is the major contributor of greenhouse gas emissions. The significant contributor of carbon dioxide is electricity generation and transportation. The following four indicators are related to greenhouse gases.
o U.S. Greenhouse Gas Emissions – Between 1990 and 2014, the greenhouse gas emissions increased by 7 percent. Carbon dioxide accounts for the majority of U.S emissions. Electricity generation in the U.S. is the major contributor of carbon dioxide followed by transportation. U.S. greenhouse gas emissions data is made available by two programs (a) Inventory of U.S. Greenhouse Gas Emissions and Sinks, and (b) the Greenhouse Gas Reporting Program. In the former Program, national energy data, data on national agricultural activities, and other national statistics are used to account for total greenhouse gas emissions for all man-made sources. In the latter Program, annual emissions data from industrial sources are collected.
o Global Greenhouse Gas Emissions - Between 1990 and 2010, global emissions of all major
greenhouse gases increased by 35%. Emissions of carbon dioxide increased by 42 percent, over this period, which is particularly important because carbon dioxide accounts for nearly three-fourths of total global emissions. In the U.S., the majority of emissions results from electricity generation, transportation and other energy production-related use.
o Atmospheric Concentrations of Greenhouse Gases - Global atmospheric concentrations of
carbon dioxide, methane, nitrous oxide, and certain manufactured greenhouse gases have all risen over the last few hundred years. Before the industrial era began in the late 1700s, carbon dioxide concentrations measured approximately 280 ppm. Concentrations have risen steadily since then, reaching an annual average of 410 ppm in 2015—a 46 percent increase. Almost all of this increase is due to human activities.
o Climate Forcing – This refers to a chance in the Earth’s energy balance resulting in positive
(warming effect) or negative climate forcing23 (cooling effect). Between 1950 and 2015, the
22 U.S. Environmental Protection Agency. 2016. Climate change indicators in the United States, 2016. Fourth edition. EPA 430-R- 16-004. www.epa.gov/climate-indicators 23 For more on climate forcing, refer http://ossfoundation.us/projects/environment/global-warming/radiative-climate-forcing

P a g e 19 | 24
total warming effect from anthropogenic greenhouse gases increased by 37 percent. At the same period, the warming effect owing to carbon dioxide alone increased by 30 percent. Carbon dioxide accounts for approximately 80 percent of the overall increase in radiative forcing since 1990.
Weather and Climate
Changes in Earth’s surface temperature and ocean water temperature creates widespread changes in weather patterns. Extreme weather patterns include frequent or more intense drought, heavy precipitation, tropical cyclone, and surface temperatures. The following six indicators relate to weather and climate.
o U.S. and Global Temperatures - Since 1901, the average surface temperature across the contiguous 48 states has risen at an average rate of 0.14°F per decade (see Figure 1). Average temperatures have risen more quickly since the late 1970s (0.29 to 0.46°F per decade since 1979). Eight of the top 10 warmest years on record for the contiguous 48 states have occurred since 1998, and 2012 and 2015 were the two warmest years on record.
o High and Low Temperatures - Unusually hot summer days (highs) have become more
common over the last few decades. The occurrence of unusually hot summer nights (lows) has increased at an even faster rate. This trend indicates less "cooling off" at night. The 20th century saw many winters with widespread patterns of unusually low temperatures, including a particularly large spike in the late 1970s Since the 1980s, though, unusually cold winter temperatures have become less common—particularly very cold nights (lows).
o U.S. and Global Precipitation - On average, total annual precipitation has increased over
land areas in the United States and worldwide. Since 1901, global precipitation has increased at an average rate of 0.08 inches per decade, while precipitation in the contiguous 48 states has increased at a rate of 0.17 inches per decade.
o Heavy Precipitation - The prevalence of extreme single-day precipitation events remained
fairly steady between 1910 and the 1980s, but has risen substantially since then. Over the entire period from 1910 to 2015, the portion of the country experiencing extreme single-day precipitation events increased at a rate of about half a percentage point per decade (5 percentage points per century). The percentage of land area experiencing much greater than normal yearly precipitation totals increased between 1895 and 2015. There has been much year-to-year variability, however.
o Drought - the U.S. land area experienced conditions that were at least abnormally dry at any
given time. The years 2002–2003 and 2012–2013 had a relatively large area with at least abnormally dry conditions, while 2001, 2005, and 2009–2011 had substantially less area experiencing drought. During the latter half of 2012, more than half of the U.S. land area

P a g e 20 | 24
was covered by moderate or greater drought. In several states, 2012 was among the driest years on record24.
o Tropical Cyclones - Since 1878, about six to seven hurricanes have formed in the North
Atlantic every year. Roughly two per year make landfall in the United States. The total number of hurricanes (particularly after being adjusted for improvements in observation methods) and the number reaching the United States do not indicate a clear overall trend since 1878.
Oceans
The oceans influence the weather on local to global scales, while changes in climate can fundamentally alter many properties of the oceans. The following five indicators relate to oceans.
o Ocean Heat - Three independent analyses show that the amount of heat stored in the ocean has increased substantially since the 1950s. Ocean heat content not only determines sea surface temperature, but also affects sea level and currents.
o Sea Surface Temperatures - Sea surface temperature increased over the 20th century and
continues to rise. From 1901 through 2015, temperatures rose at an average rate of 0.13°F per decade.
o Sea Level - After a period of approximately 2,000 years of little change, global average sea
level rose throughout the 20th century, and the rate of change has accelerated in recent years. When averaged over all the world's oceans, absolute sea level increased at an average rate of 0.06 inches per year from 1880 to 2013. Since 1993, however, average sea level has risen at a rate of 0.11 to 0.14 inches per year—roughly twice as fast as the long- term trend.
o Coastal Flooding - Flooding is becoming more frequent along the U.S. coastline. Nearly
every site measured has experienced an increase in coastal flooding since the 1950s. The rate is accelerating in many locations along the East and Gulf Coasts.
o Ocean Acidity - Measurements made over the last few decades have demonstrated that
ocean carbon dioxide levels have risen in response to increased carbon dioxide in the atmosphere, leading to an increase in acidity (that is, a decrease in pH).
24 NOAA (National Oceanic and Atmospheric Administration). 2013. State of the climate: Drought: December 2012. Accessed July 2013. www.ncdc.noaa.gov/sotc/drought/2012/12

P a g e 21 | 24
Snow and Ice
Climate change can dramatically alter the Earth’s snow- and ice-covered areas because snow and ice can easily change between solid and liquid states in response to relatively minor changes in temperature. The following seven indicators relate to snow and ice.
o Arctic Sea Ice – September, 2012, had the lowest sea ice extent on record, 49 percent below the 1979-2000 average for that month. The September 2016 sea ice extent was more than 700,000 square miles less than the historical 1981–2010 average for that month—a difference more than two and a half times the size of Texas. March sea ice extent reached the lowest extent on record in 2015 and hit roughly the same low again in 2016—about 7 percent less than the 1981–2010 average.
o Antarctic Sea Ice - Antarctic sea ice extent in September and February has increased
somewhat over time, although the most recent year was below average. The September maximum extent reached the highest level on record in 2014—about 7 percent larger than the 1981•–2010 average—but in 2015 it was slightly below the 1981–2010 average. As for February extent, 2013, 2014, and 2015 were three of the six largest years on record, but extent in 2016 was about 9 percent below the 1981–2010 average.
o Glaciers - On average, glaciers worldwide have been losing mass since at least the 1970s
which in turn has contributed to observed changes in sea level. Measurements from a smaller number of glaciers suggest that they have been shrinking since the 1940s. The rate at which glaciers are losing mass appears to have accelerated over roughly the last decade.
o Lake Ice - The time that lakes stay frozen has generally decreased since the mid-1800s. For
most of the lakes in this indicator, the duration of ice cover has decreased at an average rate of one to two days per decade.
o Snowfall - Total snowfall has decreased in most parts of the country since widespread
observations became available in 1930, with 57 percent of stations showing a decline.
o Snow Cover - Looking at averages by decade suggests that the extent of North America covered by snow has decreased somewhat over time. Between 1972 and 2015, the average extent of North American snow cover decreased at a rate of about 3,300 square miles per year. The average area covered by snow during the most recent decade (2006–2015) was 3.21 million square miles, which is about 4 percent smaller than the average extent during the first 10 years of measurement (1972–1981)—a difference of 122,000 square miles, or approximately an area the size of New Mexico.
o Snowpack - From 1955 to 2016, April snowpack declined at more than 90 percent of the
sites measured. The average change across all sites amounts to about a 23-percent decline.

P a g e 22 | 24
Health and Society
Changes in the Earth’s climate can affect public health and the society. The following seven indicators are related to Health and society, particularly link climate change to health effects.
o Health-Related Deaths – Between 1979 and 2014, the death rate as a direct result of exposure to heat (underlying cause of death) generally hovered around 0.5 to 1 deaths per million people, with spikes in certain years. Overall, a total of more than 9,000 Americans have died from heat-related causes since 1979, according to death certificates.
o Health-Related Illnesses – From 2001 to 2010, the 20 states covered in Figure 1
recorded a total of about 28,000 heat-related hospitalizations.6 The resulting annual rates ranged from 1.1 cases per 100,000 people in 2004 to 2.5 cases per 100,000 people in 2006, with a 10-year average rate of 1.8 cases per 100,000 people.
o Heating and Cooling Degree Days – Heating degree days have declined in the
contiguous United States, particularly in recent years, as the climate has warmed. This change suggests that heating needs have decreased overall. Heating degree days have generally decreased and cooling degree days have generally increased throughout the North and West. The Southeast, with the exception of Florida, has seen the opposite: more heating degree days and fewer cooling degree days.
o Lyme Disease – The incidence of Lyme disease in the United States has approximately
doubled since 1991, from 3.74 reported cases per 100,000 people to 7.95 reported cases per 100,000 people in 2014.
o West Nile Virus – The years 2002, 2003, and 2012 had the highest reported incidence
rates, around one case per 100,000 people.
o Length of Growing Season – The length of the growing season has increased more rapidly in the West than in the East. In the West, the length of the growing season has increased at an average rate of about 2.2 days per decade since 1895, compared with a rate of nearly one day per decade in the East.
o Ragweed Pollen Season – Since 1995, ragweed pollen season has grown longer at 10 of
the 11 locations studied.
Ecosystems
Ecosystems provide humans with food, clean water, and a variety of other services that can be affected by climate change. The following seven indicators are related to ecosystems.
o Wildfires – Since 1983, the National Interagency Fire Center has documented an average of 72,000 wildfires per year. The extent of area burned by wildfires each year appears to have increased since the 1980s. According to National Interagency Fire

P a g e 23 | 24
Center data, of the 10 years with the largest acreage burned, nine have occurred since 2000, including the peak year in 2015.
o Streamflow – Annual average streamflow has increased at many sites in the Northeast
and Midwest, while other regions have seen few substantial changes. Overall, sites show more increases than decreases.
o Stream Temperature – From 1960 through 2014, water temperature increased at 79
percent of the stream sites measured in the Chesapeake Bay region. More than half of these increases were statistically significant. Only 5 percent of stations had a significant temperature decrease over the same period.
o Great Lakes Water Levels and Temperatures – Water levels in the Great Lakes have
fluctuated since 1860. Over the last few decades, they appear to have declined for most of the Great Lakes.
o Bird Wintering Ranges – Among 305 widespread North American bird species, the
average mid-December to early January center of abundance moved northward by more than 40 miles between 1966 and 2013.
o Marine Species Distribution – The average center of biomass for 105 marine fish and
invertebrate species shifted northward by about 10 miles between 1982 and 2015. These species also moved an average of 20 feet deeper.
o Leaf and Bloom Dates – Leaf and bloom events are generally happening earlier
throughout the North and West but later in much of the South.

P a g e 24 | 24
1.5. CLIMATE RISK
Climate risks relate to the risks posed to natural and human systems and regions due to change in climate. Understanding climate risks is the first step towards managing climate change impacts. IPCC has conducted climate risks analysis and has identified the following risks;
• continuous increase of temperature • accumulation of extreme weather phenomena • bumper crops and crop failure • polar cap melting • changes of the planet's ecology • spreading diseases • attenuation of the North Atlantic Drift
Some of the key determinants of impacts include;
Magnitude and rate of change of global mean temperature. While magnitude of change focuses on the overall change of global mean temperature over the years, the rate of change is crucial in that it focuses on the ability of the ecosystems to migrate to minimize damages in a timely manner. Climate variability (example, unusually warm weather) is a climate change risk.
Transient or time-dependent response to anthropogenic forcings. Three types of climate extremes are studied as part of this climate change determinant -- simple extremes (e.g., heavy rainfall, high/low temperature, high wind speed), complex extremes (tropical cyclones, droughts, ice storms), and unique or singular phenomena (collapse of major ice sheets, major circulation changes). While the first two climate extremes are characterized by the frequency / return period and duration of variable exceeding a critical level, the unique or singular phenomena is characterized by the probability of occurrence and magnitude of impact.
Climate variability. Previous studies show that climate variability is important to determine climate change risks and vulnerability.
Thresholds. Thresholds are critical determinants of climate change risks. Using studies, it is possible to determine the minimum thresholds, i.e., what will be impact below a certain threshold. Besides a limit, these thresholds also focus on the linear changes that may occur within this threshold.
Surprises. These are low-probability, high impact events; these are referred to as 'imaginable surprises. Totally unexpected events are referred to as 'true surprises.'
Nonlinear, complex, and discontinuous responses. Nonlinear determinants of climate change risks are complex. Unlike thresholds, nonlinear responses occur if the thresholds are exceeded by a stimulus, that is, high sensitivity above the thresholds. Examples of nonlinear, complex, and discontinuous responses include the collapse of fish stocks, disease outbreaks, malnutrition and hunger.

Page
1
2.0 Background There is not much abstruseness to fathom that energy, material and mobility is the substratum
of human civilization and evolvement. However, the notion presents caveats when damages to the natural environment are imminent. The looming environmental conditions now emphasize humans to think critically from a higher point of view and assimilate a thought process of how one can efficiently and effectively use the substratum, yet minimize the damage to the natural environment.
With the deliberating spotlight on climate change mitigation, there are many lingering questions in the minds of people and society - Is climate change real and are humans causing climate change? If climate change is caused by humans, what are the activities that are contributing towards climate change? Can humans stop climate change with mitigating actions? If not, what will be the implications and how can humans resiliently adapt to the damaging effects of climate change?
This chapter will not be presenting scientific evidence of whether climate change is real or not, and whether it is caused by human or natural activities, which is best left to the scientific world of climate experts. Rather it starts with the supposition that an imbalance exists in the natural atmospheric environment that is causing climate change. Further, it assumes that the imbalance is due to emissions from human related (anthropogenic) activities causing increase in atmospheric concentrations of long- lived greenhouse gases (LLGHGs), thereby inducing radiative forcing on climate and resulting in global warming.
The building sector is one of the major source of greenhouse gas emissions contributing to climate change. The sector heavily uses raw materials, chemical processes, energy and equipment thereby contributing to 40% of greenhouse gas emissions. There is a pressing need for the sector to develop pathways to mitigate the impacts of climate change as well as adapt to the impacts of climate change on the built environment, owing to the fact that people spend most of the time inside buildings.
With the above viewpoint in context,
- The first section of this chapter discusses buildings and its impact on climate change. The discussion will present variegated scales of interweaving system boundaries and scoping of emissions and removals all with a common goal of mitigating climate change issues.
- The second section of this chapter discusses the meaning of whole life and partial carbon
footprint analysis of buildings.
- - The third section of this chapter discusses the difference between carbon footprint analysis and
life cycle assessment.
While the Information contained in this course has been presented with all due care, the authors do not warrant or represent that the Information is free from errors or omission. The authors accept no liability whatsoever for, or in respect of any use or reliance upon this publication by any party. Authors: Ravi Srinivasan and Jaya Lakshmanan

P a g e 2 | 19
- The forth section of this chapter discusses the importance of carbon footprint analysis for building owners, architects, engineers and contractors.

P a g e 3 | 19
2.1. BUILDINGS AND ITS IMPACT ON CLIMATE CHANGE
There is this natural earth environment, a significant part of which has an overlay of man-made buildings and infrastructure among other things, the activities of which play a fundamental role in harnessing natural resources and providing energy, material and movement for the pursuit of human sustenance, experience and happiness. However, these activities propel a substantial amount of emissions to the atmosphere that gets to stay there anywhere from a few months to 50,000 years (or perhaps forever) depending on the emission type. While in the atmosphere, these increased concentration of gases traps and radiates heat, forcing the climate to change. This in turn threatens the sustenance, experience and happiness of humans. The impact is on a global scale affecting the entire ecosystem. Now, it becomes imperative even more than ever, that humans become aware of the intensity of this problem and work together to alleviate the problem or achieve a state of resiliency.
Substantial groundwork has been done by organizations such as IPCC by bringing together resources, researchers and experts to a common unified ground to raise awareness and address issues of climate change. International Protocols such as Montreal Protocol has successfully worked together with 179 countries which has helped in alleviating the ozone depletion issue. There is the Kyoto Protocol initiated from Japan which has played a major role in increasing the awareness and importance of curbing the greenhouse gas emissions and led to the instituting of global environmental organizations, international standards and rating systems.
The building sector is one of the major causes or contributors of greenhouse gas emissions. The operating energy use during the service life of the building has been the highest contributor and the major focus of reduction in the past few decades with a high proportion of attainment towards low or zero energy and emissions buildings, that too at very competitive price tags in comparison to conventional buildings largely due to regulatory requirements, policy instruments, technological advancements and declining costs.
The embodied energy and emissions of building materials and products is the second major contributor and has gained recent attention, especially with the advent of low energy buildings taking down life cycle operational energy use. Recent IPCC Assessment Report 5 Chapter 9 on Buildings1 make the following important points about embodied energy and emissions of building materials and products.
(1) The total life cycle energy use of low-energy buildings is less than the conventional buildings, however the embodied energy of materials used in such buildings are generally higher.2
1 IPCC Assessment Report 5 - Chapter 9 - Buildings <https://www.ipcc.ch/pdf/assessment- report/ar5/wg3/ipcc_wg3_ar5_chapter9.pdf > 2 Citherlet S., and T. Defaux (2007). Energy and environmental comparison of three variants of a family house during its whole life span. Building and Environment 42, 591–598. doi: 10.1016/j.buildenv.2005.09.025, ISSN: 03601323.

P a g e 4 | 19
(2) Wood-based wall systems require 10–20% less embodied energy than traditional concrete systems3&4 and that concrete-framed buildings require less embodied energy than steel- framed buildings5
(3) Insulation materials require a wide range of embodied energy per unit volume, and the time required to pay back the energy cost of successive increments insulation through heating energy savings increases as more insulation is added.
(4) The embodied energy of biomass-based insulation products is not lower than that of many non-biomass insulation products when the energy value of the biomass feedstock is accounted for, but is less if an energy credit can be given for incineration with cogeneration of electricity and heat, assuming the insulation is extracted during demolition of the building at the end of its life.6
With the spotlight on holistic environmental performance of buildings, an approach to a whole life assessment of buildings is gaining momentum. All the direct and indirect processes in the various stages of a building project that contribute to greenhouse gas emissions and removals are accounted. Major sources and sinks of direct and indirect emissions and removals that occur and span over various stages of the life cycle of building projects can be generally categorized as follows:
Emissions from: • energy use • material use • water use • land use • transportation use • chemical processes • construction processes • fugitive gas leakage • storage and distribution • waste processing • other sources
Removals from: • sequestration, capture and utilization • other sinks
While the building sector is one of the major causes or contributors of these emissions, the good news is that the building sector can also substantially reduce the amount of these emissions through a combination of strategies i.e., by understanding the emission types and their global warming potential, accounting and reducing the greenhouse gas emissions, using methods to remove the uncalled-for greenhouse gases, using non-polluting renewable energy and fuels, using offsetting mechanisms, and
3 Upton B., R. Miner, M. Spinney, and L. S. Heath (2008). The greenhouse gas and energy impacts of using wood instead of alternatives in residential construction in the United States. Biomass and Bioenergy 32, 1–10. 4 Sathre R., and L. Gustavsson (2009). Using wood products to mitigate climate change: External costs and structural change. Applied Energy 86, 251–257. 5 Xing S., Z. Xu, and G. Jun (2008). Inventory analysis of LCA on steel- and concrete-construction office buildings. Energy and Buildings 40, 1188–1193. 6 Ardente F., M. Beccali, M. Cellura, and M. Mistretta (2008). Building energy performance: A LCA case study of kenaf-fibres insulation board. Energy and Buildings 40, 1–10

P a g e 5 | 19
last but not the least building a resilient environment to adapt to the perils of an impending climate change.
In order to take all the necessary actions to reduce the amount of emissions and enhance removals, an understanding is required of all the processes associated with the building project that causes these emissions. This understanding lays the foundation of any environmental systems thinking and enables one to establish the system boundaries and scopes to meet mitigation goals.
System Boundary and Scope
The building project as a ‘system’ is a vast set of interacting or interdependent components and processes developing into (an intricate functioning whole in the course of its service life and an extricate zilch or zippo at the end of its service life. What becomes more convoluted is the interminable progression of delineating the boundary of the ‘system’ for assessing environmental impacts.
A universally agreed upon procedure has long been absent until reputed organizations like International Standards Organization (ISO), European Standards (EN) on the one hand and Greenhouse Gas Protocol on the other hand laid the foundations for system boundary conditions. The former group focused on a life-cycle stages approach specifically for buildings and the latter group focused on a control and ownership approach specifically from a reporting entity viewpoint.
I. Based on Life-cycle stages7
There are five distinct life cycle stages for buildings namely: Product Stage, Construction Stage, Use Stage, End-of-Life Stage and Beyond Stage. Each life cycle stage consists of several attributes or elements that increase or decrease concentrations of heat trapping greenhouse gases in the atmosphere, thereby influencing climate change.
Stage System Boundary Product Stage Includes processes from extraction / refinement of raw materials to
manufacturing of construction products. Includes emissions from raw material supply, transport and manufacturing.
Construction Stage
Includes processes from factory gate of construction products to practical completion of construction works. Includes emissions from transport and construction - installation process.
Use Stage Includes processes from the practical completion of construction works to the point of deconstruction or demolition of building. Includes emissions from use, maintenance, repair, replacement, refurbishment, operational energy and water use.
End-of-Life Stage Begins when the building is decommissioned and not meant for further use. Includes emissions from deconstruction / demolition, transport, waste processing and disposal.
7 EN 15804:2012 - Sustainability of construction works - Environmental product declarations - Core rules for the product category of construction products – provides detailed rules of assessment of construction products; and EN 15978:2011 – Sustainability of construction works – Assessment of environmental performance of buildings – Calculation method – provides detailed rules for assessing the environmental performance of whole buildings.

Definitions from EN 15643-1:2010 - Sustainability of construction works. Sustainability assessment of buildings. General framework
System boundary is the interface in the assessment between a building and its surroundings or other product systems.
8 BrSeEqNu1ir5e8m04e:2n0t1s2. (-ASudsatapitneadbilfitryoomf ctohnestdruecftiinonitiwoonrkosf- IESnOvi/rDonISm1en5t6al8p6r-o1d:u2c0t 0de8cl-aBrautiioldnisn-gCsoraenrdulecsofnosrttrhuecptreodduct
Service life or Working Life is the period of time after installation during which a building or an assembled system (part of works) meets or exceeds the technical requirements and functional
category of construction products. BSI. Permission to reproduce extracts from British Standards is granted by the British Staansdsaerdtss I-n-sStieturtvioicne(BliSfIe). pNloaontnhienrgus-e- oPfatrhtis1m: aGteerniaelrisapl eprrminitctiepdl.eBsriatinshdSftraanmdaerdws ocarnk)be obtained in PDF or hard copy formats from the BSI online shop: or by contacting BSI Customer Services for hard copies only: Tel: +44 (0)20 8996 9001, Email: [email protected] is the service life required by the client or regulations.
P a g e 6 | 19
Beyond Stage Potential resources for future use. Includes reuse, recovery and recycling potential.
For a new building, the system boundary shall include the building life cycle stages indicated above.
For an existing building or part thereof, the system boundary shall include all the stages representing the remaining service life and the end of life stage of the building.
Definition of life cycle stages for whole building assessment (from BS EN 15804)8
LCA Stages Scope Summary Cradle-to-gate Product stage (required) Cradle-to-gate with options
Product stage (required) + Construction stage (optional) + Use stage (optional) + End-of-Life stage (optional)
Cradle-to-grave Product stage (required) + Construction stage (required) + Use stage (required) + End-of-Life stage (required) + Beyond Stage (optional)
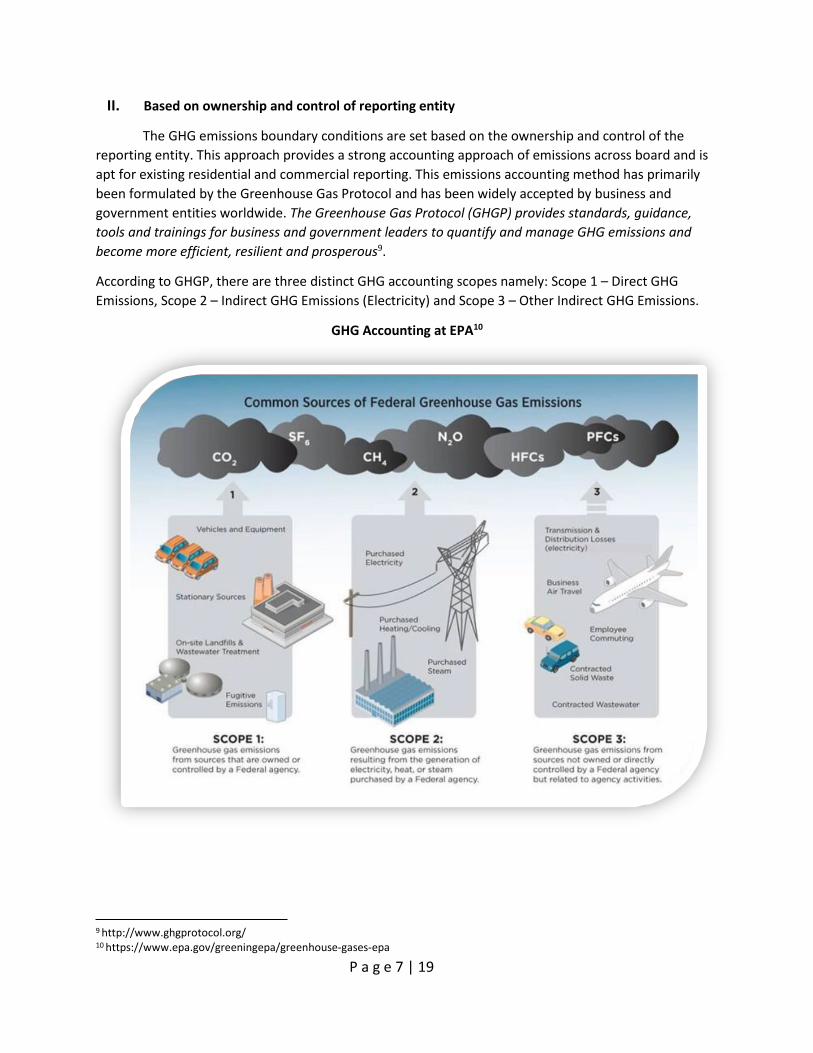
P a g e 7 | 19
II. Based on ownership and control of reporting entity
The GHG emissions boundary conditions are set based on the ownership and control of the reporting entity. This approach provides a strong accounting approach of emissions across board and is apt for existing residential and commercial reporting. This emissions accounting method has primarily been formulated by the Greenhouse Gas Protocol and has been widely accepted by business and government entities worldwide. The Greenhouse Gas Protocol (GHGP) provides standards, guidance, tools and trainings for business and government leaders to quantify and manage GHG emissions and become more efficient, resilient and prosperous9.
According to GHGP, there are three distinct GHG accounting scopes namely: Scope 1 – Direct GHG Emissions, Scope 2 – Indirect GHG Emissions (Electricity) and Scope 3 – Other Indirect GHG Emissions.
GHG Accounting at EPA10
9 http://www.ghgprotocol.org/ 10 https://www.epa.gov/greeningepa/greenhouse-gases-epa

P a g e 8 | 19
The table below explicates with examples the three scope levels with the building in mind. It is not an exhaustive list and many elements and attributes related to other aspects of a reporting entity which is typically included such as downstream activities etc., of the reporting entity is not discussed.
Scope and Boundary Condition Examples Scope 1: Direct greenhouse gas emissions or removals
Emissions or removals of GHGs from sources controlled or owned by the reporting entity, as a result of using a product system.
• Stationary Combustion of natural gas and petroleum for heating and cooking emits carbon dioxide, methane and nitrous oxide.
• Combustion of fuels in facility vehicles can emit carbon dioxide and in small amounts methane and nitrous oxide.
• Organic waste sent to landfill emits methane. • Wastewater treatment plants emit methane
and nitrous oxide. • Fluorinated gas used in air conditioning and
refrigeration may leak during service or due to leaking equipment.
Scope 2: Indirect greenhouse gas emissions or removals – Purchased Energy
Emissions and removals of GHGs from sources that are not directly controlled or owned by reporting entity, as a result of purchasing energy for consumption.
• Emissions associated with generation of purchased energy for consumption.
Scope 3: Indirect greenhouse gas emissions or removals – Others
Emissions and removals of GHGs from sources that are not directly controlled or owned by reporting entity, as a result of using a product system other than purchased energy for consumption.
• Construction materials release various types of GHGs based on the energy type and chemical process used at the time of manufacture.
• Construction processes release various types of GHGs based on the energy type and chemical process used at the time of construction.
• Extraction, production and transportation of fuels used to generate electricity such as coal mining processes release methane, petroleum refining processes may emit carbon dioxide and methane, drilling and extraction of natural gas may leak methane, and production of hydrogen (if used as fuel) may release carbon dioxide.
• Transmission and Distribution (T&D) emission losses of purchased electricity from systems and sources not owned by the business.
• End-of-Life process such as demolition, transportation and combustion of materials in land-fill release GHGs.

P a g e 9 | 19
2.2. CARBON FOOTPRINT OF BUILDINGS
Carbon Footprint Analysis11 of Buildings is the total amount of greenhouse gases emitted and removed by the building project during either its entire life cycle called Whole Life Carbon Footprint Analysis or a relevant stage in the life cycle of the building namely Partial Carbon Footprint Analysis. Carbon Footprint Analysis of Buildings applies to both residential and non-residential sectors and can be used to assess all building types - existing, new or renovation buildings.
o Whole Life Carbon Footprint analysis of Buildings
A Whole Life Carbon Footprint Analysis of Buildings is the sum of greenhouse gas emissions and removals associated with a building project, over its entire life cycle. Emissions and removals are focused on a single impact category i.e., climate change, measured in Carbon dioxide equivalent (CO2e) and reported in pounds (lbs. CO2e) or kilogram (kg. CO2e) or Tonnes or Metric Tons (MT. CO2e).
The system boundary for whole life accounting of carbon emissions and removals from buildings consists of five distinct life cycle stages:
Product Stage Carbon Footprint
Construction Stage Carbon Footprint
Whole Life Carbon Footprint Analysis of
Buildings
Use Stage Carbon Footprint
End-of-Life Stage Carbon Footprint
Beyond Stage Carbon Footprint (optional)
The sum of the five life cycle stages provides the whole life carbon footprint analysis for buildings.
o Partial Carbon Footprint analysis of Buildings
Partial Carbon Footprint Analysis of Buildings is expressed the same way as Whole Life Carbon Footprint analysis of Buildings, except that only relevant stages of processes within a specified life cycle boundary is considered for analysis. Ideally, the aim of a carbon footprint analysis of buildings is to reduce the greenhouse gases associated with building activity that contribute to Global Warming and Climate Change. However, the processes analyzed in a partial carbon footprint analysis of buildings will widely vary accordingly to the goals and objectives of the assessment.
11 ISO/TS 14067 Greenhouse gases -- Carbon footprint of products -- Requirements and guidelines for quantification and communication provides general definition of “Carbon Footprint Analysis.”

P a g e 10 | 19
2.3. DIFFERENCES BETWEEN CARBON FOOTPRINT & LIFE CYCLE ASSESSMENT
In the environmental systems thinking era, there are new goals and objectives established by various visionary agencies or thought leaders in the industry. Most of these goals and objectives revolve around environmental impact categories. The spotlight maybe focused on either one or more categories depending on the acclimatizing mechanisms of the industry, presence of scientifically validated standards or guidelines and the rapidity at which a problem needs to be addressed. In this process evolved two types of assessments – on one hand, a comprehensive assessment of multiple environmental impact categories i.e., Life Cycle Assessment, and the other hand, a comprehensive assessment of a single environmental impact category, i.e., a subset of Life Cycle Assessment such as Carbon Footprint. While the life cycle thinking is the core of these two types of analysis, the difference is in number of environmental impact category that is included in each of the assessments, as elucidated below:
Difference between Carbon Footprint & Life Cycle Assessment
CARBON FOOTPRINT OF A PRODUCT (CFP)
LIFE CYCLE ASSESSMENT (LCA)
International Standards Organization (ISO) 14067 defines Carbon Footprint of a Product (CFP) as “the sum of greenhouse gas emissions and removals in a product system, expressed as CO2 equivalents and based on a life cycle assessment using the single impact category of climate change.”
Carbon Footprint Analysis is a mono-criterion approach to environmental analysis where it focuses only on one environmental impact category indicator i.e., the Global Warming Potential of Greenhouse Gas Emissions and its impact on Climate Change.
Carbon Footprint of a Product is a subset of Life Cycle Assessment.
Core Standards that govern Carbon Footprint of a Product are GHG Protocol, PAS 2050 and ISO 14067, 14064, 14065, 14066, 14069 and 16745.
ISO 14040:2006 - Environmental management -- Life cycle assessment -- Principles and framework defines Life Cycle Assessment as “compilation and evaluation of the inputs, outputs and the potential environmental impacts of a product system throughout its life cycle.”
Life Cycle Assessment is a multi-criteria approach where it takes into consideration several environmental impact category indicators such as Global Warming Potential, Ozone Depletion Potential, Human Toxicity Potential, Eco-Toxicity Potential, Photochemical Ozone Creation Potential, Acidification Potential, and Nitrification Potential, to name a few.
Core Standards that govern Life Cycle Assessment are: ISO 14040, 14044, 14045, 14047, 14048, 14049, 14071 and 14072.
The above ISO Standards are discussed in Bibliography section of this Chapter. GHG Protocol, PAS 2050 and other related Standards are discussed in Chapter 3.
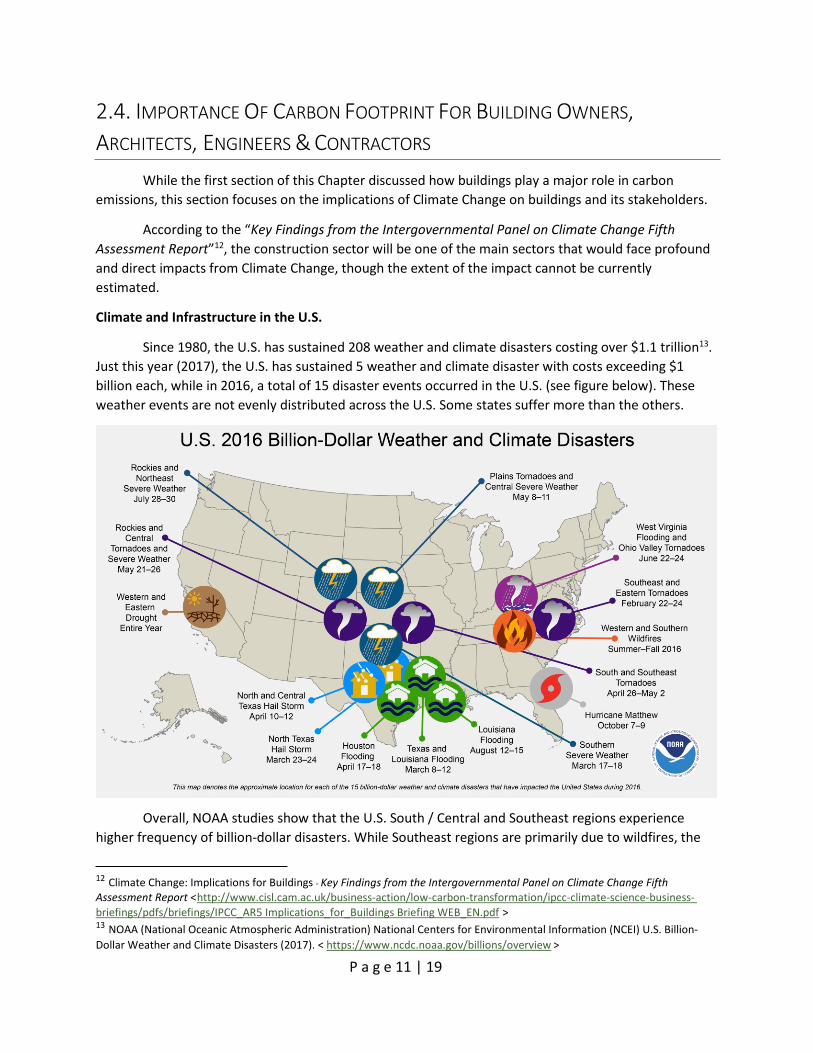
P a g e 11 | 19
2.4. IMPORTANCE OF CARBON FOOTPRINT FOR BUILDING OWNERS, ARCHITECTS, ENGINEERS & CONTRACTORS
While the first section of this Chapter discussed how buildings play a major role in carbon emissions, this section focuses on the implications of Climate Change on buildings and its stakeholders.
According to the “Key Findings from the Intergovernmental Panel on Climate Change Fifth Assessment Report”12, the construction sector will be one of the main sectors that would face profound and direct impacts from Climate Change, though the extent of the impact cannot be currently estimated.
Climate and Infrastructure in the U.S.
Since 1980, the U.S. has sustained 208 weather and climate disasters costing over $1.1 trillion13. Just this year (2017), the U.S. has sustained 5 weather and climate disaster with costs exceeding $1 billion each, while in 2016, a total of 15 disaster events occurred in the U.S. (see figure below). These weather events are not evenly distributed across the U.S. Some states suffer more than the others.
Overall, NOAA studies show that the U.S. South / Central and Southeast regions experience higher frequency of billion-dollar disasters. While Southeast regions are primarily due to wildfires, the
12 Climate Change: Implications for Buildings - Key Findings from the Intergovernmental Panel on Climate Change Fifth Assessment Report < http://www.cisl.cam.ac.uk/business-action/low-carbon-transformation/ipcc-climate-science-business- briefings/pdfs/briefings/IPCC_AR5 Implications_for_Buildings Briefing WEB_EN.pdf > 13 NOAA (National Oceanic Atmospheric Administration) National Centers for Environmental Information (NCEI) U.S. Billion- Dollar Weather and Climate Disasters (2017). < https://www.ncdc.noaa.gov/billions/overview >

P a g e 12 | 19
Southern regions face drought. The weather disaster types include drought, flooding, freeze, severe storm, tropical cyclone, wildfire, winter storm, etc. Among these disaster types, tropical cyclone has the highest percent of total losses (at 47.3%) followed by drought (18.9%) and severe storm (15.7%).
The tornado outbreaks cause extensive damage to buildings including ripping roofs off of buildings and others. For example, the March 2017 Mideast Tornado Outbreak event caused, among others, substantial damage to a concrete building.
The freeze causes building pipes to burst (freezing and thawing causes water pressure to increase and eventually leads to bursting pipes). Besides, freezing causes high heating energy use.
Flooding damage may result from pressures leading to effects on buildings including wall failure, breaking of glass, collapsing of roofs, and loss of structural systems including foundations14. To give an example, the 2005 Hurricane Katrina flooding event of New Orleans affected approximately 204,000 residential buildings with an estimated damage of $16 billion, and $7 billion estimated loss for damage to public structures, infrastructures, and utilities such as roads, railroads, etc.
Table. Weather and Climate Billion-Dollar Disasters to affect the U.S. in 2017. Reprinted from NOAA15.
Event Begin Date End Date Summary
Southeast Freeze
March 14, 2017
March 16, 2017
Severe freeze heavily damaged fruit crops across several southeastern states (SC,GA,NC,TN,AL,MS,FL,KY,VA). Mid-March freezes are not climatologically unusual in the Southeast, however many crops were blooming 3+ weeks early due to unusually warm temperatures during the preceding weeks. Damage was most severe in Georgia and South Carolina. Crops most impacted include peaches, blueberries, strawberries and apples, among others.
Mideast Tornado Outbreak
March 6, 2017
March 8, 2017
Tornado outbreak and wind damage across many Midwestern states (AR,IA,IL,KS,MI,MN,MO,NE,NY,OH,WI). Missouri and Illinois were impacted by numerous tornadoes while Michigan and New York were affected by destructive, straight-line winds following the storm system. Nearly one million customers lost power in Michigan alone due to sustained high winds, which affected several states from Illinois to New York.
Central / Southeast Tornado Outbreak
February 28, 2017
March 1, 2017
Over 70 tornadoes developed during a widespread outbreak across many central and southern states causing significant damage. There was also widespread straight-line wind and hail damage. This was the second large tornado outbreak to occur early in 2017.
14 PIstrika Aimilia, Jonkman Sebastiaan. Damage to Residential Building due to Flooding of New Orleans after Hurricane Katrina. Natural Hazards (2010) 54: 413-434. 15 NOAA National Centers for Environmental Information (NCEI) U.S. Billion-Dollar Weather and Climate Disasters (2017). < https://www.ncdc.noaa.gov/billions/ >

P a g e 13 | 19
California Flooding
February 8, 2017
February 22, 2017
Heavy, persistent rainfall across northern and central California created substantial property and infrastructure damage from flooding, landslides and erosion. Notable impacts include severe damage to the Oroville Dam spillway, which caused a multi-day evacuation of 188,000 residents downstream. Excessive rainfall also caused flood damage in the city of San Jose, as Coyote Creek overflowed its banks and inundated neighborhoods forcing 14,000 residents to evacuate.
Western Storms and Southern Tornado Outbreak
January 20, 2017
January 22, 2017
Heavy, persistent rainfall across northern and central California created substantial property and infrastructure damage from flooding, landslides and erosion. Notable impacts include severe damage to the Oroville Dam spillway, which caused a multi-day evacuation of 188,000 residents downstream. Excessive rainfall also caused flood damage in the city of San Jose, as Coyote Creek overflowed its banks and inundated neighborhoods forcing 14,000 residents to evacuate.
The International Institute of Sustainable Development (IISD)16, an independent non-profit organization that provides practical solutions to the challenge of integrating environmental and social priorities with economic developments, provides a well-compiled list of implications and an IPCC based risk model of Climate Change on Building Infrastructure. The following contents have been reprinted with permission from Jessica Boyle the lead author of the report “Climate Change Adaptation and Canadian Infrastructure - A review of the literature”. This report summarizes current literature dealing with the challenge of adapting to climate change in Canada.
16 See https://www.iisd.org/about/about-iisd

P a g e 14 | 19
Climate Change and Infrastructure Impacts: Buildings17
CLIMATE HAZARD AND/OR WEATHERING PROCESS LIKELY AFFECTED BY A CHANGING CLIMATE
INFRASTRUCTURE IMPACTS
Permafrost degradation Soil subsidence and buckling can damage a property’s foundation infrastructure
Loss of strength in buildings, which can cause them to become uninhabitable
Reduced strength and reliability of containment structures and other physical infrastructure
Hotter, drier summers and heat waves
Building damage has sometimes been observed when clay soils dry out
Forest fires can damage entire homes and businesses Premature weathering Increased indoor air temperature and reliance on cooling
systems Increased precipitation Reduced structural integrity of building components
through mechanical, chemical and biological degradation Accelerated deterioration of building facades Premature weathering of input materials Increased fractures and spalling in building foundations Decreased durability of materials Increased efflorescence and surface leaching concerns Increased corrosion Increased mold growth
Increase rainfall, storm surges and higher tides
Damaged or flooded structures Slope stability and integrity of engineered berms are also
vulnerable to extreme precipitation Coastal infrastructure inducted Wharves to be rebuilt moved or raised to avoid
inundation Increased risk of basement and localized flooding Increased corrosion in metals or deterioration in concrete
Hurricanes, tornadoes, hail, windstorms and ice storms
Property destruction Damage building infrastructure Reduction of design safety margins Reduced service life and functionality of components and
systems Increased risk of catastrophic failure Increased repair, maintenance, reserve fund
contingencies and energy costs
17 Reprinted from IISD. See page 13 Table 3 in http://www.iisd.org/pdf/2013/adaptation_can_infrastructure.pdf

P a g e 15 | 19
Definition of Climate Risk18
Climate Hazard
A climate event with the potential to cause harm or long- term change in climate variables
Exposure
Number of infrastructures present in climate-hazard prone
areas
Vulnerability
Susceptibility to harm
“A climate hazard refers to a climatic event with the potential to cause
harm (e.g., floods, wildfires, hurricanes) or
long-term changes in climate variables that
have negative consequences over time
(e.g., rising temperatures, changing rainfall
patterns).”
“Exposure of infrastructures to climate risk refers to the presence
of infrastructures in climate-hazard prone
areas.”
Sensitivity Degree to
which infrastructures
are affected by climate
hazards
Adaptive Capacity
Ability of the sector to minimize adverse
impacts and maximize
positive ones
“Vulnerability of infrastructure systems to climate events is understood as the susceptibility of those infrastructures to harm from climate hazards. The vulnerability of particular infrastructures depends on the sensitivity of infrastructures to climate risk (i.e., the predisposition of infrastructures to be affected due to at least three factors: the age, the composition and the design of infrastructure) and the capacity of the sector to adapt (adaptive capacity) by minimizing negative impacts and/or maximizing positive ones.”
18 Reprinted from IISD. See Page 4 http://www.iisd.org/pdf/2013/adaptation_can_infrastructure.pdf
Climate Risk
Risks from climate variability and climate change
“An additional concept that helps to inform efforts to manage climate risk is resilience, which is defined by the IPCC as the “ability of a system and its counterparts to anticipate, absorb, accommodate or recover from the effects of a hazardous event in a timely and efficient manner” (2012, p. 563). In the context of infrastructure, climate resilience refers to the capacity to adapt to changing conditions without catastrophic loss of form or
function (Concrete Sustainability Hub, 2013).”

P a g e 16 | 19
All things considered by and large, Climate Change can significantly impact buildings and its stakeholders in many ways the topmost reasons being, increase in: (1) premature or accelerated deterioration of building envelopes and enclosures, (2) construction delays and costs, (3) rebuilding, repair and maintenance work, (4) liability issues, (5) design requirements for buildings based on changing climatic patterns, (6) regulatory requirements, (7) energy demand, (8) health and safety risks for occupants, (9) indoor environment quality problems, (10) catastrophic failures, to name a few.
Therefore, there is a pressing need to:
(1) Understand the vulnerability of the building sector to Climate Change by researching and identifying the impacts of Climate Change on the built environment,
(2) Establish mitigating pathways to reduce the impacts of Climate Change on the built environment, and
(3) Revolutionize transformative pathways to building adaptable resilient buildings and communities that can reinstate environmental balances, reinforce natural coexistence, and invigorate health, safety and well-being.
These needs have to be addressed together by all the stakeholders in the building sectors (policy makers, building owners, architects, engineers, contractors etc.) with much greater urgency and scale of action to not only avert the implications of Climate Change to built environment, but also for the greater cause of making the world a better place to live for the current and future generations.

P a g e 17 | 19
BIBLIOGRAPHY – RELEVANT ISO STANDARDS
ISO Standards are available for purchase at: https://www.iso.org/
ISO 14040 Environmental Management – Life Cycle Assessment – Principles and Framework ISO 14040:2006 describes the principles and framework for life cycle assessment (LCA) including: definition of the goal and scope of the LCA, the life cycle inventory analysis (LCI) phase, the life cycle impact assessment (LCIA) phase, the life cycle interpretation phase, reporting and critical review of the LCA, limitations of the LCA, the relationship between the LCA phases, and conditions for use of value choices and optional elements.
ISO 14044 Environmental Management – Life Cycle Assessment – Requirements and Guidelines ISO 14044:2006 specifies requirements and provides guidelines for life cycle assessment (LCA) including: definition of the goal and scope of the LCA, the life cycle inventory analysis (LCI) phase, the life cycle impact assessment (LCIA) phase, the life cycle interpretation phase, reporting and critical review of the LCA, limitations of the LCA, relationship between the LCA phases, and conditions for use of value choices and optional elements.
ISO 14045 Environmental Management – Eco-efficiency Assessment of Product Systems – Principles, Requirements and Guidelines ISO 14045:2012 describes the principles, requirements and guidelines for eco- efficiency assessment for product systems including: the goal and scope definition of the eco-efficiency assessment; the environmental assessment; the product-system- value assessment; the quantification of eco-efficiency; interpretation (including quality assurance); reporting; critical review of the eco-efficiency assessment.
ISO/TR 14047
Environmental Management – Life Cycle Assessment – Illustrative Examples on How to Apply ISO 14044 to Impact Assessment Situations The purpose of ISO/TR 14047:2012 is to provide examples to illustrate current practice of life cycle impact assessment according to ISO 14044:2006. These examples are only a sample of all possible examples that could satisfy the provisions of ISO 14044. They offer "a way" or "ways" rather than the "unique way" of applying ISO 14044. They reflect the key elements of the life cycle impact assessment (LCIA) phase of the LCA.
ISO/TS 14048
Environmental Management – Life Cycle Assessment – Data Documentation Format ISO 14048:200 provides the requirements and a structure for a data documentation format, to be used for transparent and unambiguous documentation and exchange of Life Cycle Assessment (LCA) and Life Cycle Inventory (LCI) data, thus permitting consistent documentation of data, reporting of data collection, data calculation and data quality, by specifying and structuring relevant information.
ISO/TR 14049
Environmental Management – Life Cycle Assessment – Illustrative Examples on How to Apply ISO 14044 to Goal and Scope Definition and Inventory Analysis ISO/TR 14049:2012 provides examples about practices in carrying out a life cycle inventory analysis (LCI) as a means of satisfying certain provisions of ISO 14044:2006. These examples are only a sample of the possible cases satisfying the provisions of ISO 14044. They offer "a way" or "ways" rather than the "unique way" for the

P a g e 18 | 19
application of ISO 14044. These examples reflect only portions of a complete LCI study.
ISO 14064 Greenhouse gases -- Part 1: Specification with guidance at the organization level for quantification and reporting of greenhouse gas emissions and removals ISO 14064-1:2006 specifies principles and requirements at the organization level for quantification and reporting of greenhouse gas (GHG) emissions and removals. It includes requirements for the design, development, management, reporting and verification of an organization's GHG inventory.
ISO 14065 Greenhouse gases -- Requirements for greenhouse gas validation and verification bodies for use in accreditation or other forms of recognition ISO 14065:2013 specifies principles and requirements for bodies that undertake validation or verification of greenhouse gas (GHG) assertions.
ISO 14066 Greenhouse gases -- Competence requirements for greenhouse gas validation teams and verification teams ISO 14066:2011 specifies competence requirements for validation teams and verification teams. ISO 14066:2011 complements the implementation of ISO 14065.
ISO/TS 14067
Greenhouse gases -- Carbon footprint of products -- Requirements and guidelines for quantification and communication ISO/TS 14067:2013 specifies principles, requirements and guidelines for the quantification and communication of the carbon footprint of a product (CFP), based on International Standards on life cycle assessment (ISO 14040 and ISO 14044) for quantification and on environmental labels and declarations (ISO 14020, ISO 14024 and ISO 14025) for communication. Requirements and guidelines for the quantification and communication of a partial carbon footprint of a product (partial CFP) are also provided.
ISO/TS 14071
Environmental management -- Life cycle assessment -- Critical review processes and reviewer competencies: Additional requirements and guidelines to ISO 14044:2006 ISO/TS 14071:2014 provides additional specifications to ISO 14040:2006 and ISO 14044:2006. It provides requirements and guidelines for conducting a critical review of any type of LCA study and the competencies required for the review. ISO/TS 14071:2014 provides: details of a critical review process, including clarification with regard to ISO 14044:2006; guidelines to deliver the required critical review process, linked to the goal of the life cycle assessment (LCA) and its intended use; content and deliverables of the critical review process; guidelines to improve the consistency, transparency, efficiency and credibility of the critical review process; the required competencies for the reviewer(s) (internal, external and panel member); the required competencies to be represented by the panel as a whole.
ISO/TS 14072
Environmental management -- Life cycle assessment -- Requirements and guidelines for organizational life cycle assessment ISO/TS 14072:2014 provides additional requirements and guidelines for an effective application of ISO 14040 and ISO 14044 to organizations. This Technical Specification details: the application of Life Cycle Assessment (LCA) principles and methodology to organizations; the benefits that LCA can bring to organizations by using LCA methodology at organizational level; the system boundary; specific considerations when dealing with LCI, LCIA, and interpretation, and the

P a g e 19 | 19
limitations regarding reporting, environmental declarations, and comparative assertions.
ISO 16745 Environmental performance of buildings -- Carbon metric of a building -- Use stage ISO 16745:2015 provides requirements for determining and reporting a carbon metric of an existing building, associated with the operation of the building. It sets out methods for the calculation, reporting, communication, and verification of a set of carbon metrics for GHG emissions arising from the measured energy use during the operation of an existing building, the measured user-related energy use, and other relevant GHG emissions and removals. ISO 16745:2015 is not an assessment method for evaluating the overall environmental performance of a building or a building-rating tool and does not include value-based interpretation of the carbon metric(s) through weightings or benchmarking. ISO 16745:2015 deals with the application of the carbon metric(s) for an existing building, either residential or commercial, or a building complex. It does not include provisions for regional and/or national building stock.

Page
1
3.0 Concepts
There are many zero carbon concepts or frameworks in the built environment that are evolving in the aftermath of increased awareness of issues related to climate change due to greenhouse gas emissions. These frameworks provide building project participants - guidelines to mitigate, reduce or offset carbon emissions within certain system boundaries - and would differ from each other in the scope of the boundary settings as applicable to their stakeholders. Their boundaries may be narrow or broad and span across the life cycle of the building project. Most of these frameworks are not mandated or governed by a certification authority and is entirely voluntary to participate for building project stakeholders.
Within the context of an originating ideation, in this chapter, the components of four conceptual carbon frameworks are discussed below, amid bewildering diverse set of terminologies used in the built environment.
• Zero Net Carbon Buildings • Carbon Neutral Buildings • Carbon Negative Buildings • Zero Carbon Buildings
The central dynamics prevalent in these concepts, in entirety or combinations, are:
- Measure and Reduce carbon emissions from or due to buildings (energy efficiency measures, on-site renewable energy generation, and/or off-site renewable energy purchase)
- Offset emissions from or due to buildings (certified renewable energy credits), and/or - Export surplus on-site renewable energy to other off-site systems.
The first four sections of this chapter will discuss the conceptual frameworks in the perspective of:
- Ideation and definition of concept, - Applicable building sectors and types, - Life cycle and spatial boundaries, - Metric and timeline, and - Pathways established by the frameworks and their integration in practice by involved
stakeholders in the built environment.
Beyond Zero Carbon Emissions Buildings will be discussed to encompass futuristic visions evolving in the built environment. Zero energy concepts will be discussed to facilitate an understanding of how they differ from zero carbon buildings, and provide an all rounded perspective.
In the fifth section, the concept of carbon offset and the role of certification programs such as Green-e Climate, American Carbon Registry, Climate Action Reserve, Voluntary Gold Standard, Clean Development Mechanism and Joint Implementation, Verified Carbon Standard are discussed.
While the Information contained in this course has been presented with all due care, the authors do not warrant or represent that the Information is free from errors or omission. The authors accept no liability whatsoever for, or in respect of any use or reliance upon this publication by any party. Authors: Ravi Srinivasan and Jaya Lakshmanan

P a g e 2 | 15
3.1. ZERO NET CARBON BUILDINGS
The concept of Zero Net Carbon (ZNC)1 buildings originated from Architecture 2030, New Buildings Institute, and Rocky Mountain Institute (a group of US based Non-Profit organizations) in 2016 with an intention to establish a clear direction for new and existing buildings to advance toward zero-carbon built environments.
This group of organizations define a Zero Net Carbon building as:
“a highly energy efficient building that produces on-site, or procures, enough carbon-free
renewable energy to meet building operations energy consumption annually.”
Applicable Building Sectors & Types
Zero Net Carbon concept can be applied to all building sectors and types, residential and non- residential, new or existing, and includes even buildings in dense urban environments with limited on- site renewable energy capacity.
Life Cycle and Spatial Boundaries
Zero Net Carbon concept focuses only on carbon emissions resulting from the operational stage of the building life cycle and the spatial boundary scale is set at the site level.
Metrics & Timeline
The annual metric established for ZNC buildings is site Energy Use Intensity (EUI) in KBtu/sq. ft-year and not source EUI. The baseline for Zero Net Carbon Building is the national average energy consumption of existing U.S. commercial buildings as reported by the 2003 Commercial Building Energy Consumption Survey (CBECS).
Pathways and Applications in Practice
The proposed pathway for Zero Net Carbon is:
First, measure and reduce emissions in comparison with the baseline building type through integrative building design strategies and energy efficiency measures;
Second, reduce emissions by incorporating carbon-free on-site renewable energy systems; and/or purchasing of locally produced renewable energy to meet the balance of its energy needs.
1 http://architecture2030.org/zero-net-carbon-a-new-definition/
On an annual basis,
On-site renewable energy generation + purchased off-site renewable energy meets site operational energy consumption.

P a g e 3 | 15
Zero Net Carbon is a concept very recent in origin, and detailed certification pathways are yet to be developed and incorporated in practice. The reasoning of this concept is that all buildings should be able to achieve Zero Net Carbon status, without the building project stakeholders of having to be swamped with constraints or limitations imposed by pathways. Since its origination in July 2016, there has been a workshop among the ten Green Buildings Councils (GBC) worldwide (Australia, Brazil, Canada, China, India, Germany, South Africa, Sweden, The Netherlands and the United State), along with the World Green Building Council (WBGC) and Architecture 2030 to adopt a ZNC definition and establish certification program to achieve Zero Net Carbon goals in their respective countries by 2017.
3.2. CARBON NEUTRAL BUILDING
The concept of Carbon Neutral building originated from an initiative by Architecture 2030 Challenge2 and was first adopted by the American Institute of Architects (AIA) in 2006, with the intention of rapidly redefining the built environment from being a major contributor of greenhouse gas emission to becoming an integral part of mitigating the climate change crisis.
The organization defines a Carbon Neutral Building as:
“a building that uses no fossil fuel, greenhouse-gas-emitting energy to operate.”
Applicable Building Sectors & Types
Architecture 2030 Challenge’s Carbon Neutral building concept can be applied to all new buildings, developments and major renovations and is a voluntary commitment that can be made by individuals, firms and organizations, and governments.
Life Cycle and Spatial Boundaries
Carbon Neutral building concept focuses only on carbon emissions resulting from the operational stage of the building life cycle and the spatial boundary scale is set at the building site level.
Metrics & Timeline
The annual metric established for ZNC buildings is site Energy Use Intensity (EUI) in KBtu/sq. ft-year and not source EUI. The baseline for Zero Net Carbon Building is the national average energy consumption of existing U.S. commercial buildings as reported by the 2003 Commercial Building Energy Consumption Survey (CBECS).
Pathways and Applications in Practice
The proposed pathway for Carbon Neutral buildings is:
First, measure and reduce emissions in comparison with the baseline building type through integrative building design strategies and energy efficiency measures; see table below for specific percentages required reductions over baseline building type by year.
2 http://architecture2030.org/2030_challenges/2030-challenge/
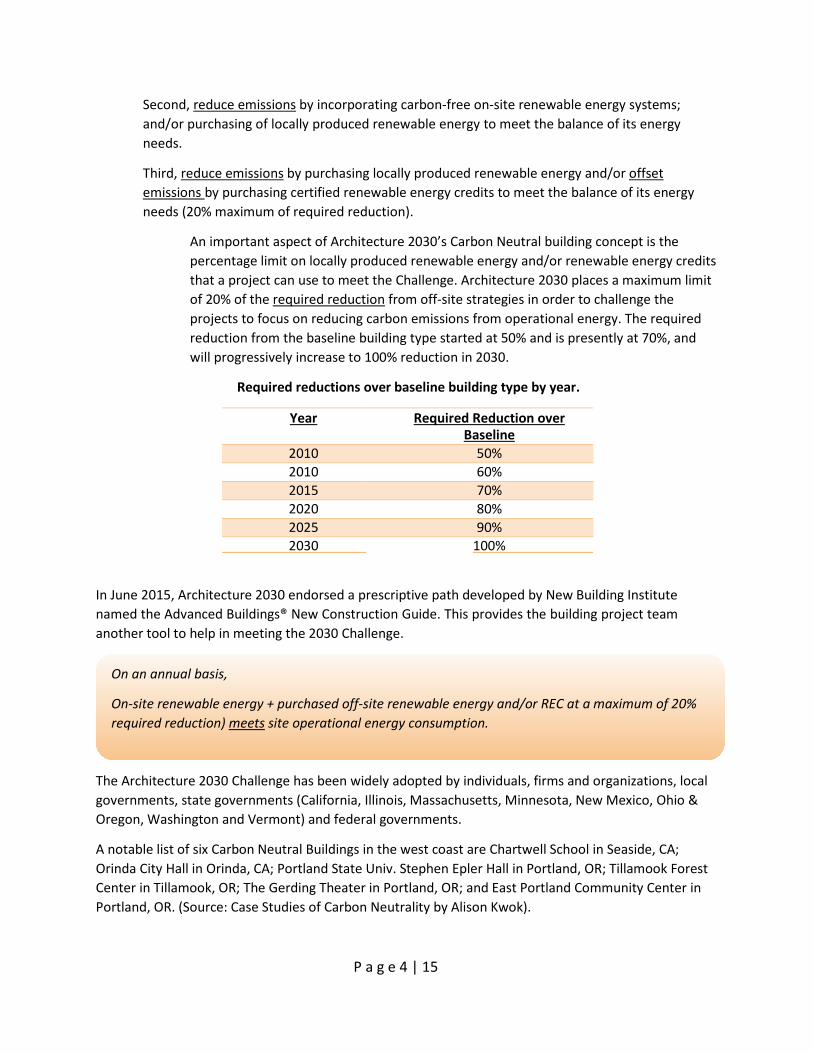
P a g e 4 | 15
Second, reduce emissions by incorporating carbon-free on-site renewable energy systems; and/or purchasing of locally produced renewable energy to meet the balance of its energy needs.
Third, reduce emissions by purchasing locally produced renewable energy and/or offset emissions by purchasing certified renewable energy credits to meet the balance of its energy needs (20% maximum of required reduction).
An important aspect of Architecture 2030’s Carbon Neutral building concept is the percentage limit on locally produced renewable energy and/or renewable energy credits that a project can use to meet the Challenge. Architecture 2030 places a maximum limit of 20% of the required reduction from off-site strategies in order to challenge the projects to focus on reducing carbon emissions from operational energy. The required reduction from the baseline building type started at 50% and is presently at 70%, and will progressively increase to 100% reduction in 2030.
Required reductions over baseline building type by year.
Year Required Reduction over Baseline
2010 50% 2010 60% 2015 70% 2020 80% 2025 90%
2030 100%
In June 2015, Architecture 2030 endorsed a prescriptive path developed by New Building Institute named the Advanced Buildings® New Construction Guide. This provides the building project team another tool to help in meeting the 2030 Challenge.
The Architecture 2030 Challenge has been widely adopted by individuals, firms and organizations, local governments, state governments (California, Illinois, Massachusetts, Minnesota, New Mexico, Ohio & Oregon, Washington and Vermont) and federal governments.
A notable list of six Carbon Neutral Buildings in the west coast are Chartwell School in Seaside, CA; Orinda City Hall in Orinda, CA; Portland State Univ. Stephen Epler Hall in Portland, OR; Tillamook Forest Center in Tillamook, OR; The Gerding Theater in Portland, OR; and East Portland Community Center in Portland, OR. (Source: Case Studies of Carbon Neutrality by Alison Kwok).
On an annual basis,
On-site renewable energy + purchased off-site renewable energy and/or REC at a maximum of 20% required reduction) meets site operational energy consumption.
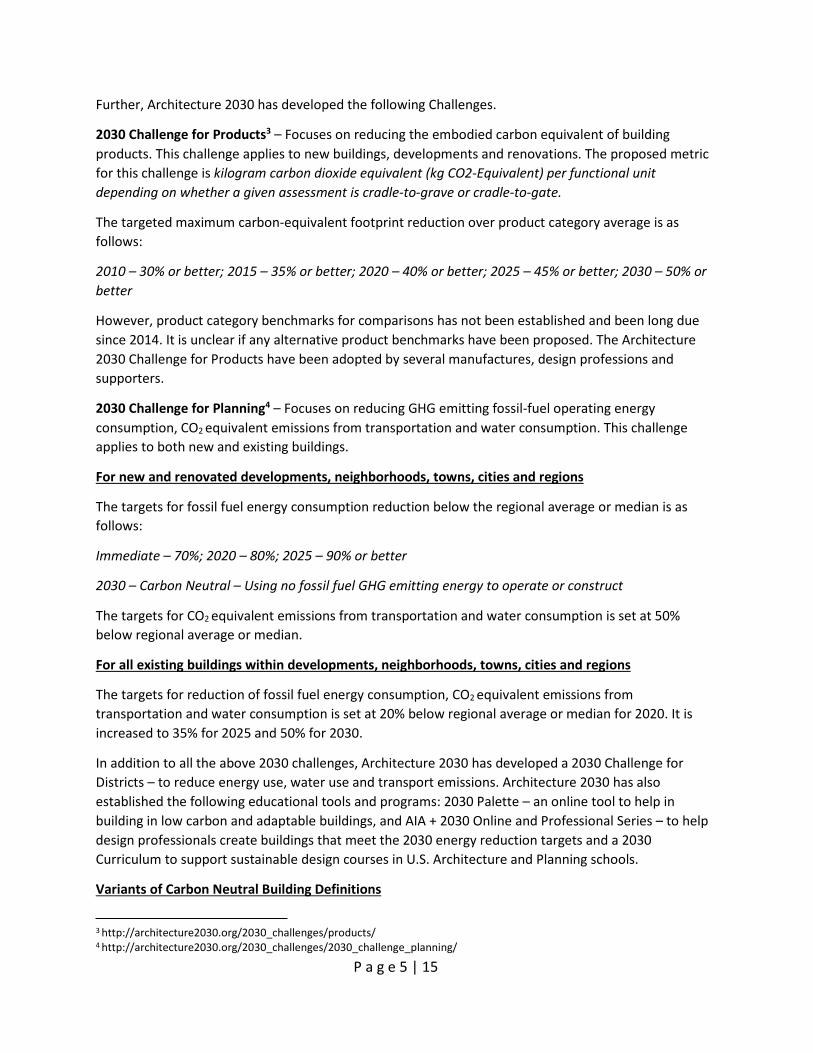
P a g e 5 | 15
Further, Architecture 2030 has developed the following Challenges.
2030 Challenge for Products3 – Focuses on reducing the embodied carbon equivalent of building products. This challenge applies to new buildings, developments and renovations. The proposed metric for this challenge is kilogram carbon dioxide equivalent (kg CO2-Equivalent) per functional unit depending on whether a given assessment is cradle-to-grave or cradle-to-gate.
The targeted maximum carbon-equivalent footprint reduction over product category average is as follows:
2010 – 30% or better; 2015 – 35% or better; 2020 – 40% or better; 2025 – 45% or better; 2030 – 50% or better
However, product category benchmarks for comparisons has not been established and been long due since 2014. It is unclear if any alternative product benchmarks have been proposed. The Architecture 2030 Challenge for Products have been adopted by several manufactures, design professions and supporters.
2030 Challenge for Planning4 – Focuses on reducing GHG emitting fossil-fuel operating energy consumption, CO2 equivalent emissions from transportation and water consumption. This challenge applies to both new and existing buildings.
For new and renovated developments, neighborhoods, towns, cities and regions
The targets for fossil fuel energy consumption reduction below the regional average or median is as follows:
Immediate – 70%; 2020 – 80%; 2025 – 90% or better
2030 – Carbon Neutral – Using no fossil fuel GHG emitting energy to operate or construct
The targets for CO2 equivalent emissions from transportation and water consumption is set at 50% below regional average or median.
For all existing buildings within developments, neighborhoods, towns, cities and regions
The targets for reduction of fossil fuel energy consumption, CO2 equivalent emissions from transportation and water consumption is set at 20% below regional average or median for 2020. It is increased to 35% for 2025 and 50% for 2030.
In addition to all the above 2030 challenges, Architecture 2030 has developed a 2030 Challenge for Districts – to reduce energy use, water use and transport emissions. Architecture 2030 has also established the following educational tools and programs: 2030 Palette – an online tool to help in building in low carbon and adaptable buildings, and AIA + 2030 Online and Professional Series – to help design professionals create buildings that meet the 2030 energy reduction targets and a 2030 Curriculum to support sustainable design courses in U.S. Architecture and Planning schools.
Variants of Carbon Neutral Building Definitions
3 http://architecture2030.org/2030_challenges/products/ 4 http://architecture2030.org/2030_challenges/2030_challenge_planning/
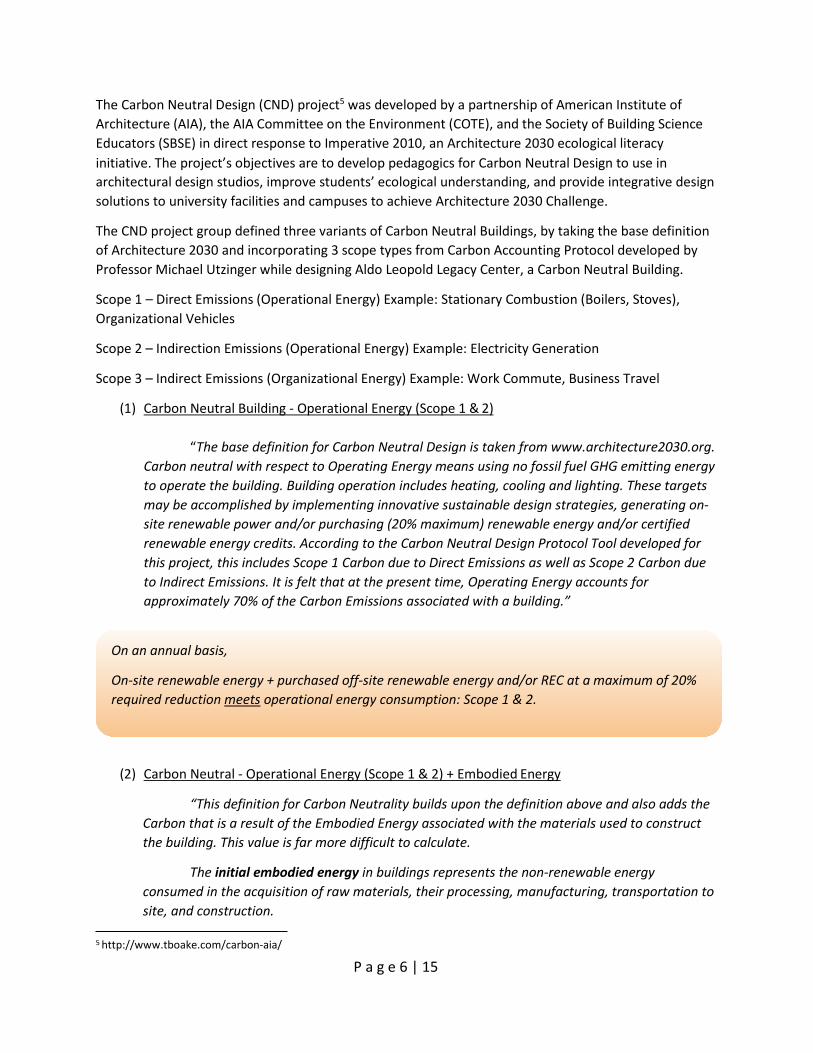
P a g e 6 | 15
The Carbon Neutral Design (CND) project5 was developed by a partnership of American Institute of Architecture (AIA), the AIA Committee on the Environment (COTE), and the Society of Building Science Educators (SBSE) in direct response to Imperative 2010, an Architecture 2030 ecological literacy initiative. The project’s objectives are to develop pedagogics for Carbon Neutral Design to use in architectural design studios, improve students’ ecological understanding, and provide integrative design solutions to university facilities and campuses to achieve Architecture 2030 Challenge.
The CND project group defined three variants of Carbon Neutral Buildings, by taking the base definition of Architecture 2030 and incorporating 3 scope types from Carbon Accounting Protocol developed by Professor Michael Utzinger while designing Aldo Leopold Legacy Center, a Carbon Neutral Building.
Scope 1 – Direct Emissions (Operational Energy) Example: Stationary Combustion (Boilers, Stoves), Organizational Vehicles
Scope 2 – Indirection Emissions (Operational Energy) Example: Electricity Generation
Scope 3 – Indirect Emissions (Organizational Energy) Example: Work Commute, Business Travel
(1) Carbon Neutral Building - Operational Energy (Scope 1 & 2)
“The base definition for Carbon Neutral Design is taken from www.architecture2030.org. Carbon neutral with respect to Operating Energy means using no fossil fuel GHG emitting energy to operate the building. Building operation includes heating, cooling and lighting. These targets may be accomplished by implementing innovative sustainable design strategies, generating on- site renewable power and/or purchasing (20% maximum) renewable energy and/or certified renewable energy credits. According to the Carbon Neutral Design Protocol Tool developed for this project, this includes Scope 1 Carbon due to Direct Emissions as well as Scope 2 Carbon due to Indirect Emissions. It is felt that at the present time, Operating Energy accounts for approximately 70% of the Carbon Emissions associated with a building.”
(2) Carbon Neutral - Operational Energy (Scope 1 & 2) + Embodied Energy
“This definition for Carbon Neutrality builds upon the definition above and also adds the Carbon that is a result of the Embodied Energy associated with the materials used to construct the building. This value is far more difficult to calculate.
The initial embodied energy in buildings represents the non-renewable energy consumed in the acquisition of raw materials, their processing, manufacturing, transportation to site, and construction.
5 http://www.tboake.com/carbon-aia/
On an annual basis,
On-site renewable energy + purchased off-site renewable energy and/or REC at a maximum of 20% required reduction meets operational energy consumption: Scope 1 & 2.

P a g e 7 | 15
This initial embodied energy has two components: Direct energy the energy used to transport building products to the site, and then to construct the building; and Indirect energy the energy used to acquire, process, and manufacture the building materials, including any transportation related to these activities.
The recurring embodied energy in buildings represents the non-renewable energy consumed to maintain, repair, restore, refurbish or replace materials, components or systems during the life of the building.
As buildings become more energy-efficient, the ratio of embodied energy to lifetime consumption increases. Clearly, for buildings claiming to be "zero-energy" or "autonomous", the energy used in construction and final disposal takes on a new significance.”
(3) Carbon Neutral Building - Operational Energy (Scope 1 & 2) + Embodied Energy + Site Energy +
Occupant Travel (Scope 3)
“This definition of Carbon Neutrality builds upon the inclusion of Operating Energy and Embodied Energy, and also reflects the carbon costs associated with a building's location. This requires a calculation of the personal carbon emissions associated with the means and distance of travel of all employees and visitors to the building. This is referred to as Scope 3 Carbon due to Indirect Emissions (organizational travel).”
Aldo Leopold Legacy Center is the first LEED recognized Carbon Neutral, a zero net energy building and LEED c2.0 Platinum Building to be constructed in the world. The one-story 11,900 sq. ft. building was completed in 2007. According to CND project website, this building was designed to use 70% less energy than a comparable conventional building. The building produces over 10% more energy than it annually consumes using 198-panel 39.6 kW rooftop photovoltaic array installation. The building project won the 2008 AIA COTE Top Ten Green Projects Award.
On an annual basis,
On-site renewable energy + purchased off-site renewable energy and/or REC at a maximum of 20% required reduction meets operational energy consumption: Scope 1 & 2 + Embodied Energy.
On an annual basis,
On-site renewable energy + purchased off-site renewable energy and/or REC at a maximum of 20% required reduction meets operational energy consumption: Scope 1 & 2 + Embodied Energy + Site Energy + Occupant Travel.

P a g e 8 | 15
On-site and near-site renewable energy + purchased off-site renewable energy exceeds operational energy consumption.
3.3. CARBON NEGATIVE BUILDINGS
The concept of Carbon Negative buildings originated from Building Research Establishment Environmental Assessment Method (BREEAM UK New Construction Rating System, Reduction of energy use and carbon emissions in the Energy section6) in 2011. BREEAM defines a Carbon Negative building as:
“a building/site that generates, surplus to its own energy demand, an excess of renewable or carbon neutral energy, and exports that surplus via the National Grid to meet other, off-site energy demands, i.e.
the building is a net exporter of zero carbon energy.”
Applicable Building Sectors & Types
Carbon Negative building concept applies to all new construction and extension of non-domestic building types.
Life Cycle and Spatial Boundaries
Carbon Negative Building “focuses only on energy and carbon dioxide emissions resulting from the operational stage of the building life cycle (as this is the stated aim of this assessment issue). It does not take in to account the embodied carbon, in terms of carbon fixing or emissions resulting from the manufacture or disposal of building materials and components.” The spatial boundary scale is set at the building level.
Metrics & Timeline
The annual metric established for Carbon Negative buildings is zero net regulated carbon emissions (kg CO2 /m2.yr.
Pathways and Applications in Practice
The pathway for Carbon Negative Building is:
First, measure and reduce emissions through integrative building design strategies and energy efficiency measures;
Second, reduce emissions by incorporating on-site and near-site renewable energy systems;
Third, export of surplus on-site renewable energy through the National Grid to meet other off- site energy demands.
An example of a Carbon Negative Buildings is an educational facility for students called Bramall Learning Center at the Royal Horticultural Society’s gardens. A 15kW wind turbine provides on-site energy generation. This building was designed by Eco Arc Architects. The building has won numerous awards owing to extraordinary performance in reducing greenhouse gas emissions by going above and beyond carbon neutral.
6 http://www.breeam.com/nondom_mobile/Advanced/content/06_energy/ene01.htm

P a g e 9 | 15
3.4. ZERO CARBON BUILDINGS
The concept of Zero Carbon buildings prevail broadly in the built environment with no universally accepted definitions. Many institutions have recognized the need for an agreed upon definition and many researchers and governments investigated definitions for Zero Carbon buildings for consistent agreed upon application across the globe.
In 2011, On behalf of the Australian Sustainable Built Environment Council’s (ASBEC’s) Zero Emissions Residential Task Group (ZERTG), Sustainability Victoria commissioned the Institute for Sustainable Futures (ISF) to review all the existing definitions for low, zero and positive impact buildings and recommend a suitable definition that can be used in the country for communication, regulation and/or voluntary initiatives.
The group recommended the following standard definition for Zero Carbon buildings7 that can be applied to all residential and non-residential buildings sectors and types:
“A zero carbon building is one that has no net annual Scope 1 and 2 emissions from operation of building incorporated services.
• Building-incorporated services include all energy demands or sources that are part of the building fabric at the time of delivery, such as the thermal envelope (and associated heating and cooling demand), water heater, built-in cooking appliances, fixed lighting, shared infrastructure and installed renewable energy generation
• Zero carbon buildings must meet specified standards for energy efficiency and on-site generation
• Compliance is based on modelling and/or monitoring of greenhouse gas emissions in kg CO2- e/m2 /yr. “
The group proposed terminology for Zero Carbon buildings variations, as outlined:
- Zero Carbon Buildings (base definition) - Zero Carbon Occupied Buildings (includes occupant emissions) - Zero Carbon Embodied Buildings (includes embodied emissions) - Zero Carbon Life-Cycle Buildings (includes all emission sources in the building life cycle) - Autonomous Zero Carbon Buildings (buildings that are not connected to the grid) - Carbon Positive Buildings (achieves less than zero emissions) - Carbon Positive Embodied Buildings (includes embodied emissions and achieves less than zero emissions) - Carbon Positive Life-Cycle Buildings (includes all emission sources and achieves less than zero emissions)
There is no indication of whether the recommended definition and variants may have been universally or nationally accepted. However, they provide an informed understanding of what possibly maybe in the scope of these terminologies.
7 http://www.asbec.asn.au/files/ASBEC_Zero_Carbon_Definitions_Final_Report_Release_Version_15112011_0.pdf
On an annual basis,
On-site renewable energy meets operational energy consumption: Scope 1 & 2.

P a g e 10 | 15
THINK TANK WATCH: Beyond Carbon Emissions
Beyond Zero Emissions (BZE)8 is a small Australian based, not-for-profit, climate change solutions think tank that has been established in 2006 within an intention to take rapid action by providing practical pathways to fix Australia’s carbon emissions and position the country as the world’s renewable energy super power.
Beyond Zero Emissions has collaborated with distinguished institutional subject matter experts such as, The Melbourne Energy Institute, Melbourne Sustainable Society Institute, MRCagney, German Aerospace Center, and The Center for Energy & Environmental Markets, research supporters and a wide range of research contributors, to prepare their highly acclaimed Zero Carbon Australia (ZCA) Plans. This series of plans provide expert analysis and/or comprehensive sector-by-sector blueprints for a Zero Carbon Australia.
‘Zero Carbon Australia’ Plan
Stationary Energy Plan (i.e. Grid Electric Power Generation)
Plan to provide all stationary electricity needs from renewable energy systems spread around an efficient national grid system.
Building Plan Plan for zero emission existing building stock using energy efficient retrofits and electrification of gas appliances, on-site renewable generation and grid renewable energy.
Transportation Plan -High Speed Rail & Electric Vehicles
Plan for zero emission transportation system using High Speed Rail and Electric Vehicles.
Land Use Plan - Forestry & Agriculture Plan
Plan to reduce greenhouse gas emissions from land use sectors such as agriculture, herding and forestry.
Renewable Energy Superpower Plan Plan elucidating the potential for Australia to become the World’s Renewable Energy Superpower.
Industrial Processes Plan Plan for zero emissions from industrial processes by means of renewable energy systems and viability of chemical fossil- carbon replacement. Plan will be published in 2017.
Beyond Zero Emissions has been collaborating with several municipalities and businesses to provide the knowledge and technical support for Zero Carbon Australia plans under two initiatives: the Zero Carbon Communities and the Energy Freedom Home programs.
Mercedes Benz Australian Environmental Research Award was awarded to Beyond Zero Emissions for the Zero Carbon Australia 2020 Stationary Energy Plan in 2010.
Think Tanks and Civil Society’s Program (TTCSP) at the University of Pennsylvania’s Lauder Institute ranked Beyond Zero Emissions as one of the world top independent think tanks, and one of the top 10 to watch in 2016.
8 http://bze.org.au/
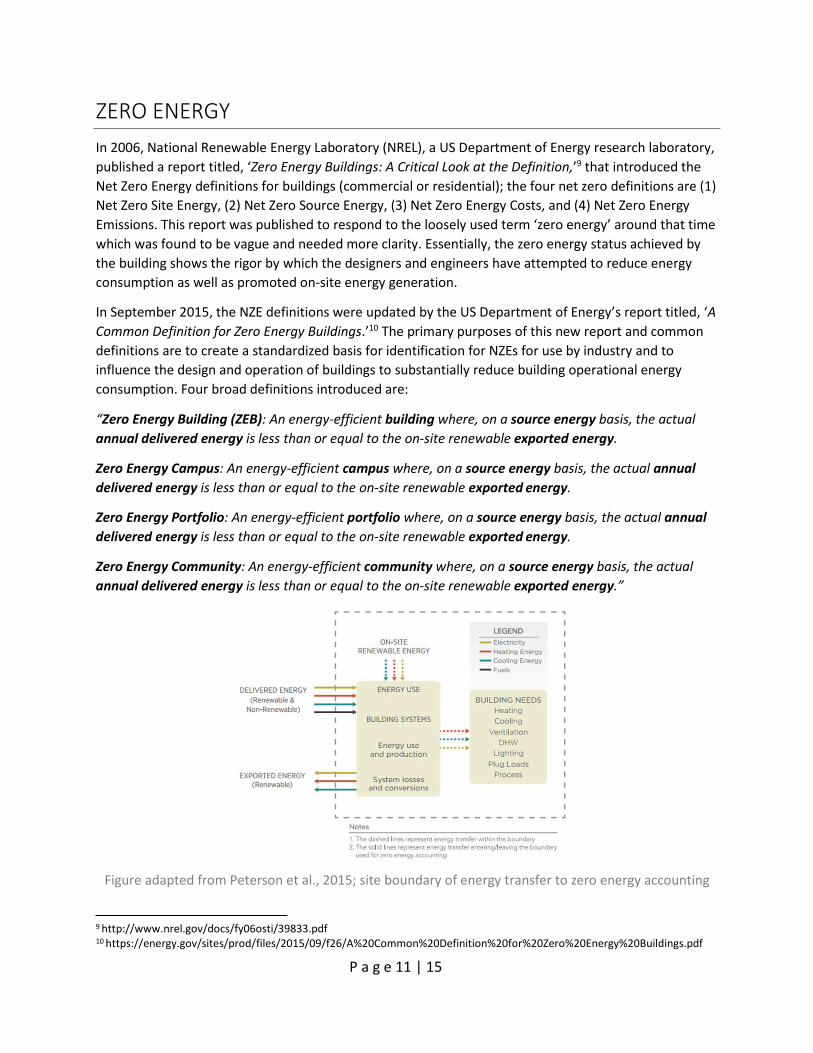
P a g e 11 | 15
ZERO ENERGY
In 2006, National Renewable Energy Laboratory (NREL), a US Department of Energy research laboratory, published a report titled, ‘Zero Energy Buildings: A Critical Look at the Definition,’9 that introduced the Net Zero Energy definitions for buildings (commercial or residential); the four net zero definitions are (1) Net Zero Site Energy, (2) Net Zero Source Energy, (3) Net Zero Energy Costs, and (4) Net Zero Energy Emissions. This report was published to respond to the loosely used term ‘zero energy’ around that time which was found to be vague and needed more clarity. Essentially, the zero energy status achieved by the building shows the rigor by which the designers and engineers have attempted to reduce energy consumption as well as promoted on-site energy generation.
In September 2015, the NZE definitions were updated by the US Department of Energy’s report titled, ‘A Common Definition for Zero Energy Buildings.’10 The primary purposes of this new report and common definitions are to create a standardized basis for identification for NZEs for use by industry and to influence the design and operation of buildings to substantially reduce building operational energy consumption. Four broad definitions introduced are:
“Zero Energy Building (ZEB): An energy-efficient building where, on a source energy basis, the actual annual delivered energy is less than or equal to the on-site renewable exported energy.
Zero Energy Campus: An energy-efficient campus where, on a source energy basis, the actual annual delivered energy is less than or equal to the on-site renewable exported energy.
Zero Energy Portfolio: An energy-efficient portfolio where, on a source energy basis, the actual annual delivered energy is less than or equal to the on-site renewable exported energy.
Zero Energy Community: An energy-efficient community where, on a source energy basis, the actual annual delivered energy is less than or equal to the on-site renewable exported energy.”
Figure adapted from Peterson et al., 2015; site boundary of energy transfer to zero energy accounting
9 http://www.nrel.gov/docs/fy06osti/39833.pdf 10 https://energy.gov/sites/prod/files/2015/09/f26/A%20Common%20Definition%20for%20Zero%20Energy%20Buildings.pdf

P a g e 12 | 15
A Zero Energy Building variant introduced is:
Renewable Energy Certificate – Zero Energy Building (REC-ZEB): An energy-efficient building where, on a source energy basis, the actual annual delivered energy is less than or equal to the on-site renewable exported energy plus acquired Renewable Energy Certificates (RECs).
The table below provides an understanding of how zero energy equations differ from zero carbon equations:
Concept Measurement Boundary Condition
Equations
Zero Net Carbon Building
Carbon Emissions
Site Energy On-site renewable energy generation + purchased off-site renewable energy meets operational energy consumption, on an annual basis.
Carbon Neutral Building
Carbon Emissions
Site Energy On-site renewable energy + purchased off- site renewable energy and/or REC at a maximum of 20% required reduction) meets operational energy consumption, on an annual basis.
Carbon Negative Building
Carbon Emissions
Site Energy On-site and near-site renewable energy + purchased off-site renewable energy exceeds operational energy consumption.
Zero Carbon Building
Carbon Emissions
Site Energy On-site renewable energy meets operational energy consumption: Scope 1 & 2.
Zero Energy Building Energy Source Energy Actual annual delivered energy ≤ on-site renewable exported energy
Renewable Energy Credits – Zero Energy Building
Energy Source Energy Actual annual delivered energy ≤ on-site renewable exported energy plus acquired Renewable Energy Certificates (RECs).
Zero Energy Campus Energy Source Energy Actual annual delivered energy ≤ on-site renewable exported energy
Zero Energy Portfolio
Energy Source Energy Actual annual delivered energy ≤ on-site renewable exported energy.
Zero Energy Community
Energy Source Energy Actual annual delivered energy is ≤ on-site renewable exported energy.”

P a g e 13 | 15
3.5. CARBON OFFSETS
A carbon offset is a mandatory or voluntary mechanism that allows individuals, companies and organizations to reduce their carbon dioxide equivalent on the atmosphere in one area by investing in projects that reduce carbon dioxide equivalent on the atmosphere in another area. One carbon offset represents the reduction or removal of one metric tonne of carbon dioxide equivalent from the atmosphere. The Environmental Protection Agency (EPA) defines a carbon offset as “a tradable, environmental commodity that represents the reduction of a specific amount of GHG emissions to the atmosphere and is measured in tons.”
Carbon offset is a complicated topic and have been subject to many controversies in the past few decades since its inception. Carbon offsets exist in both mandatory and voluntary markets. While the mandatory market is aimed at heavy emitters and regulated by their respective authorities under international, national and regional requirements, there is no universally agreed upon international standards or frameworks for voluntary carbon offsets.
The International Organization of Standardizations (ISO)’s standards for greenhouse gas accounting and verification (ISO 14064 and ISO 14065) underpins the development of most of the independent third party standards for voluntary carbon offsets. In addition, the Global Carbon Project (GCP) in its report on Carbon Reductions and Offsets11 established underlying principles (or criteria) for carbon offset projects to ensure trading credibility and real atmospheric carbon reductions using the features of Clean Development Mechanism (CDM) as the benchmark. According to the GCP report,
“A high quality carbon offset project should have at least the following three qualities. It must (i) be counted only once; ii) be additional, transparent and verifiable; and (iii) avoid leakage.”
Further, the report recommends carbon offset project establish permanence, efficiency and consider projects with societal and economic benefits in addition to offsets – offset plus.
Carbon offset project types mostly consist of: Energy Efficiency (EE), Renewable Energy (RE), Reduced Emissions from Degradation and Deforestation (REDD+), Bio-Sequestration, Energy-from-Waste Capture, Mine Methane Capture (MMC), Livestock Methane Capture, Ozone Depleting Substances (ODS) Destruction, and Transport Emissions Reduction - to name a few.
Various standards have emerged in the voluntary carbon markets and can be characterized as either independent third party project certification program or product certification program.
• The independent third party project certification programs develop their own standards and verify carbon offset project meet minimum standards. They may also verify the carbon reductions and issue credits that can traded by offset retailers.
The following is a list of independent third party project certification programs for carbon offsets, along with the names of their carbon credit units and market coverage. Each project certification program has devised its own selection criteria and protocols for the types of projects eligible for registration under their authority.
11 http://www.globalcarbonproject.org/global/pdf/reports/GCP_Report_No.6.pdf
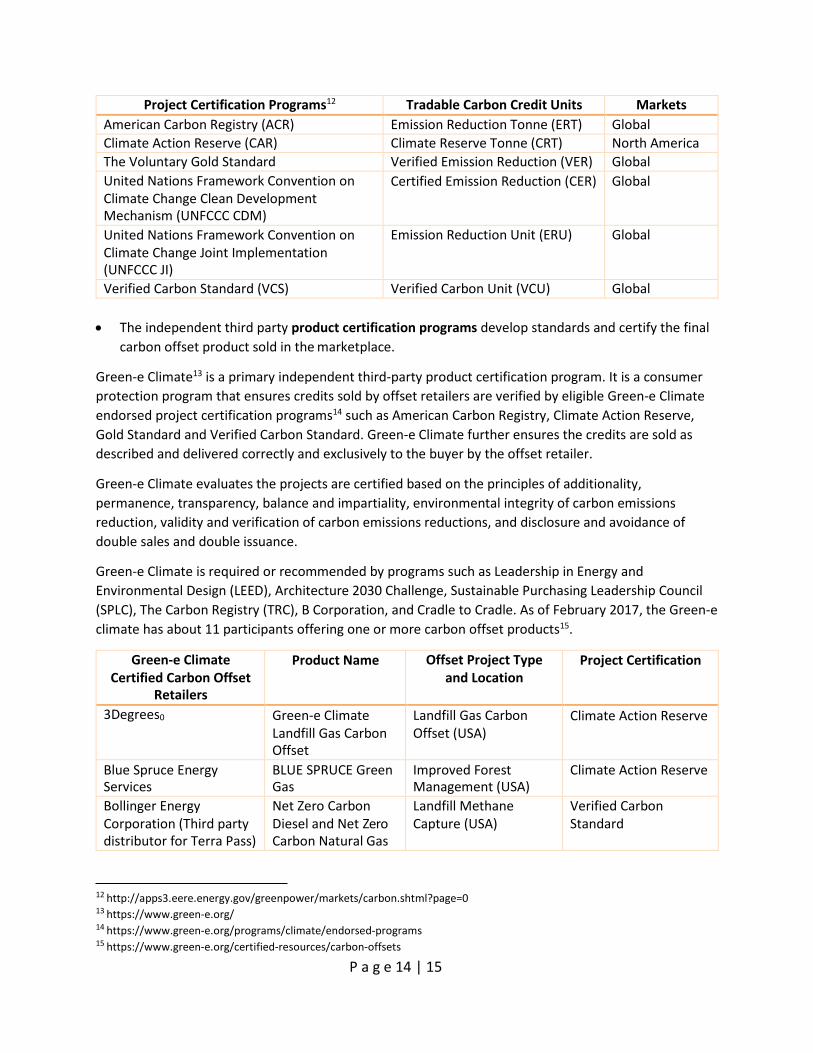
P a g e 14 | 15
Project Certification Programs12 Tradable Carbon Credit Units Markets American Carbon Registry (ACR) Emission Reduction Tonne (ERT) Global Climate Action Reserve (CAR) Climate Reserve Tonne (CRT) North America The Voluntary Gold Standard Verified Emission Reduction (VER) Global United Nations Framework Convention on Climate Change Clean Development Mechanism (UNFCCC CDM)
Certified Emission Reduction (CER) Global
United Nations Framework Convention on Climate Change Joint Implementation (UNFCCC JI)
Emission Reduction Unit (ERU) Global
Verified Carbon Standard (VCS) Verified Carbon Unit (VCU) Global
• The independent third party product certification programs develop standards and certify the final carbon offset product sold in the marketplace.
Green-e Climate13 is a primary independent third-party product certification program. It is a consumer protection program that ensures credits sold by offset retailers are verified by eligible Green-e Climate endorsed project certification programs14 such as American Carbon Registry, Climate Action Reserve, Gold Standard and Verified Carbon Standard. Green-e Climate further ensures the credits are sold as described and delivered correctly and exclusively to the buyer by the offset retailer.
Green-e Climate evaluates the projects are certified based on the principles of additionality, permanence, transparency, balance and impartiality, environmental integrity of carbon emissions reduction, validity and verification of carbon emissions reductions, and disclosure and avoidance of double sales and double issuance.
Green-e Climate is required or recommended by programs such as Leadership in Energy and Environmental Design (LEED), Architecture 2030 Challenge, Sustainable Purchasing Leadership Council (SPLC), The Carbon Registry (TRC), B Corporation, and Cradle to Cradle. As of February 2017, the Green-e climate has about 11 participants offering one or more carbon offset products15.
Green-e Climate Certified Carbon Offset
Retailers
Product Name Offset Project Type and Location
Project Certification
3Degrees0 Green-e Climate Landfill Gas Carbon Offset
Landfill Gas Carbon Offset (USA)
Climate Action Reserve
Blue Spruce Energy Services
BLUE SPRUCE Green Gas
Improved Forest Management (USA)
Climate Action Reserve
Bollinger Energy Corporation (Third party distributor for Terra Pass)
Net Zero Carbon Diesel and Net Zero Carbon Natural Gas
Landfill Methane Capture (USA)
Verified Carbon Standard
12 http://apps3.eere.energy.gov/greenpower/markets/carbon.shtml?page=0 13 https://www.green-e.org/ 14 https://www.green-e.org/programs/climate/endorsed-programs 15 https://www.green-e.org/certified-resources/carbon-offsets
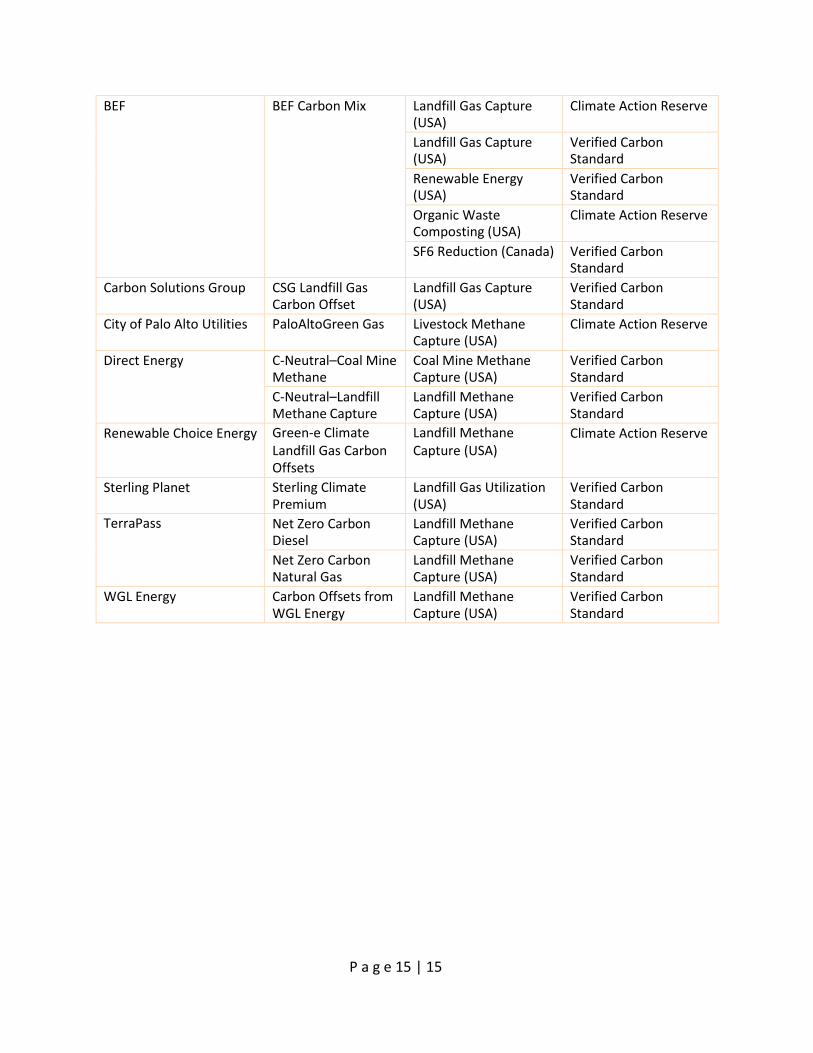
P a g e 15 | 15
BEF BEF Carbon Mix Landfill Gas Capture (USA)
Climate Action Reserve
Landfill Gas Capture (USA)
Verified Carbon Standard
Renewable Energy (USA)
Verified Carbon Standard
Organic Waste Composting (USA)
Climate Action Reserve
SF6 Reduction (Canada) Verified Carbon Standard
Carbon Solutions Group CSG Landfill Gas Carbon Offset
Landfill Gas Capture (USA)
Verified Carbon Standard
City of Palo Alto Utilities PaloAltoGreen Gas Livestock Methane Capture (USA)
Climate Action Reserve
Direct Energy C-Neutral–Coal Mine Methane
Coal Mine Methane Capture (USA)
Verified Carbon Standard
C-Neutral–Landfill Methane Capture
Landfill Methane Capture (USA)
Verified Carbon Standard
Renewable Choice Energy Green-e Climate Landfill Gas Carbon Offsets
Landfill Methane Capture (USA)
Climate Action Reserve
Sterling Planet Sterling Climate Premium
Landfill Gas Utilization (USA)
Verified Carbon Standard
TerraPass Net Zero Carbon Diesel
Landfill Methane Capture (USA)
Verified Carbon Standard
Net Zero Carbon Natural Gas
Landfill Methane Capture (USA)
Verified Carbon Standard
WGL Energy Carbon Offsets from WGL Energy
Landfill Methane Capture (USA)
Verified Carbon Standard

Page
1
4.0 Standards We presently delve in a dimension of well-intended sustainability oriented thinking, where we
are asked to reevaluate standard way of doing work and transform them into sustainability pathways beneficial to the environment, society and economy. In the process, multitudes of sustainability standards and rating systems rapidly evolve to assist in meeting the end goals of minimizing our environmental footprints. However, what is needed is an all-encompassing standard then enables to measure, reduce and offset the global environmental footprint, along with consideration of societal and economic aspects of sustainability.
The subject matter in this chapter is wrought from the viewpoint of an immediate need for convergence of multiple entities to establish global metrics and level playing fields in the sustainability of buildings arena. Therefore, the following outline has been established in this chapter to serve as a motif for the emphasis of this chapter’s intent. It is not in scope of this chapter to list or discuss all the standards and rating systems in the global marketplace right now, but only a select few that would enable to articulate the thought process around the central theme of this chapter.
The first section of this chapter will discuss the following ISO Standards related to sustainability of buildings. ISO 15392:2008 – Sustainability in building construction – General Principles, ISO/TR 21932:2013 – Buildings and constructed assets — Sustainability in building construction — Terminology, ISO 21929-1:2011 – Sustainability in building construction – Sustainability Indicators – Part 1: Framework for the development of indicators and a core set of indicators for buildings, ISO 21930:2007 – Sustainability in building construction — Environmental declaration of building products, and ISO 21931- 1:2010 – Sustainability in building construction - Framework for methods of assessment of environmental performance of construction works – Part 1: Buildings .
The second section of this chapter will discuss the following standards related to carbon footprint. ISO/TS 14067:2013 - Greenhouse gases – Carbon footprint of products – Requirements and guidelines for quantification and communication, Greenhouse Gas Protocol (GHGP) – Product life cycle accounting and reporting standard, PAS 2060:2014 - Specification for the demonstration of carbon neutrality, PAS 2060:2014 - Specification for the demonstration of carbon neutrality, International Energy Agency (IEA) Annex 57 - Evaluation of embodied energy and carbon dioxide emissions for building construction, ISO 16745:2015 - Environmental performance of buildings – Carbon metric of a building – Use stage, and Common Carbon Metric for measuring energy use and reporting greenhouse gas emissions from building operations
The third section of this chapter will discuss the multitudes of rating system in today’s global market and aspects of carbon footprint in sustainability rating systems such as LEED as an example.
The fourth section of this chapter will discuss the need for a global environmental standard and provide a reference to the European Standard that leads the way in establishing a holistic life cycle based standard encompassing the environmental, societal and economic aspects of sustainability.
While the Information contained in this course has been presented with all due care, the authors do not warrant or represent that the Information is free from errors or omission. The authors accept no liability whatsoever for, or in respect of any use or reliance upon this publication by any party. Authors: Ravi Srinivasan and Jaya Lakshmanan

P a g e 2 | 16
4.1. ENVIRONMENTAL STANDARDS FOR BUILDINGS
International Organization of Standardization (ISO) 1, the leading authority of International Standards, has come out with a suite of standards for sustainability in building construction. These International Standards are qualitative in nature and provide general principles, terminologies, core indicator frameworks, assessment frameworks and environmental declaration frameworks, thus enabling assessing entities to formulate holistic life-cycle based sustainability pathways in building construction sector.
The International Standards specific to sustainability of buildings are briefly discussed below and their referencing standards are mentioned, yet it is recommended that the users of this course purchase these Standards to have a deeper understanding of the workings of the Standards. They are typically concise documents with an emphasis on qualitative processes and procedures.
• ISO 15392:2008 – Sustainability in building construction – General Principles 2
ISO 15392:2008 is a general introductory Standard that establishes a tone for sustainability of buildings and infrastructure. The standard gives the meaning of sustainability as a state that requires humans to “carry out their activities in a way that protects the functions of the earth’s ecosystem as a whole”. Next, the Standard accentuates that addressing sustainability of buildings and other construction works should interpret and consider economic, environmental and societal goals as the primary aspects of sustainability. Further, the Standard emphasizes the importance of considering objectives and principles in its entirety and provides detailed guidelines for the same. The Standard explains the concept of product and clarifies meanings of terms such as material, components, assembly, elements, construction that are commonly used interchangeably in the industry.
Per ISO 15392:2008, the following ISO Standards should also be referenced and used when applying the Standard.
ISO 15392:2008 - Normative Reference ISO 6701-1:2004 Building and civil engineering — Vocabulary — Part 1: General terms ISO 14050 (latest edition including amendments)
Environmental Management - Vocabulary
ISO/TS 21929-1 (latest edition including amendments)
Sustainability in building construction – Sustainability indicators – Part 1: Framework for development for indicators for buildings
• ISO/TR 21932:2013 – Sustainability in buildings and civil engineering works -- A review of terminology 3
There are many frameworks for sustainability in the built environment all over the world. However, a universally accepted semantic is missing. ISO/TR 21932 establishes a standardized communication
1 ISO is an independent, non-governmental organization with a membership of 163 national standard bodies. http://www.iso.org/iso/home/about.htm 2 http://www.iso.org/iso/catalogue_detail?csnumber=40432 3 http://www.iso.org/iso/catalogue_detail.htm?csnumber=62888

5 http://www.iso.org/iso/catalogue_detail?csnumber=40435 P a g e 3 | 16
language that can be used across the globe for sustainability assessments. It provides a compilation of terms and concepts that can be commonly understood and applied in the building sustainability arena.
• ISO 21929-1:2011 – Sustainability in building construction – Sustainability Indicators – Part 1: Framework for the development of indicators and a core set of indicators for buildings4
The essence of ISO 21929-1 is the establishment of a framework for developing sustainability indicators for buildings to use in the assessment of economic, environmental and societal impacts of buildings. This Standard also establishes a set of fourteen (14) core indicators for sustainable buildings with respect to air, non-renewable resources, water, waste, land use, access to services, accessibility, indoor conditions and air quality, adaptability, costs, maintainability, safety, serviceability and aesthetic quality. These indicators can be applied to both new and existing buildings. The Standard makers are aware that the core indicator list is not all inclusive and that additional indicators may need to be added according to the nature of the case. This is a pioneering first step in establishing an international standard for the development of unified sustainability core indicators that is applicable to all buildings across the globe.
Per ISO 21929-1:2011, the following ISO Standards (latest editions including amendments) should be referenced and used when applying the Standard.
ISO 21929-1:2011 - Normative Reference ISO 6701-1 Building and civil engineering — Vocabulary — Part 1: General terms ISO 14020 Environmental labels and declarations – General Principles ISO 14021 Environmental labels and declarations – Self-declared environmental
claims (Type II environmental labelling) ISO 14024 Environmental labels and declarations – Type I environmental labelling –
Principles and procedures ISO 14025 Environmental labels and declarations — Type III environmental
declarations — Principles and procedures ISO 14040 Environmental management – Life cycle assessment – Principles and
framework ISO 14050 Environmental Management - Vocabulary ISO 15392 Sustainability in building construction – General Principles ISO 21930 Sustainability in building construction – Environmental declaration of
building products ISO 21931-1 Sustainability in building construction – Framework for methods of
assessment of the environmental performance of constructions works – Part 1: Buildings
• ISO 21930:2007 – Sustainability in building construction — Environmental declaration of building products5
A major lacuna exists for building stakeholders when it comes to selecting building products that has low environmental impacts over the life cycle of the building. A lack of a proper environmental labelling
4 http://www.iso.org/iso/catalogue_detail.htm?csnumber=46599

6 http://www.iso.org/iso/catalogue_detail?csnumber=45559 P a g e 4 | 16
system has been prevailing for a long time in spite of a high need. ISO 21930 tries to fill the gap by establishing a process for developing environmental product declarations (EPD) for building products, thereby enabling enthused environmental standard setting authorities to jumpstart and streamline the EPD process in their respective countries. This Standard establishes a framework for providing quantified environmental data using predetermined parameters based on ISO 14040 and ISO 14044, and where applicable providing additional quantitative and qualitative environmental information for the product. Further, this Standard aims at providing a consistent, transparent, reliable and verifiable environmental accounting methodology for products. This Standard points out that the manufacturers are the sole owners of their data and are liable and responsible for the environmental product declaration. The Standard provides system boundary guidance (cradle-to-gate, cradle-to-grave etc.), methodologies for product category rules (PCR), reporting requirements, EPD content requirements, and review and verification procedures. Environmental product declarations enable architects, planners and other building stakeholders to compare and select products that have a low impact on the environment assuming certain uniform conditions.
Per ISO 21930, the following ISO Standards should also be referenced and used when applying the Standard.
ISO 21930:2007 - Normative Reference ISO 6701-1 (latest edition including amendments)
Building and civil engineering — Vocabulary — Part 1: General terms
ISO 14001 (latest edition including amendments)
Environmental management systems — Requirements with guidance for use
ISO 14020:2000 Environmental labels and declarations — General principles ISO 14025:2006 Environmental labels and declarations — Type III environmental
declarations — Principles and procedures ISO 14040 (latest edition including amendments)
Environmental management — Life cycle assessment — Principles and framework
ISO 14044:2006 Environmental management — Life cycle assessment — Requirements and guidelines
ISO 21930 was used as a basis to building the European Standard EN 15804+A1 Sustainability of construction works -Environmental product declarations - Core rules for the product category of construction products. However, EN 15804+A1 has been updated since its inception and includes more product category rules and EPD content. ISO 21930 has not been updated since 2007 and it is time to review the Standard and ensure it is up to date with EN 15804+A1.
• ISO 21931-1:2010 – Sustainability in building construction - Framework for methods of assessment of environmental performance of construction works – Part 1: Buildings 6
At this point in time, there are many organizations developing, assessing and certifying environmental performance of buildings all over the world. However, there is not much uniformity, transparency or seemless integration of their assessment methods. This has caused a huge cost burden and frustrating experiences for building stakeholders and end users. A unifying standard has been very

P a g e 5 | 16
much needed to provide certifying entities a streamlined process in the development, implementation and certification of the environmental performance of buildings and ISO/TS 21931-1 has been a crucial preliminary step in this direction.
The importance of ISO/TS 21931-1 is the establishment of a framework for formulating methods of assessment of environmental performance of both new and existing buildings during its entire life cycle. The Standard consist of documentation requirements for an organization establishing the framework and assessing the environmental performance of buildings. The documentation should identify the responsible body that develops and maintains the assessment method, details of stakeholders who have been involved in the development and validation of the method, details of recognitions or accreditations of the assessment method at the national or regional or organization levels, and details of the processes and procedures for the delivery of the assessment. The documentation should also include the purpose of the assessment method, system boundary, list of issues that are assesses, assumptions and scenarios, life cycle stages covered, quantification methods, information sources, evaluation and reporting of results.
In addition to providing the general requirements of the process owners of assessment methods, the Standard also provides the extent and application of the assessment method, a high-level modular structure for the life-cycle stages of a building, a schematic matrix structure to assess cause and effect relationships between the characteristics of the building/site and its resulting environmental aspects, and to categorize them as environmental and societal impacts, and a mapping of relevant environmental issues during the different life cycle stages of a building and indicates whether it is mandatory or voluntary to assess and report each issue. This helps in clarifying the system boundary of an assessment method and provides consistency and transparency in accounting and reporting the environmental issues.
Per ISO 21931-1:2010, the following ISO Standards should also be referenced and used when applying the Standard.
ISO 21931-1:2010 - Normative Reference ISO 6701-1 (latest edition including amendments)
Building and civil engineering — Vocabulary — Part 1: General terms
ISO 14025 (latest edition including amendments)
Environmental labels and declarations — Type III environmental declarations — Principles and procedures
ISO 14040:2006 Environmental management – Life cycle assessment – Principles and procedures
ISO 14050 (latest edition including amendments)
Environmental Management – Vocabulary
ISO 15392:2008 Sustainability in building construction – General Principles ISO 15686-1 Buildings and constructed assets – Service life planning – Part 1: General
Principles and Framework ISO 21930:2007 Sustainability in building construction – Environmental declaration of
building products

P a g e 6 | 16
4.2. STANDARDS RELATED TO CARBON FOOTPRINT
There has been ongoing research by academia, industry and organizations to establish a whole life carbon footprint framework for buildings. However as of a date, there are no generally accepted and validated frameworks available to quantify whole life carbon for buildings. As far as partial carbon footprint frameworks for buildings, there are a few general guidance or standards from organizations discussed below.
Carbon Footprint of Products
ISO/TS 14067:2013 - Greenhouse gases – Carbon footprint of products – Requirements and guidelines for quantification and communication 7
ISO/TS 14067 provides a technical specification that explains the principles, requirements and guidelines for quantifying and communicating carbon footprint of products (CFP). This technical specification is based on International Standards on life cycle assessment (ISO 14040 and ISO 14044) for quantification, and environmental labels and declarations (ISO 14020, ISO 14024 and ISO 14025) for communication. The technical specification provides definition, terminologies and principles for carbon footprint of products. It provides a methodology for quantification and includes product category rules (PCR), goals and scope, and life cycle assessment processes. It establishes comprehensive reporting and communication protocols for carbon footprint of products. Offsetting is not within the scope of this technical specification.
Per ISO 14067:2013, the following ISO Standards should also be referenced and used when applying the Standard.
ISO 14067:2013 - Normative Reference ISO 14025:2006 Environmental labels and declarations — Type III environmental
declarations — Principles and procedures ISO 14044:2006 Environmental management — Life cycle assessment — Requirements
and guidelines ISO 14050 (latest edition including amendments)
Environmental management - Vocabulary
Greenhouse Gas Protocol (GHGP) – Product life cycle accounting and reporting standard8; World Resources Institute (WRI) and the World Business Council for Sustainable Development (WBCSD)
Greenhouse Gas Protocol’s product life cycle accounting and reporting standard provides comprehensive guidelines to account, report and reduce greenhouse gas emissions and removals that occur during the life cycle of the product from material acquisition to final disposal (cradle-to-grave). The standard provides the principles and fundamentals of product life cycle accounting. The guidelines include defining goals, establishing scope, setting boundary, collecting data, assessing data quality,
7 http://www.iso.org/iso/catalogue_detail?csnumber=59521 8 http://www.ghgprotocol.org/standards/product-standard

9 http://shop.bsigroup.com/upload/shop/download/pas/pas2050.pdf 10 http://shop.bsigroup.com/ProductDetail/?pid=000000000030286698
P a g e 7 | 16
allocating emissions, assessing uncertainty, calculating inventory results, assuring quality, reporting, and setting reduction targets and tracking inventory changes. The standard also provides guidance on product comparison, land use change impacts and data management plans. The GHGP includes the seven GHGs listed in the Kyoto Protocol namely carbon dioxide (CO2), methane (CH4), nitrous oxide (N2O), hydrofluorocarbons (HFCs), perfluorocarbons (PFCs), sulphur hexafluoride (SF6) and nitrogen trifluoride (NF3). The GHGP product standard encompasses all the three scopes defined below and includes all GHG emissions and removals from material acquisition to final disposal.
PAS 2050:2011 - Specification for the assessment of the life cycle greenhouse gas emissions of goods and services9; British Standards Institution (BSI)
PAS 2050:2011 specification for the assessment of the life cycle greenhouse gas emissions of goods and services is very similar to GHGP’s product standard discussed above. The PAS 2050:2011 specification provides the requirements, principles and implementation procedures. The specification further explains the scope, system boundaries, data collection, emissions allocation and GHG calculation for products. The specification also provides guidelines for assessment of emissions arising from recycled or recyclable material inputs and delayed emissions due to use and final disposal phases of products.
PAS 2060:2014 - Specification for the demonstration of carbon neutrality; BSI10
The central principles of PAS 2060 specification is to demonstrate carbon neutrality through four stages: Measure, Reduce, Offset, and Document/Validate. This specification was introduced in 2010 to
GHGP standard defines a scope system that is widely prevalent in today’s carbon footprint world
and important to know.
“The GHG Protocol defines direct and indirect emissions as follows:
Direct GHG emissions are emissions from sources that are owned or controlled by the reporting entity.
Indirect GHG emissions are emissions that are a consequence of the activities of the reporting entity, but occur at sources owned or controlled by another entity.
The GHG Protocol further categorizes these direct and indirect emissions into three broad scopes:
Scope 1: All direct GHG emissions. Scope 2: Indirect GHG emissions from consumption of purchased electricity, heat or steam. Scope 3: Other indirect emissions, such as the extraction and production of purchased
materials and fuels, transport-related activities in vehicles not owned or controlled by the reporting entity, electricity-related activities (e.g. T&D losses) not covered in Scope 2, outsourced activities, waste disposal, etc.”

P a g e 8 | 16
curtail carbon neutral claims that was prevalent during that time. The specification was updated in 2014 and provides consistent set of requirements and guidelines for all interested entities and individuals to demonstrate carbon neutral status for product, service, community, event or building.
Carbon Footprint of Construction and Maintenance
Annex 57 - Evaluation of embodied energy and carbon dioxide emissions for building construction11; International Energy Agency (IEA)
IEA Annex 57 has been established to provide a framework to evaluate embodied energy and embodied greenhouse gas emissions for building construction, and provide guidelines for low embodied energy and low carbon design. The team has been working on the framework for about six years and are in the stage of publishing detailed reports and guidelines. There will be detailed case studies from many countries included in the report.
Carbon Footprint of Use
ISO 16745:2015 - Environmental performance of buildings – Carbon metric of a building – Use stage12
Carbon emissions and removals of a building in ‘Use’ stage comprises of various sources and has not been clearly defined by standard setting or certifying authorities. ISO 16745 has taken the initial step in defining the carbon metric of a building in-use stage. The Standard provides a protocol for measuring the carbon metric of a building in the ‘use’ stage which includes system boundary, metric and calculation methodology (for energy related sources).
According to ISO 16745, a carbon metric is measured by the amount of direct and indirect emissions and removals associated with a building in-use state and defines three types of carbon metrics of a building in ‘Use’ stage, all of them expressed in CO2 equivalents.
The first type called Carbon metric 1 (CM1) is the sum of annual GHG emissions from building-related energy-use. Quantification not based on LCA.
The second type called Carbon metric 2 (CM2) is the sum of annual GHG emissions from building-related and user-related energy-use. Quantification not based on LCA.
The third type called Carbon metric 3 (CM3) is the sum of annual GHG emissions and removals from building-related and user-related energy-use plus other building-related sources of GHG emissions and removals. Quantification based on partial LCA.
The Standard further provides the reporting and communication and verification requirements.
Per ISO 16745, the following ISO Standards should also be referenced and used when applying the standard.
ISO Standard 16745:2015 - Normative Reference ISO 6701-1:2014 Building and civil engineering — Vocabulary — Part 1: General terms
11 http://www.ecbcs.org/annexes/annex57.htm 12 http://www.iso.org/iso/catalogue_detail.htm?csnumber=57576

P a g e 9 | 16
ISO 12655 (latest edition including amendments)
Energy performance of buildings – Presentation of measured energy use of buildings
ISO 14050 (latest edition including amendments)
Environmental Management – Vocabulary
ISO 15392 (latest edition including amendments)
Sustainability in building construction – General Principles
ISO/TR 16344:2012 Energy performance of buildings – Common terms, definitions and symbols for the overall energy performance rating and certification
Common Carbon Metric for measuring energy use and reporting greenhouse gas emissions from building operations; UNEP SBCI – Sustainable Buildings and Climate Initiative13
United Nations Environment Program - Sustainable Buildings and Climate Initiative (UNEP-SBCI) is the first initiative to propose a global Common Carbon Metric for buildings with the help of a wide range of worldwide contributors from the field of sustainability. UNEP-SBCI describes Common Carbon Metric as the “calculation used to define measurement, reporting, and verification for GHG emissions associated with the operation of buildings types of particular climate regions.” It further states that Common Carbon Metric is consistent with GHG Protocol and ISO 14040/44:2006 Standard and considers the six Kyoto Protocol Greenhouse Gases in the accounting of carbon emissions.
UNEP-SBCI defines two metrics: Energy Intensity and Carbon Intensity to provide for a globally harmonized basis for energy use and GHG emissions. These two metrics are based only on operating energy i.e., on-site generated power and purchased energy. Fugitive emissions and refrigerant use in buildings are reported separately.
These metrics help in establishing baselines, enhancing benchmarks and targeting improvements. This in turn helps policy and decision makers to understand energy use, improve performance and mitigate carbon emissions in their respective authority ranging from building, campus, cities up until national levels.
UNEP SBCI considers the total emissions of the building arise from the following three life cycle phases:
Before-Use Phase Emissions (Stage 1): Extraction of raw materials, agriculture or forestry, manufacturing of building products and equipment and construction.
Use-Phase Emissions (Stage 3): Operations, maintenance and retrofits of buildings during the useful service life of the building.
After-Use Phase Emissions (Stage 3): Demolition, re-use and recycling of material components or energy content, and waste processing.
13 http://www.unep.org/sbci/pdfs/UNEPSBCICarbonMetric.pdf
Energy Intensity = kWh/m2/year and kWh/o/year (if occupancy data is available)
Carbon Intensity = kgCO2e/m2/year and kgCO2e/o/year (if occupancy data is available)
P a g e 10 | 16
All the three phases involve transportation of goods, services and people.
The Common Carbon Metric established by UNEP-SBCI only considers emissions from operational energy in Stage 2, since this is the source of the highest emission during the life cycle of buildings and also data is easily available, measurable, reportable and verifiable. UNEP-SBCI ensures that the Common Carbon Metric uses a modular approach that allows changes in future to include greater scope across life cycle stages.
Further, UNEP-SBCI establishes the following scope of emissions for buildings. The Common Carbon metric takes into consideration only Scope 1 and Scope 2 Emissions (operational energy).
Scope 1: Direct, on-building site or on-building-stocks, GHG Emissions
Stationary combustion emissions Process emissions Fugitive emissions
Scope 2: Indirect on-building-site GHG Emissions
Purchased energy emissions
Scope 3: Other Indirect GHG Emissions
Upstream and Downstream emissions related to Before-use phase of the buildings Transport emissions related to all stages of the building life cycle Re-use, Recycling, Thermal recycling and Waste disposal processes emissions related to After-
Use phase of the buildings.
UNEP-SBCI also provides emission data sources to be used for purchased electricity, purchased chilled water/steam/heat, power generation, refrigerants, refrigeration and air-conditioning equipment.
Waste Footprint
• Waste Framework Directive 2008/98/EC14; European Commission
The Waste Framework Directive establishes basic principles, concepts and definitions related to waste management emphasizing minimal impact to environment and human health. The Waste Framework Directive introduces the concept of holistic life cycle thinking into waste policies thereby incorporating it in the broader aspects of sustainability and making it compatible with other environmental initiatives. The Directive also introduces concepts like "polluter pays principle" and the "extended producer responsibility” and updates its concept on waste hierarchy. The Directive tries to establish a streamline process to return recoverable waste as a resource into the production system. Further, the Directive provides guidelines for waste to energy recovery process.
14 http://ec.europa.eu/environment/waste/framework/ http://ec.europa.eu/environment/waste/framework/pdf/guidance_doc.pdf

P a g e 11 | 16
4.3. BUILDING RATING SYSTEMS AND CARBON FOOTPRINT
There is no rating system assessing and certifying carbon footprint of buildings per se, however major aspects of carbon footprint has been incorporated widely in prevalent multi-attribute rating systems such as LEED from U.S. Green Building Council (USGBC), Living Building Challenge from International Living Future Institute (ILFI) U.S., Green Globes from Green Building Initiative (GBI), BREAM from Building Research Establishment (BRE) U.K., Green Star form Green Building Council Australia (GBCA), Passive House Institute U.S. (PHIUS) – to name a few. The aspects of reducing operational and embodied energy of products, increasing renewable energy generation and green power, and reducing fugitive emissions from refrigerants has been incorporated in the rating systems.
In the present day scenario, there are many rating systems in the global market and the list keeps increasing day after day. Here is a list of rating systems from the above mentioned organizations.
RATING SYSTEMS
USGBC15
LEED for Building Design and Construction (LEED BD+C) LEED for Interior Design and Construction (LEED ID+C) LEED for Building Operations and Maintenance (LEED O+M) LEED for Neighborhood Development (LEED ND) LEED for Homes Design and Construction
USGBC partner frameworks
WELL Building Standard16 – for human health and well-being Performance Excellence in Electricity Renewal (PEER)17 – for power systems Sustainable Sites Initiative (SITES)18 – for sustainable landscapes Global Real Estate Sustainability Benchmark (GRESB)19 – for real assets Excellence in Design for Greater Efficiencies (EDGE)20 – for energy and water Parksmart21 – for parking garages Zero Waste Facility22 - for zero waste business
The International Living Future Institute (ILFI)23
Living Building Challenge (LBC)
Net Zero Energy Buildings (NZEB)
15 http://www.usgbc.org/ 16 https://www.wellcertified.com/ 17 http://peer.gbci.org/ 18 http://www.sustainablesites.org/ 19 https://gresb.com/ 20 https://www.edgebuildings.com/ 21 http://parksmart.gbci.org/ 22 http://www.gbci.org/gbci-administer-zero-waste-certification-and-credential 23 https://living-future.org/
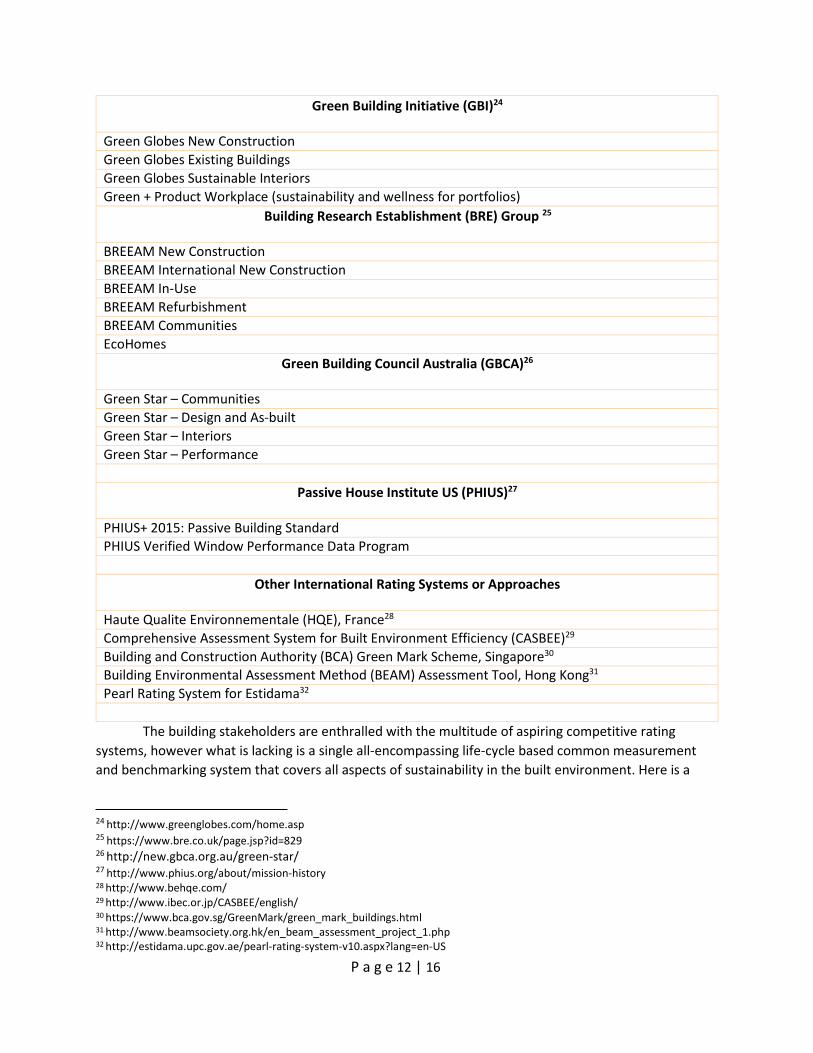
P a g e 12 | 16
Green Building Initiative (GBI)24
Green Globes New Construction Green Globes Existing Buildings Green Globes Sustainable Interiors Green + Product Workplace (sustainability and wellness for portfolios)
Building Research Establishment (BRE) Group 25
BREEAM New Construction BREEAM International New Construction BREEAM In-Use BREEAM Refurbishment BREEAM Communities EcoHomes
Green Building Council Australia (GBCA)26
Green Star – Communities Green Star – Design and As-built Green Star – Interiors Green Star – Performance
Passive House Institute US (PHIUS)27
PHIUS+ 2015: Passive Building Standard PHIUS Verified Window Performance Data Program
Other International Rating Systems or Approaches
Haute Qualite Environnementale (HQE), France28 Comprehensive Assessment System for Built Environment Efficiency (CASBEE)29 Building and Construction Authority (BCA) Green Mark Scheme, Singapore30 Building Environmental Assessment Method (BEAM) Assessment Tool, Hong Kong31 Pearl Rating System for Estidama32
The building stakeholders are enthralled with the multitude of aspiring competitive rating
systems, however what is lacking is a single all-encompassing life-cycle based common measurement and benchmarking system that covers all aspects of sustainability in the built environment. Here is a
24 http://www.greenglobes.com/home.asp 25 https://www.bre.co.uk/page.jsp?id=829 26 http://new.gbca.org.au/green-star/ 27 http://www.phius.org/about/mission-history 28 http://www.behqe.com/ 29 http://www.ibec.or.jp/CASBEE/english/ 30 https://www.bca.gov.sg/GreenMark/green_mark_buildings.html 31 http://www.beamsociety.org.hk/en_beam_assessment_project_1.php 32 http://estidama.upc.gov.ae/pearl-rating-system-v10.aspx?lang=en-US

P a g e 13 | 16
quick analysis of the line items that relate to carbon footprint in one of the leading rating systems in the world - LEED.
LEED v4 BD+C Rating System33
Stage Assessment Environmental Standards Points
Product Stage (Cradle-to- Grave)
Building Life Cycle Impact Reduction
Historic Building Reuse (or)
5
Renovation of Abandoned or Blighted Building (or)
5
Building and Material Reuse (or)
2-4
Whole-Building Life-Cycle Assessment (structure and enclosure)
Data-sets compliant with ISO 14044
2
Building Product Disclosure and Optimization - Environmental Product Declaration
Environmental Product Declaration (for 20 different permanently installed products from at least five different manufacturers)
1
(a) Product-specific declaration (or)
ISO 14044 and have at least a cradle to gate scope
(b) Environmental Product Declarations (or)
ISO 14025, 14040, 14044, and EN 15804 or ISO 21930 and have at least a cradle to gate scope
Multi-attribute Optimization (for 50% by cost of permanently installed products)
1
(a) Third party certified products (or)
(b) USGBC approved program
Construction and Demolition Stage
Construction and Demolition Waste Management Planning
Diversion (or)
Reduction of Total Waste Material
For projects that cannot meet credit requirements using recycle and reuse methods, waste-to-energy systems considered if compliant with the following frameworks: - European Commission Waste Framework Directive 2008/98/EC and Waste Incineration Directive 2000/76/EC
Mandatory and additional 1-2 points
33 See rating system for additional details http://www.usgbc.org/sites/default/files/LEED%20v4%20BDC_01.27.17_current.pdf

P a g e 14 | 16
-Waste to energy facilities meet CEN EN 303 Standards
In-use Stage Energy Performance
Minimum Energy Performance
ANSI/ASHRAE/IESNA Standard 90.1–2010
Mandatory
Optimize Energy Performance
1 - 20
Building Level Energy Metering
Mandatory
Advanced Energy Metering
1
Demand Response 1 - 2 Refrigerant
Management Fundamental Refrigerant Management (No CFC for new HVAC&R and phase- out for re-using existing HVAC&R)
Mandatory
Enhanced Refrigerant Management
Montreal Protocol 1
Water Use Water Use Reduction EPA’s WaterSense EnergyStar
Mandatory
Other water use reduction credits including Water Metering
4 - 11
Renewable Energy Production
Renewable energy up to 10% - 15% of the energy use
1 - 3
Green Power and Carbon Offsets
Green power, carbon offsets, or renewable energy certificates (RECs) for 5 years – 50 or 100% of the project’s energy use.
-Green-e Energy certified or the equivalent -Greenhouse Gas Protocol
1 - 2
From the above analysis, it is evident that there is no measurement system for sustainability or whole life carbon footprint of buildings. While the sustainability rating systems add a remarkable value as market drivers, repositories of data and knowledge, and certifying experts, they still have not harnessed the tremendous opportunity to lead and establish a holistic life-cycle based sustainability measurement system in the field of building construction and management. Since each rating system has its own requirements, it is difficult to compare the performance of the building from one rating system to another, adding more complexity to benchmarking in the global environment.
There are many opportunities to leverage the data collected as part of the agreement with the rating system such as LEED. However, their tremendous growth in their own accord, market position as sustainability leaders, and compulsion to look at sustainability as a point based system stands in their
P a g e 15 | 16
way to becoming a systems based measurement entity, thereby limiting the opportunity of buildings to level play in the global market.
There is a clear irrefutable benefit of the rating systems as an amalgamation of experiential tacit and explicit knowledge expertise evolved over the past couple of decades, with a strong intention to reduce or avoid or offset impact, yet it is missing the mainstays of life cycle system thinking and measurement science, thereby depriving it a holistic status.
4.4. NEED FOR A GLOBAL ENVIRONMENTAL STANDARD FOR BUILDINGS
The International Standards are immaculate top-down methodical and qualitative in nature, however it is not in the scope of the Standards to provide substantive subject matter knowledge of the building construction and management field itself from a bottom-up perspective.
The rating systems have a strong grip of the bottom-up perspective and expertise in the field of built environment. However, the market is flooded with multitudes of rating systems with no clear underlying methodical and qualitative leadership. Absent a life-cycle based holistic systems thinking and measurement science, the value of the rating systems will diminish in the long-term.
A paradigm shift from piecemeal systems to holistic streamlined systems with global metrics is the need of the hour, and who are better equipped to lead the show of bringing together the visionary fragments – it is none other than standard setting organizations along with building rating system organizations in an innovative era of establishing integrative systems thinking, measurement science and knowledge repository to reduce environmental, societal and economic impacts. There are many efforts by the different entities to working together to bring this arduous task to fruition.
In this regard, the European Committee for Standardization CEN/TC 35034 has raised the bar by establishing a unifying framework for sustainability assessment of buildings – encompassing the three aspects of sustainability, providing detailed rules and methodologies for environmental product declarations, and establishing calculation methodologies for the environmental, social and economic performance of buildings – all this holistically interweaved based on life cycle thinking. All aspects of sustainability covered under one suite of standards with the ISO frameworks as the foundation, which is impressive and a head start in the right direction. If the tacit and explicit knowledgebase is integrated within the framework, then it becomes complete in major aspects.
The following is the suite of integrated building performance standards that has been established by the committee.
CEN/TC 350 Standards Framework Level
EN 15643-1:2010 Sustainability of construction works – Sustainability assessment of buildings – Part 1: General Framework
34
https://standards.cen.eu/dyn/www/f?p=204:32:0::::FSP_ORG_ID,FSP_LANG_ID:481830,25&cs=117375B165644AAC954DDC63 B921F43EF

P a g e 16 | 16
EN 15643-2:2011 Sustainability of construction works – Assessment of buildings – Part 2: Framework for the assessment of environmental performance
EN 15643-3:2012 Sustainability of construction works – Assessment of buildings – Part 3: Framework for the assessment of social performance
EN 15643-4:2012 Sustainability of construction works – Assessment of buildings – Part 4: Framework for the assessment of economic performance
Product Level EN 15804:2012+A1:2013 Sustainability of construction works – Environmental product
declarations – Core rules for the product category of construction products
CEN/TR 16970: 2016 Sustainability of construction works – Guidance for the implementation of EN 15804
CEN/TR 15941:2010 Sustainability of construction works – Environmental product declarations – Methodology of selection and use of generic data
EN 15942:2011 Sustainability of construction works – Environmental product declarations – Communication format business to business
Building Level EN 15978:2011 Sustainability of construction works – Assessment of environmental
performance of buildings – Calculation method EN 16309:2014+A1:2014 Sustainability of construction works – Assessment of social performance
of buildings – Calculation method EN 16627:2015 Sustainability of construction works – Assessment of economic
performance of buildings – Calculation methods CEN/TR 17005:2016 Sustainability of construction works – Additional environmental impact
categories and indicators – Background information and possibilities – Evaluation of the possibility of adding environmental impact categories and related indicators and calculation methods for the assessment of the environmental performance of buildings
These standards enable the member European countries move in the direction of a consistent method of measuring and reporting environmental, societal and economic performance data, all evaluated uniformly to a substratum of underlying holistic standards. The German Sustainable Building Certificate (DGNB)35 has been established on the basis of the European Standards. DGNB includes the following six criteria36: environmental quality, economic quality, sociocultural and functional quality, technical quality, process quality and site quality – all this over the entire life cycle of the building. The DGNB assesses the overall sustainability performance of the building not the individual measures, thus establishing a benchmarking process for comparing building performance.
Such a suite of standards along with strategic knowledge repositories and upkeep of standards in the form of rating systems is an immediate and inevitable need for the global community to level play in the arena of responsible partaking of ecosystem goods and services.
35 http://www.dgnb-system.de/en/system/certification_system/ 36 http://www.dgnb-system.de/en/system/criteria/core14/

P a g e 17 | 16
Refund Policy Refunds, Cancellations, and Returns Contact customer service within five business days of your course purchase date for assistance with returns and cancellations. Customers who cancel orders within five business days of the course purchase date will receive a full refund. After five business days all sales are final and no refunds will be provided.