Embed Size (px)
Citation preview

Abstract Carbon forestry mitigation potential estimates at the global-level arelimited by the absence or simplicity of national-level estimates, and similarly na-tional-level estimates are limited by absence of regional-level estimates. The presentstudy aims to estimate the mitigation potential for a large diverse country such asIndia, based on the GTAP global land classification system of agro-ecological zones(AEZs), as well the Indian AEZ system. The study also estimates the implications ofcarbon price incentive (US$50 and $100) on mitigation potential in the short-,medium- and long-term, since afforestation and reforestation (A & R) is constrainedby lack of investment and financial incentives. The mitigation potential for short andlong rotation plantations and natural regeneration was estimated using the GCO-MAP global forest model for two land area scenarios. One scenario included onlywastelands (29 Mha), and the second enhanced area scenario, included wastelandsplus long fallow and marginal croplands (54 Mha). Under the $100 carbon pricecase, significant additional area (3.6 Mha under the wasteland scenario and 6.4 Mhaunder the enhanced area scenario) and carbon mitigation is gained in the short-term(2025) compared to the baseline when using the GTAP land classification system.The area brought under A & R increases by 85–100% for the $100 carbon pricecompared to $50 carbon price in the short-term, indicating the effectiveness ofhigher carbon price incentives, especially in the short-term.
A comparison of estimates of mitigation potential using GTAP and Indian AEZland classification systems showed that in the short-term, 35% additional C-stockgain is achieved in the $100 carbon price case in the enhanced area scenario of the
N. H. Ravindranath (&) Æ I. K. Murthy Æ R. K. ChaturvediCentre for Sustainable Technologies and Centre for Ecological Sciences, Indian Institute ofScience, Bangalore, Indiae-mail: [email protected]
K. AndraskoU.S. Environmental Protection Agency, Washington DC, USA
J. A. SathayeLawrence Berkeley National Laboratory, Berkeley CA, USA
123
Mitig Adapt Strat Glob Change (2007) 12:1027–1050DOI 10.1007/s11027-006-9063-4
ORI GI N A L P A PE R
Carbon forestry economic mitigation potential in India,by land classification
N. H. Ravindranath Æ I. K. Murthy Æ R. K. ChaturvediK. Andrasko Æ J. A. Sathaye
Published online: 7 December 2006� Springer Science+Business Media B.V. 2006

Indian AEZ system. This difference highlights the role of the land classificationsystem adopted in estimation of aggregate mitigation potential estimates, particu-larly in the short-term. Uncertainty involved in the estimates of national-level mit-igation potential needs to be reduced, by generating reliable estimates of carbonstock gain and losses, and cost and benefit data, for land use sector mitigationoptions at a scale disaggregated enough to be relevant for national mitigationplanning.
Keywords Mitigation potential Æ Carbon price Æ GTAP Æ AEZ Æ India ÆForest mitigation
1 Introduction
The forest and land use sector has received significant attention globally inaddressing the climate change problem. However, as evidenced by the ThirdAssessment Report (TAR) of IPCC, mitigation potential assessment in the land usechange and forest (LUCF) sector has been limited by availability of information atthe global-level, and by the lack of disggregation of mitigation potential at thenational-level (IPCC 2001). This is particularly true for India since very few forestmitigation assessment studies have been published (Ravindranath et al. 2001;Ravindranath and Sathaye 2002), and no national forest-sector study prior to thisone has used an economic model allowing dynamic interaction across land useswithin the sector. Further, most mitigation potential assessments provide onlytechnical potential estimates rather than economic or market or socio-economicpotentials, which are likely to be a fraction of technical potential. The mitigationpotential is assessed at the national-level often using only a few values for biomass orsoil carbon sequestration rates, ignoring the regional variations in carbon seques-tration rates due to diverse soil, rainfall and management practices. Studies such asRavindranath and Somashekar (1995), Ravindranath et al. (2001), and Sathaye et al.(in press) have used single biomass growth or soil carbon accumulation rates forshort- or long-rotation and other mitigation options, even though forestry optionssuch as raising eucalyptus, a short-rotation species, occur in arid zones (<500 mm/annum rainfall) to humid zones (>2000 mm/annum rainfall).
Thus, more regional-level assessments of mitigation potential that can be aggre-gated to the national and ultimately to the global-level are required for policymakers and forest managers. In the emerging carbon market, carbon price is likely tobe a critical determinant of LAND potentially available for additional afforestationand reforestation (A & R) for carbon sequestration. Few studies (outside the U.S.)have estimated the implications of carbon price on mitigation potential at thenational-level. Studies by Sathaye et al. (in press) and Sohngen and Sedjo (in press),for example, have analyzed the sensitivity of global forest sector mitigation potentialto carbon price variation, by mitigation activity and by region.
This study aims at estimating India’s forestry mitigation potential at the regional-level, based on the agro-ecological zone concept, where the implications of carbonprice changes on mitigation potential are assessed. The response of national govern-ments, forest managers, private companies, and village communities is likely to beinfluenced by the price path of carbon prices over time. The study estimates themitigation potential of A & R only, as two major forestry mitigation options in the
1028 Mitig Adapt Strat Glob Change (2007) 12:1027–1050
123

literature (e.g., Brown et al. 2000) and being implemented in climate mitigation pro-grams like the Clean Development Mechanism under the Kyoto Protocol. The studyutilizes estimates of socio-economic potential land availability, since land projected asavailable according to official records or satellite assessments may not be actuallyavailable due to legal or tenurial problems, encroachment, or community requirementsfor degraded forest land for grazing, water storage, or settlement expansion.
The specific objectives addressed in the present study are to
• assess the current rate of A & R under the baseline scenario and the periodrequired to exhaust the potential land available, since India has a large baselinerate of A & R
• estimate the mitigation or carbon sequestration potential under the baseline A & Rscenario
• assess the implication of carbon price variation on land available for mitigationactivities, rate of use of available land, carbon sequestration rates and mitigationpotential at the regional-level aggregated to national-level using two land clas-sification approaches:
GTAP (Global Trade Analysis Project) AEZ land classification system, andIndian AEZ land classification system.
The land categories considered for assessing mitigation potential for A & Rinclude wastelands as reported by NRSA (2005), and long fallow and marginalagricultural land as reported by the Ministry of Agriculture.
Wasteland is defined as ‘‘degraded land which can be brought under vegetativecover with reasonable effort, and which is currently under-utilized and deterioratingfor lack of appropriate water and soil management or on account of natural causes.Wastelands can result from inherent/imposed disabilities such as location, environ-ment, chemical and physical properties of the soil or financial or managerial con-straints’’ (NRSA 2005). Fallow land includes both current fallow (cropped area keptfallow during the current year), and fallow land other than current fallow (tempo-rarily out of cultivation for one-five years).
In the present study, two land availability scenarios are considered for estimatingthe mitigation potential under different carbon price cases. The selection of whichlands are available for mitigation is a key driver of mitigation potential-levels. Thisanalysis limits land availability to wastelands, long fallow, and marginal cropland(assumed to be 10% of cropland), and does not include lands categorized as forestland regardless of their current stocking-level, since felling in Reserve Forest lands isbanned. Further, areas currently under forest are not likely to meet many addi-tionality tests for eligibility for many GHG mitigation programs.
Wasteland (WL) scenario: Wasteland categories suitable for afforestation andreforestation are considered in the assessment. Of the total technical potentialwasteland area available, only the socio-economic potential is considered for miti-gation, based on the field studies as discussed in Sect. 3.3.
Wasteland + Long Fallow + Marginal Cropland (WL + LF + MC) scenario:Under this scenario, in addition to wasteland, long-term fallow and marginal crop-land categories are also included for mitigation assessment. Current fallow land isexcluded from the mitigation assessment, since this land would be cropped in thefollowing year. Out of the total agriculture or cropped area, only 10% of the area isincluded in the mitigation assessment, considering marginal lands not ideally suitable
Mitig Adapt Strat Glob Change (2007) 12:1027–1050 1029
123

for food production and can be profitably brought under tree crops or agroforestry.According to UNEP (1997), 110 Mha in India is degraded (about 57% of susceptibledrylands), due to soil erosion, salinization and removal of nutrient-rich topsoil.
2 Approach, methods and GCOMAP model
The carbon price response of forest sector activities is assessed using a dynamic partialequilibrium model of the global forest sector, GCOMAP (Generalized Comprehen-sive Mitigation Assessment Process) (Sathaye et al. in press). Mitigation is assessed atthe regional-level and aggregated to the national-level based on the GTAP AEZglobal-level and the Indian AEZ national-level agro-ecological zoning approaches, asdescribed in Box 1.
Box 1 Methodological steps in this analysis
Step 1: The spatial disggregation was obtained by overlaying GTAP global and Indian nationalAEZ zone maps on the district map of India. The districts were then allocated toeach of the GTAP or Indian AEZs. Where a district appeared in more thanone GTAP zone or AEZ, the geographic area of the district was allocatedproportionately.
Step 2: Wasteland scenario: Area under different wasteland categories, based on the NRSAreport (2005), was obtained at the district-level.
Step 3: Wasteland + fallow land scenario: Wasteland plus area under long fallow and 10% ofnet sown area (marginal agricultural land) was considered in this scenario. Datawere obtained from the Ministry of Agriculture (Land Use Statistics at a Glance,2001).
Step 4: Wasteland, long-term fallow, and marginal cropland suitable for A & R were identifiedand selected for three mitigation activities appropriate for their biophysical andsocial characteristics—short rotation (SR) forestation, long rotation (LR), andnatural regeneration (NR). Land categories not suitable for A & R activities wereexcluded. For example, the NR option was included only for degraded forest landsunder the control of state forest departments.
Step 5: The total technical potential area suitable for SR, LR and NR options under eachGTAP zone was estimated using district-level wasteland, fallow, and cropland data:Geographic area of India was spatially divided into 12 GTAP zones present in IndiaThe district map of India was overlaid on the GTAP zonesArea under wastelands, fallow land and marginal cropland suitable for A & R wasestimated for each of the GTAP zones using the district-level statistics.
Step 6: Socio-economic potential area for A & R activities was obtained based on estimates ofprevious studies applied nationally.
Step 7: Allocation of socio-economic potential area for SR and LR was made using the areaplanted under different species (both SR and LR) at the national-level. The areaunder NR was allocated only to the suitable wasteland categories in two of thedominant (maximum area) GTAP and Indian AEZs (refer to Sects. 3.4 and 3.5).
Step 8: Biomass and soil carbon stocks and growth rates were obtained from published liter-ature and reports for different GTAP and Indian AEZs, for SR, LR and NRactivities
Step 9: Cost and benefit data were obtained from reports of the Forest Department andMinistry of Environment and Forests as well as field studies, for different mitigationactivities and GTAP zones.
Step 10: GCOMAP model was used to estimate the implications of various carbon price caseson carbon mitigation potential of SR, LR and NR activities.
Step 11: The carbon stock (C-stock) estimates for different periods for the baseline as well asdifferent carbon price cases, and the net additional C-stock changes, were estimatedusing GCOMAP model outputs.
Step 12: The C-stock estimates of GTAP and Indian AEZ approaches were compared to studythe suitability of adopting global zonal land classification approaches for national orsub-national assessments.
1030 Mitig Adapt Strat Glob Change (2007) 12:1027–1050
123
2.1 GTAP AEZ-based land classification
At the global-level, GTAP categorizes land into 18 zones, based on the FAO/IIASAconvention of agro-ecological zoning (FAO/IIASA 1993, and Lee at al. 2005).Among the 18 GTAP zones (Table 1 and Fig. 1a), 6 boreal forest zones do not occurin India and are excluded. The dominant tropical GTAP AEZs are of criticalimportance to India. A critical factor distinguishing the GTAP AEZs is mean annualrainfall, dividing them into arid, semiarid, sub-humid, and humid.
2.2 Indian AEZ-based land classification for regional-level assessment
India is a large country with diverse temperature, rainfall, soil, vegetation type,tenurial and socio-economic conditions. India has adopted the principles of AEZand developed its own methods to classify land. The AEZ categorization is based onthe length of growing period (LGP) concept, derived from climate, soil, andtopography data with a water balance model and knowledge of crop requirements(Sehgal et al. 1992, and FAO/IIASA 1993). LGP refers to the period during the yearwhen both soil moisture and temperature are conducive to plant growth. The AEZapproach has been adopted globally for assessing the growth potential of crops, andcan be extended to growth of forest or plantation biomass (e.g., Lee et al. 2005).India’s geographic area is divided into 20 AEZs based on moisture and temperatureregimes, soil type, land form, etc., described in Table 2 and Fig. 1b.
2.3 Overlay and comparison of Global GTAP and Indian AEZ landclassification systems
When the GTAP and Indian AEZs for India are compared (Fig. 1c), only about 3%of the geographic area has an overlap of 75–100%, followed by 10% of area with anoverlap of 50–75% and 27% with 25–50% overlap. The remaining 60% of thegeographic area had less than 25% overlap. Thus, there is limited overlap betweenthe two approaches of land classification, with fully 97% of the area having less than75% overlap. The carbon mitigation potential is estimated separately for globalGTAP and Indian AEZ classification of lands, since the mitigation potential mayvary across AEZs and the land classification systems.
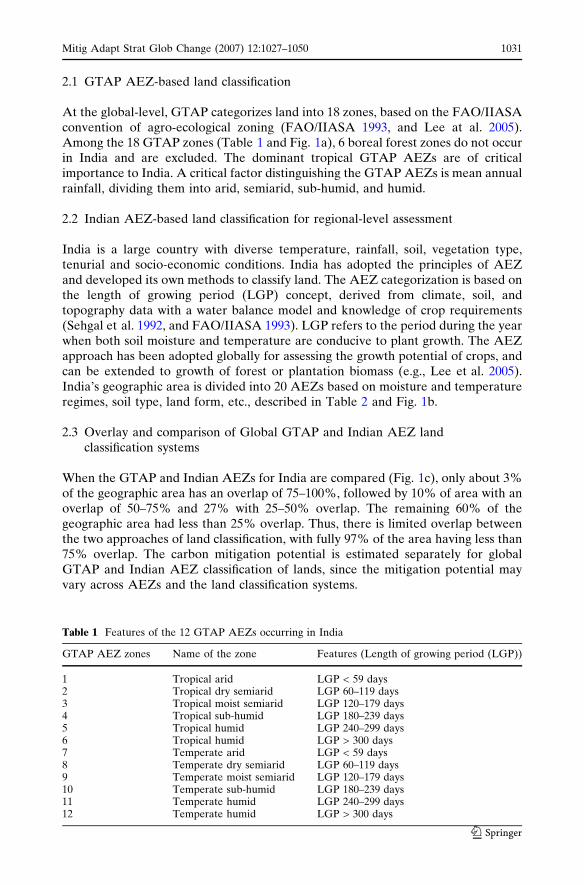
Table 1 Features of the 12 GTAP AEZs occurring in India
GTAP AEZ zones Name of the zone Features (Length of growing period (LGP))
1 Tropical arid LGP < 59 days2 Tropical dry semiarid LGP 60–119 days3 Tropical moist semiarid LGP 120–179 days4 Tropical sub-humid LGP 180–239 days5 Tropical humid LGP 240–299 days6 Tropical humid LGP > 300 days7 Temperate arid LGP < 59 days8 Temperate dry semiarid LGP 60–119 days9 Temperate moist semiarid LGP 120–179 days10 Temperate sub-humid LGP 180–239 days11 Temperate humid LGP 240–299 days12 Temperate humid LGP > 300 days
Mitig Adapt Strat Glob Change (2007) 12:1027–1050 1031
123

2.4 GCOMAP model
The model establishes a baseline scenario of land used for potential mitigationactivities with no price for carbon for 2005–2100. The model then imposes a carbonprice, and simulates the response of forest and wasteland users to these priceincentives, and estimates additional land brought under the mitigation activity abovethe baseline-level. Next the model estimates the net changes in C-stocks, whilemeeting the annual demand for timber and non-timber products.
Fig. 1 GTAP AEZs (a), Indian AEZs (b) and overlay of the two land classification systems (c)
1032 Mitig Adapt Strat Glob Change (2007) 12:1027–1050
123

The GCOMAP model includes three modules (Sathaye et al. in press). First, theland use pattern in the baseline is described using input data on biophysical char-acteristics, including biomass yield, carbon content of biomass and soils, percentshare of products, etc. The first module computes the annual changes in carbon stockover a 100-year period, and tracks both accumulation of carbon and its release due tothe decay of vegetation and products separately on lands planted each year. Thesecond module simultaneously computes the financial viability of the forestry option,using input data on fixed and variable costs, and product prices. The third module of
Table 2 Features of Indian AEZs
ZoneNo.
Indian AEZ zone Features
1 Western Himalaya,cold arid eco-region
Cold arid climate, lowAWC (60–90 days)
2 Western Plain Kutch and partof Kathiawar peninsula
Hot hyper arid climate, very lowAWC (60–90 days)
3 Deccan Plateau, hot arid ecoregion Hot arid climate, low to mediumAWC (60–90 days)
4 Northern Plain and Central Highlandsincluding Aravalis
Hot semi-arid climate, mediumAWC (90–120 days)
5 Central Highlands (Malwa), GujaratPlain and Kathiawar Peninsula
Hot moist semi-arid climate, medium to highAWC (120–150 days)
6 Deccan Plateau, hotsemi-arid ecoregion
Hot moist semi-arid climate, medium to highAWC (150–180 days)
7 Deccan Plateau (Telangana) andEastern Ghats
Hot moist semi-arid climate, mediumAWC (150–180 days)
8 Eastern Ghats and Tamilnadu uplandsand Deccan (Karnataka) Plateau
Hot moist semi-arid climate, lowAWC (120–150 days)
9 Northern Plain, hot sub-humid(dry) ecoregion
Hot dry sub humid climate, medium to highAWC (150–180 days)
10 Central highlands(Malwa and Bundelkhand)
Hot arid climate, low to medium AWC(60–90 days)
11 Eastern Plateau (Chattisgarh) Hot moist climate, medium AWC (150–180 days)12 Eastern Plateau (Chota Nagpur) Hot moist sub humid climate, low to medium
AWC (180–210 days)13 Eastern Plain, hot sub-humid Hot dry to moist sub humid climate, low to
medium AWC (180–120 days)14 Western Himalaya Warm moist to dry sub humid climate, medium
AWC (150–210 days)15 Assam and Bengal Plain Hot moist to dry sub humid climate, medium to
high AWC (210–240 days)16 Eastern Himalaya Warm to hot perhumid climate, low to medium
AWC (>300 days)17 Northeastern Hills (Purvanchal) Warm to hot moist humid to perhumid climate,
medium AWC (270–300+ days)18 Eastern Coastal Plain Hot moist semi-arid climate, high
AWC (120–150 days)19 Western Ghats and Coastal Plains Hot moist sub-humid to humid transitional
climate, low to medium AWC (210–270 days)20 Island region Excluded, since they are small islands separated
by oceans
Note: AWC = Available Water Capacity
Source: Sehgal et al. (1992)
Mitig Adapt Strat Glob Change (2007) 12:1027–1050 1033
123

the model then estimates the changes in land use under a carbon price scenario. Thefinancial rate of return is maintained the same as in the baseline scenario, whichdecides the additional land area to be planted in the mitigation case each year. Thefirst module is then rerun to compute the annual changes in carbon stock broughtabout by the change in mitigation land use. Finally, the model computes the dif-ference in carbon stocks between the mitigation and baseline cases, and reports thecarbon and land area gain for each decade.
2.5 Carbon prices for mitigation assessment
The baseline and two C-price cases are considered: US$50 per tC and $100 per tC.The baseline scenario represents the current rate of forestation in different zones,projected to continue, since in India the rate of afforestation has remained within anarrow range of 1–1.25 million hectares per year over the past 20 years. Relativelyhigher carbon price cases are considered, since the price may increase with theemergence of organized carbon markets in the years to come.
2.6 Carbon pools selected
Four of the five carbon pools identified by the UNFCCC Marrakech Accord areassessed using GCOMAP, including aboveground biomass (AGB), belowgroundbiomass (BGB, through an expansion factor, litter, and soil organic carbon (SOC);dead wood (DW) is not included.
Data for mitigation assessment: Adoption of the GTAP/AEZ land classification-based assessment approach and the GCOMAP model required the following data atthe zone-level:
• Area data: total available land, baseline annual land area planted (short rotation(SR), long rotation (LR) and natural regeneration (NR)) and land area availablefor mitigation activities;
• Biomass and soil carbon data; standing vegetation, mean annual increment ofbiomass, wood density, rotation period, initial soil C-stock and soil carbonaccumulation rate, litter as percent of mean annual increment, decompositionperiod, percent of mean annual increment as timber, harvest categories andpercent of timber, wood waste, fuelwood and harvest residue;
• Financial inputs: establishment, land, recurrent, harvest, transportation andmonitoring costs, price of timber, fuelwood and non-timber products.
An attempt was made to obtain the data required for GCOMAP at the GTAPzone and Indian AEZ-level. Over 150 studies and reports were reviewed and bio-mass and soil carbon data was compiled separately for GTAP and Indian AEZlocations, but availability of data on area, biomass, soil carbon, and financial inputs islimited at the GTAP zone and Indian AEZ-level. The data were input into GCO-MAP under both land classifications, and vary from zone to zone under both sys-tems. As an illustration, the mean annual biomass increment data input into themodel for analysis are given in Appendix 1.
1034 Mitig Adapt Strat Glob Change (2007) 12:1027–1050
123

3 Land available for mitigation
3.1 Land categories for mitigation assessment—wastelands
The important land use systems in India include cropland, fallow land, forestland,grassland and wasteland. The wastelands include degraded grasslands, forests andseveral other categories. Wastelands in India are classified into 28 categories byNational Remote Sensing Agency (NRSA 2005), but 8 have been excluded (e.g.,lands affected by salinity) as not suitable for forestry activities, and some of theremaining categories have been merged. The resulting nine land categories totaling37.9 million ha were assessed, importantly including land with scrub (16.2 millionha), degraded forest-scrub dominated (12.2 million ha), and land without scrub(3.9 million ha).
In India, long-term fallow land has stabilized at around 8–10 Mha over the past30 years (Annual Reports of Ministry of Agriculture), and these lands are consid-ered for A & R mitigation activities. Current fallow land is not included, since it maybe brought under crops during the following year. Further, 10% of the cropland areais also included for SR and LR mitigation assessment, using identical species andsilvicultural practices as those adopted on wastelands.
3.2 GTAP and Indian AEZ land classification for mitigation analysis
The 18 GTAP zones are merged into seven broad GTAP zones for India. Six zonesfalling in the boreal category do not occur in India; zones 5 and 6 (tropical humid),zones 10–16, (temperate sub-humid to humid), and arid zones 1, 7, and 8 (tropicaland temperate) are merged into single zones for this analysis. Zones with very smallland area and identical AEZ features are merged, mainly due to lack of data. Thelarge GTAP zones such as Tropical dry semiarid (Zone 2), Tropical moist semiarid(Zone 3), Tropical sub-humid (Zone 4) and Temperate moist semiarid (Zone 9) areretained (Table 3) as individual zones. The wasteland categories are also mergedbased on suitability of land for forestry mitigation and soil and rainfall features.Different wasteland categories and their area are allocated to GTAP zones byoverlaying a district map of India and using NRSA statistics on wastelands at thedistrict-level. The details of area under technical and socio-economic potential andallocation of land to different forestry mitigation activities in various GTAP zonesare given in Table 3. The Tropical moist semiarid and sub-humid zones (3 and 4)dominate by accounting for 54% of the total potential area. Similarly the 20 IndianAEZs were merged to obtain 10 zones for analysis (Table 3).
3.3 Socio-economic potential land availability for mitigation
Many mitigation assessment studies at the national and global-level estimate thetechnical mitigation potential, assuming that all the potential land within a categoryis available for mitigation activities. These estimates are based on governmentrecords, national statistics, wasteland statistics, and satellite imagery data. However,in reality all such land may not be available due to a number of barriers, such astenurial status, encroachment, and land required for grazing or other use. Currently,no national-level studies for India are available to show what percent of wastelands
Mitig Adapt Strat Glob Change (2007) 12:1027–1050 1035
123
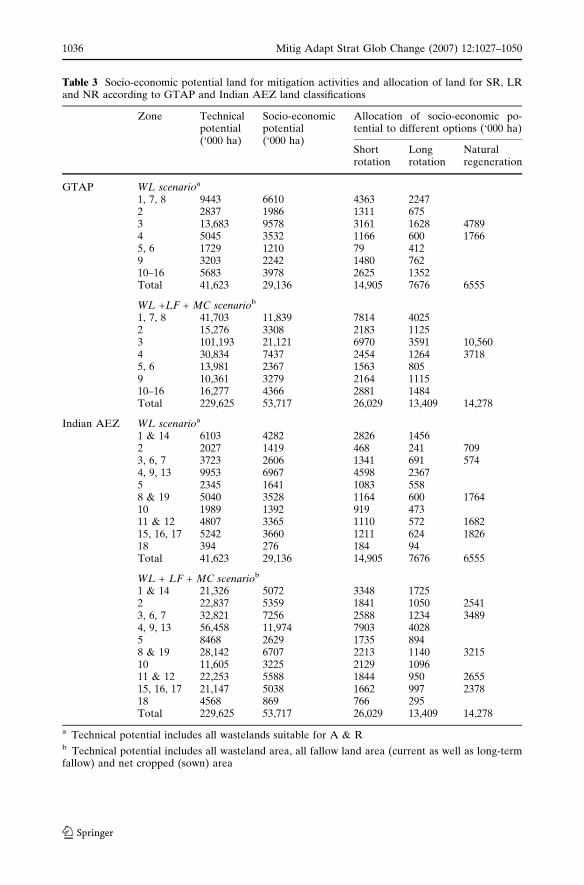
Table 3 Socio-economic potential land for mitigation activities and allocation of land for SR, LRand NR according to GTAP and Indian AEZ land classifications
Zone Technicalpotential(‘000 ha)
Socio-economicpotential(‘000 ha)
Allocation of socio-economic po-tential to different options (‘000 ha)
Shortrotation
Longrotation
Naturalregeneration
GTAP WL scenarioa
1, 7, 8 9443 6610 4363 22472 2837 1986 1311 6753 13,683 9578 3161 1628 47894 5045 3532 1166 600 17665, 6 1729 1210 79 4129 3203 2242 1480 76210–16 5683 3978 2625 1352Total 41,623 29,136 14,905 7676 6555
WL +LF + MC scenariob
1, 7, 8 41,703 11,839 7814 40252 15,276 3308 2183 11253 101,193 21,121 6970 3591 10,5604 30,834 7437 2454 1264 37185, 6 13,981 2367 1563 8059 10,361 3279 2164 111510–16 16,277 4366 2881 1484Total 229,625 53,717 26,029 13,409 14,278
Indian AEZ WL scenarioa
1 & 14 6103 4282 2826 14562 2027 1419 468 241 7093, 6, 7 3723 2606 1341 691 5744, 9, 13 9953 6967 4598 23675 2345 1641 1083 5588 & 19 5040 3528 1164 600 176410 1989 1392 919 47311 & 12 4807 3365 1110 572 168215, 16, 17 5242 3660 1211 624 182618 394 276 184 94Total 41,623 29,136 14,905 7676 6555
WL + LF + MC scenariob
1 & 14 21,326 5072 3348 17252 22,837 5359 1841 1050 25413, 6, 7 32,821 7256 2588 1234 34894, 9, 13 56,458 11,974 7903 40285 8468 2629 1735 8948 & 19 28,142 6707 2213 1140 321510 11,605 3225 2129 109611 & 12 22,253 5588 1844 950 265515, 16, 17 21,147 5038 1662 997 237818 4568 869 766 295Total 229,625 53,717 26,029 13,409 14,278
a Technical potential includes all wastelands suitable for A & Rb Technical potential includes all wasteland area, all fallow land area (current as well as long-termfallow) and net cropped (sown) area
1036 Mitig Adapt Strat Glob Change (2007) 12:1027–1050
123

estimated by NRSA or land survey statistics are actually available. According to twostudies conducted in Karnataka state in South India, nearly two-thirds of the tech-nical potential land is available for mitigation activities (Sudha et al. 2006;Ravindranath et al. 2006). This socio-economic potential land availability was esti-mated through a group discussion with the sample village communities, to estimatethe extent of land they would like to dedicate for A & R, considering competingneeds for grazing, settlement expansion, water bodies, etc. We then applied theKarnataka district findings nationally (the only data available), and assume thatabout 70% of technical potential area is available for forestry mitigation activities, or29.1 Mha out of 41.6 Mha (Table 3). The maximum potential of 41.6 Mha in prin-ciple could be available for A & R activities, if the carbon price incentives were highand policy and institutional barriers were overcome.
For the WL + LF + MC scenario, the socio-economic potential wastelands plusthe area under LF as well as 10% of net sown area or MC is considered for analysis.Of the total technical potential area of 229 Mha, only about 54 Mha or 24% hasbeen considered as available for assessment, to ensure adequate cropland is avail-able to meet India’s future food requirements.
3.4 Activities selected for mitigation assessment
The current assessment is limited to only wastelands under the control of state forestand land revenue departments and village communities, and a fraction of long-termfallow and marginal cropland under the control of individual farmers. Mitigationactivities suitable for such land categories are given in Table 4.
3.5 Allocation of land for different mitigation activities
Allocation of land to different mitigation activities is based on species planted inA & R in the past (FSI 1999) and previous studies (Ravindranath et al. 2001). The
Table 4 Mitigation activities and their features
Activity Dominant species Rotationperiod(years)
End uses
Short rotation(SR)
Eucalyptus spp. 7 Fuelwood, industrial wood,poles—with harvest
Casuarina spp.Acacia spp.Gmelina arborea
Long rotation(LR)
Tectona grandis 40 Timber for construction andfurniture—with harvest
Shorea robustaDalbergia sissooPinus spp.
Naturalregeneration(NR)
Promotion of nativevegetation such as Shorearobusta, Tectona grandis,Terminalia spp, Acacia nilotica etc.
50 Non-timber wood products,biodiversity conservation,with harvest
Mitig Adapt Strat Glob Change (2007) 12:1027–1050 1037
123
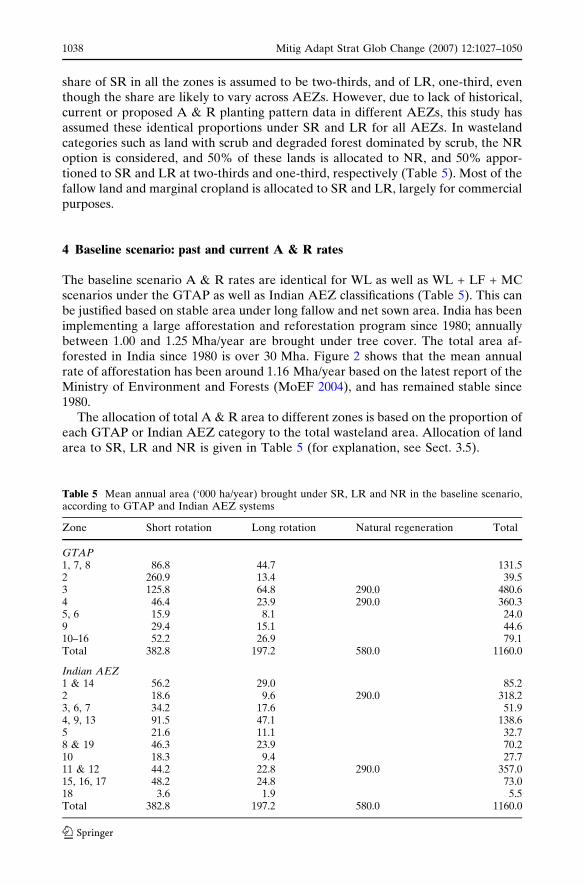
share of SR in all the zones is assumed to be two-thirds, and of LR, one-third, eventhough the share are likely to vary across AEZs. However, due to lack of historical,current or proposed A & R planting pattern data in different AEZs, this study hasassumed these identical proportions under SR and LR for all AEZs. In wastelandcategories such as land with scrub and degraded forest dominated by scrub, the NRoption is considered, and 50% of these lands is allocated to NR, and 50% appor-tioned to SR and LR at two-thirds and one-third, respectively (Table 5). Most of thefallow land and marginal cropland is allocated to SR and LR, largely for commercialpurposes.
4 Baseline scenario: past and current A & R rates
The baseline scenario A & R rates are identical for WL as well as WL + LF + MCscenarios under the GTAP as well as Indian AEZ classifications (Table 5). This canbe justified based on stable area under long fallow and net sown area. India has beenimplementing a large afforestation and reforestation program since 1980; annuallybetween 1.00 and 1.25 Mha/year are brought under tree cover. The total area af-forested in India since 1980 is over 30 Mha. Figure 2 shows that the mean annualrate of afforestation has been around 1.16 Mha/year based on the latest report of theMinistry of Environment and Forests (MoEF 2004), and has remained stable since1980.
The allocation of total A & R area to different zones is based on the proportion ofeach GTAP or Indian AEZ category to the total wasteland area. Allocation of landarea to SR, LR and NR is given in Table 5 (for explanation, see Sect. 3.5).
Table 5 Mean annual area (‘000 ha/year) brought under SR, LR and NR in the baseline scenario,according to GTAP and Indian AEZ systems
Zone Short rotation Long rotation Natural regeneration Total
GTAP1, 7, 8 86.8 44.7 131.52 260.9 13.4 39.53 125.8 64.8 290.0 480.64 46.4 23.9 290.0 360.35, 6 15.9 8.1 24.09 29.4 15.1 44.610–16 52.2 26.9 79.1Total 382.8 197.2 580.0 1160.0
Indian AEZ1 & 14 56.2 29.0 85.22 18.6 9.6 290.0 318.23, 6, 7 34.2 17.6 51.94, 9, 13 91.5 47.1 138.65 21.6 11.1 32.78 & 19 46.3 23.9 70.210 18.3 9.4 27.711 & 12 44.2 22.8 290.0 357.015, 16, 17 48.2 24.8 73.018 3.6 1.9 5.5Total 382.8 197.2 580.0 1160.0
1038 Mitig Adapt Strat Glob Change (2007) 12:1027–1050
123
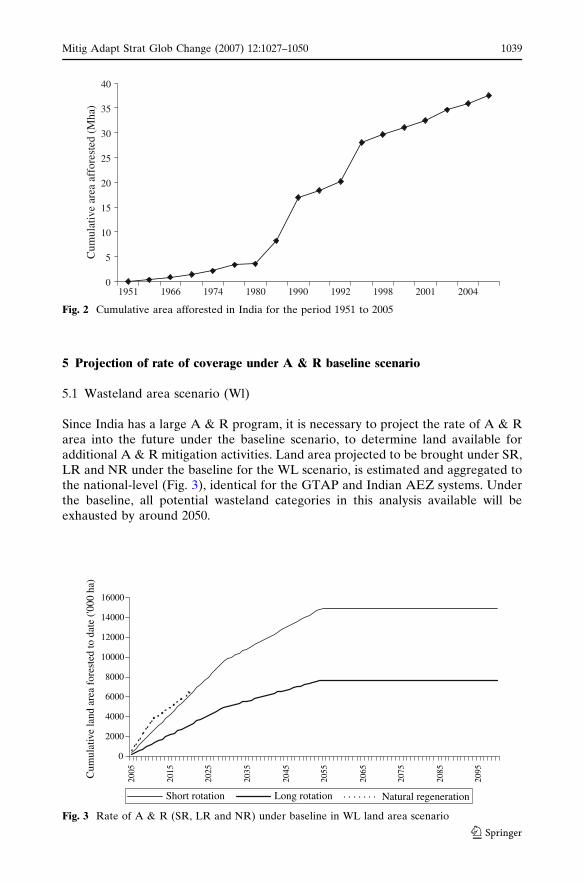
5 Projection of rate of coverage under A & R baseline scenario
5.1 Wasteland area scenario (Wl)
Since India has a large A & R program, it is necessary to project the rate of A & Rarea into the future under the baseline scenario, to determine land available foradditional A & R mitigation activities. Land area projected to be brought under SR,LR and NR under the baseline for the WL scenario, is estimated and aggregated tothe national-level (Fig. 3), identical for the GTAP and Indian AEZ systems. Underthe baseline, all potential wasteland categories in this analysis available will beexhausted by around 2050.
0
5
10
15
20
25
30
35
40
1951 1966 1974 1980 1990 1992 1998 2001 2004
Cum
ulat
ive
area
aff
ores
ted
(Mha
)
Fig. 2 Cumulative area afforested in India for the period 1951 to 2005
0
2000
4000
6000
8000
10000
12000
14000
16000
2005
2015
2025
2035
2045
2055
2065
2075
2085
2095Cum
ulat
ive
land
are
a fo
rest
ed to
dat
e ('0
00 h
a)
Short rotation Long rotation Natural regeneration
Fig. 3 Rate of A & R (SR, LR and NR) under baseline in WL land area scenario
Mitig Adapt Strat Glob Change (2007) 12:1027–1050 1039
123

5.2 Enhanced land area scenario (WL + LF + MC)
Under the baseline, when long fallow and marginal cropland is considered inaddition to wasteland (WL + LF + MC scenario), land will still be available for A &R under SR even after 100 years (Fig. 4). Under LR, all area available for A & R isexhausted by 2097. All land dedicated for NR will be afforested by 2041. Figure 4 isidentical for GTAP as well as Indian AEZ land classification systems.
Two main implications emerge from Figs. 3 and 4. One option to exploit theadditional mitigation potential of A & R under both WL and WL + LF + MCscenarios is to significantly enhance the rate of A & R under the mitigation sce-narios, to derive carbon benefits early for mitigation of climate change. Anotherimplication is that different land categories have very different baseline rates of landuse, due to driver variables and trends already in effect. GHG mitigation programsand the market thus need to identify which land categories can be brought morequickly or in greater area into which mitigation options and concentrate their effortsto reduce barriers and increase incentives there. This approach may help maximizemitigation potential in the near- and mid-term.
6 Rate of A & R for different carbon price cases under GTAP and Indian AEZsystems
The rate of land brought under A & R in India in the baseline scenario and theperiod when all potential land is exhausted is largely determined by two key bar-riers—government land use and economic policies, and investment capital avail-ability (Ravindranath and Somashekar 1995; Ravindranath et al. 2001). Further,some A & R options have a low Internal Rate of Return (Ravindranath et al. 2001).In India, A & R programs are promoted more for their social (such as meeting
0
5000
10000
15000
20000
25000
30000
2005
2015
2025
2035
2045
2055
2065
2075
2085
2095C
umul
ativ
e la
nd a
rea
fore
sted
to d
ate
('000
ha)
Short rotation Long rotation Natural regeneration
Fig. 4 Rate of A & R (SR, LR and NR) under baseline in WL + LF + MC land area scenario
1040 Mitig Adapt Strat Glob Change (2007) 12:1027–1050
123

fuelwood requirement) and environmental (forest conservation) benefits.Enhancement of the rate of A & R would require financial incentives, which carbonprices may offer.
6.1 Incremental area brought under A & R in the US$50 and $100 carbon pricecases in the short-term
6.1.1 GTAP land classification
Table 6 illustrates that when only wastelands are considered (WL scenario), the annualadditional area brought under $50 and $100 carbon price cases in the short-term year2025 (after 20 years) is 98,210 ha/year and 183,120 ha/year, respectively, over thebaseline rate of A & R. But when fallow lands and marginal croplands are consideredalong with wastelands (WL + LF + MC scenario), 161,194 ha/year and 322,755 ha/year of additional area will be brought under A & R annually in the $50 and $100carbon price cases, respectively, during the short-term—a significant increase.
6.1.2 Indian AEZ land classification
A similar trend is observed under the Indian AEZ land classification systems. Thecumulative area is higher than the baseline by 11 and 19% for the WL scenario forthe $50 and $100 carbon price cases, respectively, and the values are 18 and 27%higher than the baseline for WL + LF + MC scenario.
Thus in the short-term, carbon price incentive of US$50 or $100 brings largeadditional area under A & R compared to the baseline. The higher carbon price of$100 brings 52–100% additional area under A & R over the lower carbon price of$50 in the short-term under the two land use systems and area scenarios.
6.2 Comparison of A & R rates under WL and WL+LF+MC land area scenariosfor US$50 and $100 carbon price
6.2.1 GTAP land classification
Figure 5 demonstrates that under the $100 carbon price case, the area under SR will beexhausted 2 years ahead and will peak by 2051. Similarly, there is only a 3-year dif-ference between $50 and $100 carbon price cases for LR and there is a 4-year difference
Table 6 Cumulative additional area (‘000 ha) brought under A & R during 2005–2025, in thebaseline scenario, under two carbon price cases for GTAP and Indian AEZ land classifications
Land classification Scenario Cumulative additional area brought under A &R, 2005–25 (‘000 ha)
US$50 Carbon price US$100 Carbon price
GTAP WL scenario 1964 3662WL + LF + MC scenario 3224 6455
Indian AEZ WL scenario 2048 3475WL + LF + MC scenario 4354 6626
Mitig Adapt Strat Glob Change (2007) 12:1027–1050 1041
123

for NR between the two carbon price cases. Under the WL+LF+MC land area scenario(Fig. 6), the area under both SR and LR will peak near the end of the analysis around2091, with only 2–3 years difference between the two carbon price cases.
However, when the short-term date of 2025 (20 years out) is considered, addi-tional area brought under SR and LR is around 2.2 and 1.3 Mha, respectively underWL as well as WL + LF + MC land area scenarios with a carbon price of $100; for$50, the values are 1.2 Mha and 0.7 Mha. This indicates that on an average, an
0
5000
10000
15000
20000
25000
30000
2005
2010
2015
2020
2025
2030
2035
2040
2045
2050
2055
2060
2065
2070
2075
2080
2085
2090
2095
2100
Cum
ulat
ive
land
are
a ga
ined
('0
00 h
a)
SR-Mitigation SR-Baseline LR-MitigationLR-Baseline NR-Mitigation NR-Baseline
Fig. 6 Cumulative land area brought under A & R under $100 carbon price case in WL + LF + MCland area scenario under GTAP land classification
0
2000
4000
6000
8000
10000
12000
14000
16000
2005
2010
2015
2020
2025
2030
2035
2040
2045
2050
2055
2060
2065
2070
2075
2080
2085
2090
2095
2100
Cum
ulat
ive
land
are
a ga
ined
('0
00 h
a)
SR-Mitigation SR-Baseline LR-MitigationLR-Baseline NR-Mitigation NR-Baseline
Fig. 5 Cumulative land area brought under A & R under $100 carbon price case in WL scenariounder GTAP land classification
1042 Mitig Adapt Strat Glob Change (2007) 12:1027–1050
123
annual additional area of about 185,000 ha for a carbon price of $100 will be broughtunder A & R over the baseline scenario rates.
6.2.2 Indian AEZ land classification
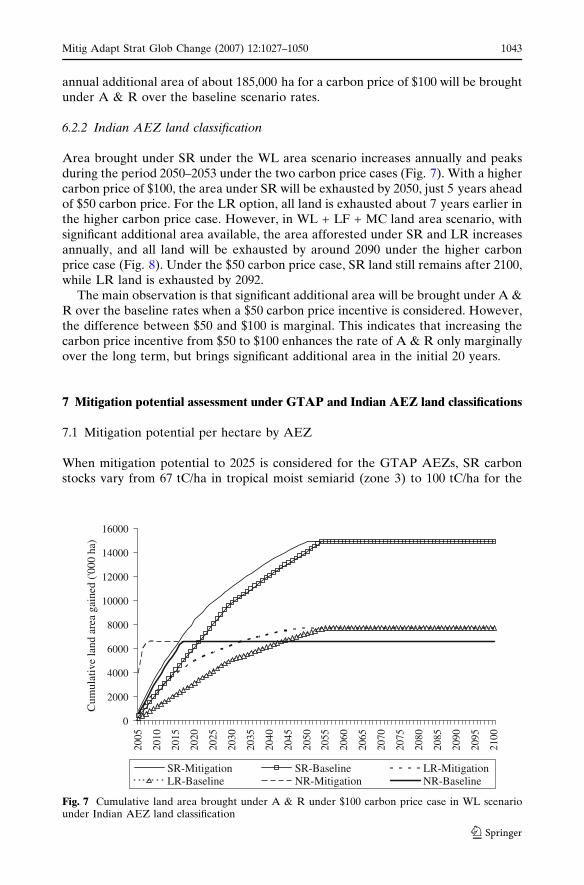
Area brought under SR under the WL area scenario increases annually and peaksduring the period 2050–2053 under the two carbon price cases (Fig. 7). With a highercarbon price of $100, the area under SR will be exhausted by 2050, just 5 years aheadof $50 carbon price. For the LR option, all land is exhausted about 7 years earlier inthe higher carbon price case. However, in WL + LF + MC land area scenario, withsignificant additional area available, the area afforested under SR and LR increasesannually, and all land will be exhausted by around 2090 under the higher carbonprice case (Fig. 8). Under the $50 carbon price case, SR land still remains after 2100,while LR land is exhausted by 2092.
The main observation is that significant additional area will be brought under A &R over the baseline rates when a $50 carbon price incentive is considered. However,the difference between $50 and $100 is marginal. This indicates that increasing thecarbon price incentive from $50 to $100 enhances the rate of A & R only marginallyover the long term, but brings significant additional area in the initial 20 years.
7 Mitigation potential assessment under GTAP and Indian AEZ land classifications
7.1 Mitigation potential per hectare by AEZ
When mitigation potential to 2025 is considered for the GTAP AEZs, SR carbonstocks vary from 67 tC/ha in tropical moist semiarid (zone 3) to 100 tC/ha for the
0
2000
4000
6000
8000
10000
12000
14000
16000
2005
2010
2015
2020
2025
2030
2035
2040
2045
2050
2055
2060
2065
2070
2075
2080
2085
2090
2095
2100
Cum
ulat
ive
land
are
a ga
ined
('0
00 h
a)
SR-Mitigation SR-Baseline LR-MitigationLR-Baseline NR-Mitigation NR-Baseline
Fig. 7 Cumulative land area brought under A & R under $100 carbon price case in WL scenariounder Indian AEZ land classification
Mitig Adapt Strat Glob Change (2007) 12:1027–1050 1043
123
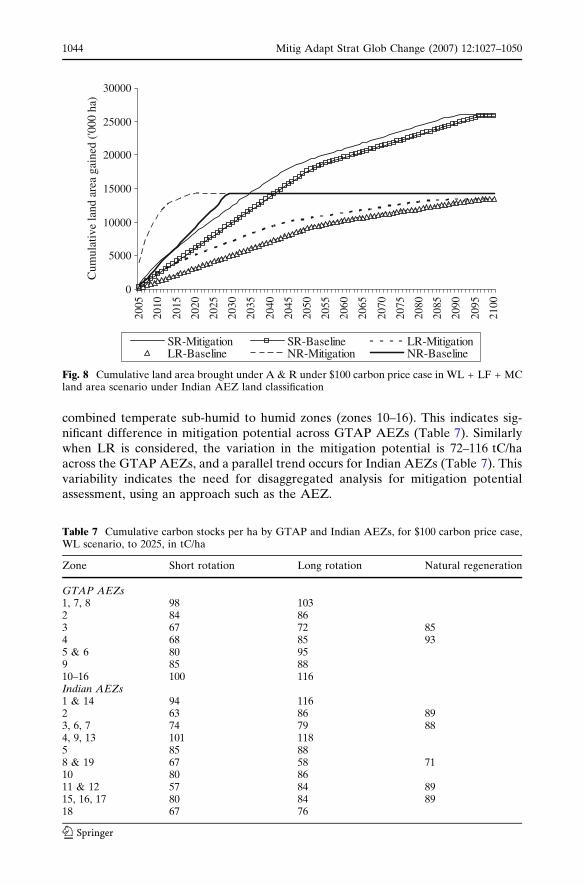
combined temperate sub-humid to humid zones (zones 10–16). This indicates sig-nificant difference in mitigation potential across GTAP AEZs (Table 7). Similarlywhen LR is considered, the variation in the mitigation potential is 72–116 tC/haacross the GTAP AEZs, and a parallel trend occurs for Indian AEZs (Table 7). Thisvariability indicates the need for disaggregated analysis for mitigation potentialassessment, using an approach such as the AEZ.
0
5000
10000
15000
20000
25000
30000
2005
2010
2015
2020
2025
2030
2035
2040
2045
2050
2055
2060
2065
2070
2075
2080
2085
2090
2095
2100
Cum
ulat
ive
land
are
a ga
ined
('0
00 h
a)
SR-Mitigation SR-Baseline LR-MitigationLR-Baseline NR-Mitigation NR-Baseline
Fig. 8 Cumulative land area brought under A & R under $100 carbon price case in WL + LF + MCland area scenario under Indian AEZ land classification
Table 7 Cumulative carbon stocks per ha by GTAP and Indian AEZs, for $100 carbon price case,WL scenario, to 2025, in tC/ha
Zone Short rotation Long rotation Natural regeneration
GTAP AEZs1, 7, 8 98 1032 84 863 67 72 854 68 85 935 & 6 80 959 85 8810–16 100 116Indian AEZs1 & 14 94 1162 63 86 893, 6, 7 74 79 884, 9, 13 101 1185 85 888 & 19 67 58 7110 80 8611 & 12 57 84 8915, 16, 17 80 84 8918 67 76
1044 Mitig Adapt Strat Glob Change (2007) 12:1027–1050
123
7.2 Implications of carbon price on mitigation potential
Carbon stock gain under $50 and $100 carbon prices, aggregated for all the threemitigation options for the WL and WL + LF + MC land area scenarios, in the short-term (2005–2025), is given in Table 8. The mitigation potential under the GTAPland classification WL scenario increased by about 84% as the carbon price doubledfrom $50 to $100. This trend holds for the Indian AEZ WL and enhanced areascenarios. Thus a higher carbon price will bring significant additional area (Table 8)as well as increase the mitigation potential (68–90%) in the short-term.
It is interesting to note that in the enhanced area scenario at $100 carbon price,even though the area increased marginally by around 3% in the Indian AEZscompared to the GTAP AEZs (Table 6), the carbon stock increased by 35% duringthe same period. This could be due to higher-levels of disaggregation in the IndianAEZ system with differential biomass and soil carbon increment rates (discussed indetail in Sect. 8).
7.3 Carbon stock gain under WL and WL+LF+MC Land area scenarios
The total socio-economic potential area available for A & R is 29 Mha under WLscenario and 54 Mha (85% higher) under the WL + LF + MC scenario.
7.3.1 GTAP
When the two land area scenarios are considered, the aggregate additional carbonstock gained in the baseline by adopting the WL + LF + MC enhanced area scenariois 960 MtC for the short term to 2025, and 2930 MtC in the long term to 2100, in theWL scenario. Under the $100 carbon price case, the values are 1045 MtC and1492 MtC, respectively, for the same time periods (Table 9). For an 85% increase inarea under the WL + LF + MC land area scenario, the additional carbon stockgained in the short term is 54% higher compared to the WL scenario, and 81%higher in the long term.
7.3.2 Indian AEZ
The additional carbon stock gained in the enhanced land area scenario, using theIndian AEZ system, cumulative to 2025, is 1181 MtC. By 2100, it reaches 3218 MtCunder the $100 carbon price mitigation scenario (Table 9).
Table 8 Incremental mitigation potential under $50 and $100 carbon price cases in the short-termperiod to 2025, under two land classification systems
Land classification system Scenario Incremental mitigation potential for theperiod 2005–2025 (MtC)
US$50 Carbon price US$100 Carbon price
GTAP WL scenario 129 238WL + LF + MC scenario 170 323
Indian AEZ WL scenario 139 234WL + LF + MC scenario 244 435
Mitig Adapt Strat Glob Change (2007) 12:1027–1050 1045
123
Thus, India could gain significant additional mitigation potential of 257 MtC(under GTAP) to 285 MtC (under Indian AEZ), if fallow land and marginal crop-land are brought under A & R in addition to wastelands under a $100 carbon pricescenario.
7.4 Comparison of national aggregate mitigation potential with disaggregatedAEZ estimates
There are very few studies conducted at the national-level in India estimating themitigation potential. Further, the area, growth rates of biomass and soil carbonconsidered differ among the studies. However, a preliminary comparison betweenthis study and Ravindranath et al. 2001, with comparable area and for a period of30 years, shows the mitigation potential under the disaggregated GTAP AEZ is onlyabout half of the estimate of Ravindranath et al. 2001 (Table 10). National mitiga-tion potential estimates, therefore, could vary significantly depending on the-level ofaggregation, area eligible, and growth rates considered.
8 Comparison of mitigation potential under GTAP and Indian AEZ landclassification systems
One of the objectives of this analysis is to compare the mitigation potential obtainedusing the global GTAP and Indian AEZ land classification systems. The total landarea under the two systems is identical, and the allocation pattern of land to thedifferent mitigation options is similar. However, the spatial overlap between theGTAP zones and the Indian AEZs is low (Sect. 2). Further, the aboveground
Table 9 Comparison of cumulative carbon stocks (MtC) gained between WL and WL + LF + MCland area scenarios under the baseline and $100 carbon price mitigation case for GTAP and IndianAEZ systems
2005 2025 2045 2065 2085 2100
GTAP—WL scenarioBaseline 1134 1686 2531 3170 3663 3881Mitigation 1112 1924 2813 3301 3777 3950Increment –21 238 282 131 114 69
GTAP—WL + LF + MC scenarioBaseline 2022 2645 3837 5063 6129 6811Mitigation 2035 2969 4305 5469 6519 7137Increment 13 323 469 406 391 326
Indian AEZ—WL scenarioBaseline 1122 1652 2474 3097 3570 3763Mitigation 1110 1886 2757 3230 3685 3821Increment –12 234 283 133 116 58
Indian AEZ—WL + LF + MC scenarioBaseline 2064 2631 3832 4972 6045 6696Mitigation 2058 3067 4413 5464 6530 7039Increment –6 435 582 492 485 343
1046 Mitig Adapt Strat Glob Change (2007) 12:1027–1050
123

biomass growth rates and soil carbon uptake rates input into the individual zones ofthe two systems are different (Appendix 1).
Wasteland (WL) scenario: The carbon stocks under the baseline and the $100carbon price case for the 100-year period are given in Table 9. Baseline carbonstocks under the GTAP and Indian AEZ systems follow an increasing trend from2005 to 2100, with stocks slightly higher in the GTAP system. Total carbon stocksunder the GTAP baseline scenario over the 100-year period are marginally higherthan in the Indian AEZ baseline.
WL + LF + MC land area scenario: Carbon stocks for the GTAP and IndianAEZ systems for the enhanced area scenario (85% higher than WL scenario) followa reverse trend compared to the WL scenario, with Indian AEZ stocks higher thanGTAP stocks (Table 9) during most periods. For example, the carbon stock underthe Indian AEZ system is 35% higher than under the GTAP land classification for2025 in the $100 carbon price case.
This difference between the carbon stock gain estimates under the two landclassification systems can be explained by
• The GTAP system (Table 1) is characterized by higher-levels of aggregation,e.g., GTAP Zone 3 (tropical moist semiarid) accounts for nearly 33% of thegeographic area of India;
• GTAP Zone 3 is comprised of parts of 14 Indian AEZs, (Table 2) ranging fromhot arid to moist sub-humid zones;
• The mean annual biomass increment value for GTAP Zone 3 is 4.4 t/ha/year forlong rotation option, whereas this value varies for the Indian AEZs falling inGTAP Zone 3, e.g., it is 7.37 t/ha/year for Zone 14 (Western Himalayas), 6.6 t/ha/year for Zone 4 (northern plains and central highlands) and 5.07 t/ha/year forZone 10 (central highlands). Similarly, the values for other Indian AEZs vary,and the trend is similar for SR and NR options;
Table 10 Comparison of estimates of Indian forestry mitigation potential across aggregate nationaland disaggregated AEZ-based estimates, using different methods (cumulative MtC by year given)
Mitigation options This study:$100/tC,30-yearperiod,for two landclassificationsystems,WL scenario2005–2035
This study:$100/tC,30-yearperiod,for two landclassificationsystems,WL + LF + -MC scenario2005–2035
Sathya et al.(in press):$100,2000–2030,GCOMAPNationalmodel
Ravindranathet al. (2001):30-yearperiod
Sohngenand Sedjo,in press):$100/tC,30-yearperiod,GTM model
GTAPAEZ
IndianAEZ
GTAPAEZ
IndianAEZ
Short rotation 51 34 75 67 348 25 NALong rotation 129 150 95 179 505 75 NANatural
regeneration80 75 254 273 NA 215* NA
Total 260 258 424 520 853 315 210
Note: *Includes forest protection and natural regeneration options
NA = not available or not included in analysis
Mitig Adapt Strat Glob Change (2007) 12:1027–1050 1047
123

• Thus, the mitigation potential estimate for the Indian AEZ land classificationsystem is higher, compared to GTAP.
9 Conclusions
India has been implementing one of the world’s largest A & R programs to meet itsbiomass requirement (fuelwood, timber and non-timber products) and for forestconservation purposes. India has also set a goal of covering about one-third of thegeographic area under forests, compared to less than 20% area currently underforests. The investment capital barrier mainly limits the A & R program in India.The present study has explored the potential of carbon price incentive for carbonstocks gained in A & R programs as a strategy to overcome the investment capitalbarrier. This study also has attempted to overcome the limitations of existing studiesestimating mitigation potential using aggregate area and growth rates of soil andbiomass carbon, by conducting a disaggregated analysis using the agro-ecologicalzone approach for spatially disaggregating or classifying the area available formitigation.
The study has adopted GTAP’s global land classification system, as well as theindigenous Indian AEZ system. Results indicate that a financial incentive of aconstant carbon price of US$100/tC over the short-term period of 20 years to 2025generates 3.76 and 6.4 Mha of additional area brought under A & R under thewasteland and enhanced area scenarios, respectively, over the baseline under theGTAP land system. This $100 price also brought significant additional area underA & R compared to $50 price scenario, illustrating that a higher incentive can driveA & R rates, particularly in the short term. A comparison of estimates of mitigationpotential using the GTAP and Indian AEZ systems shows that in the short term, forthe enhanced land area scenario, 35% additional C-stock gain is achieved under the$100 price case. However in the long term, the difference between the global GTAPand Indian AEZ systems is marginal.
These results highlight that mitigation potential estimates can be significantlydifferent depending on the land classification system adopted, particularly whenlarger areas are considered, due to differences in growth rates at the disaggregatedAEZ-level. The Indian AEZ l system has a larger number of zones compared to themore aggregate GTAP. Thus, nationally derived land classification systems with agreater-level of disaggregation need to be considered when estimating aggregateland use mitigation potential.
Additionally, decisions regarding what lands are to be considered available formitigation have a major impact on mitigation potential estimates. In this analysis, theenhanced area scenario showed significantly higher mitigation potential. This anal-ysis included only 10% of agricultural land in India, i.e., those considered marginal.An analysis with land-use competition across forest, crop, pasture, biofuel andcarbon sequestration land uses, which ensures that demand for food is met in thefuture, may yield a higher potential.
These estimates of mitigation potential at the disaggregated AEZ-level usingeither land classification are limited by availability of data on growth and stock ofcarbon in different pools, particularly aboveground biomass and soil carbon, bymitigation option. Some AEZs, even though spread over a large number of districts,
1048 Mitig Adapt Strat Glob Change (2007) 12:1027–1050
123

had only one or two observations, for e.g., for biomass growth rate, resulting in themerging of zones and loss of disaggregation. A larger number of estimates wouldminimize this error. Each AEZ, particularly the larger ones, could be subdivided tohomogeneous sub-zones in the GTAP land classification. The 20 AEZs of the Indianland classification system, for instance, are subdivided into 64 sub-zones.
The uncertainty in the estimates of mitigation potential could be reduced by gen-erating reliable, disaggregated estimates of the carbon stock gain and losses by miti-gation option. Disaggregated data are also needed on land use establishment,maintenance, harvest, and replanting costs and benefits for major mitigation options.More detailed data on the Internal Rate of Return (IRR) of competing land uses thatdrive this analysis would help improve the calculation of economic carbon benefits.However, this study offers a significant advance over previous studies for India, byutilizing a dynamic economic model of the forest sector. It also provides a roadmap forfuture work in support of forestry mitigation analysis and implementation.
Acknowledgements This work was supported by the U.S. Environmental Protection Agency, Of-fice of Atmospheric Programs through the U.S. Department of Energy under Contract No. DE-AC02-05CH11231. Disclaimer: The views and opinions of the authors herein do not necessarily stateor reflect those of the United States Government or the Environmental Protection Agency. Theauthors would also like to thank the Ministry of Environment and Forests for supporting andencouraging the research activities on climate change at the Indian Institute of Science. We alsothank Prity Sagar for her assistance in the analysis.
Appendix 1
Input data – Mean annual biomass increment data for Global GTAP and IndianAEZs
Zones Mean annual increment (t biomass/ha/year)
Short rotation Long rotation
Global GTAP AEZ1, 7, 8 3.9 3.942 3.9 3.943 6.5 4.44 5.94 5.055 + 6 7.13 7.79 4.9 3.9610–16 7.9 7.7
Indian AEZ1 & 14 3.63 7.372 4.56 4.823, 6, 7 3.35 4.074, 9, 13 5.41 6.635 3.38 4.938 & 19 3.38 2.0110 4.01 5.0711 & 12 3.67 5.0215, 16, 17 8.74 5.0918 4.66 5.09
Mitig Adapt Strat Glob Change (2007) 12:1027–1050 1049
123
References
Brown S, Omar M, Jayant S (2000) Project based activities. In: Land use, land use change andforestry, IPCC Special Report, Cambridge University Press, Cambridge, UK
Food and Agriculture Organization of The United Nations/International Institute for AppliedSystems Analysis (FAO/IIASA) (1993) Agro-ecological assessments for national planning: theexamples of Kenya. FAO Soils Bull 67
FSI (1999) State of forest report 1999. Ministry of Environment and Forests, Government of India,Dehra Dun
IPCC (2001) Climate change 2001: mitigation, contribution of working group III to the thirdassessment report of the intergovernmental panel on climate change. Cambridge UniversityPress, Cambridge, USA
Land Use Statistics at a Glance (2001) http://agricoop.nic.in/statistics2003/chap14.htmLee H-L, Hertel TW et al (2005) Towards and integrated land use data base for assessing the
potential for greenhouse gas mitigation. GTAP Technical Paper No. 25, Center for Global TradeAnalysis, Purdue University http://www.gtap.agecon.purdue.edu/resources/res_display.asp?Re-cordID=1900
MoEF (2004) India’s initial national communication to the United Nations Framework Conventionon climate change (UNFCCC). NATCOM, Ministry of Environment and Forests, Governmentof India, New Delhi, http://www.natcomindia.org/
National Remote Sensing Agency NRSA (2005) Wastelands atlas of India, 2005, Government ofIndia, Ministry of Rural Development, Department of Land Resources, New Delhi and NationalRemote Sensing Agency, Dept. of Space, Government of India, Balanagar, India
Ravindranath NH, Murthy IK et al (2006) Methodological issues in forestry mitigation projects: acase study of Kolar district. Mitigation and Adaptation Strategies for Global Change (this issue)
Ravindranath NH, Sathaye J (2002) Climate change and developing countries. Kluwer AcademicPublishers, Netherlands
Ravindranath NH, Somashekhar BS (1995) Potential and economics of forestry options for carbonsequestration in India. Biomass and Bioenergy 8(5):323–336
Ravindranath NH, Sudha P et al (2001) Forestry for sustainable biomass production and carbonsequestration in India. Mitig Adapt Strat Glob Change 6:233–256
Sathaye J, Makundi W, Dale L, Chan P, Andrasko K (2005) GHG mitigation potential, costs andbenefits in global forests: a dynamic partial equilibrium approach. Energy J (in press)
Sehgal JL, Mandal DK et al (1992) Agro-ecological region of India. NBSS & LUP (ICAR) Publi-cation 24, Nagpur
Sohngen B, Sedjo R (2005) Carbon sequestration costs in global forests. Energy J (in press)Sudha P, Shubhashree D et al (2006) Estimating land suitability and development of regional
baseline for a dominant agro-ecological zone of Karnataka, India. Mitig Adapt Strat GlobChange
UNEP (1997) Global environment outlook, United Nations Environment Program
1050 Mitig Adapt Strat Glob Change (2007) 12:1027–1050
123