Embed Size (px)
Citation preview

EUCO2 80/50 project and hands-on experience
from Oslo
Irma Karjalainen
Director
HSY, Helsinki Region Environmental Services Authority
Carbon free future
of European cities

+4
C global warming ?
• World Bank says that consequences are
potentially devastating:
– Inundation of coastal cities
– Increasing risks for food production and
higher malnutrition rates
– Many dry regions becoming dryer,
wet regions wetter
– Unprecedented heat waves in many regions
– Substantially exacerbated water scarcity in
many regions
– Increased intensity of tropical cyclones
http://climatechange.worldbank.org/sites/default/files/Turn_Down_the_heat_Why_a_4_degree_centrigrade_warmer_world_must_be_avoided.pdf

0
10
20
30
40
50
60
70
1990 2000 2010 2020 2030
Gt (C
O2
)
RCP 8.54,0-6,1 °C
RCP 6.02,6-3,7 °C
RCP 4.52,0-3,0 °C
RCP 3.0-PD1,3-1,9 °C
Actualemissions
Global CO2 emissions and new scenarios
-10
0
10
20
30
40
50
60
70
80
90
100
110
2000 2010 2020 2030 2040 2050 2060 2070 2080 2090 2100
Gt (C
O2
)
RCP 8.54,0-6,1 °C
RCP 6.02,6-3,7 °C
RCP 4.52,0-3,0 °C
RCP 3.0-PD1,3-1,9 °C
-10
0
10
20
30
40
50
60
70
80
90
100
110
2000 2010 2020 2030 2040 2050 2060 2070 2080 2090 2100
Gt (C
O2
)
RCP 8.54,0-6,1 °C
RCP 6.02,6-3,7 °C
RCP 4.52,0-3,0 °C
RCP 3.0-PD1,3-1,9 °C
Source: Peters et al. 2012; Le Quéré et al. 2012; CDIAC Data; Global Carbon Project 2012
Current trend leads here…
…but this is where
we want to be!

Irma Karjalainen 24.1.2013
• Objective: 80 %
reduction of urban
greenhouse gas
emissions by 2050
• 15 metropolitan regions
with total population of
48 million >
10 % of the population
of Europe
• Lead partner Hamburg
• METREX
• 2009-2011
EUCO2 80/50 project

EUCO2 80/50 project A two stage project:
1. Regional greenhouse gas
inventories
– First comparative study with a
big number of important
metropolitan areas
– Basis for regional mitigation
activities
2. Scenario workshops
– How to reach -80 %?
– Basis for a consensual
mitigation strategy and political
implementation
Irma Karjalainen 24.1.2013

Stage 1: regional inventories
Irma Karjalainen 24.1.2013
0
5
10
15
20
25
30
tCO
2e p
er
capita
Agriculture
Waste
Transport
Services
Residential
Industry
Industrial Processes
Energy Industry
Fugitive
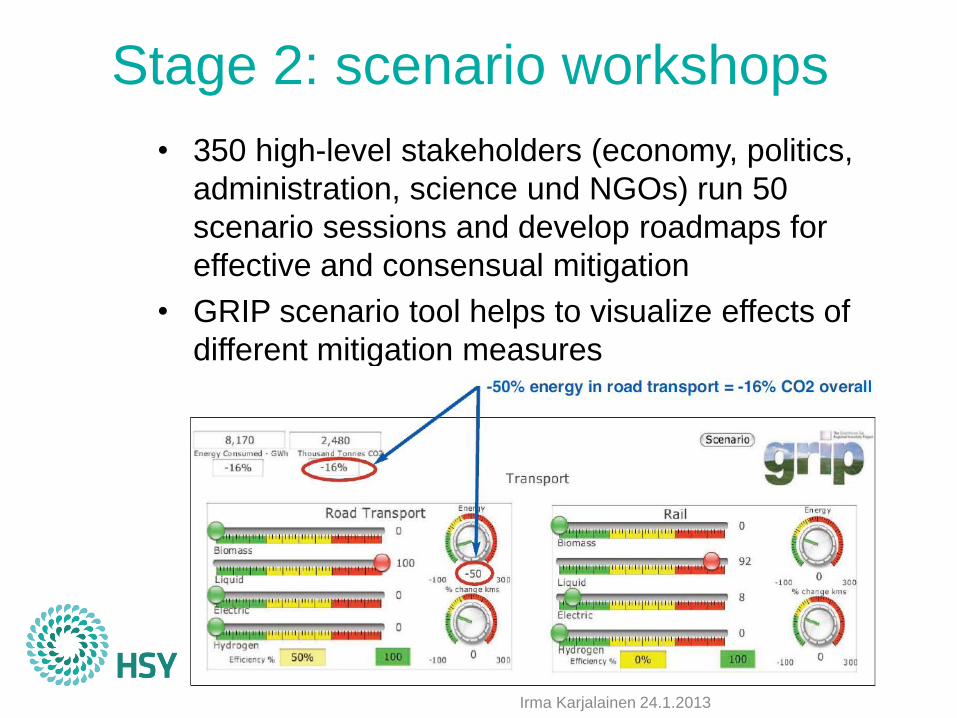
• 350 high-level stakeholders (economy, politics,
administration, science und NGOs) run 50
scenario sessions and develop roadmaps for
effective and consensual mitigation
• GRIP scenario tool helps to visualize effects of
different mitigation measures
Irma Karjalainen 24.1.2013
Stage 2: scenario workshops

Stage 2: key findings 1/3
1. Only 35% of the scenarios reached the target of
an 80% reduction
2. Southern European stakeholders were less
confident in mitigation chances than the rest of
Europe
3. Low Carbon Electricity generation is key to
mitigation
4. 100% de-carbonised grid would on its own
reduce European CO2 emissions by less than
25%
Irma Karjalainen 24.1.2013

Stage 2: key findings 2/3
5. Emissions reductions in the building sector are
key to mitigation
6. Increased industrial efficiency can contribute
substantially to emissions reductions
7. Savings in electrical energy are necessary even
with a de-carbonised grid
8. Road transport is also essential
Irma Karjalainen 24.1.2013

Stage 2: key findings 3/3
• Contribution
of different
sectors to
overall 80 %
reduction goal:
Irma Karjalainen 24.1.2013

• 94 %, 87 % and 77 % reduction scenarios
Results from Helsinki workshops
Sector Principal emission reduction measures
District
heating
- Adoption of CCS-technology in all power plants,
fossil fuels remain dominant
- Increased use (to 20-40 %) of biofuels
- Nuclear waste heat suggested in one workshop -80 %
emission
reduction
by the year
2050
Electricity - Carbon neutral Finnish grid with some CCS-coal
- Wind up to 12 %, nuclear 40-45 %
- Local production was considered insignificant
Irma Karjalainen 24.1.2013

• 94 %, 87 % and 77 % reduction scenarios
Results from Helsinki workshops
Special report: http://www.hsy.fi/seututieto/Documents/
Ilmasto/EUCO2%20workshop%20report%20Helsinki.pdf
Sector Principal emission reduction measures
Buildings
- Improved energy efficiency in buildings (by 50 %)
- Reduced electricity consumption
- Conversion to low-emission cogeneration (CHP)
- More heat pumps, no fuel oil
-80 %
emission
reduction
by the
year
2050
Transport - Increased use of plug-in hybrids and EVs
(electricity 50 %)
- All or almost all fossil fuels replaced (biofuels 40 %)
- Improved energy efficiency (by 30 %)
- Mileage increases but less than population
Irma Karjalainen 24.1.2013

80 % reduction is possible!
Irma Karjalainen 24.1.2013
Reports and more info:
http://www.euco2.org/

Irma Karjalainen 24.1.2013
Sustainability
in the City of Oslo
Environmental planning
• Oslo facts
• The Environment and Climate Action Plan
• Waste and waste water management
• Transport fuels
• Green Mobility
Irma Karjalainen 24.1.2013

Oslo’s GHG emissions: 2.3 t/per capita
Fluorinated gases and solvents
7 %
Stationary sources
38 %
Transport/ Mobile
sources 50 %
Other sources
5 %
Irma Karjalainen 24.1.2013

Oslo climate goals
• GHG emissions reduction of 50% by 2030 and
climate neutral by 2050
– Clear targets for a climate neutral and efficient
transport system and carbon free heating
– Public transport to be fossil free by 2020
– Oslo will reduce GHG emissions from all transport by
50 % by 2030
– Fossil free district heating powered by heat from
sewage and domestic waste
Irma Karjalainen 24.1.2013
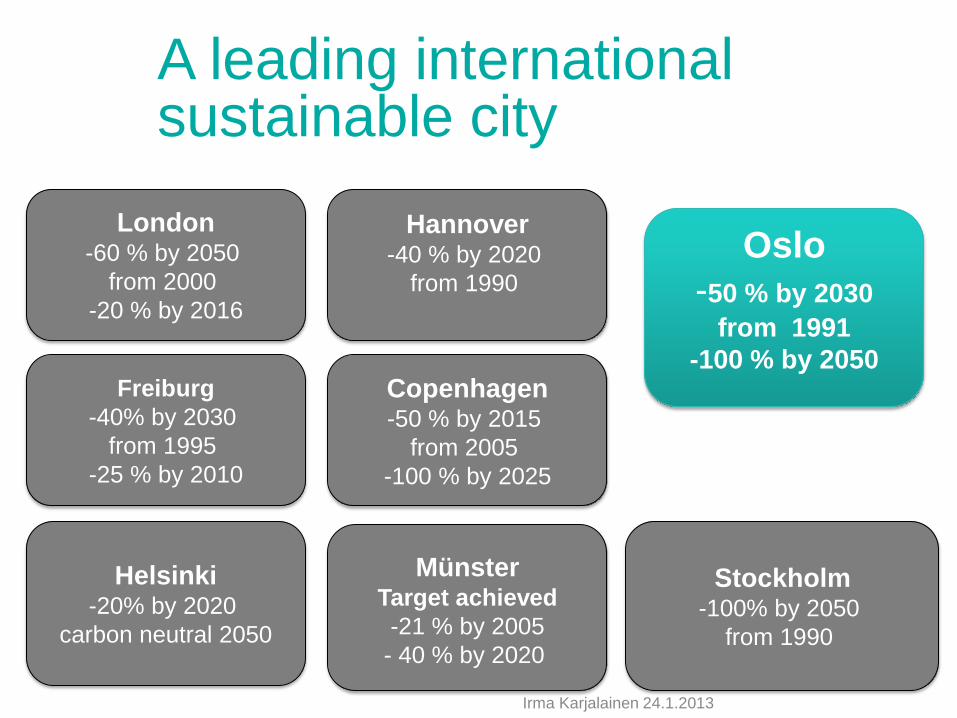
Hannover -40 % by 2020
from 1990
Copenhagen -50 % by 2015
from 2005
-100 % by 2025
Stockholm -100% by 2050
from 1990
London -60 % by 2050
from 2000
-20 % by 2016
Freiburg
-40% by 2030
from 1995
-25 % by 2010
Helsinki -20% by 2020
carbon neutral 2050
Münster Target achieved
-21 % by 2005
- 40 % by 2020
Oslo
-50 % by 2030
from 1991
-100 % by 2050
A leading international sustainable city
Irma Karjalainen 24.1.2013

Waste and waste
water management
Irma Karjalainen 24.1.2013

Oslo’s cycle-based waste management system
Irma Karjalainen 24.1.2013
hazardous glass paper
waste metal cardboad
Bio fertilizer District heating
Bio gas Electricity
Waste-to-Energy Agency
City of Oslo
Contruction
waste re-use,
recycling
and energy
recovery

Oslo’s reuse of waste heat and waste water -the renewable energy producer
Sewage and waste heat
Biogas
Fuel for 80 buses
and 140 refuse collection trucks
Energy to district heating
250 GWh, heating 21 000 homes,
Sludge for agriculture farmland
Fertiliser 140 t
= Fosfor 110 000
bags of min.fertiliser,
30 kg/bag
Annual production

optical
sorting
Waste–to-Energy Agency
City of Oslo
Efficient sorting and re-use of domestic waste
• 94 % of all household waste is either
energy recovered or material recycled
• 90 % of all inhabitants live within 300 m
of a waste return point
• All homes included in waste sorting
Irma Karjalainen 24.1.2013
• Organic waste to biogas
• Plastic waste to new products
• Waste to district heating

From plastic wrapping to new products
• The national plastic recycling system: – The plastic is optically sorted in Oslo, melted
and transformed into new plastic products in
Germany
– Worlds largest, and the only sorting plant
with mechanical presorting process in Oslo
Irma Karjalainen 24.1.2013

District heating
Irma Karjalainen 24.1.2013

District heating at Oslo will
be fossil free by 2016
(20 % fossil 2012)
• Fossil free district heating
powered by heat from
sewage and domestic
waste and bioenergy
• Oslo’s municipal buildings
oil-free from 2012
• 2 waste incineration plants
Irma Karjalainen 24.1.2013

Transport
Irma Karjalainen 24.1.2013

All public transport to be fossil free by 2020
All transport GHG reduction by 50 % by 2030:
Metro Trams Buses run by
biogas hydrogen hybrid biodiesel bioethanol
Boats - biogas Local trains

Oslo – Electric Car
Capital of the World?
• 2500 electric cars in the Oslo
urban area,
4000 in the metropolitan region
• No charge at toll ring
• Use of public transport lanes
• Free parking for EV’s
• EV’s and hydrogen cars are
exempt from Vehicle Import
Duty and VAT
• Rapid charging project
Irma Karjalainen 24.1.2013

500 public charging stations for EV’s by
....230 private charging stations
Foto: Mona Strande
Irma Karjalainen 24.1.2013

The world’s first public commercial car-sharing scheme with EV’s.
• 13 electric cars at three central locations
Irma Karjalainen 24.1.2013

Hydrogen – five new buses and regional hydrogen infrastructure
Irma Karjalainen 24.1.2013
Oslo is creating early markets for
hydrogen,
4 filling stations and
17 hydrogen fuel cell cars
A hydrogen refuellng station
a world first as the station is supplied
by hydrogen produced from domestic waste.

Transport planning
Irma Karjalainen 24.1.2013

62% of journeys on public transport system by rail
Railwa
y
Metr
o
Tram
Irma Karjalainen 24.1.2013

Is level of car traffic reducing?
Improvement of public
transport
new metro
carriages,
new price structure,
high frequency
car traffic -3%

Road charging for financing transport
infrastructure and reducing transport demand
City
Hall
RING 3
RINGROAD
2
RING ROAD
3
RING
1
Irma Karjalainen 24.1.2013

Green mobility in
Oslo is about… …attractive city for
pedestrians
…improving public transport
…introduction of green
vehicles and infrastructure for
electro and hydrogen mobility
…transforming the city to be
bike friendly
Irma Karjalainen 24.1.2013
Conclusions: A great city needs a great green policy
• Strong political leadership
• Good urban governance and strong management
• Clear goals
• Civil society involvement
• Best practice
• Dedicated people, action plan and concrete actions
• Knowledge dissemination
-
Irma Karjalainen 24.1.2013

Thank you!
More information: • www.hsy.fi/seututieto/Documents/Ilmasto/EUCO2%20workshop%20report%20
Helsinki.pdf
• www.hsy.fi/seututieto/Documents/Ilmasto/EUCO2-Results-Summary-
mall_FINAL%20VERSION.pdf
• www.oslogogreen.no
• www.hsy.fi/seututieto/ilmasto/