Embed Size (px)
Citation preview
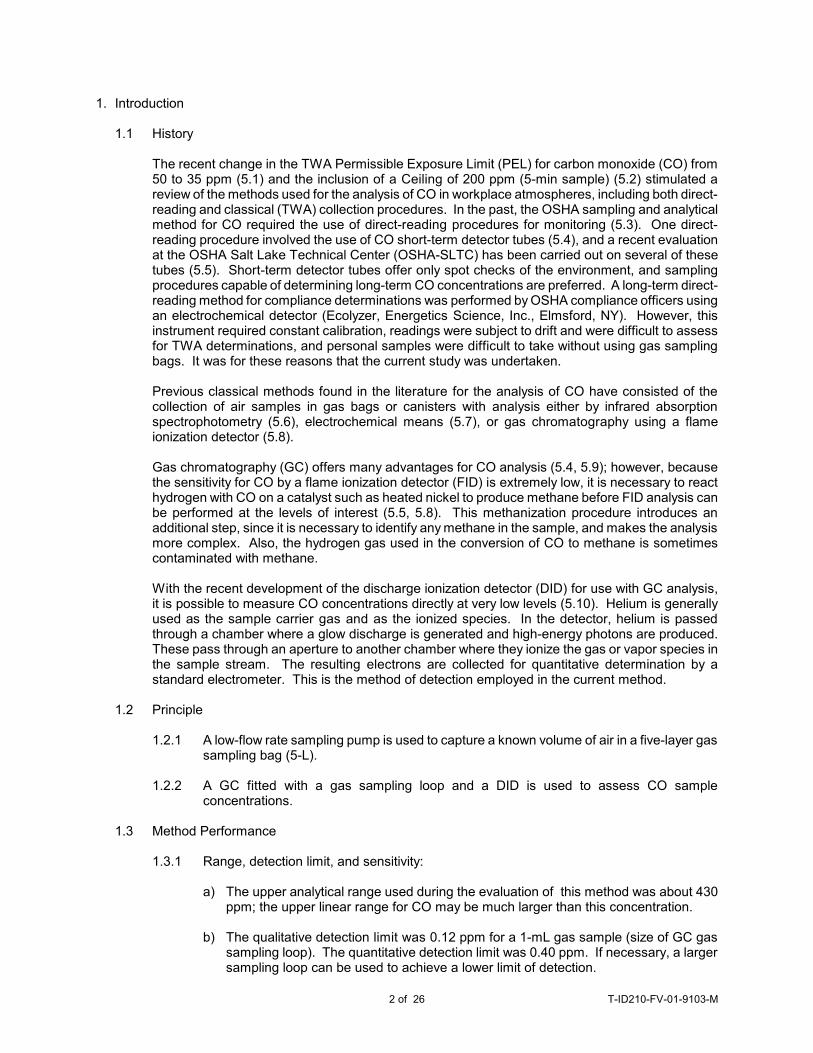
CARBON MONOXIDE IN WORKPLACE ATMOSPHERES
Method Number: ID-210
Matrix: Air
OSHA Permissible Exposure LimitsFinal Rule Limits: 35 ppm Time Weighted Average (TWA)
200 ppm Ceiling (5-min sample)Transitional Limit: 50 ppm TWA
Collection Procedure: Each sample is collected by drawing a known volume of air into a five-layer aluminized gas sampling bag.
Recommended Air Volume: 2 to 5 liters
Recommended Sampling RatesTWA Determination: 0.01 to 0.05 L/minCeiling Determination: 1 L/min
Analytical Procedure: A portion of the gas sample is introduced into a gas sampling loop,injected into a gas chromatograph, and analyzed using a dischargeionization detector.
Detection Limits (TWA, Ceiling)Qualitative: 0.12 ppmQuantitative: 0.40 ppm
Precision and AccuracyValidation Range: 17.2 to 63.6 ppmCVT(pooled): 0.025Bias: +0.058Overall Error: ±10.8%
Special Requirements: Samples should be sent to the laboratory as soon as possible andanalyzed within two weeks after collection.
Method Classification: Validated method
Chemist: Robert G. Adler
Date: March, 1991
Commercial manufacturers and products mentioned in this method are for descriptive use only and do notconstitute endorsements by USDOL-OSHA. Similar products from other sources can be substituted.
Inorganic Methods Evaluation BranchOSHA Salt Lake Technical Center
Salt Lake City, Utah
1 of 26 T-ID210-FV-01-9103-M
1. Introduction
1.1 History
The recent change in the TWA Permissible Exposure Limit (PEL) for carbon monoxide (CO) from50 to 35 ppm (5.1) and the inclusion of a Ceiling of 200 ppm (5-min sample) (5.2) stimulated areview of the methods used for the analysis of CO in workplace atmospheres, including both direct-reading and classical (TWA) collection procedures. In the past, the OSHA sampling and analyticalmethod for CO required the use of direct-reading procedures for monitoring (5.3). One direct-reading procedure involved the use of CO short-term detector tubes (5.4), and a recent evaluationat the OSHA Salt Lake Technical Center (OSHA-SLTC) has been carried out on several of thesetubes (5.5). Short-term detector tubes offer only spot checks of the environment, and samplingprocedures capable of determining long-term CO concentrations are preferred. A long-term direct-reading method for compliance determinations was performed by OSHA compliance officers usingan electrochemical detector (Ecolyzer, Energetics Science, Inc., Elmsford, NY). However, thisinstrument required constant calibration, readings were subject to drift and were difficult to assessfor TWA determinations, and personal samples were difficult to take without using gas samplingbags. It was for these reasons that the current study was undertaken.
Previous classical methods found in the literature for the analysis of CO have consisted of thecollection of air samples in gas bags or canisters with analysis either by infrared absorptionspectrophotometry (5.6), electrochemical means (5.7), or gas chromatography using a flameionization detector (5.8).
Gas chromatography (GC) offers many advantages for CO analysis (5.4, 5.9); however, becausethe sensitivity for CO by a flame ionization detector (FID) is extremely low, it is necessary to reacthydrogen with CO on a catalyst such as heated nickel to produce methane before FID analysis canbe performed at the levels of interest (5.5, 5.8). This methanization procedure introduces anadditional step, since it is necessary to identify any methane in the sample, and makes the analysismore complex. Also, the hydrogen gas used in the conversion of CO to methane is sometimescontaminated with methane.
With the recent development of the discharge ionization detector (DID) for use with GC analysis,it is possible to measure CO concentrations directly at very low levels (5.10). Helium is generallyused as the sample carrier gas and as the ionized species. In the detector, helium is passedthrough a chamber where a glow discharge is generated and high-energy photons are produced. These pass through an aperture to another chamber where they ionize the gas or vapor species inthe sample stream. The resulting electrons are collected for quantitative determination by astandard electrometer. This is the method of detection employed in the current method.
1.2 Principle
1.2.1 A low-flow rate sampling pump is used to capture a known volume of air in a five-layer gassampling bag (5-L).
1.2.2 A GC fitted with a gas sampling loop and a DID is used to assess CO sampleconcentrations.
1.3 Method Performance
1.3.1 Range, detection limit, and sensitivity:
a) The upper analytical range used during the evaluation of this method was about 430ppm; the upper linear range for CO may be much larger than this concentration.
b) The qualitative detection limit was 0.12 ppm for a 1-mL gas sample (size of GC gassampling loop). The quantitative detection limit was 0.40 ppm. If necessary, a largersampling loop can be used to achieve a lower limit of detection.
2 of 26 T-ID210-FV-01-9103-M
c) The sensitivity of the analytical method [using analytical conditions stated for a Tracor540 GC (Tracor Instruments Austin, Inc., Austin TX) and Hewlett-Packard 3357Laboratory Automation System, Revision 2540 (Hewlett-Packard Co., Avondale PA)]was taken from the slope of the linear working range curve (1.70 to 63.6 ppm range). The sensitivity is 1,970 area units per 1 ppm. (For the HP 3357 Automation System,1 area unit = 1 µVs.)
1.3.2 Precision, accuracy, and stability:
a) The pooled coefficient of variation for the sampling and analytical method from 17.2 to63.6 ppm was 0.025.
b) The average recovery of generated samples taken in the 17.2-63.6 ppm range at 50%RH was 105.8%. The range of bias was -0.01 to +0.10. The Overall Error (OE) was±10.8%.
c) Precision and accuracy data were derived from generated samples and preparedstandards that were aged 4 days or less. The stability of CO in sampling bags isacceptable up to 2 weeks after sample collection.
d) Stability tests indicated that significant scatter in the results and lower recoveriestended to appear after prolonged storage. Use of new bags free of small leaks andinternal deposits may prolong sample stability. Samples should be analyzed as soonas possible to minimize storage problems.
1.4 Advantages and Disadvantages
1.4.1 The method is specific for CO. The method is also applicable in measuring complianceto Indoor Air Quality Standards for CO [9 ppm (8 h), 35 ppm (1 h)] (5.11).
1.4.2 Using similar procedures, sampling and analysis for carbon dioxide (CO2) is also possibleprovided the molecular sieve column is eliminated from the gas stream during CO2
analysis.
1.4.3 Gas sampling bags are employed and may be somewhat inconvenient to use.
1.4.4 Changes in humidity do not affect sample collection.
1.4.5 The bulk of the sample is not destroyed during analysis. Other potentially toxic gases mayalso be analyzed from the same sample.
1.4.6 The gas bags used as sample collection media are reusable.
1.4.7 The method requires the use of a GC equipped with a DID.
1.4.8 Analytical time required per sample is within 20 min when using the conditions specified.
1.4.9 Gas bag samples are stable for approximately 2 weeks. Samples should be analyzed assoon as possible.
1.5 Physical Properties of CO (5.12, 5.13)
Molecular weight 28.01Molecular formula COAppearance Colorless, odorless gasExplosive limits in air 12.5 to 74.2% (v/v)Autoignition temperature 651ECMelting point -207EC
3 of 26 T-ID210-FV-01-9103-M
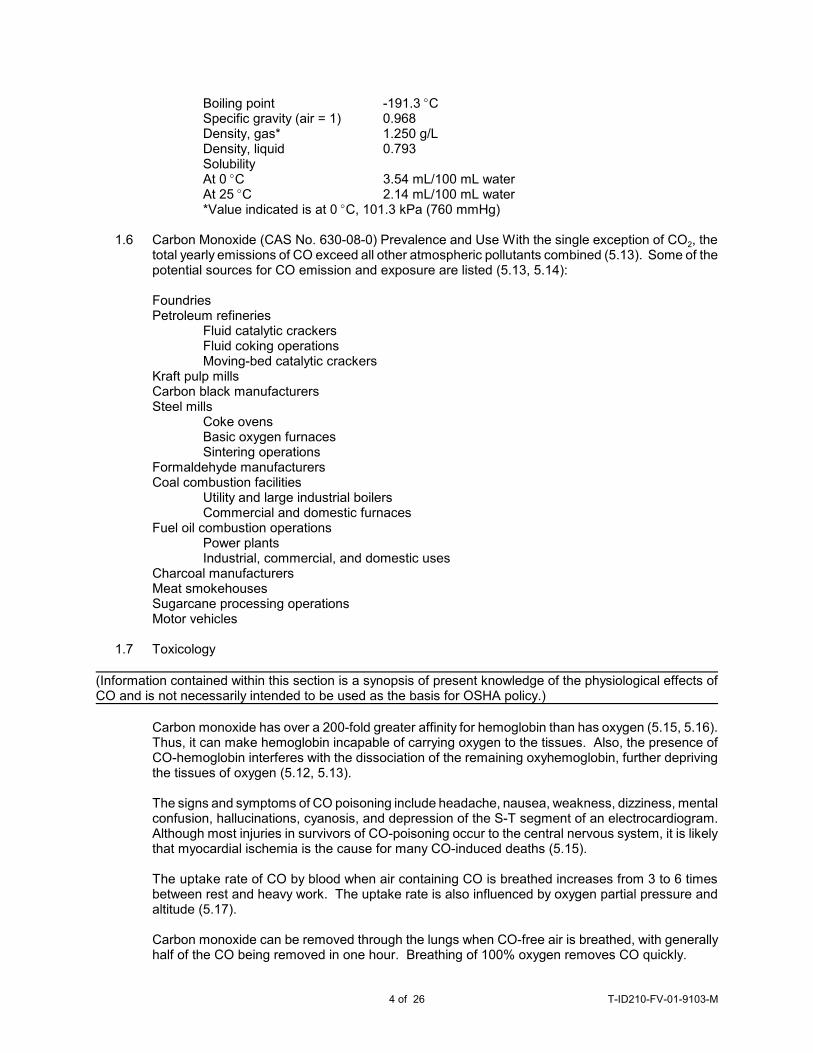
Boiling point -191.3ECSpecific gravity (air = 1) 0.968Density, gas* 1.250 g/LDensity, liquid 0.793SolubilityAt 0EC 3.54 mL/100 mL waterAt 25EC 2.14 mL/100 mL water*Value indicated is at 0EC, 101.3 kPa (760 mmHg)
1.6 Carbon Monoxide (CAS No. 630-08-0) Prevalence and Use With the single exception of CO2, thetotal yearly emissions of CO exceed all other atmospheric pollutants combined (5.13). Some of thepotential sources for CO emission and exposure are listed (5.13, 5.14):
FoundriesPetroleum refineries
Fluid catalytic crackersFluid coking operationsMoving-bed catalytic crackers
Kraft pulp millsCarbon black manufacturersSteel mills
Coke ovensBasic oxygen furnacesSintering operations
Formaldehyde manufacturersCoal combustion facilities
Utility and large industrial boilersCommercial and domestic furnaces
Fuel oil combustion operationsPower plantsIndustrial, commercial, and domestic uses
Charcoal manufacturersMeat smokehousesSugarcane processing operationsMotor vehicles
1.7 Toxicology
(Information contained within this section is a synopsis of present knowledge of the physiological effects ofCO and is not necessarily intended to be used as the basis for OSHA policy.)
Carbon monoxide has over a 200-fold greater affinity for hemoglobin than has oxygen (5.15, 5.16). Thus, it can make hemoglobin incapable of carrying oxygen to the tissues. Also, the presence ofCO-hemoglobin interferes with the dissociation of the remaining oxyhemoglobin, further deprivingthe tissues of oxygen (5.12, 5.13).
The signs and symptoms of CO poisoning include headache, nausea, weakness, dizziness, mentalconfusion, hallucinations, cyanosis, and depression of the S-T segment of an electrocardiogram. Although most injuries in survivors of CO-poisoning occur to the central nervous system, it is likelythat myocardial ischemia is the cause for many CO-induced deaths (5.15).
The uptake rate of CO by blood when air containing CO is breathed increases from 3 to 6 timesbetween rest and heavy work. The uptake rate is also influenced by oxygen partial pressure andaltitude (5.17).
Carbon monoxide can be removed through the lungs when CO-free air is breathed, with generallyhalf of the CO being removed in one hour. Breathing of 100% oxygen removes CO quickly.
4 of 26 T-ID210-FV-01-9103-M
Acute poisoning from brief exposure to high concentrations rarely leads to permanent disability ifrecovery occurs. Chronic effects from repeated exposure to lower concentrations have beenreported. These include visual and auditory disturbances and heart irregularities. Where poisoninghas been long and severe, long-lasting mental or nerve damage has resulted (5.12).
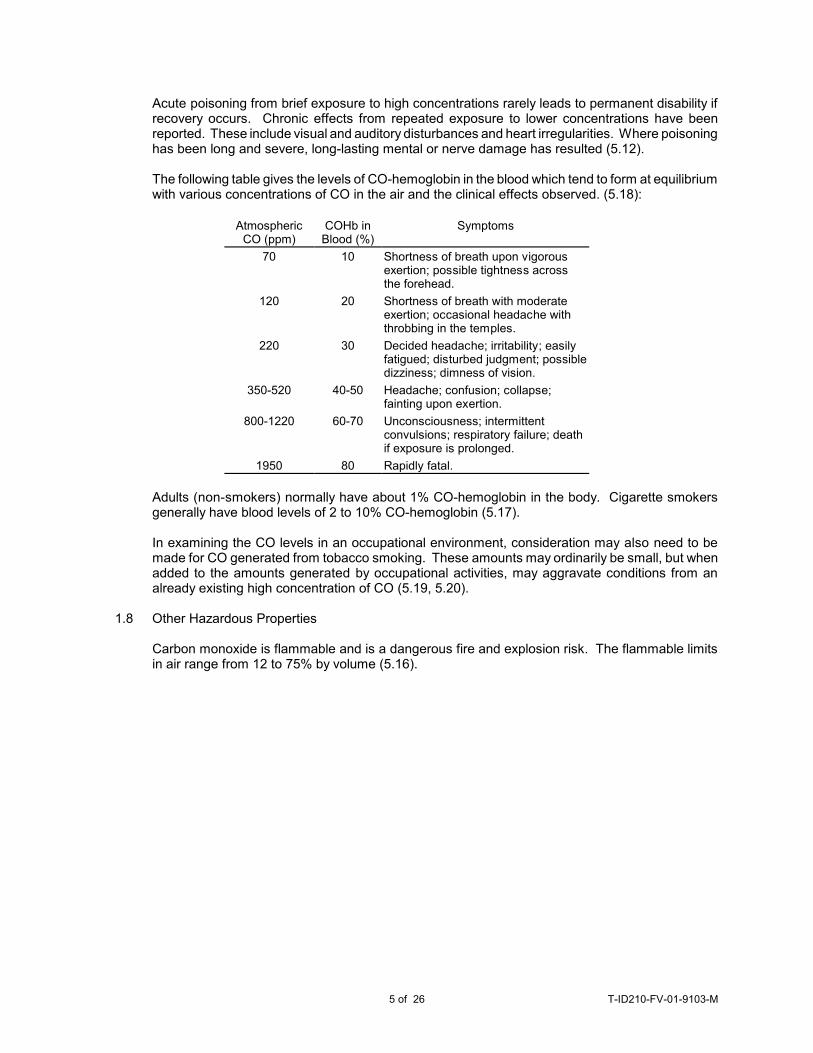
The following table gives the levels of CO-hemoglobin in the blood which tend to form at equilibriumwith various concentrations of CO in the air and the clinical effects observed. (5.18):
AtmosphericCO (ppm)
COHb inBlood (%)
Symptoms
70 10 Shortness of breath upon vigorousexertion; possible tightness acrossthe forehead.
120 20 Shortness of breath with moderateexertion; occasional headache withthrobbing in the temples.
220 30 Decided headache; irritability; easilyfatigued; disturbed judgment; possibledizziness; dimness of vision.
350-520 40-50 Headache; confusion; collapse;fainting upon exertion.
800-1220 60-70 Unconsciousness; intermittentconvulsions; respiratory failure; deathif exposure is prolonged.
1950 80 Rapidly fatal.
Adults (non-smokers) normally have about 1% CO-hemoglobin in the body. Cigarette smokersgenerally have blood levels of 2 to 10% CO-hemoglobin (5.17).
In examining the CO levels in an occupational environment, consideration may also need to bemade for CO generated from tobacco smoking. These amounts may ordinarily be small, but whenadded to the amounts generated by occupational activities, may aggravate conditions from analready existing high concentration of CO (5.19, 5.20).
1.8 Other Hazardous Properties
Carbon monoxide is flammable and is a dangerous fire and explosion risk. The flammable limitsin air range from 12 to 75% by volume (5.16).
5 of 26 T-ID210-FV-01-9103-M
2. Sampling
2.1 Safety Precautions
2.1.1 Attach the sampling equipment to the worker in such a manner that it will not interfere withwork performance or safety.
2.1.2 Follow all safety practices that apply to the work area being sampled.
2.2 Equipment
Note: The gas sample taken will contact the pump and tubing during collection. The filter (if available) of thepump should be clean and chemically inert to CO as well as any material inside the pump that the samplecomes in contact with. Pumps used to evaluate the method were: Du Pont Model No. P-125 pumps [E. I. DuPont de Nemours and Co. (Inc.), Wilmington, DE] for the TWA portion, and SKC Model No. 224-30 pumps(SKC Inc., Eighty Four, PA) for the Ceiling studies. The tubing also must not affect the CO concentration. Tygon tubing was used for method validation and therefore is specified to be used in this procedure.
2.2.1 Use a personal sampling pump capable of delivering a flow rate of approximately 0.01 to0.05 L/min for TWA PEL samples. Use a larger flow rate pump (1 L/min) for Ceiling PELmeasurements. Either pump must have an external inlet, an outlet port, and hose barbs.
2.2.2 Use five-layer aluminized gas sampling bags (5-L) as the collection media (the bags canbe obtained from the OSHA-SLTC or Calibrated Instruments Inc., Ardsley, NY).
2.2.3 Make pump, sampling media, and breathing zone connections with various lengths offlexible Tygon tubing.
2.3 Sampling Procedure
2.3.1 Calibrate the personal sampling pumps. Since the sampling bags have a total volumecapacity of approximately 6 L, a sampling scheme for TWA PEL measurements is shown:
Flow Rate(L/min)
SamplingTime (h)
Sample Vol(L)
0.0150.0220.0350.050
44
2.51.5
3.65.35.34.5
Take as large a sample as possible (<6 L) during the time frame used for sampling. A large flowrate (0.04-0.05 L/min) will require replacing sampling bags throughout the day. For TWA PELdeterminations, a flow rate of approximately 0.020-0.025 L/min is sufficient for a 4-h sample. ForCeiling PEL samples, calibrate the pump to approximately 1 L/min.2.3.2 Evacuate and check the gas sampling bags for leaks. Each sampling bag can be
evacuated and leak tested by applying a vacuum to the bag. If a vacuum is applied to aleaky sampling bag, the bag will not fully collapse. If a vacuum pump is not available,inflate the gas sampling bags with nitrogen (N2), let them sit overnight, inspect for leaks,and then evacuate by hand rolling and flattening.
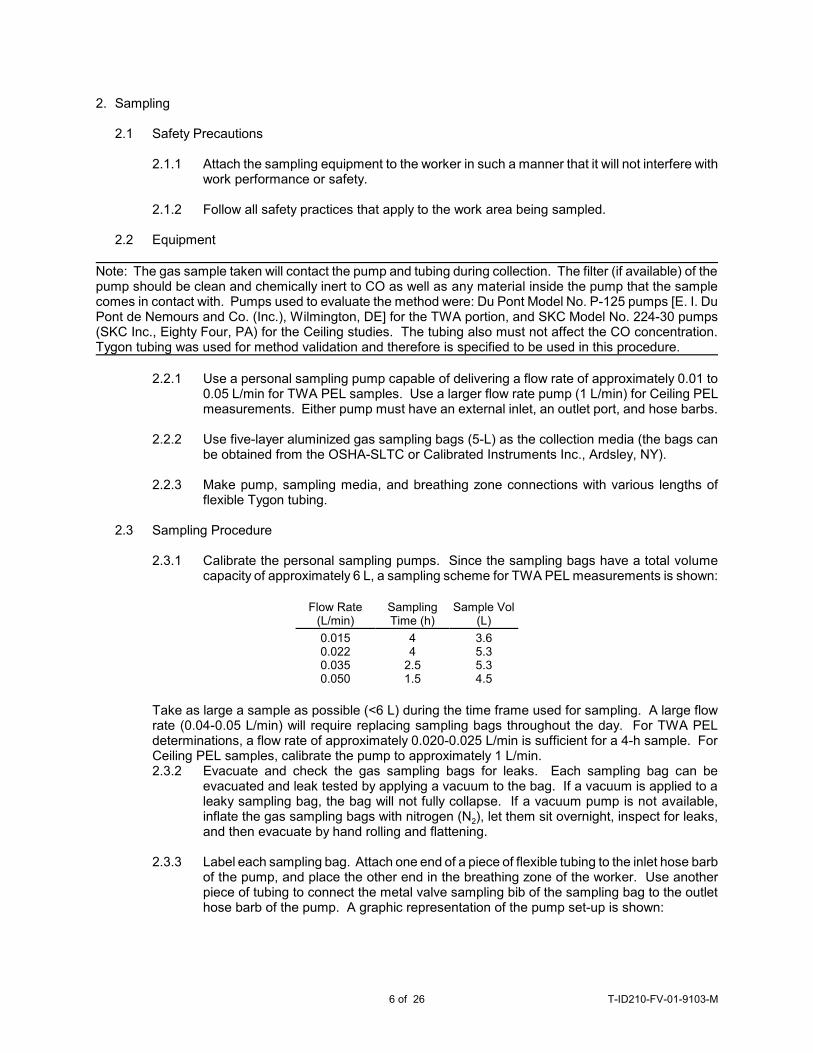
2.3.3 Label each sampling bag. Attach one end of a piece of flexible tubing to the inlet hose barbof the pump, and place the other end in the breathing zone of the worker. Use anotherpiece of tubing to connect the metal valve sampling bib of the sampling bag to the outlethose barb of the pump. A graphic representation of the pump set-up is shown:
6 of 26 T-ID210-FV-01-9103-M
2.3.4 For personal sampling, attach the gas sampling bag to any loose fitting clothing on theworker’s back or side with tubing clamps.
2.3.5 When ready to sample, open the gas sampling bag valve by rotating the metal valvecounter-clockwise until fully open. Attach the free end of the tubing connected to the bagto the outlet hose barb of the pump. Turn on the pump. For Ceiling PEL determinations,sample for 5 min; for TWA measurements, sample up to 4 h.
Note: If the employee being monitored is smoking a tobacco product during sampling, a positive contributionof CO from the combustion of tobacco may occur for personal samples. Ask the employee to refrain fromsmoking during sampling so that only the occupational exposure is measured.
2.3.6 After sampling, rotate the valve clockwise until tight. Place an OSHA-21 seal over themetal valve. Record the total air volume taken.
2.3.7 Prepare samples and paperwork for submission to the laboratory. Do not prepare anyblank samples. Request analysis for carbon monoxide.
2.3.8 When submitting sampling bags for analysis, pack loosely and pad generously to minimizepotential damage during shipment. Submit samples to the laboratory as soon as possibleafter sampling.
3. Analysis
3.1 Safety Precautions
3.1.1 Refer to instrument manuals and operating procedures for proper operation of theinstruments.
\3.1.2 Observe laboratory safety regulations and practices.
3.1.3 Prepare all CO standards in a well ventilated exhaust hood. AVOID inhaling CO.
3.2 Equipment
3.2.1 Instruments
A GC fitted with a 1-mL stainless steel gas sampling loop, sampling valve, and DID is used. Loops other than 1 mL can also be used.
3.2.2 Standard media:
Five-layer aluminized gas sampling bags are used.
3.2.3 A 4-foot × 1/8-inch stainless steel, 60-80 mesh, Hayesep Q column and a 12-foot × 1/8-inch stainless steel, 60-80 mesh, molecular sieve 5A column (in this order) are used.
3.2.4 Data reduction:
7 of 26 T-ID210-FV-01-9103-M
An electronic integrator is used to calculate peak areas.
3.2.5 Standard generation:
Certified CO standards can be used or standards can be prepared using any combinationof: Calibrated gas-tight syringes or calibrated rotameters, mass flow controllers, or soapbubble flowmeters. A stopwatch is also necessary.
3.2.6 Additional accessories:
A personal sampling pump, with inlet and outlet ports and hose barbs, is used to load thegas sampling loop (loop loading can also be manually performed by squeezing thesampling bag).
3.3. Reagents (Gases)
3.3.1. A commercially prepared, bottled mixture of CO diluted with either air or N2 is suitable forgenerating gas standards. The CO concentration must be certified. If a soap bubbleflowmeter (~1 L/min) is used for standard preparation, a mixture containing 100 ppm COis convenient. If a gas-tight calibrated syringe (~0 to 30 mL) is used, a mixture containing5,000 ppm is suitable.
3.3.2. Filtered, compressed, CO-free air is used for dilutions when necessary. A convenientsource of pure air is a cylinder of USP (United State Pharmacopeia) grade air. Smallamounts of CO can be removed from the air by using a catalytic filter unit containinghopcalite to convert any CO to CO2.
3.3.3. Helium (research grade, <1 ppm impurities) is used as the carrier gas.
3.4. Standard Preparation
Prepare standards by either using a calibrated syringe or metered delivery of CO using flowmeasurement. When a soap bubble flow meter is used for gas flow measurements, apply watervapor corrections if necessary, since the gas flowing through the meter expands somewhat uponsaturation with water vapor. As an example, consider the case where dry gas at 101.3 kPa pressure(760 mmHg) enters a flow meter and is saturated with water vapor [vapor pressure = 2.9 kPa(22mmHg)]. In this case the gas volume (and therefore the gas flow rate) will be measured at(104.2/101.3 = 1.029) times the actual values. Specific cases of whether or not to use vaporcorrections are given below.
Note: Commercially prepared standards in gas cylinders, if available, can be used in place of laboratory-prepared standards. It is recommended to use at least two standards to prepare a concentration-responsecurve. One of the commercial standards should be above the anticipated concentration of the samples.
A standard generation scheme using 100-ppm CO with metered delivery is proposed as follows:
Standard(ppm)
100-ppm COVolume (L)
Volume ofAir (L)
Blank10173570
100
0.000.400.681.402.804.00
4.003.603.322.601.200.00
Other dilution schemes with different size gas bags and gas volumes can be used. For otherconcentrations of CO, use the following equation:
8 of 26 T-ID210-FV-01-9103-M
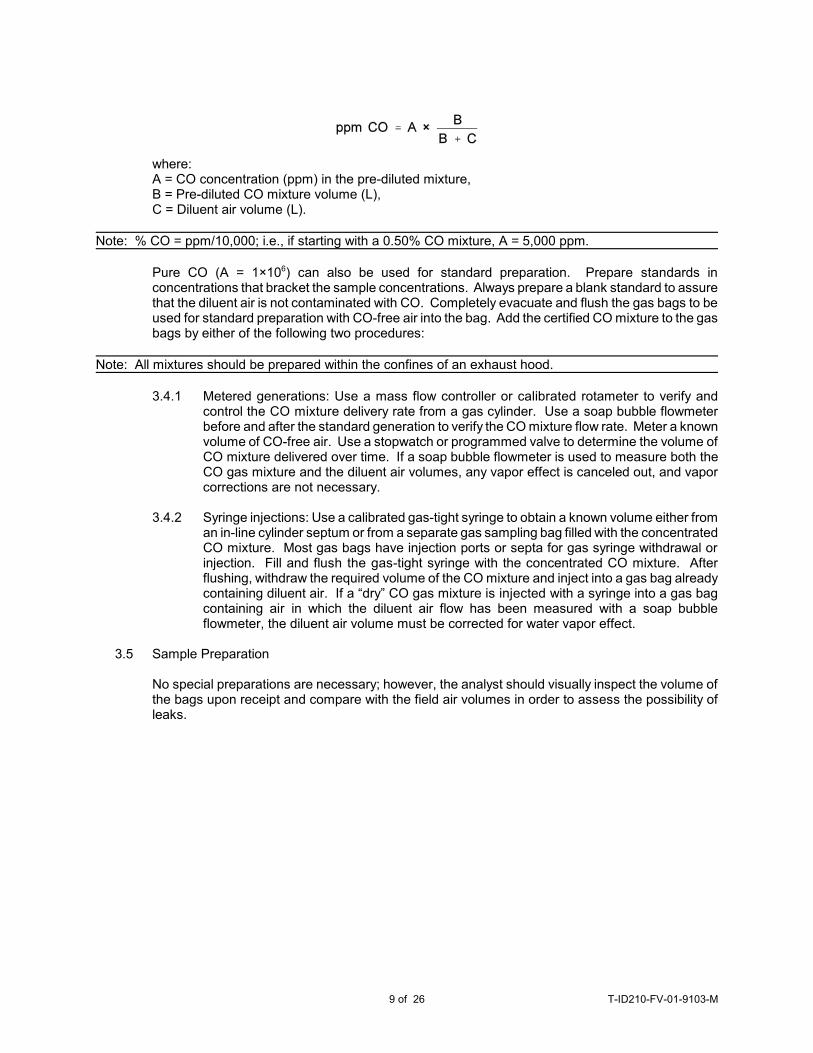
where:A = CO concentration (ppm) in the pre-diluted mixture,B = Pre-diluted CO mixture volume (L),C = Diluent air volume (L).
Note: % CO = ppm/10,000; i.e., if starting with a 0.50% CO mixture, A = 5,000 ppm.
Pure CO (A = 1×10⁶) can also be used for standard preparation. Prepare standards inconcentrations that bracket the sample concentrations. Always prepare a blank standard to assurethat the diluent air is not contaminated with CO. Completely evacuate and flush the gas bags to beused for standard preparation with CO-free air into the bag. Add the certified CO mixture to the gasbags by either of the following two procedures:
Note: All mixtures should be prepared within the confines of an exhaust hood.
3.4.1 Metered generations: Use a mass flow controller or calibrated rotameter to verify andcontrol the CO mixture delivery rate from a gas cylinder. Use a soap bubble flowmeterbefore and after the standard generation to verify the CO mixture flow rate. Meter a knownvolume of CO-free air. Use a stopwatch or programmed valve to determine the volume ofCO mixture delivered over time. If a soap bubble flowmeter is used to measure both theCO gas mixture and the diluent air volumes, any vapor effect is canceled out, and vaporcorrections are not necessary.
3.4.2 Syringe injections: Use a calibrated gas-tight syringe to obtain a known volume either froman in-line cylinder septum or from a separate gas sampling bag filled with the concentratedCO mixture. Most gas bags have injection ports or septa for gas syringe withdrawal orinjection. Fill and flush the gas-tight syringe with the concentrated CO mixture. Afterflushing, withdraw the required volume of the CO mixture and inject into a gas bag alreadycontaining diluent air. If a “dry” CO gas mixture is injected with a syringe into a gas bagcontaining air in which the diluent air flow has been measured with a soap bubbleflowmeter, the diluent air volume must be corrected for water vapor effect.
3.5 Sample Preparation
No special preparations are necessary; however, the analyst should visually inspect the volume ofthe bags upon receipt and compare with the field air volumes in order to assess the possibility ofleaks.
9 of 26 T-ID210-FV-01-9103-M
3.6 Sample Analysis
3.6.1 Recommended GC conditions:
Settings for a Tracor Model No. 540 GC and Model No. 706 DID are given in Appendix 1. Other settings may apply to different GCs.
3.6.2 Sample and standard introduction:
a) Connect the outlet port of the personal sampling pump to the sampling loop via inerttubing.
b) Adjust the pump to give a suitable flow rate for sample loading from the bag to thesampling loop.
c) Connect a short piece of tubing from the inlet port of the pump to the sample bag. Turn the bag valve counterclockwise to the open position and turn on the pump.
d) After the sample is loaded into the loop (which is vented to the atmosphere), turn offthe pump to allow the loop sample to return to atmospheric pressure. Wait 1 to 2 minfor pressure equalization and then open the gas sampling valve. Carrier gas flow isnow directed through the sampling loop to the column and detector.
Note: Samples and standards can be introduced into the loop without a pump by simply squeezing a sufficientamount of sample from the bag into the loop. The sampling bag must be released for loop sample pressurenormalization before opening the gas sampling valve.
e) Perform two determinations of each sample and standard.
3.6.3 Depending on column and GC flow characteristics, CO retention times are in the range of12 to 14 min.
3.7 Interferences
The GC determination of CO is relatively specific; however, any compound having a similar columnretention time as CO is a potential interference. Interferences can be minimized by alteringoperational conditions such as oven temperature and column packings. Using the conditions statedwithin this method, other common gases and vapors do not present serious potential interferences. Carbon dioxide is adsorbed on the molecular sieve column and does not interfere. Hydrogen,oxygen, nitrogen, methane, and carbon monoxide will elute in the order listed (5.10). However, theCO peak will normally appear on the shoulder of the N2 peak for air; therefore, GC conditions shouldbe set so that a distinct CO peak is obtained. A chromatogram showing the elution of CO in N2 isshown in Figure 1.
If necessary, the sample can be analyzed by GC-mass spectrometry to confirm the presence of CO;however, since CO has nearly the same molecular weight as N2, low resolution mass spectrometrymay not distinguish the two if the peaks are not well separated.
3.8 Calculations
3.8.1 If blank correction is necessary for the standards, subtract the blank peak area from thestandard area readings before constructing the concentration-response curve. No blankcorrection is necessary for the samples.
3.8.2 Calculate CO concentrations from a least-squares regression curve. Establish the curvewith peak area or peak height versus ppm. Results are calculated in units of ppm. Nocalculations using air volumes are necessary since gas phase samples are compareddirectly to gas phase standards.
3.8.3 Report results to the industrial hygienist as ppm CO.
10 of 26 T-ID210-FV-01-9103-M
4. Backup Report
Experimental Protocol
The validation of the method consists of the following experimental protocol:
1) Analysis of three sets of six spiked carbon monoxide (CO) samples having concentration rangesof approximately 0.5, 1, and 2 × TWA PEL.
2) Analysis of three sets of six dynamically generated CO samples having concentration ranges ofapproximately 0.5, 1, and 2 × TWA PEL. Also, analysis of six generated samples having aconcentration close to the Ceiling PEL value.
3) Determination of the storage stability of CO samples collected in gas sampling bags.4) Determination of any variation in results when sampling at low and high humidity levels.5) Determination of the qualitative and quantitative detection limits for the analysis of CO.6) Comparison with a previous GC method used for CO determinations in which the CO was reduced
to methane and analyzed with a flame ionization detector (FID).7) Assessment of the performance of this method and conclusions.
All samples, blanks, and standards used for validation were analyzed by direct injection into a 1-mLgas sampling valve in the GC as mentioned in the method. A Tracor Model No. 540 GC equippedwith a Model No. 706 DID was used. Integrated peak areas were used as a measure of instrumentresponse. Analytical parameters used during these experiments are listed in Appendix 1. All resultswere statistically examined for outliers and, when necessary for pooling results, for homogeneousvariance. Possible outliers were determined by using the American Society for Testing andMaterials (ASTM) test for outliers (5.21). Homogeneity of the coefficients of variation (CV) wasdetermined using the Bartlett’s test (5.22). Overall Error (OE) (5.23) was calculated as:
OEi = ± [|mean biasi| + sCVi] × 100%
where i is the respective sample pool being examined
4.1 Analysis (spiked samples)
Procedure: Three sets of spiked samples were prepared and analyzed as follows:
4.1.1. Samples were prepared according to the following procedure:
a) Gas sampling bags were flushed several times with N2. A vacuum was then appliedto completely collapse the bags.
b) Air (USP grade) was used as a diluent after flowing through an Ecolyzer No. 7915 ZeroAir Filter. A known amount of air was metered into each sampling bag. Compressedair flow rates were measured before and after each bag filling using a soap bubbleflowmeter (Model M-5, A. P. Buck, Inc., Orlando, FL). Air flow was regulated with aregulator-rotameter system. Blank samples of the compressed air were periodicallycollected and analyzed along with the samples and standards.
c) A known amount of CO was injected into each sampling bag containing diluent airusing a calibrated gas syringe. A gas cylinder containing 0.50% CO in N2 (certified,Linde Div., Union Carbide Corp., Denver, Colorado) was used as the CO source.
4.1.2. Analytical standards were prepared according to the following procedure:
a) Standards were prepared by dilution of 104-ppm CO in N2 (certified, Airco, Inc., MurrayHill, NJ) with USP grade air.
The CO content of the cylinder was confirmed by employing a simplified modificationof a method used by Grant, Katz, and Haines (5.24). A known volume of the 104-ppm
11 of 26 T-ID210-FV-01-9103-M
CO was passed through iodine pentoxide contained in a glass tube at about 150 oC. The resulting iodine was collected in an aqueous solution of potassium iodide. Theamount of iodine formed was determined by titration using standard thiosulfate solutionwith starch as the indicator (5.25). Two samples were collected. Carbon monoxideconcentration determinations of 99.4 and 95.4 ppm (95.6% and 91.7% recoveryrespectively) were obtained. Previous work had demonstrated that the results for thisprocedure tend to be slightly lower than expected (5.24). For the present work, thegiven concentration of 104 ppm was used.
b) Known amounts of CO and air were metered into gas sampling bags as described inSection 4.1.1 above.
4.1.3 These samples and standards were analyzed within 4 days of preparation.
Results: Spiked sample recoveries (found/taken) are listed in Table 1. All analysis datapassed the ASTM outlier test. The Bartlett’s test valve (13.73) was high, most likelybecause the mean and standard deviation values at 1 × TWA PEL were exceptionallybetter than the other levels tested.
Note: When a set of results fails the Bartlett’s test, possible options are to reject the results as being derivedfrom significantly different sample populations, or adopt the CV at the PEL as the “Pooled CV”. In this casethe CV1 (Pooled) result was used instead. This appears more conservative since CV1 (Pooled) > CV1 (TWAPEL).
The data (Table 1) indicated good precision and accuracy. The CV1 was 0.038 and theaverage analytical recovery was 98.1%.
4.2 Sampling and Analysis (Generated samples)
Procedure: Three sets of generated samples at 0.5, 1, and 2 × TWA PEL were prepared andanalyzed.
4.2.1 Samples were prepared according to the following procedure:
a) Gas sampling bags were flushed several times with N2. A vacuum was then appliedto completely collapse the bags.
b) A dynamic gas generation system was assembled as shown in Figure 2. Moisture andother contaminants were removed from the diluent air by using a charcoal/Drierite/silicagel filtering system. A humidity, temperature, and flow control system (Model HCS-301, Miller-Nelson Research Inc., Monterey, CA) was used to treat the diluent air toproduce the stated RH at 25 oC. Diluent air flow was measured before and after eachexperiment using a dry test meter (Model DTM-115, American Meter Co., PhiladelphiaPA). The flow control system was calibrated in-house for temperature and humidityprior to use.
c) The CO (0.5% in N2) was introduced into the flow system via a glass mixing chamber. Gas flow rates were taken immediately before and after each experiment using a soapbubble flowmeter (Model 823-1, Mast Development Co., Davenport, IA). Flow rateswere controlled using a mass flow controller (Model FC-261, Tylan Corp., Torrance,CA).
To assure continuous generation of controlled concentrations of CO and provide anadditional verification of concentrations, the flow system was continuously monitoredduring each test with a direct-reading instrument [Model 7140 (for CO), InterscanCorp., Chatsworth, CA] connected to the flow system. Calibration of the instrumentwas performed with a 40-ppm calibrating gas (certified, Alphagaz, Cambridge, MD).
12 of 26 T-ID210-FV-01-9103-M
4.2.2 Samples were analyzed within 2 days after preparation; standards were used within 4 daysafter preparation.
4.2.3 Six samples with a CO concentration near the Ceiling PEL (200 ppm) were also generatedusing the system described above. Standards were prepared by injection of CO (0.5% inN2) using a calibrated gas syringe into a gas bag containing a known volume of USP gradeair. Samples and standards were analyzed 4 days after preparation.
Results: Recoveries for generated samples at 0.5, 1, and 2 × TWA PEL are listed in Table2a. The Sampling and Analysis date showed good precision and accuracy. All datapassed the outlier test. The Bartlett’s test value (9.92) was slightly higher than the criticalvalue (9.23), again probably due to greater precision for the TWA PEL results. The datawere pooled, since it was felt a significant amount of error would not be introduced bypooling. The CV2 (Pooled) value is similar to that found during the humidity studies(Section 4.4).
Recoveries for the samples generated at the Ceiling PEL level are given in Table 2b. These results showed excellent recovery.
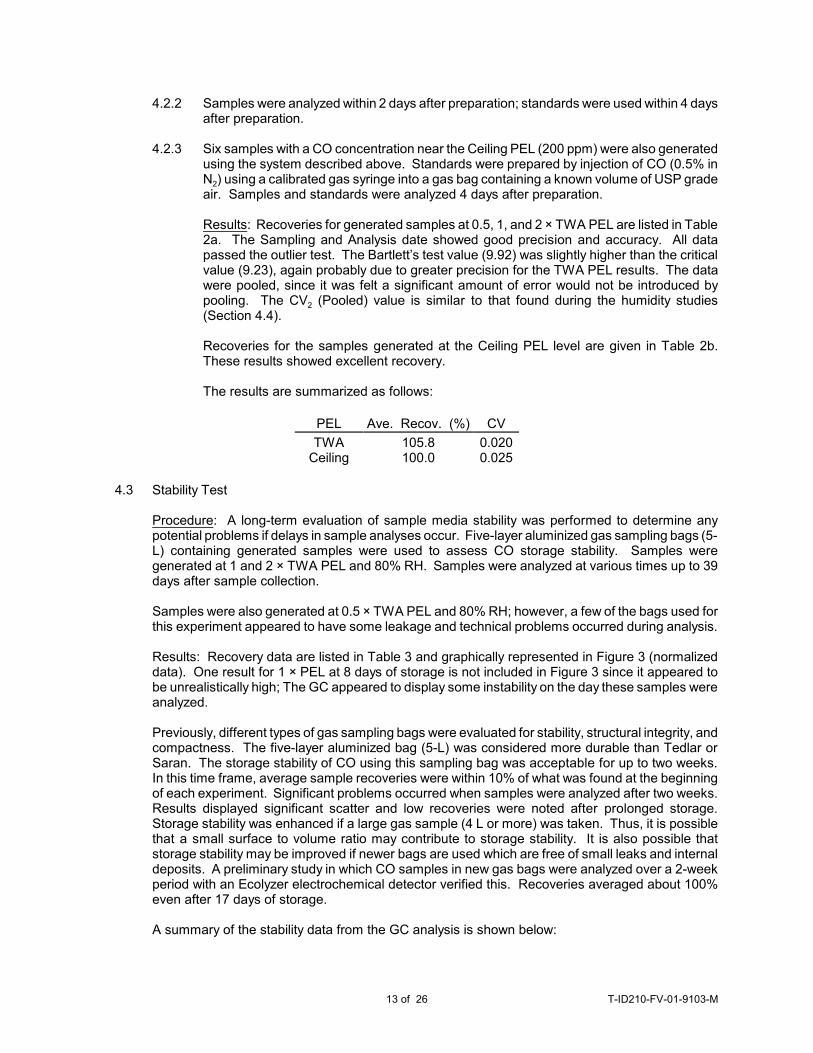
The results are summarized as follows:
PEL Ave. Recov. (%) CV
TWACeiling
105.8100.0
0.0200.025
4.3 Stability Test
Procedure: A long-term evaluation of sample media stability was performed to determine anypotential problems if delays in sample analyses occur. Five-layer aluminized gas sampling bags (5-L) containing generated samples were used to assess CO storage stability. Samples weregenerated at 1 and 2 × TWA PEL and 80% RH. Samples were analyzed at various times up to 39days after sample collection.
Samples were also generated at 0.5 × TWA PEL and 80% RH; however, a few of the bags used forthis experiment appeared to have some leakage and technical problems occurred during analysis.
Results: Recovery data are listed in Table 3 and graphically represented in Figure 3 (normalizeddata). One result for 1 × PEL at 8 days of storage is not included in Figure 3 since it appeared tobe unrealistically high; The GC appeared to display some instability on the day these samples wereanalyzed.
Previously, different types of gas sampling bags were evaluated for stability, structural integrity, andcompactness. The five-layer aluminized bag (5-L) was considered more durable than Tedlar orSaran. The storage stability of CO using this sampling bag was acceptable for up to two weeks. In this time frame, average sample recoveries were within 10% of what was found at the beginningof each experiment. Significant problems occurred when samples were analyzed after two weeks. Results displayed significant scatter and low recoveries were noted after prolonged storage. Storage stability was enhanced if a large gas sample (4 L or more) was taken. Thus, it is possiblethat a small surface to volume ratio may contribute to storage stability. It is also possible thatstorage stability may be improved if newer bags are used which are free of small leaks and internaldeposits. A preliminary study in which CO samples in new gas bags were analyzed over a 2-weekperiod with an Ecolyzer electrochemical detector verified this. Recoveries averaged about 100%even after 17 days of storage.
A summary of the stability data from the GC analysis is shown below:
13 of 26 T-ID210-FV-01-9103-M
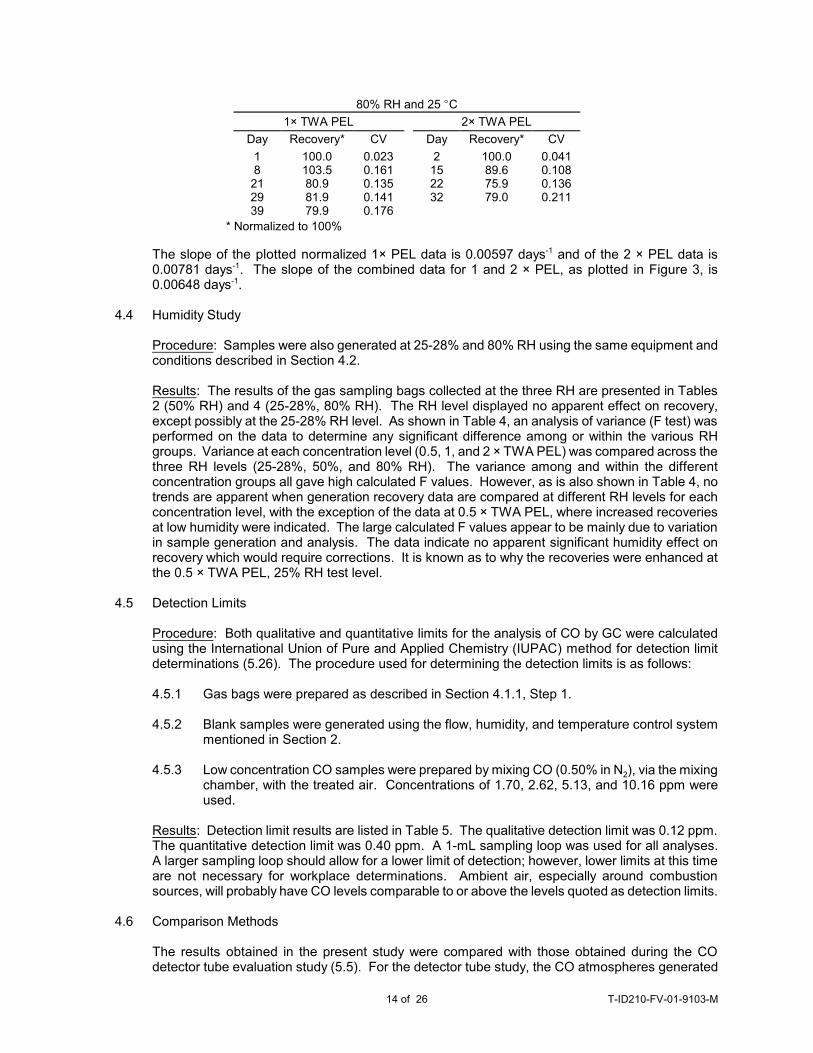
80% RH and 25 EC
1× TWA PEL 2× TWA PEL
Day Recovery* CV Day Recovery* CV
18
212939
100.0103.580.981.979.9
0.0230.1610.1350.1410.176
2152232
100.089.675.979.0
0.0410.1080.1360.211
* Normalized to 100%
The slope of the plotted normalized 1× PEL data is 0.00597 days-1 and of the 2 × PEL data is0.00781 days-1. The slope of the combined data for 1 and 2 × PEL, as plotted in Figure 3, is0.00648 days-1.
4.4 Humidity Study
Procedure: Samples were also generated at 25-28% and 80% RH using the same equipment andconditions described in Section 4.2.
Results: The results of the gas sampling bags collected at the three RH are presented in Tables2 (50% RH) and 4 (25-28%, 80% RH). The RH level displayed no apparent effect on recovery,except possibly at the 25-28% RH level. As shown in Table 4, an analysis of variance (F test) wasperformed on the data to determine any significant difference among or within the various RHgroups. Variance at each concentration level (0.5, 1, and 2 × TWA PEL) was compared across thethree RH levels (25-28%, 50%, and 80% RH). The variance among and within the differentconcentration groups all gave high calculated F values. However, as is also shown in Table 4, notrends are apparent when generation recovery data are compared at different RH levels for eachconcentration level, with the exception of the data at 0.5 × TWA PEL, where increased recoveriesat low humidity were indicated. The large calculated F values appear to be mainly due to variationin sample generation and analysis. The data indicate no apparent significant humidity effect onrecovery which would require corrections. It is known as to why the recoveries were enhanced atthe 0.5 × TWA PEL, 25% RH test level.
4.5 Detection Limits
Procedure: Both qualitative and quantitative limits for the analysis of CO by GC were calculatedusing the International Union of Pure and Applied Chemistry (IUPAC) method for detection limitdeterminations (5.26). The procedure used for determining the detection limits is as follows:
4.5.1 Gas bags were prepared as described in Section 4.1.1, Step 1.
4.5.2 Blank samples were generated using the flow, humidity, and temperature control systemmentioned in Section 2.
4.5.3 Low concentration CO samples were prepared by mixing CO (0.50% in N2), via the mixingchamber, with the treated air. Concentrations of 1.70, 2.62, 5.13, and 10.16 ppm wereused.
Results: Detection limit results are listed in Table 5. The qualitative detection limit was 0.12 ppm. The quantitative detection limit was 0.40 ppm. A 1-mL sampling loop was used for all analyses. A larger sampling loop should allow for a lower limit of detection; however, lower limits at this timeare not necessary for workplace determinations. Ambient air, especially around combustionsources, will probably have CO levels comparable to or above the levels quoted as detection limits.
4.6 Comparison Methods
The results obtained in the present study were compared with those obtained during the COdetector tube evaluation study (5.5). For the detector tube study, the CO atmospheres generated
14 of 26 T-ID210-FV-01-9103-M
were sampled side-by-side using five-layer aluminized gas sampling bags (5-L) and detector tubes. A sample of the gas from each gas bag taken was chromatographed using a 5A Molecular Sievecolumn. It was then passed with H2 carrier gas through a nickel catalytic methanizer to convert theCO to methane (CH4) before analysis with a flame ionization detector. Further details are describedin reference 5.5. Peak heights were used for sample measurement and fewer gas samples weretaken than in the present study. The results are reported in Table 6, along with a summary of thepresent results for comparison purposes. The results tend to indicate that the mean recoveries forthe individual RH and concentration level determinations are less precise in the present study. TheOverall Error (Total) (OET) values obtained indicate the amount of error is similar for either analyticaltechnique. Either approach gives acceptable results. The DID method is more direct, is simpler touse, and does not involve as much auxiliary equipment as the methanizer/FID method.
4.7 Method Performance - Conclusions
The data generated during the validation of the method indicate an acceptable method for samplingand analyzing CO. The GC-DID method offers an accurate and precise assessment of COexposures in the workplace. The data are summarized in Table 7. The GC-DID CO determinationsnear the TWA PEL were within NIOSH and OSHA accuracy and precision guidelines (5.22, 5.23). The total coefficient of variation (CVT) was 0.025, and the overall recovery was 105.8%. The dataobtained in the Ceiling PEL studies showed an average recovery of 100.0%.
Obtaining good analytical results appears to be contingent on analyzing the samples within twoweeks, and preferable as soon as possible after collection. Storage stability appears to beenhanced if a large gas sample (4 L or more) is taken. It is also possible that storage stability maybe improved if newer bags are used which are free of small leaks and internal deposits. Gas bagsamples should be sent to the laboratory and analyzed as soon as possible.
This method is capable of accurate and precise measurements to determine compliance with the35-ppm TWA PEL and 200-ppm Ceiling PEL for CO exposures.
5. References
5.1 “Air Contaminants; Final Rule” Federal Register 29 CFR Part 1910 (19 Jan. 1989). Pp. 2332-2983.
5.2 United States Department of Labor, OSHA: “Memorandum, Updated Changes to 29 CFR1910.1000, Air Contaminants Standard.” by Patricia Clark, Director Designate, Directorate ofCompliance Programs. United States Department of Labor, OSHA, Washington, DC, June 1, 1990.[Memo].
5.3 Directorate of Technical Support, OSHA-DOL: Chemical Information File, Online Database-OSHAInformation System. Salt Lake City, UT: Occupational Safety and Health Administration Salt LakeTechnical Center, 1989.
5.4 Katz, M., ed.: Methods of Air Sampling and Analysis. 2nd ed., APHA Intersociety Committee. Washington, D.C.: Publication Office, American Public Health Association, 1977. No. 132, pp. 368-369.
5.5 Occupational Safety and Health Administration Salt Lake Technical Center: Carbon MonoxideDetector Tubes (Short-Term) (USDOL/OSHA-SLTC PE-11). Salt Lake City, UT: OccupationalSafety and Health Administration Salt Lake Technical Center, 1990.
5.6 National Institute for Occupational Safety and Health: NIOSH Manual of Analytical Methods. 2nd.ed., Vol. 1 (Method No. P&CAM 112) (DHEW/NIOSH Pub. No. 77-157-A). Cincinnati, OH: NationalInstitute for Occupational Safety and Health, 1977.
5.7 National Institute for Occupational Safety and Health: NIOSH Manual of Analytical Methods. 2nd.e., Vol. 4 (Method No. S340) (DHEW/NIOSH Pub. No. 78-175). Cincinnati, OH: National Institutefor Occupational Safety and Health, 1978.
15 of 26 T-ID210-FV-01-9103-M
5.8 Mine Safety and Health Administration: Regular Mine Gas Analysis (MSHA Standard Method No.1). Denver, CO: MSHA, 1979.
5.9 Guiochon, G. and C. Pommier: Gas Chromatography in Inorganics and Organometallics. AnnArbor, MI: Ann Arbor Science Publishers Inc., 1973. pp. 79-115.
5.10 Williams, D.M.: “Unique Applications for New Helium Glow Discharge Ionization Detector for GasChromatography.” Paper presented at the 1988 Pittsburgh Conference, New Orleans, LA, February1988.
5.11 American Society of Heating, Refrigerating and Air-Conditioning Engineers Inc.: Ventilation forAcceptable Indoor Air Quality. ASHRAE 62-1989. Atlanta, GA: American Society of Heating,Refrigerating and Air-Conditioning Engineers, 1989. pp. 1-26.
5.12 Sax, N.I.: Dangerous Properties of Industrial Materials. 4th ed. New York: Van Nostrand ReinholdCompany, 1975. pp. 520-521.
5.13 National Institute for Occupational Safety and Health: Criteria for a Recommended Standard--Occupational Exposure to Carbon Monoxide (DHEW/NIOSH Pub. HSM 73-11000). Cincinnati, OH: National Institute for Occupational Safety and Health, 1972.
5.14 Coburn, R.F., chairman: Carbon Monoxide. Washington, DC: National Academy of Sciences,1977.
5.15 Proctor, N.H. and J.P. Hughes: Chemical Hazards of the Workplace. Philadelphia, PA: J.B.Lippincott Co., 1978. pp. 151-153.
5.16 Sax, N.I. and R.J. Lewis, Sr.: Hawley’s Condensed Chemical Dictionary. 11th ed. New York: VanNostrand Reinhold Co., 1987. pp. 221-222.
5.17 American Conference of Governmental Industrial Hygienists: Documentation of the Threshold LimitValues for Substances in Workroom Air. 3rd ed. Cincinnati, OH: American Conference ofGovernmental Industrial Hygienist, 1971. pp. 41-43.
5.18 Ellenhorn, M.J., and D.G. Barceloux: Medical Toxicology. New York, NY: Elsevier SciencePublishing Co., Inc., 1988. p. 821.
5.19 Lee, H.K., T.A. McKenna, L.N. Renton, and J. Kirbride: Impact of a New Smoking Policy on OfficeAir Quality. In Indoor Air Quality in Cold Climates: Hazards and Abatement Measures, edited byD.S. Walkinshaw. Pittsburgh PA: Air Pollution Control Association. pp. 307-322. (NIOSH-00172085).
5.20 Leaderer, B.P., W.S. Cain, R. Isseroff, and L.G. Berglung: Ventilation Requirements in Buildings. II. Particulate Matter and Carbon Monoxide from Cigarette Smoking. Atmospheric Environment 18,No. 1: 99-106 (1984). (NIOSH-00137853).
5.21 Mandel, J.: Accuracy and Precision, Evaluation and Interpretation of Analytical Results, TheTreatment of Outliers. In Treatise On Analytical Chemistry. 2nd ed., Vol. 1, edited by I.M. Kolthoffand P.J. Elving. New York, NY: John Wiley and Sons, 1978. pp. 282-285.
5.22 National Institute for Occupational Safety and Health: Documentation of the NIOSH Validation Testsby D. Taylor, R. Kupel and J. Bryant (DHEW/NIOSH Pub. No. 77-185). Cincinnati, OH: NationalInstitute for Occupational Safety and Health, 1977. pp. 1-12.
5.23 Occupational Safety and Health Administration Salt Lake Technical Center: OSHA AnalyticalMethods Manual. Vol. III (USDOL/OSHA-SLTC Method Validation Guidelines). Cincinnati, OH:American Conference of Governmental Industrial Hygienists (Pub. No. ISBN: 0-936712-66-X), 1985.
16 of 26 T-ID210-FV-01-9103-M

5.24 Grant, G.A., M. Katz, and R.L. Haines: A Modified Iodine Pentoxide Method for the Determinationof Carbon Monoxide. Can. J. of Technol. 29: 43-51 (1951).
5.25 Skoog, D.A. and D.M. West: Analytical Chemistry: an Introduction. 4th ed. Philadelphia, PA: Saunders College Publishing, 1986. pp. 591-594.
5.26 Long, G.L. and J.D. Winefordner: Limit of Detection — A Closer Look at the IUPAC Definition. Anal. Chem. 55: 712A-724A (1983)
17 of 26 T-ID210-FV-01-9103-M
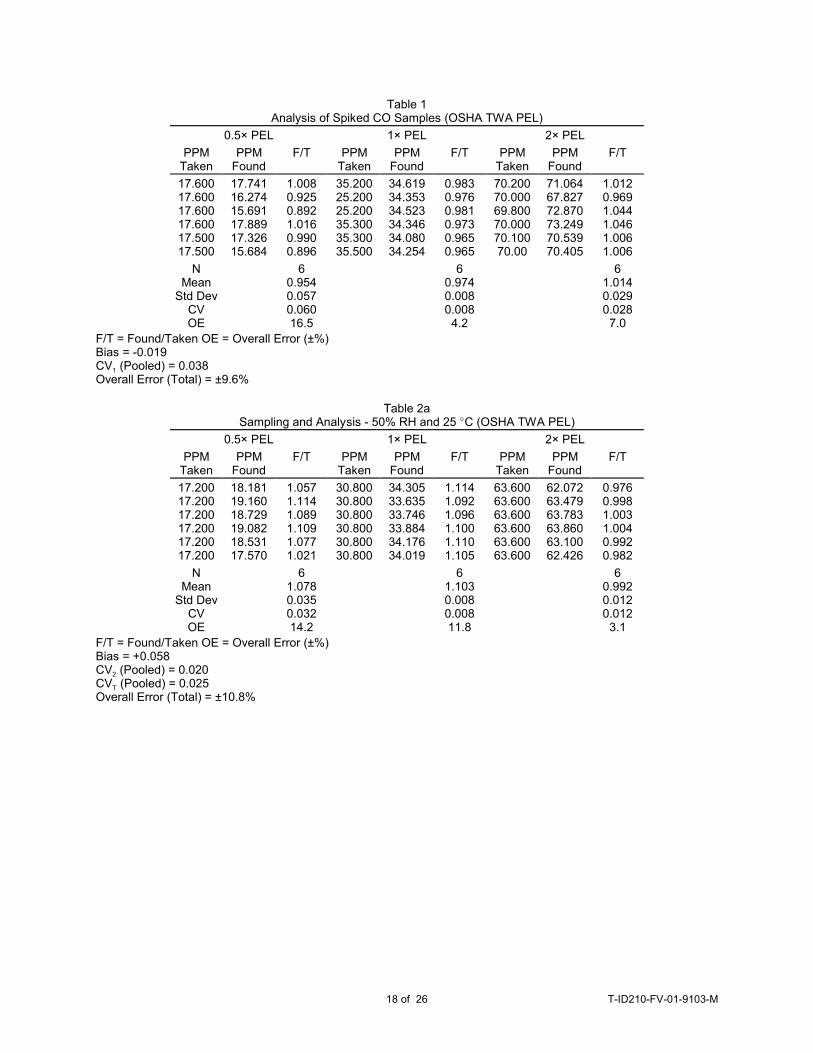
Table 1Analysis of Spiked CO Samples (OSHA TWA PEL)
0.5× PEL 1× PEL 2× PEL
PPMTaken
PPMFound
F/T PPMTaken
PPMFound
F/T PPMTaken
PPMFound
F/T
17.60017.60017.60017.60017.50017.500
17.74116.27415.69117.88917.32615.684
1.0080.9250.8921.0160.9900.896
35.20025.20025.20035.30035.30035.500
34.61934.35334.52334.34634.08034.254
0.9830.9760.9810.9730.9650.965
70.20070.00069.80070.00070.10070.00
71.06467.82772.87073.24970.53970.405
1.0120.9691.0441.0461.0061.006
NMean
Std DevCVOE
60.9540.0570.06016.5
60.9740.0080.008
4.2
61.0140.0290.028
7.0
F/T = Found/Taken OE = Overall Error (±%)Bias = -0.019CV1 (Pooled) = 0.038Overall Error (Total) = ±9.6%
Table 2aSampling and Analysis - 50% RH and 25 EC (OSHA TWA PEL)
0.5× PEL 1× PEL 2× PEL
PPMTaken
PPMFound
F/T PPMTaken
PPMFound
F/T PPMTaken
PPMFound
F/T
17.20017.20017.20017.20017.20017.200
18.18119.16018.72919.08218.53117.570
1.0571.1141.0891.1091.0771.021
30.80030.80030.80030.80030.80030.800
34.30533.63533.74633.88434.17634.019
1.1141.0921.0961.1001.1101.105
63.60063.60063.60063.60063.60063.600
62.07263.47963.78363.86063.10062.426
0.9760.9981.0031.0040.9920.982
NMean
Std DevCVOE
61.0780.0350.03214.2
61.1030.0080.00811.8
60.9920.0120.012
3.1
F/T = Found/Taken OE = Overall Error (±%)Bias = +0.058CV2 (Pooled) = 0.020CVT (Pooled) = 0.025Overall Error (Total) = ±10.8%
18 of 26 T-ID210-FV-01-9103-M
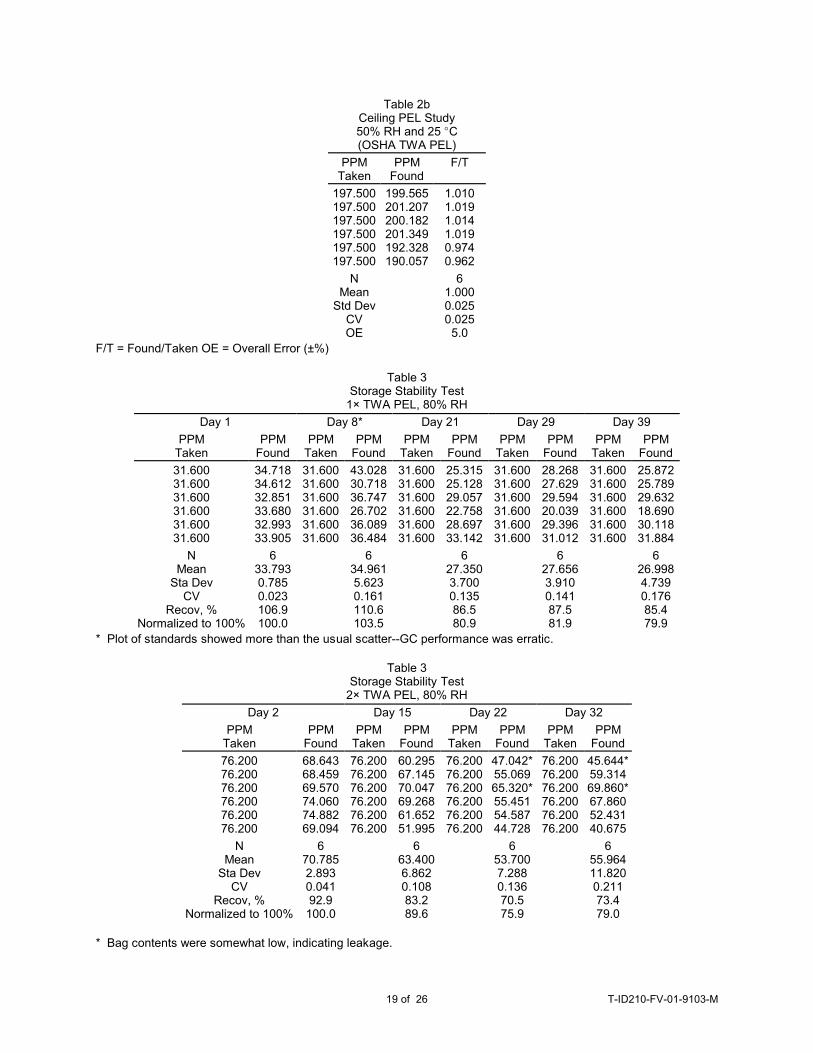
Table 2bCeiling PEL Study50% RH and 25 EC(OSHA TWA PEL)
PPMTaken
PPMFound
F/T
197.500197.500197.500197.500197.500197.500
199.565201.207200.182201.349192.328190.057
1.0101.0191.0141.0190.9740.962
NMean
Std DevCVOE
61.0000.0250.025
5.0
F/T = Found/Taken OE = Overall Error (±%)
Table 3Storage Stability Test
1× TWA PEL, 80% RH
Day 1 Day 8* Day 21 Day 29 Day 39
PPMTaken
PPMFound
PPMTaken
PPMFound
PPMTaken
PPMFound
PPMTaken
PPMFound
PPMTaken
PPMFound
31.60031.60031.60031.60031.60031.600
34.71834.61232.85133.68032.99333.905
31.60031.60031.60031.60031.60031.600
43.02830.71836.74726.70236.08936.484
31.60031.60031.60031.60031.60031.600
25.31525.12829.05722.75828.69733.142
31.60031.60031.60031.60031.60031.600
28.26827.62929.59420.03929.39631.012
31.60031.60031.60031.60031.60031.600
25.87225.78929.63218.69030.11831.884
NMean
Sta DevCV
Recov, %Normalized to 100%
633.7930.7850.023106.9100.0
634.9615.6230.161110.6103.5
627.3503.7000.13586.580.9
627.6563.9100.14187.581.9
626.9984.7390.17685.479.9
* Plot of standards showed more than the usual scatter--GC performance was erratic.
Table 3Storage Stability Test
2× TWA PEL, 80% RH
Day 2 Day 15 Day 22 Day 32
PPMTaken
PPMFound
PPMTaken
PPMFound
PPMTaken
PPMFound
PPMTaken
PPMFound
76.20076.20076.20076.20076.20076.200
68.64368.45969.57074.06074.88269.094
76.20076.20076.20076.20076.20076.200
60.29567.14570.04769.26861.65251.995
76.20076.20076.20076.20076.20076.200
47.042*55.06965.320*55.45154.58744.728
76.20076.20076.20076.20076.20076.200
45.644*59.31469.860*67.86052.43140.675
NMean
Sta DevCV
Recov, %Normalized to 100%
670.7852.8930.04192.9
100.0
663.4006.8620.10883.289.6
653.7007.2880.13670.575.9
655.96411.8200.21173.479.0
* Bag contents were somewhat low, indicating leakage.
19 of 26 T-ID210-FV-01-9103-M
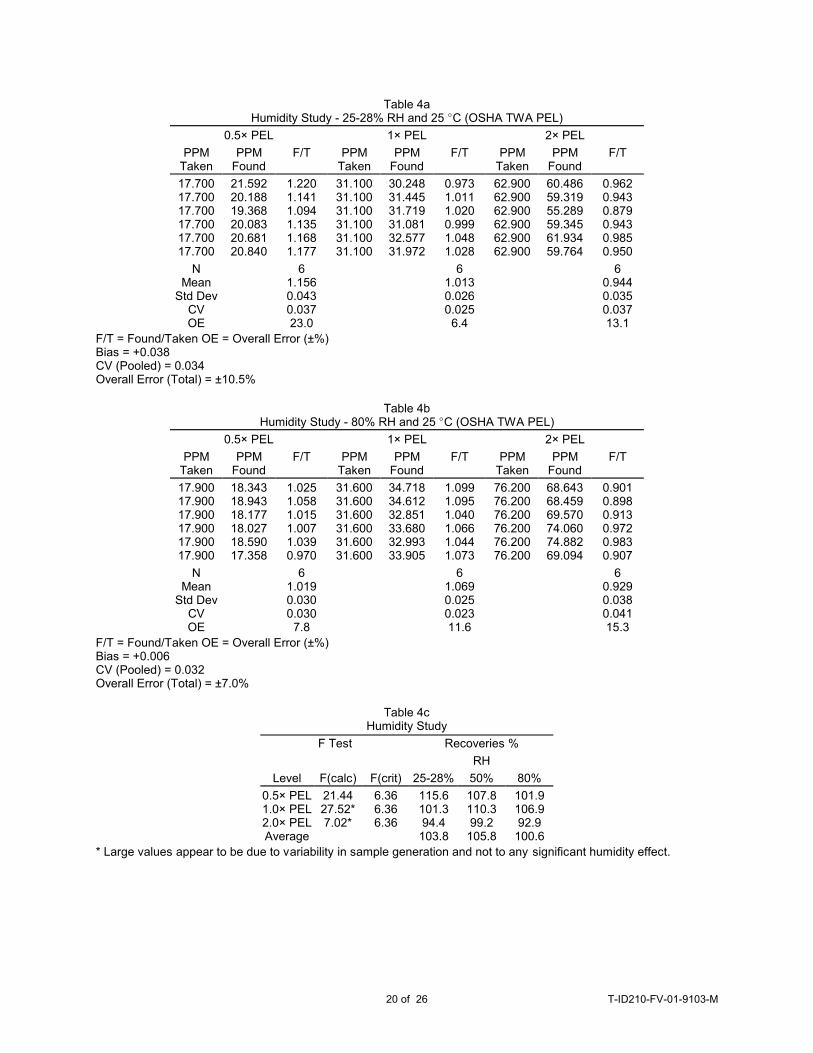
Table 4aHumidity Study - 25-28% RH and 25 EC (OSHA TWA PEL)
0.5× PEL 1× PEL 2× PEL
PPMTaken
PPMFound
F/T PPMTaken
PPMFound
F/T PPMTaken
PPMFound
F/T
17.70017.70017.70017.70017.70017.700
21.59220.18819.36820.08320.68120.840
1.2201.1411.0941.1351.1681.177
31.10031.10031.10031.10031.10031.100
30.24831.44531.71931.08132.57731.972
0.9731.0111.0200.9991.0481.028
62.90062.90062.90062.90062.90062.900
60.48659.31955.28959.34561.93459.764
0.9620.9430.8790.9430.9850.950
NMean
Std DevCVOE
61.1560.0430.03723.0
61.0130.0260.025
6.4
60.9440.0350.03713.1
F/T = Found/Taken OE = Overall Error (±%)Bias = +0.038CV (Pooled) = 0.034Overall Error (Total) = ±10.5%
Table 4bHumidity Study - 80% RH and 25 EC (OSHA TWA PEL)
0.5× PEL 1× PEL 2× PEL
PPMTaken
PPMFound
F/T PPMTaken
PPMFound
F/T PPMTaken
PPMFound
F/T
17.90017.90017.90017.90017.90017.900
18.34318.94318.17718.02718.59017.358
1.0251.0581.0151.0071.0390.970
31.60031.60031.60031.60031.60031.600
34.71834.61232.85133.68032.99333.905
1.0991.0951.0401.0661.0441.073
76.20076.20076.20076.20076.20076.200
68.64368.45969.57074.06074.88269.094
0.9010.8980.9130.9720.9830.907
NMean
Std DevCVOE
61.0190.0300.030
7.8
61.0690.0250.02311.6
60.9290.0380.04115.3
F/T = Found/Taken OE = Overall Error (±%)Bias = +0.006CV (Pooled) = 0.032Overall Error (Total) = ±7.0%
Table 4cHumidity Study
F Test Recoveries %
RH
Level F(calc) F(crit) 25-28% 50% 80%
0.5× PEL1.0× PEL2.0× PELAverage
21.4427.52*7.02*
6.366.366.36
115.6101.394.4
103.8
107.8110.399.2
105.8
101.9106.992.9
100.6
* Large values appear to be due to variability in sample generation and not to any significant humidity effect.
20 of 26 T-ID210-FV-01-9103-M
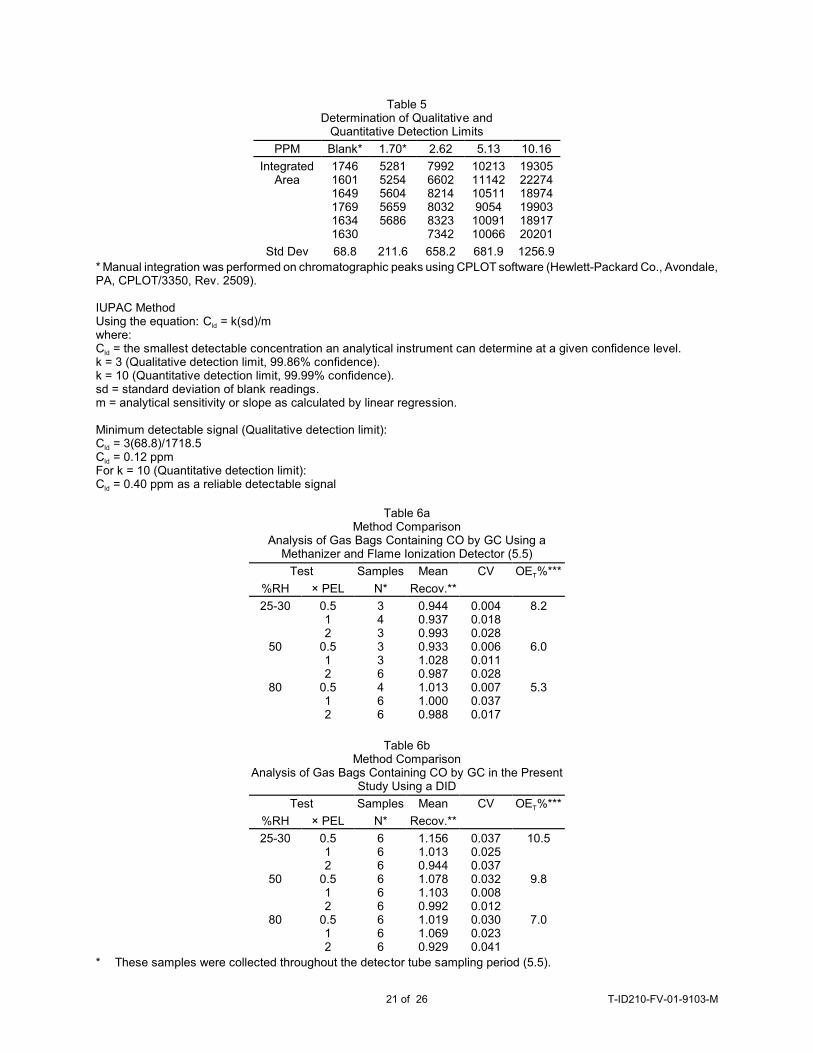
Table 5Determination of Qualitative and
Quantitative Detection Limits
PPM Blank* 1.70* 2.62 5.13 10.16
IntegratedArea
174616011649176916341630
52815254560456595686
799266028214803283237342
1021311142105119054
1009110066
193052227418974199031891720201
Std Dev 68.8 211.6 658.2 681.9 1256.9
* Manual integration was performed on chromatographic peaks using CPLOT software (Hewlett-Packard Co., Avondale,PA, CPLOT/3350, Rev. 2509).
IUPAC MethodUsing the equation: Cld = k(sd)/mwhere:Cld = the smallest detectable concentration an analytical instrument can determine at a given confidence level.k = 3 (Qualitative detection limit, 99.86% confidence).k = 10 (Quantitative detection limit, 99.99% confidence).sd = standard deviation of blank readings.m = analytical sensitivity or slope as calculated by linear regression.
Minimum detectable signal (Qualitative detection limit):Cld = 3(68.8)/1718.5Cld = 0.12 ppmFor k = 10 (Quantitative detection limit):Cld = 0.40 ppm as a reliable detectable signal
Table 6aMethod Comparison
Analysis of Gas Bags Containing CO by GC Using aMethanizer and Flame Ionization Detector (5.5)
Test Samples Mean CV OET%***
%RH × PEL N* Recov.**
25-30
50
80
0.512
0.512
0.512
343336466
0.9440.9370.9930.9331.0280.9871.0131.0000.988
0.0040.0180.0280.0060.0110.0280.0070.0370.017
8.2
6.0
5.3
Table 6bMethod Comparison
Analysis of Gas Bags Containing CO by GC in the PresentStudy Using a DID
Test Samples Mean CV OET%***
%RH × PEL N* Recov.**
25-30
50
80
0.512
0.512
0.512
666666666
1.1561.0130.9441.0781.1030.9921.0191.0690.929
0.0370.0250.0370.0320.0080.0120.0300.0230.041
10.5
9.8
7.0
* These samples were collected throughout the detector tube sampling period (5.5).
21 of 26 T-ID210-FV-01-9103-M
** Results were compared to standards prepared from 104-ppm CO in N2. Theoretical concentrations were based onthe blending of 0.50% CO in N2 with purified, humidified air during sample generation.
*** Note: OET% (Total Overall Error in %) is the pooled result of all three concentrations at one RH level.
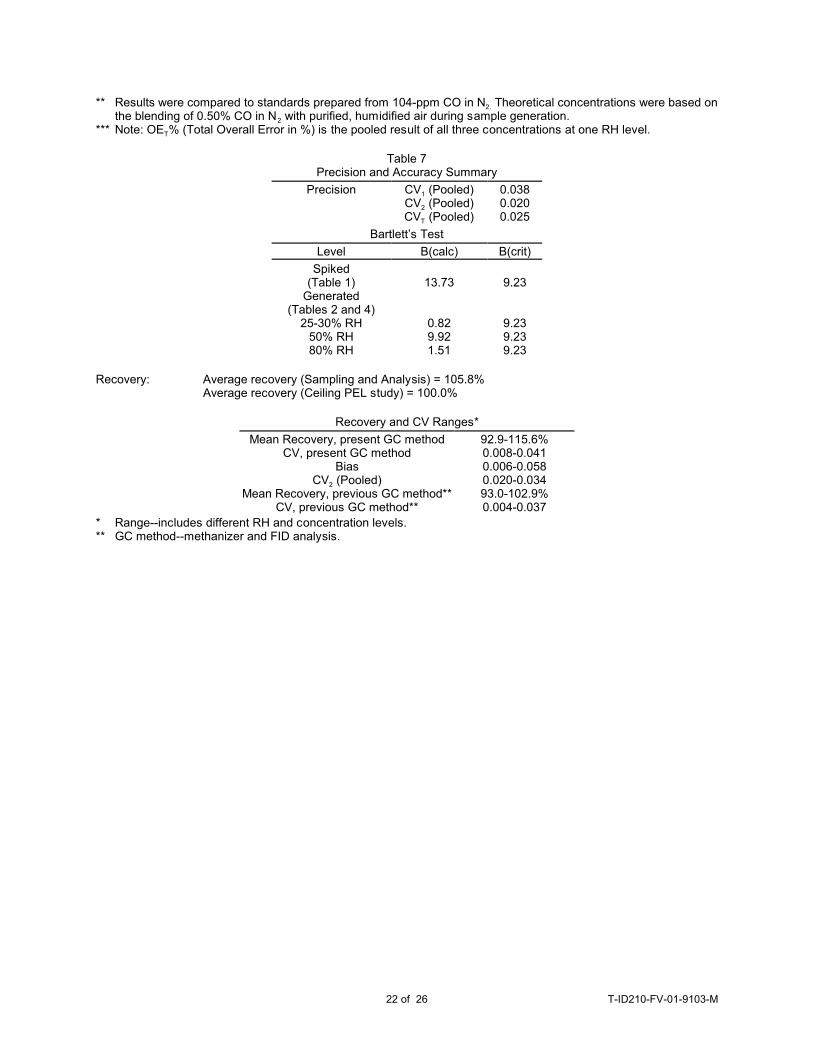
Table 7Precision and Accuracy Summary
Precision CV1 (Pooled)CV2 (Pooled)CVT (Pooled)
0.0380.0200.025
Bartlett’s Test
Level B(calc) B(crit)
Spiked(Table 1)
Generated(Tables 2 and 4)
25-30% RH50% RH80% RH
13.73
0.829.921.51
9.23
9.239.239.23
Recovery: Average recovery (Sampling and Analysis) = 105.8% Average recovery (Ceiling PEL study) = 100.0%
Recovery and CV Ranges*
Mean Recovery, present GC methodCV, present GC method
BiasCV2 (Pooled)
Mean Recovery, previous GC method**CV, previous GC method**
92.9-115.6%0.008-0.0410.006-0.0580.020-0.03493.0-102.9%0.004-0.037
* Range--includes different RH and concentration levels.** GC method--methanizer and FID analysis.
22 of 26 T-ID210-FV-01-9103-M
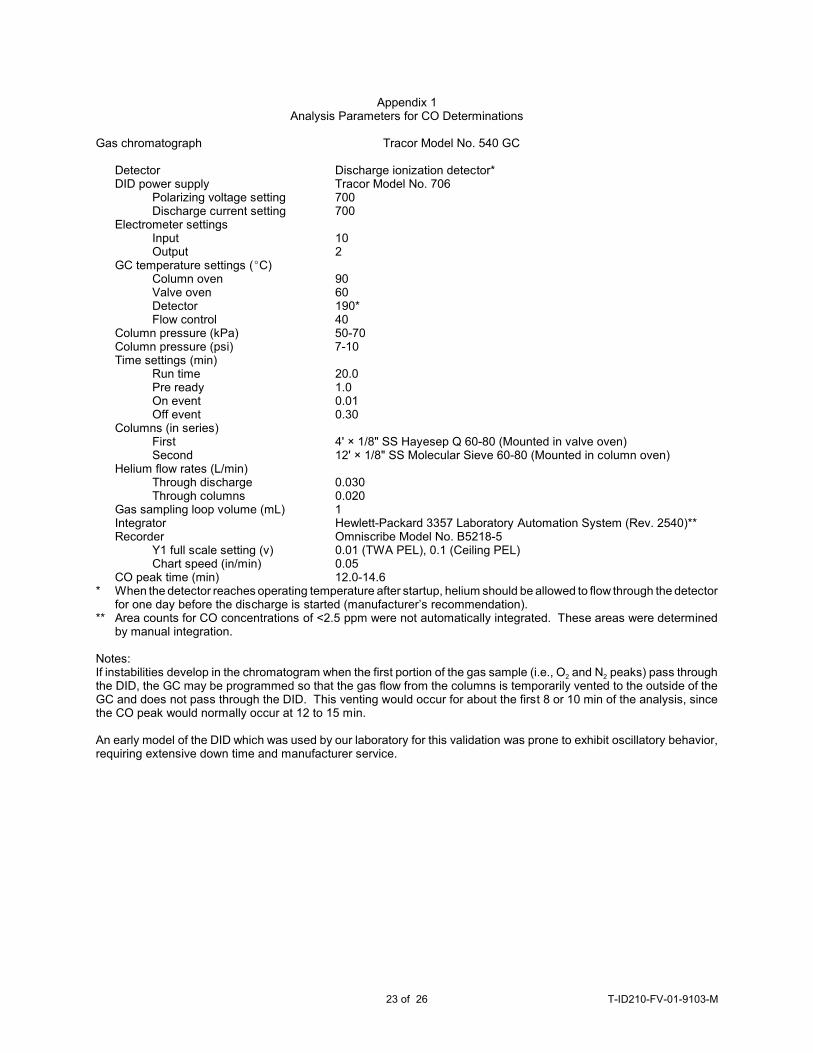
Appendix 1Analysis Parameters for CO Determinations
Gas chromatograph Tracor Model No. 540 GC
Detector Discharge ionization detector*DID power supply Tracor Model No. 706
Polarizing voltage setting 700Discharge current setting 700
Electrometer settingsInput 10Output 2
GC temperature settings (EC)Column oven 90Valve oven 60Detector 190*Flow control 40
Column pressure (kPa) 50-70Column pressure (psi) 7-10Time settings (min)
Run time 20.0Pre ready 1.0On event 0.01Off event 0.30
Columns (in series)First 4' × 1/8" SS Hayesep Q 60-80 (Mounted in valve oven)Second 12' × 1/8" SS Molecular Sieve 60-80 (Mounted in column oven)
Helium flow rates (L/min)Through discharge 0.030Through columns 0.020
Gas sampling loop volume (mL) 1Integrator Hewlett-Packard 3357 Laboratory Automation System (Rev. 2540)**Recorder Omniscribe Model No. B5218-5
Y1 full scale setting (v) 0.01 (TWA PEL), 0.1 (Ceiling PEL)Chart speed (in/min) 0.05
CO peak time (min) 12.0-14.6* When the detector reaches operating temperature after startup, helium should be allowed to flow through the detector
for one day before the discharge is started (manufacturer’s recommendation).** Area counts for CO concentrations of <2.5 ppm were not automatically integrated. These areas were determined
by manual integration.
Notes:If instabilities develop in the chromatogram when the first portion of the gas sample (i.e., O2 and N2 peaks) pass throughthe DID, the GC may be programmed so that the gas flow from the columns is temporarily vented to the outside of theGC and does not pass through the DID. This venting would occur for about the first 8 or 10 min of the analysis, sincethe CO peak would normally occur at 12 to 15 min.
An early model of the DID which was used by our laboratory for this validation was prone to exhibit oscillatory behavior,requiring extensive down time and manufacturer service.
23 of 26 T-ID210-FV-01-9103-M
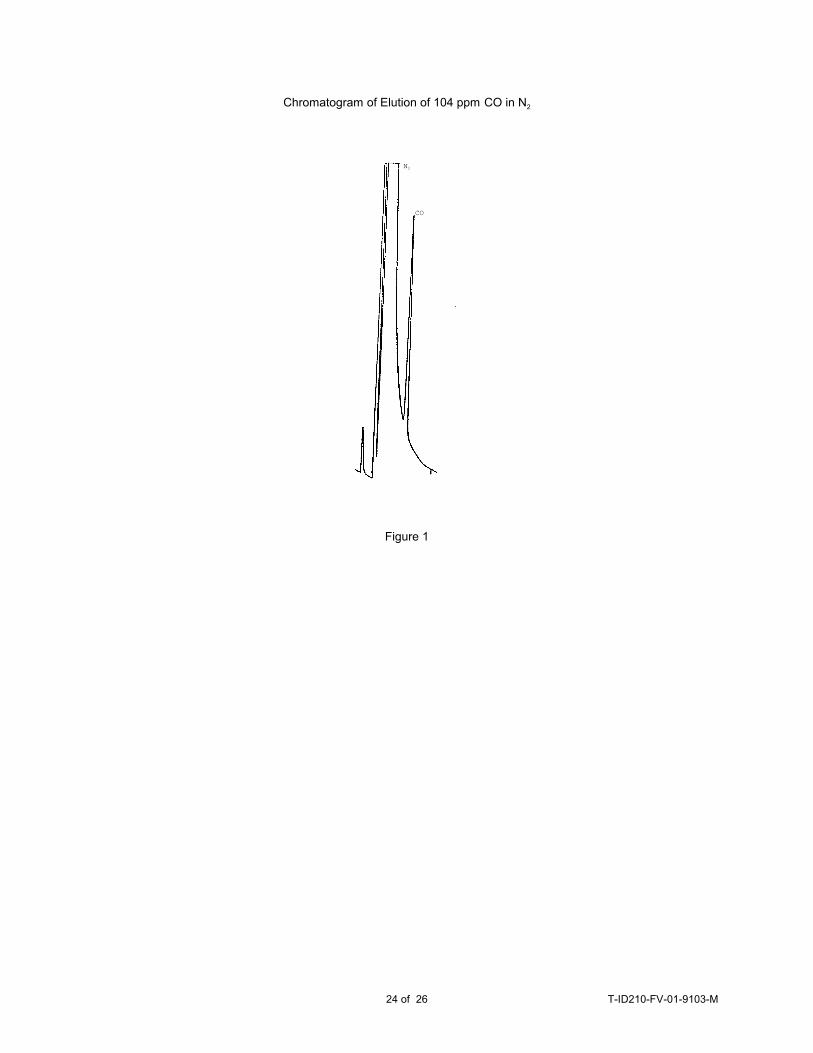
Chromatogram of Elution of 104 ppm CO in N2
Figure 1
24 of 26 T-ID210-FV-01-9103-M
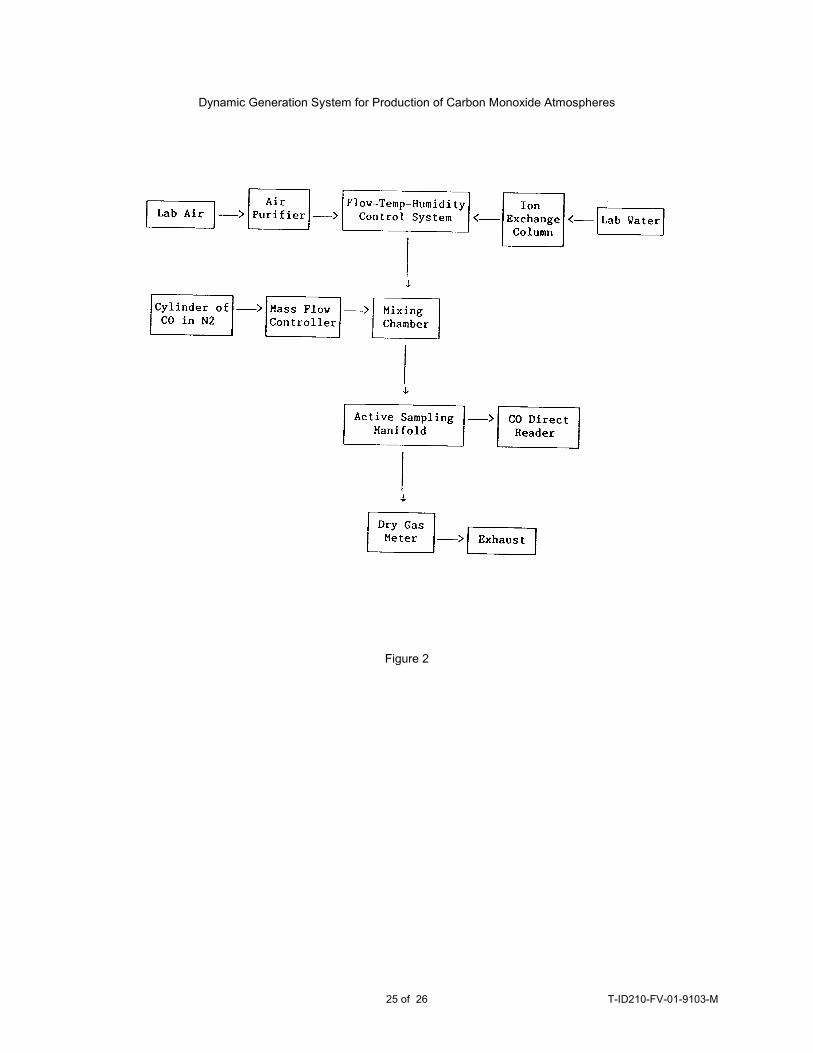
Dynamic Generation System for Production of Carbon Monoxide Atmospheres
Figure 2
25 of 26 T-ID210-FV-01-9103-M
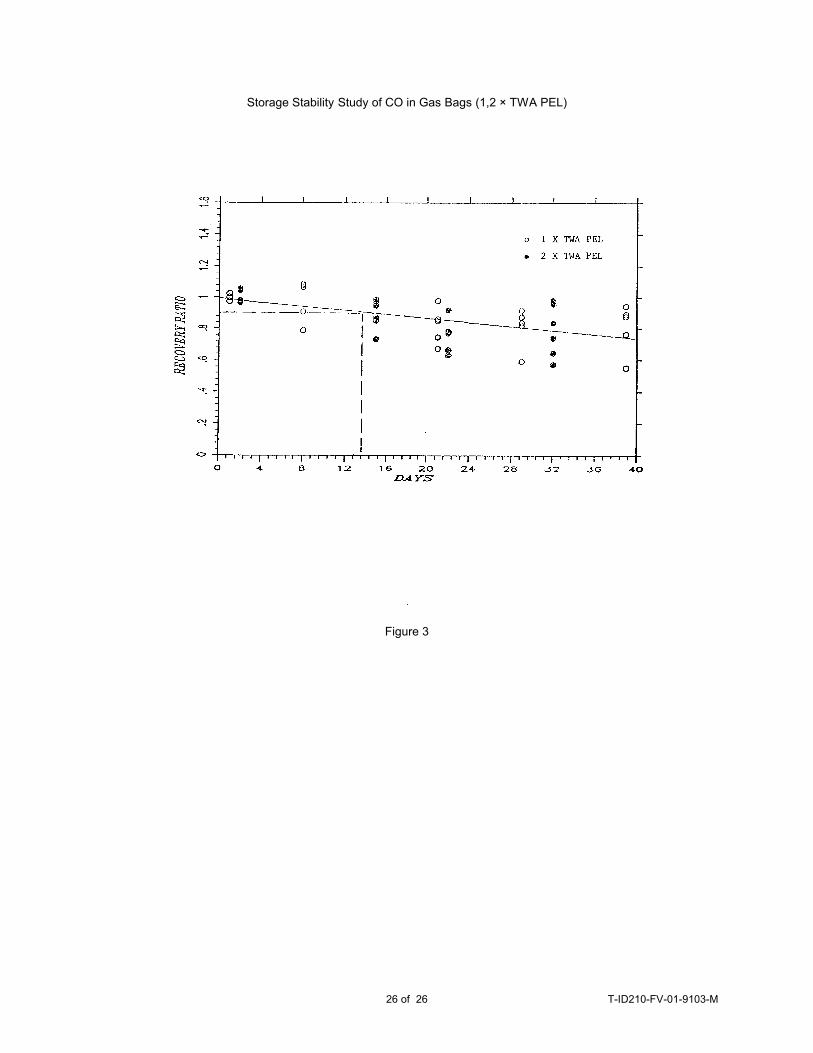
Storage Stability Study of CO in Gas Bags (1,2 × TWA PEL)
Figure 3
26 of 26 T-ID210-FV-01-9103-M