Embed Size (px)
Citation preview

Carbon neutral tea production in ChinaThree pilot case studies


Carbon neutral tea production in ChinaThree pilot case studies
Published bythe Food and Agriculture Organization of the United Nations
andthe Chinese Academy of Agricultural Sciences

Required citation:FAO and CAAS. 2021. Carbon neutral tea production in China – Three pilot case studies. Rome. https://doi.org/10.4060/cb4580en
The designations employed and the presentation of material in this information product do not imply the expression of any opinion whatsoever on the part of the Food and Agriculture Organization of the United Nations (FAO) or the Chinese Academy of Agricultural Sciences (CAAS) concerning the legal or development status of any country, territory, city or area or of its authorities, or concerning the delimitation of its frontiers or boundaries. The mention of specific companies or products of manufacturers, whether or not these have been patented, does not imply that these have been endorsed or recommended by FAO or CAAS in preference to others of a similar nature that are not mentioned.
The views expressed in this information product are those of the author(s) and do not necessarily reflect the views or policies of FAO or CAAS.
ISBN 978-92-5-134373-9 [FAO]© FAO, 2021
Some rights reserved. This work is made available under the Creative Commons Attribution-NonCommercial-ShareAlike 3.0 IGO licence (CC BY-NC-SA 3.0 IGO; https://creativecommons.org/licenses/by-nc-sa/3.0/igo/legalcode).
Under the terms of this licence, this work may be copied, redistributed and adapted for non-commercial purposes, provided that the work is appropriately cited. In any use of this work, there should be no suggestion that FAO endorses any specific organization, products or services. The use of the FAO logo is not permitted. If the work is adapted, then it must be licensed under the same or equivalent Creative Commons licence. If a translation of this work is created, it must include the following disclaimer along with the required citation: “This translation was not created by the Food and Agriculture Organization of the United Nations (FAO). FAO is not responsible for the content or accuracy of this translation. The original [Language] edition shall be the authoritative edition.”
Disputes arising under the licence that cannot be settled amicably will be resolved by mediation and arbitration as described in Article 8 of the licence except as otherwise provided herein. The applicable mediation rules will be the mediation rules of the World Intellectual Property Organization http://www.wipo.int/amc/en/mediation/rules and any arbitration will be conducted in accordance with the Arbitration Rules of the United Nations Commission on International Trade Law (UNCITRAL).
Third-party materials. Users wishing to reuse material from this work that is attributed to a third party, such as tables, figures or images, are responsible for determining whether permission is needed for that reuse and for obtaining permission from the copyright holder. The risk of claims resulting from infringement of any third-party-owned component in the work rests solely with the user.
Sales, rights and licensing. FAO information products are available on the FAO website (www.fao.org/publications) and can be purchased through [email protected]. Requests for commercial use should be submitted via: www.fao.org/contact-us/licence-request. Queries regarding rights and licensing should be submitted to: se a: [email protected].
Cover photograph: ©FAO/Yinlong XuBack photograph: ©FAO/Kuo Li

iii
ContentsForeword ......................................................................................................................................................................................................................................viiAcknowledgements ..............................................................................................................................................................................................viiiAcronyms ......................................................................................................................................................................................................................................ixSymbols and units . ..............................................................................................................................................................................................xExecutive summary ..............................................................................................................................................................................................xi
Introduction ...................................................................................................................................................................................................................1Rationale ......................................................................................................................................................................................................................................2
I. Tea in China: production model and climatic vulnerabilities .......................................................................4Climatic zoning of tea production in China ...................................................................................................................................7Impacts of climate change on tea production in China ...........................................................................................8Vulnerability of tea production to climate change ...............................................................................................................12
II. At the tea garden level: choosing three pilot case studies ......................................................................13Tea industry in the three pilot counties ..................................................................................................................................14Basic information about the three pilot tea gardens ..........................................................................................15Climate change challenges faced by the three pilot tea gardens ......................................................................17Vulnerability to climate change ..........................................................................................................................................................................20
III. Carbon neutral tea production: the how-to ...............................................................................................................21Securing tea production with adaptation measures ...........................................................................................21Mitigation measures for low carbon tea production in China .......................................................................26Increasing carbon sequestration and sinks ...................................................................................................................................26Reducing greenhouse gas emissions at farm-level ...............................................................................................................27Improving the tea garden’s ecological system ...............................................................................................................27Enhancing energy use efficiency .......................................................................................................................................................28Efficient use of water through digital innovation ...............................................................................................................31Offset measures for carbon neutral tea production ...............................................................................................................33
IV. Accounting GHG emissions in pilot tea gardens ...............................................................................................................34Scope of GHG emissions accounting .......................................................................................................................................................35Inventory data and assumptions .......................................................................................................................................................36
Data in cradle-to-retail stages .......................................................................................................................................................36Data in consumption stages .......................................................................................................................................................40
GHG emissions in the pilot tea gardens ...................................................................................................................................40Cradle-to-retail GHG emissions .......................................................................................................................................................40GHG emissions at the consumption stage ...................................................................................................................................41
Carbon sink in pilot tea gardens .......................................................................................................................................................41The field sampling for long-term carbon storage estimation .......................................................................41The carbon sink accounting from te a gardens ...............................................................................................................46
Net GHG emissions in the pilot tea gardens ...................................................................................................................................46Proposed offset measures for pilot tea gardens ...............................................................................................................47

iv
V. Certification and labelling ...........................................................................................................................................................................49Opportunities for certification ...........................................................................................................................................................................51Challenges for certification ...........................................................................................................................................................................51Recommendations to obtain certification ...................................................................................................................................52
VI. A way forward: achieving carbon neutral tea production .......................................................................54The added value of a carbon neutral tea value chain ...........................................................................................55Scalability .......................................................................................................................................................................................................................................56
VII. Final remarks ...................................................................................................................................................................................................................58Limitations of the Report ...............................................................................................................................................................................................59Suggestions and recommendations for policymakers ...........................................................................................60Insights for South-South Cooperation .......................................................................................................................................................61
Glossary .......................................................................................................................................................................................................................................62Annexes .......................................................................................................................................................................................................................................64References .......................................................................................................................................................................................................................................68

v
Figures
Figure ES 1. Intensity of GHG emissions from three pilot tea gardens at different stages of the value chain ............xiv
Figure ES 2. Intensity of GHG emissions, carbon sink and net emissions in three pilot tea gardens ............xiv
Figure ES 3. Conceptual pathway for carbon neutrality in tea production ........................................................................xv
Figure 1. The relationship between low carbon agriculture and carbon neutrality ........................................................................3.Figure 2. Economic tea zoning in Mainland China ....................................................................................................................................4
Figure 3. The cultivation area of tea in China and globally ................................................................................................................5
Figure 4. Tea yields in China and globally ........................................................................................................................................................6
Figure 5. Tea exports from China and globally ........................................................................................................................................................6
Figure 6. Four main climatic zones for tea cultivation in Mainland China ........................................................................7
Figure 7. Location of three pilot tea gardens in China: Dabu in Meizhou, Guangdong Province; Longquan and Songyang in Lishui, Zhejiang Province ................................................................................................................13
Figure 8. The trend of annual Tm, Tmax, Tmin, and the annual extreme daily Tmax and Tmin from 1970 to 2017 in the three pilot counties ........................................................................................................................................................18
Figure 9. Seasonal (spring, summer, and autumn) consecutive dry days (CDD) in the three pilot counties from 1971 to 2017 ................................................................................................................................................................................................19
Figure 10. Sprinkle irrigation and drip irrigation facilities in the three pilot tea gardens ...................................................24
Figure 11. Coloured sticky traps and solar insecticidal lamps in three pilot tea gardens ...................................................25
Figure 12. Automatic data collection Irrigation system ...................................................................................................................................31
Figure 13. Comparison of usual and trial tea gardens affected by heat damage in July 2017 ...............................31
Figure 14. Comparison of usual and trial tea gardens affected by frost damage in March 2018 ...............................32
Figure 15. The emission accounting framework for the life cycle of tea production ...................................................36
Figure 16. The activities of tea production in Songyang, Zhejiang province (8 August 2018) ...............................38
Figure 17. Intensity of GHG emissions from three pilot tea gardens at different stages of the value chain ............41
Figure 18. The distribution of samples of soil and biomass from tea gardens ........................................................................42
Figure 19. Tea plant sampling (field survey carried out in Dabu and Longquan, 4–8 August 2018) ................................43
Figure 20. Intensity of GHG emissions, carbon sink and net emissions in three pilot tea gardens ................................47
Figure 21. Percentage of carbon emissions for different production stages in three pilot tea gardens ............48
Figure 22. Conceptual pathway for carbon neutrality in tea production ............................................................................................54

vi
Tables
Table 1. Top 10 countries with the highest tea yields and exports in 2017 .........................................................................1
Table 2. Background information on the three pilot tea gardens .............................................................................................16
Table 3. Information about plucking and irrigation in three pilot tea gardens .........................................................................17
Table 4. Vulnerability of the three pilot tea gardens to climate change ............................................................................................20
Table 5. Adaptation measures adopted in China to protect tea from unpredicted temperature changes and drought ....................................................................................................................................................................................................................22
Table 6. Adaptation measures adopted in the three pilot tea gardens ............................................................................................23
Table 7. Measures for increasing carbon sequestration and sinks ............................................................................................26
Table 8. Measures and effects of GHG emissions reduction ................................................................................................................27
Table 9. Measures and effects of an improved ecological system ............................................................................................28
Table 10. Measures and effects of increased energy use efficiency ............................................................................................30
Table 11. Emission factors from tea production in three pilot gardens during cradle-to-retail stages ............37
Table 12. Emission factors at the tea consumption stage ................................................................................................................40
Table 13. Detailed information about tea trees in three pilot tea gardens ........................................................................45
Table 14. Detailed information of soil TOC in three pilot tea gardens ............................................................................................45
Table 15. Summary of certification schemes applied to tea production ........................................................................50
Table 16. Comparison of traditional and carbon neutral tea value chains ........................................................................55
Box 1. Carbon neutral and low carbon agriculture .....................................................................................................................................3
Box 2. FAO and low carbon certification and labelling .....................................................................................................................................53
Box 3. FAO’s Global Low Carbon Initiatives for Tea Production (GLI-TEA) .............................................................................................57

vii
ForewordClimate change is one of the greatest global challenges we face today, severely degrading agricultural productive capacities, and the natural resources and ecosystems on which they rely. It hits poorer communities the hardest, disproportionately affecting those most vulnerable and least able to adapt.
Agriculture and food security depend on climate action today more than ever before. As explained in the IPCC Special Report on Climate Change and Land (2019), the Agriculture, Forestry and Other Land Use (AFOLU) sector is responsible for about 25 percent of all greenhouse gas emissions, a part of which comes from food systems and agricultural value chains. Despite this, the agriculture sectors can be an important part of the solution to climate change through adaptation and mitigation efforts. In order to achieve the central goal of the Paris Agreement to stay “well below” two degrees Celsius above pre-industrial levels and to pursue efforts to limit the temperature increase even further to 1.5 °C, rethinking sustainable agriculture and GHG emissions is critical.
The Food and Agriculture Organization of the United Nations (FAO) has been making advances in low carbon and carbon neutral approaches for sustainable agricultural development, making use of potential synergies between climate mitigation and adaptation through innovative agricultural production systems and their value chains. As part of FAO’s Strategy on Climate Change, the Organization, along with its partners, is developing low carbon initiatives, based on emission reductions along entire agricultural value chains, with tea and its business model being the first commodity to be evaluated.
This report, with tea as central commodity, presents how research and technology development, monitoring and assessment, standards for production and new market schemes can lead to a new approach to sustainable food and agriculture systems. The tea industry and its value chain generate about 15 to 19 kg of CO2eq for each kilogram of tea produced, attributable to several sources, including fertilizers applied to soils, the production of pesticides and herbicides, electricity used for irrigation and processing, as well as fossil fuels used in transport. At the same time, tea is vulnerable to the effects of climate change, particularly to extreme temperature events and changes in rainfall patterns.
As the largest producer and consumer of tea in the world, China is collaborating with FAO to develop an overall framework and minimum standards for sustainable tea production. This report, developed in collaboration with the Chinese Academy of Agricultural Sciences (CAAS), assesses the potential of low carbon and carbon neutral approaches to tea production.
Based on the lessons learned from this study, FAO expects to transfer and exchange knowledge through South-South Cooperation with other tea-producing countries. The development of low carbon tea production in Kenya, the world’s largest tea exporter, will be the first initiative. It aims to lay the groundwork to standardize this approach and to upscale it regionally and globally, while building a tea sector that reduces its environmental impact and is more resilient to climate change.
Furthermore, the experiences of this pilot study will demonstrate the advantages of low carbon approaches to the private sector, including cost saving due to efficiency, lower capital costs, improved public and private sector partnerships, as well as higher price premiums. Successful cases of low carbon approaches, shared among stakeholders, can then address climate change along agricultural value chains, to develop further low carbon and carbon neutral markets.
As we re-shape and build new food systems to feed the future, decisive climate action will be our defining challenge. Whether producer or consumer, from farmer to policymaker, in rural or urban contexts – we are all stewards of the natural resources and ecosystems that sustain us. United in action, we can become resilient.
René Castro SalazarAssistant Director-General
Food and Agriculture Organization of the United Nations

viii
AcknowledgementsThis report is an output of a pioneering project by the Climate Change Team of the Institute of Environment and Sustainable Development in Agriculture of the Chinese Academy of Agriculture Sciences (IEDA, CAAS), supported by the Department of International Cooperation of CAAS. The pilot project on carbon neutral tea production in China was financially supported by the Office of Climate Change, Biodiversity and Environment (OCB) of the Food and Agriculture Organization of the United Nations (FAO), who piloted a methodology for accounting greenhouse gas (GHG) emissions from tea production in specific tea gardens in Zhejiang and Guangdong provinces.
We wish to acknowledge the following persons and institutions for their contributions to the report:Coordinating lead author: Yinlong XuLead authors: Kuo Li, Xin Ma, Yingchun Li, Xinyue Zhang and Sergio A. ZelayaContributing authors: Xinhua Li, Lei Zhang, Yuncheng Zhao, Jiliang Ma, Lucas Amorelli Ribeiro Kornexl, Paula Casamayor, Carolin Busch, Karem del Castillo, Wenyan Han, Peng Yan, Xin Li, Qiang Xiao and Liping ZhangTranslation, proofreading and layout: Mingzhou Shen, Christabel Clark, Raissa D’uffizi, Karem del Castillo and Alexandro Maria RuoccoEditors: Karem del Castillo and Lucas Amorelli Ribeiro Kornexl
Several colleagues contributed to the report, including Vanda Ferreira dos Santos, Mingzhou Shen, Kristof Horvath, Karla Pita Vidal and Jean Luc Mastaki from FAO’s Intergovernmental Group (IGG) on Tea.
Special thanks go to the CAAS advisory group composed of Yukun Liu, Erda Lin, and Yu’e Li from IEDA, CAAS.
Sincere thanks also go to the owners of the pilot tea gardens: Kaida Tea Farm in Dabu; Fengyangchun Tea Farm in Longquan, and Xuefengyunjian Tea Farm in Songyang, for their support and contributions. Acknowledgment goes to the Development and Reform Bureau of Songyang County, and the Development and Reform Bureau of Lishui City, for their help in coordinating and implementing the project. Special thanks to Kebai Sciences Inc. in Beijing for sharing their technical working experience on field experiment related to Big Data and IoT (Internet of Things) in Songyang County, Lishui, Zhejiang province.
ix
Acronyms
ALD Activity level data
CAAS Chinese Academy of Agricultural Science
FAO Food and Agriculture Organization of the United Nations
GHG Greenhouse gases
GIZ German Corporation for International Cooperation GmbH
IEDA Institute of Environment and Sustainable Development in Agriculture
IFOAM International Federation of Organic Agricultural Movements
IoT Internet of Things
IPCC Intergovernmental Panel on Climate Change
ITC International Tea Committee
LC/CN Low carbon/Carbon neutral
LCA Life cycle assessment
NDC Nationally Determined Contributions
NDRC National Development and Reform Commission of the People’s Republic of China
OTRDC Chinese Organic Tea Research and Development Center
PAS Publicly Available Specification
SDG Sustainable Development Goals
TRI Tea Research Institute
UNFCCC United Nations Framework Convention on Climate Change

x
CDD Consecutive dry days
CH4 Methane
CNY Chinese Yuan
CO2eq Carbon dioxide equivalent
CO2 Carbon dioxide
g Gram
GWP Global Warming Potential
ha Hectare
kg Kilogram
km Kilometre
KWh Kilowatt hour
m Meter
MJ Megajoule
ml Millilitre
MWh Megawatt hour
MAP Mean annual precipitation
masl Meters above sea level
MAT Mean annual temperature
N Nitrogen
N2O Nitrous oxide
NPK Nitrogen (N), Phosphorus (P) and Potassium (K)
ppbv Parts per billion by volume
ppmv Parts per million by volume
SOC Soil Organic Carbon
Tmax Maximum temperature
Tm Mean temperature
Tmin Minimum temperature
TOC Total Organic Carbon
Symbols and units

xi
This report presents the first results of the pioneering project ‘Carbon neutral tea production in China’, for which three tea gardens in Dabu (Guangdong Province) and Longquan and Songyang (Zhejiang Province) were chosen as pilot gardens to carry out greenhouse gas (GHG) accounting and to analyse opportunities for mitigation to present a pathway to carbon neutrality for tea production.
The report first introduces China’s tea production and trading status, reviewing the impacts of climate change on Chinese tea production, and summarizing adaptation and mitigation measures taken to address climate change challenges. It then presents a life cycle assessment (LCA) methodology for accounting GHG emissions in the three pilot areas, from cultivation to consumption, which provides the scientific basis for potentially feasible offset measures. This is a first step towards carbon neutral minimum standards for tea production that will potentially lead to carbon neutral certification.
Emissions from the tea value chain: key findings
Pioneering investigation was carried out to develop the LCA methodology for accounting the cradle-to-consumption GHG emissions in the pilot tea gardens. The initial step was to determine how to collect the primary data on the level of activity through structured questionnaires and soil and biomass sampling for carbon sink estimation. Secondary data on emission factors was collected from a literature review and the International Panel on Climate Change (IPCC) guidelines.
Carbon emissions intensity for the tea value chain differs at each processing step from cradle to consumption (Figure ES 1). Changes in net cradle-to-retail GHG emissions showed great potential for accomplishing carbon neutrality in the tea value chain; estimated at 4.47 kg of CO2eq/kg in Dabu, 4.12 kg of CO2eq/kg in Longquan, and 7.75 kg of CO2eq/kg in Songyang (Figure ES 2).
Executive summary

xii
Figure ES 2. Intensity of GHG emissions, carbon sink and net emissions in three pilot tea gardens
o
2
4
6
8
10
Dabu Longquan Songyang -4
-2
Dabu Longquan Songyang
Inte
nsi
ty k
g o
f C
O2
eq
/kg
o
1
2
3
4
5
6
7
8
Cultivation Processing Storage and Packaging Transportation
Dabu Longquan Songyang
Inte
nsi
ty k
g o
f C
O2
eq
/kg
Figure ES 1. Intensity of GHG emissions from three pilot tea gardens at different stages of the value chain

xiii
A conceptual pathway for carbon neutral tea production
The main purpose of the low carbon agriculture approach is to increase food and agricultural systems’ productivity and farmers’ income, while creating climate change adaptation and mitigation synergies. Based on the pilot investigation made, we propose a conceptual pathway to achieving carbon neutrality (Figure ES 3) through three steps.
First, accounting the GHG emissions of the tea value chain; second, taking intensive adaptation and mitigation measures for low carbon tea production, with insetting and offsetting measures; and third, adopting carbon neutral tea products for added value.
Transition point
Tea productivity
Mitigation
Adaptation
Productivity
Intensified low carbonpathway
Trend of business-as-usual low carbon pathway
Trend of business-as-usual adaptation measures
Trend of business-as-usual productivity
Added value of carbonneutrality
Intensive adaptation measures
Synergy of adaptation and mitigation
Intensive mitigation measures
Offset measures
Figure ES 3. Conceptual pathway for carbon neutrality in tea production
There are many opportunities for policymaking, technology development, financing mechanisms, and institutional innovations along this pathway to support, scale up, and ensure resilient tea value chains.

xiv
Recommendations for policy makers
To facilitate the success and scalability of low carbon and carbon neutral tea value chains, it is necessary to:• Promote technological innovations and low carbon practices in tea production systems at
national and international level.• Ensure institutional support for knowledge sharing and exchange within and between tea
producing countries.• Further disseminate the concept of carbon neutrality and support options to encourage
this type of product to be consumed.• Carry out certification schemes for carbon neutral tea products to help increase the quality
of tea and introduce carbon-related labelling in the tea industry.• Diversify the tea value chain to increase added value.• Establish a new cost-sharing financial mechanism that enables the consumer to pay for
carbon neutral tea products.
Supporting South-South and Triangular Cooperation
Setting up a permanent experiment and demonstration plots could greatly benefit the development of South-South and Triangular Cooperation in the framework of FAO, for international knowledge sharing and to support the development of guidelines and a methodology for carbon neutral tea production.
A complete system to collect preliminary data on climatic conditions, tea growth and productivity, biomass production, tea garden inputs, energy consumption for tea field management and processing, as well as trading and marketing records for the carbon emissions accounting, could present a rationale for carbon neutrality, a way of reviewing the status of greenhouse gas emissions and reductions, and demonstrating the principle of carbon neutral tea production.
The creation of a carbon neutral tea platform would support the organization and development of activities for capacity development to help countries to foster their own low carbon development strategies and incorporate plans for carbon neutral tea into strategic development objectives, such as poverty alleviation and green economy.

1
Tea is the most widely consumed beverage in the world, with a dramatic rise in the past two decades (Chang 2015). The global tea production was 5.68 million tonnes in 2017, a 124 percent increase compared to the 2.53 million tonnes produced in 1995. The global tea planting area increased accordingly by 143 percent from 2.28 million ha in 1995 to 5.54 million ha in 2017 (ITC 2018).
Tea is a major cash crop in many developing countries such as China, India, Sri Lanka, Indonesia, Viet Nam, Kenya, Rwanda, Burundi, Uganda, Malawi, and Tanzania (Table 1). According to the market forecast, tea plantations will expand further due to their high economic value, especially in Eastern and Southern Africa (Chang 2015; FAO 2018a).
Table 1. Top 10 countries with the highest tea yields and exports in 2017
Tea yieldCountry
China (mainland)
Yield (tonnes) Global share (%) Country Export (tonnes) Global share (%)
Trade
India
Kenya
Sri Lanka
Indonesia
Turkey
Argentina
Bangladesh
Japan
Viet Nam
2 550 000
1 278 830
439 858
307 080
124 500
102 447
82 000
78 949
77 000
172 000
44.8
22.5
7.7
5.4
2.2
1.8
1.4
1.4
1.4
3.0
Kenya
China (mainland)
Sri Lanka
India
Argentina
Indonesia
Uganda
Malawi
Tanzania
Viet Nam
415 715
355 258
278 195
240 680
76 600
55 000
45000
29 290
27 512
134 000
23.4
20.0
15.6
13.5
4.3
3.1
2.5
1.6
1.5
7.5
Following the cultivation of tea plants and the harvest of fresh leaves, tea processing includes primary packaging, transportation, storage, distribution, and retail. In some cases, the tea value chain is extended, including other services, such as ecotourism, due to its leisure potential and cultural dimension. Overall, the tea industry is considered to have a high energy consumption.
It is estimated that agriculture accounts for about 20 to 24 percent of total GHG emissions globally (FAO 2017). Global warming has become a great challenge for sustainable development due to intensive human activities over the past decades. An Intergovernmental Panel on Climate Change scientific report (IPCC 2013) showed that GHG concentrations reached 393.1 ppmv of CO2, 1 819 ppbv of CH4 and 325.1 ppbv of N2O in 2012, an increase by 41%, 160% and 20% respectively, compared to the pre-industrial era. The global mean surface temperature increased by 0.85 °C between 1880 and 2012. Strict measures must be taken to meet the Paris Agreement’s global mitigation goals to keep the global warming within 2 °C above pre-industrial levels and to keep temperature increase within 1.5 °C.
Introduction
Source: ITC, 2018.

2 Carbon neutral tea production in China - Three pilot case studies
The 24th Session of the Conference of the Parties to the United Nations Framework Convention on Climate Change (COP24) in Katowice in December 2018 set additional guidelines and regulations for the implementation of the Paris Agreement, including stricter rules for transparency and communication on the implementation of Nationally Determined Contributions (NDCs) and other climate change adaptation actions (UNFCCC 2019). It has been proposed that global carbon neutrality should be achieved before 2050.
China’s total GHG emissions in 2012, excluding land use change and forestry, reached 11 896 MtCO2eq, with agricultural sources contributing to 7.9 percent (NDRC 2016a). To achieve China’s NDC submitted to the UNFCCC Secretariat, action should be taken to explore pathways to carbon neutral agricultural practices in the country. A case study on carbon neutrality could be a reference for other crops and other developing countries.
Rationale
This report presents a carbon neutral tea methodology based on best practices from three pilot tea gardens in China. By using a mixed method of primary and secondary sources and insights from the Chinese Academy of Agricultural Sciences (CAAS) and FAO, the report estimates emissions from each stage of the tea value chain and their mitigation potential, thus presenting a guide for carbon neutral tea production that can be replicated and scaled up.
The first section describes how tea is produced in China. It reviews the impacts of climate change on tea gardens in the country and the main vulnerabilities of tea production to climate change.
The following section presents information of the three pilot tea gardens that were analysed and identifies possible ways to achieve carbon neutrality by evaluating mitigation opportunities within the tea value chain, including energy consumption and efficiency, sustainable practices and offsetting measures.
Section three reviews the primary and secondary data collected and analysed, and constructs a methodology for accounting the GHG emissions from tea production by using the life cycle analysis (LCA) methodology described in Publicly Available Specification (PAS) 2050 (BSI 2008). Based on this approach, the report briefly discusses low carbon and carbon neutral (LC/CN) certification and labelling for tea, by first reviewing the tea certification schemes that currently exist, and identifying some of the opportunities and challenges when developing a LC/CN certification for tea.
The report concludes with key findings, describing the limitations of the document and highlighting recommendations for practitioners and policy makers, including FAO’s South-South and Triangular Cooperation scheme.

3Introduction
Box 1. Carbon neutral and low carbon agricultureLow carbon and carbon neutral (LC/CN) agriculture is an innovative approach for sustainable development that makes use of potential synergies between climate change mitigation and adaptation through improved agricultural production systems. In recent years, FAO has been developing the groundwork for this integrated and holistic approach that can contribute to the simultaneous achievement of several Sustainable Development Goals.
Carbon neutrality is based on offsetting measures that balance the GHG emissions during food and agricultural production, eventually leading to a net-zero carbon footprint. The low carbon approach focuses on mitigating climate change throughout a product’s value chain, providing adaptation co-benefits and addressing other Sustainable Development Goals (FAO 2017), such as ending hunger and alleviating poverty. The vision of low carbon agriculture is to support best practices that integrate climate action, not necessarily focusing on the net emissions, but on the way in which it strengthens agricultural livelihoods, while mitigating climate change and achieving sustainable use of natural resources. Nonetheless, low carbon approaches tend to lead to carbon neutrality over time.
Figure 1. The relationship between low carbon agriculture and carbon neutrality
Low carbonagriculture
Carbon neutral agriculture
GHG emissions
Carbon sink
Biodiversity
Poverty
Food security
Adaptation
Added value
Intensifiedmitigation measures
NET GHG emissions
GHG reduction
COremoval
2
Low carbonmeasures = 0
Offsetmeasures
Low carbon and carbon neutral approaches involve addressing sustainable production practices, agroforestry, offsetting measure, technology transfer, increase of energy efficiency, and capacity development to deliver a sustainable food production and ensure food security.
4
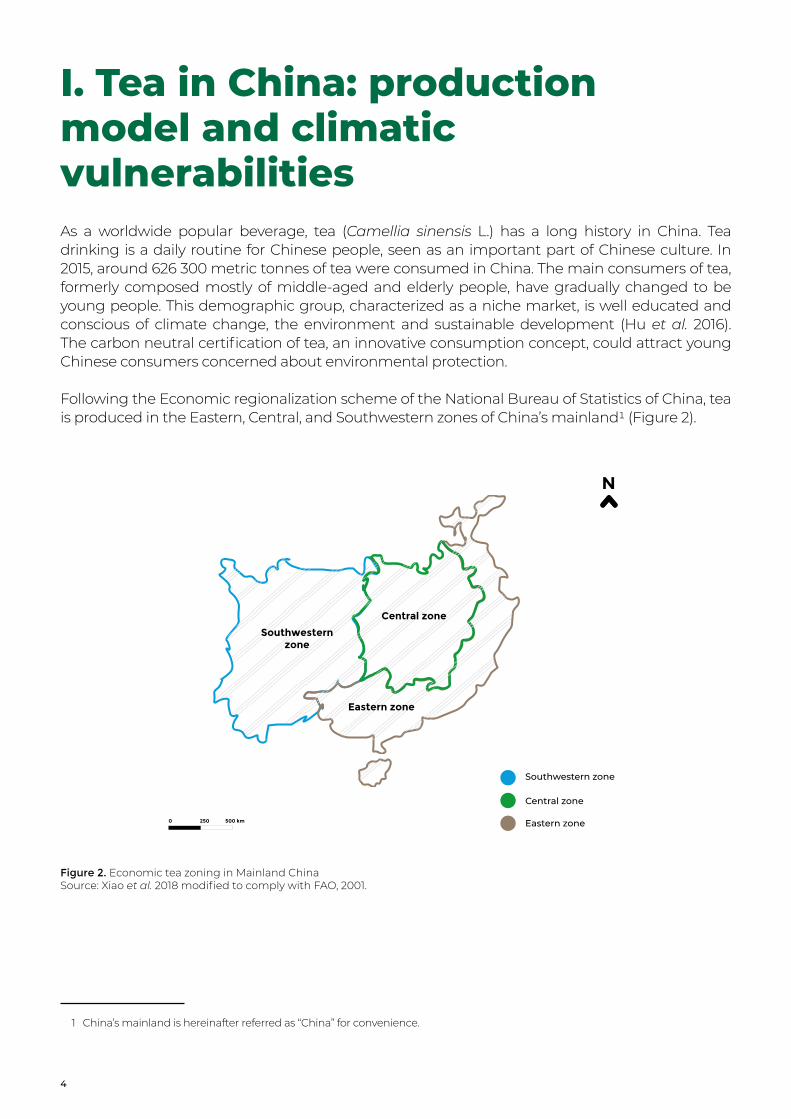
I. Tea in China: production model and climatic vulnerabilitiesAs a worldwide popular beverage, tea (Camellia sinensis L.) has a long history in China. Tea drinking is a daily routine for Chinese people, seen as an important part of Chinese culture. In 2015, around 626 300 metric tonnes of tea were consumed in China. The main consumers of tea, formerly composed mostly of middle-aged and elderly people, have gradually changed to be young people. This demographic group, characterized as a niche market, is well educated and conscious of climate change, the environment and sustainable development (Hu et al. 2016). The carbon neutral certification of tea, an innovative consumption concept, could attract young Chinese consumers concerned about environmental protection.
Following the Economic regionalization scheme of the National Bureau of Statistics of China, tea is produced in the Eastern, Central, and Southwestern zones of China’s mainland1 (Figure 2).
N
Southwestern zone
Central zone
Eastern zone
0 250 500 km
Southwestern zone
Central zone
Eastern zone
Figure 2. Economic tea zoning in Mainland ChinaSource: Xiao et al. 2018 modified to comply with FAO, 2001.
1 China’s mainland is hereinafter referred as “China” for convenience.

5I. Tea in China: production model and climatic vulnerabilities
The Eastern zone is the most economically developed region in China, with a rich tea culture and a high demand for tea production. Tea trees originate from the Southwestern zone that has a favourable climate and soil conditions for tea cultivation (Yang 2005). Labour and land costs are also much lower here than in the Eastern zone, but the extensive management offsets these advantages, as there is an urgent need for technology, as well as human and financial capital to promote the development of the tea industry. The Central zone is seen as a transition area between the Eastern and Southwestern zones, with average social-economic conditions. Tea trees were first planted in this zone in the 1950s during a national project to expand the tea industry. Although this zone has a relatively short tea cultivation history, it has developed a large-scale tea industry and produced several nationally renowned, high-quality tea products (Wang et al. 2007).
The global tea plantation area is large and has been expanding in China over the past two decades (Figure 3), attributable to its rapid economic growth. The distribution pattern of tea production in China2 has gradually shifted from the economically advanced eastern region to the less developed western region (Yu 2018). Despite the advantageous conditions in the mountainous area in the western region, with abundant precipitation, moderate sunshine, and relatively high humidity, tea yield in this area is lower (Figure 4), mostly due to low productivity.
Tea cultivation area
400
300
200
100
0
199
3
199
4
199
5
199
6
199
7
199
8
199
9
20
00
20
01
20
02
20
03
20
04
20
05
20
06
20
07
20
08
20
09
20
10
20
11
20
12
20
13
20
14
100%
80%
60%
40%
20%
0%
China’s percentage to the globe ChinaGlobe
×104 ha
Figure 3. The cultivation area of tea in China and globallyData source: FAO, 2018a; National Bureau of Statistics, 2018.
2 All surface areas in the report have been converted to hectares. The traditional surface unit for tea production in China is called Mu, which equals 666 m2. One ha equals 15 Mu.

6 Carbon neutral tea production in China - Three pilot case studies
The rapid growth of China’s domestic tea production promotes its international trade (Wan & Yan 2006). World tea exportation reached 1.77 million tonnes in 2013 (Figure 5), with China exporting 0.33 million of them (Chang 2015). Most of China’s tea exports go to developing countries with a low-end market. Long-term dependence in said markets is not the best choice for improving China’s tea quality and constructing an international brand. Therefore, the practice of carbon neutral tea could be an entry point for developing China's sustainable tea industry by adding value and reducing its environmental and climatic impacts.
Tea export volume
200
150
100
50
0
20
02
20
03
20
04
20
05
20
06
20
07
20
08
20
09
20
10
20
11
20
12
20
13
20
14
20
15
20
16
20
17
China’s percentage to the globe
25%
20%
15%
10%
5%
0%
ChinaGlobe
×104 t
Figure 5. Tea exports from China and globallyData source: ITC, 2018; National Bureau of Statistics, 2018.
Tea yield
600
450
300
150
0
199
0
199
1
199
2
199
3
199
4
199
5
199
6
199
7
199
8
199
9
20
00
20
01
20
02
20
03
20
04
20
05
20
06
20
07
20
08
20
09
20
10
20
11
20
12
20
13
China’s percentage to the globe
100%
80%
60%
40%
20%
0%
ChinaGlobe
×104 t
Figure 4. Tea yields in China and globallyData source: ITC, 2018; National Bureau of Statistics, 2018.

7I. Tea in China: production model and climatic vulnerabilities
Climatic zoning of tea production in China
Tea cultivation is highly dependent on natural resources and plant physiology (Joliffe 2003). The ideal climatic conditions for tea cultivation are a mean annual temperature (MAT) of more than 13 °C and a mean annual precipitation (MAP) of 1300 mm. Tea cultivation is also restricted to biophysical conditions such as soil texture, topography, and slope, as well as socioeconomic conditions (Shen & Huang 2001). Therefore, tea cultivation is geographically limited to a few areas around the world and is highly sensitive to changes in environmental factors.
At the national level, tea cultivation has been divided into four main climatic zones in China, namely the Southwestern, South, South Yangtze and North Yangtze zones (Figure 6).
Tea in China originated mostly in the Southwestern zone that has a subtropical monsoon climate, with warm winters and cool summers. Various tea varieties of green, black and dark tea grow here due to its complex topography and diverse climates.
Climate in the South zone is believed to be the most suitable for tea production, where MAT is around 19 to 22 °C and MAP is about 2000 mm; the tea growing season can be as long as 10 months. Various big leaf tea trees are planted to produce black, oolong, flower, white, and dark tea.
South Yangtze zone has a distinct seasonal climate; MAT here is about 15–18 °C, while MAP is approximately 1600 mm. Annual tea yield from this zone contributes to two-thirds of the national total, producing mainly green, black, yellow and dark tea.
North Yangtze zone is the northern boundary of tea cultivation in China. Although MAT is around 15 °C, temperatures during the winter can reach -10 °C and MAP is only 800 mm with an uneven distribution; mainly producing green tea (Xiao et al. 2017).
Southwestern zone
South Yanhtze zone
South zone
North Yangtze zone
N
Southwestern zone
South Yangtze zone
North Yangtze zone
0 250 500 km South zone
Figure 6. Four main climatic zones for tea cultivation in Mainland ChinaSource: Xiao et al. 2017 modified to comply with FAO, 2001.

8 Carbon neutral tea production in China - Three pilot case studies
Impacts of climate change on tea production in China
China’s tea production has been significantly affected by climate change, with extreme climatic events heavily affecting tea production and quality (Ahmed et al. 2014). • Suitable areas for tea cultivation have changed due to warming temperatures;• Agro-meteorological and ecological disasters have been exacerbated due to intensified
climatic events; and• Socioeconomic impacts of climatic events have altered steps in the tea value chain,
jeopardizing the resilience of the tea industry.
With an observed higher occurrence of extreme climatic events in China (NDRC 2015), frequency of heat waves and stronger precipitation events are likely to increase. Models under different IPCC Representative Concentration Pathway scenarios showed an increasing trend in the annual average temperature in all regions of China (Zhang et al. 2017). Both the maximum and minimum temperature of China are predicted to increase; low-temperature hazards are however not likely to be reduced even with the general warming trend.
On the contrary, loss in tea yields could be exacerbated due to higher variation in the climate system itself and the advances of the phenophase of Spring tea buds (Zhang et al. 2012; Cao et al. 2015; Qiang et al. 2017; Jin & Zhou 2018). Heat and drought damage are the most common hazards for tea production in summer and autumn (Yang 2017). Consecutive dry days (CDD) will further increase in the southern areas. It has been suggested that insect pests will become more abundant as temperatures rise (Cannon 2004), and the negative effects of soil degradation and organic matter reduction caused by continuous farming will worsen due to climate change

9I. Tea in China: production model and climatic vulnerabilities
Agro-meteorological disasters
Hot
Higher occurrence of hot temperature events and intensified damage to tea production in the Southern and South zones (Li et al. 2015).
In 2013, a severe heat wave occurred in Zhejiang province, with temperatures higher than 40ºC lasting for 10 to 20 days. Affecting 138 500 ha of tea garden, this caused a direct economic loss of CNY 1.31 billion and a 20 percent decrease in the Spring tea yield the following year (Lou et al. 2018); only in Songyang county, 5 800 ha of tea farm were affected by the heat wave, causing CYN 62 million of direct economic loss (Jiang et al. 2014).
Damage by cold is related to climate variability and the adoption of early-spring tea varieties. Hazards include freezing damage during the winter, and frost and low temperatures during the spring. Tea plantations in the mid-latitudes of China are threatened by freezing damage almost every year, especially north of the Yangtze River (Li et al. 2015). In Shandong province, a serious freeze in the 2010–2011 winter caused an 80 percent reduction in the yield of Spring tea (Zhu et al. 2012).
From January to February 2008, 11 500 ha of tea garden suffered from serious freezing damage in Zhejiang province, causing a direct economic loss of CNY 1 billion.
In the springs of 2010, 2013 and 2016, 1 500 ha, 480 ha and 80 thousand ha of tea garden suffered from frost damage in Zhejiang province, causing a direct economic loss of CNY 2.0 billion, CNY 0.45 billion and CNY 1.8 billion, respectively.
Low temperatures are more frequent, delaying the plucking date of the Spring tea (Qiang et al. 2017).
Drought has increased in almost all the tea production regions, affecting tea yield and quality, especially in the summer (Tian et al. 2003). A severe drought occurred in Guiyang, Guizhou province in 2011, which caused 80 percent of young tea trees to die and there was no yield from the 900 ha of new tea plantations. The economic loss was about CNY 10 million (Tan & Yang 2017).
Cold
Drought

10 Carbon neutral tea production in China - Three pilot case studies
Ecological disasters
Pests and diseases
Climate change-related variations in temperature and precipitation may increase the incidence and prevalence of pests and diseases, particularly from new invasive species. For example, the tea lace bug (Stephanitis chinensis Drake) was first found in Ziyang County in 2014. By 2015, the area of damage had reached 4 067 ha, affecting 143 villages and causing economic losses of CNY 12 million.
Elevated temperatures may increase the generation of pests. Due to their early occurrence, the tea production system is therefore becoming more vulnerable to pests and diseases, resulting in crop loss and poor quality (Ahmed et al. 2014). The range of diseases and insects may also extend to high latitudes. At present, pathogens and parasites confined to the tropics could spread to subtropical and even temperate regions.
Tea gardens are already suffering from soil acidification, a decline in soil organic matter and the effects of pollutant dispersion and chemical residues. Due to the use of nitrogen fertilizer, the annual input of pure nitrogen can reach 737.7 kg/ha. The overuse of nitrogen fertilizers causes water eutrophication; in Jiangxi province and the four tea producing counties, soil acidification is worsening (Cai et al. 2018). Soil pH was less than 4.0 in over 72.6 percent of the four main tea producing counties, of which 26.4 percent had pH levels of less than 3.5.
As climate change may hamper tea tree growth and benefit pests and diseases, more fertilizers and pesticides are applied on tea farms (Chang & Brattlof 2015), affecting tea yields and reducing the quality of the tea.
Ecological degradation

11I. Tea in China: production model and climatic vulnerabilities
Picking time is delayed with low temperature. For example, from January to March 2012, the Spring tea was delayed by 15 days because of continuous rain in Shaoxing, Zhejiang province.
In contrast, the high temperature in spring can cause tea to grow too fast so it is difficult to pick it on time. In April 2006, the high temperature in Xinchang, Zhejiang province caused the price of tea to drop from CNY 600/kg to CNY 400/kg in two days, which seriously affected the income of tea farmers (Lou & Xiao 2016).
Tea quality declined due to aggravated drought, as the biochemical composition of amino acids, caffeine and other components decreased while tea polyphenols and crude fiber increased (Jiang et al. 2014). High temperature also affects the growth of tea buds, significantly reducing the amino acid content, leading to a decline in the quality of Spring tea, and consequently affecting the quality of Summer tea (Zhen 2014).
The processing and transportation of tea were affected by climate change. On 2 April and 3 April 2012, a disastrous gale occurred in Anhui, Jiangsu and Zhejiang provinces, which seriously affected the transport process and the price of tea. The unit price of tea was reduced from CNY 150 per kg to CNY 35–80 per kg (Wu et al. 2018). Tea processing equipment can also be damaged by meteorological disasters. In 2008, the snowstorm in Xinyang, Henan province, caused the collapse of more than 300 buildings in the tea enterprise, 55 sets of tea processing machinery and equipment were damaged, and overall it caused the economic loss of CYN 532 million (Xia et al. 2008).
Freezing damage not only affects tea yield, but also affects the tea market. Spring tea production in Rizhao, Shangdong province decreased by about 40 percent in 2018, resulting in highly priced Spring tea. The earliest price of “one bud and one leaf” reached CYN 360 per kg, and the price of fresh leaves of “one bud and two leaves” was CNY 16–17 per kg, while the price during the same period in 2017 was only around CYN 6/kg (Qiu et al. 2018).
Socioeconomic consequences
Plucking time
Quality
Processing & transportation
Market

12 Carbon neutral tea production in China - Three pilot case studies
Vulnerability of tea production to climate change
Drought, cold, diseases and pests are the main threats to tea production, especially in spring and autumn. In past decades, the negative impact of drought has declined due to the development of adapted technology and the enforcement of infrastructures. Prior to this, poor irrigation systems meant tea farmers had to carry water, using human labour and livestock to avoid tea yield losses from drought. In most cases this was unsuccessful. In recent years, the situation has changed with the establishment of advanced irrigation systems, including drip irrigation, sprinklers, canals and ditches, reservoirs and water pumps. This has significantly promoted the capacity of tea farms to cope with drought.
Even though data shows that the frequency of cold events at national level decreased in the past decades, it has become a main obstacle in the production of quality tea yields, because the widely adopted early-Spring tea varieties have high risks despite bringing in an initial income (Li et al. 2018; Lou et al. 2015).
Climate change threatens areas that once had suitable conditions for growing tea. It has caused increased diseases and pest outbreaks, with wider occurrence, prolonged duration and stronger intensity, bringing new challenges for tea production. As temperatures during the growing season become warmer, pests and diseases have the right conditions to grow rapidly and for longer periods (Huo et al. 2012). At present, the chemical approaches that prevent pest and disease damage are gradually being abandoned, while the environmentally friendly, physical and natural ecological approaches are widely adopted for the control of pests and diseases (Chen 2018).
The key factors of increased vulnerability are:• Small tea gardens with low diversity in tea varieties.• Land degradation due to soil erosion, overuse of pesticides and chemical fertilizers.• Insufficient infrastructure to prevent agro-meteorological disasters.• Weak early-warning systems and insurance mechanisms.• Undiversified tea value chains due to extensive agriculture management.

13
0 500 1000 km
N
Longquan
Songyang
Dabu
Figure 7. Location of three pilot tea gardens in China: Dabu in Meizhou, Guangdong Province; Longquan and Songyang in Lishui, Zhejiang ProvinceSource: FAO, 2001 modified for this publication.
Three small tea gardens in Dabu, Longquan, and Songyang were selected as pilot case studies due to their relatively equal scale of industry, but different environmental conditions for tea cultivation. Dabu is located in Meizhou City, Guangdong province; Longquan and Songyang are both located in Lishui City, Zhejiang province (Figure 7). Climatically, Dabu belongs to the South tea zone, while Longquan and Songyang belong to the South Yangtze zone, but economically they all belong to the Eastern tea region. The socioeconomic conditions and management practices are similar.
II. At the tea garden level: choosing three pilot case studies
14 Carbon neutral tea production in China - Three pilot case studies
Tea industry in the three pilot counties
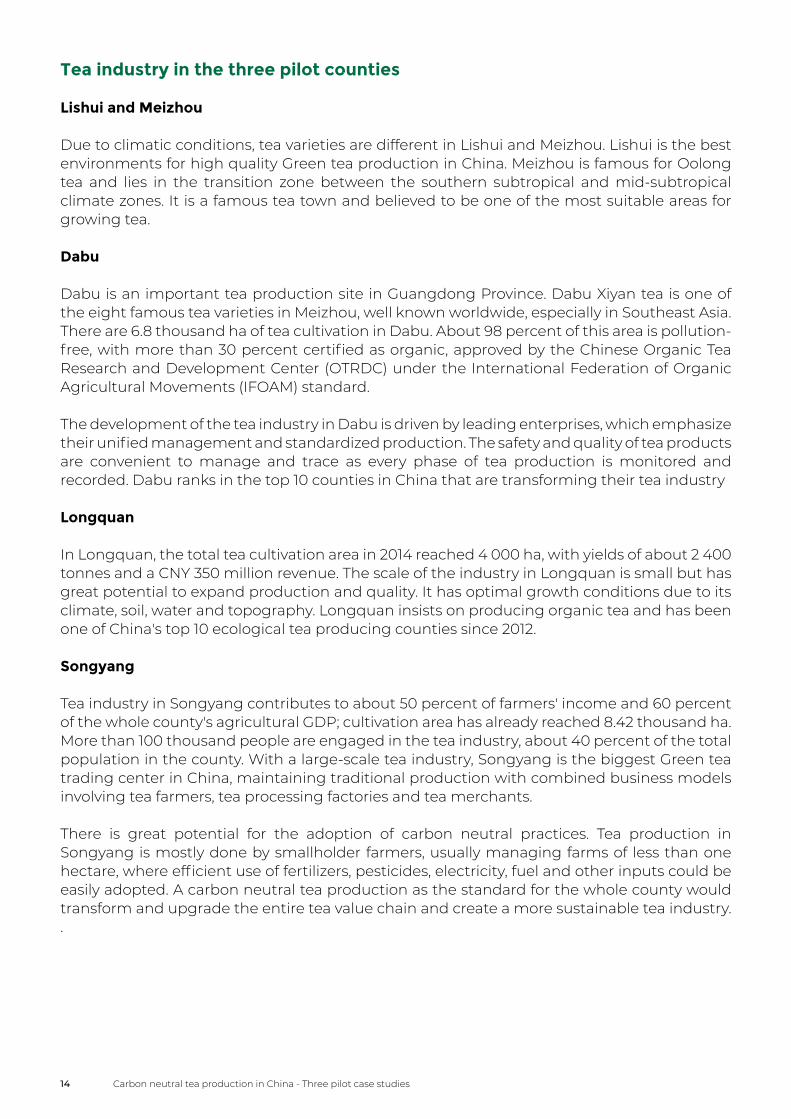
Lishui and Meizhou
Due to climatic conditions, tea varieties are different in Lishui and Meizhou. Lishui is the best environments for high quality Green tea production in China. Meizhou is famous for Oolong tea and lies in the transition zone between the southern subtropical and mid-subtropical climate zones. It is a famous tea town and believed to be one of the most suitable areas for growing tea.
Dabu
Dabu is an important tea production site in Guangdong Province. Dabu Xiyan tea is one of the eight famous tea varieties in Meizhou, well known worldwide, especially in Southeast Asia. There are 6.8 thousand ha of tea cultivation in Dabu. About 98 percent of this area is pollution-free, with more than 30 percent certified as organic, approved by the Chinese Organic Tea Research and Development Center (OTRDC) under the International Federation of Organic Agricultural Movements (IFOAM) standard.
The development of the tea industry in Dabu is driven by leading enterprises, which emphasize their unified management and standardized production. The safety and quality of tea products are convenient to manage and trace as every phase of tea production is monitored and recorded. Dabu ranks in the top 10 counties in China that are transforming their tea industry
Longquan
In Longquan, the total tea cultivation area in 2014 reached 4 000 ha, with yields of about 2 400 tonnes and a CNY 350 million revenue. The scale of the industry in Longquan is small but has great potential to expand production and quality. It has optimal growth conditions due to its climate, soil, water and topography. Longquan insists on producing organic tea and has been one of China's top 10 ecological tea producing counties since 2012.
Songyang
Tea industry in Songyang contributes to about 50 percent of farmers' income and 60 percent of the whole county's agricultural GDP; cultivation area has already reached 8.42 thousand ha. More than 100 thousand people are engaged in the tea industry, about 40 percent of the total population in the county. With a large-scale tea industry, Songyang is the biggest Green tea trading center in China, maintaining traditional production with combined business models involving tea farmers, tea processing factories and tea merchants.
There is great potential for the adoption of carbon neutral practices. Tea production in Songyang is mostly done by smallholder farmers, usually managing farms of less than one hectare, where efficient use of fertilizers, pesticides, electricity, fuel and other inputs could be easily adopted. A carbon neutral tea production as the standard for the whole county would transform and upgrade the entire tea value chain and create a more sustainable tea industry..

15II. At the tea garden level: choosing three pilot case studies
Basic information about the three pilot tea gardens
In Dabu, the tea garden is in a high mountainous region, at an altitude of 1250 masl. Surrounded by mist all year long, the environment remains uncontaminated, with no source of pollution nearby. Soils are rich in selenium and water has a low alkaline content. Dabu is an ideal site for the cultivation of high-quality organic tea and has been named as a national demonstration site for a standardized ecological tea garden. Oolong tea is the main product in Dabu.
In Longquan, tea production is carried out according to the strict guidelines of organic agriculture. Manufactured fertilizers, pesticides, plant growth regulators, chemical additives or other substances are not used. The farm meets IFOAM standards and has been certified by OTRDC.
In Songyang, the tea farm functions under a circular-agriculture model, combining tea cultivation and pig breeding. The pig breeding provides organic fertilizer for the tea cultivation, while the tea cultivation provides fodder for pigs.
There are some tea varieties which are plucked two to three times a year, others only once a year, to maintain the tea quality. Based on the field survey and observations, approximately one month prior to bud sprouting, tea farmers apply fertilizer on the latent tea bushes. The most intense period of tea harvesting takes place early in March until early May. Pruning is usually done after the spring harvest is completed, and the amount of pruning depends on local production practices in each garden. The second time soil is fertilized is between mid-summer and late autumn to optimize the nutrient supply. The latent period for tea trees starts in mid-November.

16 Carbon neutral tea production in China - Three pilot case studies
Basic informationName of pilot farm
Kaida tea farm Fengyangchun tea farm Xunfengyunjian tea farm
Location of tea gardens
Dabu, Meizhou, Guangdong province
Longquan, Lishui, Zhejiang province
Songyang, Lishui, Zhejiang province
Tea variety Oolong tea Green tea Green tea
Area 90.67 ha 88 ha 20 ha
Total yield 80 tonnes 84 tonnes 27 tonnes
Environmental conditionsLatitude 24°10′16″ 28°02′7″ 28°28′24″
Longitude 116°47′31″ 119°05′46″ 119°30′45″
Altitude 1250 masl 380 masl 190 masl
Climate zone Transition zone between the southern and central subtropical monsoon climate zones
Central subtropical monsoon climate zone
Central subtropical monsoon climate zone
Soil pH 3.9–5.2 5.0–5.5 4.5–6.5
Soil organic matter
2.8% 3.1% 3.5%
InputsProcessing method
Refinery tea processing Preliminary tea processing Preliminary tea processing
Farm equipment 30 tea processing machines 25 tea processing machines 27 tea processing machines
Staff 25 employees 10 employees 15 employees
Tea industry importance at county-level
Famous national brand
1 (Xiyan Dancong) 0 1 (Songyang Yinhou)
Tea yield 7.0 thousand tonnes 2.4 thousand tonnes 14.2 thousand tonnes
Output value CNY 0.63 billion CNY 0.35 billion CNY 1.41 billion
Cultivation area 6 806 ha 4 126 ha 8 420 ha
Famous provincial brands
15 2 6
National recognition
• Chinese Dancong tea town• Among China’s top 10 counties for demonstration of transformation and upgrade of the tea industry
• One of China's top 10 ecological tea production counties
• Largest Green tea trading centre in China• A demonstration county for China’s tea industry
Table 2. Background information on the three pilot tea gardens. Data from field survey (Annex 1) and local statistics

17II. At the tea garden level: choosing three pilot case studies
Xiangfeicuiyu4–5 April 7–8 November 2–3 times, mainly in
spring and autumn;
According to the market demand, tea leaves may be plucked in the summer
Tea garden Varieties Beginning of plucking
End of plucking Frequency of plucking
Irrigation Frequency of irrigation
Dabu
20–21 March 8–24 October
Wuyehuangzhixiang
Traditional Meizhan
Baiyedancong
Jinguanyin 4–5 April 23–24 October
Rainfall and sprinklers
The seasonal distribution of rainfall and the demand of tea growth determines the frequency and amount of irrigation.
March June
1–2 times, mainly in spring
Longquan
Rainfall None1 time, mainly in spring
Jiukeng
Longjing
1–2 times, mainly in spring
MayAprilBaicha
Mid- February
September2 times, mainly in spring and summer
Songyang
Rainfall and spraying
The seasonal distribution of rainfall and the demand of tea growth determines the frequency and amount of irrigation.
Wuniuzao
Longjing43
Late MarchBaicha
Early March
Table 3. Information about plucking and irrigation in three pilot tea gardens
Climate change challenges faced by the three pilot tea gardens
In the past decades, drought was a main threat to tea yields in Dabu, especially in spring and autumn when a high quantity of good quality tea is usually plucked. In recent years, drought and cold damage have been the main threats to tea yields in Longquan and Songyang. Cold damage can have a particularly bad effect on tea cultivation, especially during spring. It has also been projected that drought will aggravate tea cultivation in the future, with diseases and pests becoming more frequent with warmer weather (Li et al. 2015).
Warming trends and extreme temperature events
The annual mean temperature (Tm) increased between 1970 and 2017, with a trend of 0.11 °C, 0.24 °C and 0.30 °C per decade in Dabu, Longquan and Songyang, respectively (Figure 8), while the annual maximum temperature (Tmax) increased with a trend of 0.13 °C, 0.25 °C and 0.31 °C per decade, respectively.
The warming trend of the annual Tmax is a bit higher than the annual Tm in these three pilot gardens; meanwhile, annual minimum temperature (Tmin) increased with a trend of 0.17 °C, 0.21 °C and 0.08 °C per decade in Dabu, Longquan and Songyang, respectively. A clear indicator of these changes is the notorious fluctuation of both annual Tmax and Tmin after 1990 in the three pilot gardens. In parallel with the warming trend of annual Tmin in Songyang, there has been an increasing trend in the annual extreme minimum temperature, meaning that the cold damage would be aggravated.
Dry Season
It is noticeable that spring drought is longer, as the number of consecutive dry days (CDD) increased in each tea garden. In contrast, autumn drought is shorter as the CDD in autumn decreased between 1971 and 2017. The great variation of summer CDD in Longquan and Songyang suggests that severe summer drought did happen in some years. Summer drought in Dabu has slightly reduced due to less CDDs since the 1990s (Figure 9).

18 Carbon neutral tea production in China - Three pilot case studies
Figure 8. The trend of annual Tm, Tmax, Tmin, and the annual extreme daily Tmax and Tmin from 1970 to 2017 in the three pilot counties
40
35
30
25
20
15
10
5
0
-5
-10Te
mp
era
rure
˚C
1970 1980 1990 2000 2010
Ave_TmDaily Tmax
Daily Tmin
Ave_Tmax
Ave_Tmin
40
35
30
25
20
15
10
5
0
-5
-10Te
mp
era
rure
˚C
1970 1980 1990 2000 2010
Ave_TmDaily Tmax
Daily Tmin
Ave_Tmax
Ave_Tmin
40
35
30
25
20
15
10
5
0
-5
-10Te
mp
era
rure
˚C
1970 1980 1990 2000 2010
Ave_TmDaily Tmax
Daily Tmin
Ave_Tmax
Ave_Tmin
a. Dabu
b. Longquan
c. Songyang

19II. At the tea garden level: choosing three pilot case studies
Figure 9. Seasonal (spring, summer, and autumn) consecutive dry days (CDD) in the three pilot counties from 1971 to 2017
a. Dabu
b. Longquan
c. Songyang
7580
606570
55504540353025201510A
nn
ual
co
nse
cuti
ve d
ry d
ays
1970 1980 1990 2000 2010
Spring
Summer
Autumn
70
6065
55504540353025201510
An
nu
al c
on
secu
tive
dry
day
s
1970 1980 1990 2000 2010
5
70
60
65
55
50
45
403530
2520
15
An
nu
al c
on
secu
tive
dry
day
s
1970 1980 1990 2000 2010
10
Spring
Summer
Autumn
Spring
Summer
Autumn

20 Carbon neutral tea production in China - Three pilot case studies
Vulnerability components Vulnerability context
Adaptive capacity
Exposure
Sensitivity There are five varieties of tea in Dabu that are to some extent resistant to drought, cold and insects.
There are three resistant tea varieties in Longquan: Jiukeng is drought, cold and insect-resistant; Anjibaicha is resistant to drought and cold but not to insects. Longjing43 has a medium level of resistance in comparison to the two above-mentioned varieties.There are three tea varieties in Songyang, similar to Jiukeng; Wuniuzao is also resistant to drought, cold and insects. Baicha is similar. Anjibaicha and Longjing are more similar to Longjing43.
Resistance to heat waves, hail, strong wind and other disasters is not considered when breeding different tea varieties in the three pilot gardens..
The basic infrastructures for alleviating drought have been established, including ditches, sprinkler irrigation systems and reservoirs; insect luring sticky boards, solar insecticidal lamps and other, have gradually replaced the chemical insecticides to guarantee high-quality tea products. However, the countermeasures for cold damage, floods, heat waves and other climatic disasters are still weak; early-warning systems are not in place across all the tea farms.
There are 90.67 ha, 88 ha, and 20 ha of tea trees in Dabu, Longquan, and Songyang, respectively. They are all directly exposed to aggravated agro-meteorological disasters of cold and hot temperature stress, drought and flood. An intercropping system has not yet been built and tree shade is not enough..
Table 4. Vulnerability of the three pilot tea gardens to climate change
Vulnerability to climate change
Due to the different climatic hazards tea cultivation faces, its yields, socioeconomic factors, technology, and management are highly vulnerable.

21
Securing tea production with adaptation measures
Adaptation efforts have always been taken to increase the climate resilience of tea production. Initially, adaptation efforts in China were mainly focused on climatic suitability and increasing the yield, clone breeding, increasing nutrients and preventing pests and diseases, but there were some negative side-effects. These occurred from an overuse of fertilizers and pesticides since the 1980s which had consequences on the environment including water pollution and soil degradation (Huang et al. 2010).
Since the 1990s, comprehensive measures were taken to prevent ecological degradation and reduce the impacts of agro-meteorological disasters on tea production. These integrated measures included:• Breeding tea varieties resistant to climate hazards (Table 5) and insects.• Improving the ecology of the tea gardens, preventing disaster damage through improved
irrigation, fertilization, pruning, agroforestry and shade.• Building an early-warning system and establishing a risk transfer mechanism, such as
financial insurance.• Balancing fertilization and organic tea production were gradually adopted and reduced
nitrogen (N) fertilization was recommended to prevent land degradation.• Applying sticky traps and biological technologies for pests and diseases control (Ruan 2010).
So far, adaptation measures are mainly focused on tea field management, not during processing, transportation and retail. Thus, to identify climate change adaptation measures, interviews with tea farmers were not limited to cultivation but tried to identify measures throughout the entire value chain (Table 6).
III. Carbon neutral tea production: the how-to
1 Effective adaptation measures to produce tea biomass under a changing climate.
2 Produce low carbon tea to reduce GHG emissions and increase the carbon sink.
3 Introduce measures to offset and balance the amount of GHG emissions throughout the entire tea production value chain.
China has been facing a series of challenges induced by climate change, thus adaptation measures are the first step needed to reduce the present vulnerability in the agriculture sectors and increase resilience to future risks.
Carbon neutral tea production should be achieved through a synergy of adaptation and mitigation measures. A pathway towards carbon neutral tea should include:

22 Carbon neutral tea production in China - Three pilot case studies
Table 5. Adaptation measures adopted in China to protect tea from unpredicted temperature changes and drought
Disasters Adaptation measures
Cold temperatures
Freezing damage
Drought
Hot temperatures
• Irrigation system and water conservation in the tea garden.• Shallow ploughing to prevent drought affecting young tea trees.• Spraying foliar fertilizer to promote root growth, increase water content and enhance drought resistance.
• Conserve water and cool the soil by covering it.• Using a sunshade net above the tea to reduce exposure to heat.• Irrigation in the morning or evening.
• Depending on the degree of frost damage, frozen tea trees should be pruned once temperatures start to increase.• Shallow ploughing to ensure water content is maintained in frozen tea plantations before the Spring tea plucking.
• Pruning branches and plucking on time when plants encounter chills.• Timely fertilization after chilling injury.
Chilling injury
Pre-disaster measures:• Selection of frost-resistant varieties.• Match suitable varieties to ensure variety diversity.• Choose appropriate tea garden sites to avoid frost-prone areas.• Improve the microclimate of the tea garden.• Precise fertilization to improve tea resistance.
In-situ measures:• Use big fans to blow high-altitude hot air to the canopy of tea trees to prevent or reduce frost damage.• Timely spraying to defrost tea gardens.• Mulch filming/covering to prevent frost.
Post-disaster measures:• Pruning damaged, frozen branches. Timely cultivating and weeding, applying fast-acting, effective fertilizer.• Retaining new leaves to strengthen the plant.
Frost
Source: Zhang et al. 2012; Cao et al. 2015; Qiang et al. 2017; Jin & Zhou, 2018; Yang, 2017.

23III. Carbon neutral tea production: the how-to
Disasters Adaptation measures
Irrigation improvement
There are five tea varieties, Xiangfeicuiyu, Baiyedancong, Wuyehuangzhixiang, traditional Meizhan and Jinguanyin. A new tea variety, Bayedancong, resistant in colder temperatures, was planted in recent years in Dabu.
Breeding tea varieties
Dabu
There are three tea varieties, Jiukeng, Baicha, and Longjing. Jiukeng, a local tea variety from Zhejiang. It is drought and pest resistant and produces a stable yield.
Longquan
There are three tea varieties, Baicha, Longjing and Wuniuzao. The different varieties bud at different times ensuring that one or all of the varieties thrive.
Songyang
Sprinklers and drip irrigation systems were applied in all three tea gardens; canals, ditches and water reservoirs are built in Dabu, while basic irrigation and water conservancy facilities have been constructed in Longquan and Songyang (Figure 10).
Transportation
Pest control Sticky traps and solar insecticidal lamps were set up in the three pilot tea farms. The farms use a natural, ecological method of biodiversity conservation and cultivation management. They use biological control agents and ensure timely pruning and leaf plucking (Figure 11).
Processing Traditionally, the withering of fresh tea leaves requires a lot of sunshine and enough wind to make moisture evaporate from fresh leaves. As there are more continuous rainy days than before, the process of sun withering cannot be well performed, which results in a lower tea quality. Rotation machines have therefore been used in recent years to substitute sun withering.
In order to reduce the risk from storms, floods and landslides, the pilot gardens use different modes of transportation, including rail, road, sea and air. Tea gardens are usually situated on mountain sides and in past decades, the poor transportation infrastructure was an obstacle to selling tea. In recent years, there have been developments in the transportation infrastructure and a rapid development in logistics facilities. There are more options for tea garden owners to transport tea products, reducing the risk to tea in the event of meteorological disasters and secondary mountain disasters due to lack of effective transportation. Meanwhile, the precise and efficient management of tea orders and transportation is also an important adaptation, as well as mitigation measure for the three tea gardens.
Tea storage Cold storage for keeping tea products is in place.
Table 6. Adaptation measures adopted in the three pilot tea gardens

24 Carbon neutral tea production in China - Three pilot case studies
Figure 10. Sprinkle irrigation (top) and drip irrigation facilities (bottom) in the three pilot tea gardens
©FA
O/K
uo L
i
©FA
O/K
uo L
i
©FA
O/K
uo L
i

25III. Carbon neutral tea production: the how-to
Figure 11. Coloured sticky traps (top and middle) and solar insecticidal lamps (bottom) in three pilot tea gardens
©FA
O/Yingchun Li and K
uo Li©
FAO
/Yingchun Li and Kuo Li
©FA
O/Yingchun Li and K
uo Li
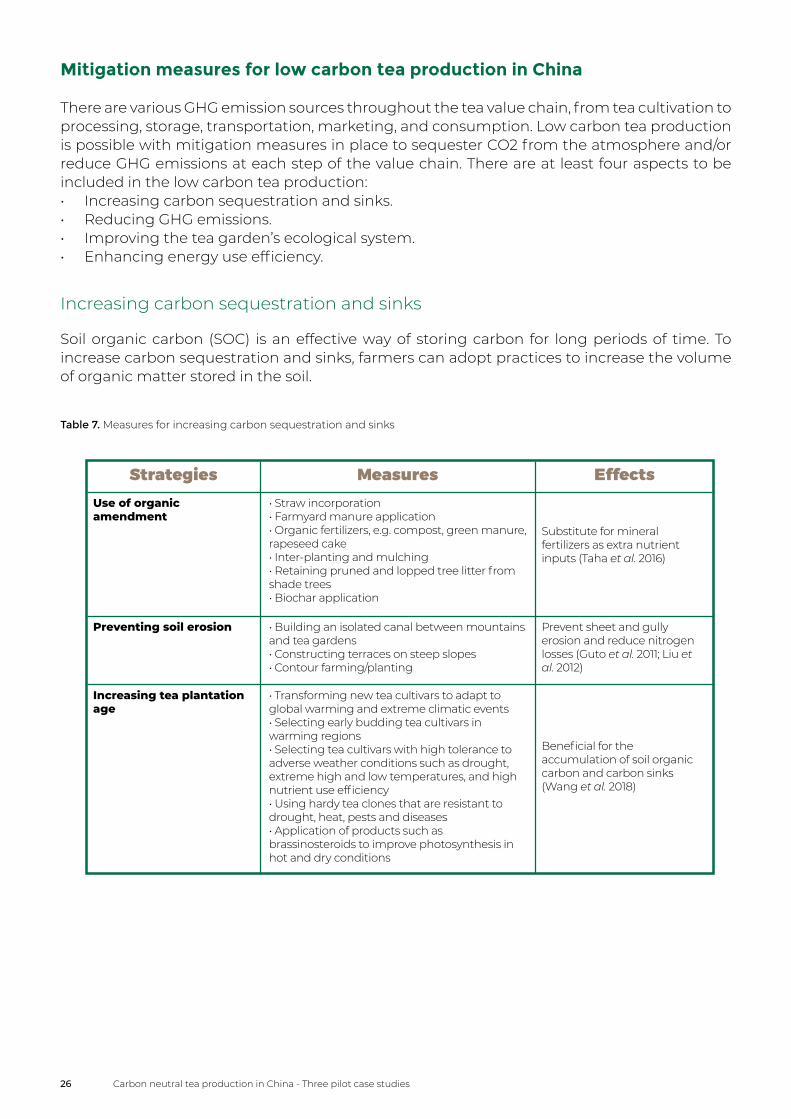
26 Carbon neutral tea production in China - Three pilot case studies
Mitigation measures for low carbon tea production in China
There are various GHG emission sources throughout the tea value chain, from tea cultivation to processing, storage, transportation, marketing, and consumption. Low carbon tea production is possible with mitigation measures in place to sequester CO2 from the atmosphere and/or reduce GHG emissions at each step of the value chain. There are at least four aspects to be included in the low carbon tea production:• Increasing carbon sequestration and sinks.• Reducing GHG emissions.• Improving the tea garden’s ecological system.• Enhancing energy use efficiency.
Increasing carbon sequestration and sinks
Soil organic carbon (SOC) is an effective way of storing carbon for long periods of time. To increase carbon sequestration and sinks, farmers can adopt practices to increase the volume of organic matter stored in the soil.
Strategies Measures Effects• Straw incorporation• Farmyard manure application• Organic fertilizers, e.g. compost, green manure, rapeseed cake• Inter-planting and mulching• Retaining pruned and lopped tree litter from shade trees• Biochar application
Substitute for mineral fertilizers as extra nutrient inputs (Taha et al. 2016)
Use of organic amendment
• Building an isolated canal between mountains and tea gardens• Constructing terraces on steep slopes• Contour farming/planting
Prevent sheet and gully erosion and reduce nitrogen losses (Guto et al. 2011; Liu et al. 2012)
Preventing soil erosion
• Transforming new tea cultivars to adapt to global warming and extreme climatic events• Selecting early budding tea cultivars in warming regions• Selecting tea cultivars with high tolerance to adverse weather conditions such as drought, extreme high and low temperatures, and high nutrient use efficiency• Using hardy tea clones that are resistant to drought, heat, pests and diseases• Application of products such as brassinosteroids to improve photosynthesis in hot and dry conditions
Beneficial for the accumulation of soil organic carbon and carbon sinks (Wang et al. 2018)
Increasing tea plantation age
Table 7. Measures for increasing carbon sequestration and sinks

27III. Carbon neutral tea production: the how-to
Reducing greenhouse gas emissions at farm-level
Crop producers can adjust nutrient management practices to reduce GHG emissions in the field, including the reduced use of nitrogen fertilizer, soil testing, precision agriculture, use of slow-release fertilizers or nitrification inhibitors (Table 8), and changes in application timing to better match plant uptake of nutrients (Smith et al. 2008).
Strategies Measures EffectsFertilization practices based on soil tests Reduced environmental
pollutionReducing nitrogen application
• Application of the right fertilizer at the right time, right rate and in the right place • Balancing chemical and organic fertilization, especially with nitrogen, phosphorus and potassium (NPK) • Balancing the application of chemical fertilizer and organic manure
Improve nutrient use efficiency and decrease N2O and CO2 emissions (Liu et al. 2015)
Optimizing fertilizer management
• Slow-release coated urea• Nitrogen inhibitors
Improve crop yields and fertilizer use efficiency, reducing nitrogen losses (Liu et al. 2012; Noellsch et al. 2009)
Adopting new types of fertilizer
Table 8. Measures and effects of GHG emissions reduction
Improving the tea garden’s ecological system
With the development of China's economy, the concept of tea cultivation and consumption is also changing gradually, from the original mode of tea planting to a way of producing higher yields and quality. Measures like reducing the use of chemical pesticides and fertilizers, using pruned leaves in the garden, increase the vegetation coverage and biomass raising the garden, and controlling the amount of pollution from pesticides and fertilizers, can effectively protect the ecology of the tea garden and its surroundings, promote the ecological service capacity of tea garden, and ensure improved resource efficiency and a higher quality of product.

28 Carbon neutral tea production in China - Three pilot case studies
Strategies Measures Effects• Planting shade trees in tea gardens• Intercropping • Shelter belts
Increase carbon storage and biodiversity. Improve harvesting conditions for tea farmers (ITC 2014)
Increasing vegetation coverage and biomass
• Expanding multi-cropping systems (e.g. tea and rubber intercropping)• Establishing a complex ecosystem, for example raising pigs or sheep and using the manure on the tea gardens• Interplanting precious tree species for timber• Introducing integrated pests and diseases management, sticky traps and insecticidal lamps
Increase crop diversification, reduce soil erosion and increase tea yields and quality
Constructing ecological cultivation
Table 9. Measures and effects of an improved ecological system
Enhancing energy use efficiency
In the tea value chain, like in other agriculture sectors, GHG emissions are caused by energy use (ITC 2014). Ensuring a carbon neutral tea value chain means modifying and optimizing energy use at the most energy consuming stages of the tea value chain; during processing, transportation, packaging and consumption (Table 10).
Processing
Tea processing is an energy intensive process. Factories process heat for drying and withering and electricity is also used for machinery, office equipment and lighting. Energy efficiency highly depends on having well-maintained and up-to-date machinery. This makes the tea value chain a sector with great potential for GHG mitigation through energy savings and transformation. Some measures applicable to the processing stage are described below.
Wood fuel storage and seasoning
Proper storage to ensure optimal fuel wood moisture (15 to 20 percent) is necessary to increase its calorific power, thus improving its combustion efficiency (ITC 2014; Sims et al. 2017). Seasoning is the process of drying wood to reduce moisture content. The benefits of proper seasoning include reduction in wood consumption, efficient boiler operation, and a reduction in the emissions (ITC 2014; Sims et al. 2015, Sims et al. 2017). The key principles of wood seasoning include:• Stacking wood properly to allow the same, constant airflow with calculated distances
between stacks.• Drying and storing the wood for six months until the moisture content reaches the desired
level, thus increasing the calorific value of the wood fuel.• Covering wood to protect it from rain with clear material to allow sunlight that increases
moisture evaporation.

29III. Carbon neutral tea production: the how-to
Efficient boiler operation
Over 90 percent of tea factories’ energy is used for withering and drying. Ensuring maximum boiler efficiency through good practices in operating the boiler can significantly reduce the consumption of wood required to produce the same amount of energy, while positively influencing production costs (ITC 2014; Sims et al. 2015). The measures include:• Ensuring complete combustion and a regular and consistent steam supply using billets
and measuring air and fuel flows to save energy, and to reduce GHG emissions produced through incomplete combustion.
• Using preheaters.• Removing ash daily.• Eliminating leakages.• Insulating the system properly.• Using air flow control dampers and flue gas readings to regulate the amount of fresh air
entering the combustion chamber.• Monitoring and measuring fuel wood consumption to then analyse boiler efficiency.• Applying variable speed drive motor units.
Withering
Withering is the most energy intensive procedure in tea processing (ITC 2014). Over 50 percent of total thermal energy consumption and around 40 percent of a factory’s total electricity consumption are required for tea withering. To minimize energy consumption, fans and warm air use should be kept to a minimum and maintained in optimal operational conditions. Spreading the tea into thinner layers is a good practice to implement at this stage, allowing uniform air circulation resulting in good withering and minimum energy use.
Drying
Tea drying uses around 40 percent of a factory’s heat requirements and 20 percent of the total electricity demand to power large fans, making it the second most energy intensive process after withering (ITC 2014). Some ways to reduce energy use in tea drying are:• Applying variable speed-drive motor units to tea drying equipment.• Ensuring equipment and fans are well maintained and in optimal operational condition.• Recording the temperature of tea entering the dryers to ensure the correct amount of
steam is applied.• Ensuring air intake is well controlled and all steam pipes are well insulated.• Replacing biomass combustion with gasification.Gasification technologies have several advantages compared to combustion (ITC 2014). Despite being more expensive than biomass boilers, gasification occurs at lower temperatures than combustion, and therefore has lower maintenance costs and a longer lifetime. Gasification is more efficient than combustion, requiring less wood fuel and producing fewer emissions. Char obtained from gasification can be used as a fertilizer and for producing activated carbon.
Energy sources and renewable energy
Using conventional energy sources contributes to GHG emissions along the tea value chain (ITC 2014 Sims et al. 2015; Sims et al. 2017; FAO 2011). Integrating renewable energy for electricity and heat production will be a win-win solution and a key low carbon measure, not only contributing to climate change mitigation but also to reducing associated fuel costs.

30 Carbon neutral tea production in China - Three pilot case studies
Transportation
Improving energy efficiency in tea transportation along the tea value chain to reduce GHG emissions includes the following measures:• Limit the use of cars and trucks.• Use transportation lines.• Replace fossil fuels with biofuels.• Grow feedstock to be used as biofuels for wind turbines or solar panels.
Consumption and packaging
Finally, green consumption and reducing the carbon footprint of tea packaging are advocated. With changes in the concept of consumption and cultural promotion in China, consumers are beginning to pay more attention to the quality of tea and refuse luxury packaging. Reducing the waste of resources and energy in the consumption and packaging stages of the tea value chain can be achieved by the promotion of green packaging and consumption using environmentally friendly tea bags, as well as green and low carbon packaging (ITC 2014; Sims et al. 2015).
Strategies Measures EffectsFertilization practices based on soil tests Reduced environmental
pollutionReducing nitrogen application
• Application of the right fertilizer at the right time, right rate and in the right place • Balancing chemical and organic fertilization, especially with nitrogen, phosphorus and potassium (NPK) • Balancing the application of chemical fertilizer and organic manure
Improve nutrient use efficiency and decrease N2O and CO2 emissions (Liu et al. 2015)
Optimizing fertilizer management
• Slow-release coated urea• Nitrogen inhibitors
Improve crop yields and fertilizer use efficiency, reducing nitrogen losses (Liu et al. 2012; Noellsch et al. 2009)
Adopting new types of fertilizer
Table 10. Measures and effects of increased energy use efficiency

31III. Carbon neutral tea production: the how-to
Efficient use of water through digital innovation
Utilization of Big Data and Internet of Things (IoT) in tea gardens has been adopted for precision cultivation using high-tech systems. This consists of an integrated system of automatic remote sensing, early-warning and micro-spray irrigation. Timely warning functions can help users discover environmental changes over time, and then quickly start the irrigation system to avoid damage from heat, cold and drought (Figure 12).
An experiment was implemented by Kebai Sciences, IoT Technology and Precision Agriculture, near to the pilot tea garden to carry out GHG emissions accounting in Songyang, Zhejiang province (Figure 13 and Figure 14).
Figure 12. Automatic data collection (left) Irrigation system (right)
Figure 13. Comparison of usual (left) and trial (right) tea gardens affected by heat damage in July 2017
©FA
O/Yinlong X
u©
FAO
/Kebai S
ciences Inc., Beijing
©FA
O/K
ebai Sciences Inc., B
eijing©
FAO
/Yinlong Xu

32 Carbon neutral tea production in China - Three pilot case studies
Figure 14. Comparison of usual (left) and trial (right) tea gardens affected by frost damage in March 2018
Some indicators to demonstrate the benefits of the high-tech system:• 50 percent less water used• 40 percent less fertilizer used• 35 percent less pesticide used• 50 percent less electricity used• 95 percent of manpower saved• Zero heat damage• Zero frost damage
©FA
O/K
ebai
Sci
ence
s In
c., B
eijin
g
©FA
O/K
ebai
Sci
ence
s In
c., B
eijin
g

33III. Carbon neutral tea production: the how-to
Offset measures for carbon neutral tea production
To achieve carbon neutrality in the production of tea in the pilot tea gardens, the net GHG emissions for the whole tea value chain must first be quantified. This is usually done using a Life Cycle Analysis-based (LCA) framework for GHG emissions accounting. The method of LCA is defined by the guidelines and principles set in the international standards ISO14040/14044. The main objective of this method (ISO 2006) is to assess all environmental impacts of a product or service throughout its entire life cycle, from cradle-to-grave. The PAS2050 (BSI 2008) is one standardized guideline to assess the carbon footprint of a product, based on the LCA method, but focusing only on the impact of greenhouse gas emissions and sinks.
After the GHG emissions are quantitatively assessed, practical carbon reduction strategies can be designed and verified. After intensive reduction efforts have been made, compensation measures with certified carbon credits should be taken to offset the remaining GHG emissions to achieve the commitment to carbon neutrality. In this report, the baseline GHG emissions assessment of the pilot tea gardens is described, based on LCA methodology to provide the scientific evidence for decision-making on practical offsetting measures for future carbon neutral actions.

34
The main goal of this section is to estimate the Global Warming Potential (GWP) of tea production and the carbon sink created by tea bushes and the soil. For methodological purposes, the GHG emissions from the three pilot tea gardens in 2017 are the baseline, and a series of measures have been designed to mitigate the emissions.
Until now, there has been no assessment of the GHG emissions for the entire tea value chain, so this report attempts to describe the efforts to construct the LCA methodology to measure the GHG emissions from tea production.
The principles of GHG accounting throughout the lifecycle of a product based on LCA methodology is described in PAS2050 (BSI 2008) and contains several key steps:
IV. Accounting GHG emissions in pilot tea gardens
1 Defining the scope of carbon emission accounting. In this report, the system boundary is defined as the whole value chain from tea cultivation to consumption, excluding waste management.
2Data collection.This includes primary data related to levels of activity, soil and biomass sampling, and secondary data on emissions factors.
3 GHG emissions accounting.This is based on activity level data and the determinate factors of GHGs (based on the IPCC’s Guidelines for National GHGs Inventories 2006).
4 Estimation of the carbon sink.This estimation was based on soil and biomass sampling.
5 Identifying net GHG emissions intensity.This is estimated by observing quantitative differences between GHG emissions and carbon sinks in the pilot tea gardens. Considering also carbon sequestration, offsetting measures are then proposed for the remaining net emissions.

35IV. Accounting GHG emissions in pilot tea gardens
In order to measure the GHG emissions, the data was collected in different ways. First, the activity level data (ALD) in this report was obtained from interviews with the tea garden farmers based on structured questionnaires (Annex 1), designed according to the GHG emissions accounting methodology proposed in PAS2050. Second, the adaptation measures and low carbon technologies were selected following a literature review, field survey and interviews with tea farmers. Third, the soil and biomass sampling was made in the pilot tea gardens to estimate the size of the carbon sink. Fourth, the emission factors were obtained from China's National Development and Reform Commission (NDRC) guidelines on GHG emissions from food, tobacco, alcohol, drinks and tea companies, as well as the IPCC guidelines for national greenhouse gas inventories.
Scope of GHG emissions accounting
The system boundary signifies that all GHG emissions are being considered from cultivation to consumption (Kalita et al. 2015), in the three pilot tea gardens, mainly based on China's do-mestic tea consumption habits (Figure 15).
6
1 Cultivation: Direct and indirect GHG emissions from the production and application of fertilizers during tea cultivation, which included emissions during fertilizer production, water and materials used during cultivation, land-use change to create tea gardens, pruning and harvesting of tea, collection of plucked tea and transport to processing.
2 Processing: Electricity and heat used for processing the harvested tea leaves involving withering, leaf maceration, oxidation, drying and sorting.
3
Packaging: All primary, secondary and tertiary packaging used in the life cycle of tea.
Storage: Transport of packed tea to storage rooms and cold storage facilities.
Transportation: All transportation steps throughout the life cycle of tea, except for retail market to consumer.
Consumption: Water and electricity used for tea drinking.
4
5

36 Carbon neutral tea production in China - Three pilot case studies
Transport:gasoline, diesel
Tea cultivation and harvesting:organic fertilizer, electricity,diesel
Processing:electricity, biomass pellet fuel,natural gas
Packaging:electricity, plastic bags
Storage:electricity
Consumption:electricity, natural gas, coal
Waste management:waste tea, broken packaging,boiler ash
Figure 15. The emission accounting framework for the life cycle of tea production
During the investigation, all waste from tea production and related waste were excluded from the system boundary. Storage and packaging are put together as one stage for the convenience of the analysis. The life cycle assessment of tea was covered from field to retail and tea consumption was assessed separately with secondary data from a literature review, to obtain a more accurate understanding of the GHG emissions at different stages. Intensive data collection activities on GHG emissions until the retail stage are more reliable than the GHG emission estimations at the consumption stage.
Inventory data and assumptions
Data in cradle-to-retail stages
The LCA method applied in the study follows the guidelines in ISO14040/44 and PAS2050. These are existing standards that define the methodologies to be used for the implementation of low carbon approaches3. The emission factors were adopted from the accounting method and guidelines of GHG emissions for food, tobacco, alcohol, drinks and tea companies issued by China’s NDRC (IPCC 2006; NDRC 2016b), as well as GWP factors (Table 11).
3 ISO14040/14044: Internationally accepted standards guidelines and methodologies for LCA studies. PAS2050 set guidelines for the accounting and reporting of GHG emissions for products.

37IV. Accounting GHG emissions in pilot tea gardens
The activity level data in 2017 was collected using structured questionnaires from the three pilot tea gardens (Figure 16). In these three gardens, only organic fertilizer is used to increase yield, no pesticides or other chemicals are used, and the tea leaves are harvested with manual plucking to ensure the tea is the highest quality, because only the top two leaves and the bud are plucked. The tea pickers take the harvested tea to a local collection point on foot, from where the fresh tea leaves are transported in small trucks to the tea processing plant.
Table 11. Emission factors from tea production in three pilot gardens during cradle-to-retail stages
Transportation
Stage
Cultivation and harvesting
Organic fertilizer
N2O
Pilot siteEmission factor4Source GHG
Dabu Longquan Songyang
408 tonnes 198 tonnes 300 tonnes Average nitrogen content 2 %, direct emission factor 0.0178
Volatility 20%, indirect emission factor 0.01
Loss 20%, indirect emission factor 0.0075
Atmospheric sedimentation N2O
Leaching runoff N2O
Electricity CO2 30 000 Kwh 0 Kwh 0 Kwh 0.58735 tonnes of CO2/MWh
Diesel CO2 5 725.5 kg 0 kg 0 kg 46.04 MJ/kg; 0.20 tonnes of CO2/TJ
Gasoline CO2 4 722.38 kg 3 195 kg 3 141.75 kg 46 MJ/kg; 18.9 of CO2/TJ
Processing Electricity CO2 95 792 Kwh 118 560 Kwh 110 000 Kwh 0.58735 tonnes of CO2/MWh
Biomass pellet fuel
CH4 0 tonnes 65 tonnes 40 tonnes 2.7 g/kg of CH4
N2O 0.08 g/kg of N2O
CO2
36 MJ/m3; 15.32 tonnes of CO2/TJ
Natural gas CO2 11 206 m3 4 980 m3 0 m3
28.5 MJ/kg of CO2; carbon content 0.5
Storage and packaging
Electricity CO2 192 Kwh 0 Kwh 5 000 Kwh 0.58735 tonnes of CO2/MWh
Plastic bags CO2 3 200 units 8 492 units 3 500 units 0.58735 tonnes of CO2/MWh
Market & retail
CO2 40 tonnes; 81 km, Meizhou
40 tonnes; 66 km, Shuzhou
2 tonnes; 1 091 km, Qingdao
2 tonnes/vehicle; 10 litre/100 km
12 tonnes; 453 km, Guangzhou
22 tonnes; 215 km, Wenzhou
13 tonnes; 487 km, Fuzhou
13 tonnes; 227 km, Shantou
12 tonnes; 600 km, Shanghai
4 tonnes; 766 km, Wuhan
7 tonnes; 343 km, Huizhou
9 tonnes; 700 km, Nanjing
4 tonnes;1 674 km, Nanning
8 tonnes; 935 km, Nanning
1 tonne; 5 km; Local
4 tonnes; 1 528 km, Beijing
4 Emission factors from NDRC, 2016b and IPCC, 2006.
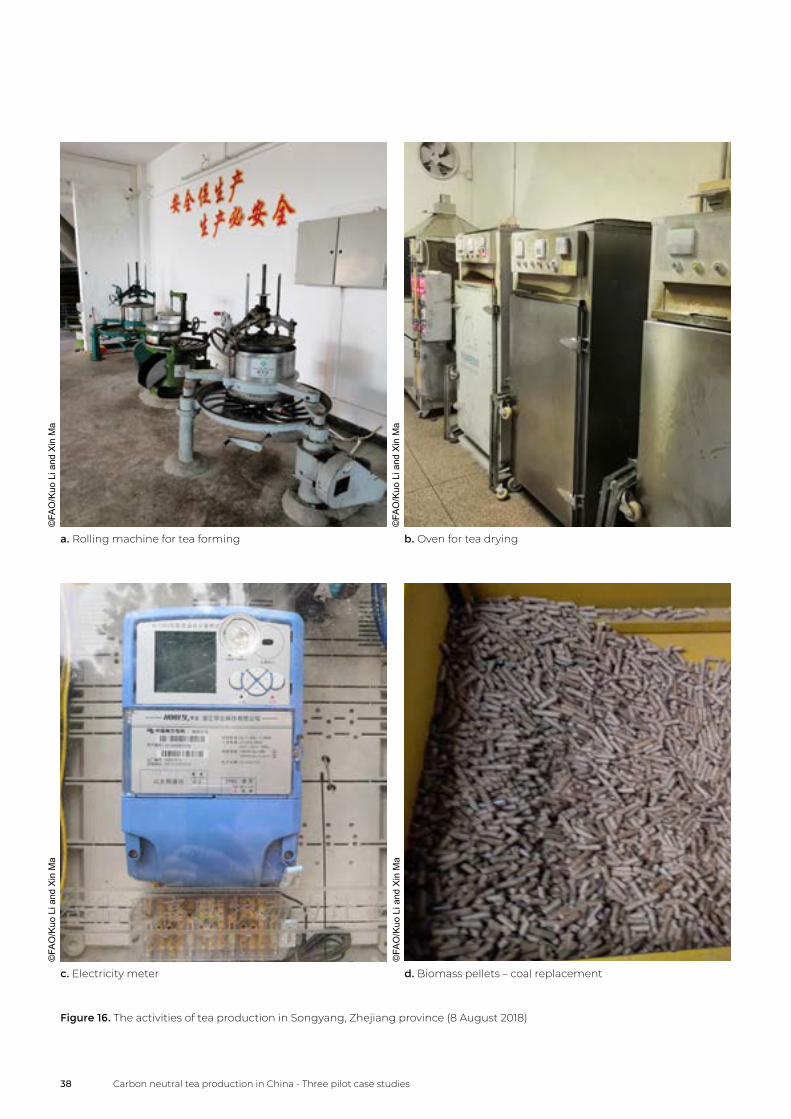
38 Carbon neutral tea production in China - Three pilot case studies
a. Rolling machine for tea forming b. Oven for tea drying
c. Electricity meter d. Biomass pellets – coal replacement
Figure 16. The activities of tea production in Songyang, Zhejiang province (8 August 2018)
©FA
O/K
uo L
i and
Xin
Ma
©FA
O/K
uo L
i and
Xin
Ma
©FA
O/K
uo L
i and
Xin
Ma
©FA
O/K
uo L
i and
Xin
Ma

39IV. Accounting GHG emissions in pilot tea gardens
e. Natural gas f. Bags for tea packaging
g. Vehicle for tea transportation
Figure 16. The activities of tea production in Songyang, Zhejiang province (8 August 2018)
©FA
O/K
uo Li and Xin M
a©
FAO
/Kuo Li and X
in Ma
©FA
O/K
uo Li and Xin M
a
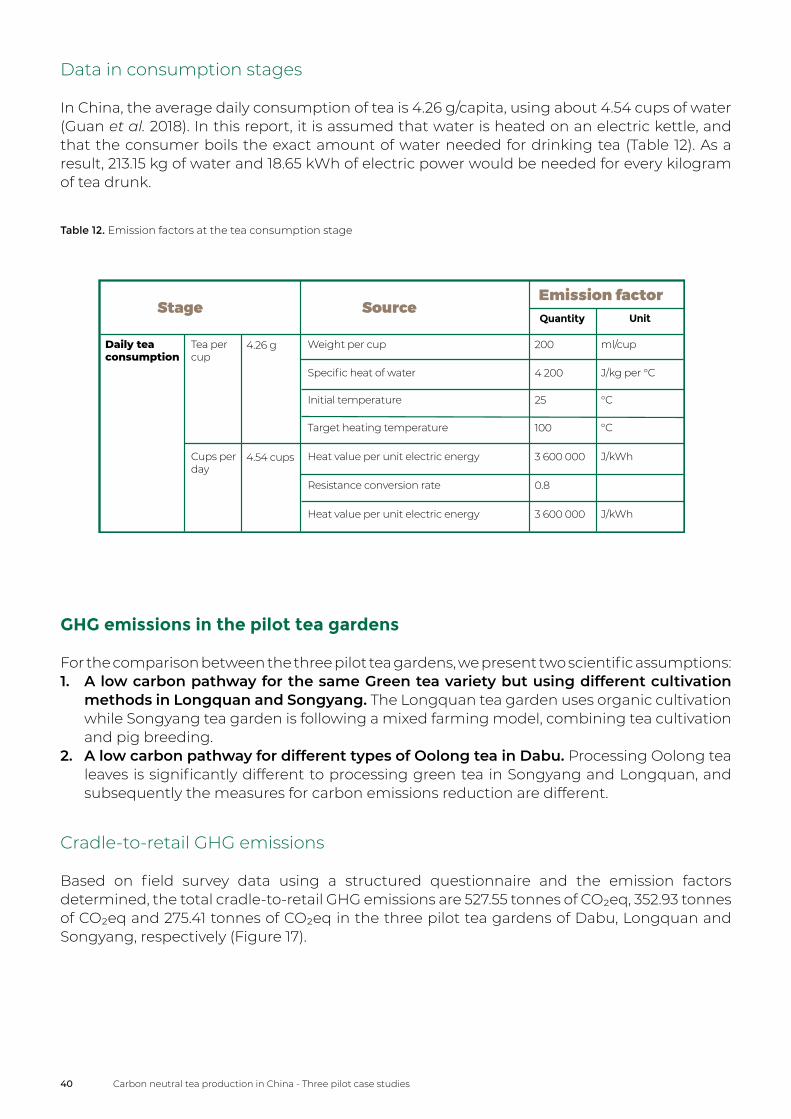
40 Carbon neutral tea production in China - Three pilot case studies
Data in consumption stages
In China, the average daily consumption of tea is 4.26 g/capita, using about 4.54 cups of water (Guan et al. 2018). In this report, it is assumed that water is heated on an electric kettle, and that the consumer boils the exact amount of water needed for drinking tea (Table 12). As a result, 213.15 kg of water and 18.65 kWh of electric power would be needed for every kilogram of tea drunk.
Table 12. Emission factors at the tea consumption stageStrategies
Stage SourceEmission factor
Tea per cup
Daily tea consumption
4.26 g Weight per cup 200 ml/cup
Specific heat of water 4 200 J/kg per °C
Initial temperature 25 °C
Target heating temperature 100 °C
Cups per day
4.54 cups Heat value per unit electric energy 3 600 000 J/kWh
Resistance conversion rate 0.8
Heat value per unit electric energy 3 600 000 J/kWh
Quantity Unit
GHG emissions in the pilot tea gardens
For the comparison between the three pilot tea gardens, we present two scientific assumptions:1. A low carbon pathway for the same Green tea variety but using different cultivation
methods in Longquan and Songyang. The Longquan tea garden uses organic cultivation while Songyang tea garden is following a mixed farming model, combining tea cultivation and pig breeding.
2. A low carbon pathway for different types of Oolong tea in Dabu. Processing Oolong tea leaves is significantly different to processing green tea in Songyang and Longquan, and subsequently the measures for carbon emissions reduction are different.
Cradle-to-retail GHG emissions
Based on field survey data using a structured questionnaire and the emission factors determined, the total cradle-to-retail GHG emissions are 527.55 tonnes of CO2eq, 352.93 tonnes of CO2eq and 275.41 tonnes of CO2eq in the three pilot tea gardens of Dabu, Longquan and Songyang, respectively (Figure 17).

41IV. Accounting GHG emissions in pilot tea gardens
Figure 17. Intensity of GHG emissions from three pilot tea gardens at different stages of the value chain
o
1
2
3
4
5
6
7
8
Cultivation Processing Storage and Packaging Transportation
Dabu Longquan Songyang
Inte
nsi
ty k
g o
f C
O2
eq
/kg
GHG emissions at the consumption stage
According to section 4.2.2, emission intensity is 10.95 kilograms of CO2eq for 1 kg of tea consumption in China. Therefore, the total GHG emissions from tea consumption for three pilot tea gardens were 876 tonnes of CO2eq, 919.8 tonnes of CO2eq and 295.65 tonnes of CO2eq in Dabu, Longquan and Songyang, respectively.
Carbon sink in pilot tea gardens
Based on the GHG emissions calculated above, the pilot tea gardens’ carbon sink was measured. Firstly, the long-term carbon storage of tea gardens was calculated with the data from field samples; and secondly, the tea gardens’ carbon sink was calculated over one year using a statistical formula.
The field sampling for long-term carbon storage estimation
The field sampling was carried out in mid-August 2018 and completed in nine days, with a round trip between Dabu, Longquan and Songyang. The design of field sampling was improved and perfected based on cluster sampling. For the field sampling work, GPS and battery, tape and rope, vernier calliper, soil drill, valve bag, marker pen, etc. were prepared. The details of field sampling are shown in Figure 18 and Figure 19.
Sample determination
• The quadrat size is 20 m per 20 m, and its border is circled by a red cord.• The quadrat is divided, on average, into nine meshes by red cord.• The coordinates of the centre point of the sample are determined by GPS.

42 Carbon neutral tea production in China - Three pilot case studies
Figure 18. The distribution of samples of soil and biomass from tea gardens (upper left: diagrammatic sketch of quadrant; lower left: Songyang; upper right: Dabu; lower right: Longquan)
Soil sampling
• Soil was collected randomly from tea plants in plots No.3, No.5 and No.7.• The soil samples were collected in three depth layers of 0–10 cm, 10–20 cm, and 20–30 cm
with the help of a soil drill.• Soil samples were about 200 g per layer, and impurities (such as gravel) were picked out.• The three soil samples taken at the same depth were mixed, and then one-third of the
total amount was taken, placed in the sample bag and marked.• The remaining of soil was put back into the sampling pit.

43IV. Accounting GHG emissions in pilot tea gardens
Figure 19. Tea plant sampling (field survey carried out in Dabu and Longquan, 4–8 August 2018)
b. Soil sampling
a. 20×20m sampling plot
©FA
O/K
uo Li©
FAO
/Kuo Li

44 Carbon neutral tea production in China - Three pilot case studies
Figure 19. Tea plant sampling (field survey carried out in Dabu and Longquan, 4–8 August 2018)
d. Ground diameter of tea trees
c. Plant height measurement
©FA
O/K
uo L
i©
FAO
/Kuo
Li
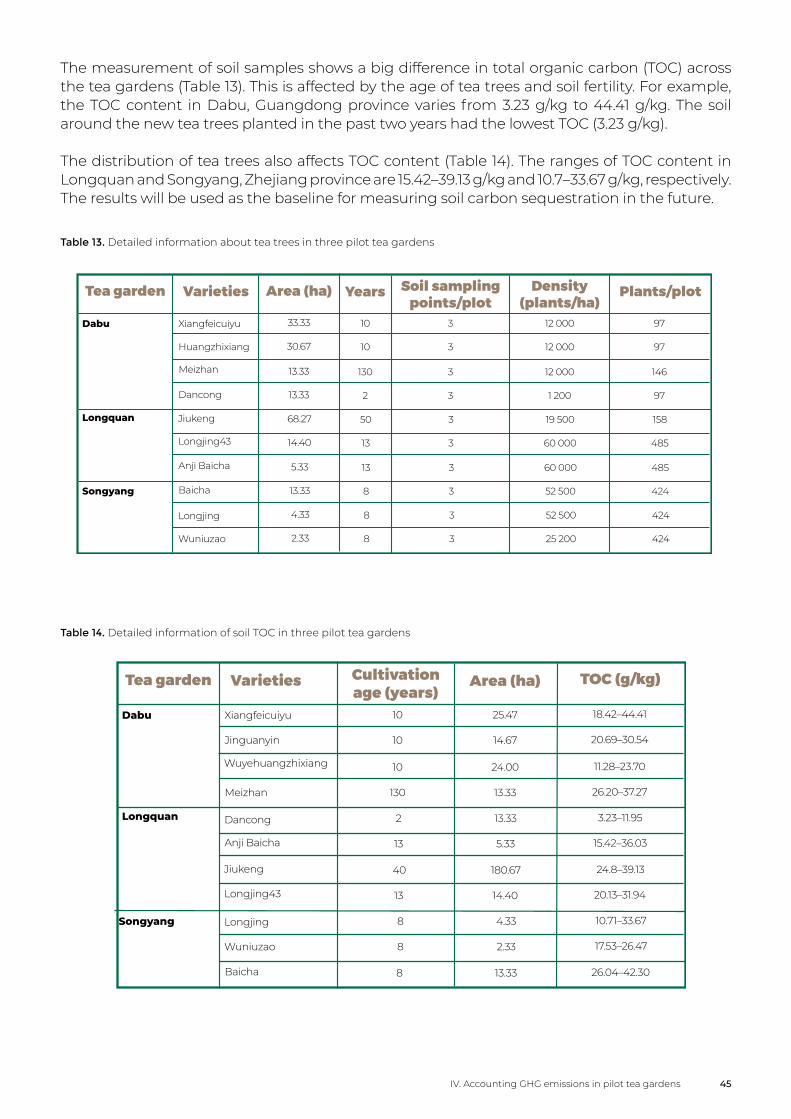
45IV. Accounting GHG emissions in pilot tea gardens
The measurement of soil samples shows a big difference in total organic carbon (TOC) across the tea gardens (Table 13). This is affected by the age of tea trees and soil fertility. For example, the TOC content in Dabu, Guangdong province varies from 3.23 g/kg to 44.41 g/kg. The soil around the new tea trees planted in the past two years had the lowest TOC (3.23 g/kg).
The distribution of tea trees also affects TOC content (Table 14). The ranges of TOC content in Longquan and Songyang, Zhejiang province are 15.42–39.13 g/kg and 10.7–33.67 g/kg, respectively. The results will be used as the baseline for measuring soil carbon sequestration in the future.
Table 13. Detailed information about tea trees in three pilot tea gardens
Xiangfeicuiyu 33.33 10
Tea garden Varieties Area (ha) Years Soil sampling points/plot
Plants/plot
Dabu
Longquan
Songyang
Huangzhixiang
Meizhan
Dancong
Jiukeng
Longjing43
Anji Baicha
Wuniuzao
Longjing
Baicha
3
Density (plants/ha)
12 000 97
30.67 10 3 12 000 97
13.33 130 3 12 000 146
13.33 2 3 1 200 97
68.27 50 3 19 500 158
14.40 13 3 60 000 485
5.33 13 3 60 000 485
13.33 8 3 52 500 424
4.33 8 3 52 500 424
2.33 8 3 25 200 424
Table 14. Detailed information of soil TOC in three pilot tea gardens
Xiangfeicuiyu 10
Tea garden Varieties Area (ha) TOC (g/kg)
Dabu
Longquan
Songyang
Jinguanyin
Meizhan
Dancong
Jiukeng
Longjing43
Anji Baicha
Wuniuzao
Longjing
Baicha
25.47
Cultivation age (years)
18.42–44.41
10 14.67 20.69–30.54
10 24.00 11.28–23.70
130 13.33 26.20–37.27
2 13.33 3.23–11.95
13 5.33 15.42–36.03
40 180.67 24.8–39.13
8 13.33 26.04–42.30
8 4.33 10.71–33.67
8 2.33 17.53–26.47
Wuyehuangzhixiang
13 14.40 20.13–31.94

46 Carbon neutral tea production in China - Three pilot case studies
The carbon sink accounting from tea gardens
Tea growth model
A growth model of tea was selected to estimate the carbon storage:
M = -14.95 + 56.3 (1-e ) (equation 1)Plant-0.27t
Where MPlant is the aboveground biomass (tonnes/ha) and t is the age of the tea plants (Zhang
et al. 2017).
The growth model originated from tea growth data in Zhejiang province, which is considered suitable as a demonstration tea garden. The root/canopy ratio5 of tea is related to the year of planting; the value used is 0.38 or 0.6 after 15 years of planting (Li 2012); while the carbon con-tent is 0.5 above ground or 0.4 belowground.
Calculation of carbon sink in tea gardens
Based on the growth model of tea (equation 1) and the cultivation ages, we calculated the aboveground biomass of tea plants, the belowground biomass was then deduced by the root/canopy ratio of tea, and finally the carbon sink was calculated for the whole biomass multiplied by carbon content and 44/126. The carbon sink of Dabu, Longquan and Songyang were 170.09 tonnes of CO2eq, 6.53 tonnes of CO2eq and 66.23 tonnes of CO2eq in 2017, respectively.
Net GHG emissions in the pilot tea gardens
The difference between GHG emissions and carbon sinks are considered as the remaining emissions, which should be balanced with offset measures for carbon neutrality. If the system is defined as cradle-to-retail, the net GHG emissions are 357.46 tonnes of CO2eq in Dabu, 346.4 tonnes of CO2eq in Longquan, and 209.18 tonnes of CO2eq in Songyang. If consumption is included, the cradle-to-grave net GHG emissions are 1 233.46 tonnes of CO2eq in Dabu, 1 266.2 tonnes of CO2eq in Longquan, and 5 04.83 tonnes of CO2eq in Songyang.
Correspondingly, the intensity of net GHG emissions in the three pilot gardens are 4.47 kg of CO2eq/kg in Dabu, 4.12 kg of CO2eq/kg in Longquan, and 7.75 kg of CO2eq/kg in Songyang (Figure 20). If consumption is considered, the net cradle-to-grave GHG emissions increased to 15.42 kg of CO2eq/kg in Dabu, 15.07 kg of CO2eq/kg in Longquan, and 18.70 kg of CO2eq/kg in Songyang.
There is a great potential to accomplish carbon neutrality in tea production.
5 Root/shoot ratio refers to the fresh or dry weight of belowground and aboveground parts of the plants. Its size reflects the correlation between them.
6 Molecular weight ratio is used in these calculations of CO2 to C: g mol-1 (g mol-1)-1

47IV. Accounting GHG emissions in pilot tea gardens
Figure 20. Intensity of GHG emissions, carbon sink and net emissions in three pilot tea gardens
o
2
4
6
8
10
Dabu Longquan Songyang -4
-2
Dabu Longquan Songyang
Inte
nsi
ty k
g o
f C
O2
eq
/kg
Proposed offset measures for pilot tea gardens
According to the various tea varieties, processing technologies and measures taken at each production stage, the determinants of the GHG emissions in the three tea gardens are different. If considering only the cradle-to-retail stages, more than half of the emissions come from cultivation and harvesting in Dabu, while in Longquan and Songyang more than half of the emissions are due to tea processing (Figure 21). There should be different pathways for the carbon neutrality in the three tea gardens. In Dabu, the potential for GHG emissions reduction is to improve the efficiency of fertilizers; while in Songyang and Longquan, the aim is to improve energy use efficiency, or to make use of clean energy such as solar, water and wind power to replace biomass fuel, thus reducing the consumption of biomass granule fuel.
It can be seen from the comparison between Longquan and Songyang in Figure 20 that there is almost no potential for a carbon sink in Longquan where organic tea cultivation is being practiced and the trees are older. There is still some potential for a carbon sink in Songyang; the tea plants are young, so the low carbon pathways and the carbon offsetting measures are different. Besides low carbon measures taken in the tea gardens, various offsetting measures could also be taken including reforestation/afforestation, the adoption of renewable energy and the purchase of certified carbon credits. In Songyang, the owner of the tea garden also operates a small hydropower station to reduce GHG emissions, though the exact amount of GHG this reduces is not estimated in this report. Hydropower, as a renewable energy source, is considered an effective carbon offsetting measure; upgrading the hydropower station in the future could offset most of the GHG emissions in Songyang.

48 Carbon neutral tea production in China - Three pilot case studies
Figure 21. Percentage of carbon emissions for different production stages in three pilot tea gardens
Cultivation Processing Storage and Packaging Transportation
40%
50%
60%
70%
80%
90%
Dabu Longquan Songyang
20%
30%
100%
0%
10%
In addition to the above business-as-usual offset measures, innovations in governance and marketing could also be introduced in the three pilot tea gardens. For example, forest covers more than 80 percent of the land in Lishui, thus favourable policies could be made to share the carbon sink of the forest with the carbon neutral tea practice in Longquan and Songyang. Innovative pricing mechanisms could also be introduced for tea products from the pilot tea gardens, with consumers paying an extra fee to purchase a certified carbon credit.

49
Despite not being a LC/CN tea certification scheme, there are major tea certification schemes for tea, e.g. Fairtrade, Organic, UTZ Certified and Rainforest Alliance, the latter being the scheme that certified the largest area of tea, as well as the largest volume of tea in 2015 (Table 15). Although multiple certification schemes make it hard to determine the exact amount of certified land across the world, at least 538 thousand ha (or 14.2 percent of the global tea production area) were certified in 2015 (Kemper et al. 2018).
In the case of the pilot tea fields, both Dabu and Longquan are certified by the Organic (Natural) Food Certification Organization-OTRDC in China, and both adhere to the organic standards from IFOAM, which supports international tea trade and works to harmonize the efforts of the many organic certification schemes around the world. IFOAM standards include many climate mitigation and adaptation co-benefits, but do not cover all the stages of the tea value chain that a carbon neutral tea would.
According to IFOAM Organics International, the organic approach reduces GHGs as no chemical nitrogen fertilizers can be used. It also encourages carbon storage in the soil through agroforestry and reduces fossil fuels in transportation through the utilization of internal farm inputs and plant biomass (IFOAM 2020).
Table 15 allows to see that these certification schemes do not address the whole tea value chain and encompass only some climate change mitigation measures, thus, to some extent, these schemes only correspond with LC/CN tea. The aim for FAO and CAAS is to support relevant actors to set targets and facilitate the establishment of LC/CN tea certification schemes with carbon indicators and set goals to reach net-zero GHG emissions for the whole tea value chain.
Moreover, transparency strengthened by a participative approach and traceability are components that ought to be considered in the process of low carbon or carbon neutral certification processes. As certifications/labels target the demand for low carbon products and the many buyers that are becoming aware of their personal carbon footprint, it is important that consumers are fully involved and can verify the origin of the product or be able to access and certify the product’s CO2eq footprint. In the carbon market and carbon trading systems, transparency and traceability are also important. It also provides a method to protect the farmers, ensure decent wages and encourage further mitigation activities to maintain or increase the quality of the product.
V. Certification and labelling
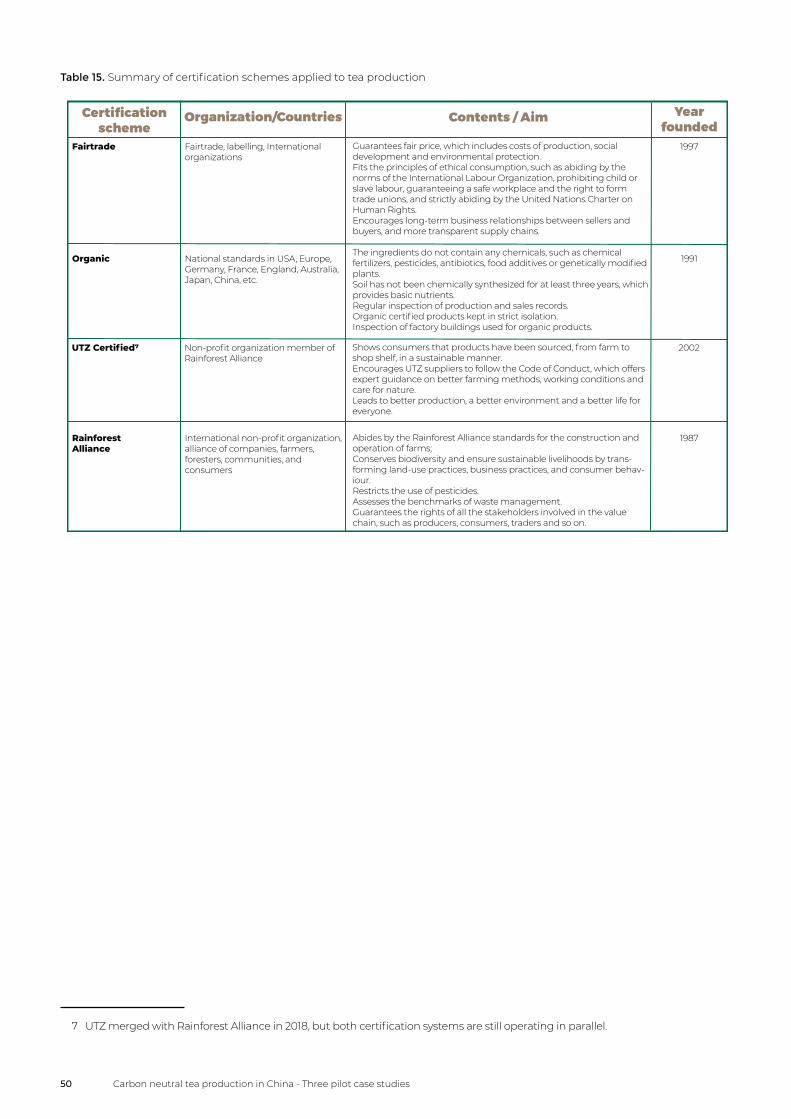
50 Carbon neutral tea production in China - Three pilot case studies
Table 15. Summary of certification schemes applied to tea production
Fairtrade, labelling, International organizations
Certification scheme
Organization/Countries Contents / Aim Year founded
Fairtrade Guarantees fair price, which includes costs of production, social development and environmental protection.Fits the principles of ethical consumption, such as abiding by the norms of the International Labour Organization, prohibiting child or slave labour, guaranteeing a safe workplace and the right to form trade unions, and strictly abiding by the United Nations Charter on Human Rights.Encourages long-term business relationships between sellers and buyers, and more transparent supply chains.
1997
National standards in USA, Europe, Germany, France, England, Australia, Japan, China, etc.
OrganicThe ingredients do not contain any chemicals, such as chemical fertilizers, pesticides, antibiotics, food additives or genetically modified plants.Soil has not been chemically synthesized for at least three years, which provides basic nutrients. Regular inspection of production and sales records.Organic certified products kept in strict isolation.Inspection of factory buildings used for organic products.
1991
Non-profit organization member of Rainforest Alliance
UTZ Certified7 Shows consumers that products have been sourced, from farm to shop shelf, in a sustainable manner.Encourages UTZ suppliers to follow the Code of Conduct, which offers expert guidance on better farming methods, working conditions and care for nature.Leads to better production, a better environment and a better life for everyone.
2002
International non-profit organization, alliance of companies, farmers, foresters, communities, and consumers
Rainforest Alliance
Abides by the Rainforest Alliance standards for the construction and operation of farms;Conserves biodiversity and ensure sustainable livelihoods by trans-forming land-use practices, business practices, and consumer behav-iour. Restricts the use of pesticides.Assesses the benchmarks of waste management.Guarantees the rights of all the stakeholders involved in the value chain, such as producers, consumers, traders and so on.
1987
7 UTZ merged with Rainforest Alliance in 2018, but both certification systems are still operating in parallel.

51V. Certification and labelling
Opportunities for certification
The establishment of a LC/CN tea standardization and certification scheme has enormous potential with the more environmentally conscious consumers. As this report has previously mentioned, among the younger generations in China, the demand for such products is increasing. European, North American and other markets have also been pressured to meet the demand of an ever-growing climate-conscious consumer base (FAO 2018b; Tong et al. 2019). First-comers to such a market may also benefit financially by bringing China's tea products up to date.
LC/CN tea certification is a market-based mechanism that may help increase the level of awareness on the need to adopt low carbon or carbon neutral approaches among producers, consumers and governments. It may motivate producers to produce agricultural crops in environmentally friendly and ecologically sustainable ways. Similarly, it also raises the awareness of consumers about the goods they are consuming and other potential LC/CN agricultural products. For governments, the fulfilment of international commitments and increased export (for example tea or coffee producing countries) are added benefits.
The government could make favourable policies to increase the incomes of smallholder farmers who adopt low carbon agricultural practices under the LC/CN certification mechanism. One key issue is capacity development for the adoption of agreed standards of low carbon agriculture and farming.
Particularly for China, a dynamic approach would help strengthen low carbon and other certifications in the country. Government policy and ambitions to increase the country`s reputation in terms of being environmentally friendly in the tea and other sectors, indicates that China’s emerging middle class is also supporting the change.
Challenges for certification
As in the development of every certification scheme, the engagement and participation of the different actors of a value chain, including the Government, is critical for success (FAO 2018c). It is evident that good local governance and empowering farmers’ groups and organizations will be essential for a successful certification scheme; including them will promote efficiency, building on economies of scale.
Furthermore, establishing a successful LC/CN certification scheme requires the involvement of many stakeholders throughout the tea value chain, and large coordination between all actors, including financial support to ensure the engagement and the infrastructure required from farm-level to the distribution of the product.
The level of consumer awareness regarding low carbon labels also needs to be increased. The awareness of the consumers who are at the end of the value chain is important in order to increase the benefits of the product and sustainability at its source.

52 Carbon neutral tea production in China - Three pilot case studies
Recommendations to obtain certification
The certification of low carbon agricultural products may require advocacy for public-private partnerships aimed at the establishment of legal and policy regulations, capacity development and facilitating national and sub-national processes. Establishing such certification schemes can be done by a diverse range of actors, including governments, consulting firms and non-governmental organizations but because certification addresses the product’s entire value chain, the engagement of all possible actors is essential.
Moreover, because it would encompass different actors throughout the value chain, training and capacity development for them would also be necessary. This would raise awareness, improve a farm’s income, and encourage rural development and market access (Kemper et al. 2018).
Governments could also explore payment for environmental services and willingness to pay or accept carbon taxes and subsidies, produced by increased small-scale biomass and carbon stock changes. Rural income incentives, including planting trees, demarcation of pastoral corridors, and rotational pasturing systems, should be encouraged in par with certified low carbon agricultural techniques or practices already in place. To facilitate this reorientation, governments should pay attention to greater transparency and accountability, the participation of multiple actors, measurable results, and follow-up systems.
There are already many well-established international tea certification schemes, namely Fairtrade, Organic, the Rainforest Alliance and UTZ, which are already on the market and may engage with farmers and countries to adapt and/or develop standards to include extra steps to mitigate carbon emissions throughout the tea’s value chain, based on existing certification mechanisms.
The governments of countries may also cooperate to develop common standards for LC/CN tea production, which can form the basis for certification schemes in their countries. For example, China as the world’s largest producer and consumer of tea, and Kenya as the largest tea exporter, could work together to share their expertise and working experience, to guide other countries in ways of reducing their GHG emissions to achieve a win-win strategy that copes with climate change. If these two countries and other tea growing countries develop a common standard through a South-South Cooperation initiative, other tea producing countries may also follow and so would the private sector.

53V. Certification and labelling
Box 2. FAO and low carbon certification and labellingBased on the experiences and lessons learned from the carbon neutral tea production exercise in China and other low carbon agricultural initiatives, FAO seeks to work with key stakeholders to develop guidelines and methodologies for certifying and labelling low carbon and carbon neutral agricultural products, including tea and other crops. Guidelines could include minimum standards for quality, GHG mitigation, biodiversity conservation and livelihood protection.
Based on existing certification schemes for the sustainable production of agricultural products, partnerships can be formed with government agencies, international, non-governmental organizations, producer organizations and the private sector to establish such guidelines. Regarding the development and codification of methodologies, the approach used in the model tea gardens in China can assist in establishing standards for the measurement of GHG emissions along entire value chains and the identification of reduction potential.
FAO can facilitate the establishment of transparency and traceability criteria along value chains to ensure that the positive effects of certification reach smallholder farmers and improve awareness and trust among consumers. The Organization can also support countries, communities and the private sector to adopt and implement other innovative technologies, including the application of distributed ledger technologies (DLT), such as blockchains, as a method to establish traceability throughout the value chain, maximize efficiency and transparency of transactions, and facilitate carbon accounting and offsetting to engage with carbon markets (Tripoli & Schmidhuber 2018).
Furthermore, FAO can promote collaboration and coordination among the different stakeholders in the certification process. By cooperating with governments of Member Countries, FAO can help to develop a supportive environment for certification schemes of low carbon and carbon neutral agricultural commodities. Such actions could support the improvement of livelihoods and the security of production processes for smallholder farmers.

54
Transition point
Tea productivity
Mitigation
Adaptation
Productivity
Intensified low carbonpathway
Trend of business-as-usual low carbon pathway
Trend of business-as-usual adaptation measures
Trend of business-as-usual productivity
Added value of carbonneutrality
Intensive adaptation measures
Synergy of adaptation and mitigation
Intensive mitigation measures
Offset measures
Figure 22. Conceptual pathway for carbon neutrality in tea production
In the proposed pathway for carbon neutral tea production (Figure 22), low carbon development is accompanied by enhanced climate change adaptation measures to ensure tea productivity. After the accounting of GHG emissions from tea production has been carried out, intensive adaptation measures should be taken in synergy with intensive mitigation measures to boost low carbon development and ultimately carbon neutrality through carbon offset measures.
Carbon neutral tea production is consistent with the low carbon agriculture approach, which aims to increase agricultural productivity and income, while adapting to and mitigating the effects of climate change.
VI. A way forward: achieving carbon neutral tea production

55VI. A way forward: achieving carbon neutral tea production
The added value of a carbon neutral tea value chain
Traditional value chains contain biomass production, processing and services including transportation, storage, retail, consumption, and ecotourism. The added value of the carbon neutral tea value chain includes climate change mitigation, promotion of institutional and technological innovation, opportunities to organize ecotours with carbon neutral tea production demonstrations, and carbon neutral tea certification schemes (Table 16). It is a pioneering action to implement the Paris Agreement and will be an important reference when working to ensure other crops and even the agricultural sectors become carbon neutral.
Tea planting and harvesting
Value chain Biomass production Processing Services
Traditional tea value chain
Primary processing & refining
Transportation, domestic and international trading, warehouses, e-commerce
Components
Tea arts and culture, ecotours, etc.Added value
Carbon neutral tea value chain
Tea planting and harvesting, maximizing climatic resources and other natural resources, lower input
High-efficiency energy use
Branded, carbon neutral tea products
Components
Carbon neutrality concept disseminated to encourage climate change mitigation.Promotion of institutional and technological innovations.Ecotours with carbon neutral demonstrations.Carbon neutral tea certification schemes.
Added value
Table 16. Comparison of traditional and carbon neutral tea value chains

56 Carbon neutral tea production in China - Three pilot case studies
Scalability
This report analyses the elements and key attributes of carbon neutral tea based on the three case studies in China. It presents the groundwork to be replicated and scaled up in China and in other tea growing countries to improve tea value chains and reach the SDGs and their NDCs.
Both FAO and CAAS are dedicated to supporting countries and partners to introduce climate change mitigation activities into tea growing communities. There are several opportunities for scalability that are worth highlighting.
Through the development of LC/CN tea standardization and certification, governments, farmers and the private sector may be empowered and incentivized to implement and produce carbon neutral tea. Besides the many benefits of the practice, the production meets the growing demand for climate-conscious consumers, it improves the value chain of tea and the livelihoods of those who depend on it. It creates different economic incentives, including engagement in international carbon markets and circular economy.
Additionally, tea in many of the top tea growing countries such as China, is produced for local consumption and thus the products are not packaged and transported far until they are consumed, resulting in a lower GHG footprint. However, in many tea growing countries in Africa, where most of the yield is packed and transported to European and North American countries, the tea value chain has greater potential for upscaling and the possibility to secure the livelihoods of farmers, increase the cultivation of climate-resilient tea, and improve the crop’s value chain (ITC 2014).
Furthermore, climate mitigation in tea production does not just come from carbon neutral tea production, but also through climate change mitigation activities. The best practices and recommendations highlighted in this report can support and facilitate the implementation of relevant mitigation components in the tea sector and increase the sustainability of any tea value chain.

57VI. A way forward: achieving carbon neutral tea production
Box 3. FAO’s Global Low Carbon Initiatives for Tea Pro-duction (GLI-TEA)One of FAO’s next steps on LC/CN tea is to scale up the approach through multilateral cooperation between Kenya, China and Germany. The main goal of this project is to decrease the carbon emissions throughout the tea value chain in a pilot project in Kenya by implementing methodologies developed by CAAS (codified in this report) and a two-way knowledge exchange between Chinese and Kenyan tea growers and researchers.
The tea value chain can become CO2 neutral and more resilient to climate change, contributing to the increased sustainability of the agricultural sectors and improving the livelihoods of tea producers. The Programme, set to start in 2020, also aims to engage tea farmers and the private sector from other tea growing countries including Sri Lanka, Malawi and Rwanda, to share best practices, develop their capacities and a common set of LC/CN tea standards and labeling. The expected outputs of the programme are:1. Research on low carbon tea production and processing technologies in Kenya and
relevant methodologies and guidelines are developedResearch and evaluation of GHG emissions in the tea value chain in Kenya would create a baseline for assessing the low carbon technologies and methodologies developed by CAAS at farm level and by GIZ at factory level. Through pilot plots and factories, farmers, research institutes, governments, non-state actors and private sector actors can pool their expertise to deliver an innovative methodology for a low carbon tea value chain in Kenya.2. Tea value chain actors in Kenya and other partners are given a better understanding
of low carbon food production through capacity developmentNeeds assessments and strategy formulation are conducted at each stage of the tea value chain to develop and validate training modules and capacity development activities in cooperation with FAO, CAAS, GIZ, and other partners. Capacity development of the relevant stakeholders is strengthened through training, field visits, and symposiums to share best practices, technology and experience, as well as to implement the different innovative practices at farm-, factory-, storage-, and packaging-levels. The outcome aims to develop the capacity of stakeholders at different stages in the Kenyan tea value chain, with the underlying goal of improving the capacities and livelihoods of smallholder farmers.3. Conditions for integrating low carbon tea practices into policy formulation are
improvedThrough in-depth analysis of the current policy environment, a stocktaking document could be developed to serve as a baseline for policy dialogue. A multi-stakeholder dialogue would support the development of recommendations on policies to support the implementation of LC tea value chains. The partners will also develop guidelines for easy access to certification and labeling of low carbon tea, to mainstream low carbon tea requirements to complement existing standards, certifications and labels.4. Knowledge products are disseminated at national, regional and international levelBest practices and knowledge products should be developed and disseminated through national, regional and international actors using guidelines, reports, events and a knowledge-sharing platform to connect stakeholders and improve their capacities.The project also aims to organize knowledge exchange visits for other tea-growers to Kenya, and Kenyan tea-growers to other countries.
The project also aims to organize knowledge exchange visits for other tea-growers to Kenya, and Kenyan tea-growers to other countries.

58
In this report, we introduced tea production in China and its importance around the globe. The impacts of climate change on tea production in China were reviewed, the vulnerability of China's tea production to climate changed and the adaptation and mitigation measures were summarized. Three pilot tea gardens in Dabu, Guangdong province, and Longquan and Songyang in Lishui, Zhejiang province were selected for the pioneering investigation into GHG emissions accounting to provide a scientific baseline for tea to achieve a carbon neutral status. The conclusions are as follows:
1. China’s tea production has been seriously affected by climate change; the northern boundary of the area of tea cultivation has expanded northwards. The suitability of tea planting increased in the northern tea planting regions of China and decreased in southern China. Extreme climatic events, typically heat waves, cold temperature, and drought were aggravated and caused a series of ecological consequences, such as an outbreak of pests and diseases, loss of biodiversity and land degradation. An obvious effect of climate change impacts on tea production is that cold damage has been greatly exacerbated.
2. China’s tea production is facing great challenges to climate change. Many tea gardens are vulnerable due to their small size and lack of diverse tea varieties. Land degradation due to soil erosion, overuse of pesticides and chemical fertilizers, insufficient infrastructure to protect the tea gardens from agro-meteorological disasters, short value chains needing extensive management, and weakness in early-warning systems with poorly developed insurance mechanisms are main challenges.
3. Many climate change adaptation measures have been taken. Breeding stress-resistant (against cold, heat, drought, and insects) tea varieties is a priority to cope with climate change and to increase the tea yield. Improved irrigation, fertilization, plucking, agroforestry, and shading are all standard ways of enhancing tea garden ecology and preventing disaster damage. Sticky traps and biological technologies are used for pests and diseases control. There has been progress on early-warning systems and financial insurance, but they need to be strengthened.
4. Considerable effort has been put into low carbon tea production. Low carbon tea production is possible with mitigation measures in place to sequester CO2 from the atmosphere and/or reduce GHG emissions at each step of the value chain. Using organic amendment and preventing soil erosion can increase the volume of organic matter stored in the soil. Optimizing fertilizer management can reduce GHG emissions from soil. Changing and optimizing energy use in tea processing, storage and transportation can also reduce GHG emissions. Green consumption and reducing the carbon footprint of tea packaging are advocated.
5. Pioneering investigation has been carried out to develop the LCA methodology for accounting cradle-to-grave GHG emissions in the pilot tea gardens, based on PAS2050. An important initial step is collecting the primary data at activity level using structured questionnaires, soil and biomass sampling for carbon sink estimation, and gathering secondary data related to emission factors from a literature review and IPCC guidelines. Climate change adaptation and low carbon technologies revealed through field surveys and interviews with tea farmers should then be adopted.
VII. Final remarks

59VII. Final remarks
6. The intensity of net cradle-to-retail GHG emissions are estimated as 4.47 kg of CO2eq/kg in Dabu, 4.12 kg of CO2eq/kg in Longquan, and 7.75 kg of CO2eq/kg in Songyang. As intensity of GHG emissions for tea consumption could reach 10.95 kg of CO2eq/kg, it means that cradle-to-grave GHG emissions could reach at least 15.42 kg of CO2eq/kg in Dabu, 15.07 kg of CO2eq/kg in Longquan, and 18.70 kg of CO2eq/kg in Songyang. According to demand there is great potential for accomplishing carbon neutrality in the tea value chain.
7. There are different pathways for carbon neutrality following GHG emissions accounting in the three pilot tea gardens. Offset measures could be reforestation/afforestation and adoption of renewable energy. There are also opportunities for policymaking, technology development, funding through financing mechanisms, and institutional innovations.
Limitations of the Report
The report presents a preliminary pioneering investigation on GHG accounting in three pilot tea gardens in 2017. The study could be improved to provide more robust scientific evidence to achieve concrete carbon neutrality in tea production through intensive low carbon actions and carbon offsetting.
A. Limited time for GHG accounting in the pilot tea gardens. The assessment in the tea gardens took place over a short period of time in 2017. An assessment of carbon neutral coffee in Costa Rica (Birkenberg & Birner 2018) took five years and looked at GHG accounting, intensive low carbon actions, verification, accreditation, and finally certification for carbon neutral coffee products. This project should be prolonged to reduce uncertainties and take further actions to obtain carbon neutral certification for tea.
B. Lack of systemic data records. Primary data is essential for the accurate accounting of GHG emissions in the pilot tea gardens. In this report activity level data (ALD) was obtained from both interviews and structured questionnaires with farmers on the pilot tea farms. In the absence of systematic data records, depending on the subjective feelings of interviews and questionnaires may have led to some discrepancies. In addition, it is difficult to ensure the accuracy of the collected information due to the lack of supporting documents or information on record. The shrub growth model is used to assess the carbon sink produced by the growth of tea trees; however, the shrub growth model cannot be applied to evaluate the entire life of the tea plants. Moreover, the carbon emission factors adopted in this report are default values from the IPCC and/or national guidelines, so systematic work should be carried out on data records to reduce uncertainty in GHG emissions accounting.
C. More work to overcome uncertainties surrounding GHG emission estimations. The cradle-to-retail net GHG emissions intensity in the three pilot gardens are 4.12–7.75 kg of CO2eq/kg. Considering the Chinese habit of drinking tea, boiling water is also part of the process and means that GHG emissions could reach 10.95 kg of CO2eq/kg at the consumption stage. Compared with the emissions of 2.830 kg of CO2eq/kg and 4.532 kg of CO2eq/kg in two green tea processing lines reported by Cheng and Liao (2016) and 9.2 kg of CO2eq/kg reported by Azapagic et al. (2016) that also assumed boiling the water by electric power, the accounting results of this report are basically reasonable, but still slightly higher. Different tea drinking habits and tools have a great impact on the accounting results. This study is based on the simple assumption that tea-drinking habits are consistent. Therefore, follow-up research should consider as many different tea-drinking habits as possible, to reduce uncertainties surrounding GHG emissions at the consumption stage. Nonetheless, these results remind us that consumer demand plays a role in achieving carbon neutrality.

60 Carbon neutral tea production in China - Three pilot case studies
D. Waste management is not considered in the GHG emissions accounting. Though the LCA method assesses GHG emissions from cultivation to consumption, waste management was not considered in this report. Thus, the estimation of the GHG emissions for the entire tea value chain may be underestimated.
E. The synergy of adaptation and mitigation actions was not studied. Climate change has a direct impact on tea production during planting and has secondary effects on other tea production processes. These effects are mainly the impact on tea processing, transportation, sales and even consumption. At present, adaptation measures are in place during tea planting, but not at the other stages. Therefore, it is necessary to further strengthen the quantitative assessment and clarify the effect of integrated adaptation measures on reducing GHG emissions throughout the whole value chain.
F. The offset measures for carbon neutral tea production are proposed but need to be verified in practice. Based on the accounting of GHG emissions in the three pilot tea gardens in 2017, offset measures such as reforestation/afforestation, use of renewable energy, and innovations in policy making and financing mechanisms, were proposed, but the effects of these measures were not verified. More innovative pathways for carbon neutrality in tea production using institutional and technological innovations should also be explored. Pioneering action is needed to support and ensure carbon neutral practices in tea production in China.
G. The socioeconomic context could be enriched further through carbon neutral tea production. The report discusses more about the physical and biophysical aspects of the tea production and does look in depth at the socioeconomic issues. The tea industry includes biomass production, different kinds of processing for different types of tea (Green, Black, Oolong, White, Yellow, Dark), and complex services that include transportation, storage, retail, and consumption, as well as ecotourism. Carbon neutral tea is an opportunity to expand the value chain to be longer and more profitable. The benefits include carbon neutrality for planetary health, the development of a sustainable tea industry, greater soil fertility and other ecological benefits, and economic benefits due to improved tea quality, ecotourism and packaging. The opportunities for financial, institutional, and technological innovations, and creating favourable policies to promote a carbon neutral tea industry need to be discussed in depth.
H. Present sex-disaggregated data and include gender and youth issues. Building the carbon neutral tea industry can also create opportunities for gender equity. At present, in the three pilot gardens, there are more female workers than male, male staff members are mainly working in management and mechanical operations and though the owner of the tea garden in Longquan is a woman, female staff are usually the tea pickers. New job opportunities for women, who are strong advocates of environmental protection and sustainable development, could be created through a carbon neutral tea industry.
Suggestions and recommendations for policymakers
All three pilot tea gardens are distributed in the economically developed eastern zone of China and are concentrated on growing Green tea or Oolong tea. The case study should be expanded to the central and southwestern tea zones, and improved by including other tea varieties, such as White tea, Yellow tea, Red tea (named as Black tea in western countries) and Dark tea.

61VII. Final remarks
A data archive is important to save all the ALD related to carbon emissions, including an index of tree growth, tea usage, price of agricultural inputs, and the type and amount of energy used. Systematic data collection, analysis and reporting on carbon emissions would make accounting process and third-party certification possible.
Certification of carbon neutral tea products will help increase tea quality, support the tea industry in becoming carbon neutral, and expand the value-added product range of tea.
It is also recommended that institutional, financial, and technological innovations related to producing carbon neutral tea are promoted, as well as the concept of carbon neutrality among consumers. A new cost-sharing mechanism needs to be established to enable consumers to pay for carbon neutral tea products.
Insights for South-South Cooperation
This report presents pioneering research through an LCA of tea in three pilot tea gardens. Greenhouse gases (GHG) accounting was carried out from ‘cradle-to-grave’, excluding the measurement of GHG from waste disposal. The methodology could be further developed to produce guidelines on how to collect data at activity level through structured questionnaires, how to manage soil and biomass sampling for carbon sink estimation, how to determine the emission factors, and how to design a scheme to achieve carbon neutrality and standardize the certification.
Permanent experiment and demonstration base for South-South Cooperation
It is suggested that a permanent experiment and demonstration base for South-South Cooperation in the framework of FAO should be established for international knowledge sharing and to support the formation of a methodology and guidelines to achieve carbon neutrality in tea production.
The base would contain a complete system to archive all preliminary data on climate, tea growth, biomass production, inputs to the tea garden, energy consumption for tea field management and processing. It should include trading and marketing records for carbon emissions accounting. The base could be a demonstration platform to present what it means to be carbon neutral or to have a net-zero carbon footprint, the rationale, the current status of GHG emissions and sinks and the principles of carbon neutral tea production.
Activities for capacity development
Based on the methodologies and demonstration base, a series of activities could be designed to help countries in the southern hemisphere to foster their own low carbon development strategies and incorporate carbon neutral tea into their strategic development objectives, such as poverty alleviation and green economy.
Development of South-South and Triangular Cooperation programmes
South-South and Triangular Cooperation programmes should be developed to exchange expertise, share knowledge and construct a low carbon technology system to investigate the potential of grassroots technology and the transfer of high-tech technologies such as IoT and Big Data.

62
Adaptation: The process of adjustment to actual or expected climate and its effects. In human systems, adaptation seeks to moderate or avoid harm or exploit beneficial opportunities. In some natural systems, human intervention may facilitate adjustment to expected climate and its effects.
Adaptive capacity: The ability of systems, institutions, humans, and other organisms to adjust to potential damage, to take advantage of opportunities, or to respond to consequences.
Carbon neutral tea production: No net increase in the global emission of GHG to the atmosphere during tea production, being climate-friendly and sustainable.
Carbon neutrality: Achieving net-zero GHG emissions by balancing carbon emissions with mitigation and carbon removal (often through carbon offsetting).
Climate-smart agriculture: Agriculture that sustainably increases productivity, income and the ability to adapt and build community resilience to climate change, and reduces and/or removes greenhouse gas emissions, where possible.
Carbon sequestration: Removal of carbon from the atmosphere.
Carbon storage: Retaining carbon of biogenic or atmospheric origin in a form other than as an atmospheric gas.
Exposure: People, livelihoods, species or ecosystems, environmental functions, services, and resources, infrastructure, or economic, social, or cultural assets that could be adversely affected through their presence in different places and settings.
Impact: The effects on natural and human systems. It is used primarily to refer to the effects of extreme weather and climate events and of climate change on natural and human systems. Impacts generally refer to effects on lives, livelihoods, health, ecosystems, economies, societies, cultures, services, and infrastructure due to the interaction of climate changes or hazardous climate events occurring within a specific time period and the vulnerability of an exposed society or system. Impacts are also referred to as consequences and outcomes.
Low carbon agriculture: An agricultural approach that ensures a reduction in greenhouse gas emissions throughout agricultural value chains in a sustainable manner which simultaneously contributes to the achievement of several Sustainable Development Goals.
Low carbon tea production: Tea production that emits minimal GHGs into the biosphere.Mitigation: A human intervention to reduce the sources or enhance the sinks of GHGs.
Offset measures: A unit of CO2eq emissions that is reduced, avoided, or sequestered to compensate for emissions occurring elsewhere.
Risk: The potential for consequences where something of value is at stake and where the outcome is uncertain, recognizing the diversity of values. Risk is often represented as the probability of occurrence of hazardous events or trends multiplied by the impacts if these events or trends occur. Risk results from the interaction of vulnerability, exposure, and hazard.
Glossary

63Glossary
Sensitivity: The degree to which a system or species is affected, either adversely or beneficially, by climate variability or change. The effect may be direct (e.g. a change in crop yield in response to a change in the mean, range or variability of temperature) or indirect (e.g. damage caused by an increase in the frequency of coastal flooding due to sea level rise).
Vulnerability: The propensity or predisposition to be adversely affected. Vulnerability encompasses a variety of concepts and elements including sensitivity or susceptibility to harm and lack of capacity to cope and adapt.

64
AnnexesAnnex 1. Questionnaire forms designed by IEDA, CAAS
Basic information of tea cultivation
Name of the tea garden
Total area (ha)
Name of the tea variety
Planting area (ha)
Average tree height (cm)
Total amount trimmed from bushes per year (kg)
Geographic location
Main tea varieties
Tea age (years)
Total number of tea trees per ha
Average diameter at breast height (cm)
Total amount of fresh leaves picked per year (kg)
Field management measures
Description of the main field management measures:
Fertilizer types
Pesticide type
Chemical
Organic
None
Chemical
Organic
None
Energy type used for tea garden'smanagement
Electricity
Coal
Wood
Gas
Other
Annual amount of each fertilizer
Annual amount of each pesticide
Annual irrigation volume
Annual consumption of each energy type used for tea garden's management
Fresh tea leaves processing
Description of the main tea processing steps and machines involved:
Energy type used for tea processing machine 1 Name:
Energy type used for tea processing machine 2 Name:
Electricity
Coal
Wood
Gas
Other
Annual consumption of each energy type used for tea processing
Annual consumption of each energy type used for tea processing
Electricity
Coal
Wood
Gas
Other
... Electricity
Coal
Wood
Gas
Other
Annual consumption of each energy type used for tea processing
Annual tea production of each tea variety (kg):
Main irrigation type

65Annexes
Tea products storage and package
Description of the main storage and packaging:
Packaging Plastic
Paper
Cloth
Energy type used for packaging
Electricity
Coal
Wood
Gas
Other
Annual consumption of each packaging materials
Annual consumption of each energy type used for packaging
Tea products transportation
Description of the main transportation means:
Highway transportation distance (km)
Railway transportation distance (km)
Annual fuel consumption for highway transportation
Air transportation distance (km)
Other
Other transportation means and energy consumption
Annual electricity consumption for storage
Basic information of tea cultivation
Name of the tea garden
Total area (ha)
Name of the tea variety
Planting area (ha)
Average tree height (cm)
Total amount trimmed from bushes per year (kg)
Geographic location
Main tea varieties
Tea age (years)
Total number of tea trees per ha
Average diameter at breast height (cm)
Total amount of fresh leaves picked per year (kg)
Field management measures
Description of the main field management measures:
Fertilizer types
Pesticide type
Chemical
Organic
None
Chemical
Organic
None
Energy type used for tea garden'smanagement
Electricity
Coal
Wood
Gas
Other
Annual amount of each fertilizer
Annual amount of each pesticide
Annual irrigation volume
Annual consumption of each energy type used for tea garden's management
Fresh tea leaves processing
Description of the main tea processing steps and machines involved:
Energy type used for tea processing machine 1 Name:
Energy type used for tea processing machine 2 Name:
Electricity
Coal
Wood
Gas
Other
Annual consumption of each energy type used for tea processing
Annual consumption of each energy type used for tea processing
Electricity
Coal
Wood
Gas
Other
... Electricity
Coal
Wood
Gas
Other
Annual consumption of each energy type used for tea processing
Annual tea production of each tea variety (kg):
Main irrigation type

66 Carbon neutral tea production in China - Three pilot case studies
Detailed Local Situation
Item Measures Detailed descriptions
Remarks
Varieties Changes of varieties Have tea varieties ever been changed since the foundation of the tea garden? Please describe the time, reason, and changing area.
Features of each current variety
Please describe its yield per unit area, genotype, stress resistance characteristics (such as drought resistance, insect resistance and so on) and final tea product types (such as green tea, black tea and so on).
Irrigation Rainfall only Please describe the drought threat to the tea garden, including the frequency, duration, and intensity of drought.
Flood irrigation Please provide information about the irrigation time, frequency and volume of water used.Sprinkle irrigation
Drip irrigation
Canals and ditches
Fertilizer Chemical fertilizer
Please provide detailed information about the investors and construction time.
Organic fertilizer Please provide the name, type (such as pig manure, chicken mature and so on) and the amount of fertilizer applied.
Pest control Chemical pesticide
Please provide the name and amount of pesticide applied.
Sticky traps Please provide the total quantity and placement in the tea garden.
Other measures Please describe the measures in detail.
Disaster prevention and mitigation
Heat wave Please give detailed information about how to cope with the disaster using local practices. If one of these disasters has not affected your tea garden, pleasefill the blank with "NA".
Cold damage
Frost
Drought
Flood
Other disasters
Please provide the name, type (such as nitrogenous fertilizer, phosphate fertilizer, potasium fertilizer and so on) and the amount of fertilizer applied.
Please provide the name and amount of pesticide applied.
Field management
Weeding Please provide detailed information about weeding methods (manual, by machine, using weedicide etc.).
Water and soil conservation
Please give a detailed description about these management measures.
Other measuresPlease give detailed descriptions if there are any.

67Annexes
Tea processing
Sunning The power used at the different stages of tea processing (manual, electricity, natural gas, firewood etc.).
Fixation
Transportation Type of transport Please provide the main type of transport (road, rail, air).
Sales Sales mode Please describe the main sales mode and volume (retail, wholesale, internet etc.).
Rolling
Drying
Screening
Refining
Packing

68
ReferencesAhmed, S., Orians C.M., Griffin, T.S., Buckley, S., Unachukwu, U., Stratton. A.E., Stepp. J.R., Robbat, A.Jr., Cash. S. & Kennelly E.J. 2014. Effects of water availability and pest pressures on tea (Camellia sinensis) growth and functional quality. AoB Plants, 6(3):623-626 (also available at: https://doi.org/10.1093/aobpla/plt054).
Azapagic, A., Bore, J., Cheserek, B., Kamunya, S. & Elbehri, A. 2016. The global warming potential of production and consumption of Kenyan tea. J. Clean. Prod. 112:4031–4040 (also available at: https://doi.org/10.1016/j.jclepro.2015.07.029).
Birkenberg, A. & Birner, R. 2018. The world's first carbon neutral coffee: Lessons on certification and innovation from a pioneer case in Costa Rica. Journal of Cleaner Production, 189: 485-501 (also available at: https://doi.org/10.1016/j.jclepro.2018.03.226).
BSI. 2008. PAS 2050:2008 Specification for the assessment of the life cycle greenhouse gas emissions of goods and services. British Standards Institute. London (also available at: http://www.carbonconstruct.com/pdf/pas_2050.pdf).
Cai, X., Li, YS., Yang, PX., Li, C., He, WX. & Yue, CN. 2018. Current situation and prevention measures of nonpoint source pollution in tea plantations. Sericulture and Tea Newsletter, 06: 24-26 (in Chinese).
Cannon, RJC. 2004. The implications of predicted climate change for insect pests in the UK, with emphasis on non‐indigenous species. Global Change Biology, 4(7): 785-796. (also available at: https://doi.org/10.1046/j.1365-2486.1998.00190.x).
Cao, XY., Zhong, SQ., Chen, Z. & Cao, SH. 2015. Investigation and analysis of chilling injury in tea leaves in spring. China Tea, 37(07): 25-26 (in Chinese).
Castro, R. 2015. Eco-Competitiveness and Eco-Efficiency: Carbon Neutrality in Latin America. Viewpoints, Harvard Project on Climate Agreements (also available at: https://www.hks.harvard.edu/sites/default/files/centers/mrcbg/files/151100_castro_vp.pdf).
Chang, K. 2015. World tea production and trade: Current and future development. FAO, Rome (also available at: http://www.fao.org/3/a-i4480e.pdf).
Chang, K. & Brattlof, M. 2015. Socio-economic implications of climate change for tea producing countries. FAO, Rome (also available at: http://www.fao.org/3/a-i4482e.pdf).
Chen, Y. 2018. Green control technologies of main pest and diseases in tea cultivation. Agriculture and Technologies, 38(21): 96-97 (in Chinese).
Cheng, Z. & Liao, Q. 2016. Analysis on carbon emissions of green tea production according to PAS 2050. Hubei Agric. Sci., 3, 608–611 (in Chinese).
FAO. 2001. First and second level sub-national boundaries for China [online]. [Cited 15 April 2020]. http://www.fao.org:80/geonetwork?uuid=cd58c020-88fd-11da-a88f-000d939bc5d8

69References
FAO. 2011. “Energy-Smart” Food for People and Climate: Issue Paper. FAO, Rome. 66 pp (also available at: http://www.fao.org/3/i2454e/i2454e00.pdf).
FAO. 2017. FAO Strategy on Climate Change. Rome (also available at: http://www.fao.org/3/a-i7175e.pdf).
FAO. 2018a. Intergovernmental Group on Tea: CCP:TE 18/CRS1 “Current Market Situation and Medium Term Outlook for tea to 2021”. Hangzhou, China (also available at: http://www.fao.org/3/BU642en/bu642en.pdf).
FAO. 2018b. Intergovernmental Group on Tea: CCP:TE 18/2 “Emerging trends in tea consumption: informing a generic promotion process”. Hangzhou, China (also available at: http://www.fao.org/3/MW522EN/mw522en.pdf).
FAO. 2018c. Intergovernmental Group on Tea: CCP:TE 18/4 “Fostering sustainability in tea production and trade: assessing the impact of certification schemes on farm incomes, inclusive rural development and market access”. Hangzhou, China (also available at: http://www.fao.org/3/MW523EN/mw523en.pdf)
Guan, X., Yang, JF., Xie, XY., Lin, C. & Li, JY. 2018. Research on the behavior of tea consumption in China with the CKB Data. Journal of Tea Science, 38(3): 287-295 iIn Chinese).
Guto, SN., Pypers, P., Vanlauwe, B., de Ridder, N. & Giller, KE. 2011. Tillage and vegetative barrier effects on soil conservation and short-term economic benefits in the Central Kenya highlands. Field Crops Research, 122, 85-94 (also available at: https://doi.org/10.1016/j.fcr.2011.03.002).
Hu, CP., Gu, L., Cai, SZ., Hong, MH. & Li, CQ. 2016. Analysis of public low-carbon awareness and related influencing factors in Eastern China. Environmental Science and Management, 41(4): 1-6 (in Chinese).
Huang, DF., Li, WH., Fan, P., Qiu, XX. & Lin, XJ. 2010. Countermeasures of low-carbon economy for the sustainable development of China’s tea industry. Chinese Journal of Eco-Agriculture, 18(5):1110-1115 (in Chinese).
Hui, K., Ruan, HJ. & Lin, ZH. 2017. Analysis of climate change’s impact on the suitability of spring tea cultivation in Fujian Province. Proceedings of the 2017 Annual Meeting of the Chinese Society of Environmental Sciences and Technologies (Volume IV) (in Chinese).
Huo, ZG., Li, MS., Wang, L., Wen, QP., Xiao, JJ., Huang, DP. & Wang, CY. 2012. Impacts of climate warming on crop diseases and pests in China. Scientia Agricultura Sinica, 45(10): 1926-1934 (in Chinese).
IFOAM. 2020. Climate Change. In: IFOAM - Organics International [online]. Bonn, Germany. [Cited 15 April 2020]. https://www.ifoam.bio/en/advocacy/climate-change
International Trade Center. 2014. Mitigating Climate Change in the Tea Sector. Geneva: ITC, 2014. xvi, 102 pages (Technical paper). Doc. No. SC-14-245.E (also available at: http://www.intracen.org/uploadedFiles/intracenorg/Content/Publications/Climate%20Change%20Tea-%20Final%20Manual_Low%20Res.pdf).
IPCC. 2006. Guidelines for National Greenhouse Gas Inventories, Prepared by the National Greenhouse Gas Inventories Programme. [Eggleston H.S., Buendia L., Miwa K., Ngara T. and Tanabe K. (eds)]. IGES, Japan (also available at: https://www.ipcc-nggip.iges.or.jp/public/2006gl/index.html).

70 Carbon neutral tea production in China - Three pilot case studies
IPCC. 2013. Climate Change 2013: The Physical Science Basis. Contribution of Working Group I to the Fifth Assessment Report of the Intergovernmental Panel on Climate Change [Stocker, T.F., Qin, D., Plattner, G.K., Tignor, M., Allen, S.K., Boschung, J., Nauels, A., Xia, Y., Bex, V. and Midgley, P.M. (eds.)]. Cambridge University Press, Cambridge, United Kingdom and New York, NY, USA (also available at: https://www.ipcc.ch/report/ar5/wg1/).
IPCC. 2019. Climate Change and Land: an IPCC special report on climate change, desertification, land degradation, sustainable land management, food security, and greenhouse gas fluxes in terrestrial ecosystems [Shukla, P.R., Skea, J., Calvo Buendia, E., Masson-Delmotte, V., Pörtner, H.O., Roberts, D.C., Zhai, P., Slade, R., Connors, S., van Diemen, R., Ferrat, M., Haughey, E., Luz, S., Neogi, S., Pathak, M., Petzold, J., Portugal Pereira, J., Vyas, P., Huntley, E., Kissick, K., Belkacemi, M. and Malley, J. (eds.)]. In press (also available at: https://www.ipcc.ch/srccl/).
ISO. 2006. ISO 14044:2006 Environmental management — Life cycle assessment — Requirements and guidelines. International Organization for Standardization. Geneva (also available at: https://www.iso.org/standard/38498.html).
ITC. 2018. Annual Bulletin of Statistics. London.
Jiang, YM., Ma, JH., Li, HM. & Yu, JH. 2014. Effects of high temperature heat damage on tea production in Lishui City from July to August 2013. China Agricultural Bulletin, 30(16): 158-163 (in Chinese).
Jin, YY. & Zhou, HY. 2018. Influence of low temperature in the spring during the last 20 years on famous tea production and its counter measures. Journal of Tea, 44 (1): 17-20 (in Chinese).
Joliffe, L. 2003. The lure of tea: history, traditions and attractions. Food Tourism Around the World: 121-136. Taylor and Francis Group. ISBN: 9780080477862
Kalita, RM., Das, AK. & Nath, AJ. 2015. Allometric equation for estimating above- and below ground biomass in tea (Camellia sinensis (L) O. Kuntze) agroforestry system of Barak Valley, Assam, Northeast India. Biomass and Bioenergy, 83: 42-49 (also available at: https://doi.org/10.1016/j.biombioe.2015.08.017).
Kemper, L., Lernoud, J. & Willer, H. 2018. Fostering sustainability in production and trade of raw materials, horticulture and tropical products (RaMHOT): assessing the impact of certification on farm incomes, inclusive rural development and market access. Research Institute of Organic Agriculture FiBL. Frick, Switzerland.
Li, BZ., Xie, JX., Kong, P., Yin, J. & Center, J.C. 2015. Comprehensive risk division of agrometeorological disaster for tea in southern Yangtze river. Journal of Arid Meteorology, 33(6): 1017-1023 (in Chinese).
Li, YS. 2012. Study of the condition of field grown tea tree biomass and nutrient distribution and the characteristics of root growth. Sichuan Agricultural University (in Chinese).
Li, X., Ahammed, GJ., Li, ZX., Zhang, L., Wei, JP., Yan, P., Zhang, LP. & Han, WY. 2018. Freezing stress deteriorates tea quality of new flush by inducing photosynthetic inhibition and oxidative stress in mature leaves. Scientia Horticulturae, 230: 155-160 (also available at: https://doi.org/10.1016/j.scienta.2017.12.001).
Liu, ZA., Yang, JP., Yang, ZC. & Zou, JL. 2012. Effects of rainfall and fertilizer types on nitrogen and phosphorus concentrations in surface runoff from subtropical tea fields in Zhejiang, China. Nutrient Cycling in Agroecosystems, 3:297-307 (also available at: https://doi.org/10.1007/s10705-012-9517-x).
71References
Liu, YN., Li, YC., Peng, ZP., Wang, YP., Ma, SY., Guo, LP., Lin, ED. & Han, X. 2015. Effects of Different Nitrogen Fertilizer Management Practices on Wheat Yields and N2O Emissions from Wheat Fields in North China. Journal of Integrative Agriculture, 14(6): 1184–1191 (also available at: https://doi.org/10.1016/S2095-3119(14)60867-4).
Lou, WP., Sun, SL., Wu, LH. & Sun, K. 2015. Effects of climate change on the economic output of the Longjing-43 tea tree, 1972–2013. International Journal of Biometeorol, 59: 593-603 (also available at: https://doi.org/10.1007/s00484-014-0873-x).
Lou, WP. & Xiao Q. 2016. Adverse Meteorological Conditions and Countermeasures of Tea Production in Zhejiang Province. Chinese Tea, 10: 26-28 (in Chinese).
Lou, WP., Xiao, Q., Sun, K., Deng, SG. & Yang, M. 2018. Heat stress risk regionalization of tea plants in Zhejiang Province. Journal of Tea Science, 38(5): 480-486 (in Chinese).
Luo, XY., Wang, JL., Chen, ZW., Zhao, ZQ., Duan, XY. & Chen, J. 2011. Technical measures for disaster prevention and control of tea trees rain and snow freezing of tea trees. Guizhou Tea, (1): 1-3 (in Chinese).
National Bureau of Statistics. 2018. China Statistical Yearbook (in Chinese) (also available at: http://www.stats.gov.cn/tjsj/ndsj/).
NDRC. 2015. China’s Third National Assessment Report on Climate Change (in Chinese).
NDRC. 2015. Enhanced actions on climate change: China’s Intended Nationally Determined Contributions (also available at: https://www4.unfccc.int/sites/submissions/INDC/Published%20Documents/China/1/China's%20INDC%20-%20on%2030%20June%202015.pdf)
NDRC. 2016a. The People’s Republic of China First Biennial Update Report on Climate Change (in Chinese).
NDRC. 2016b. Guidelines for Accounting and Reporting Greenhouse Gas Emissions. China Food, Tobacco, Alcohol, Beverages and Purified Tea Manufacturing Enterprises (Trial) (also available at: http://en.ccchina.org.cn/archiver/ccchinaen/UpFile/Files/Default/20160302133515407138.pdf).
Noellsch, AJ., Motavalli, PP., Nelson, KA. & Kitchen, N.R. 2009. Corn response to conventional and slow-release nitrogen fertilizers across a clay pan landscape. Agronomy Journal, 101(3): 607-614 (also available at: https://doi.org/10.2134/agronj2008.0067x).
Qiang, YH., Zhi, XF. & Jiang, YM. 2017. Climate change characteristics of low temperature frost and its impact on the first plucking date of spring tea in Lishui. Journal of Henan Agricultural Sciences, 46(02): 33-37 (in Chinese).
Qiu, ZL., Hu, FD. & Xia, YS. 2018. Causes and countermeasures of serious frost on Rizhao tea plants from 2017 to 2018. Anhui Agricultural Bulletin, 24(22): 36-37 (in Chinese).
Ruan, JY. 2010. Carbon sequestration potential of tea plantation ecosystem and low carbon tea production technology. China Tea, (7): 6-9 (in Chinese).
Sims, R., Flamimini, A., Ruri, M. & Bracco, S. 2015. Opportunities for Agri-Food Chains to Become Energy-Smart. FAO, Rome (also available at: http://www.fao.org/3/a-i5125e.pdf).
72 Carbon neutral tea production in China - Three pilot case studies
Sims, R., Flamimini, A., Santos, N., Pereira, LD., Carita, A., Bracco, S. & Oze, D. 2017. Adoption of Climate Technologies in the Agrifood Sector: Methodology. Food and Agriculture Organization (FAO), Rome and European Bank for Reconstruction and Development (EBRD), London (also available at: http://www.fao.org/3/i7022en/I7022EN.pdf).
Shen, C.D. & Huang, S.B. 2001. The ecological conditions and the law of geographical distribution for cultivated tea plants in China. Journal of Zhejiang University (Agric. & Life Sci.), 27:381-384 (in Chinese).
Smith, P., Martino, D., Cai, Z., Gwary, D., Janzen, H., Kumar, P., McCarl, B., Ogle, S., O’Mara, F., Rice, C., Scholes, B., Sirotenko, O., Howden, M., McAllister, T., Pan, G., Romanenkov, V., Schneider, U., Towprayoon, S., Wattenbach, M. & Smith, J. 2008. Greenhouse gas mitigation in agriculture. Philosophical Transactions of the Royal Society B, 2(363): 789-813 (also available at: https://doi.org/10.1098/rstb.2007.2184).
Taha, R., Ayman, H.A.M. & Hamdy, A.A. 2016. Effect of biofertilizers as a partial substitute for mineral fertilizers on growth, anatomical structure, mineral elements and yield of wheat under newly reclaimed soil conditions. International Journal of Current Microbiology and Applied Sciences, 5: 458-469 (also available at: http://dx.doi.org/10.20546/ijcmas.2016.508.049).
Tan, HH. & Yang, Q. 2017. The impact of climate change on tea production in Chun’an County. Modern Agricultural Technology, (7): 202-203 (in Chinese).
Tian, YH., Liang, YF., Wei, J. & Zhou, GL. 2003. The effect of disastrous climate on tea trees. Guizhou Agricultural Science, 31(2):20-23 (in Chinese).
Tong, W., Du, J., Zhao, F., Mu, D. & Sutherland, JW. 2019. Optimal Joint Production and Emissions Reduction Strategies Considering Consumers’ Environmental Preferences: A Manufacturer’s Perspective. Sustainability 2019, 11, 474 (also available at: https://doi.org/10.3390/su11020474).
Tripoli, M. & Schmidhuber, J. 2018. Emerging Opportunities for the Application of Blockchain in the Agri-food Industry. FAO and the International Center for Trade and Sustainable Development (ICTSD): Rome and Geneva. ISSN 1817-356X (also available at: http://www.fao.org/3/ca1335en/ca1335en.pdf).
UNFCCC. 2019. FCCC/CP/2018/10 “Report of the Conference of the Parties on its twenty-fourth session, held in Katowice from 2 to 15 December 2018” (also available at: https://undocs.org/en/FCCC/CP/2018/10).
Wan, Q. & Yan, F.Z. 2006. International competitiveness of the Chinese tea industry and policy implications. Resources Science, 4: 118-124 (in Chinese).
Wang, C.H., Kuang, X., Wang, J.L., Wang, D.F., Li, D.X. & Wang, Y. 2007. Study on quality changes in tea when tea plants are transferred from south to north. Proceedings of the National Tea Industry Science and Technology Symposium, pp 170-174 (in Chinese).
Wang, Y., Zhang, GL., Yang, SY., Zou, DS., Xiao, RL., Zhu, HY. & Wang, H. 2018. The photosynthetic mechanism of tea yield and quality affected by different habitats. Chinese Journal of Applied Ecology, 2018-09-26 (in Chinese).
Wu, B., Li, YF. & Jin, ZF. 2018. The classification and analysis of disastrous weather affecting the yield and quality of Anji White Tea. Chinese Agricultural Science Bulletin, 34(13): 137-143 (in Chinese)
73References
Xia, XW., Li, SH. & Liu, Q. 2008. Preliminary study on measures of tea restoration and management after rain and snow freezing disaster in Xinyang City, Henan Province. East China Forest Manager, 22(3): 1-3 (in Chinese).
Xiao, Z., Huang, X.J., Meng, H. & Yang, Z. 2017. Spatial structure and evolution of tea production in China from 2009 to 2014. Geographical Research, 36(1): 109-120 (in Chinese).
Xiao, Z., Huang, X.J., Zang, Z. & Yang, H. 2018. Spatio-temporal variation and the driving forces of tea production in China over the last 30 years. Journal of Geographical Sciences, 28(3): 275-290 (also available at: https://doi.org/10.1007/s11442-018-1472-2).
Yang, F. 2017. Study on the characteristics and defensive technologies of high temperature and drought disasters on tea plants in Zhejiang Province during the past 55 years. Nanjing University (in Chinese).
Yang, Y.J. 2005. Chinese tea tree cultivation. Shanghai Science and Technology Press, pp 104-105. (in Chinese).
Yu, C. 2018. Study on the characteristics and influencing factors of China’s tea production distribution based on a survey of 408 counties. Zhejiang University (in Chinese).
Yu, HK. 2016. Variation characteristics of climate suitability for tea in Eastern Fujian. Mountain Research, 34(04): 415-424 (in Chinese).
Zhang, M., Chen, YG., Fan, DM., Zhu, Q., Pan, ZQ., Fan, K. & Wang, XC. 2017. Temporal evolution of carbon storage in Chinese tea plantations from 1950 to 2010. Pedosphere, 27(1): 121-128 (also available at: https://doi.org/10.1016/S1002-0160(15)60098-4).
Zhang, YW., Li, XD. & Xu, XB. 2012. Effects of low temperature and drought on tea production in Qingdao city in Shandong province and Countermeasures. Deciduous Fruits, 44(01): 32-34 (in Chinese).
Zhao, HR., Zhang, YH., Jia, SZ., Chen, B. & Yao, C. 2017. The variation trend of tea temperature suitability - A case study of Tai’an. Journal of Guizhou Meteorology, 41(04): 57-62 (in Chinese).
Zhen, XL. 2014. Effect of temperature on tea quality and picking period. Guizhou Meteorology, 38(5): 37-39 (in Chinese).
Zhu, XH., Yuan, HG. & Zhen, HT. 2012. Cause analysis of the cold climate damage on Shandong’s tea trees in last 45 years. China Tea, (3): 11-13 (in Chinese).
Zhu, XH., Zhou, XJ. & Han, GX. 2003. Climate change and its impact on the growth of tea trees in Rizhao City. Shandong Meteorology, 23(04): 36-37 (in Chinese).


Office of Climate Change, Biodiversity and Environment
Food and Agriculture Organization of the United NationsRome, Italy
CB4580EN/1/05.21
ISBN 978-92-5-134373-9
9 7 8 9 2 5 1 3 4 3 7 3 9