Embed Size (px)
Citation preview

E C O N O M I C A N D S E C T O R W O R K
M AY 2 0 1 2
REPORT NUMBER: 67395-GLB
CARBON SEQUESTRATION IN AGRICULTURAL SOILS
Pub
lic D
iscl
osur
e A
utho
rized
Pub
lic D
iscl
osur
e A
utho
rized
Pub
lic D
iscl
osur
e A
utho
rized
Pub
lic D
iscl
osur
e A
utho
rized
Pub
lic D
iscl
osur
e A
utho
rized
Pub
lic D
iscl
osur
e A
utho
rized
Pub
lic D
iscl
osur
e A
utho
rized
Pub
lic D
iscl
osur
e A
utho
rized

CARBON SEQUESTRATION IN AGRICULTURAL SOILS
R E P O RT N O . 6 7 3 9 5 - G L B
AGRICULTURE AND RURAL DEVELOPMENT
ARD
E C O N O M I C A N D S E C T O R W O R K

© 2012 International Bank for Reconstruction and Development/International Development Association or The World Bank1818 H Street NWWashington DC 20433Telephone: 202-473-1000Internet: www.worldbank.org
This volume is a product of the staff of the International Bank for Reconstruction and Development/ The World Bank. The fi ndings, interpretations, and conclusions expressed in this paper do not necessarily refl ect the views of the Executive Directors of The World Bank or the governments they represent.
The World Bank does not guarantee the accuracy of the data included in this work. The boundaries, colors, denominations, and other information shown on any map in this work do not imply any judgment on the part of The World Bank concerning the legal status of any territory or the endorsement or acceptance of such boundaries.
Rights and Permissions
The material in this work is subject to copyright. Because The World Bank encourages dissemination of its knowledge, this work may be reproduced, in whole or in part, for noncommercial purposes as long as full attribution to this work is given.
Any queries on rights and licenses, including subsidiary rights, should be addressed to the Offi ce of the Publisher, The World Bank, 1818 H Street NW, Washington, DC 20433, USA; fax: 202-522-2422; e-mail: [email protected].
Cover Photos: Scott Wallace, Tran Thi Hoa, Curt Carnemark, Ami Vitale, and Ray Witlin.
CONTENTS
ECONOMIC AND SECTOR WORK
II I
TABLE OF CONTENTS
List of Figures . . . . . . . . . . . . . . . . . . . . . . . . . . . . . . . . . . . . . . . . . . . . . . . . . . . . . . . v
List of Photos . . . . . . . . . . . . . . . . . . . . . . . . . . . . . . . . . . . . . . . . . . . . . . . . . . . . . . . vi
List of Tables . . . . . . . . . . . . . . . . . . . . . . . . . . . . . . . . . . . . . . . . . . . . . . . . . . . . . . . vii
List of Boxes . . . . . . . . . . . . . . . . . . . . . . . . . . . . . . . . . . . . . . . . . . . . . . . . . . . . . . . viii
Preface . . . . . . . . . . . . . . . . . . . . . . . . . . . . . . . . . . . . . . . . . . . . . . . . . . . . . . . . . . . . ix
Acknowledgments . . . . . . . . . . . . . . . . . . . . . . . . . . . . . . . . . . . . . . . . . . . . . . . . . . . . xi
Abbreviations . . . . . . . . . . . . . . . . . . . . . . . . . . . . . . . . . . . . . . . . . . . . . . . . . . . . . . xiii
Executive Summary . . . . . . . . . . . . . . . . . . . . . . . . . . . . . . . . . . . . . . . . . . . . . . . . . . xv
Chapter 1: Introduction . . . . . . . . . . . . . . . . . . . . . . . . . . . . . . . . . . . . . . . . . . . . . . . . . 1
1.1: Food Security Under a Changing Climate . . . . . . . . . . . . . . . . . . . . . . . . . . . . . . . . . . . . . 1
1.2: Carbon Benefi ts Through Climate-Smart Agriculture . . . . . . . . . . . . . . . . . . . . . . . . . . . . . . 2
1.3: Objectives and Scope of the Report . . . . . . . . . . . . . . . . . . . . . . . . . . . . . . . . . . . . . . . . 4
Chapter 2: Soil Organic Carbon Dynamics and Assessment Methods . . . . . . . . . . . . . . . . . . 5
2.1: Soil Organic Carbon Dynamics . . . . . . . . . . . . . . . . . . . . . . . . . . . . . . . . . . . . . . . . . . . 5
2.2: Carbon Assessment for Land Management Projects . . . . . . . . . . . . . . . . . . . . . . . . . . . . . . 12
2.3: Techniques of Soil Carbon Assessment . . . . . . . . . . . . . . . . . . . . . . . . . . . . . . . . . . . . . 12
2.4: Carbon Assessment in The World Bank’s Sustainable Land Management Portfolio. . . . . . . . . . . . . 17
Chapter 3: Meta-Analyses of Soil Carbon Sequestration . . . . . . . . . . . . . . . . . . . . . . . . . . 19
3.1: Introduction . . . . . . . . . . . . . . . . . . . . . . . . . . . . . . . . . . . . . . . . . . . . . . . . . . . . 19
3.2: Methods . . . . . . . . . . . . . . . . . . . . . . . . . . . . . . . . . . . . . . . . . . . . . . . . . . . . . . 20
3.3: Results . . . . . . . . . . . . . . . . . . . . . . . . . . . . . . . . . . . . . . . . . . . . . . . . . . . . . . . 20
Chapter 4: Ecosystem Simulation Modeling of Soil Carbon Sequestration . . . . . . . . . . . . . . 43
4.1: Model Description. . . . . . . . . . . . . . . . . . . . . . . . . . . . . . . . . . . . . . . . . . . . . . . . . 43
4.2: Results . . . . . . . . . . . . . . . . . . . . . . . . . . . . . . . . . . . . . . . . . . . . . . . . . . . . . . . 46
Chapter 5: Economics of Soil Carbon Sequestration. . . . . . . . . . . . . . . . . . . . . . . . . . . . . 51
5.1: Marginal Abatement Costs . . . . . . . . . . . . . . . . . . . . . . . . . . . . . . . . . . . . . . . . . . . . 51
5.2: Trade-Offs in Soil Carbon Sequestration . . . . . . . . . . . . . . . . . . . . . . . . . . . . . . . . . . . . 53
5.3: Implications of the Trade-Offs in Land-Use Decisions . . . . . . . . . . . . . . . . . . . . . . . . . . . . . 57
5.4: Sustainable Land Management Adoption Barriers . . . . . . . . . . . . . . . . . . . . . . . . . . . . . . . 58
5.5: Policy Options for Soil Carbon Sequestration. . . . . . . . . . . . . . . . . . . . . . . . . . . . . . . . . . 58

CARBON SEQUESTRATION IN AGRICULTURAL SOILS
Appendix A: The Farming Practice Effect, Number of Estimates, and Features in Land Management Practices . . . . . . . . . . . . . . . . . . . . . . . . . . . . . . . . . . . . . . . 63
Appendix B: General Scenario Assumptions and Application for World Regions . . . . . . . . . . 67
B.1: Baseline Scenario . . . . . . . . . . . . . . . . . . . . . . . . . . . . . . . . . . . . . . . . . . . . . . . . . 67
B.2: Global Mitigation Scenarios . . . . . . . . . . . . . . . . . . . . . . . . . . . . . . . . . . . . . . . . . . . 67
B.3: Application to World Regions . . . . . . . . . . . . . . . . . . . . . . . . . . . . . . . . . . . . . . . . . . 68
B.4: Detailed Modeling for Africa . . . . . . . . . . . . . . . . . . . . . . . . . . . . . . . . . . . . . . . . . . . 70
Appendix C: Global Crop Yields (T ha−1 yr−1) Grouped into 25th, 50th, and 75th Percentile Bins Corresponding to Low, Medium, and High . . . . . . . . . . . . . . . . . . . . . . . 75
Appendix D: Uncertainty Analysis. . . . . . . . . . . . . . . . . . . . . . . . . . . . . . . . . . . . . . . . . 81
Appendix E: Assumptions for Deriving the Applicable Mitigation Area for the Land Management Practices . . . . . . . . . . . . . . . . . . . . . . . . . . . . . . . . . . . . . . . 83
E.1: Africa . . . . . . . . . . . . . . . . . . . . . . . . . . . . . . . . . . . . . . . . . . . . . . . . . . . . . . . . 83
CONTENTSIV

ECONOMIC AND SECTOR WORK
LIST OF FIGURES
Figure E1: Abatement Rates of the Land Management Practices (t CO2e Per Hectare Per Year) . . . . . . . . . .xxii
Figure E2: Trade-Offs Between Profi tability and Carbon Sequestration of Sustainable Land Management Technologies . . . . . . . . . . . . . . . . . . . . . . . . . . . . . . . . . . . . . . . . . . . . . . .xxv
Figure E3: Relationship Between Private Benefi ts and Public Costs . . . . . . . . . . . . . . . . . . . . . . . xxvi
Figure 1.1: Contribution of Different Sectors to Greenhouse Gas (GHG) Emissions . . . . . . . . . . . . . . . . .1
Figure 1.2: Proportion of Agricultural Land Derived from Different Land Covers in the Tropics, 1980–2000 . . . . .2
Figure 2.1: Carbon Stocks in Biomass and Soils. . . . . . . . . . . . . . . . . . . . . . . . . . . . . . . . . . . .5
Figure 2.2: Global Soil Regions . . . . . . . . . . . . . . . . . . . . . . . . . . . . . . . . . . . . . . . . . . . .7
Figure 2.3: Factors Affecting Soil Carbon Sequestration . . . . . . . . . . . . . . . . . . . . . . . . . . . . . . 10
Figure 3.1: Geographical Distribution of Carbon Sequestration Estimates . . . . . . . . . . . . . . . . . . . . . 21
Figure 3.2: Soil Carbon Sequestration and Precipitation . . . . . . . . . . . . . . . . . . . . . . . . . . . . . . . 22
Figure 3.3: Soil Carbon Sequestration and Temperature. . . . . . . . . . . . . . . . . . . . . . . . . . . . . . . 22
Figure 3.4: Soil Carbon Sequestration and Soil Order . . . . . . . . . . . . . . . . . . . . . . . . . . . . . . . . 23
Figure 3.5: Soil Carbon Sequestration and Time . . . . . . . . . . . . . . . . . . . . . . . . . . . . . . . . . . . 24
Figure 3.6: Soil Carbon Sequestration and Application Levels of Nitrogen Fertilizer (Means and 95 Percent Confi dence Intervals, n = 285) . . . . . . . . . . . . . . . . . . . . . . . . . 26
Figure 3.7: Soil Carbon Sequestration and Fertilizer Combinations (Means and 95 Percent Confi dence Intervals, n = 285) . . . . . . . . . . . . . . . . . . . . . . . . . . . . . . . . . . . . . . . . . . . . 26
Figure 3.8: Mean Soil Carbon Sequestration and Levels of Residue Returned . . . . . . . . . . . . . . . . . . . 30
Figure 3.9: Classifi cation of Tillage Systems Based on Crop Residue Management . . . . . . . . . . . . . . . . 31
Figure 3.10: Mean Soil Carbon Sequestration and Cropping Intensity . . . . . . . . . . . . . . . . . . . . . . . 33
Figure 3.11: Carbon Dioxide Abatement Rates of the Land Management Practices . . . . . . . . . . . . . . . . 39
Figure 4.1: Representation of the RothC Model . . . . . . . . . . . . . . . . . . . . . . . . . . . . . . . . . . . 43
Figure 4.2: The 12 Strata Used for Ecosystem Simulation Modeling . . . . . . . . . . . . . . . . . . . . . . . . 45
Figure 4.3: Africa Agroecological Zone . . . . . . . . . . . . . . . . . . . . . . . . . . . . . . . . . . . . . . . 46
Figure 4.4: A Screen Shot of the Soil Carbon Internet Database . . . . . . . . . . . . . . . . . . . . . . . . . . 47
Figure 4.5: Cumulative Soil Carbon Loss by 2030 Assuming 15 Percent Residue Retention (t ha−1) under Different Cropping Systems . . . . . . . . . . . . . . . . . . . . . . . . . . . . . . . . . . . 48
LIST OF FIGURES V

Figure 4.6: Predicted Cumulative C Sequestration for Different Land Management Practices by 2030 . . . . . . 49
Figure 5.1: The Private Marginal Abatement Cost Curves. . . . . . . . . . . . . . . . . . . . . . . . . . . . . . 52
Figure 5.2: Total Private Benefi ts (Blue) and Public Costs (Red) of Land Management Practices (US$, Billion) for the B1 Scenario . . . . . . . . . . . . . . . . . . . . . . . . . . . . . . . . . . . . 54
Figure 5.3: Trade-Offs Between Profi tability and Carbon Sequestration of Sustainable Land Management Technologies in Africa . . . . . . . . . . . . . . . . . . . . . . . . . . . . . . . . . . . . . . . . . . 55
Figure 5.4: Relationship Between Private Benefi ts and Public Costs in Africa . . . . . . . . . . . . . . . . . . . 56
Figure B.1: FAO Land-Use Map . . . . . . . . . . . . . . . . . . . . . . . . . . . . . . . . . . . . . . . . . . . 71
LIST OF FIGURESVI
CARBON SEQUESTRATION IN AGRICULTURAL SOILS
LIST OF PHOTOS
Photo E.1: Terracing and Landscape Management in Bhutan . . . . . . . . . . . . . . . . . . . . . . . . . . . .xvii
Photo E.2: Crop Residue Management in Irrigated Fields in Indonesia . . . . . . . . . . . . . . . . . . . . . . . xx
Photo E.3: Water Management in a Field in India . . . . . . . . . . . . . . . . . . . . . . . . . . . . . . . . . xxiii
Photo E.4: Maize Growing under Faidherbia Albida Trees in Tanzania . . . . . . . . . . . . . . . . . . . . . . . xxiv
Photo E.5: Crop Harvesting in Mali. The Biomass Is Smaller Compared to that of Agroforestry Systems. . . . . .xxv
Photo 3.1: Crop Residue Management in Irrigated Fields in Indonesia . . . . . . . . . . . . . . . . . . . . . . . 29
Photo 3.2: Water Management in a Field in India . . . . . . . . . . . . . . . . . . . . . . . . . . . . . . . . . . 33
Photo 3.3: Maize Growing under Faidherbia Albida Trees in Tanzania . . . . . . . . . . . . . . . . . . . . . . . . 34
Photo 3.4: Crop Harvesting in Mali. The Biomass Is Smaller Compared to that of Agroforestry Systems. . . . . . 40
Photo 5.1: Terracing and Landscape Management in Bhutan . . . . . . . . . . . . . . . . . . . . . . . . . . . . 57

VII
ECONOMIC AND SECTOR WORK
LIST OF TABLES
Table E1: Carbon Stocks in Vegetation and Top 1 Meter of Soils of World Biomes . . . . . . . . . . . . . . . . .xvii
Table E2: Estimates of Erosion-Induced Carbon Emission Across World Regions. . . . . . . . . . . . . . . . . xviii
Table E3: Technical Mitigation Potential, Private Benefi ts, and Public Costs of the Land Management Technologies by 2030 . . . . . . . . . . . . . . . . . . . . . . . . . . . . . . . . . . . . . . . . . . xxvii
Table E4: Relative Importance of Different Factors for Adopting Improved Land Management Practices . . . . xxviii
Table 1.1: Improvement in Crop Yields Per Ton of Carbon in the Root Zone . . . . . . . . . . . . . . . . . . . . .3
Table 1.2: Estimated Increase in Grain Crop Production From Land Management Technologies That Sequester Soil Carbon (Million Tons Per Year) . . . . . . . . . . . . . . . . . . . . . . . . . . . . . . .3
Table 2.1: Carbon Stocks in Vegetation and Top 1 Meter of Soils of World Biomes. . . . . . . . . . . . . . . . . .6
Table 2.2: Global Carbon Budget (Gt C) . . . . . . . . . . . . . . . . . . . . . . . . . . . . . . . . . . . . . . . .6
Table 2.3: Forms of Carbon in the Soil . . . . . . . . . . . . . . . . . . . . . . . . . . . . . . . . . . . . . . . . .7
Table 2.4: Soil Carbon Pool up to 1-Meter Deep for Soil Orders of the World’s Ice-Free Land Surface . . . . . . . .8
Table 2.5: Estimate of Erosion-Induced Carbon Emission . . . . . . . . . . . . . . . . . . . . . . . . . . . . . . 10
Table 2.6: Comparison of Carbon Assessment for Carbon Mitigation and Noncarbon Mitigation Projects . . . . . 13
Table 2.7: Direct and Indirect Methods of Soil Carbon Assessment. . . . . . . . . . . . . . . . . . . . . . . . . 14
Table 2.8: Characteristics of Emerging In Situ Methods of Soil Carbon Analytical Techniques . . . . . . . . . . . 14
Table 2.9: Comparative Features of Some Carbon Estimation Models . . . . . . . . . . . . . . . . . . . . . . . 15
Table 2.10: Components of Soil Carbon Monitoring at the Regional Scale . . . . . . . . . . . . . . . . . . . . . 16
Table 2.11: Carbon Accounting Systems and Tools . . . . . . . . . . . . . . . . . . . . . . . . . . . . . . . . . 16
Table 3.1: Practices That Sequester Carbon in Forest, Grassland, and Cropland . . . . . . . . . . . . . . . . . . 19
Table 3.2: Nutrient Management and Soil Carbon Sequestration Rates (kg C ha−1 yr−1) . . . . . . . . . . . . . . . 27
Table 3.3: Relative Importance of the Four Domains of Integration on Crop-Livestock Interaction . . . . . . . . . 28
Table 3.4: Tillage, Crop Residue Management, and Soil Carbon Sequestration Rates (kg C ha−1 yr−1) . . . . . . . . 29
Table 3.5: Crop Rotation and Soil Sequestration Rates (kg C ha−1 yr−1) . . . . . . . . . . . . . . . . . . . . . . . 32
Table 3.6: Water Management and Soil Carbon Sequestration Rates (kg C ha−1 yr−1) . . . . . . . . . . . . . . . . 34
Table 3.7: Agroforestry and Soil Carbon Sequestration Rates (kg C ha−1 yr−1) . . . . . . . . . . . . . . . . . . . . 35
Table 3.8: Land-Use Changes and Soil Carbon Sequestration Rates (kg C ha−1 yr−1). . . . . . . . . . . . . . . . . 36
LIST OF TABLES

CARBON SEQUESTRATION IN AGRICULTURAL SOILSCARBON SEQUESTRATION IN AGRICULTURAL SOILS
LIST OF BOXES
Box 2.1: Brief Description of Soil Orders . . . . . . . . . . . . . . . . . . . . . . . . . . . . . . . . . . . . . . . .9
Box 2.2: Sustainable Land Management Practices Reverse Soil Carbon Loss in Java. . . . . . . . . . . . . . . . 11
Box 5.1: Risk-Related Barriers to Adoption of Soil Carbon Sequestration Activities . . . . . . . . . . . . . . . . . 59
Table 3.9: Summary of Observed Rates of Soil Carbon Sequestration (kg C ha−1 yr−1) as a Result of Land-Use Changes and Other Practices Relevant to Livestock Management . . . . . . . . . . . . . . 37
Table 3.10: Soil Amendments and Soil Carbon Sequestration Rates (kg C ha−1 yr−1) . . . . . . . . . . . . . . . . 38
Table 4.1: Spatial Datasets Used in the Study . . . . . . . . . . . . . . . . . . . . . . . . . . . . . . . . . . . . 44
Table 4.2: Modeled Cumulative Soil Carbon Sequestration Potential by 2030 (Mt C) under Different Land Management Practices . . . . . . . . . . . . . . . . . . . . . . . . . . . . . . . . . . . . . . . 50
Table 5.1: Private Savings of Different Technologies Per Ton of Carbon Dioxide Sequestered . . . . . . . . . . . 53
Table 5.2: Public Costs of Different Technologies Per Ton of Carbon Dioxide Sequestered. . . . . . . . . . . . . 53
Table 5.3: Technical Mitigation Potential, Private Benefi ts, and Public Costs of the Land Management Technologies by 2030 . . . . . . . . . . . . . . . . . . . . . . . . . . . . . . . . . . . . . . . . . . . 55
Table 5.4: Relative Importance of Different Factors for Adopting Improved Land Management Practices . . . . . 60
Table 5.5: Interventions for Facilitating Increased Input Use . . . . . . . . . . . . . . . . . . . . . . . . . . . . 60
Table B.1: Agricultural Systems and Mitigation Scenario in South America . . . . . . . . . . . . . . . . . . . . . 69
Table B.2: Agricultural Systems and Mitigation Scenario in Central America . . . . . . . . . . . . . . . . . . . . 69
Table B.3: Manure C Inputs for the AEZs in Africa Based on FAOSTAT . . . . . . . . . . . . . . . . . . . . . . . 70
Table B.4: C Inputs for Different Green Manure/Cover Crop Systems. . . . . . . . . . . . . . . . . . . . . . . . 72
Table B.5: C Inputs for Different Agroforestry Systems . . . . . . . . . . . . . . . . . . . . . . . . . . . . . . . 73
Table D.1: Uncertainty Analyses Using Random Samples from the Mitigation Scenarios. . . . . . . . . . . . . . 82
Table E.1: Estimated Cropland Area in the 2000s . . . . . . . . . . . . . . . . . . . . . . . . . . . . . . . . . . 83
Table E.2: Estimated Cropland and Grassland Area by 2030 (Million Hectare). . . . . . . . . . . . . . . . . . . . 84
LIST OF TABLESVII I

ECONOMIC AND SECTOR WORK
PREFACE
Agriculture’s direct reliance on the natural resource base has always been a defi ning characteristic of the sector. Production relies directly on soil, water, and a variety of biological processes. And it also relies on the climate at the same time that its role in the global carbon cycle makes it a major contributing factor to climate change. Today, more than ever before, we understand not only the signifi cance that climate has for agriculture, but also the enormous signifi cance that agriculture has for the climate.
The growing consensus on the need for a climate-smart agriculture emerged largely out of international awareness of the sector’s negative impacts—its ecological footprint. It also grew out of the recognition that conventional forms of agricul-tural production are often unsustainable and deplete or “mine” the natural resources on which production relies over time. Agriculture is the world’s leading source of methane and nitrous oxide emissions, a substantial source of carbon emissions, and the principal driver behind deforestation worldwide. Some 30 percent of global greenhouse gas emissions are attributable to agriculture and deforestation driven by the expansion of crop and livestock production for food, fi ber and fuel.
More recently, this perspective of agriculture as a source of greenhouse gas emissions and pollution has become more balanced, with a growing understanding of the environmental services the sector can provide if production is well-managed. While agriculture emits a large volume of greenhouse gases, its biomass and especially its soils also sequester carbon out of the atmosphere, and this role as a carbon sink and as a carbon store can be strategically optimized through proven farming techniques and methods that simultaneously reduce emissions. These technical elements of climate-smart agriculture are by now well understood, and in addition to their technical feasibility, they can be highly productive and profi table.
As this document will discuss, this new and more sustainable pattern of agricultural development can make the sector an ac-tive agent in climate change mitigation at the same time that it improves and builds upon the sector’s capacity to adapt to the increasing temperatures and declining precipitation that are already reducing yields of grains and other primary crops in many parts of the vast semi-arid tropics where so many of the poorest reside. This trend is projected to intensify in the coming de-cades and have serious ramifi cations for global food security, and for the food security of vulnerable populations in particular.
Agricultural production operates under intensifying pressures. Food production will need to effectively double in many devel-oping countries by 2050 to feed a growing and increasingly urban global population. The agriculture systems that supply this food play a pivotal role in these countries’ economies. Agriculture employs up to two-thirds of their workforce and accounts for between 10 and 30 percent of their gross domestic product. Increasing productivity is agriculture’s most pressing priority, but it is not its only priority.
Perhaps the most important point conveyed in this document is that the dual roles of agriculture as a source of food security and as a source of environmental services converge in fundamental ways. Too often the relationship between these roles is viewed as a series of painful trade-offs. Yet the same carbon that is sequestered through sustainable practices makes those practices more productive. The carbon that is removed from the atmosphere and captured in soils and plant biomass is the same carbon that makes agricultural soils more fertile, and that leads to higher profi t margins for producers. Higher carbon content enables the soil to make more water and nutrients available to support crop growth, and increases the resilience of farmland, reducing both the need for fertilizer applications and susceptibility to land degradation. The Intercontinental Panel on Climate Change (IPCC) indicates that carbon sequestration accounts for about 90 percent of global agricultural mitigation potential by 2030.
IXPREFACE

X
CARBON SEQUESTRATION IN AGRICULTURAL SOILS
PREFACE
While technical progress in the area of integrated “landscape” approaches to managing natural and economic resources has been very promising, the adoption of these approaches still faces serious constraints in many developing countries. Among the most important of these constraints are the signifi cant upfront expenditures that many of the newer techniques require. In many of the developing countries in which these techniques would wield some of their most important benefi ts, aware-ness of both the techniques and the benefi ts remain limited. In some settings there is limited capacity to implement them even when people are aware of them.
Mobilizing and targeting resources to overcome these constraints has been an important reason the World Bank became determined to get climate-smart agriculture more fi rmly onto the agenda of the international dialogue on climate change. It is our hope that this report moves that agenda forward by making the “triple win” of soil carbon sequestration for increased productivity, improved climate resilience, and enhanced mitigation an integral part of that dialogue.
Juergen VoegeleDirectorAgriculture and Rural Development DepartmentThe World Bank

XI
ECONOMIC AND SECTOR WORK
ACKNOWLEDGMENTS
ACKNOWLEDGMENTS
The preparation of this report was managed by the Agriculture and Rural Development (ARD) department. Ademola Braimoh wrote the report with meta-analyses and research support from Idowu Oladele, Louis Lebel, and Ijeoma Emenanjo. Matthias Seebauer, Patricia del Valle Pérez, and Katia Obst carried out the ecosystem simulation modeling, while Reza Firuzabadi, Michael Kane, Varuna Somaweera, Dany Jones, Sarah Elizabeth Antos, Katie McWilliams, and Alex Stoicof provided Geographical Information System and Information Technology support.
The author is grateful for constructive comments and suggestions from the following peer reviewers: Erick Fernandes, Johannes Woelcke, Yurie Tanimichi Hoberg, Chuck Rice, John Idowu, Ellysar Baroudy, Johannes Heister, Wilhelmus Janssen, Christine Negra, Louis Bockel, Tim Searchinger, Meine van Noordwijk, and Andreas Wilkes. Many others provided inputs and support including Jurgen Voegele, Mark Cackler, Fionna Douglas, Marjory-Anne Bromhead, Patrick Verkoijen, Pai-Yei Whung, Dipti Thapa, Gunnar Larson, Maria Gabitan, Olusola Ikuforiji, Sarian Akibo-Betts, Ramon Yndriago, Kaisa Antikainen, Cicely Spooner, Shunalini Sarkar, and Genalinda Gorospe.
This report improves the knowledge base for scaling-up investments in land management technologies that sequester soil carbon for increased productivity under changing climate conditions.


XIII
ECONOMIC AND SECTOR WORK
ABBREVIATIONS
AEZ Agroecological Zone
BIO microbial biomass
CBP Carbon Benefi ts Project
CSA climate-smart agriculture
DPM decomposable plant material
EX-ACT Ex Ante Appraisal Carbon-Balance Tool
FAOSTAT Food and Agriculture Organization of the United Nations
GEF Global Environment Facility
GHG greenhouse gas
GIS geographical information system
GPS global positioning system
ha hectare
HUM humifi ed organic matter
INS inelastic neutron scattering
IOM inert organic matter
IPCC Intercontinental Panel on Climate Change
LIBS laser-induced breakdown spectroscopy
MAC marginal abatement cost
MMV measurement, monitoring, and verifi cation
NPP net primary productivity
RPM resistant plant material
SALM Sustainable Agricultural Land Management
SLM sustainable land management
UNFCCC UN Framework Convention on Climate Change
ABBREVIATIONS


XV
ECONOMIC AND SECTOR WORK
Ensuring food security in a context of growing population and changing climate is arguably the principal challenge of our time. The current human population of 7 billion will increase to more than 9 billion by 2050.
Moreover, rising incomes and the increasing proportion of the global population living in urban areas are changing the compo-sition of food demand in fundamental ways. Higher income urban populations have more diverse diets that feature a variety of high-value food sources, such as livestock that are more resource intensive to produce and process. This adds to the chal-lenge of maintaining and preserving the resilience of both natural and agricultural ecosystems. Based on these developments, projections indicate that global food production must increase by 70 percent by 2050. In many African countries, where the challenge is most acute, food production must increase by more than 100 percent—it must effectively double.
The onus of this challenge falls on agriculture, which is the sector of the global economy that is most vulnerable to the effects of global warming, such as more variable rainfall and more extreme weather-generated events. At the same time, agriculture and the changes in land-use that are associated with it, are one of the principal contributors to climate change, accounting for one-third of global greenhouse gas (GHG) emissions. Projected increases in demand for food and bioenergy by 2050 have profound implications for the pressure that agriculture wields on forests and other natural ecosystems in the tropics. These ecosystems are vital, both in the role their biomass plays in sequestering carbon and in providing habitat for biodiversity. When they are lost, they become a massive source of GHG emissions.
Increasing agricultural productivity, enhancing its resilience to climate change, and reducing the emissions that come from the agriculture sector are therefore triple imperatives that require alternative sets of practices. Climate-smart agriculture (CSA) seeks to increase productivity in an environmentally and socially sustainable way, strengthen farmers’ resilience to climate change, and reduce agriculture’s contribution to climate change by reducing GHG emissions and sequestering carbon. A key element of CSA is sustainable land management (SLM), involving the implementation of land-use systems and management practices that enable humans to maximize the economic and social benefi ts from land while maintaining or enhancing the ecosystem services that land resources provide.
Because soil is the basic resource in agricultural and forest land use, it is the central element of most SLM technologies. Soil carbon has a direct correlation with soil quality. It is a major determinant of the soil’s ability to hold and release water and other nutrients that are essential for plants and their root systems to grow. Soil carbon also plays an important role in maintaining the biotic habitats that make land management systems sustainable, resilient, and able to resist degradation. Carbon seques-tration, the process by which atmospheric carbon dioxide is taken up by plants through photosynthesis and stored as carbon in biomass and soils, can help reverse soil fertility loss, limit GHG concentrations in the atmosphere, and reduce the impact of climate change on agricultural ecosystems.
The objective of this report is to improve the knowledge base that informs investment decisions in land management tech-nologies that purposefully sequester soil carbon. The fi ndings reported are based on three exercises. The fi rst was a review of soil carbon dynamics and assessment methods and a meta-analysis of soil carbon sequestration rates in Africa, Asia, and Latin America. The second exercise was to apply an ecosystem simulation modeling technique to predict future carbon storage in global cropland soils. The third consisted of a series of estimations of marginal abatement costs and trade-offs to assess the cost-effectiveness of deploying the land management technologies for climate-smart agriculture. The results
EXECUTIVE SUMMARY
EXECUTIVE SUMMARY

CARBON SEQUESTRATION IN AGRICULTURAL SOILS
reported in this document complement a number of related publications, including empirical lessons from recent project examples and policy briefs that were used as inputs at the Durban Climate Change Conference in November 2011.
At least four key messages emerge over the course of this report, and these relate to profi tability, managing trade-offs, barriers to adoption, and the need for targeted public support.
Profi tability
In addition to storing soil carbon, sustainable land management technologies can be benefi cial to farmers because they can increase yields and reduce production costs. Total private profi ts by the year 2030 are estimated at US$105 billion for Africa, $274 billion for Latin America, and $1.4 trillion for Asia.
Maximizing Benefi ts and Managing Trade-Offs
Soil carbon sequestration can be maximized by managing trade-offs across space, time, and sectors. Working at the land-scape level is useful for addressing food security and rural livelihood issues and in responding to the impacts of climate change and contributing to its mitigation.
Barriers to Adoption and Up-Front Costs
The adoption of sustainable land management practices can face a variety of socioeconomic and institutional barriers. These include the need for signifi cant up-front expenditures on the part of poorer farmers, the nonavailability of some inputs in the local markets, lack of information about the potential of improved techniques, and often limited capacity to implement the techniques. Certain techniques associated with sustainable land management can be incompatible with traditional practices. In some instances, the diffusion of new technologies relies on a level of social capital and experience with collective action that farmers simply do not yet have.
The Need for Targeted Public Support
Without public support for farmers, poor agricultural land management will intensify land degradation, increase farmers’ vul-nerability to the effects of climate change, and lead to the emission of additional GHGs into the atmosphere. The amount of support that governments will need to provide by the year 2030 to enable farmers to implement SLM practices are projected at US$20 billion in Africa, $41 billion in Latin America, and $131 billion in Asia.
Mechanisms for Carbon Enhancement in Agro-Ecosystems
Sustainable land management delivers carbon benefi ts in three important ways. The fi rst is carbon conservation, in which the large volumes of carbon stored in natural forests, grasslands, and wetlands remain stored as carbon stocks. Conserving this terrestrial carbon represents a “least-cost opportunity” in terms of climate change adaptation and mitigation and is essential to increasing the resilience of agricultural ecosystems. The second benefi t is carbon sequestration, in which the growth of agricultural and natural biomass actively removes carbon from the atmosphere and stores it in soil and biomass. The third benefi t delivered by SLM is to reduce the emissions of GHGs that emanate from agricultural production, including those emissions that result from land-use change in which carbon stocks become carbon sources as agricultural production expands into natural ecosystems.
SLM practices are alternatives to conventional agriculture in all three of these paths—conservation, sequestration, and reductions in GHG emissions. While it capitalizes more purposefully on the positive impacts of conservation and sequestration, its reversal of agriculture’s negative impacts also presents profound contrast with conventional practices. These conventional agricultural prac-tices include deforestation, the burning of biomass, draining of wetlands, uncontrolled grazing, and plowing and other forms of soil disturbance that release not only carbon dioxide into the atmosphere, but also nitrous oxide and methane—GHGs with extremely high impacts on global warming. Investment in soil quality improvement practices such as erosion control, water management, and judicious application of fertilizers can reduce these emissions directly and increase rates of soil carbon sequestration.
The Dynamics of Soil Organic Carbon
Different ecosystems store different amounts of carbon depending on their species compositions, soil types, climate, relief, and other biophysical features. (Globally, volumes of carbon are generally measured in gigatonnes [Gt], which is equal to
XVI EXECUTIVE SUMMARY

ECONOMIC AND SECTOR WORK
1 billion tons, or metric tons in the United States.) The amount of carbon stored in plant biomass ranges from 3 Gt in croplands to 212 Gt in tropical forests (table E1). Soils hold more carbon than plant biomass (or vegetation) and account for 81 percent of the world’s terrestrial carbon stock. Soil carbon stocks also vary by ecosystem, ranging, for instance, from 100 Gt in temper-ate forests to 471 Gt in boreal forests. Boreal ecosystems are a particular concern. Because much of the soil organic carbon stored there is permafrost and wetlands, any large-scale melting caused by global warming will release massive volumes of carbon into the atmosphere. Conservation and protection are therefore widely recognized as major priorities, with the excep-tion of limited areas selected for forest management.
XVIIEXECUTIVE SUMMARY
TABLE E1: Carbon Stocks in Vegetation and Top 1 Meter of Soils of World Biomes
BIOMESAREA
(MILLION km2)
CARBON STOCKS (Gt C) AND PROPORTION IN THE ECOSYSTEM (%)
VEGETATIONPROPORTION
(%) SOILSPROPORTION
(%) TOTAL
Tropical forests 17.6 212 49.5 216 50.5 428
Temperate forests 10.4 59 37.1 100 62.9 159
Boreal forests 13.7 88 15.7 471 84.3 559
Tropical savannas 22.5 66 20.0 264 80.0 330
Temperate grasslands 12.5 9 3.0 295 97.0 304
Deserts 45.5 8 4.0 191 96.0 199
Tundra 9.5 6 4.7 121 95.3 127
Wetlands 3.5 15 6.3 225 93.8 240
Croplands 16 3 2.3 128 97.7 131
Total 151.2 466 2,011 2,477
Proportion (%) 19 81 100
Source: Watson, Robert, et al. (2000).
PHOTO E.1: Terracing and Landscape Management in Bhutan
Source: Curt Carnemark/World Bank.

The global carbon cycle describes the transfer of carbon in the earth’s atmosphere, vegetation, soils, and oceans. The two most important anthropogenic processes responsible for the release of carbon dioxide into the atmosphere are the burning of fossil fuels (coal, oil, and natural gas) and land use. Rapidly growing emissions are outpacing the growth in natural sinks (lands and oceans). The effi ciency of oceans and lands as carbon dioxide sinks has declined over time. These sinks currently remove an average of 55 percent of all anthropogenic carbon dioxide emissions; 50 years ago they removed 60 percent.
Soils are critically important in determining global carbon cycle dynamics because they serve as the link between the atmo-sphere, vegetation, and oceans. Globally, the soil carbon pool (also referred to as the pedologic pool) is estimated at 2,500 Gt up to a 2-m depth. Out of this, the soil organic carbon pool comprises 1,550 Gt, while the soil inorganic carbon and elemental pools make up the remaining 950 Gt (Batjes 1996). The soil carbon pool is more than 3 times the size of the atmospheric pool (760 Gt) and about 4.5 times the size of the biotic pool (560 Gt).
The soil organic carbon pool represents a dynamic balance between gains and losses. The amount changes over time de-pending on photosynthetic C added and the rate of its decay. Under undisturbed natural conditions, inputs of carbon from litter fall and root biomass are cycled by output through erosion, organic matter decomposition, and leaching. The potential carbon sequestration is controlled primarily by pedological factors that set the physico-chemical maximum limit to storage of carbon in the soil. Such factors include soil texture and clay mineralogy, depth, bulk density, aeration, and proportion of coarse fragments.
Attainable carbon sequestration is determined by factors that limit the input of carbon to the soil system. Net primary produc-tivity (NPP)—the rate of photosynthesis minus autotrophic respiration—is the major factor infl uencing attainable sequestra-tion and is modifi ed by above-ground versus below-ground allocation. Land management practices that increase carbon input through increasing NPP tend to increase the attainable carbon sequestration to nearer to the potential level. Climate has both direct and indirect effects on attainable sequestration. Decomposition rate increases with temperature but decreases with increasingly anaerobic conditions. Actual carbon sequestration is determined by land management factors that reduce carbon storage such as erosion, tillage, residue removal, and drainage. Theoretically, the potential soil carbon sequestration capacity is equivalent to the cumulative historical carbon loss. However, only 50 to 66 percent of this capacity is attainable through the adoption of sustainable land management practices.
The current rate of carbon loss due to land-use change (deforestation) and related land-change processes (erosion, tillage operations, biomass burning, excessive fertilizers, residue removal, and drainage of peat lands) is between 0.7 and 2.1 Gt carbon per year. Soil erosion is the major land degradation process that emits soil carbon. Because soil organic matter is concentrated on the soil surface, accelerated soil erosion leads to progressive depletion of soil carbon. The annual rate of soil loss ranges from 7.6 Gt for Oceania to 74.0 Gt for Asia (table E2). This corresponds to carbon emissions ranging from 0.02 to 0.04 Gt per year for Oceania to 0.30 to 0.44 Gt per year for Asia. Globally, 201 Gt of soil is lost to erosion, corresponding to 0.8 to 1.2 Gt of emitted carbon per year. Africa, Asia, and South America emit between 0.60 and 0.92 Gt of carbon per year through soil erosion. Agricultural soils must be prevented from being washed into streams and rivers where the relatively stable soil carbon pools are rapidly oxidized to carbon dioxide.
TABLE E2: Estimates of Erosion-Induced Carbon Emission Across World Regions
REGIONGROSS EROSION
(Gt/YEAR)
SOIL CARBON DISPLACED BY EROSION (2 TO 3 PERCENT OF
SEDIMENT; Gt C/YEAR)
EMISSION (20 PERCENT OF DISPLACED SOIL CARBON;
Gt C/YEAR)
Africa 38.9 0.8–1.2 0.16–0.24
Asia 74.0 1.5–2.2 0.30–0.44
South America 39.4 0.8–1.2 0.16–0.24
North America 28.1 0.6–0.8 0.12–0.16
Europe 13.1 0.2–0.4 0.04–0.08
Oceania 7.6 0.1–0.2 0.02–0.04
Total 201.1 4.0–6.0 0.8–1.2
Source: Lal, R. (2003).
XVII I EXECUTIVE SUMMARY
CARBON SEQUESTRATION IN AGRICULTURAL SOILS

ECONOMIC AND SECTOR WORK
Soil respiration, the fl ux of microbially and plant-respired carbon dioxide, estimated at 75 to 100 Gt carbon per year, is the next largest terrestrial carbon fl ux following photosynthesis. Soil respiration is a potentially important mechanism of positive feedback to climate change. A small change in soil respiration can signifi cantly alter the balance of atmospheric carbon dioxide concentration compared to soil carbon stores. Conventional tillage leads to the destruction of soil aggregates, excessive respiration, and soil organic matter decomposition, leading to reduced crop production and decreased resilience of the soil ecosystem. When other factors are at optimum, conservation tillage, use of cover crops (green manure), crop rotations, use of deep-rooted crops, application of manure, and water management can optimize soil respiration in addition to improving soil carbon leading to the triple win of enhanced agricultural productivity, adaptation, and mitigation.
Approaches to Soil Carbon Assessment
Soil carbon assessment in different parts of the world requires methods that are appropriate to the circumstances. The variety of methods that have been developed and tested for use in different countries raises concerns about their comparability. Ensuring this comparability warrants serious international priority. In the case of carbon projects, credible and cost-effective techniques of monitoring changes in soil carbon still need to be developed.
Soil carbon assessment methods can be broadly classifi ed into direct and indirect methods, depending on whether carbon content in soil samples is directly measured or inferred through a proxy variable. The most established type of direct soil carbon assessment entails collecting soil samples in the fi eld and analyzing them in the laboratory using combustion techniques. Field sampling is technically challenging, but most of its challenges can be addressed through an appropriate design that accounts for soil spatial variation. The degree and nature of sampling depend on the objectives of the carbon assessment objective, whether, for instance, the assessment is used for national or regional accounting or for a carbon offset project. Each context will require a differing degree of granularity and measurement set to assess uncertainty in the estimates. Direct methods are more precise and accurate but also more time and labor intensive as well as very expensive. Some in situ soil carbon analytical methods are being developed with the objective of offering increased accuracy, precision, and cost-effectiveness over con-ventional ex situ methods. The in situ soil carbon analytical methods include mid-infrared (IR) spectroscopy, near-IR spectros-copy, laser-induced breakdown spectroscopy (LIBS), and inelastic neutron scattering (INS). While LIBS and INS technologies are still in their infancy, IR spectroscopy has proven valuable in developing soil spectral libraries and for rapid characterization of soil properties for soil quality monitoring and other agricultural applications in developed and developing countries.
Indirect estimation of soil organic carbon changes over large areas using simulation models has become increasingly im-portant. Indirect methods are needed to fi ll knowledge gaps about the biogeochemical processes involved in soil carbon sequestration. One of the more important indirect methods involves the use of simulation models that project changes in soil organic carbon under varying climate, soil, and management conditions. Although simulation models can have limited accuracy, particularly in the context of developing countries in which land resources data are scarce, they are a cost-effective means of estimating GHG emissions in space and time under a wide range of biophysical and agricultural management condi-tions. The data can be particularly useful in scaling-up site-specifi c information to larger scales of magnitude.
Monitoring and verifying soil carbon sequestration at the project or regional scale require fi ve activities. These include selec-tion of landscape units suitable for monitoring soil carbon changes, development of measurement protocols, use of remote sensing to estimate soil organic carbon controlling parameters, spatially explicit biogeochemical modeling, and scaling-up the results to the entire project area. The selection of landscape monitoring units is based on the responsiveness of the area to land management practices as determined by climate, soil properties, management history, and availability of historical data. Protocols for temporally repeated measurements at fi xed locations will generally include stratifi cation and selection of sampling sites, sampling depth and volume, measurement of bulk density, laboratory analyses, other ancillary fi eld measure-ments, and estimation of the marginal cost of carbon sequestration.
Remote sensing can provide information on net primary productivity, leaf area index, tillage practices, crop yields and location, and amounts of crop residues. All of this is critical information used for input into models. Recently, the cellulose absorption index, derived from remote imaging spectroscopy, has been used to infer tillage intensity and residue quantity. These param-eters are fed into biogeochemical models to predict soil carbon sequestration. Scaling-up to larger areas requires integration from a variety of sources including fi eld measurements, existing databases, models, geographical information systems, and remote sensing. Multitemporal moderate resolution remote sensing such as the Landsat Thematic Mapper and Moderate
XIXEXECUTIVE SUMMARY

CARBON SEQUESTRATION IN AGRICULTURAL SOILS
Resolution Imaging Spectroradiometer can provide information such as land-use and land-cover change, crop rotations, and soil moisture, which can markedly improve our ability to scale-up soil carbon assessments.
Monitoring trends in soil carbon over a large geographical area through repeated sampling is, for the most part, restricted to in-dustrialized countries and a handful of developing countries. Examples of national carbon accounting system and tools include Australia’s National Carbon Accounting System; Canada’s National Forest Carbon Monitoring, Accounting, and Reporting System; Indonesia’s National Carbon Accounting System; and New Zealand’s Carbon Accounting System.
The Agriculture and Land Use National Greenhouse Gas Inventory Software tool was recently developed by Colorado State University to support countries’ efforts to understand current emission trends and the infl uence of land-use and manage-ment alternatives on future emissions. The tool can be used to estimate emissions and removals associated with biomass C stocks, soil C stocks, soil nitrous oxide emissions, rice methane emissions, enteric methane emissions, and manure meth-ane and nitrous oxide emissions, as well as non-CO2 GHG emissions from biomass burning.
PHOTO E.2: Crop Residue Management in Irrigated Fields in Indonesia
Source: Curt Carnemark/World Bank.
The Food and Agriculture Organization of the United Nations has developed the Ex Ante Appraisal Carbon-Balance Tool (EX-ACT) to assess GHGs in the agricultural sector. EX-ACT can provide ex ante assessments of the impact of agriculture and related forestry, fi sheries, livestock, and water development projects on GHG emissions and carbon sequestration, thereby indicating the overall effects on the carbon balance. A detailed analysis of lessons learned in testing EX-ACT in World Bank agriculture projects can be found in a separate report.
The BioCarbon Fund of the World Bank has also developed a methodology to encourage adoption of sustainable land man-agement practices by small-scale farmers in developing countries. The methodology, referred to as Sustainable Agricultural Land Management (SALM), provides a protocol for quantifying carbon emissions and removals and includes guidelines for identifying baseline scenario and assessing additionality in all carbon pools relevant to sustainable land management projects.
Factors Affecting Soil Carbon Sequestration
Climate signifi cantly infl uences large-scale patterns of soil carbon sequestration. In this study, irrespective of land manage-ment practices, higher sequestration rates were observed in the wettest locations with annual precipitation above 1,500 mm.
XX EXECUTIVE SUMMARY

ECONOMIC AND SECTOR WORK
XXIEXECUTIVE SUMMARY
There was also a trend to lower sequestration rates in the coolest (mean annual temperature less than 20°C) and warmest (mean annual temperature greater than 30°C) conditions. Sites in warmer and middle temperature regions tend to accumulate soil carbon more rapidly than those in colder regions, while semi-humid areas have higher sequestration rates than their semi-arid counterparts.
Soil type is signifi cant to soil carbon sequestration as well. Soils with higher clay content sequester carbon at higher rates. In Africa and Latin America, carbon sequestration rates and variability are highest on inceptisols—relatively young soils that con-stitute about 9 percent of soils in the tropics. In Asia, the highest sequestration rates and variability are observed in oxisols, formed principally in humid tropical zones under rain forest, scrub, or savanna vegetation. Oxisols comprise about 24 percent of tropical land mass and are typically found on old landscapes that have been subject to shifting cultivation for some time.
Timing is another factor that warrants careful consideration when introducing improved land management practices that increase carbon sequestration. Most of the potential soil carbon sequestration takes place within the fi rst 20 to 30 years of adopting improved land management practices. The patterns of change in sequestration rates are nonlinear and differ between major types of practices. With most practices, the highest rates of sequestration are achieved in the intermediate term, with lower or even negative rates in the short term.1
Greenhouse Gas Mitigation by Sustainable Land Management Technologies
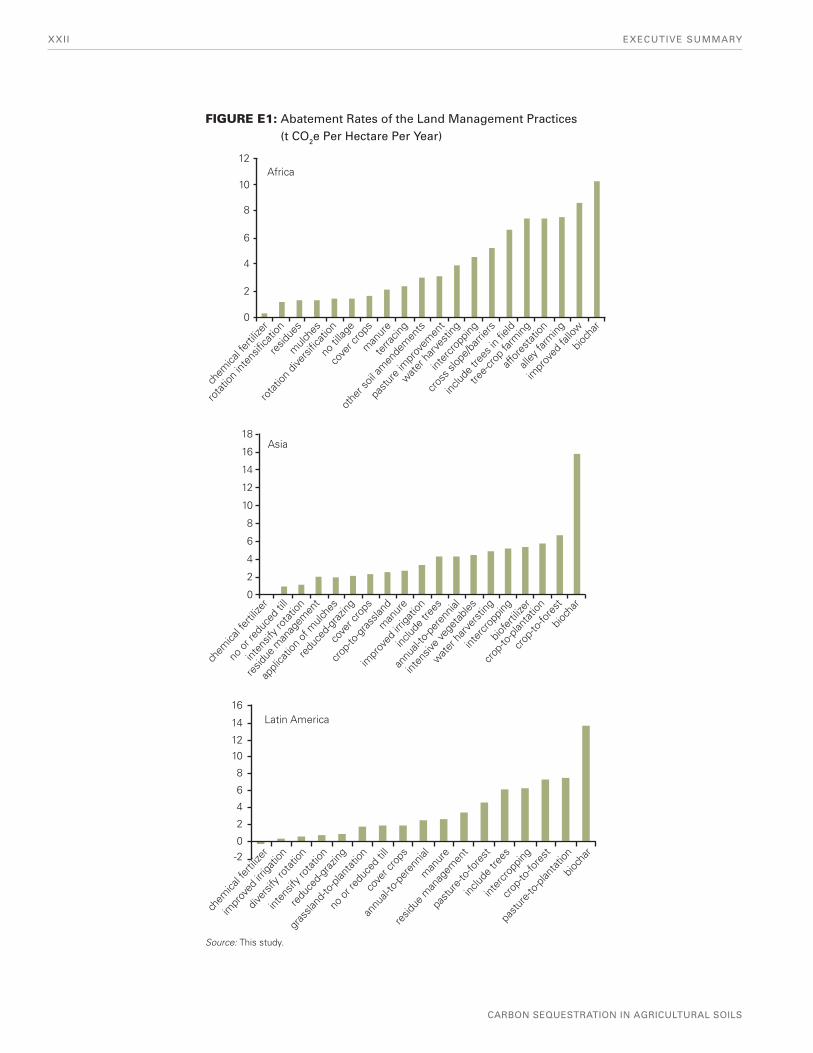
The climate benefi ts of sustainable land management technologies are measured by the net rate of carbon sequestration adjusted for emissions associated with the technologies—a measurement referred to as the abatement rate. The emissions associated with the technologies are classifi ed as land emissions and process emissions. Land emissions are the differences between emissions of nitrous oxides and methane by conventional and improved practices. Process emissions are those arising from fuel and energy use. The abatement rate is expressed in tons of carbon dioxide equivalent (t CO2e) per hectare (ha) per year.
Increases in productivity from nitrogen fertilizers need to be considered against the increased emission of GHGs from soils as well as the energy-related emissions associated with the fertilizer’s production and transport. In Latin America, the abatement rate of inorganic fertilizer is −0.23 t CO2e per ha per year compared to 0.13 t CO2e per ha per year for Asia and 0.29 t CO2e per ha per year for Africa. The greenhouse mitigation of manure is much higher at about 2.2 to 2.7 t CO2e per ha per year across the regions.
No-tillage and residue management generated abatement rates ranging from 0.9 to 3.5 t CO2e per ha per year across the three regions. These rates represent the marginal carbon benefi t of mulching or incorporating residues relative to burning, grazing, and removal of the residues for other uses. Commonly applied residues on croplands include biomass from trees, sugarcane, rice, and other grain crops.
Cover crops and crop rotation are key complementary practices for successful implementation of no-tillage. Cover crops improve soil quality by increasing soil organic carbon through their biomass, and they also help in improving soil aggregate stability and protecting the soil from surface runoff. Crop rotation is the deliberate order of specifi c crops sown on the same fi eld. The succeeding crop may be of a different species (e.g., maize or sorghum followed by legumes) or a variety from the previous crop, and the planned rotation may be for 2 or more years. GHG abatements of cover crops were 1.7 to 2.4 t CO2e per ha per year, while those of crop rotation were 0.7 to 1.5 t CO2e per ha per year. There is a tendency toward higher carbon sequestration rates in triple cropping systems, although variation is high. Differences in soils, climate, and cropping systems also affect carbon sequestration under crop rotation.
Supplemental irrigation and water harvesting are needed to minimize production risks in dry land agriculture. They also sequester carbon in the soil. Improved irrigation generated low to moderately high abatement rates (0.2 to 3.4 t CO2e per ha
1 The World Bank has posted a useful geographical information system tool on the Internet that summarizes the results of a series of ecosystem modeling exercises (see http://www-esd.worldbank.org/SoilCarbonSequestration/). The tool comprises several land man-agement scenarios refl ecting situations typically encountered in agricultural projects. The Internet GIS database provides per-hectare estimates of soil carbon sequestration under different land management practices for a period of 20 to 25 years. Information on carbon sequestration potential of a location can be derived by point-and-click or by searching using place names. Users can download data from the database and integrate them with other GIS information to estimate soil carbon stock changes for different agricultural projects.
CARBON SEQUESTRATION IN AGRICULTURAL SOILS
XXII EXECUTIVE SUMMARY
FIGURE E1: Abatement Rates of the Land Management Practices (t CO2e Per Hectare Per Year)
chem
ical fe
rtiliz
er
rota
tion i
nten
sifica
tion
resid
ues
mulc
hes
rota
tion d
iversi
ficati
onno
tillag
eco
ver c
rops
man
ure
terra
cing
othe
r soil
amen
dem
ents
pastu
re im
prov
emen
t
water h
arve
sting
inter
cropp
ing
cross
slop
e/barr
iers
includ
e tre
es in
field
tree-c
rop f
arming
affor
esta
tion
alley
farm
ing
impr
oved
fallo
wbio
char
Africa12
10
8
6
4
2
0
chem
ical fe
rtiliz
er
no o
r red
uced
till
inten
sify r
otat
ion
resid
ue m
anag
emen
t
appli
catio
n of
mulc
hes
redu
ced-
graz
ingco
ver c
rops
crop
-to-g
rass
land
man
ure
impr
oved
irriga
tion
includ
e tre
es
annu
al-to
-per
ennia
l
inten
sive
vege
table
s
water
har
vers
ting
inter
crop
ping
biofe
rtiliz
ercr
op-to
-fore
st
crop
-to-p
lanta
tion
bioch
ar
Asia18
16
14
12
10
8
6
4
2
0
16Latin America14
1210
8
6
4
2
0-2
chem
ical fe
rtiliz
er
impr
oved
irriga
tion
diver
sify r
otat
ion
inten
sify r
otat
ion
redu
ced-
graz
ing
gras
sland
-to-p
lanta
tion
no o
r red
uced
till
cove
r cro
ps
annu
al-to
-per
ennia
lm
anur
e
resid
ue m
anag
emen
t
pastu
re-to
-fore
st
includ
e tre
es
inter
crop
ping
crop
-to-fo
rest
pastu
re-to
-plan
tatio
nbio
char
Source: This study.

ECONOMIC AND SECTOR WORK
per year). Process and land emissions under irrigation can signifi cantly offset gains from carbon sequestration. Apart from energy-related emissions, a critical issue for soil carbon sequestration activities in irrigated areas is reduced emissions of methane from rice fi elds. Mid-season drainage is a viable practice to reduce such emissions. The GHG abatement of water harvesting, the process of concentrating runoff from a larger area for use in a smaller target area, averaged 3.9 to 4.8 t CO2e per ha per year. Terracing and construction of slope barriers on sloping lands for soil and water conservation produced abate-ments of 2.4 to 5.3 t CO2e per ha per year.
PHOTO E.3: Water Management in a Field in India
Source: Ray Witlin/World Bank.
Abatement rates of agroforestry systems, integrated land-use systems combining trees and shrubs with crops and livestock, are fairly high. This is due to the relatively large time-averaged biomass of trees compared to crops. The average abatement rates in t CO2e per ha per year are 7.6 for alley farming (the growing of crops simultaneously in alleys of perennial, preferably leguminous trees or shrubs), 7.5 for tree-crop farming, 8.7 for improved fallow (involving the use of fast-growing trees to ac-celerate soil rehabilitation), 4.6 to 6.3 for intercropping (the growing of crops near existing trees), and 4.3 to 6.7 for croplands where trees are introduced.
The impacts of land-use changes on tree-based systems are also relatively large. Conversion of cropland to forest or pasture to plantation resulted in an abatement of 6.7 to 7.5 t CO2e per ha per year, while conversion of cropland to plantation gener-ated an abatement of 5.7 t CO2e per ha per year. Pasture improvement generated an abatement of 3.21 t CO2e per ha per year, whereas conversion of cropland to grassland produced GHG mitigation of 2.6 t CO2e per ha per year. By defi nition, most of the potential impact of changes in agricultural practices on carbon stocks is below ground. However, land-use changes away from cropland to agroforestry or plantations provide more convincing examples where it is useful to think of both above- and below-ground sequestration rates at the same time and possible trade-offs or interactions between them.
Application of biochar, on average, resulted in the highest overall GHG abatement rate (10.3 to 15.7 t CO2e per ha per year), but its impact on crop productivity and soil resilience is still uncertain. In general, biochar production should not deplete the soil of the crop residues needed to protect against erosion and increase soil resilience.
Decisions to adopt any of the land management practices should not be based solely on their respective climate mitigation benefi ts. Rather, they should be based on whole farm systems analysis that comprehensively assesses the productivity,
XXIIIEXECUTIVE SUMMARY

CARBON SEQUESTRATION IN AGRICULTURAL SOILS
on-farm resource use, and environmental load of the system. Farm-scale management decisions, taken within a wider socio-economic context, particularly the infl uence of public policy and markets, will most likely generate optimum social benefi ts.
Profi tability of Soil Carbon Sequestration
In addition to storing soil carbon, sustainable land management technologies can be benefi cial to farmers by increasing yields and reducing production costs. Increases in crop yields derive from the ability of the land management technologies to maintain soil organic matter and biological activity at levels suitable for soil fertility. The pattern of increase in yield, however, varies from crop to crop. The profi tability of no-tillage systems results mainly from the reduced labor requirement for seedbed preparation and other tillage operations compared to conventional tillage systems. In Zambia, yields have doubled for maize and increased by 60 percent for cotton compared to the conventional tillage system.
Farmers also frequently reported signifi cant crop yield increases for maize, sorghum, millet, cotton, and groundnut in agroforestry systems, but relatively high labor inputs are required to reduce competition effects of trees from negatively impacting crop growth. Inorganic fertilizers also show relatively high profi ts because they provide nutrients that can be readily absorbed by plants. Judicious fertilizer application counters soil nutrient depletion, reduces deforestation and expansion of cultivation to marginal areas, and increases crop yields. Excessive fertilizer use is less environmentally friendly, however, due to nitrous oxide emissions associated with high application rates of nitrogen fertilizers and fossil fuel–based emissions associated with fertilizer production and transportation.
Capitalizing on Synergies and Managing Trade-Offs in Soil Carbon Sequestration
Synergies occur when there is a positive correlation between carbon sequestration and profi tability (where profi tability refers to the net present value of implementing the land management practices). Trade-offs occur when attempts to increase carbon storage reduce profi ts. Increasing food security under a changing climate requires the analysis and identifi cation of the land management technologies that maximize synergies and minimize trade-offs. A plot of profi t versus carbon sequestration reveals synergies in two agroforestry systems—intercropping and alley farming (top right quadrant of fi gure E2).
In fi gure E2, land management technologies in the lower right quadrant have high mitigation potentials but are modestly profi table. Afforestation, improved fallow (including trees in croplands), and establishing barriers across sloping areas tend to take land out of production for a signifi cant period of time. They reduce the amount of land available for cultivation in the short run but can lead to overall increases in productivity and improved resilience in the long run. The time-averaged, above-ground
XXIV EXECUTIVE SUMMARY
PHOTO E.4: Maize Growing under Faidherbia Albida Trees in Tanzania
Source: World Agroforestry Centre.

ECONOMIC AND SECTOR WORK
biomass of crop residues and other technologies in the lower left quadrant of fi gure E2 is relatively small compared to that of agroforestry systems. Also, the biomass of crop residues does not accumulate easily, resulting in lower mitigation benefi ts.
Judicious fertilizer application increases crop yields and profi tability. Yields also increase with manure application and ac-cumulation of soil carbon, but with patterns that depend on crop type. Manure is less profi table than inorganic fertilizer because of the labor costs associated with collecting and processing manure (top left quadrant of fi gure E2). The relatively high profi tability of no-tillage derives primarily from the decrease in production costs after the establishment of the system.
XXVEXECUTIVE SUMMARY
FIGURE E2: Trade-Offs Between Profi tability and Carbon Sequestration of Sustainable Land Management Technologies
Source: This study.
1,000
100
10
1
0 2 4
carbon dioxide sequestered (ton per hectare per year)
6 8 10
Cross slope barriersImproved fallow
Tree crop farming
Afforestation
Alley farming
Intercropping
No-tillage
Manure
Cover crops
Crop residuesSoil amendments
TerracingRotation diversifi cationRotation
intensifi cation
Rainwater harvesting
Inorganic fertilizer
Include trees
profi
t pe
r to
ne o
f car
bon
diox
ide
sequ
este
red
(US
$)
PHOTO E.5: Crop Harvesting in Mali. The Biomass Is Smaller Compared to that of Agroforestry Systems
Source: Curt Carnemark/World Bank.
CARBON SEQUESTRATION IN AGRICULTURAL SOILS
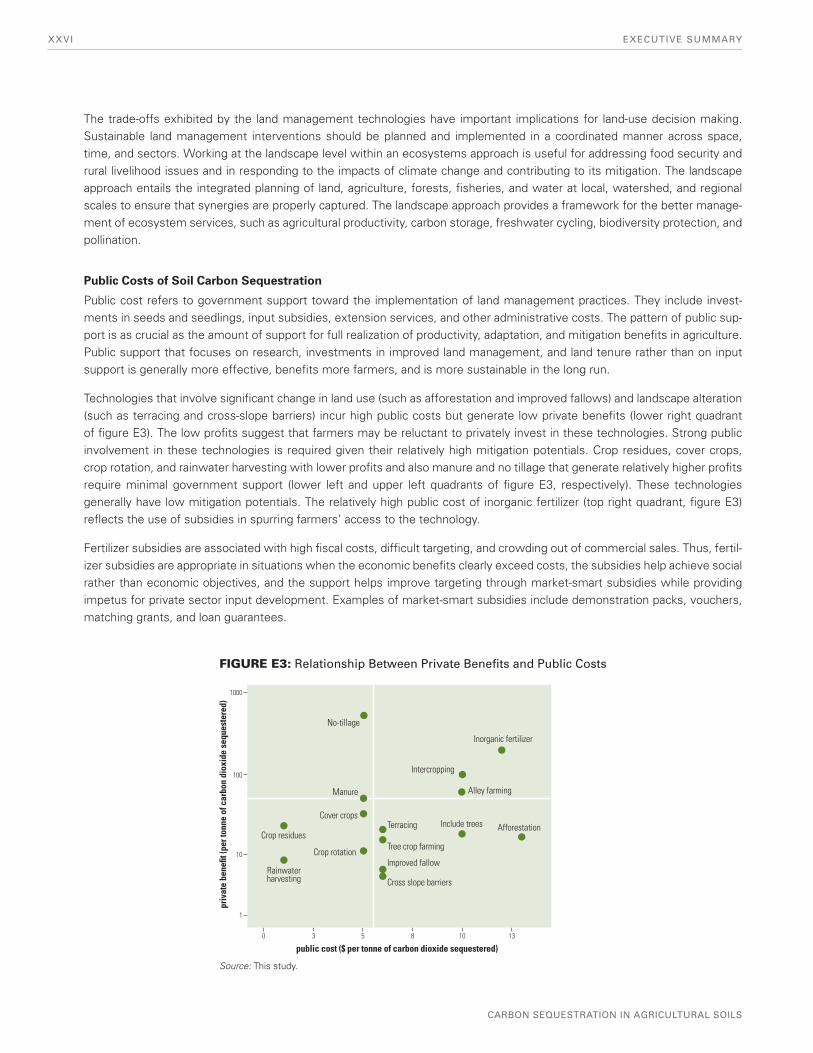
The trade-offs exhibited by the land management technologies have important implications for land-use decision making. Sustainable land management interventions should be planned and implemented in a coordinated manner across space, time, and sectors. Working at the landscape level within an ecosystems approach is useful for addressing food security and rural livelihood issues and in responding to the impacts of climate change and contributing to its mitigation. The landscape approach entails the integrated planning of land, agriculture, forests, fi sheries, and water at local, watershed, and regional scales to ensure that synergies are properly captured. The landscape approach provides a framework for the better manage-ment of ecosystem services, such as agricultural productivity, carbon storage, freshwater cycling, biodiversity protection, and pollination.
Public Costs of Soil Carbon Sequestration
Public cost refers to government support toward the implementation of land management practices. They include invest-ments in seeds and seedlings, input subsidies, extension services, and other administrative costs. The pattern of public sup-port is as crucial as the amount of support for full realization of productivity, adaptation, and mitigation benefi ts in agriculture. Public support that focuses on research, investments in improved land management, and land tenure rather than on input support is generally more effective, benefi ts more farmers, and is more sustainable in the long run.
Technologies that involve signifi cant change in land use (such as afforestation and improved fallows) and landscape alteration (such as terracing and cross-slope barriers) incur high public costs but generate low private benefi ts (lower right quadrant of fi gure E3). The low profi ts suggest that farmers may be reluctant to privately invest in these technologies. Strong public involvement in these technologies is required given their relatively high mitigation potentials. Crop residues, cover crops, crop rotation, and rainwater harvesting with lower profi ts and also manure and no tillage that generate relatively higher profi ts require minimal government support (lower left and upper left quadrants of fi gure E3, respectively). These technologies generally have low mitigation potentials. The relatively high public cost of inorganic fertilizer (top right quadrant, fi gure E3) refl ects the use of subsidies in spurring farmers’ access to the technology.
Fertilizer subsidies are associated with high fi scal costs, diffi cult targeting, and crowding out of commercial sales. Thus, fertil-izer subsidies are appropriate in situations when the economic benefi ts clearly exceed costs, the subsidies help achieve social rather than economic objectives, and the support helps improve targeting through market-smart subsidies while providing impetus for private sector input development. Examples of market-smart subsidies include demonstration packs, vouchers, matching grants, and loan guarantees.
XXVI EXECUTIVE SUMMARY
FIGURE E3: Relationship Between Private Benefi ts and Public Costs
Source: This study.
1000
100
10
1
0 3 5 8 10 13
public cost ($ per tonne of carbon dioxide sequestered)
Cross slope barriers
Improved fallow
Tree crop farming
Afforestation
Alley farming
Intercropping
No-tillage
Manure
Cover crops
Crop residues
Crop rotation
Terracing
Rainwater harvesting
Inorganic fertilizer
Include trees
priv
ate
bene
fi t (p
er to
nne
of c
arbo
n di
oxid
e se
ques
tere
d)

ECONOMIC AND SECTOR WORK
XXVIIEXECUTIVE SUMMARY
TABLE E3: Technical Mitigation Potential, Private Benefi ts, and Public Costs of the Land Management Technologies by 2030
SCENARIOTECHNICAL POTENTIAL (MILLION TONS CO2-eq)
PRIVATE BENEFITS (US$, BILLION )
PUBLIC COSTS (US$, BILLION )
Africa
B1 3,448 105.4 19.6
A1b 3,505 108.6 19.7
B2 3,678 111.4 20.8
A2 3,926 120.9 22.3
Asia
B1 5,977 1,224.5 131.3
A1b 6,388 1,259.3 143.6
B2 7,007 1,368.1 159.7
A2 6,678 1,310.8 150.4
Latin America
B1 2,321 273.8 40.8
A1b 2,425 279.4 42.9
B2 2,538 288.8 44.3
A2 3,097 319.4 55.1
Source: This study.Notes: B1 = a world more integrated and more ecologically friendly; A1b = a world more integrated with a balanced emphasis on all energy sources; B2 = a world more divided but more ecologically friendly; A2 = a world more divided and independently operating self-reliant nations.
The overall biophysical mitigation, potential savings, and the costs of soil carbon sequestration by 2030 depend on the emission scenarios infl uenced by a wide range of driving forces from demographic to social and economic developments. The total mitigation potential varies from 2.3 Gt CO2-eq for Latin America to 7.0 Gt CO2-eq for Asia (table E3). Total private profi ts range from US$105 billion in Africa to $1.4 trillion in Asia, while total public costs range from US$20 billion in Africa to $160 billion in Asia.
Barriers to the Adoption of Sustainable Land Management Practices
Despite the fact that improved land management technologies generate private and public benefi ts, their adoption faces many socioeconomic and institutional barriers: Most of the land management technologies require signifi cant up-front ex-penditure that poor farmers cannot afford; the nonavailability of inputs in the local markets can be a signifi cant obstacle; lack of information on the potentials of alternative techniques of farming and limited capacity is a major constraint in many developing countries; when technologies are inconsistent with community rules and traditional practices, their adoption is often resisted; and willingness and ability to work together is crucial for many technologies such as improved irrigation and communal pastures. The absence of collective action will hinder successful uptake, diffusion, and impact of such land management technologies.
Factors affecting adoption tend to be more specifi c to the land management technologies. Table E4 suggests that lack of credit and inputs and land tenure problems are by far the most important factors for adoption across the range of technologies. However, improved availability of inputs is a necessary but insuffi cient condition for adoption of land management practices. Better market prices for crops and other agricultural produce are crucial. Secure land rights is a precondition for climate-smart agriculture as it provides incentive for local communities to manage land more sustainably. Ill-defi ned land ownership may inhibit sustainable land management changes.

XXVII I
CARBON SEQUESTRATION IN AGRICULTURAL SOILS
Behavioral change through education and extension services is required to enable change-over to improved land manage-ment technologies. For instance, conservation agriculture, the farming system involving no-tillage, residue management, and use of cover crops is highly knowledge intensive, requiring training and practical experience of those promoting its adoption. Learning hubs, regional platforms, scientifi c research, south-south knowledge exchange, and technical support mechanisms may increase innovation and facilitate adoption of improved land management technologies. The knowledge base of land management practices at the local level can be also improved through careful targeting of capacity development programs.
Policy Implications
Private benefi ts that drive land-use decisions often fall short of social costs; thus, carbon sequestration may not reach the optimal level from a social point of view unless some mechanisms exist to encourage farmers. Some public policies that can potentially incentivize carbon sequestration include the following options.
1. Strengthen the capacity of governments to implement climate-smart agriculture. Countries must be prepared to access new and additional fi nance. There is a need to build the technical and institutional capacity of government ministries to implement climate-smart agriculture programs. Existing national policies, strategies, and investment plans should be strengthened to form the basis for scaling-up investments for climate-smart agriculture. Readiness for carbon sequestration and climate-smart agriculture can be achieved through improved extension services and training in relevant land management technologies for different locales.
2. Global cooperative agreement. Given the tremendous signifi cance that agriculture has for the global climate, prog-ress in incorporating it into the UN Framework Convention on Climate Change (UNFCCC) has been slower than many people hoped for. While the negative impacts of agricultural production in terms of land-use change and GHG emis-sions were reasonably well covered by the convention, the real and potential contributions the sector can and does make in terms of sequestering carbon in agricultural biomass and soils were for the most part omitted. Redressing this omission promises to foster a more balanced perspective in which food security is not necessarily at odds with climate change adaptation and mitigation (an unworkable confl ict in which longer term environmental concerns are virtually guaranteed to universally lose out politically to the more immediate concern of food supply). A more practi-cal and thorough picture makes it possible for agriculture to be rewarded for its positive environmental impacts and to be an integral part of the solution as well as part of the problem. This is vitally important because agriculture needs to be fully incorporated into adaptation and mitigation strategies. As a result, the international community has recognized the importance of integrating agriculture into the ongoing negotiations on the international climate change regime. At the 17th Conference of Parties to the UNFCCC in Durban, South Africa, in November 2011, the parties asked the UNFCCC Subsidiary Body for Scientifi c and Technological Advice to explore the possibility of a formal work program on agriculture.
LAND MANAGEMENT TECHNOLOGY
INPUTS/CREDITS
MARKETACCESS
TRAINING/EDUCATION
LANDTENURE RESEARCH INFRASTRUCTURE
Inorganic fertilizer *** ** ** ** * **
Manure ** ** * ** * **
Conservation agriculture ** ** *** ** ** *
Rainwater harvesting ** ** ** *** ** **
Cross-slope barriers ** * ** ** ** *
Improved fallows ** * * *** ** *
Grazing management *** *** ** *** ** *
Source: Synthesized from Liniger et al. 2011.
Liniger, H. P., Mekdaschi Studer, R., Hauert, C., and Gurtner, M. 2011. Sustainable Land Management in Practice—Guidelines and Best Practices for Sub-Saharan Africa. World Overview of Conservation Approaches and Technologies and Food and Agriculture Organization of the United Nations.Key * = Low importance, ** = Moderate importance; *** = High importance.
TABLE E4: Relative Importance of Different Factors for Adopting Improved Land Management Practices
EXECUTIVE SUMMARY

XXIX
ECONOMIC AND SECTOR WORK
3. Boost fi nancial support for early action. A blend of public, private, and development fi nance will be required to scale-up improved land management practices. Integrating sources of climate fi nance with those that support food security may be one of the most promising ways to deliver to climate-smart agriculture the resources it requires. For technologies that generate signifi cant private returns, grant funding or loans may be more suitable to overcom-ing adoption barriers. For technologies such as conservation agriculture that require specifi c machinery inputs and signifi cant up-front costs, payment for an ecosystem services scheme could be used to support farmers and break the adoption barrier. There is also the potential for carbon fi nance to support farmers during the initial period before the trees in agroforestry systems generate an economic return.
4. Raise the level of national investment in agriculture. While this may appear a tall order in countries with severe bud-get constraints, fi nite public resources can be more selectively targeted using the criteria given above—prioritizing technologies that generate no short-term returns and those that most effectively address the barriers that prevent prospective adopters from moving forward. In some cases, relatively affordable technologies that generate quick and demonstrable benefi ts may warrant priority and potentially establish some of the channels through which more sophisticated technologies are dispersed in the future. Nationally owned climate-smart agricultural policies and action frameworks will increase the adoption of sustainable land management practices. However, public investment is only one sphere, and involving the private sector in climate-smart agriculture and sustainable land management is the other.
5. Create enabling environments for private sector participation. Introducing policies and incentives that provide an enabling environment for private sector investment can increase overall investment. This private investment can be targeted to some degree as well, particularly when government priorities translate clearly into business opportunities and certain areas of investment are looked upon favorably by public offi cials and institutions. Public investment can also be used to leverage private investment in areas such as research and development, establishing tree planta-tions, and developing improved seeds and seedlings. Particular attention should go to encouraging private fi nancial service providers to tailor instruments that enable farmers who adopt SLM practices to overcome the barriers de-scribed above. Bundling agricultural credit and insurance together and providing different forms of risk management such as index-based weather insurance or weather derivatives are areas of private investment that can be encour-aged through public policy and public-private partnerships.
EXECUTIVE SUMMARY


1
ECONOMIC AND SECTOR WORK
CHAPTER 1 — INTRODUCTION
Chapter 1: INTRODUCTION
1.1 FOOD SECURITY UNDER A CHANGING CLIMATE
Ensuring food security under changing climate conditions is one of the major challenges of our era. There are about 925 million food-insecure people in the world—about 16 percent of the population in developing countries. Global population will increase from 7 billion currently to over 9 billion people by 2050, creating a demand for a more diverse diet that re-quires additional resources to produce. Competition for land, water, and energy will intensify in an attempt to meet the need for food, fuel, and fi ber and will contribute to economic development and poverty reduction. Over this period, global-ization may further expose the food system to the vagaries of economic and political forces. Various projections suggest that global food requirements must increase by 70 to 100 percent by 2050 (Burney, Davis, and Lobell 2010), in addition to maintaining and, where possible, enhancing the resilience of natural ecosystems.
Agriculture is highly vulnerable to climate change and needs to adapt to changing climate conditions. Under optimistic lower end projections of temperature rise, climate change may reduce crop yields by 10 to 20 percent (Jones and Thornton 2009), while increased incidence of droughts and fl oods may lead to a sharp increase in prices of some of the main food crops by the 2050s. Climate change will also im-pact agriculture through effects on pests and disease. The interactions between ecosystems and climate change are complex, and the full implications in terms of productivity and food security are uncertain (Gornall et al. 2010)
The agriculture sector has a pivotal role to play in mitigating greenhouse gas (GHG) emissions. Agriculture and land-use change currently account for about one-third of total emis-sions (fi gure 1.1). Agriculture is the primary driver of defores-tation in many developing countries. The net increase in agri-cultural land during the 1980s and 1990s was more than 100 million ha across the tropics. About 55 percent of the new
FIGURE 1.1: Contribution of Different Sectors to Greenhouse Gas Emissions
Buildings8%
Forestry17%
Agriculture14%
Waste 3%
Transport13%
Energy26%
Industry19%
Manuremgt, 7%
Rice production,11%
Biomassburning, 12%
Nitrous oxidefrom soils,
38%
Enteric fermentation,32%
Source: IPCC 2007; Smith et al. 2008.

CARBON SEQUESTRATION IN AGRICULTURAL SOILS
2 CHAPTER 1 — INTRODUCTION
agricultural land in the tropics came at the expense of intact forests, while another 28 percent came from the conversion of degraded forests (Gibbs et al. 2010; fi gure 1.2). Projected increases in demand for food and bioenergy by 2050 may further increase pressure on forests in the tropics with pro-found implications for an increase in GHG emissions. Even if emissions in all other sectors were eliminated by 2050, growth in agricultural emissions under a business-as-usual world with a near doubling in food production would perpetu-ate climate change.
1.2 CARBON BENEFITS THROUGH CLIMATE-SMART AGRICULTURE
The triple imperatives of increasing productivity, reducing emissions, and enhancing resilience to climate change call for alternative approaches to practicing agriculture. Climate-smart agriculture (CSA) seeks to increase productivity in an environmentally and socially sustainable way, strengthen farmers’ resilience to climate change, and reduce agriculture’s contribution to climate change by reducing GHG emissions and increasing soil carbon storage. One of the key elements of CSA is sustainable land management (SLM) involving the implementation of land-use systems and management practices that enable humans to maximize the economic and social benefi ts from land while maintaining or enhancing the ecosystem services from land resources.
Soil is central to most SLM technologies because it is the basic resource for land use. It supports all the terrestrial eco-systems that cycle much of the atmospheric and terrestrial carbon. It also provides the biogeochemical linkage between other major carbon reservoirs, namely the biosphere, at-mosphere, and hydrosphere. Soil carbon is held within the soil, primarily in association with its organic constituent. Soil carbon has a strong correlation with soil quality, defi ned as the ability of soils to function in natural and managed ecosys-tems. Soil carbon infl uences fi ve major functions of the soil (Larson and Pierce 1991), namely the ability to
accept, hold, and release nutrients;
accept, hold, and release water both for plants and for surface and groundwater recharge;
promote and sustain root growth;
maintain suitable biotic habitat; and
respond to management and resist degradation.
Increasing soil organic carbon can reverse soil fertility deteri-oration, the fundamental cause of declining crop productivity in developing countries. Table 1.1 indicates the potential in-crease in crop yields from increasing the soil organic carbon pool in the root zone by 1 ton C/ha/yr through SLM technolo-gies. The overall increase in grain productivity in Africa, Asia, and Latin America due to such increase in soil organic carbon is estimated at 24 to 40 million tons per year (table 1.2).
FIGURE 1.2: Proportion of Agricultural Land Derived From Different Land Covers in the Tropics, 1980–2000
Water
90%
80%
70%
60%
50%
40%
30%
20%
10%
0%
100%
Plantations
Shrubs
Disturbed forests
Intact forests
Sout
h Asia
Wes
t Afri
ca
East
Afri
ca
Sout
h Am
erica
Sout
h-Ea
st A
sia
Centra
l Afri
ca
Centra
l Am
erica
Pan-
Tropic
s
Source: Redrawn from Gibbs et al. (2010).
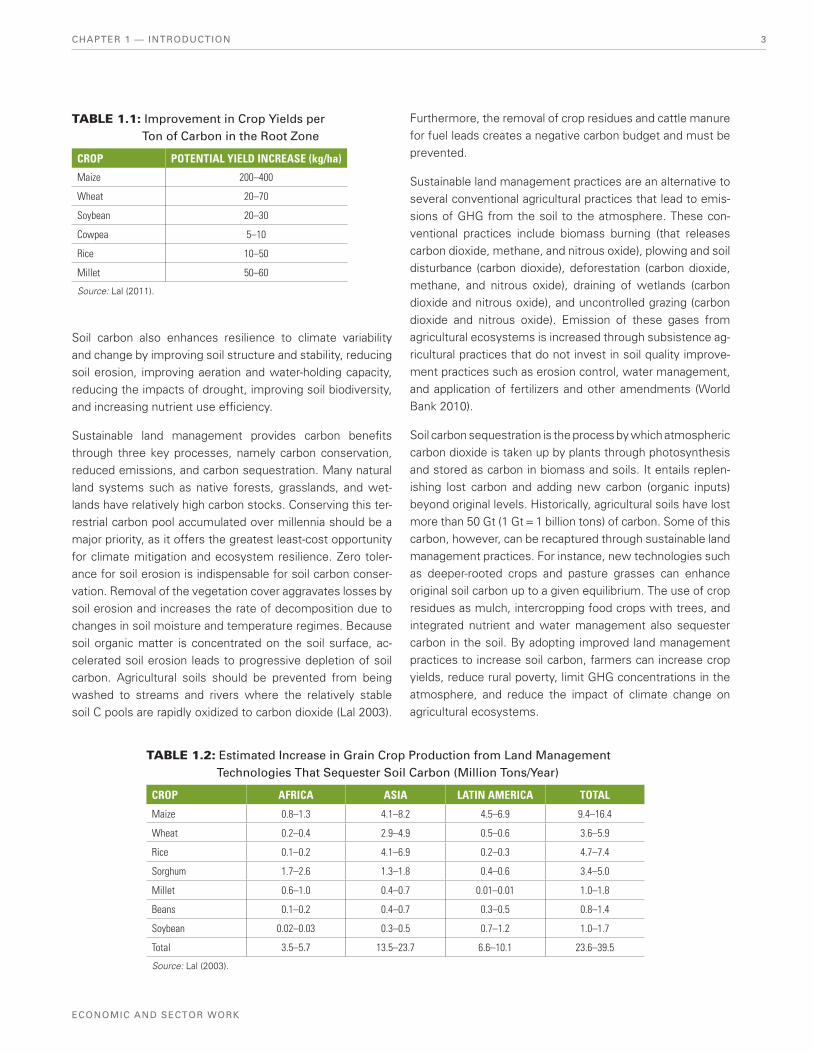
ECONOMIC AND SECTOR WORK
3CHAPTER 1 — INTRODUCTION
Soil carbon also enhances resilience to climate variability and change by improving soil structure and stability, reducing soil erosion, improving aeration and water-holding capacity, reducing the impacts of drought, improving soil biodiversity, and increasing nutrient use effi ciency.
Sustainable land management provides carbon benefi ts through three key processes, namely carbon conservation, reduced emissions, and carbon sequestration. Many natural land systems such as native forests, grasslands, and wet-lands have relatively high carbon stocks. Conserving this ter-restrial carbon pool accumulated over millennia should be a major priority, as it offers the greatest least-cost opportunity for climate mitigation and ecosystem resilience. Zero toler-ance for soil erosion is indispensable for soil carbon conser-vation. Removal of the vegetation cover aggravates losses by soil erosion and increases the rate of decomposition due to changes in soil moisture and temperature regimes. Because soil organic matter is concentrated on the soil surface, ac-celerated soil erosion leads to progressive depletion of soil carbon. Agricultural soils should be prevented from being washed to streams and rivers where the relatively stable soil C pools are rapidly oxidized to carbon dioxide (Lal 2003).
Furthermore, the removal of crop residues and cattle manure for fuel leads creates a negative carbon budget and must be prevented.
Sustainable land management practices are an alternative to several conventional agricultural practices that lead to emis-sions of GHG from the soil to the atmosphere. These con-ventional practices include biomass burning (that releases carbon dioxide, methane, and nitrous oxide), plowing and soil disturbance (carbon dioxide), deforestation (carbon dioxide, methane, and nitrous oxide), draining of wetlands (carbon dioxide and nitrous oxide), and uncontrolled grazing (carbon dioxide and nitrous oxide). Emission of these gases from agricultural ecosystems is increased through subsistence ag-ricultural practices that do not invest in soil quality improve-ment practices such as erosion control, water management, and application of fertilizers and other amendments (World Bank 2010).
Soil carbon sequestration is the process by which atmospheric carbon dioxide is taken up by plants through photosynthesis and stored as carbon in biomass and soils. It entails replen-ishing lost carbon and adding new carbon (organic inputs) beyond original levels. Historically, agricultural soils have lost more than 50 Gt (1 Gt = 1 billion tons) of carbon. Some of this carbon, however, can be recaptured through sustainable land management practices. For instance, new technologies such as deeper-rooted crops and pasture grasses can enhance original soil carbon up to a given equilibrium. The use of crop residues as mulch, intercropping food crops with trees, and integrated nutrient and water management also sequester carbon in the soil. By adopting improved land management practices to increase soil carbon, farmers can increase crop yields, reduce rural poverty, limit GHG concentrations in the atmosphere, and reduce the impact of climate change on agricultural ecosystems.
TABLE 1.1: Improvement in Crop Yields per Ton of Carbon in the Root Zone
CROP POTENTIAL YIELD INCREASE (kg/ha)
Maize 200–400
Wheat 20–70
Soybean 20–30
Cowpea 5–10
Rice 10–50
Millet 50–60
Source: Lal (2011).
TABLE 1.2: Estimated Increase in Grain Crop Production from Land Management Technologies That Sequester Soil Carbon (Million Tons/Year)
CROP AFRICA ASIA LATIN AMERICA TOTAL
Maize 0.8–1.3 4.1–8.2 4.5–6.9 9.4–16.4
Wheat 0.2–0.4 2.9–4.9 0.5–0.6 3.6–5.9
Rice 0.1–0.2 4.1–6.9 0.2–0.3 4.7–7.4
Sorghum 1.7–2.6 1.3–1.8 0.4–0.6 3.4–5.0
Millet 0.6–1.0 0.4–0.7 0.01–0.01 1.0–1.8
Beans 0.1–0.2 0.4–0.7 0.3–0.5 0.8–1.4
Soybean 0.02–0.03 0.3–0.5 0.7–1.2 1.0–1.7
Total 3.5–5.7 13.5–23.7 6.6–10.1 23.6–39.5
Source: Lal (2003).

CARBON SEQUESTRATION IN AGRICULTURAL SOILS
1.3 OBJECTIVES AND SCOPE OF THE REPORT
The purpose of this report is to improve the knowledge base for facilitating investments in land management tech-nologies that sequester soil organic carbon. While there are many studies on soil carbon sequestration, there is no single unifying volume that synthesizes knowledge on the impact of different land management practices on soil carbon se-questration rates across the world.2 A meta-analysis was car-ried out to provide soil carbon sequestration rates in Africa, Asia, and Latin America. This is one important element in decision-making for sustainable agricultural intensification, agro-ecosystems resilience, and comprehensive assess-ments of greenhouse mitigation potentials of SLM practices. Furthermore, the ecosystem simulation modeling technique was used to predict future carbon storage in global cropland soils. Last, marginal abatement cost curves and trade-off graphs were used to assess the cost-effectiveness of the technologies in carbon sequestration.
The remainder of the report is organized as follows. Chapter 2 provides a brief review of soil organic carbon dynamics and the methods for soil carbon assessment. The chapter con-cludes with brief information on carbon assessment in The World Bank’s sustainable land management projects portfo-lio. Chapter 3 reports the increase in soil carbon for selected sustainable land management practices in Africa, Asia, and Latin America. Chapter 4 reports the estimates from ecosys-tem simulation, while Chapter 5 concludes with the benefits and costs of adopting carbon sequestering practices and a discussion of policy options to support climate-smart agricul-ture in developing countries. The report will provide a broad perspective to natural resource managers and other profes-sionals involved in scaling up CSA.
REFERENCES
Burney, J. A., Davis, S. J., and Lobell, D. B. 2010. “Greenhouse Gas Mitigation by Agricultural Intensification.” Proceedings of the National Academy of Sciences 107 (26): 12052–12057.
Gibbs, H. K., Ruesch, A. S., Foley, J. A., Ramankutty, N., Achard, F., and Holmgren, P. 2010. “Pathways of Agricultural Expansion Across the Tropics: Implications for Forest Resources.” Proceedings of the National Academy of Sciences 107 (38): 16732–16737.
Gornall, J., Betts, R., Burke, E., Clark, R., Camp, J., Willett, K., and Wiltshire, A. 2010. “Implications of Climate Change for Agricultural Productivity in the Early Twenty-First Century.” Philosophical Tranactions of the Royal Society B 365: 2973–2989. doi:10.1098/rstb.2010.0158.
Guo, L., and Gifford, R. 2002. “Soil Carbon Stocks and Land-Use Change: A Meta Analysis.” Global Change Biology 8: 345–360.
Intercontinental Panel on Climate Change (IPCC). 2007. Climate Change 2007: Synthesis Report—Summary for Policymakers. Fourth Assessment Report.
Jones, P., and Thornton, P. 2009. “Croppers to Livestock Keepers: Livelihood Transitions to 2050 in Africa Due to Climate Change.” Environmental Science and Policy 12: 427–437.
Lal, R. 2003. “Soil Erosion and the Global Carbon Budget.” Environment International 29: 437–450.
Lal, R. 2011. “Sequestering Carbon in Soils of Agroecosystems.” Food Policy 36: S33–S39.
Larson, W. E., and Pierce, F. J. 1991. “Conservation and Enhancement of Soil Quality.” In Evaluation for Sustainable Land Management in the Developing World, Vol. 2: Technical Papers, ed. J. Dumanski, E. Pushparajah, M. Latham, and R. Myers. Bangkok, Thailand: International Board for Research and Management. IBSRAM Proceedings No. 12 (2): 175–203.
Ogle, S. M., Bredit, F. J., and Pasutian, K. 2005. “Agricultural Management Impacts on Soil Organic Carbon Storage Under Moist and Dry Climatic Conditions of Temperate and Tropical Regions.” Biogeochemistry 72: 87–121.
Smith, P., Martino, D., Cai, Z., et al. 2008. “Greenhouse Gas Mitigation in Agriculture.” Philosophical Transactions of the Royal Society B 363: 789–813.
Watson, Robert et al., ed. 2000. Land Use, Land-Use Change, and Forestry. Intergovernmental Panel on Climate Change. Cambridge University Press, Cambridge.
World Bank. 2010. Sustainable Land Management for Mitigation of and Adaptation to Climate Change. Environment Department.
2 Major exceptions are Guo and Gifford (2002) and Ogle et al. (2005), but the sequestration rates in these papers are highly variable and not specific to local conditions.
C H A P T E R 1 — I N T R O D U C T I O N4

ECONOMIC AND SECTOR WORK
2.1 SOIL ORGANIC CARBON DYNAMICS
Different ecosystem types store different amounts of car-bon depending on their species compositions, soil types, climate, relief, and other biophysical features (fi gure 2.1). Of the estimated over 150 million km2 of terrestrial ecosystems area, forests account for more than 40 million km2 (about 28 percent). Savannahs and grasslands both cover about 23 percent, while croplands occupy about 11 percent (table 2.1). Among the biomes, vegetation carbon stocks range from 3 Gt for croplands to 212 Gt for tropical forests, while soil car-bon stocks range from 100 Gt for temperate forests to 471 Gt for boreal forests. The tundra biome, covering an area of less than 10 million km2, has the highest density of carbon storage. Soils generally hold more carbon than vegetation across biomes and account for 81 percent of terrestrial car-bon stock at the global level.
The global carbon cycle describes the transfer of carbon in the earth’s atmosphere, vegetation, soils, and oceans. The
two most important anthropogenic processes responsible for the release of carbon dioxide into the atmosphere are burning of fossil fuels (coal, oil, and natural gas) and land use (table 2.2). Emissions from land-use change are about 1.5 Gt C per year, largely determined by tropical deforestation that exacerbates soil erosion and organic matter decomposition. The underlying driving factors of tropical deforestation are highly interconnected and include poverty, policy and institu-tional failures, population growth, and the attendant demand for natural resources, urban expansion, and international trade.
Rapidly growing emissions are outpacing the growth in natural sinks. The effi ciency of oceans and lands as carbon dioxide sinks has declined over the years. Currently, natural sinks remove an average of 55 percent of all anthropogenic carbon dioxide emissions, which is slightly lower than 60 percent they removed some 50 years ago (Global Carbon Project 2009).
Chapter 2: SOIL ORGANIC CARBON DYNAMICS AND ASSESSMENT METHODS
FIGURE 2.1: Carbon Stocks in Biomass and Soils
Carbon storage interrestrial ecosystems(Tonnes per ha)
0 to 1010 to 2020 to 5050 to 100100 to 150150 to 200200 to 300300 to 400400 to 500More than 500
Source: Ruesch and Gibbs, 2008;IGBP-DIS, 2000.
Source: UNEP/GRID, http://www.grida.no/publications/rr/natural-fi x/page/3724.aspx.
CHAPTER 2 — SOIL ORGANIC CARBON DYNAMICS AND ASSESSMENT METHODS
Source: Ruesch and Gibbs, 2008;IGBP-DIS, 2000.
5

6
CARBON SEQUESTRATION IN AGRICULTURAL SOILS
CHAPTER 2 — SOIL ORGANIC CARBON DYNAMICS AND ASSESSMENT METHODS
Soils are critically important in determining global carbon cycle dynamics because they serve as the link between the atmosphere, vegetation, and oceans. Globally, the soil car-bon pool (also referred to as the pedologic pool) is estimated at 2,500 Gt up to 2 meters deep. Out of this, the soil organic carbon pool comprises 1,550 Gt, while the soil inorganic carbon and elemental pools make up the remaining 950 Gt (Batjes 1996). The soil carbon pool is more than three times the size of the atmospheric pool (760 Gt) and about 4.5 times the size of the biotic pool (560 Gt).
The elemental and inorganic forms of soil carbon primarily result from mineral weathering and are less responsive to land management than soil organic carbon (table 2.3). Soil organic carbon is a complex mixture of organic compounds composed of decomposing plant tissue, microbial organ-isms, and carbon bound to soil minerals. These compounds originate from the photosynthetic activities of plants.
Through photosynthesis, plants reduce carbon from its oxi-dized form to organic forms (net primary productivity; NPP) useful for growth and energy storage. Over time, the C fi xed in the atmosphere becomes soil carbon through the process of above- and below-ground decomposition of materials, release of sap exudates from plant roots into the soil, and root die-off. Breeding crop plants with deeper and bushy root ecosystems could simultaneously sequester more carbon, improve soil structure, improve water and nutrient retention, and increase crop yields (Kell 2011).
Different fractions or soil organic carbon pools have different functions within the soil system. Crop residues are readily broken down and serve as substrates to soil microorgan-isms. Particulate organic carbon is broken down relatively quickly but more slowly than other crop residues and is important for soil structure, energy for biological processes, and provision of nutrients for plants. A more stable fraction,
TABLE 2.1: Carbon Stocks in Vegetation and Top 1 Meter of Soils of World Biomes
BIOMESAREA
(MILLION km2)
CARBON STOCKS (Gt C) AND PROPORTION IN THE ECOSYSTEM (%)
VEGETATION PROPORTION (%) SOILS PROPORTION (%) TOTAL
Tropical forests 17.6 212 49.5 216 50.5 428
Temperate forests 10.4 59 37.1 100 62.9 159
Boreal forests 13.7 88 15.7 471 84.3 559
Tropical savannas 22.5 66 20.0 264 80.0 330
Temperate grasslands 12.5 9 3.0 295 97.0 304
Deserts 45.5 8 4.0 191 96.0 199
Tundra 9.5 6 4.7 121 95.3 127
Wetlands 3.5 15 6.3 225 93.8 240
Croplands 16 3 2.3 128 97.7 131
Total 151.2 466 2,011 2,477
Proportion (%) 19 81 100
Source: Based on Watson et al. (2000) and Ravindranath and Ostwald (2008).
TABLE 2.2: Global Carbon Budget (Gt C)
SOURCE 1980s 1990s 2000–2008
Atmospheric increase 3.3 ± 0.1 3.2 ± 0.1 4.1 ± 0.1
Fossil fuel emissions 5.4 ± 0.3 6.4 ± 0.4 7.2 ± 0.3
Net ocean-to-atmosphere fl ux −1.8 ± 0.8 −2.2 ± 0.4 −2.3 ± 0.5
Net land-to-atmosphere fl ux −0.3 ± 0.9 −1.0 ± 0.6 −1.3 ± 0.7
Partitioned as:
Land-use change fl ux 1.4 ± 1.0 1.6 ± 0.7 1.4 ± 0.7
Residual land sink −1.7 ± 1.7 −2.6 ± 0.9 −2.7 ± 1.0
Sources: IPCC (2007) and the Global Carbon Project (2009).

7
ECONOMIC AND SECTOR WORK
CHAPTER 2 — SOIL ORGANIC CARBON DYNAMICS AND ASSESSMENT METHODS
humus, can be classifi ed into two depending on the level of decomposability: The fi rst is active humus that is still subject to further decomposition, and the other is passive humus (or recalcitrant carbon), the highly stable, insoluble form that is not subject to further decomposition. Active humus is an excellent source of plant nutrients (nitrates and phosphates), while passive humus is important for soil physical structure, water retention, and tilth. Some very
stable humus complexes can remain in the soil for centuries or millennia.
At the global level, the soil organic carbon pool is concen-trated in fi ve major soil orders: histosols, inceptisols, enti-sols, alfi sols, and oxisols. In the tropics, the largest amount of soil organic carbon is found in oxisols, histosols, ultisols, and inceptisols (fi gure 2.2, table 2.4, and box 2.1).
TABLE 2.3: Forms of Carbon in the Soil
FORMS SOURCES
Elemental Geologic materials (e.g., graphite and coal)Incomplete combustion of organic materials (e.g., charcoal, graphite, and soot)Dispersion of these carbon forms during mining
Inorganic Geologic or soil parent materials, usually as carbonates—that is, calcite, CaCO3 dolomite, CaMg(CO3)2 and, to some extent, siderite (Fe CO3)Agricultural inputs such as liming can also introduce calcite and dolomite into the soil.
Organic Plant and animal materials at various stages of decomposition ranging from crop residues with size of 2 mm or morePlant debris, also referred to as particulate organic carbon, with size between 0.05 and 2 mm humus, highly decomposed materials less than 0.05 mm that are dominated by molecules attached to soil minerals
Source: Synthesized from Schumacher (2002).
FIGURE 2.2: Global Soil Regions
Robinson projectionscale 1:130,000,000
Soil orders
Alfisols
Andisols
Aridisols
Entisols Inceptisols Spodosols Rocky land
Shifting sand
Ice/glacier
Ultisols
Vertisols
Mollisols
Oxisols
Gelisols
Histosols
Source: United States Department of Agriculture.

8
CARBON SEQUESTRATION IN AGRICULTURAL SOILS
CHAPTER 2 — SOIL ORGANIC CARBON DYNAMICS AND ASSESSMENT METHODS
TABLE 2.4: Soil Carbon Pool up to 1-M Deep for Soil Orders of the World’s Ice-Free Land Surface
SOIL ORDER
GLOBAL LAND AREA TROPICAL LAND AREA
EXTENT (1000 km2)
PROPORTION (%)
SOIL ORGANIC CARBON POOL (Gt)
PROPORTION (%)
EXTENT (1000 km2)
PROPORTION (%)
SOIL ORGANIC CARBON POOL (Gt)
PROPORTION (%)
Alfi sols 18,283 13.5 127 8.1 6,411 12.9 30 5.9
Andisols 2,552 1.9 78 4.9 1,683 3.4 47 9.3
Aridisols 31,743 23.5 110 7 9,117 18.4 29 5.7
Entisols 14,921 11 148 9.4 3,256 6.6 19 3.8
Histosols 1,745 1.3 357 22.7 286 0.6 100 19.8
Inceptisols 21,580 16 352 22.3 4,565 9.2 60 11.9
Mollisols 5,480 4.1 72 4.6 234 0.5 2 0.4
Oxisols 11,772 8.7 119 7.6 11,512 23.2 119 23.5
Spodosols 4,878 3.6 71 4.5 40 0.1 2 0.4
Ultisols 11,330 8.4 105 6.7 9,018 18.2 85 16.8
Vertisols 3,287 2.4 19 1.2 2,189 4.4 11 2.2
Others 7,644 5.7 18 1.1 1,358 2.7 2 0.4
Total 135,215 100 1,576 100 49,669 100 506 100
Source: Eswaran et al. (1993).
The soil organic carbon pool represents a dynamic balance between gains and losses. The amount changes over time depending on photosynthetic C added and the rate of its de-cay. Under undisturbed natural conditions, inputs of carbon from litter fall and root biomass are cycled by output through erosion, organic matter decomposition, and leaching.
The potential carbon sequestration is controlled primarily by pedological factors that set the physico-chemical maximum limit to storage of carbon in the soil. Such factors include soil texture and clay mineralogy, depth, bulk density, aera-tion, and proportion of coarse fragments (fi gure 2.3). The attainable carbon sequestration is set by factors that limit the input of carbon to the soil system. NPP—the rate of photosynthesis minus autotrophic respiration—is the major factor infl uencing attainable sequestration and is modifi ed by above-ground versus below-ground allocation. Land manage-ment practices that increase carbon input through increas-ing NPP tend to increase the attainable level to nearer the potential level. Climate has both direct and indirect effects on attainable sequestration. The decomposition rate increases with temperature but decreases with increasingly anaerobic conditions. The actual carbon sequestration is determined by land management factors that reduce carbon storage such as
erosion, tillage, residue removal, and drainage. Theoretically, the potential soil carbon sequestration capacity is equivalent to the cumulative historical carbon loss. However, only 50 to 66 percent of this capacity is attainable through the adop-tion of sustainable land management practices (Lal 2004; box 2.2).
The current rate of carbon loss due to land-use change (defor-estation) and related land change processes (erosion, tillage operations, biomass burning, excessive fertilizers, residue removal, and drainage of peat lands) is between 0.7 and 2.1 Gt carbon per year (table 2.2). This is more than 50 percent of the carbon absorbed by land. The conversion of natural vegetation to agricultural ecosystems leads to a depletion of the soil organic carbon pool by as much as 60 percent in the temperate regions and by 75 percent or more in the tropics (box 2.1). The degree of loss is higher in soils that are susceptible to accelerated erosion and other soil degradation processes. Soil erosion is the major land degradation process that emits soil carbon. The annual soil losses in Africa, South America, and Asia are estimated at 39 to 74 Gt, correspond-ing to carbon emissions of 0.16 to 0.44 Gt per year (table 2.5). Globally, soil erosion accounts for up to 1.2 Gt of C emitted to the atmosphere each year. This is more than 57 percent

9
ECONOMIC AND SECTOR WORK
CHAPTER 2 — SOIL ORGANIC CARBON DYNAMICS AND ASSESSMENT METHODS
Alfi sols: Formed primarily under forest or mixed vegeta-tive cover, alfi sols result from weathering processes that leach clay minerals from the surface to the subhorizon.
Andisols: Common in cool areas with moderate to high precipitations, andisols result from weathering process-es that generate minerals with little orderly crystalline structure (volcanic glass) and usually have high nutrient- and water-holding capacity.
Aridisols: Formed under arid climates, the lack of mois-ture markedly restricts the intensity of weathering and development of aridisols. The paucity of vegetation also leads to low organic matter content.
Entisols: Occurring in areas of recently deposited parent materials or areas where erosion or deposition rates ex-ceed the rate of soil development, entisols are charac-terized with little or no horizon development. They occur in many environments such as on steep slopes, fl ood plains, or sand dunes.
Gelisols: Found mostly in very cold areas under the infl u-ence of glaciation, gelisols are characterized by perma-frost within 2 m of the soil surface. High amounts of soil organic matter accumulate in the upper layer, mak-ing most gelisols black or dark brown in color. Gelisols are not highly fertile because nutrients are very easily leached above the permafrost.
Histosols: Formed in decomposed organic materials that accumulate faster than they decay, histosols have a high content of organic matter and no perma-frost. Most histosols are saturated all the year round. They are commonly called peats, bogs, mucks, or moors.
Inceptisols: Exhibiting modest soil weathering and horizon development, inceptisols are formed on recent geomor-phic surfaces in semi-arid to humid environments. Included in this category are partially developed soils of the Sahel re-gion of West Africa, some soils of the riverine fl oodplains of the Ganges and Brahmaputra Rivers in Bangladesh and India, and the fl oodplains of Southeast Asia.
Mollisols: Formed under moderate to pronounced sea-sonal moisture defi cits, mollisols are grassland soils with dark-colored surface horizons, relatively high or-ganic matter, and high base saturation.
Oxisols: Dominated by low activity minerals, oxisols are highly weathered soils of tropical and subtropical re-gions. They are found on stable landscapes, have low natural fertility, and low capacity to retain fertilizer and soil amendments.
Spodosols: Commonly occurring in areas of coarse-tex-tured deposits of humid regions, spodosols have devel-oped from weathering processes that strip organic matter and iron and aluminum oxides from the surface to the sub-soil. Spodosols tend to be acidic and are inherently infertile.
Ultisols: Formed from fairly intense weathering and leaching that results in clay accumulation at the subsoil, ultisols are typically acidic with most nutrients concen-trated in the topsoil. They have moderately low capacity to retain fertilizer and soil amendments.
Vertisols: Dominated by high content of swelling and shrinking clay minerals, vertisols typically form from highly basic rocks in climates that are seasonally humid or subject to erratic fl oods, droughts, or impeded drainage. Vertisols tend to be high in natural fertility, but they are diffi cult to till.
Source: Modifi ed from United States Department of Agriculture.
BOX 2.1: Brief Description of Soil Orders
of the emission through land-use change and underscores the need for carbon conservation through zero tolerance for soil erosion.
Each year, the terrestrial carbon pool assimilates 120 Gt C from the atmosphere in the form of gross primary productiv-ity (or photosynthesis). Soil respiration, the fl ux of microbially and plant-respired carbon dioxide (CO2) from the soil surface
to the atmosphere, estimated at 75 to 100 Gt C per year is the next largest terrestrial carbon fl ux (Raich and Potter 1995). It is about 60 times the annual contribution of land-use change and about 11 times that of fossil fuel to atmospheric emissions. Thus, a small change in soil respiration can sig-nifi cantly alter the balance of atmospheric carbon dioxide concentration compared to soil carbon stores. Soil respira-tion is regulated by several factors including temperature,

10
CARBON SEQUESTRATION IN AGRICULTURAL SOILS
CHAPTER 2 — SOIL ORGANIC CARBON DYNAMICS AND ASSESSMENT METHODS
FIGURE 2.3: Factors Affecting Soil Carbon Sequestration
Potential
Attainable
Actual
SOC-increasingmeasures
SOC-protectingmeasures
SOC level (t1/2 ≥ 10 years) ton ha–1
carb
on s
eque
stra
tion
situ
atio
n– Mineralogy/content– Depth– Stoniness– Bulk density– Aeration
– NPP and allocation– Climate (direct)– Climate (via NPP)
– Erosion– Tillage– Residue removal– Disrupted biology– Drainage
Reducing factors:
Defining factors:
Limiting factors:
Source: Redrawn from Ingram and Fernandes (2001).
TABLE 2.5: Estimate of Erosion-Induced Carbon Emission
CONTINENTGROSS EROSION (X 109 Mg/YEAR)
SOIL CARBON DISPLACED BY EROSION (2 TO 3 PERCENT OF SEDIMENT; Gt C/YEAR)
EMISSION (20 PERCENT OF DISPLACED SOIL CARBON; Gt C/YEAR)
Africa 38.9 0.8–1.2 0.16–0.24
Asia 74.0 1.5–2.2 0.30–0.44
South America 39.4 0.8–1.2 0.16–0.24
North America 28.1 0.6–0.8 0.12–0.16
Europe 13.1 0.2–0.4 0.04–0.08
Oceania 7.6 0.1–0.2 0.02–0.04
Total 201.1 4.0–6.0 0.8–1.2
Source: Adapted from Lal (2003).
moisture, vegetation type, nitrogen content, and level of aeration of the soil.
Climate change is positively correlated with increasing rate of soil respiration. Higher temperatures trigger microbes
to speed up their consumption of plant residues and other organic matter. Variations in temperature are signifi cantly and positively correlated with changes in global soil res-piration (Bond-Lamberty and Thompson 2010). In 2008, the global soil respiration reached roughly 98 Gt, about 10

11
ECONOMIC AND SECTOR WORK
CHAPTER 2 — SOIL ORGANIC CARBON DYNAMICS AND ASSESSMENT METHODS
Research in the tropics has demonstrated the decline of soil organic carbon by as much as 60 percent after conversion of forest to cropland. However, sustainable land management practices can accumulate soil organ-ic carbon, reverse chronic soil degradation, improve soil quality, and enhance ecosystem services supply from the soil. Some soil scientists have recently used legacy soil survey data to capture the long-term trend of soil or-ganic carbon in Java in Indonesia (Minasny et al. 2010). With an estimated population density of 1,026 persons km−2, Java is undoubtedly the most densely populated and the most intensively cultivated island in Indonesia. An analysis over the period from 1930 to 2010 revealed that human activities are more important than environ-mental factors in explaining soil organic carbon trend. The median soil organic carbon stock in the topsoil dropped from 20.4 t ha−1 between 1930 and 1940 to 7.3 t ha−1 between 1960 and 1970 (see fi gure below). This huge drop was mostly due to the high conversion of for-ests and natural vegetation into plantations and subse-quently to food crops. During the Dutch colonial period, most land development was for plantations such as tea, rubber, and coffee. Between 1930 and 1950, decline in soil carbon stock was primarily due to conversion of
forests to cropland. From the Japanese occupation in 1942, throughout its independence years, and until the early 1960s, Indonesia faced a serious problem of food scarcity. The Green Revolution of the 1960s saw Java producing close to two-thirds of the country’s rice. As a result, between 1960 and 1970, soil organic carbon markedly declined by 62 percent of its natural condition.
Since the late 1960s, soil organic C has increased slightly as a result of the government extension program to disseminate new agricultural production knowledge among farmers, including the use of high-yielding varieties and chemical inputs. The increased biomass and the return of crop residues, green com-post, and animal manure application were mostly responsible for the increase in soil organic carbon stock. By the 1990s, soil organic carbon stock had risen to about 11 t ha−1 as there was also a large inter-est in organic farming in Java. Further intensifi cation has resulted in improved environmental awareness, increased likelihood of adoption of sustainable land management practices, increased soil carbon se-questration, and increased resilience of the agricul-tural system.
25
20
15
10
t ha
–1
5
01930–1940 1940–1950 1950–1960 1960–1970 1970–1980 1980–1990 1990–2000 2000–2010
BOX 2.2: Sustainable Land Management Practices Reverse Soil Carbon Loss in Java
Source: Minasny, B., Sulaeman, Y., and McBrateney A.B. 2010. Is soil carbon disappearing? The dynamics of soil organic carbon in Java. Global Change Biology 17:1917–1924.

12
CARBON SEQUESTRATION IN AGRICULTURAL SOILS
CHAPTER 2 — SOIL ORGANIC CARBON DYNAMICS AND ASSESSMENT METHODS
times more carbon than humans release into the atmo-sphere each year. Soil respiration increased 0.1 Gt C per year between 1989 and 2008. A rise in temperature by 2°C is estimated to release an additional 10 Gt C per year to the atmosphere through soil respiration (Friedlingstein et al. 2003).
Tillage operations can signifi cantly affect soil respiration. Conventional tillage leads to the destruction of soil aggre-gates, excessive respiration, and soil organic matter decom-position, leading to reduced crop production and decreased resilience of the soil ecosystem. Excessive application of large amounts of nitrogenous fertilizer can markedly in-crease root biomass and stimulate soil respiration rates. When other factors are at optimum, conservation tillage, use of cover crops (green manure), crop rotations, use of deep-rooted crops, application of manure, and water man-agement can optimize soil respiration in addition to improv-ing soil carbon.
2.2 CARBON ASSESSMENT FOR LAND MANAGEMENT PROJECTS
Carbon assessment entails the estimation of stocks and fl uxes of carbon from different land-use systems in a given area over a period of time. The assessment covers four bio-mass pools—above ground, below ground, dead wood, and litter—and the soil organic carbon pool. The assessment can be undertaken either at national or project level.
Signatory parties of the UN Framework Convention on Climate Change (UNFCCC) are required to prepare national GHG inventories on a periodic basis and report them to the body. Annex I or industrialized countries are required to estimate and report emissions and removals annually, while non-Annex I or developing countries only need to report every 3 to 5 years. The key steps involved are as follows:
1. Estimating the area under a given land-use category in a given year and the area under each category subjected to land-use change
2. Estimating the stocks of carbon in each pool at the beginning and end of the period to calculate net emissions or removal (stock difference approach)
3. Estimating the gain in carbon stock for each pool due to accumulation or losses and calculating the differ-ence between gains and losses as net emissions or removal (a gain-loss approach).
Typically, different countries adapt the Intergovernmental Panel on Climate Change (IPCC) guideline for national GHG by using sampling methods, measurement techniques, and models tailored to their particular circumstances.
Carbon assessment for land management projects can be either purposely for climate mitigation or for nonclimate mitigation. Mitigation projects involve estimation of verifi -able changes in carbon stocks over a given period in the de-fi ned project area and require methods for estimating car-bon stocks and changes for the baseline scenario (without the project) and the project. Carbon assessment for land management projects not principally designed for climate change mitigation is carried out for a number of reasons:
The need to assess the carbon footprint of the opera-tional work of funding agencies (see section 2.4).
Changes in soil carbon over the lifetime of a project are an indicator of the success of SLM intervention.
Changes in soil carbon stocks can help track changes in regulating, supporting, and provisioning ecosystem services.
Interest in benefi ting from carbon fi nance, though this is hardly a prime objective.
The key differences for carbon assessment for the two types of projects are summarized in table 2.6.
2.3 TECHNIQUES OF SOIL CARBON ASSESSMENT
Methods to assess above-ground biomass are more ad-vanced than for soil carbon. The three major methods for above-ground carbon assessment include the following (Gibbs et al. 2007):
1. Biome averages involving the estimation of average forest carbon stocks for broad forest categories based on a variety of input data sources,
2. Forest inventory that relates tree diameters or volume to forest carbon stocks using allometric relationships, and
3. Use of optical, radar, or laser remote-sensing data integrated with allometry and ground measurements.
Soil carbon assessment in different parts of the world re-quires methods that are appropriate to the circumstances. Many different methods have been tested in a number of countries, but effort is required to ensure that the methods are comparable. Furthermore, for carbon projects, credible

13
ECONOMIC AND SECTOR WORK
CHAPTER 2 — SOIL ORGANIC CARBON DYNAMICS AND ASSESSMENT METHODS
and cost-effective techniques of monitoring changes in soil carbon are required.
Soil carbon assessment methods can be broadly classifi ed into direct and indirect methods depending on whether car-bon content in soil samples is directly measured or inferred through a proxy variable (table 2.7). Most assessments typi-cally involve a combination of these techniques. Each of the methods depicted in table 2.7 has unique constraints related to costs, inadequacies, geographic scope, and sampling de-sign requirements and associated levels of bias or uncertainty. The most established type of direct soil carbon assessment entails collecting soil samples in the fi eld and analyzing them in the laboratory by combustion techniques. Field sampling is technically challenging, but it can be addressed with appropri-ate design that accounts for soil spatial variation. The degree and nature of sampling depend on the carbon assessment objective, whether for national or regional accounting or for carbon offset project. Each context will require a differing degree of granularity and measurement set to assess un-certainty in the estimates. The direct method, though more precise and accurate, is quite laborious and very expensive.
In Finland, Makipaa et al. (2008) observed that organic layer carbon measurements cost 520 per plot if 10 samples are analyzed. The precision obtained with such sampling cor-responds to detection of soil carbon change greater than 860 g C m−2. At the national level, two measurements for a minimum of 3,000 plots are needed to detect an expected change of 11 g C m−2 yr−1 in the organic layer of upland forest soils at 10-year sampling intervals. One round of measure-ment was estimated to cost about 4 million, corresponding to 8 percent of the value of the annual sequestration of about 3 million tCO2 of Finland’s upland forest soils. Strategies to reduce the cost of soil carbon monitoring include lengthening the sampling interval, increasing the effi ciency of sampling through stratifi cation, pooled sampling, use of in situ analyti-cal methods, and the use of biogeochemical models.
Several in situ soil carbon analytical methods are being de-veloped with the objective of offering increased accuracy, precision, and cost-effectiveness over conventional ex situ methods. A comparison of these techniques is provided in table 2.8. Most of the in situ techniques are still in their in-fancy. The exception is infrared spectroscopy currently being
TABLE 2.6: Comparison of Carbon Assessment for Carbon Mitigation and Non-Carbon-Mitigation Projects
PROJECT PHASE CARBON MITIGATION PROJECTS
NONCARBON-MITIGATION PROJECTS (SUSTAINABLE LAND MANAGEMENT INCLUDING FOREST, GRASSLAND, CROPLAND MANAGEMENT)
Conceptualization Primary focus: carbon mitigation and carbon credits—global environmental benefi t
Secondary focus: soil and biodiversity conservation
Primary focus: forest and biodiversity conservation, watershed protection, and livelihoods enhancement
Cobenefi ts: carbon mitigation is implicit though often not men-tioned in proposal
Proposal development Clear historical records of the past vegetation and soil carbon status are required
Project boundarya impacted by project activities needs clear defi nition
Estimation of baseline carbon stocks is crucial as well as rigorous plan for monitoring carbon stock changes
Historical vegetation status not so critical to project eligibility
Project boundary needed for estimating environmental and socioeconomic benefi ts restricted to project area
Baseline economic benefi ts, soil fertility, and biodiversity need to be clearly identifi ed. Also, well-defi ned plan is required for monitoring of local environmental and socioeconomic impacts
Project review and appraisal Baseline and project scenario carbon monitoring methods are critical
Monitoring plan for local environmental and socioeconomic benefi ts is important
Implementation Activities aimed at maximizing carbon benefi ts, followed by other cobenefi ts
Activities are aimed at maximizing biomass production, crop yields, biodiversity conservation, and livelihood improvement
Monitoring and evaluation Approved methodologiesb are crucial. Additionality must be demonstrated
All the relevant carbon pools must be considered
Large transaction cost likely for carbon inventory and monitoring
Project-specifi c methodology is used
Additionality of local environmental and socioeconomic benefi ts are critical
Soil carbon critical for land development projects due to effects on agricultural sustainability
Moderate transaction cost for monitoring
Source: Modifi ed from Ravindranath and Ostwald (2008).a Project boundary refers to the physical boundary of the land area delineated either with a geographical information system or a global positioning system and the greenhouse gas boundary that includes all fl uxes of all gases affected by project activity.
b Carbon assessment methodologies are the blueprints to design, verify, and operate carbon projects. They document the protocol for quantifying carbon emissions and removals and include guidelines for identifying baseline scenario and assessing additionality in all carbon pools relevant to the project.

14
CARBON SEQUESTRATION IN AGRICULTURAL SOILS
CHAPTER 2 — SOIL ORGANIC CARBON DYNAMICS AND ASSESSMENT METHODS
TABLE 2.7: Direct and Indirect Methods of Soil Carbon Assessment
DIRECT METHODS INDIRECT METHODS
1. Field sampling and laboratory measurements using dry combustion or wet combustion
Accounting techniques Stratifi ed accounting with database Remote sensing to infer factors determining above-ground carbon inputs
2. Eddy covariance; fl ux tower measurements Biogeochemical/ecosystem simulation modeling to understand below-ground biological processes, for example,
RothC Century DNDC PROCOMAP CO2FIX
3. Emerging technologies for in situ determination Laser-Induced Breakdown Spectroscopy Inelastic Neutron Scattering (still being assessed for improved reli-ability for measurement) Near-infrared and mid-infrared spectroscopy
Source: Modifi ed from Post et al. (2001).
TABLE 2.8: Characteristics of Emerging In Situ Methods of Soil Carbon Analytical Techniques
DIRECT METHOD PROCESS
TYPE OF RADIATION MEASURED
PENETRATION DEPTH (CM)
SAMPLED VOLUME
(CM3) ADVANTAGES DISADVANTAGES
Mid-infrared spectroscopy
Molecular/diffuse refl ectance
Infrared 1 10 In situ–based measurement of carbon. Better than near infrared in distinguishing soil organic from inorganic carbon.
Costs are prohibitive on per project basis
Near-infrared spectroscopy
Molecular/diffuse refl ectance
Near infrared 0.2 1 Rapid, low cost, in situ method
Less accurate than mid-infrared in pre-dicting soil organic carbon
Laser-induced break-down spectroscopy
Atomic/plasma-inducedemission
Visible 0.1 0.1 Very fast—provides total soil carbon measurements in seconds; capable of spectrally resolving several elements apart from carbon
Interference with iron compounds around 248 nm wavelength; currently, the technology cannot directly distinguish soil inorganic from organic carbon
Inelastic neutron scattering
Nuclear/neutron-induced nuclear reactions
Gamma rays 30 100,000 Large footprint of about 2 m2 and sampling depth
The technology is still at its infancy and needs to be calibrated for wide variety of soil types, and scanner must be adapted to capture large areas
Source: Adapted from Chatterjee and Lal (2009).

15
ECONOMIC AND SECTOR WORK
CHAPTER 2 — SOIL ORGANIC CARBON DYNAMICS AND ASSESSMENT METHODS
used to develop a spectral library for soils of the world.3 The spectral library provides a valuable resource for rapid char-acterization of soil properties for soil quality monitoring and other agricultural applications.
Indirect estimation of soil organic carbon changes over large areas using simulation models is increasingly important to fi ll knowledge gaps about the biogeochemical processes of soil carbon sequestration. Simulation models describe changes in soil organic carbon under varying climate, soil, and management conditions. Though the models could have limited accuracy, they are particularly useful in the context of developing countries where land resources data are scarce. Models provide a cost-effective means of estimating GHG emissions in space and time under a wide range of biophysi-cal and agricultural management conditions, and they are particularly useful for up-scaling site-specifi c information to the regional level. Table 2.9 compares the features of some of the biogeochemical models commonly used for soil car-bon assessment.
Monitoring and verifying soil carbon sequestration at the project or regional scale require fi ve components (Post et al. 1999). These include the selection of landscape units suit-able for monitoring soil carbon changes, development of measurement protocols, application of remote sensing to estimate soil organic carbon controlling parameters, spatially explicit biogeochemical modeling, and scaling-up the results to the entire project area (table 2.9).
Monitoring the trends in soil carbon over a large geographi-cal area through repeated sampling is mainly restricted to developed and few developing countries. Examples of national carbon accounting system and tools are presented in table 2.11.
Progress is being made in developing and testing cost-effec-tive soil carbon monitoring methods. The Global Environment Facility (GEF) in collaboration with other partners is currently implementing the Carbon Benefi ts Project (CBP) to develop standardized, cost-effective methods of quantifying the carbon benefi ts of sustainable land management projects.4
3 World Agroforestry Centre, ISRIC-World Soil Information: A glob-ally distributed soil spectral library: visible near-infrared diffuse refl ectance spectra, http://www.africasoils.net/sites/default/fi les/ICRAF-ISRICSoilVNIRSpectralLibrary.pdf.
TABLE 2.9: Comparative Features of Some Carbon Estimation Models
MODEL FEATURES KEY INPUTS KEY OUTPUTS
CENTURY Simulates long-term dynamics of carbon, nitrogen, phosphorus, and sulfur for different ecosystems
Monthly mean maximum and minimum air temperature and total precipitation; plant N, P, and S content; soil texture; atmospheric and soil nitrogen inputs; and initial soil carbon, nitrogen, phosphorus, and sulfur levels
Total carbon, soil water dynamics, commercial crop yield, total dry matter, and carbon in plant residue
CO2FIX Simulates carbon dynamics of single/multiple species, forests, and agroforestry systems
Simulation length, maximum biomass in stand, carbon content, wood density, initial carbon, yield tables, precipitation, temperature, and length of growing period
Carbon stocks and fl uxes, total biomass and soil carbon, above- and below-ground biomass, deadwood, and litter and soil organic carbon production
RothC Estimation of turnover of organic carbon in topsoil
Clay, monthly rainfall, monthly open pan evapo-ration, average monthly mean air temperature, and an estimate of the organic input
Total organic carbon content and carbon content in microbial biomass
PROCOMAP Equilibrium model for estimating carbon stocks Activity data, planting rate, vegetation carbon stocks, rotation period, and mean annual incre-ment in biomass and soil
Biomass and soil carbon stock, incremental carbon stocks, and cost-effectiveness indicators
DNDC DeNitrifi cation-DeComposition is used for predicting crop growth, soil temperature and moisture regimes, carbon sequestration, nitrogen leaching, and emissions of nitrous oxide (N2O), nitric oxide (NO), dinitrogen (N2), ammonia (NH3), methane (CH4), and carbon dioxide (CO2)
Plant growth data, soil clay, bulk density, pH, air temperature, rainfall, atmospheric nitrogen decomposition rate, crop rotation timing and type, inorganic fertilizer timing, amount and type, irrigation timing and amount, residue incorporation timing and amount, and tillage timing and type
Total carbon, total nitrogen, soil water dynam-ics, biomass carbon, carbon dioxide, crop yield, carbon input into soil, fl uxes of gases including N2O, nitric oxide NO, NH3, and methane CH4
Source: This study.
4 http://www.unep.org/climatechange/carbon-benefi ts/

16
CARBON SEQUESTRATION IN AGRICULTURAL SOILS
CHAPTER 2 — SOIL ORGANIC CARBON DYNAMICS AND ASSESSMENT METHODS
TABLE 2.10: Components of Soil Carbon Monitoring at the Regional Scale
COMPONENTS DESCRIPTION
Selection of landscape units The selection will depend on responsiveness of the area to land management practices as determined by climate, soil properties, management history, and availability of historical data. Participation of local agronomists, farmer organizations, and other stakeholders can be of help in selecting pilot areas and the extent to which the results can be extrapolated over the region.
Development of protocol Changes in soil carbon can generally be estimated as changes in stocks (from direct measurement) or fl uxes (using eddy covariance methods) (see table 2.7). Protocols for temporally repeated measurements at fi xed locations will generally include stratifi cation and selection of sampling sites, sampling depth and volume, measurement of bulk density, laboratory analyses, other ancillary fi eld measurements, and estimation of the marginal cost of carbon sequestration.
Application of remote sensing Remote sensing can provide information on net primary productivity, leaf area index, tillage practices, crop yields, and location and amount of crop residue for input into models. Recently, cellulose absorption index derived from remote imaging spectroscopy has been used to infer tillage intensity and residue quantity (Serbin et al. 2009)
Biogeochemical modeling Models are used to determine soil carbon changes over large areas because satellites cannot sense below-ground biological processes. Models are useful for understanding soil properties–land management interactions and for predicting soil carbon sequestration. They can simulate full ecosystem–level carbon balance, multiple land uses, or several land management practices
Up-scaling Scaling-up to large areas requires integration from a variety of sources including fi eld measurements, existing database, models, geographical information system, and remote sensing. Multitemporal moderate resolution remote sensing such as Landsat Thematic Mapper and Moderate Resolution Imaging Spectroradiometer can provide information such as land-use and land cover change, crop rotations, and soil moisture that can markedly improve up-scaling of soil carbon assessment.
Source: Synthesized from Post et al. 1999.
TABLE 2.11: Carbon Accounting Systems and Tools
NAME DESCRIPTION AND INTERNET LOCATION
Australia’s National Carbon Accounting System (NCAS)
NCAS estimates emissions through a system that combines satellite images to monitor land use and land-use change across Australia that are updated annually; monthly maps of climate information, such as rainfall, temperature, and humidity; maps of soil type and soil carbon; databases containing information on plant species, land management, and changes in land manage-ment over time; and ecosystem modeling—the Full Carbon Accounting Model. http://www.climatechange.gov.au/government/initiatives/national-carbon-accounting.aspx
National Forest Carbon Monitoring, Accounting and Reporting System, Canada (NFCMARS)
NFCMARS is designed to estimate past changes in forest carbon stocks and to predict, based on scenarios of future distur-bance rates and management actions, changes in carbon stocks in the next two to three decades. http://carbon.cfs.nrcan.gc.ca/index_e.html
Agriculture and Land Use National Greenhouse Gas Inventory Software (Colorado State University, United States)
The program supports countries’ efforts to understand current emission trends and the infl uence of land-use and management alternatives on future emissions. It can be used to estimate emissions and removals associated with biomass C stocks, soil C stocks, soil nitrous oxide emissions, rice methane emissions, enteric methane emissions, manure methane, and nitrous oxide emissions, as well as non-CO2 GHG emissions from biomass burning. The software accommodates Tier 1 and 2 methods as de-fi ned by the Intercontinental Panel on Climate Change. It allows compilers to integrate global information system spatial data along with national statistics on agriculture and forestry and is designed to produce a consistent and complete representation of land use for inventory assessment. http://www.nrel.colostate.edu/projects/ghgtool/software.php
National Carbon Accounting System of Indonesia
Provides monitoring capabilities for greenhouse gas (GHG) emissions/sinks to establish a credible reference emission level. The three major activities linked are the remote sensing program, the modeling and measurement program for GHG accounting and reporting, and the data program. http://www.dpi.inpe.br/geoforest/pdf/group2/04%20-%20National%20carbon%20accounting%20system%20of%20Indonesia.pdf
New Zealand’s Carbon Accounting System
The National Carbon Accounting System for New Zealand’s indigenous forest, shrub land, and soils was developed for the Ministry of the Environment by Landcare Research and Scion. It monitors forest defi nition, land-use change, forest inventory and modeling, and reporting methods. http://www.joanneum.at/carboinvent/workshop/1000_Peter_Stephens_ver_fi nal.pdf
Forest Vegetation Simulator, United States
The Forest Vegetation Simulator (FVS) is a family of forest growth simulation models. The basic FVS model structure has been calibrated to unique geographic areas to produce individual FVS variants. Since its initial development in 1973, it has become a system of highly integrated analytical tools. http://www.fs.fed.us/fmsc/fvs/description/index.shtml
Source: This study.
The new suite of tools estimate and model carbon and other GHG fl ows under present and alternative management and measures. They also monitor changes in carbon under speci-fi ed land use and management. The CBP comprises a na-tional GHG inventory tool; the Agriculture and Land Use Tool (table 2.11), Voluntary Reporting of Greenhouse Gases-Carbon
Management Evaluation Tool (http://www.cometvr.colostate.edu/), and the GEF Soil Organic Carbon System that approximates national- and subnational-scale soil carbon stock variations in developing countries using RothC and Century models (table 2.9).

17
ECONOMIC AND SECTOR WORK
CHAPTER 2 — SOIL ORGANIC CARBON DYNAMICS AND ASSESSMENT METHODS
2.4 CARBON ASSESSMENT IN THE WORLD BANK’S SUSTAINABLE LAND MANAGEMENT PORTFOLIO
Carbon Assessment Using the Ex Ante Appraisal
Carbon-Balance Tool
The World Bank is increasingly looking to assess the carbon footprint of its operational work across sectors. Emphasis is placed on cost-effective approaches that do not add exces-sively to the burden of project management. The Ex-Ante Appraisal Carbon-Balance Tool (EX-ACT; http://www.fao.org/tc/exact/en/) has been developed with this objective in mind.
EX-ACT can provide ex ante assessments of the impact of agriculture and related forestry, fi sheries, livestock, and water development projects on GHG emissions and carbon seques-tration, thereby indicating the overall effects on the carbon balance. EX-ACT was developed following the IPCC guideline for national GHG inventory (IPCC 2006), supplemented by other existing methodologies and reviews of default coeffi -cients. It is easy to use in the context of program formulation; it is cost-effective and requires a minimum amount of data. It also has resources (linked tables and maps) that can assist in gathering the information necessary to run the model. While EX-ACT primarily works at the project level, it can easily be up-scaled at the program/sector level.
Carbon assessment in EX-ACT is implemented in the follow-ing three steps:
General description of the project (geographic area, cli-mate and soil characteristics, and duration of the project)
Identifi cation of changes in land use and technologies foreseen by project components using specifi c “mod-ules” (deforestation, forest degradation, afforestation/reforestation, annual/perennial crops, rice cultivation, grasslands, livestock, inputs, organic soils, and energy)
Computation of carbon balance with or without the project using IPCC default values and, when available, ad hoc coeffi cients.
A detailed analysis of lessons learned in testing EX-ACT in World Bank agriculture projects can be found in World Bank (2012).
Sustainable Agricultural Land Management
Methodology
The BioCarbon Fund of the World Bank has recently devel-oped a carbon accounting methodology to encourage adop-tion of sustainable land management practices by small-scale
farmers in developing countries (http://www.v-c-s.org/sites/v-c-s.org/files/VM0017%20SALM%20Methodolgy%20v1.0.pdf). The methodology, referred to as Sustainable Agricultural Land Management (SALM), provides protocol for quantifying carbon emissions and removals and includes guidelines for identifying baseline scenario and assessing additionality in all carbon pools relevant to sustainable land management projects. SALM is applicable to projects that introduce sustainable land management practices into crop-lands subject to conditions such that soil organic carbon would remain constant or decrease with time in the absence of the project. The methodology currently being applied in the fi rst African soil carbon project allows small-holder farmers in Kenya to access the carbon market and receive additional carbon revenue streams through the adoption of productivity-enhancing practices and technologies.
REFERENCES
Batjes, N. H. 1996. “Total Carbon and Nitrogen in the Soils of the World.” European Journal of Soil Science 47: 151–163.
Bond-Lamberty, B., and Thomson, A. 2010. “Temperature-Associated Increases in the Global Soil Respiration Record.” Nature 464: 579–582.
Chatterjee, A., and Lal, R. 2009. “On Farm Assessment of Tillage Impact on Soil Carbon and Associated Soil Quality Parameters.” Soil Tillage Research. 104: 270–277.
Friedlingstein, P., Dufresne, J., and Cox, P. 2003. “How Positive is the Feedback Between Climate Change and the Global Carbon Cycle?” Tellus 55B: 692–700.
Eswaran, H., van den Berg, E., Reich, P. 1993. ``Organic Carbon in Soils of the World,’’ Soil Science Society of America Journal 57, 192–194.
Gibbs, H. K., Brown, S., Niles, J. O., and Foley, J. A. 2007. “Monitoring and Estimating Tropical Forest Carbon Stocks: Making REDD a Reality.” Environmental Research Letters 2: 045023.
Global Carbon Project. 2009. Policy Brief November 2009. No. 10.
Ingram, J. S. I., and Fernandes, E. C. M. 2001. “Managing Carbon Sequestration in Soils: Concepts and Terminology.” Agriculture, Ecosystems and Environment 87: 111–117.
IPCC. 1996. Guidelines for National Greenhouse Gas Inventories Vol. 1–3. Intergovernmental Panel on Climate Change, London.
IPCC. 2006. Guidelines for National Greenhouse Gas Inventories Vol. 4: Agriculture, Land Use, and Forestry. http://www.ipcc-nggip.iges.or.jp.
IPCC. 2007. Climate Change 2007: Synthesis Report—Summary for Policymakers. Fourth Assessment Report.
Kell, D.B. 2011. “Breeding Crop Plants With Deep Roots: Their Role in Sustainable Carbon, Nutrient, and Water Sequestration.” Ann. Bot. 108 (3): 407–418.

18
CARBON SEQUESTRATION IN AGRICULTURAL SOILS
CHAPTER 2 — SOIL ORGANIC CARBON DYNAMICS AND ASSESSMENT METHODS
Lal, R. 2003. “Soil Erosion and the Global Carbon Budget.” Environment International 29: 437–450.
Lal, R. 2004. “Carbon Emission From Farm Operations.” Environment International 30: 981–990.
Makipaa, R., Hakkinen, M., Muukkonen, P., et al. 2008. “The Costs of Monitoring Changes in Forest Soil Carbon Stocks.” Boreal Environmental Research 13: 120–130.
Post, W. M., Izaurralde, R. C., Mann, L. K., and Bliss, N. 1999. “Monitoring and Verifi cation of Soil Organic Carbon Sequestration.” In Proceedings of the Symposium on Carbon Sequestration in Soils Science, Monitoring and Beyond, ed. N.J. Rosenberg, R.C. Izaurralde, and E.L. Malone, Columbus, OH: Batelle Press.
Post, W. M., Izaurralde, R. C., Mann, L. K., and Bliss, N. 2001. “Monitoring and Verifying Changes of Organic Carbon in Soil.” Climatic Change 51 (1): 73–99.
Raich, J., and Potter, C. 1995. “Global Patterns of Carbon Dioxide Emissions From Soils.” Global Biogeochemical Cycles 9: 23–36.0
Ravindranath, N. H., and M. Ostwald. 2008. Carbon Inventory Methods Handbook for Greenhouse Gas Inventory, Carbon Mitigation and Roundwood Production Projects. Advances in Global Change Research. Springer-Verlag, Berlin.
U.S. Department of Agriculture, Natural Resources Conservation Service. “Global Soil Regions.” http://soils.usda.gov/use/world-soils/mapindex/orders.jpg.
Watson, Robert et al., ed. 2000. Land Use, Land-Use Change, and Forestry. Intergovernmental Panel on Climate Change. Cambridge University Press, Cambridge.
World Bank. 2012. Carbon Foot-Printing of ARD Projects: Testing the Ex-Ante Carbon Balance Appraisal Tool. World Bank, Washington, DC.

19
ECONOMIC AND SECTOR WORK
CHAPTER 3 — META-ANALYSES OF SOIL CARBON SEQUESTRATION
3.1 INTRODUCTION
A range of practices has been suggested as important to soil carbon sequestration and thus of potential relevance to increasing crop yield, increasing the resilience of agro-ecosystems, and mitigating GHG emissions (table 3.1). Mitigation of GHG in agriculture can involve several practices such as avoiding the conversion of native forests and grass-lands to croplands; enhancing removal of carbon from the atmosphere through a range of soil and water management practices including crop diversifi cation; restoration of barren, abandoned, or seriously degraded agricultural lands; and
livestock and manure management. The impacts of changes in agricultural practices on soil carbon stocks such as chang-es to crop rotation or reduced grazing are usually more subtle than those brought about by more dramatic changes in land use such as conversion of cropland to forest or grassland to tree crops.
This chapter documents the evidence from the published lit-erature on the impacts of agricultural land management prac-tices and agricultural land-use changes on soil carbon seques-tration in Africa, Asia, and Latin America. The main emphasis is on obtaining better estimates of soil carbon sequestration
Chapter 3: META-ANALYSES OF SOIL CARBON SEQUESTRATION
TABLE 3.1: Practices That Sequester Carbon in Forest, Grassland, and Cropland
FOREST GRASSLAND CROPLAND
Protection of existing forests—Avoided deforesta-tion preserves existing soil C stocks and prevents emissions associated with biomass burning and soil exposure by land clearing
Improved grassland management—Optimize stocking rates to reduce land degradation, depletion of soil organic carbon, and methane emissions through enteric fermentation
No or reduced tillage—Reduces the accelerated decomposition of organic matter associated with intensive (conventional or traditional) tillage
Reforestation—Increasing tree density in degraded forests increases carbon accumulation
Introduction of improved pasture species and legumes to increase above- and below-ground biomass produc-tion and soil organic carbon accumulation
Mulching/residue management—Improves soil mois-ture, prevents soil erosion, and increases soil organic matter when incorporated into the soil; crop residues also prevent loss of carbon from the soil system
Afforestation—Establishment of new forests on nonforest land (cropland, grassland, or degraded lands) increases carbon stock through the increase in above-ground biomass as well as greater organic materials input for soil decomposition
Application of inorganic fertilizers and manure to stimulate biomass production—Chemical fertilizers are, however, less environmentally friendly due to nitrous oxide (N2O) emissions associated with N fertil-izers, the greenhouse cost of fertilizer production, and emissions associated with transport of fertilizers
Application of inorganic fertilizers and manure to stimulate biomass production—Chemical fertilizers are, however, less environmentally friendly due to nitrous oxide (N2O) emissions associated with N fertil-izers, the greenhouse cost of fertilizer production, and emissions associated with transport of fertilizers
Water management to increase productivity, but this has to be put in the perspective of emissions associ-ated with the process of irrigation
Use of cover crops/green manure increases the biomass returned to the soil and thus increases soil carbon stock
Introduction of earthworms to improve aeration and aid organic matter decomposition in the soil profi le
Use of improved crop varieties—Improved crop varieties help to sequester carbon in the soil through increased above- and below-ground biomass production
Establishment of pasture on degraded land reintro-duces large amounts of organic matter into the soil
Agroforestry/tree-crop farming—Introduction of fruit trees, orchards, and woodlots into croplands helps to store more carbon, optimize water use, diversify production, and increase income
Introduction of improved crop varieties
Application of biochar and other soil amendments
Source: This study.

20
CARBON SEQUESTRATION IN AGRICULTURAL SOILS
CHAPTER 3 — META-ANALYSES OF SOIL CARBON SEQUESTRATION
rates. This is one important element in making comprehen-sive assessments of the impact of soil quality on agricultural sustainability and greenhouse mitigation potentials.
3.2 METHODS
Searches and Data Sources
Searches were carried out using online database and search tools, including ProQuest, Scopus, Sciencedirect, SpringerLink, Wiley Science Library, and Google Scholar with an emphasis on key terms such as soil organic matter, or-ganic matter, soil organic carbon, soil carbon, carbon seques-tration, soil sequestration, and soil properties, in combination with geographical descriptors (e.g., countries and continents) and terms for particular agricultural practices.
Inclusion-Exclusion Criteria
For soil fertility and surface management effects that are commonly studied in agricultural science, only studies of at least 3 years duration were included. A major effort was made to collect data from as many long-term studies as possible. Almost all studies adopted formal experimental designs, setting up control and treatments. The variations applied in the treatments accounted for the different levels of carbon added to the soil. In a few cases where paired designs were employed, logical contrasts were made with appropriate con-trols using fi nal values of stocks under each treatment.
Experimental study designs are rare for land-use change effects. Most adopted nonexperimental designs such as chronosequence where adjacent plots of different ages were compared, paired studies where adjacent plots of different land uses and similar ages were compared, or repeated sam-ples where same plot was measured over time. Only studies of at least 4 years duration were included, and where repeat-ed measures were made, sequestration rates for the longest time interval were taken. A major reason for excluding papers with data on different land uses was diffi culty in assuming particular sites could be taken as a reasonable control.
Effect Sizes
The effect of a land management practice was estimated by comparing the fi nal level of soil carbon stock in one treatment with that practice and an appropriate control. Thus, all soil carbon sequestration rates are estimates of effect size—the difference with respect to a control—and thus represent the marginal benefi t of adopting that practice. Effect sizes were estimated for all logical contrasts with suffi cient information provided in a paper.
Analysis
Most studies reported concentrations of carbon in soil samples (Cc in g kg−1). These were converted to volumes and then areas to calculate stocks (Cs in kg−1 ha−1) and sequestra-tion rates (kg ha−1 yr−1) using bulk density (BD, in g cm−3) and sample soil depth (D, in cm):
Cs = BD x Cc x D x 10,000
In a few studies, value was given in terms of percent soil organic matter. In these cases, concentrations of Cc (g kg−1) were calculated as
Cc = 0.58 x OM% x 10
In some cases, only a single value, either initial or average across treatments, was provided for bulk density. In these cases, that value was assumed to apply to all treatments. If no bulk density information was provided in a paper (or other reports about the same study cited by that paper), then bulk density was estimated using known pedotransfer functions (that is, simple regression equations) developed for that region or extracted from the International Soil Reference Information Center–derived soil properties database (www.isric.org).
Effect sizes and importance of contextual variables (e.g., temperature, precipitation, duration, and soil type) were summarized by means and 95 percent confi dence intervals for the mean. Associations of the context variables with car-bon sequestration were assessed by grouping observations into a few classes so that nonlinear patterns could be clearly identifi ed. Geographical distribution of datasets is shown in fi gure 3.1, while the characteristics of the estimates with respect to duration of study, soil sampling depth, and experi-mental design are shown in Appendix 3.1.
3.3 RESULTS
Contextual Factors and Soil Carbon Sequestration
Climate
Climate signifi cantly infl uences large-scale patterns of soil carbon sequestration. In this study, higher sequestration rates were observed in the wettest locations (fi gure 3.2). There was also a trend to lower sequestration rates in the coolest and warmest conditions (fi gure 3.3). Sites in warmer and middle temperature regions tended to accumulate soil carbon more rapidly than those in colder regions, whereas semi-humid areas had higher average rates than their semi-arid counterparts. Potter et al. (2007) explored interactions with residue management practices in maize fi elds at six

21
ECONOMIC AND SECTOR WORK
CHAPTER 3 — META-ANALYSES OF SOIL CARBON SEQUESTRATION
sites across a wide range of annual temperature regimes in Mexico and discovered that as temperature increased, more crop residues needed to be retained to increase levels of soil organic carbon. An increase in soil temperature exacerbated the rate of mineralization, leading to a decrease in the soil organic carbon pool (SOC). However, decomposition by-products at higher temperatures may be more recalcitrant than those at lower temperatures.
Soils
Soil type, especially those with a higher clay content, leads to higher carbon sequestration rates. However, obtaining com-parable data is diffi cult as not all studies provide suffi cient information on soil properties, and those that do use differ-ent soil classifi cation schemes at different levels of detail. As a fi rst-level analysis, the reported soil types were reclassifi ed into major soil orders of the U.S. Department of Agriculture classifi cation system (fi gure 3.4). Carbon sequestration rates were highest and also highly variable on inceptisols in Africa and Latin America. Inceptisols are relatively young soils characterized by having only the weakest appearance of ho-rizons, or layers, produced by soil-forming factors. Inceptisol
soil profi les give some indication of humus, clay minerals, or metal oxides accumulating in their layers. In Asia, the highest sequestration rates and variability were observed on oxisols, formed principally in humid tropical zones under rain forest, scrub, or savanna vegetation on fl at to gently sloping up-lands. Oxisols are typically found on old landscapes that have been subject to shifting cultivation for several years.
Duration
Longer term studies on average have resulted in lower sequestration rates, as would be expected from saturation (fi gure 3.5). Most of the potential soil carbon sequestration takes place within the fi rst 20 to 30 years. The pattern of change in sequestration rates is nonlinear and differs be-tween major groups of practices, with the highest rates at intermediate times and low or even negative rates in the short term.
Nutrient Management
Fertilizer use sequesters carbon by stimulating biomass pro-duction. Judicious fertilizer application also counters nutrient depletion, reduces deforestation and expansion of cultivation
FIGURE 3.1: Geographical Distribution of Carbon Sequestration Estimates
Carbon sequestration
number of estimates
1–10
11–3031–50
51–100101–200
201–630
Source: This study.

22
CARBON SEQUESTRATION IN AGRICULTURAL SOILS
CHAPTER 3 — META-ANALYSES OF SOIL CARBON SEQUESTRATION
FIGURE 3.2: Soil Carbon Sequestration and Precipitation
<500
3,000
Africa
2,500
2,000
1,500
1,000
500
0
annual precipitation (mm)
carb
on s
eque
stra
tion
(kg
C/h
a/yr
)
<1,500500–1,000 1,001–1,500
<500
1,250
Asia
250
750
1,000
500
annual precipitation (mm)
carb
on s
eque
stra
tion
(kg
C/h
a/yr
)
1,500+500–1,000 1,001–1,500
800
Latin America
600
400
200
<500 500–1,000 1,000–1,500 1,500+annual precipitation (mm)
carb
on s
eque
stra
tion
(kg
C/h
a/yr
)
Source: This study.
FIGURE 3.3: Soil Carbon Sequestration and Temperature
3,000Africa
2,500
2,000
1,500
1,000
500
0<20
carb
on s
eque
stra
tion
(kg
C/h
a/yr
)
mean annual temperature (°C)20–25 25–30 >30
< 10
200
400
600
800
Asia
10 – 20 20 – 30 30+
mean annual tempeature (°C)
carb
on s
eque
stra
tion
(kg
C/h
a/yr
)
1,200
Latin America
1,000
800
600
400
200
0
<15 15.20 20.25 25+
mean annual temperature (°C)
carb
on s
eque
stra
tion
(kg
C/h
a/yr
)
–200
Source: This study.

23
ECONOMIC AND SECTOR WORK
CHAPTER 3 — META-ANALYSES OF SOIL CARBON SEQUESTRATION
FIGURE 3.4: Soil Carbon Sequestration and Soil Order
4,0003,0002,0001,0000
Alfisols
Andisols
Inceptisols
Mollisols
Oxisols
Ultisols
Vertisols
Africa
carbon sequestration (kg C/ha/yr)
soil
type
0
Alfisols
Andisols
Aridisols
Entisols
Inceptisols
Mollisols
Oxisols
Ultisols
Vertisols
Asia
soil
type
1,000carbon sequestration (kg C/ha/yr)
2,000 3,000 4,000
carbon sequestration (kg C/ha/yr)–2,000 –1,000 0 1,000 2,000 4,0003,000
Alfisols
Andisols
Entisols
Inceptisols
Mollisols
Oxisols
Ultisols
Vertisols
Latin America
soil
type
Source: This study.
to marginal areas, and increases crop yields. Strategies to promote nutrient use effi ciency include the following:
Adjusting application rates based on assessment of crop needs
Minimizing losses by synchronizing the application of nutrients with plant uptake
Correcting placement to make the nutrients more accessible to crop roots (microfertilization and microdosing)
Using controlled-release forms of fertilizer that delay its availability for plant uptake and use after application
Using nitrifi cation inhibitors that hold-up microbial processes leading to nitrous oxide formation
The average effect size of applying fertilizer was an additional 124 kg C ha−1 yr−1 sequestered for Latin America, 222 kg C ha−1 yr−1 for Asia, and 264 kg C ha−1 yr−1 for Africa (table 3.2). The ma-jority of studies have designs focused on the infl uence of dif-ferent levels of nitrogen and, in some cases, the combination of fertilizer with locally available manure sources. Aggregating across locations and cropping systems there was no signifi cant association between level of N applied across annual cropping cycles and carbon sequestration rates (fi gure 3.6).
Across the full dataset, studied average sequestration rates with NPK - Nitrogen, Phosphorus and Potassium compound fertilizers N = Nitrogen, P = Phosphorus, K = Potassium were signifi cantly higher than other combi-nations (Figure 3.7). Within individual experiments, some studies show that integrated management of N, P, and K fertilizers is important to maintaining or increasing soil car-bon and nitrogen and thus soil fertility.
Alvarez’s (2005a) analysis of a global dataset indicated that for every additional tonne of nitrogen fertilizer applied, two more tonnes of soil organic carbon were stored in fertilized than unfertilized plots. Soil organic carbon levels clearly in-creased under nitrogen fertilization only when crop residues were returned to the soil. Another meta-analysis at the global level concluded that addition of nitrogen fertilizer resulted, on average, in a 3.5 percent increase in soil carbon in agricultural ecosystems (Lu et al. 2011).
Biofertilizers are an essential component of organic farming. They contain living microorganisms that colonize the rhizo-sphere and promote plant growth by increasing the supply of nutrients through nitrogen fi xation or enhancing the avail-ability of primary nutrients to the host plant by solubilizing phosphorus and other nutrients. The microorganisms in

24
CARBON SEQUESTRATION IN AGRICULTURAL SOILS
CHAPTER 3 — META-ANALYSES OF SOIL CARBON SEQUESTRATION
FIGURE 3.5: Soil Carbon Sequestration and Time
<5
4,500
4,000
3,500
3,000
2,500
2,000
1,500
1,000
500
05–10 11–20
duration of study (years)>30
All
Africa
carb
on s
eque
stra
tion
(kg
C/h
a/yr
)
<5 5–10
1,600
1,400
1,200
1,000
800
600
400
200
011–20
duration of study (years)
Tillage and residuemanagement
carb
on s
eque
stra
tion
(kg
C/h
a/yr
)
<5
3,000
2,500
2,000
1,500
1,000
500
05–10 11–20
duration of study (years)
Nutrientmanangement
carb
on s
eque
stra
tion
(kg
C/h
a/yr
)
<5
3,000
3,500
4,000
4,500
2,500
2,000
1,500
1,000
500
05–10 11–20 20–30 >30
duration of study (years)
Land-use changeca
rbon
seq
uest
ratio
n (k
g C
/ha/
yr)
<5 <5
1,250 All
Asia
1,000
600
400
200
0
750
500
250
carb
on s
eque
stra
tion
(kg
C/h
a/yr
)
5–10 5–1010–20 10–20
duration of study (years) duration of study (years)20–30 20–3030+ 30+
Tillage and residuemanagement
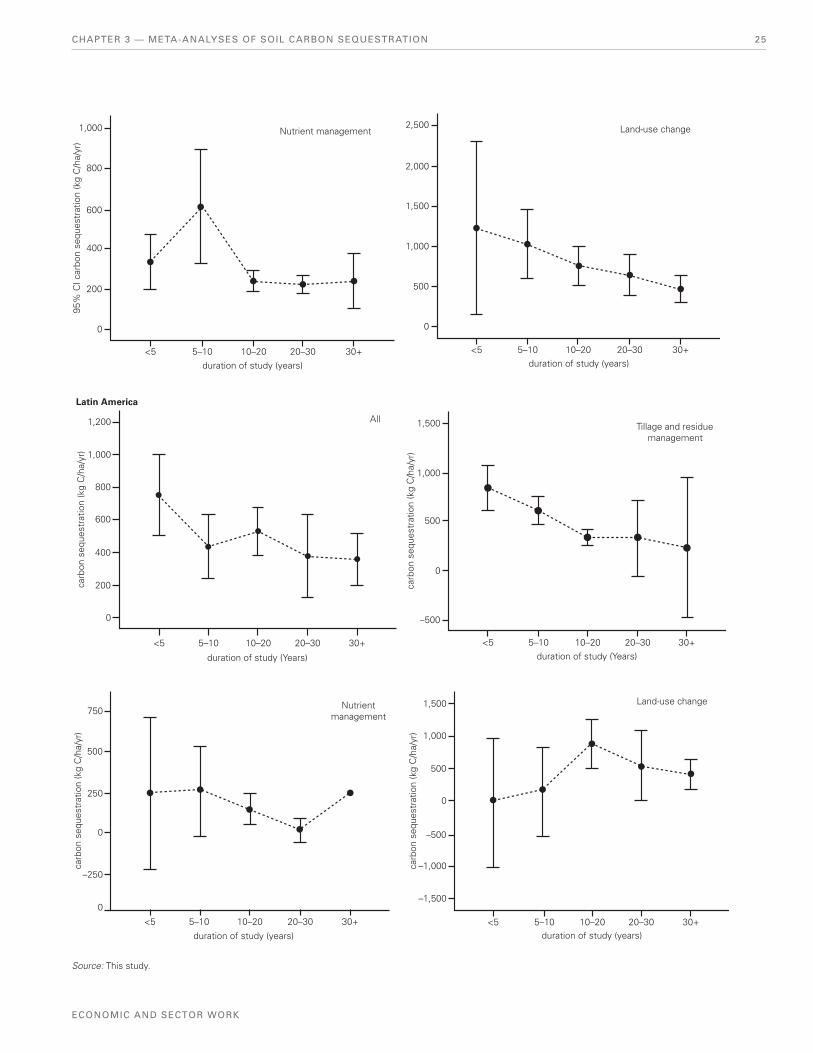
25
ECONOMIC AND SECTOR WORK
CHAPTER 3 — META-ANALYSES OF SOIL CARBON SEQUESTRATION
5–10 10–20 20–30 30+duration of study (years)
Land-use change1,000
800
600
400
200
0
5–10 10–20
Nutrient management
20–30 30+duration of study (years)
95%
CI c
arbo
n se
ques
trat
ion
(kg
C/h
a/yr
)
<5 <5
0
500
1,000
1,500
2,000
2,500
<5 5–10
0
200
400
600
800
1,000
1,200
Latin America
10–20 20–30 30+
All
duration of study (Years)
carb
on s
eque
stra
tion
(kg
C/h
a/yr
)
<5
1,000
1,500
500
–500
0
5–10 10–20 20–30 30+duration of study (Years)
Tillage and residuemanagement
carb
on s
eque
stra
tion
(kg
C/h
a/yr
)
Source: This study.
750
500
250
0
–250
0
5–10 10–20
Nutrientmanagement
20–30 30+
duration of study (years)
carb
on s
eque
stra
tion
(kg
C/h
a/yr
)
<5 5–10 10–20 20–30 30+duration of study (years)
Land-use change
carb
on s
eque
stra
tion
(kg
C/h
a/yr
)
<5
–1,500
–500
–1,000
500
0
1,000
1,500

26
CARBON SEQUESTRATION IN AGRICULTURAL SOILS
CHAPTER 3 — META-ANALYSES OF SOIL CARBON SEQUESTRATION
FIGURE 3.6: Soil Carbon Sequestration and Application Levels of Nitrogen Fertilizer (Means and 95 Percent Confi dence Intervals, n = 285)
<100
0
200
400
600
100–200 200–300 300+
N fertilizer (kg N/ha/yr)
carb
on s
eque
stra
tion
(kg
C/h
a/yr
)
Source: This study.Note: N = Nitrogen.
FIGURE 3.7: Soil Carbon Sequestration and Fertilizer Combinations (Means and 95 Percent Confi dence Intervals, n = 285)
NP PK NK NPKN
0
100
200
300
400
500
fertilizer mix
carb
on s
eque
stra
tion
(kg
C/h
a/yr
)
Source: This study.Note: N = Nitrogen only; NP = Nitrogen and Phosphorus only; PK = Phosphorus and Potassium only; NK = Nitrogen and Potassium only; NPK = combination of Nitrogen, Phosphorus and Potassium.

27
ECONOMIC AND SECTOR WORK
CHAPTER 3 — META-ANALYSES OF SOIL CARBON SEQUESTRATION
biofertilizers restore the soil’s natural nutrient cycle and help in building soil organic matter. Biofertilizers are more envi-ronmentally friendly and cost-effective relative to chemical fertilizers. Three studies reviewed indicate that biofertilizers sequestered about 1.4 t C ha−1 yr−1.
Manure application to agricultural soils can reduce nitrous oxide emissions by displacing N fertilizer use. Methane emis-sions can also be minimized by displacing anaerobic storage options with aerobic decomposition. These benefi ts have already been recognized in efforts to divert organic waste from landfi lls. Pattey, Trzcinski, and Desjardins (2005) found that compared to untreated manure storage, composting reduced total GHG emissions (CH4 and N2O) by 31 to 78 percent, depending on carbon-to-nitrogen ratio, moisture content, and aeration status.
The impact of composting on emissions post-land applica-tion is of further interest. Fronning, Thelen, and Min (2008) examined GHG fl uxes following land application of solid beef manure and composted dairy manure over a 3-year period. Net CH4 fl ux was minimal (less than 0.01 t CO2e ha−1 yr−1), while untreated manure application generated higher N2O emissions than did compost (0.9 versus 0.7 t CO2e ha−1 yr−1). However, these land emission impacts were small when compared to soil C sequestration rates, which were 1.8 times greater for compost than for manure, suggesting that the organic matter stabilization during composting reduces post-application respiration losses.
Manure sequestered more carbon than fertilizer, yielding 61 kg C ha−1 yr−1 more in Africa, 243 C ha−1 yr−1 more in Asia, and 331 kg C ha−1 yr−1 more in Latin America (table 3.2). Yields
also increased with manure application and accumulation of soil carbon but with patterns that depend on crop. In China, yields of maize and maize-wheat systems increased over the longer term, while in rice-based systems, the gains hap-pened in the fi rst few years and were not followed by further yield improvements (Zhang et al. 2009).
One major constraint is the availability of manure and labor costs associated with collecting and processing it. Studies in Nepal (Acharya et al. 2007) and Thailand (Matsumoto, Paisancharoen, and Hakamata 2008) have pointed to trends of declining livestock numbers and speculated on impacts of this on manure application practices. The impact of manure on soil carbon sequestration is best realized in farming sys-tems that integrate crops and livestock. Crop-livestock inte-gration can occur in space, time, management, or ownership domains. The agronomic and economic justifi cation for the integration is based on the exchange of four main types of resources: crop residues, manure, animal power, and fi nan-cial income (Sumberg 2003). The spatial domain integration is based on the idea that crops and livestock activities can be colocated with the level of integration increasing as the scale becomes smaller. Close spatial integration is required for crop-livestock interactions involving crop residues, manure, and animal power (table 3.3). At large distances (scale), eco-nomic movement of crop residues, manure, and livestock is markedly curtailed, hindering interaction.
Integration in the temporal domain connotes that crop and livestock production can take place simultaneously (in paral-lel) or can be temporally segregated (in sequence). Temporal integration can only occur after some form of spatial integra-tion has taken place, and the latter is important given the
TABLE 3.2: Nutrient Management and Soil Carbon Sequestration Rates (kg C ha−1 yr−1)
PRACTICE MEAN
LOWER 95 PERCENT CONFIDENCE
INTERVALOF MEAN
UPPER 95 PERCENT CONFIDENCE
INTERVALOF MEAN
NUMBER OF ESTIMATES
Africa
Chemical fertilizer 264 169 359 30
Manure 325 224 427 30
Asia
Chemical fertilizer 222 157 288 297
Manure 465 374 556 146
Biofertilizer 1,459 −42 2,960 3
Latin America
Chemical fertilizer 124 −15 262 74
Manure 455 23 887 25
Source: This study.

28
CARBON SEQUESTRATION IN AGRICULTURAL SOILS
CHAPTER 3 — META-ANALYSES OF SOIL CARBON SEQUESTRATION
seasonality of feed and water for livestock. Integration in the ownership domain underscores the fact that a given crop-livestock combination can be owned by the same or a differ-ent entity, thereby promoting control and secure access to resources. However, the formal and informal links between crop and livestock producers for accessing manure, crop residue, or power implies that though desired, integration in the ownership domain is not required for benefi cial crop-livestock interaction.
Last, integration in the management domain implies that management of crop and livestock production may or may not be in the hands of the same entity and that manage-ment may not necessarily coincide with ownership of both crops and livestock. While ownership may increase the ef-fi ciency of the benefi cial effects of interaction, integration in the management domain is not a prerequisite for successful benefi cial crop-livestock interaction (Sumberg 2003).
Crop Residue Management and Tillage
Crop residues are an important renewable resource for agro-ecosystems. Crop residue management infl uences soil resil-ience, agronomic productivity, and GHG emissions by
aiding nutrient cycling;
intercepting raindrops, thereby allowing water to gen-tly percolate into the soil;
lowering soil evaporation;
increasing aggregation of soil particles; and
reducing run-off and erosion.
The quality and quantity of residues markedly infl uence the amount of carbon sequestered (fi gure 3.8). The quantity of residue produced is a function of the cropland area and ag-ronomic practices, including tillage method. Cereals are two to three times better than legumes at sequestering carbon. Cereals also have higher concentrations of lignin that are
resistant to decomposition. High-quality residues of perennial legumes are generally the most effective in supplying nitrogen in the short to medium term, while low-quality residues tend to immobilize nitrogen. As large carbon losses occur under very wet conditions, the best results are obtained when residues are applied shortly before the beginning of the rainy season.
One of the main barriers to the use of crop residues and mulch for soil fertility management is the numerous compet-ing uses for feed, fodder, thatch, and biofuel. Crop-livestock integration can minimize the trade-off in the use of residues for feed (see the section of this report on nutrient manage-ment on page 21). Controlled grazing and the establishment of plots of permanent forages for direct grazing can also reduce confl icts between soil organic matter accumulation and grazing needs. Zero grazing involving the confi nement of livestock in a stall and developing a cut-and-carry fodder system can make for more residue retention on the fi eld, but it requires more labor. The establishment of bioenergy plants to meet the demand for biofuel may also help. In general, desirable results will be achieved if integrated food-feed-energy systems are tailored to specifi c local conditions. Examples include intercropping maize and pigeon pea, and using cookstoves for rural dwellers in Malawi and using agro-forestry systems for food, income generation, and bioetha-nol production in Mozambique. The effects of crop residues and mulches on carbon sequestration are highest in Latin America and lowest in Africa (table 3.4). In Latin America, most studies looked specifi cally at the effects on soil carbon sequestration of mulching or incorporating residues rela-tive to burning. Others were on the effects of sugar cane residues on sequestration, while others looked at the effects of grazing crop residues on soil carbon sequestration. Apart from biomass from trees, use of straw from rice and other crop residues was found to be prevalent in Asia.
Tillage, the agricultural preparation of the soil for planting, has three primary purposes: to facilitate seed germination
TABLE 3.3: Relative Importance of the Four Domains of Integration on Crop-Livestock Interaction
SPACE TIME OWNERSHIP MANAGEMENT
Crop residue *** ** * **
Manure *** * * **
Animal power *** *** * *
Financial income * ** *** *
Source: Adapted from Sumberg (2003).Note: * = little importance; ** = some importance, *** = much importance.

29
ECONOMIC AND SECTOR WORK
CHAPTER 3 — META-ANALYSES OF SOIL CARBON SEQUESTRATION
TABLE 3.4: Tillage, Crop Residue Management, and Soil Carbon Sequestration Rates (kg C ha−1 yr−1)
PRACTICE MEAN
LOWER 95 PERCENT CONFIDENCE
INTERVAL OF MEAN
UPPER 95 PERCENT CONFIDENCE
INTERVAL OF MEANNUMBER OF ESTIMATES
Africa
Crop residues 374 292 457 46
Mulches 377 159 595 6
Cover crops 406 298 515 24
No-tillage 370 322 418 108
Asia
Crop residues 450 379 521 189
Mulches 565 371 759 53
Cover crops 414 233 594 38
No-tillage 224 97 351 48
Latin America
Crop residues 948 638 1,258 56
Mulches 748 262 1,108 16
Cover crops 314 108 520 33
No-tillage 535 431 639 249
Source: This study.
PHOTO 3.1: Crop Residue Management in Irrigated Fields in Indonesia
Source: Curt Carnemark/World Bank.

30
CARBON SEQUESTRATION IN AGRICULTURAL SOILS
CHAPTER 3 — META-ANALYSES OF SOIL CARBON SEQUESTRATION
by creating a smooth, uniform soil surface for planting; to incorporate fertilizer, manures and crop residues into the soil; and to control weeds. Depending on the amount of residue left on the soil surface, tillage systems can be broadly clas-sifi ed into conventional, reduced, and conservation tillage (fi gure 3.9). The conventional method, more appropriately referred to as intensive tillage, entails motorized multiple farm operations with mold board, disk, plow, and harrow for seedbed preparation. Conventional tillage should not be confused with traditional tillage techniques involving manual or animal-drawn operations. Conventional tillage leaves the least residue on the soil surface. While plowing loosens and aerates the topsoil and facilitates seedling establishment, it can lead to many unfavorable effects including soil compac-tion, destruction of soil aggregates, decrease in infi ltration rate, increase in soil erosion and loss of nutrients, increase in evaporation loss, and reduction in soil organic matter. Conservation tillage systems leave the most crop residues on the surface, and they are the precursor to conservation agriculture, the holistic agricultural production system that in-tegrates management of soil, water, and biological resources (Liniger et al. 2011). Conservation agriculture is based on
minimum soil disturbance through mechanical tillage,
permanent soil cover through residue management, and
crop rotation and diversifi cation using legumes and green manure or cover crops (fi gure 3.2).
In this study, carbon sequestration under conservation tillage ranged from 224 kg ha−1 yr−1 for Asia to 535 kg ha−1 yr−1 for Latin America (table 3.4).
Most of the conservation tillage systems are large-scale farms in the United States, Canada, Brazil, Argentina, and Australia. Africa lags behind with only about 500,000 ha under conservation agriculture. Recent experience in Zambia—conservation agriculture with trees—suggests that the system holds promise for replenishing soil fertility and improving productivity and rural livelihoods. Conservation agriculture in Zambia entails (1) dry season land preparation using minimum tillage methods and utilizing fi xed planting stations (small shallow basins), (2) retention of crop residue from previous harvests in the fi eld or use of other mulches from the tree component (Faidherbia albida) or other cover crops, and (3) rotation of grains with legumes in the fi eld.
FIGURE 3.8: Mean Soil Carbon Sequestration and Levels of Residue Returned
<3
200
400
600
800
1,000
0
3–5
residue application (t/ha/yr)
carb
on s
eque
stra
tion
(kg
C/h
a/yr
)
5–8 8+
Source: This study.Notes: n = 165; the 95 percent confi dence intervals are shown as whiskers.

31
ECONOMIC AND SECTOR WORK
CHAPTER 3 — META-ANALYSES OF SOIL CARBON SEQUESTRATION
Over 180,000 farmers used this system at the end of 2010, and this fi gure was projected to rise to 250,000 farmers by 2011, representing some 30 percent of the population of small-scale farmers in Zambia. The tree component provides mulch and nutrients. By eliminating the need for laborious land preparation, farmers adopting the system have been better able to plant close to the onset of the rains. Using conservation agriculture, yields have doubled for maize and increased by 60 percent for cotton compared to conventional tillage system.
Cover Crops
In this study, the practice of growing cover crops in situ was distinguished from mulches and crop residues of main harvested crops. Cover crops help to improve soil macro-nutrients and micronutrients and are termed green manure because of their ability to enhance soil fertility. Green manure crops are commonly leguminous crops with high nitrogen content. Examples include cowpea, groundnut and mucuna. Cover crops can also improve soil quality by increasing soil organic carbon through their biomass, and they also help in
FIGURE 3.9: Classifi cation of Tillage Systems Based on Crop Residue Management
Rotational tillage
This is a system in which different tillage methods are used to establish different crops during a crop rotation sequence. For instance, a rotational system may include both mulch tillage and notillage, or rotation from annual to perennials. The soils are tilled at specific intervals e.g. at the introduction of a crop in the rotation sequence, or every other year dependingon cropping sequence.
Tillage Systems
Conservation tillage
Greater than 30% cropresidue on the soil (>1,000 kgha-1 crop residue equivalent)
Reduced tillage
15% to 30% residue cover onthe soil (500 to 1,000 kg ha-1
crop residue equivalent)
Conventional tillage
Less than 15% residue coveron the soil (< 500 kg ha-1 crop
residue equivalent)
No tillage
Also called zerotillage; aims for 100%soil cover and does not involve soil disturbance through tillage. Helps to increase soil moisture, organic matter, nutrients, and crop yields; less tillage reduces labor costs. Higher soil moisture also helps to increase cropping intensity rather than leave the field fallow. To avoid yield depression during transition period (3 to5 years), fertilizer should be applied in slightly higher quantities. As an option to increased herbicide use, cover crops can be used to control weeds and supply nutrients.
Strip tillage
It uses minimum tillage by combining the soil aeration benefits of conventional tillage with the soil-protecting advantages of notillage. Only the soil area containing seed rows are tilled. Strip tillage allows for a better seedbed and for nutrients to be better adapted to the plant’s needs. Soil erosion on strip tilled farms is much lower than for conventional tillage. Strip tillage requires higher precision planters compared to notillage system. Also, appropriate cover crop mix for weed suppression is essential.
Mulch tillage
Soil is disturbed prior to planting and crop residues are incorporated using chisels, sweeps, and field cultivators.It also includes planting operations such as hoe drills and air seeders. The primary purpose of mulch tillage is to increase soil organic matter and tilth, reduce erosion, improve water use efficiency and reduce energy use. Residue management is used in conjunction with crop rotation, cover crops, and adjustment of planting density.
Ridge tillage
Ridge tillage is similar to the traditional systems with planting on preformed ridges, hills or bunds that provides warmer conditions for plant growth. The ridges are formed from crop residues that are left on the soil. The system is mainly used on poorly drained soils. The rows are maintained in the same location each season, while the top of the ridges are leveled off at planting. Like other conservation tillage systems, the residue cover prevents soil erosion, conserves soil moisture and helps increase soil organic matter.
Source: This study.

32
CARBON SEQUESTRATION IN AGRICULTURAL SOILS
CHAPTER 3 — META-ANALYSES OF SOIL CARBON SEQUESTRATION
TABLE 3.5: Crop Rotation and Soil Sequestration Rates (kg C ha−1 yr−1)
PRACTICE MEAN
LOWER 95 PERCENT CONFIDENCE
INTERVALOF MEAN
UPPER 95 PERCENT CONFIDENCE
INTERVALOF MEAN
NUMBER OF ESTIMATES
Africa
Diversify rotation 378 306 451 49
Intensify rotation 342 277 407 55
Asia
Intensify rotation 345 87 604 43
Latin America
Intensify rotation 331 165 496 25
Diversify rotation 136 −62 334 43
Source: This study.
improving soil aggregate stability, protecting the soil from surface runoff and suppressing weeds.
Crop Rotation
Crop rotation is a key complementary practice for successful implementation of no-tillage. Crop rotation is the deliberate order of specifi c crops sown on the same fi eld. The suc-ceeding crop may be of a different species (e.g., grain crops followed by legumes) or variety from the previous crop, and the planned rotation may be for 2 or more years. Rotating to a different crop such as cowpea or soybean usually results in higher grain yields when compared to continuous cropping of maize. Other benefi ts of crop rotation include improved soil fertility, increased soil water management, reduced soil erosion, and reduced pest and diseases. The recommended crop rotation strategies include
producing large amounts of biomass and residue for soil protection and incorporation in the soil,
maintaining a continuous sequence of living vegetation,
including perennial crops in the rotation, and
diversifying the rotation to include nitrogen-fi xing legumes.
Two variants of crop rotation observed in the review are rota-tion intensifi cation and diversifi cation (table 3.5). Intensifying rotation means replacing a fallow with another crop, while diversifying rotation implies altering cropping sequences within or across years while keeping the same number of crops in the rotation.
There is a tendency toward higher sequestration rates in triple cropping systems, but variation is high (fi gure 3.10).
The apparent lower level for double compared to single or triple cropping may refl ect differences in soils, climate, and cropping systems rather than effects of cropping intensity. Rotation diversifi cation is different in Africa compared to Latin America. In Africa, the traditional element of crop rotation is the replenishment of nitrogen through the use of legumes in sequence with other crops. In the Sahel, a typical cropping sequence is millet/sorghum, followed by maize, groundnuts, cowpea, sesame, cassava, yams, and tree legumes, while in Ethiopia, the sequence is usually maize/barley, followed by sorghum, millet, and tef.
Water Management
Improved water productivity in agriculture is achieved by reducing water loss, harvesting water, managing excess wa-ter, and maximizing water storage. Rainwater harvesting is particularly important for rain-fed agriculture in arid and semi-arid regions. The practice aims at minimizing the effects of seasonal variations in water availability due to droughts and dry periods and enhancing the reliability of agricultural production. Conveyance and distribution effi ciency are also important measures in irrigation. Terracing on steep slopes and cross-slope barriers helps in reducing surface runoff. Improved irrigation sequestered carbon the most, while ter-racing sequestered the least (table 3.6).
Agroforestry
Agroforestry is an integrated land-use system combining trees and shrubs with crops and livestock. Agroforestry maintains soil organic matter and biological activity at levels suitable for soil fertility. It also contributes to agro-ecosystem resilience by controlling runoff and soil erosion, thereby

33
ECONOMIC AND SECTOR WORK
CHAPTER 3 — META-ANALYSES OF SOIL CARBON SEQUESTRATION
FIGURE 3.10: Mean Soil Carbon Sequestration and Cropping Intensity
250
500
750
1,000
1,250
1,500
Single
carb
on s
eque
stra
tion
(kg
C/h
a/yr
)
Double Triple of more
cropping intensity
Source: This study.Note: The 95 percent confi dence intervals are shown as whiskers (n = 536).
PHOTO 3.2: Water Management in a Field in India
Source: Ray Witlin/World Bank.

34
CARBON SEQUESTRATION IN AGRICULTURAL SOILS
CHAPTER 3 — META-ANALYSES OF SOIL CARBON SEQUESTRATION
reducing losses of water and nutrients. The shade provided by the trees helps in moderating microclimate and reducing crops and livestock stress and helps to improve crop yields. One of the most promising fertilizer tree species is Faidherbia albida, an Acacia species native to Africa and the Middle East. Faidherbia is widespread throughout Africa, thrives on a range of soils, and occurs in different ecosystems ranging from dry lands to wet tropical climates. It fi xes nitrogen and
has the special feature of reversed leaf phenology, a char-acteristic that makes it dormant and sheds its leaves during the early rainy season and leafs out at the onset of the dry season. This makes Faidherbia compatible with food crop production because it does not compete for light, nutrients, and water. Farmers have frequently reported signifi cant crop yield increases for maize, sorghum, millet, cotton, and groundnut when grown in proximity to Faidherbia.
TABLE 3.6: Water Management and Soil Carbon Sequestration Rates (kg C ha−1 yr−1)
PRACTICE MEAN
LOWER 95 PERCENT CONFIDENCE
INTERVAL OF MEAN
UPPER 95 PERCENT CONFIDENCE
INTERVAL OF MEANNUMBER OF ESTIMATES
Africa
Rainwater harvesting 839 556 1,122 33
Cross-slope barriers 1,193 581 1,805 22
Terracing 421 276 566 15
Asia
Rainwater harvesting 1,086 405 1,767 4
Improved irrigation 1,428 477 2,379 10
Latin America
Improved irrigation 571 −59 1,201 34
Source: This study.
PHOTO 3.3: Maize Growing under Faidherbia Albida Trees in Tanzania
Source: World Agroforestry Centre.

35
ECONOMIC AND SECTOR WORK
CHAPTER 3 — META-ANALYSES OF SOIL CARBON SEQUESTRATION
Improved fallow involves the use of fast-growing trees to accelerate the process of soil rehabilitation and thereby shorten the length of fallow sequester carbon the most (about 2.5 t ha−1 yr−1). Nitrogen-fi xing plants are normally used because they are generally sturdy, easy to establish, deep rooted, drought tolerant, and fi x atmospheric nitro-gen. The improved fallow trees and shrubs are left in the fi eld for several months or years. During the fallow period, the plants accumulate nitrogen from the atmosphere and deep layers of the soil, while leaf litter protects the soil from erosion, enriches the soil with nutrients, and helps to conserve moisture. When the trees are removed after fallow, their roots remaining in the soil gradually decom-pose, releasing additional nutrients to the subsequent crops. Examples of species used for improved fallow in-clude pigeon pea, sesban, sun hemp, Gliricidia sepium, and Tephrosia vogelii.
The average soil carbon sequestration rate of tree-crop farming is approximately 1.4 t C ha−1 yr−1.The estimates covered cocoa in Ghana and Cameroon, coffee in Burkina Faso, indigenous fruit trees in South Africa, oil palm in Cote d’Ivoire, exotic tree species in Ethiopia, rubber plantation in Nigeria and Ghana, and cashew and teak plantation in Nigeria. Cocoa planted at low plant density and under shade stores more carbon per unit area of soil than an equivalent area of cocoa planted at high density without
shade. In addition to C sequestration in biomass and soil, tropical plantations are needed for timber and, more im-portantly, as fuel for cooking. Thus, the area under tropical plantations has increased drastically since the 1960s from 7 Million hectares (Mha) in 1965 to 21 Mha in 1980, 43 Mha in 1990, and 187 Mha in 2000.
Intercropping examines the effects of crops on soils where there are trees, as opposed to the effects of including trees where there are crops. The responses over time vary in dif-ferent studies and may be affected by biomass harvesting. Competition with crops is an important trade-off. Although in-cluding the nitrogen-fi xing tree Dalbergia sisso leads to more accumulation of organic carbon in the soil, the incorporation of more trees reduces spacing between crops, and shading of crops by trees may reduce crop yields. The highest effects recorded in Latin America for intercropping were 1.1 t ha−1 yr−1, while the highest effects for trees recorded in Africa was 1.2 t ha−1 yr−1 (table 3.7).
Land-Use Changes
The review captured diverse categories of land-use changes in Asia and Latin America compared to Africa (table 3.8). Replacing annual crops with perennials increased soil carbon sequestration on average by 1 t C ha−1 yr−1 in Asia and by 0.5 t C ha−1 yr−1 in Latin America. In virtually all cases, the switch was to perennial grasses used as fodder for livestock. On
TABLE 3.7: Agroforestry and Soil Carbon Sequestration Rates (kg C ha−1 yr−1)
PRACTICE MEAN
LOWER 95 PERCENT
CONFIDENCE INTERVAL OF
MEAN
UPPER 95 PERCENT
CONFIDENCE INTERVAL OF
MEANNUMBER OF ESTIMATES
Africa
Include trees in fi eld 1,204 798 1,610 125
Intercropping 629 162 1,421 14
Alley farming 1,458 869 2,047 46
Tree-crop farming 1,359 755 1,964 44
Improved fallow 2,413 1,886 2,941 71
Asia
Include trees in fi eld 562 220 904 58
Intercropping 803 65 1,541 17
Latin America
Include trees in fi eld 1,065 270 1,860 43
Diversify trees 1,365 516 2,213 6
Intercropping 1,089 116 2,063 7
Source: This study.

36
CARBON SEQUESTRATION IN AGRICULTURAL SOILS
CHAPTER 3 — META-ANALYSES OF SOIL CARBON SEQUESTRATION
average, conversion of cultivated lands to secondary forests sequestered more than 1 t C ha−1 yr−1 in Africa. The Global Partnership on Forest Landscape Restoration estimates that over 400 Mha of degraded forest landscapes offer oppor-tunities for restoring or enhancing the functionality mosaic landscapes of forest, agriculture, and other land uses in the continent. In any afforestation project, emphasis should be placed on maximizing the use of available land by planting high-yielding tree species. The species may be similar or mixed in a manner that will generate the highest yield and biodiversity. The growing of plantations on former agricul-tural land sequestered on average an additional 0.9 t C ha−1 yr−1 in Asia and Latin America—a value comparable to that for secondary forests. However, more C is sequestered when the former land use is pasture (about 1.2 t C ha−1 yr−1 in Latin America). The establishment of pasture on cultivated land sequesters 1.1 t C ha−1 yr−1.
In Latin America, the conversion of native grasslands includ-ing savannahs, which are frequently grazed, to plantations, on average, resulted in a net loss of soil carbon of 0.4 t C ha−1 yr−1 (table 3.8). This is in sharp contrast to fi ndings for con-version of pastures to forest or plantation. Converting grass-lands to plantations in the Pampas region results in acidifi -cation of soils (Jobbagy and Jackson 2003), an impact also observed in some studies of savannas in Brazil (Lilienfein et al. 2000). Other studies have suggested that grassland soils may not accumulate carbon once forested and that some humid soils may even lose carbon (Paruelo et al. 2010).
The highest soil carbon sequestration rate for land-use change observed in this review was for intensive veg-etable production in Asia (2.6 t C ha−1 yr−1). One green-house system in Taiwan had 26 crops in 4 years with high inputs of fertilizers and manures (Chang, Chung, and
TABLE 3.8: Land-Use Changes and Soil Carbon Sequestration Rates (kg C ha−1 yr−1)
PRACTICE MEAN
LOWER 95 PERCENT
CONFIDENCE INTERVAL OF
MEAN
UPPER 95 PERCENT
CONFIDENCE INTERVAL OF
MEANNUMBER OF ESTIMATES
Africa
Crop-to-forest 1,163 619 1,706 37
Pasture improvement 799 469 1,129 32
Asia
Crop-to-forest 932 554 1,309 60
Crop-to-plantation 878 662 1,094 158
Crop-to–grassland 302 −36 640 35
Exclusion or reduction in grazing 502 126 877 39
Restoration of wetlands 471 1
Annual-to-perennial 1,004 615 1,392 36
Intensive vegetables and specialty crops
2,580 1,226 3,933 56
Latin America
Crop-to-forest 528 −80 1,135 59
Pasture-to-forest 362 −32 756 62
Crop-to-plantation 893 299 1,488 14
Pasture-to-plantation 1,169 315 2,024 53
Grassland–to-plantation −406 −842 32 32
Exclusion or reduction in grazing 172 −393 737 30
Crop-to-pasture 1,116 −32 2,265 7
Annual-to-perennial 526 239 812 13
Pasture improvement 1,687 825 2,549 13
Source: This study.

37
ECONOMIC AND SECTOR WORK
CHAPTER 3 — META-ANALYSES OF SOIL CARBON SEQUESTRATION
Wang 2008). But other systems included farms with or-ganic production using no pesticides or chemical fertilizers (Ge et al. 2010c). Although intensifi ed cultivation in green-houses produced the highest average rates of soil carbon sequestration, the differences from estimates from fi eld or agroforestry settings were not statistically signifi cant. One repeated-sampling design study in India, for example, documented the consequences of intensive cultivation of high-value medicinals and aromatics in an agroforestry set-ting (Sujatha et al. 2011), while another looked at growing vanilla orchids under different organic manure and mulch combinations in an agroforestry setting (Sujatha and Bhat 2010). Fertigation, the inclusion of liquid fertilizers as part of a drip irrigation system, has been experimented with for high-value crops in arecanut agroforestry systems (Bhat and Sujatha 2009). Increases in soil organic carbon under these high-input systems are likewise rapid (Bhat and Sujatha 2009).
Grazing management, the control of animal grazing to sus-tain productivity and ensure continuous supply of forages to animals, sequesters about 0.5 and 0.2 t C ha−1 yr−1 in Asia and Latin America, respectively. Grazing management helps to
maintain a healthy and productive pasture;
increase water use effi ciency by increasing infi ltration and reducing runoff;
reduce soil and nutrient losses in runoff, thereby main-taining soil physical and chemical quality; and
maintain higher amounts of soil organic matter and rapid cycling of nutrients.
Grazing management and pasture improvement should be integrated for optimal benefi ts. An effi cient grazing system
uses the appropriate mix of grass or legume species for pasture, manages stocking rates, encourages more uniform use of paddocks, and adjusts the timing of grazing. Pasture improvement sequestered 0.8 and 1.7 t C ha−1 yr−1 in Africa and Latin America, respectively.
Livestock grazing is relevant to many different land-use and agricultural practices. This study looks at livestock manage-ment practices from several perspectives, recognizing that there is not always a clear boundary between categories of effects. These different practices are summarized in table 3.9 to aid comparison.
Biochar and Other Soil Amendments
Of the soil amendments studied, biochar sequestered car-bon the most (table 3.10). Biochar is produced by pyrolysis, the thermal decomposition of biomass under limited oxygen supply and at temperatures below 700°C. Biochar is a key ingredient in the formation of anthropogenic Amazonian dark earth (soils). Its application has gained recognition in the last few years for both climate change mitigation and soil improvement. The climate mitigation benefi t of biochar lies in the fact that it decomposes more slowly and stabilizes biomass carbon. Application of biochar also leads to avoided emissions of nitrous oxide and methane. As a soil amend-ment, biochar
adds nutrients and improves uptake of applied fertilizers,
increases water holding capacity of the soil,
increases microbial biomass and activity, and
increases mycorrhizal abundance linked to enhanced agronomic effi ciency and yield.
TABLE 3.9: Summary of Observed Rates of Soil Carbon Sequestration (kg C ha−1 yr−1) as a Result of Land-Use Changes and Other Practices Relevant to Livestock Management
PRACTICE EFFECTGRASS
PLANTEDTREES
PLANTED GRAZING AFRICA ASIALATIN
AMERICA
Pasture improvement (perennial, productive grasses)
Y N Y 799 1687
Pasture to plantation Y Y (N) 1169
Include trees (silvopasture) (N) Y Y 1167
Pasture to forest Y N (N) 362
Excluding grazing (N) N N 502 172
Grassland to plantation N Y (N) −406
Crop to grassland Y N Y 302
Source: This study.Note: Letters in parentheses indicate typical but not absolute conditions.

38
CARBON SEQUESTRATION IN AGRICULTURAL SOILS
CHAPTER 3 — META-ANALYSES OF SOIL CARBON SEQUESTRATION
Biochar can remain resident in the soil approximately 10 to 1,000 times longer than the residence time of most soil or-ganic matter. However, research results on biochar’s effect on some soil properties are not consistent. No signifi cant increase in nutrient-holding capacity was observed after the addition of biochar to a coastal plain soil (Novak et al. 2009). Other studies have also indicated an adverse effect of biochar application on earthworm survival, possibly due to increases in soil pH. In general, the use of biochar should ensure that crop residues and mulch needed for soil protec-tion are not removed from the fi eld.
Net Climate Change Mitigation Benefi ts of the Land
Management Practices
Estimates of the net climate change mitigation benefits of the agricultural land management practices are sum-marized in figure 3.11. The estimates were derived by converting carbon sequestration rates from this study to carbon dioxide equivalent by multiplying by 3.67 and also by accounting for land and process emissions. Land emis-sions are the differences between emissions of nitrous oxides and methane expressed in CO2 equivalents by conventional and improved practices, while process emis-sions are those arising from fuel and energy use (Eagle et al., 2010).
Net Mitigation Benefi ts for Nutrient Management
Increases in productivity from nitrogen fertilizers and irriga-tion need to be considered against increased emission of
TABLE 3.10: Soil Amendments and Soil Carbon Sequestration Rates (kg C ha−1 yr−1)
PRACTICE MEAN
LOWER 95 PERCENT CONFIDENCE
INTERVAL OF MEAN
UPPER 95 PERCENT CONFIDENCE
INTERVAL OF MEANNUMBER OF ESTIMATES
Africa
Biochar 2,303 1,219 3,387 11
Soil amendmenta 569 299 839 15
Asia
Biochar 3,818 747 6,889 6
Sulfur 425 106 743 5
Lime 39 1
Zinc 53 1
Latin America
Biochar 3,237 1,079 5,395 8
Lime 114 −287 516 9
Source: This study.a Ash, sawdust, cocoa husk, rice bran.
GHGs from soils as well as energy-related emissions. It should be noted that as much as 70 to 75 percent of fossil fuel use in the agricultural sector in the tropics is for the production and use of chemical fertilizers (Vlek, Rodriquez-Kuhl, and Sommer 2004). Fertilizers may make no net con-tribution to mitigation of climate change if the CO2 emitted to produce and transport them exceeds the soil storage benefi t (Schlesinger, 2010). Shang et al. (2010) calculated full GHG budgets over a 3-year period in a long-term ex-periment on fertilization in a double rice-cropping system in China. They found fertilizer plots sequestered 470 kg C ha−1 yr−1 more carbon in soil than controls but that long-term fer-tilization increased CH4 emissions during fl ooded rice and increased N2O emissions from drained soils at other times. They estimated a net impact of 4.1 t CO2e ha−1 yr−1 above unfertilized controls although in terms of emissions per unit yield fertilization was still benefi cial. Shang et al. noted that mixtures of inorganic fertilizer and chemical fertilizers increased net annual greenhouse warming potential even further, to as much as 13.5 t CO2e ha−1 yr−1 above unfertil-ized controls.
A modeling study for Indian rice and wheat suggested that increased irrigation and fertilizer application would increase the carbon effi ciency ratio even as net emissions rise (Bhatia et al. 2010). At the same time, intensifi cation of agricultural production (using more fertilizers) on better lands may make less suitable land available for conversion to grasslands and forests with high soil carbon sequestration potential (Vlek, Rodriquez-Kuhl, and Sommer 2004). Reducing wasteful

39
ECONOMIC AND SECTOR WORK
CHAPTER 3 — META-ANALYSES OF SOIL CARBON SEQUESTRATION
FIGURE 3.11: Carbon Dioxide Abatement Rates of the Land Management Practices
chem
ical fe
rtiliz
er
rota
tion i
nten
sifica
tion
resid
ues
mulc
hes
rota
tion d
iversi
ficati
onno
tillag
eco
ver c
rops
man
ure
terra
cing
othe
r soil
amen
dem
ents
pastu
re im
prov
emen
t
water h
arve
sting
inter
cropp
ing
cross
slop
e/barr
iers
includ
e tre
es in
field
tree-c
rop f
arming
affor
esta
tion
alley
farm
ing
impr
oved
fallo
wbio
char
Africa12
10
8
6
4
2
0
chem
ical fe
rtiliz
er
no o
r red
uced
till
inten
sify r
otat
ion
resid
ue m
anag
emen
t
appli
catio
n of
mulc
hes
redu
ced-
graz
ingco
ver c
rops
crop
-to-g
rass
land
man
ure
impr
oved
irriga
tion
includ
e tre
es
annu
al-to
-per
ennia
l
inten
sive
vege
table
s
water
har
vers
ting
inter
crop
ping
biofe
rtiliz
ercr
op-to
-fore
st
crop
-to-p
lanta
tion
bioch
ar
Asia18
16
14
12
10
8
6
4
2
0
16Latin America14
1210
8
6
4
2
0-2
chem
ical fe
rtiliz
er
impr
oved
irriga
tion
diver
sify r
otat
ion
inten
sify r
otat
ion
redu
ced-
graz
ing
gras
sland
-to-p
lanta
tion
no o
r red
uced
till
cove
r cro
ps
annu
al-to
-per
ennia
lm
anur
e
resid
ue m
anag
emen
t
pastu
re-to
-fore
st
includ
e tre
es
inter
crop
ping
crop
-to-fo
rest
pastu
re-to
-plan
tatio
nbio
char
Source: This study.

40
CARBON SEQUESTRATION IN AGRICULTURAL SOILS
CHAPTER 3 — META-ANALYSES OF SOIL CARBON SEQUESTRATION
fertilizer use by ensuring that applied rates do not exceed crop requirements is an important mitigation strategy.
Net Mitigation Benefi ts for Residue Management and Tillage
The net GHG mitigation potential of residue management has been assessed in a few instances. Key constraints in-clude controlling methane emission from rice paddies. The net potential of straw return (rather than burning) in China was assessed using a GHG budget model by Lu and et al. (2010). They found that across 10 provinces, straw return increased net GHG emissions; in the other provinces, the total net mitigation potential at soil saturation was equivalent to just 1.7 percent of the fossil fuel emission budget in China for 2003.
The life cycle analysis by Koga, Sawamoto, and Tsuruta (2006) of conventional and reduced tillage in intensive crop-ping systems in Hokkaido, Japan, suggested that soil-derived CO2 emissions accounted for 64 to 76 percent of total GHG emissions, emphasizing the importance of soil management practices. Adoption of reduced till in these systems was ex-pected to reduce total GHG emissions by 4 to 18 percent for various crops as a result of slower decomposition rates and fuel saving for plowing. The experimental study by Harada,
Kobayashi, and Shindo (2007), for example, found 43 percent lower CH4 emissions in no-till rice.
The GHG mitigation benefi ts of residue management also require consideration of processes apart from soil carbon sequestration. Returning straw to fi elds rather than burning it helps avoid emissions associated with producing synthetic fertilizer as well as CH4 and N2O emissions from burning (Lu et al. 2010). Improved management of compost pro-cesses and mulches can reduce non-CO2 emissions (Zeman, Depken, and Rich 2002).
Net Mitigation Benefi ts of Intensifi cation and Water Management
Very intensive systems such as vegetable production under greenhouses can sequester a lot of carbon in the soil, but they obviously depend a lot on high levels of inputs as well. Wang et al. (2011) made one of the few full carbon budgets for a greenhouse system. Their analyses suggest that green-houses are a net sink of 1,210 and 1,230 kg C ha−1 yr−1 in temperate and subtropical areas, respectively. The conver-sion from conventional agriculture enhances carbon sink potential as much as 8 times in temperate and 1.3 times in tropical areas. The mitigation potential of improved irrigation is almost offset by land and process emissions, but cross-slopes/barriers achieve moderate mitigation impact.
PHOTO 3.4: Crop Harvesting in Mali. The Biomass Is Smaller Compared to that of Agroforestry Systems
Source: Curt Carnemark/World Bank.

41
ECONOMIC AND SECTOR WORK
CHAPTER 3 — META-ANALYSES OF SOIL CARBON SEQUESTRATION
A critical issue for soil carbon sequestration activities across humid parts of Asia is how to reduce emissions of CH4 from rice fi elds. There is a very large scientifi c literature on factors infl uencing emissions and management options (e.g., Babu et al., 2006; Li et al. 2006, Minamikawa and Sakai 2005, Pathak 2010, Wassmann et al. 2000, and Zheng et al. 2007). For example, midseason drainage is a viable practice in some locations in India to reduce CH4 emissions (Babu et al. 2006). Increasing fertilizer use increased both yields and CH4 emis-sions. Other more complex water management strategies have been proposed and demonstrated to reduce CH4 emis-sions (Minamikawa and Sakai 2007).
Net Mitigation Benefi ts for Agroforestry and Land-Use Changes
The impacts of land-use changes to trees are positive and large. The effects of some practices such as excluding grazers from rangelands or grasslands are, however, fairly small. Most of the potential impacts of changes in agricultural practices on carbon stocks are by defi nition below ground. The time-averaged above-ground biomass of crops is small and does not accumulate easily. Land-use changes away from cropping, such as to agroforestry or plantations, provide more compel-ling examples where it is useful to think of both above- and below-ground sequestration rates at the same time and pos-sible trade-offs or interactions between them. One estimate for humid tropics globally suggested that tree-based agrofor-estry systems could sequester 70 Mg C ha−1 in vegetation and up to 25 Mg C ha−1 in the topsoil (Mutuo et al. 2005).
Net Mitigation Benefi ts for Biochar Application
Applications of biochar or charcoal, on average, resulted in higher overall GHG mitigation potential than other practice changes reviewed in this study, but precise estimates were not possible given the paucity of data. These fi ndings are consistent with reviews that suggest potential value of bio-char for improving soil conditions and increasing sequestra-tion of GHGs (Lehmann et al., 2006; Sohi et al., 2010).
REFERENCES
Acharya, G. P., McDonald, M., Tripathi, B., Gardner, R., and Mawdesley, K. 2007. “Nutrient Losses From Rain-Fed Bench Terraced Cultivation Systems in High Rainfall Areas of the Mid-Hills of Nepal.” Land Degradation & Development 18: 486–499.
Alvarez, R. 2005a. “A Review of Nitrogen Fertilizer and Conservation Tillage Effects on Soil Organic Carbon Storage.” Soil Use and Management 21: 38–52.
Alvarez, R. 2005b. “A Review of Nitrogen Fertilizer and Conservation Tillage Effects on Soil Organic Carbon Storage.” Soil Use and Management 21: 38–52.
Babu, Y., Li, C., Frolking, S., Naya, D., Adhya, T. 2006. “Field Validation of DNDC Model for Methane and Nitrous Oxide Emissions From Rice-Based Production Systems of India.” Nutrient Cycling in Agroecosystems 74: 157–174.
Bhat, R., and Sujatha, S. 2009. “Soil Fertility and Nutrient Uptake by Arecanut (Areca catechu L.) as Affected by Level and Frequency of Fertigation in a Laterite Soil.” Agricultural Water Management 96: 445–456.
Bhatia, A., Pathak, H., Aggarwal, P. K., Jain, N. 2010. “Trade-Off Between Productivity Enhancement and Global Warming Potential of Rice and Wheat in India.” Nutrient Cycling in Agroecosystems 86, 413–424.
Chang, E., Chung, R., Wang, F. 2008. “Effect of Different Types of Organic Fertilizers on the Chemical Properties and Enzymatic Activities of an Oxisol Under Intensive Cultivation of Vegetables for 4 years.” Soil Science & Plant Nutrition 54: 587–599.
Eagle, A., Henry, L., Olander, L., Haugen-Kozrya, K., Millar, N., and Robertson, G.P. 2010. Greenhouse Gas Mitigation Potential of Agricultural Land Management in the United States: A Synthesis of the Literature. Technical Working Group on Agricultural Greenhoused Gases (T-AGG) Report. Nicholas Institute, Duke University, Durham.
Fronning, E., Thelen, D., and Min, H. 2008. “Use of Manure, Compost, and Cover Crops to Supplant Crop Residue Carbon in Corn Stover Removed Cropping Systems.” Agronomy Journal 100 (6): 1703–1710.
Ge, T., Nie, S., Hong, Y., Wu, J., Xiao, H., Tong, C., and Iwasaki, K. 2010c. “Soluble Organic Nitrogen Pools in Greenhouse and Open Field Horticultural Soils Under Organic and Conventional Management: A Case Study.” European Journal of Soil Biology 46: 371–374.
Harada, H., Kobayashi, H., Shindo, H. 2007. “Reduction in Greenhouse Gas Emissions by No-Tilling Rice Cultivation in Hachirogata Polder, Northern Japan: Life-cycle Inventory Analysis.” Soil Science and Plant Nutrition 53 (5): 668–677.
Jobbagy, E., and Jackson, R. 2003. “Patterns and Mechanisms of Soil Acidifi cation in the Conversion of Grasslands to Forests.” Biogeochemistry 64: 205–229.
Koga, N., Sawamoto, T., Tsuruta, H. 2006. “Life Cycle Inventory-Based Analysis of Greenhouse Gas Emissions From Arable Land Farming Systems in Hokkaido, Northern Japan.” Soil Science and Plant Nutrition 52 (4): 564–574.
Lehmann, J., Gaunt, J., and Rondon., M. 2006. “Biochar Sequestration in Terrestrial Ecosystems—A Review.” Mitigation and Adaptation Strategies for Global Change 11: 403–427.
Li, C., Salas, W., DeAngelo, B., Rose, S. 2006. “Assessing Alternatives for Mitigating Net Greenhouse Gas Emissions and Increasing Yields from Rice Production in China Over the Next Twenty Years.” Journal of Environmental Quality 35 (4): 1554.
Lilienfein, J., Wilcke, W., Ayarza, M., Vilela, L., Lima, S., and Zech, W. 2000. “Soil Acidifi cation in Pinus Caribaea Forests on Brazilian Savanna Oxisols.” Forest Ecology and Management 128: 145–157.

42
CARBON SEQUESTRATION IN AGRICULTURAL SOILS
CHAPTER 3 — META-ANALYSES OF SOIL CARBON SEQUESTRATION
Liniger, H. P., Mekdaschi Studer, R., Hauert, C. and M. Gurtner. 2011. Sustainable Land Management in Practice - Guidelines and Best Practices for Sub Saharan Africa. World Overview of Conservation Approaches and Technologies (WOCAT) and Food and Agriculture Organization of the United Nations (FAO).
Lu, F., Wang, X., Han, B., Ouyang, Z., Duan, X., and Zheng, H. 2010. “Net Mitigation Potential of Straw Return to Chinese Cropland: Estimation With a Full Greenhouse Gas Budget Model.” Ecological Applications 20 (3): 634–647.
Lu, M., Zhou, X., Luo, Y., Yang, Y., Fang, C., Chen, J., and Li, B. 2011. “Minor Stimulation of Soil Carbon Storage by Nitrogen Addition: A Meta-Analysis.” Agriculture, Ecosystems, and Environment 140: 234–244.
Matsumoto, N., Paisancharoen, K., and Hakamata, T. 2008. “Carbon Balance in Maize Fields Under Cattle Manure Application and No-Tillage Cultivation in Northeast Thailand.” Soil Science and Plant Nutrition 54: 277–288.
Minamikawa, K., and Sakai, H. 2005. “The effect of Water Management Based on Soil Redox Potential on Methane Emission From Two Kinds of Paddy Soils in Japan.” Agriculture, Ecosystems, and Environment 107: 397–407.
Mutuo, P., Cadisch, G., Albrecht, A., Palm, C., and Verchot, L. 2005. “Potential of Agroforestry for Carbon Sequestration and Mitigation of Greenhouse Gas Emissions From Soils in the Tropics.” Nutrient Cycling in Agroecosystems 71: 43–54.
Novak, J. M., Busscher, W. J., Laird, D. L., Ahmedna, M., Watts, D. W., and Niandou, M. A. S. 2009. “Impact of Biochar Amendment on Fertility of a Southeastern Coastal Plain Soil.” Soil Science 174: 105–112.
Paruelo, J. M., Pineiro, G., Baldi, G., Baeza, S., Lezama, F., Altesor, A., and Oesterheld, M. 2010. “Carbon Stocks and Fluxes in Rangelands of the Rio de la Plata Basin.” Rangeland Ecology & Management 63: 94–108.
Pathak, H., 2010. “Mitigating Greenhouse Gas and Nitrogen Loss With Improved Fertilizer Management in Rice: Quantifi cation and Economic Assessment.” Nutrient Cycling in Agroecosystemes 87: 443–454.
Pattey, E., Trzcinski, M. K., and Desjardins, R. L. 2005. “Quantifying the Reduction of Greenhouse Gas Emissions as a Result of Composting Dairy and Beef Cattle Manure.” Nutrient Cycling in Agroecosystems 72: 173–187.
Potter, K., Velazquez-Garcia, J., Scopel, E., and Torbert, H. 2007. “Residue Removal and Climatic Effects on Soil Carbon Content of No-Till Soils.” Journal of Soil and Water Conservation 62: 110–114.
Schlesinger, W. H., 2010. “On Fertilizer-Induced Soil Carbon Sequestration in China’s Croplands.” Global Change Biology 16: 849–850.
Shang, Q., Yang, X., Gao, C., Wu, P., Liu, J., Xu, Y., Shen, Q., Zou, J., and Guo, S., 2010. “Net Annual Global Warming Potential and Greenhouse Gas Intensity in Chinese Double Rice-Cropping Systems: A 3-Year Field Measurement in Long-Term Fertilizer Experiments.” Global Change Biology, doi: 10.1111/j.1365-2486.
Sohi S., Krull, E., Lopez-Capel, E., and Bol, R. 2010. “A Review of Biochar and Its Use and Function in Soil.” Advances in Agronomy 105:47–82.
Sujatha, S., and Bhat, R. 2010. “Response of Vanilla (Vanilla Planifolia A.) Intercropped in Arecanut to Irrigation and Nutrition in Humid Tropics of India.” Agricultural Water Management 97: 988–994.
Sujatha, S., Bhat, R., Kannan, C., and Balasimha, D. 2011. “Impact of Intercropping of Medicinal and Aromatic Plants With Organic Farming Approach on Resource Use Effi ciency in Arecanut (Areca catechu L.) Plantations in India.” Industrial Crops and Products 33: 78–83.
Sumberg, J. 2003. “Toward a Disaggregated View of Crop–Livestock Integration in Western Africa.” Land Use Policy 20: 253–264.
Vlek, P., Rodriquez-Kuhl, G., and Sommer, R., 2004. “Energy Use and CO2 Production in Tropical Agriculture and Means and Strategies for Reduction or Mitigation.” Environment, Development, and Sustainability 6: 213–233.
Wang, Y., Xu, H., Wu, X., Zhu, Y., Gu, B., Niu, X., Liu, A., Peng, C., Ge, Y., Chang, J., 2011. Quantifi cation of net carbon fl ux from plastic greenhouse vegetable cultivation: A full carbon cycle analysis. Environmental Pollution 159, 1427–1434.
Wassmann, R., Lantin, R., Neue, H., Buendia, L., Corton, T., and Lu, Y. 2000. “Characterization of Methane Emissions From Rice Fields in Asia III: Mitigation Options and Future Research Needs.” Nutrient Cycling in Agroecosystemes 58: 23–36.
Zeman, C., Depken, D., and Rich, M., 2002. “Research on How the Composting Process Impacts Greenhouse Gas Emissions and Global Warming.” Compost Science & Utilization 10 (1) : 72.
Zhang, H., Xu, M., and Zhang, F. 2009. “Long-Term Effects of Manure Application on Grain Yield Under Different Cropping Systems and Ecological Conditions in China.” Journal of Agricultural Science 147 (1): 31.
Zheng, J., Zhang, X., Li, L., Zhang, P., and Pan, G. 2007. “Effect of Long-Term Fertilization on C Mineralization and Production of CH4 and CO2 Under Anaerobic Incubation From Bulk Samples and Particle Size Fractions of a Typical Paddy Soil.” Agriculture, Ecosystems, and Environment 120: 129–138.

43
ECONOMIC AND SECTOR WORK
4.1 MODEL DESCRIPTION
The RothC model (Coleman and Jenkinson 2008) was used to project the amount of soil carbon sequestered by dif-ferent land management practices up to 2035. The RothC model describes the fate of organic inputs entering the soil environment, the undergoing decomposition within the soil biomass to form a number of carbon pools, and the release of CO2. The pools have different susceptibilities to decom-position, ranging from highly labile to inert materials. The pools include easily decomposable plant material (DPM), resistant plant material (RPM), microbial biomass (BIO), hu-mifi ed organic matter (HUM), and inert organic matter (IOM),
which is highly resistant to microbial decomposition (fi gure 4.1). Both DPM and RPM decompose to form CO2, BIO, and HUM. The proportion that is converted to CO2 and to BIO plus HUM is primarily determined by the clay content of the soil. Subsequent further decomposition of the BIO and HUM produces more CO2, BIO, and HUM.
One of the main advantages of the RothC model is its re-quirement of a few, easily obtainable inputs to estimate soil carbon. The required inputs are monthly rainfall, monthly open pan evaporation, average monthly mean air tempera-ture (in degrees Celsius), clay content of the soil, and an estimate of the decomposability of the incoming organic
Chapter 4: ECOSYSTEM SIMULATION MODELING OF SOIL CARBON SEQUESTRATION
FIGURE 4.1: Representation of the RothC Model
Organic inputs
IOM RPM DPM
HUM BIO CO2
HUM BIO CO2
HUM BIO CO2
Source: This study.Note: DPM = decomposable plant material, RPM = resistant plant material, BIO = microbial biomass, HUM = humifi ed organic matter, IOM = inert organic matter.
CHAPTER 4 — ECOSYSTEM SIMULATION MODELING OF SOIL CARBON SEQUESTRATION

44
CARBON SEQUESTRATION IN AGRICULTURAL SOILS
CHAPTER 4 — ECOSYSTEM SIMULATION MODELING OF SOIL CARBON SEQUESTRATION
material referred to as the DPM/RPM ratio (Coleman and Jenkinson 2008). The model has been validated across the agro-ecological zones of the world and has been used for many subnational and national GHG inventories.
The amount of carbon (Y) that decomposes from an active pool in a given month can be represented by an exponential decay function of the form
Y = Y0(1 − e−abckt), [1]
where Y0 is the initial amount of carbon in the particular pool, a is the rate-modifying factor for temperature, b is the rate-modifying factor for soil moisture, c is the rate-modifying fac-tor for soil cover, k is the yearly decomposition rate constant for that particular compartment, and t = ¹⁄¹² is to scale k into monthly values.
Equations for calculating each of these factors can be found in Coleman and Jenkinson (2008). While the above factors contribute exponentially to the soil carbon remaining at the end of each month, others related to the input of carbon such as crop yields, root biomass, and the proportion of carbon in plant residues are linearly related to the amount of carbon decomposing. The RothC model also adjusts for clay content by altering the partitioning between evolved CO2 and soil C
decomposition rates (BIO plus HUM) pools formed during decomposition using the following exponential equation:
x = 1.67(1.85 + 1.60e−0.0786%clay), [2]
where x is the ratio CO2/(BIO + HUM) and BIO and HUM are the corresponding biomass and humic pools formed initially as incoming plant materials.
The global soil carbon mitigation potential due to the adop-tion of sustainable land management practices was modeled to a depth of 30 cm using the following relationship:
Cs = A × f, [3]
where Cs is the change in soil organic carbon as a result of adoption, A is the activity data or land area (in ha) where a given sustainable land management practice was adopted, and f the emission factor is the sequestered carbon in t C ha−1 yr−1. The activity data (global cropland area) were de-rived from available spatial datasets (table 4.1). The harvest-ed areas of eight major crops (barley, maize, millet, pulses, rice, sorghum, soybean, and wheat) occupying more than 70 percent of the global agricultural area were estimated within a geographical information system and used for modeling.
TABLE 4.1: Spatial Datasets Used in the Study
DATA PURPOSE REFERENCES
Clay content, initial soil carbon content
RothC model parameterization Harmonized World Soil Database v 1.1: FAO/IIASA/ISRIC/ISSCAS/JRC, 2009. Harmonized World Soil Database (version 1.1). FAO, Rome, Italy and IIASA, Laxenburg, Austria. http://www.iiasa.ac.at/Research/LUC/External-World-soil-database/HTML/index.html
Temperature and precipitation RothC model parameterization FAOCLIM 2; World-wide Agro Climatic Data Base; Food and Agriculture Organization of the United Nations; Environment and Natural Resources Service—Agrometerology Group
Crop calendar RothC model parameterization, modeling
FAO Crop Calendar—a crop production information tool for decisionmaking (FAO 2010): http://www.fao.org/agriculture/seed/cropcalendar/welcome.do
Direct manure/composted manure input data
Carbon input for modeling Global Fertilizer and Manure Application Rates; Land Use and the Global Environment, Department of Geography, McGill University; Food and Agriculture Organization of the United Nations livestock data for Africa, 2009: http://faostat.fao.org/site/569/default.aspx#ancor
Harvested area (ha) of selected crops and crop yield (t/ha/year) data
Carbon input for modeling Harvested area and yields of selected crops; Harvested area and Yields of 175 crops (M3-Crops Data); Navin Ramankutty; Land Use and the Global Environment, Department of Geography, McGill University
Carbon input data for agroforestry and cover crops
From several published literature See references
Land-use systems Additional data used to estimate land area for which a given technology is applicable
FAO Land Use Systems http://www.fao.org/geonetwork/srv/en/main.home http://www.fao.org/geonetwork/srv/en/metadata.show
Sustainability and the Global Environment Global Agro-Ecological Zones
Stratifi cation of Africa Center for Sustainability and the Global Environment, University of Wisconsin
Source: This study.

45
ECONOMIC AND SECTOR WORK
CHAPTER 4 — ECOSYSTEM SIMULATION MODELING OF SOIL CARBON SEQUESTRATION
Using cluster analysis, the global cropland extent was stratifi ed into mapping units based on temperature, precipi-tation, and clay content. This resulted in 12 distinct clusters (strata) within eight regions (Africa, Asia, Central America, Europe, North America, Oceania, Russia, and South America) (Figure 4.2). Crop yields and manure were converted into organic residues as model inputs using IPCC standard equa-tions (IPCC, 2006). A standard DPM/RPM ratio of 1.44 was set for modeling sustainable land management scenarios except for agroforestry, where a ratio of 0.25 was assumed. The specifi c organic inputs for the land management practice being modeled were set on a monthly basis using crop calen-dars specifi c for each stratum. For each stratum and region, the most dominant cropping systems were identifi ed from the literature. A summary of the farming systems is given in Appendix 4.1.
The choice of the suitable mitigation scenarios for each world region was guided by the following baseline considerations:
The most dominant cropping systems in a specifi c region. For instance, mixed smallholder farming systems are the dominant system in Africa, cropping systems in South Asia are dominated by rice, and maize-soybeans systems are dominant in several parts of South America.
The typical land management practices associated with the cropping systems. For example, most of the farming systems in North America already leave the residues on the fi eld, while in Africa, a common prac-tice is to burn or remove the residues from the fi eld.
Documented impact of agricultural land management practices on carbon sequestration (see Chapter 3).
As a result, residue management, manure management, tillage management, agroforestry, and integrated fertility management were modeled. A detailed description of the baseline and mitigation scenarios is provided in Appendix 4.1. The study also took advantage of the recently released crop calendar for Africa (http://www.fao.org/agriculture/seed/cropcalendar/welcome.do) to model carbon sequestration under various levels of organic inputs for Africa. Africa was classifi ed into four agroecological zones using procedures similar to the global cropland extent (Figure 4.3). The land management practices include integrated residue and ma-nure management; agroforestry systems including perennial crops; land rehabilitation; coppice and improved fallow; and cropping systems involving mucuna, cowpea, and groundnut as cover crops. To account for trade-offs between mulch residues and livestock and fuel biomass, different fractions of retained residues (i.e., 25 percent, 50 percent, and 75 per-cent) were modeled. A detailed description of the scenarios for Africa is provided in Appendix 4.2.
FIGURE 4.2: The 12 Strata Used for Ecosystem Simulation Modeling
Source: This study.

46
CARBON SEQUESTRATION IN AGRICULTURAL SOILS
CHAPTER 4 — ECOSYSTEM SIMULATION MODELING OF SOIL CARBON SEQUESTRATION
worldbank.org/SoilCarbonSequestration/. The tool includes over 4,000 land management scenarios carefully chosen to refl ect situations typically encountered in agricultural proj-ects. The Internet GIS database provides per-ha estimates of soil carbon sequestration under different land manage-ment practices for a period of 20 to 25 years (fi gure 4.4). Information on carbon sequestration potential of a location can be derived by point-and-click or by searching using place name. Users can download data from the Internet database and integrate with other GIS information to es-timate soil carbon stock changes for different agricultural projects.
FIGURE 4.3: Africa Agroecological Zone
Uncertainties in model parameters were estimated fol-lowing the adoption of the Sustainable Agricultural Land Management (SALM) methodology (http://www.v-c-s.org/sites/v-c-s.org/files/SALM%20Methodolgy%20V5%202011_02%20-14_accepted%20SCS.pdf). The procedures are provided in Appendix 4.3.
4.2 RESULTS
Soil Carbon Sequestration Internet Tool
Modeling results are summarized in an Internet geo-graphical information system (GIS) tool at http://www.esd.

47
ECONOMIC AND SECTOR WORK
CHAPTER 4 — ECOSYSTEM SIMULATION MODELING OF SOIL CARBON SEQUESTRATION
Soil Carbon Loss Under Low Input Baseline Scenario
The predicted cumulative C loss by 2030 varies for different cropping systems and regions of the world. The loss is high-est for Russia under wheat, rice, pulses, and barley (35 to 40 t C ha−1) where the drive to exploit minerals and other natu-ral resources has spread agriculture to unproductive soils and low fertilizer use has led to a sharp decrease in soil fertility. Middle America is predicted to experience the next highest loss due to depletion of crop residues in virtually all its crop-ping systems (25 to 37 t C ha−1). The highest cumulative C loss under the low input scenario occurs under rice and pulses for Africa (20 t C ha−1), under pulses for South America (26 t C ha−1), and under millet for Europe (23 t C ha−1). The cumulative C loss is around 15 to 20 t C ha−1 for all cropping systems in Asia.
Soil Carbon Sequestration Under Different Land
Management Practices
Carbon sequestration through residue management depends much on the land area devoted to a given crop (table 4.2). Based on the assumption of 50 percent residue retention, cu-mulative carbon sequestration by 2030 varies from 0.5 Million tons (Mt) C for soybean to 37 Mt C for maize (fi gure 4.5). In Asia, the sequestered carbon varies from 10 Mt for millet to 517 Mt for rice. The lowest amount of sequestered car-bon from cover crops was recorded for Middle America (15 Mt), while the highest was recorded for Asia (1 Gigaton). The highest sequestration potentials for direct and composted manure (550 and 587 Mt, respectively) were observed for North America, while Russia has the least (less than 0.2 Mt).
Agroforestry by far has the highest sequestration potentials for all world regions. The time-averaged above-ground bio-mass of trees is relatively large compared to crops.
Carbon sequestration potential of the land management practices is in the order of agroforestry > cover crops > manure > crop residues > no-tillage. The highest emphasis should be placed on agroforestry systems because of the diverse benefi ts they provide including compatibility of some tree species with crops and livestock production, increased income through production of indigenous fruit trees, and suit-ability of certain tree species for bioenergy. Agroforestry is also vital for the restoration of marginal and degraded lands.
Carbon Sequestration Maps
Figure 4.6 reveals differences in the predicted spatial pat-tern of carbon sequestration for the land management prac-tices. High sequestration rates are generally observed in the Guinea savannah areas in Africa for most of the practices. The highest cumulative sequestration for green manure (6 to 10 t C ha−1) are predicted for Europe and North America, while the highest for maize residue (7 to 12 t C ha−1) are predicted for Asia. The spatial patterns of composted and direct manure are similar because both models are based on frequency of livestock. Composted manure sequesters slightly higher than direct manure (0.04 to 14 t C ha−1 versus 0.02 to 13 t C ha−1). No-tillage sequesters least (0.08 to 1.3 t C ha−1); its estimates markedly suffer from lack of good resolution spatial data of no-tillage adopting areas.
FIGURE 4.4: A Screen Shot of the Soil Carbon Internet Database
Source: http://www.esd.worldbank.org/SoilCarbonSequestration/.

48
CARBON SEQUESTRATION IN AGRICULTURAL SOILS
CHAPTER 4 — ECOSYSTEM SIMULATION MODELING OF SOIL CARBON SEQUESTRATION
FIGURE 4.5: Cumulative Soil Carbon Loss by 2030 Assuming 15 Percent Residue Retention (t ha−1) Under Different Cropping Systems
Wheat MiddleAmerica
NorthAmerica Europe Asia
0
–5–10
–15–20
–25–30–35
–40
–45
OceaniaAfricaRussiaSouth
America
MiddleAmerica
NorthAmerica
SouthAmericaEurope Asia
0
–5
–10
–15
–20
–25
–30
–35
–40
AfricaSoybean
Oceania
MiddleAmerica
NorthAmerica
SouthAmerica Asia
0
–5
–10
–15
–20
–25
–30
AfricaSorghum
Oceania
Rice
0
–5
–10
–15
–20
–25
–30
–35
–40
Russia Africa Asia OceaniaEuropeMiddle
AmericaNorth
AmericaSouth
America
Millet Europe Asia
–5
–10
–15
–20
–25
0AfricaNorth America
MiddleAmerica
SouthAmerica
NorthAmerica
MaizeOceaniaAfrica Asia
0
–5
–10
–15
–20
–25
–30
–35
–40
Europe
RussiaPulses
0
–5–10
–15
–20–25
–30
–35–40
–45
MiddleAmerica
NorthAmerica
SouthAmericaEurope Africa Asia Oceania
RussiaBarley
0
–5–10
–15
–20
–25
–30
–35
–40
–45
MiddleAmerica
NorthAmerica
SouthAmericaEurope AfricaAsia Oceania
Source: This study.

49
ECONOMIC AND SECTOR WORK
CHAPTER 4 — ECOSYSTEM SIMULATION MODELING OF SOIL CARBON SEQUESTRATION
FIGURE 4.6: Predicted Cumulative C Sequestration for Different Land Management Practices by 2030
Green Manuring
2030
6,0000 9,000 12,000Kilometers
1,500 3,000
3,014 – 3,552
3,553 – 4,341
4,342 – 5,438
5,439 – 6,743
6,744 – 9,799
Tons per Hectare
Agroforestry
2030
2.563 – 3.915
6,0000 9,000 12,000Kilometers
1,500 3,000
3.916 – 6.479
6.480 – 9.3389.339 – 12.859
12.860 – 23.976
Tons per Hectare
Non Tillage Composted Manure
Direct Manuring Residue Management, Maize
Source: This study.

50
CARBON SEQUESTRATION IN AGRICULTURAL SOILS
CHAPTER 4 — ECOSYSTEM SIMULATION MODELING OF SOIL CARBON SEQUESTRATION
REFERENCES
Coleman, K., and Jenkinson, D. S.2008 ROTHC-26.3, A Model for the Turnover of Carbon in Soil: Model Description and Windows Users Guide. Rothamsted Research, Harpenden, UK. Available online at http://www.rothamsted.ac.uk/aen/carbon/mod26_3_win.pdf.
Intergovernmental Panel on Climate Change. 2006. “Volume 4. Agriculture, Forestry, and Other Land Uses,” in 2006 IPCC Guidelines for National Greenhouse Gas Inventories, ed. H. S. Eggleston, L. Buendia, K. Miwa, T. Ngara, and K. Tanabe. Institute for Global Environmental Strategies, Japan.
TABLE 4.2: Modeled Cumulative Soil Carbon Sequestration Potential by 2030 (Mt C) Under Different Land Management Practices
AFRICA ASIA EUROPEMIDDLE
AMERICANORTH
AMERICA OCEANIA RUSSIASOUTH
AMERICA
Residue management
Barley 7.898 16.359
Maize 37.281 209.574
Millet 10.657 9.993
Pulses 13.664 32.995
Rice 17.771 516.843 1.637 3.279
Sorghum 21.494 11.562
Soybean 0.524 35.120
Wheat 34.504 360.966
No-tillage 20.763 33.209 33.128 0.700 0.557 7.131
Cover crops 513.237 1009.402 772.082 14.727 632.415 136.495
Direct manure 400.101 203.703 23.556 2.252 549.558 1.740 0.080 20.098
Composted manure 427.890 478.064 57.106 5.460 586.731 4.218 0.193 48.721
Agroforestry 1309.511 2416.434 803.907 18.608 727.361 81.229 19.868 210.233
Source: This study.

51
ECONOMIC AND SECTOR WORK
CHAPTER 5 — ECONOMICS OF SOIL CARBON SEQUESTRATION
5.1 MARGINAL ABATEMENT COSTS
Sustainable land management technologies can generally be deployed at varying costs, creating the need to evaluate their cost-effectiveness. Such analysis helps in identifying potential mitigation pathways for a given context. The cost-effectiveness of the land management practices in mitigat-ing climate change has been evaluated using the marginal abatement cost (MAC) curve. The MAC curve analysis was a quantitative assessment of all possible costs and benefi ts that would accrue if the various management practices were implemented. A MAC curve depicts the relationship be-tween the cost-effectiveness of different land management practices vis-à-vis the amount of GHG abated. The MAC is plotted on the y-axis and GHG abated on the x-axis, with the land management practices ranked against the MAC from the lowest to the highest. Moving along the curve from left to right worsens the cost-effectiveness of the mitigation measures. The width of the column is the amount of GHG mitigated by the land management practice, while the area of each column equals the cost or benefi t of adopting the practice. The MAC curve can also be used for cost-benefi t analysis by comparing the unit mitigation cost with the shadow price of carbon or the cost of purchasing emissions allowance. Negative MACs indicate that a land management practice is self-fi nancing (that is, it both reduces emissions and saves money), while positive MACs imply that the land management practice reduces emissions at a cost and thus requires judgment against the cost of inaction.
In this study, private and public marginal abatement costs were computed. For the private MACs, all possible costs and benefi ts that would accrue to the farmers were valued at market prices the farmers are likely to face in switching to the practices. The public costs, on the other hand, refer to government support toward the implementation of land management practices. Without public support to farm-ers, poor agricultural land management will intensify land degradation, increase farmers’ vulnerability, and contribute additional GHGs in the atmosphere. Computed public costs
included investments in seeds and seedlings, input subsi-dies, extension services, and other administrative costs. The cost-benefi t fl ows were discounted to present value to cal-culate NPV using a discount rate of 9 percent. The adoption period was assumed to be 25 years; the time carbon seques-tration reaches saturation for most of the land management technologies.
The abatement rates of the land management practices (fi gure 3.11) were used to scale-up for each continent by multiplying by the suitable areas for each practice within a continent in 2030. The assumptions for estimating the suit-able areas for the four IPCC special reports on emission sce-narios are described in Appendix 5.1. Efforts were made to avoid double counting as some of the practices are mutually exclusive.
Figure 5.1 shows the MACs for Africa, Asia, and Latin America. The shapes of the curve are similar across scenar-ios, so only the curves for the A1b scenario are presented.
All the land management practices are profi table to the farm-er, but to varying degrees (table 5.1). The marginal benefi t of no-tillage is greater than US$100 per tonne of carbon dioxide mitigated for the three regions. Alley farming and intercrop-ping also yield relatively high profi ts in Africa. With the excep-tion of Asia, the marginal benefi t of residues for the regions is modest (less than US$50). Table 5.1 also reveals the inherent trade-off between the profi tability of the land management practices and their mitigation potentials. Afforestation and pasture establishment on degraded land with relatively high mitigation potentials are modestly profi table. This suggests that farmers may be reluctant to privately implement land rehabilitation. On the other hand, manure and fertilizer with modest mitigation potential yielded relatively high profi ts.
The public costs of all the land management practices are lower than US$20 per ton of GHG mitigated in Africa. Afforestation and grassland rehabilitation cost governments more than $20 per ton of GHG mitigated in Asia and Latin
Chapter 5: ECONOMICS OF SOIL CARBON SEQUESTRATION
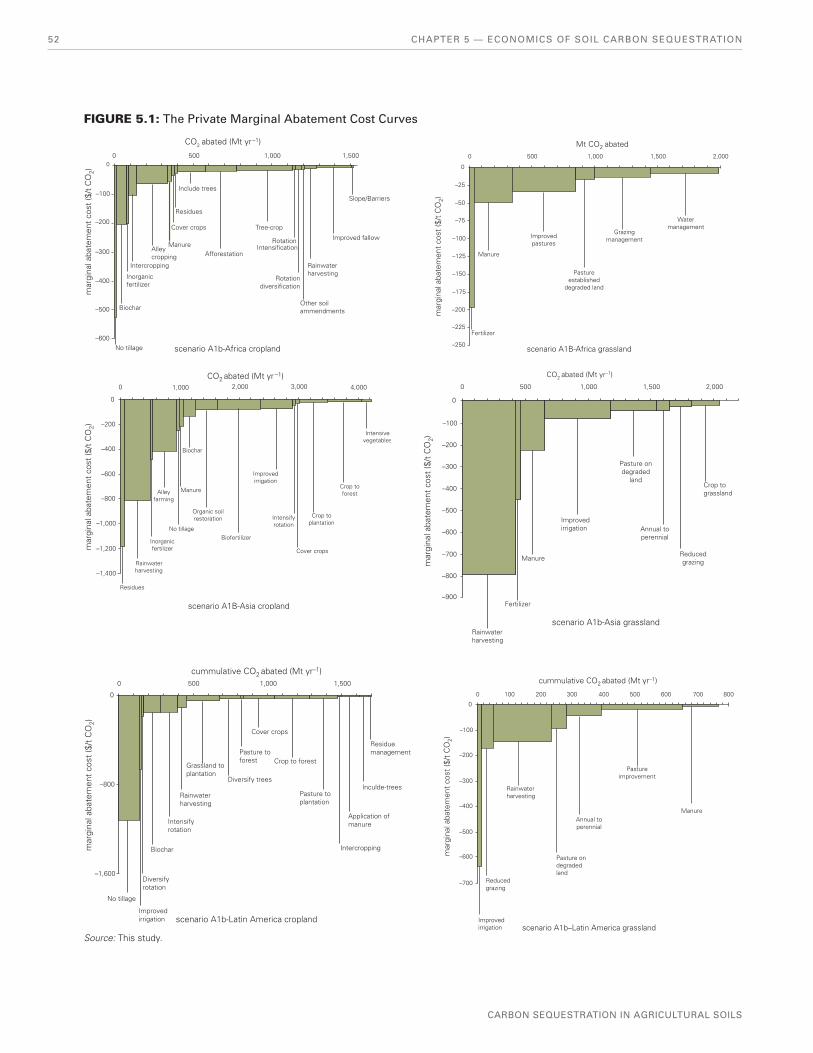
52
CARBON SEQUESTRATION IN AGRICULTURAL SOILS
CHAPTER 5 — ECONOMICS OF SOIL CARBON SEQUESTRATION
FIGURE 5.1: The Private Marginal Abatement Cost Curves
Include trees
Residues
Cover crops
ManureAlleycropping Afforestation
Tree-crop
RotationIntensification
Improved fallow
Rainwaterharvesting
Rotationdiversification
Other soilammendments
scenario A1b-Africa cropland
Slope/Barriers
Intercropping
Inorganicfertilizer
Biochar
mar
gina
l aba
tem
ent
cost
($/t
CO
2)
No tillage–600
–500
–400
–300
–200
–100
00 500 1,000
CO2 abated (Mt yr–1)
1,500
Mt CO2 abated1,0005000
0
–25
–50
–75
–100
–125
–150
–175
–200
–225
–250
1,500
Watermanagement
Grazingmanagement
Pastureestablished
degraded land
Improvedpastures
Manure
mar
gina
l aba
tem
ent
cost
($/t
CO
2)
Fertilizer
scenario A1B-Africa grassland
2,000
CO2 abated (Mt yr –1)3,000 4,000
Intensivevegetables
Crop toforest
Crop toplantation
Cover crops
Intensifyrotation
Improvedirrigation
Biofertilizer
scenario A1B-Asia cropland
No tillage
Manure
Residues
mar
gina
l aba
tem
ent
cost
($/t
CO
2)
Alleyfarming
Inorganicfertilizer
Rainwaterharvesting
Biochar
Organic soilrestoration
2,0001,0000
0
–200
–400
–600
–800
–1,000
–1,200
–1,400
CO2 abated (Mt yr–1)
1,500 2,0001,0005000
0
–100
–200
–300
–400
–500
–600
–700
–800
–900Fertilizer
mar
gina
l aba
tem
ent
cost
($/t
CO
2)
Rainwaterharvesting
scenario A1b-Asia grassland
Manure
Improvedirrigation
Pasture ondegraded
land
Annual toperennial
Reducedgrazing
Crop tograssland
cummulative CO2 abated (Mt yr–1)1,0005000
0
–800
–1,600
No tillage
Improvedirrigation
Diversifyrotation
Biocharmar
gina
l aba
tem
ent
cost
($/t
CO
2)
Intensifyrotation
Rainwaterharvesting
Grassland toplantation
Diversify trees
Pasture toforest
Cover crops
Crop to forest
Pasture toplantation
Residuemanagement
Inculde-trees
Application ofmanure
Intercropping
scenario A1b-Latin America cropland
1,500
cummulative CO2 abated (Mt yr–1)
Pastureimprovement
ManureAnnual toperennial
Pasture ondegradedland
Rainwaterharvesting
mar
gina
l aba
tem
ent
cost
($/t
CO
2)
Reducedgrazing
scenario A1b–Latin America grasslandImprovedirrigation
–700
–600
–500
–400
–300
–200
–100
0
0 100 200 300 400 500 600 700 800
Source: This study.

53
ECONOMIC AND SECTOR WORK
CHAPTER 5 — ECONOMICS OF SOIL CARBON SEQUESTRATION
America (table 5.2). Intensive vegetable production, biofer-tilizer application, and organic soil restoration also display relatively high costs in Asia, while in Latin America, the land management practices with the largest costs are mainly those associated with trees.
Figure 5.2 indicates that all the land management practices generate benefi ts to the farmers, but at varying costs to the public. Private benefi ts that motivate decisions often fall short of social costs, with the implication that in the absence of countervailing policies, GHGs from poor land management will continue to accumulate in the atmosphere. The total cost for afforestation was highest for Africa (US$2.8 billion), Asia (US$16.7 billion), and Latin America (US$5.5 billion), while the lowest total public cost was for terracing in Africa (US$18.7 million), inorganic fertilizer in Asia (US$154.7 mil-lion), and rotation diversifi cation in Latin America (US$30.1 million).
The total mitigation potential varies from 2.3 Gt CO2-eq for Latin America to 7.0 Gt CO2-eq for Asia (table 5.3). Total private profi ts range from US$105 billion in Africa to $1.4 tril-lion in Asia, while total public costs range from $20 billion in Africa to $160 billion in Asia.
5.2 TRADE-OFFS IN SOIL CARBON SEQUESTRATION
Trade-off is inherent in the attempt to achieve the triple wins of food security, increased resilience, and reduced GHG emissions. For instance, attempts to increase soil carbon storage through afforestation may reduce productivity (prof-itability), as afforestation tends to take land out of production for a signifi cant period of time. Conversely, intercropping, the growing of crops near existing trees, provides synergy be-tween profi tability and increased soil carbon sequestration.
TABLE 5.1: Private Savings of Different Technologies Per Ton of Carbon Dioxide Sequestered
LESS THAN US$50 US$51 TO $100 MORE THAN US$100
Africa Cover crops, residues, other soil amendments, terracing, afforestation, tree crop farming, rotation, rainwater harvesting, cross-slope barriers, pasture improvement, grazing management, pasture on degraded lands
Manure No tillage, biochar, inorganic fertilizer, intercrop-ping, alley farming
Asia Intensify rotation, cover crops, crop-to-plantation, afforestation, annual-to-perennial grass, pasture on degraded land, grazing management, crop-to–grassland
Include trees, organic soil restoration, biofertilizer, improved irrigation
Residues, rainwater harvesting, inorganic fertilizer, no-tillage, manure, biochar
Latin America Diversify trees, pasture-to-forest, cover crops, afforestation, pasture- to-plantation, intercropping, manure, include trees, residues, annual-to-perenni-al grass, pasture improvement
Pasture on degraded land No-tillage, improved irrigation, diversify rotation, biochar, intensify rotation, rainwater harvesting, grassland–to-plantation, grazing management
Source: This study.
TABLE 5.2: Public Costs of Different Technologies Per Ton of Carbon Dioxide Sequestered
LESS THAN US$10 US$10 TO $20 MORE THAN US$20
Africa Tree crop farming, rainwater harvesting, no-tillage, manure, cover crops, rotation intensifi cation, rotation diversifi cation, residues, terracing, slope barriers, improved fallows, other soil amendments, improved pastures
Biochar, inorganic fertilizer, intercropping, alley farming, include trees, afforestation, pasture establishment on degraded land
Asia Residues, rainwater harvesting No-tillage, manure, improved irrigation, intensify rotation, cover crops, crops-to-plantation, grazing management, cropland–to–grassland
Inorganic fertilizer, alley farming, biochar, include trees, organic soil restoration, biofertilizer, afforestation, intensive veg-etables, annual-to-perennial grass, pasture establishment on degraded land
Latin America No-tillage, diversify rotation, intensify rotation, rainwater harvesting, cover crops, manure, residues, grazing management
Improved irrigation, biochar Grassland–to-plantation, diversify trees, pasture to forest, afforestation, pasture to plantation, intercropping, include trees
Source: This study.
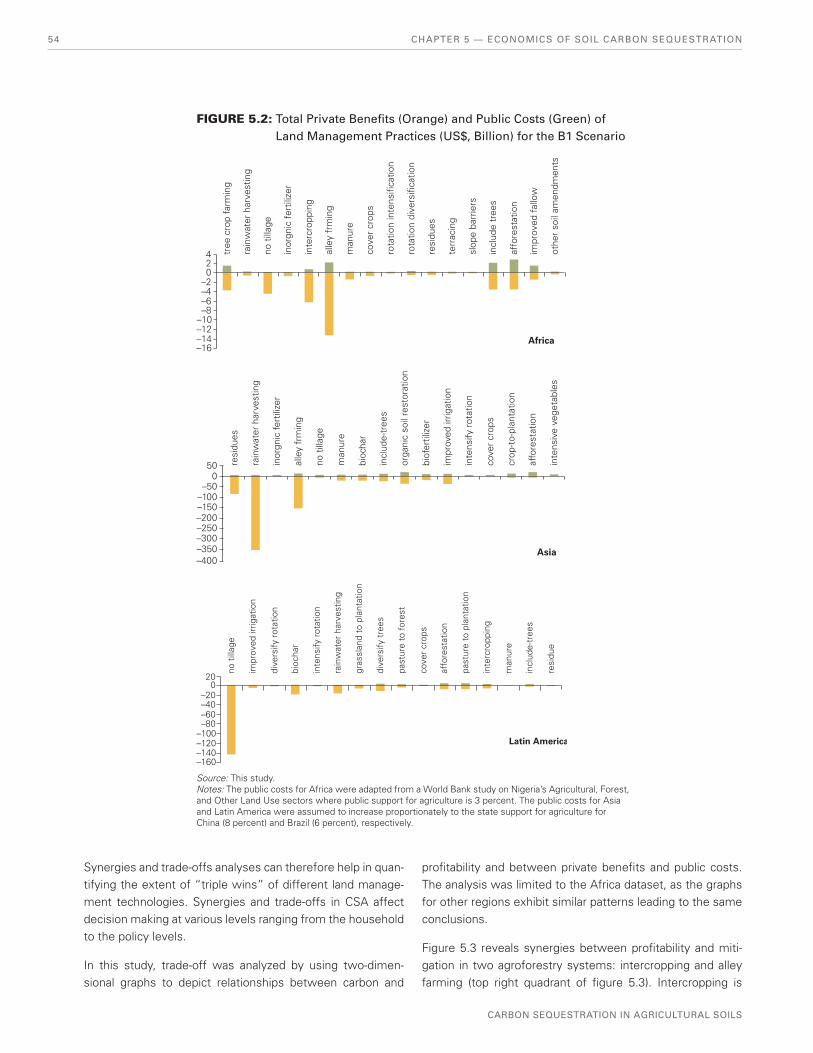
54
CARBON SEQUESTRATION IN AGRICULTURAL SOILS
CHAPTER 5 — ECONOMICS OF SOIL CARBON SEQUESTRATION
FIGURE 5.2: Total Private Benefi ts (Orange) and Public Costs (Green) of Land Management Practices (US$, Billion) for the B1 Scenario
tree
cro
p fa
rmin
g
rain
wat
er h
arve
stin
g
Africa–16–14–12–10–8
–4–2024
–6
alle
y fr
min
g
man
ure
cove
r cr
ops
rota
tion
inte
nsifi
catio
n
rota
tion
dive
rsifi
catio
n
resi
dues
terr
acin
g
slop
e ba
rrie
rs
incl
ude
tree
s
affo
rest
atio
n
impr
oved
fal
low
othe
r so
il am
endm
ents
no t
illag
e
inte
rcro
ppin
g
inor
gnic
fer
tiliz
er
rain
wat
er h
arve
stin
g
alle
y fr
min
g
man
ure
bioc
har
resi
dues
biof
ertil
izer
orga
nic
soil
rest
orat
ion
incl
ude-
tree
s
impr
oved
irrig
atio
n
inte
nsify
rot
atio
n
cove
r cr
ops
crop
-to-
plan
tatio
n
affo
rest
atio
n
inte
nsiv
e ve
geta
bles
no t
illag
e
inor
gnic
fert
ilize
r
–400Asia–350
–300–250–200
–100–50
500
–150
–160–140–120–100–80
–40–20
20
Latin America
0
–60
rain
wat
er h
arve
stin
g
past
ure
to f
ores
t
gras
slan
d to
pla
ntat
ion
incl
ude-
tree
s
impr
oved
irrig
atio
n
inte
nsify
rot
atio
n
dive
rsify
rot
atio
n
dive
rsify
tre
es
cove
r cr
ops
affo
rest
atio
n
past
ure
to p
lant
atio
n
inte
rcro
ppin
g
man
ure
resi
due
no t
illag
e
bioc
har
Source: This study.Notes: The public costs for Africa were adapted from a World Bank study on Nigeria’s Agricultural, Forest, and Other Land Use sectors where public support for agriculture is 3 percent. The public costs for Asia and Latin America were assumed to increase proportionately to the state support for agriculture for China (8 percent) and Brazil (6 percent), respectively.
Synergies and trade-offs analyses can therefore help in quan-tifying the extent of “triple wins” of different land manage-ment technologies. Synergies and trade-offs in CSA affect decision making at various levels ranging from the household to the policy levels.
In this study, trade-off was analyzed by using two-dimen-sional graphs to depict relationships between carbon and
profi tability and between private benefi ts and public costs. The analysis was limited to the Africa dataset, as the graphs for other regions exhibit similar patterns leading to the same conclusions.
Figure 5.3 reveals synergies between profi tability and miti-gation in two agroforestry systems: intercropping and alley farming (top right quadrant of fi gure 5.3). Intercropping is

55
ECONOMIC AND SECTOR WORK
CHAPTER 5 — ECONOMICS OF SOIL CARBON SEQUESTRATION
FIGURE 5.3: Trade-Offs Between Profi tability and Carbon Sequestration of Sustainable Land Management Technologies in Africa
Source: This study.
1000
100
10
1
0 2 4
carbon dioxide sequestered (ton per hectare per year)
6 8 10
Cross slope barriersImproved fallow
Tree crop farming
Afforestation
Alley farming
Intercropping
No-tillage
Manure
Cover crops
Crop residuesSoil amendments
TerracingRotation diversifi cationRotation
intensifi cation
Rainwater harvesting
Inorganic fertilizer
Include trees
profi
t pe
r to
ne o
f car
bon
diox
ide
sequ
este
red
(US
$)
TABLE 5.3: Technical Mitigation Potential, Private Benefi ts, and Public Costs of the Land Management Technologies by 2030
SCENARIOTECHNICAL POTENTIAL (MILLION TONS CO2-eq)
PRIVATE BENEFITS (US$, BILLION )
PUBLIC COSTS (US$, BILLION )
Africa
B1 3,448 105.4 19.6
A1b 3,505 108.6 19.7
B2 3,678 111.4 20.8
A2 3,926 120.9 22.3
Asia
B1 5,977 1,224.5 131.3
A1b 6,388 1,259.3 143.6
B2 7,007 1,368.1 159.7
A2 6,678 1,310.8 150.4
Latin America
B1 2,321 273.8 40.8
A1b 2,425 279.4 42.9
B2 2,538 288.8 44.3
A2 3,097 319.4 55.1
Source: This study.Notes: B1 = a world more integrated and more ecologically friendly; A1b = a world more integrated with a balanced emphasis on all energy sources; B2 = a world more divided but more ecologically friendly; A2 = a world more divided and independently operating self-reliant nations.

56
CARBON SEQUESTRATION IN AGRICULTURAL SOILS
CHAPTER 5 — ECONOMICS OF SOIL CARBON SEQUESTRATION
growing crops near existing trees, whereas alley farming is growing crops simultaneously in alleys of perennials, prefer-ably leguminous trees or shrubs. Both are important strate-gies for increased productivity and resilience of the farming system. Land management technologies in the lower right quadrant of fi gure 5.3 have high carbon sequestration rates but are modestly profi table. Afforestation, improved fallow involving the use of fast-growing trees to accelerate soil re-habilitation, including trees in croplands, and establishing bar-riers across sloping areas, tends to take land out of produc-tion for a signifi cant period of time. It reduces the amount of land available for cultivation in the short run, but can lead to overall increases in productivity and stability in the long run. The time-averaged, above-ground biomass of crop residues and other technologies in the lower left quadrant of fi gure 5.3 is relatively small compared to that of agroforestry systems. Also, the biomass of crop residues does not accumulate eas-ily, resulting in lower mitigation benefi ts.
Judicious fertilizer application counters soil nutrient deple-tion, reduces deforestation and expansion of cultivation to marginal areas, and increases crop yields. Reversing devel-oping countries’ (especially Africa’s) soil productivity declines cannot be adequately addressed without increased fertilizer use. Farmers apply 9 kg/ha of fertilizer in Africa compared to 86 kg/ha in Latin America, 104 kg/ha in South Asia, and 142 kg/ha in Southeast Asia (Kelly 2006). Yields also increase with manure application and accumulation of soil carbon, but with patterns that depend on crop type. Manure plays a crucial role in improving fertilizer use effi ciency and soil moisture
conservation Manure is less profi table than inorganic fertil-izer because of the labor costs associated with collecting and processing manure (top left quadrant of fi gure 5.3). Manure also has quite low nutrient content relative to inorganic fertil-izers, so a large amount needs to be applied on relatively small fi elds. This explains why manure works well for small-scale intensive and high-value vegetable gardening. Manure systems are also associated with high methane emissions. The relatively high profi tability of no-tillage derives primarily from the decrease in production costs after establishment of the system.
The relationship between public costs and private benefi ts of the land management technologies is shown in fi gure 5.4. Public cost refers to government support toward the imple-mentation of land management practices. They include investments in seeds and seedlings, input subsidies, exten-sion services, and other administrative costs. The pattern of public support is as crucial as the amount of support for full realization of productivity, mitigation, and adaptation benefi ts in agriculture. Public support that focuses on research, invest-ments in improved land management, and land tenure rather than on input support are generally more effective, benefi t more farmers, and are more sustainable in the long run.
Technologies that involve signifi cant change in land-use (af-forestation and improved fallows) and landscape alteration (terracing and cross-slope barriers) incur high public costs but generate low private benefi ts (lower right quadrant of fi gure 5.4). The low profi ts suggest that farmers may be re-luctant to privately invest in these technologies. Strong public
FIGURE 5.4: Relationship between Private Benefi ts and Public Costs in Africa
Source: This study.
1,000
100
10
1
0 3 5 8 10 13
public cost ($ per tonne of carbon dioxide sequestered)
Cross slope barriers
Improved fallow
Tree crop farming
Afforestation
Alley farming
Intercropping
No-tillage
Manure
Cover crops
Crop residues
Crop rotation
Terracing
Rainwater harvesting
Inorganic fertilizer
Include trees
priv
ate
bene
fi t (p
er to
nne
of c
arbo
n di
oxid
e se
ques
tere
d)

57
ECONOMIC AND SECTOR WORK
CHAPTER 5 — ECONOMICS OF SOIL CARBON SEQUESTRATION
involvement in these technologies is justifi able given their rel-atively high mitigation potentials. Crop residues, cover crops, crop rotation, and rainwater harvesting with lower profi ts and also manure and no tillage that generate relatively higher prof-its require minimal government support (lower left and upper left quadrants of fi gure 5.4, respectively). These technologies generally have low mitigation potentials. The relatively high public cost of inorganic fertilizer (top right quadrant, fi gure 5.4) refl ects the use of subsidies in spurring farmers’ access to the technology. Fertilizer subsidy is, however, associated with high fi scal costs, diffi cult targeting, and crowding out of commercial sales. Thus, fertilizer subsidies are appropriate in situations when the economic benefi ts exceed costs, the subsidies help achieve social rather than economic objec-tives, and the support helps improve targeting through mar-ket-smart subsidies while providing impetus for private sec-tor input development. Examples of market-smart subsidies include demonstration packs, vouchers, matching grants, and loan guarantees (Agwe, Morris, and Fernandes 2007).
5.3 IMPLICATIONS OF THE TRADE-OFFS IN LAND-USE DECISIONS
The trade-offs exhibited by the land management tech-nologies have important implications for land-use decision
making. Sustainable land management interventions should be planned and implemented in a coordinated manner across space, time, and sectors. Working at the landscape level with an ecosystems approach is useful for addressing food security and rural livelihood issues and in responding to the impacts of climate change and contributing to its mitiga-tion. The landscape level is the scale at which many eco-system processes operate and at which interactions among agriculture, environment, and development objectives are mediated. It entails the integrated planning of land, agricul-ture, forests, fi sheries, and water at local, watershed, and regional scales to ensure synergies are properly captured. The landscape approach provides a framework for the bet-ter management of ecosystem services, such as agricultural productivity, carbon storage, fresh water cycling, biodiversity protection, and pollination. It allows trade-offs to be explic-itly quantifi ed and addressed through negotiated solutions among various stakeholders.
Two examples taken from World Bank (2011c) illustrate the effi cacy of the landscape approach. The fi rst example is the silvopastoral farming systems of Costa Rica and Nicaragua. After several years of intensive grazing in Costa Rica and Nicaragua, pastures were degraded, erosion was accelerat-ing, and livestock productivity was falling. To address these challenges, a pilot project introduced silvopastoral techniques
PHOTO 5.1: Terracing and Landscape Management in Bhutan
Source: Curt Carnemark/World Bank.

58
CARBON SEQUESTRATION IN AGRICULTURAL SOILS
CHAPTER 5 — ECONOMICS OF SOIL CARBON SEQUESTRATION
to 265 farms on 12,000 ha between 2001 and 2007. A payment scheme for environmental services—carbon se-questration and biodiversity conservation—was introduced as an additional income stream for livestock production. Silvopastoral techniques were used to transform degraded lands with monocultures of one grass species into more complex agroforestry systems of different tree species, live fences, riparian forests, and trees dispersed in pastures. The techniques have been shown to enhance biodiversity, sequester carbon, and reduce methane emissions. Results showed a typical win-win situation: An annual sequestration of 1.5 Mt of CO2-equivalent was accompanied with increases of 22 percent in milk production, 38 percent in stocking rate, and 60 percent in farm income. The methane emission per product kilogram decreased, while biodiversity (measured by the number of bird species and water quality) increased.
The last example is one of the world’s largest erosion control programs in China. Revegetation has successfully restored the devastated Loess Plateau to sustainable agricultural production, improving the livelihoods of 2.5 million people and securing food supplies in an area where food was some-times scarce in the past. The project encouraged natural regeneration of grasslands, trees, and shrubs on previously cultivated sloping lands. Replanting and a grazing restriction allowed the perennial vegetation cover to increase from 17 to 34 percent between 1999 and 2004, sustaining soil fertility and enhancing carbon sequestration. Together with terrac-ing, these measures not only increased average yields, but also signifi cantly lowered their variability. Agricultural produc-tion has changed from generating a narrow range of food and low-value grain commodities to high-value products. As a result, the evolution of farm and family incomes has shown a steady increase. It is estimated that as many as 20 mil-lion people have benefi ted from the replication of the Loess Plateau approach throughout China.
5.4 SUSTAINABLE LAND MANAGEMENT ADOPTION BARRIERS
Despite the fact that improved land management technolo-gies generate private benefi ts, their adoption faces many socioeconomic and institutional barriers. The commonly cited risk-related barriers to adoption of carbon sequester-ing technologies in agriculture are permanence, leakage, and additionality (box 5.1). Beyond these, there are a number of other implementation constraints.
First, most of the land management technologies require signifi cant up-front expenditure that poor farmers cannot af-ford. Second, the nonavailability of inputs in the local markets
can be a signifi cant barrier in situations where farmers might want to invest in a technique. Third, lack of information on the potentials of alternative techniques of farming and limited capacity is a major constraint in many developing countries. Fourth, when technologies are inconsistent with community rules and traditional practices, their adoption will most likely encounter the resistance of the people. Last, willingness and the ability to work together are crucial for many technologies such as improved irrigation and communal pastures. The ab-sence of collective action will hinder successful uptake, dif-fusion, and impact of these land management technologies.
Factors affecting adoption tend to be more specifi c to the land management technologies. Table 5.4 suggests that lack of credit and inputs and land tenure problems are by far the most important factors for adoption across the range of technologies. However, improved availability of inputs is a necessary but insuffi cient condition for adoption of land management practices. Better market prices for crops and other agricultural produce are crucial. Secure land rights is a precondition for climate-smart agriculture as it provides in-centive for local communities to manage land more sustain-ably. Ill-defi ned land ownership may inhibit sustainable land management changes.
Behavioral change through education is required to enable changeover to improved land management technologies. For instance, conservation agriculture, the farming system involv-ing no-tillage, residue management, and use of cover crops, is highly knowledge intensive, requiring training and practi-cal experience of those promoting its adoption. Learning hubs, regional platforms, scientifi c research, south-south knowledge exchange, and technical support mechanisms may increase innovation and facilitate adoption of improved land management technologies. The knowledge base of land management practices at the local level can also be improved through careful targeting of capacity development programs.
Table 5.5 summarizes possible demand- and supply-side in-terventions for facilitating the adoption of sustainable land management inputs. It is unlikely that any of these interven-tions alone will be effective in increasing input use. Careful selection of combinations of demand- and supply-side mea-sures will allow the demand and supply to grow, leading to the emergence of viable private sector–led input markets.
5.5 POLICY OPTIONS FOR SOIL CARBON SEQUESTRATION
Private benefi ts that drive land-use decisions often fall short of social costs; thus, carbon sequestration may not reach an

59
ECONOMIC AND SECTOR WORK
CHAPTER 5 — ECONOMICS OF SOIL CARBON SEQUESTRATION
• Permanence: Permanence refers to the secure retention of newly sequestered carbon. Carbon sequestration only removes carbon from the atmosphere until the maximum capacity of the ecosystem is reached, which may be about 25 years for most land management practices. Storage of carbon in soils is relatively volatile and subject to re-emission into the atmosphere in a subsequent change in land management. The risk of nonpermanence is lower when the adoption of soil carbon sequestration practices also leads to more profi table farming systems. Note that not all agricultural mitigation options are transient. Substitution of fossil fuels by bioenergy is a permanent mitigation option, and reduction in nitrous oxide and methane emis-sions are nonsaturating.
• Leakage: Leakage occurs when a project dis-places greenhouse gas emissions outside its boundary. For instance, control of grazing in an area might force herders to move their animals to another location. Economic adjustment to meet market demand is the underlying driver
of leakage. Macroeconomic policies induce changes in market conditions and prices, which in turn infl uence farmers’ land-use and management practices. While most occur-rence of leakage has a negative effect on project benefi ts, positive leakage spillover effects that lead to reduction in emissions outside the project boundary can occur. This could be as a result of technology transfer or changes in market conditions that stimulate mitigation activities.
• Additionality: The concept implies that in order to attract compensation, emissions reduc-tion must be in addition to what would have occurred under the business-as-usual scenario. Additionality is usually calculated as postproject carbon stocks less the forward-looking baseline, less deduction for leakage and risk of reversal, and less emission generated by the project (Fynn et al. 2010).
Permanence, leakage, and additionality can be ad-dressed through temporary crediting, ex ante discount-ing, and comprehensive accounting (Murray et al. 2007).
TEMPORARY CREDITING EX ANTE DISCOUNTING COMPREHENSIVE ACCOUNTING
Description Balances debits and credits for fi nite periods with provision for reversal
Accounts for the possibility of future loss by reducing the amount of credit at the onset based on the expectation of reversal
Balances debits and credits as they oc-cur in the course of the project. These can be based on stock change or aver-age stock change during the period
Environmental rigor Rigorous as temporary credits must be replaced when they expire
Credits may not equal debits for a given project; as such, ex ante discounting may lead to underdebiting or overdebit-ing of ex post reversal.
This achieves consistency as long as the system is monitored perpetually
Feasibility of implementation
Enables up-front payment; book balanc-ing at the end of the project is also possible
Relatively easy to impose discounts on credits if amounts of reversal can be reasonably projected
Boosts attractiveness of investment by allowing credits to be earned as soon as they are generated by the project; however, perpetual accounting may hinder balancing the books at the end of a fi nite-life project
Transaction costs Measurement, monitoring, and verifi ca-tion (MMV) and contract renewal costs need to be borne by the project
MMV are not necessary; rather, credits are reduced by formula, not observed changes in carbon
MMV are carried out into perpetuity
Source: Table synthesized from Murray et al. 2007.
BOX 5.1: Risk-Related Barriers to Adoption of Soil Carbon Sequestration Activities
optimal level from a social point of view unless some mecha-nisms exist to encourage farmers. Some public policies that can potentially incentivize carbon sequestration include the following:
1. Strengthen the capacity of governments to imple-ment climate-smart agriculture. Countries must be prepared to access new and additional fi nance. There is a need to build the technical and institutional

60
CARBON SEQUESTRATION IN AGRICULTURAL SOILS
CHAPTER 5 — ECONOMICS OF SOIL CARBON SEQUESTRATION
capacity of government ministries to implement climate-smart agriculture programs. Existing national policies, strategies, and investment plans should be strengthened to form the basis for scaling-up invest-ments for climate-smart agriculture. Readiness for carbon sequestration and climate-smart agriculture can be achieved through improved extension services and training in relevant land management technolo-gies for different locales.
2. Global cooperative agreement. Given the tremendous signifi cance that agriculture has for the global climate,
progress in incorporating it into the UNFCCC has been slower than many people hoped for. Although the negative impacts of agricultural production in terms of land-use change and GHG emissions were reasonably well covered by the convention, the real and potential contributions the sector can and does make in terms of sequestering carbon in agricultural biomass and soils were for the most part omitted. Redressing this omission promises to foster a more balanced perspective in which food security is not necessarily at odds with climate change adaptation
TABLE 5.5: Interventions for Facilitating Increased Input Use
DEMAND-SIDE INTERVENTIONS SUPPLY-SIDE INTERVENTIONS
Strengthen soil-crop research and extensionSupport to public agenciesPublic-private partnershipOn-farm trials and demonstrations
Reduce input sourcing costsLowering trade barriers to increase national and regional market size
Improve farmers’ ability to purchase inputs Improve access to credits Phased and incremental use (e.g., small bags for fertilizers) Implement laws that enables farmers to use risk-free collaterals for loans
Reduce distribution costsImprove road and rail infrastructure to lower transport costs
Provide farmers with risk management toolsImproved weather forecasting, weather-indexed crop insurance
Strengthen business fi nance and risk managementUse credit guarantee and innovative insurance schemes
Improved quality and dissemination of market informationPublic and private sector information systems easily accessible to farmers
Improve supply chain coordination mechanismsProduct grades and standardsMarket information systems to reduce information costs
Protecting farmers against low and volatile output pricesInvestment in measures to reduce production variability such as drought-tolerant crops, deep-rooted crops, irrigation, and storage systems
Empowering farmers by supporting producer organizationsInvestment in rural education Training farmers in organizational management
Improving the resource base so that input use is more profi tableInvestment in soil and water management and irrigation infrastructure
Source: Modifi ed from Agwe, Morris, and Fernandes (2007).
TABLE 5.4: Relative Importance of Different Factors for Adopting Improved Land Management Practices
LAND MANAGEMENT TECHNOLOGY
INPUTS/CREDITS
MARKETACCESS
TRAINING/EDUCATION
LANDTENURE RESEARCH INFRASTRUCTURE
Inorganic fertilizer *** ** ** ** * **
Manure ** ** * ** * **
Conservation agriculture ** ** *** ** ** *
Rainwater harvesting ** ** ** *** ** **
Cross-slope barriers ** * ** ** ** *
Improved fallows ** * * *** ** *
Grazing management *** *** ** *** ** *
Source: Synthesized from Liniger et al. 2011.Key * = Low importance, ** = Moderate importance; *** = High importance.

61
ECONOMIC AND SECTOR WORK
CHAPTER 5 — ECONOMICS OF SOIL CARBON SEQUESTRATION
and mitigation (an unworkable confl ict in which longer term environmental concerns are virtually guaranteed to universally lose out politically to the more immedi-ate concern of food supply). A more practical and thorough picture makes it possible for agriculture to be rewarded for its positive environmental impacts, and to be an integral part of “the solution” as well as part of “the problem.” This is vitally important be-cause agriculture needs to be fully incorporated into adaptation and mitigation strategies. As a result, the international community has recognized the impor-tance of integrating agriculture into the ongoing ne-gotiations on the international climate change regime. At the 17th Conference of Parties to the UNFCCC in Durban, South Africa, in November, 2011, the parties asked the UNFCCC Subsidiary Body for Scientifi c and Technological Advice to explore the possibility of a formal work program on agriculture.
3. Boost fi nancial support for early action. A blend of public, private, and development fi nance will be required to scale-up improved land management practices. Integrating sources of climate fi nance with those that support food security may be one of the most promising ways to deliver climate-smart agriculture with the resources it requires. For technologies that generate signifi cant private returns, grant funding or loans may be more suitable to overcoming adoption barriers. For tech-nologies such as conservation agriculture that require specifi c machinery inputs, and signifi cant up-front costs, payment for ecosystem services scheme could be used to support farmers and break the adoption barrier. There is also the potential for carbon fi nance to support farmers during the initial period before the trees in agroforestry systems generate an economic return.
4. Raise the level of national investment in agriculture. While this may appear a tall order in countries with severe budget constraints, fi nite public resources can be more selectively targeted using the criteria given above—prioritizing technologies that generate no short-term returns and those that most effec-tively address the barriers that prevent prospective adopters from moving forward. In some cases, relatively affordable technologies that generate quick and demonstrable benefi ts may warrant priority and potentially establish some of the channels through which more sophisticated technologies are dispersed in the future. Nationally owned climate-smart
agricultural policies and action frameworks will increase the adoption of sustainable land manage-ment practices. However, public investment is only one sphere, involving the private sector in climate-smart agriculture and sustainable land management is the other.
5. Create enabling environments for private sector participation. Introducing policies and incentives that provide an enabling environment for private sector investment can increase overall investment. This pri-vate investment can be targeted to some degree as well, particularly when government priorities translate clearly into business opportunities and certain areas of investment are looked upon favorably by public of-fi cials and institutions. Public investment can also be used to leverage private investment in areas such as research and development, establishing tree planta-tions, and in developing improved seeds and seed-lings. Particular attention should go to encouraging private fi nancial service providers to tailor instruments that enable farmers who adopt SLM practices to overcome the barriers described above. Bundling ag-ricultural credit and insurance together and providing different forms of risk management, such as index-based weather insurance or weather derivatives, are areas of private investment that can be encouraged through public policy and public-private partnerships.
REFERENCES
Agwe, J., Morris, M., and Fernandes, E. 2007. “Africa’s Growing Soil Fertility Crisis: What Role for Fertilizer?” World Bank Agriculture and Rural Development Note Issue 21 (May): 4 pp.
Fynn, A. J., Alvarez, P., Brown, J. R., George, M. R., Kustin, C., Laca, E. A., Oldfi eld, J. T., Schohr, T., Neely, C. L., and Wong, C. P. 2010. Soil Carbon Sequestration in U.S. Rangelands: Issues Paper for Protocol Development. Environmental Defense Fund, New York.
Kelly, V. A. 2006. Factors Affecting Demand for Fertilizer in Sub-Saharan Africa. Agriculture and Rural Development Discussion Paper 23. World Bank, Washington, DC.
Liniger, H. P., Mekdaschi Studer, R., Hauert, C., and Gurtner, M. 2011. Sustainable Land Management in Practice—Guidelines and Best Practices for Sub-Saharan Africa. World Overview of Conservation Approaches and Technologies and Food and Agriculture Organization of the United Nations.
Murray, B. C., Sohngen, B. L., and Ross, M. T. 2007. “Economic Consequences of Consideration of Permanence, Leakage, and Additionality for Soil Carbon Sequestration Projects.” Climatic Change 80: 127–143.
World Bank. 2011. Climate-Smart Agriculture—A Call to Action. Washington, DC.


63
ECONOMIC AND SECTOR WORK
APPENDIX A — FARMING PRACTICE EFFECT, NUMBER OF ESTIMATES, AND FEATURE IN LAND MANAGEMENT
Africa
LAND MANAGEMENT PRACTICES
NUMBER OF ESTIMATES SUBTOTALS MEAN DURATION
MEAN DEPTH
EXPERIMENTAL DESIGN (%)
Nutrient management 60 8.3 15 100
Chemical fertilizer 30
Animal manure 30
Tillage and residue management
184 4 15 100
No tillage 108
Residues 46
Mulches 6
Cover crops 24
Agroforestry 185 6 22 100
Trees/forest 125
Intercropping 14
Alley farming 46
Tree-crop farming 44 44 2.2 18.4
Land-use changes 103 3 20 100
Afforestation 16
Grazing pasture 32
Cropping intensity 55
Soil management 187 4.5 10 100
Crop rotation 49
Improved fallow 71
Natural fallow 68
Water management 56 2.5 12 100
Water/rain harvesting 33
Slope/barriers 22
Terracing 15
Others 100
Biochar 11 11 1.8 7.4
Soil amendment 15 15 1.8 10
Appendix A: FARMING PRACTICE EFFECT, NUMBER OF ESTIMATES, AND FEATURE IN LAND MANAGEMENT PRACTICES

64
CARBON SEQUESTRATION IN AGRICULTURAL SOILS
APPENDIX A — FARMING PRACTICE EFFECT, NUMBER OF ESTIMATES, AND FEATURE IN LAND MANAGEMENT
Asia
PRACTICESNUMBER OF ESTIMATES SUBTOTALS
MEAN DURATION (yr) MEAN DEPTH (cm)
EXPERIMENTAL DESIGN (%)
Nutrient management 443 17.0 26 97
Application of fertilizer 297
Application of manure 146
Tillage and residue management 328 9.3 20 99
Reduced or no till 48
Return of crop residues to fi eld
189
Application of mulches 53
Cover crops 38
Agroforestry 75 8.3 27 64
Inclusion of trees 58
Intercropping 17
Intensifi cation 150 14.4 49 34
Intensive vegetables 57
Annual-to-perennial 36
Intensify rotation 43
Improved irrigation 10
Rain harvest 4
Land-use change 292 18.5 29 5
Crop-to-forest 60
Crop-to-plantation 158
Crop-to-grassland 35
Reduced grazing 39
Other amendments and practices
25 8.6 18 100
Biochar 6
Bio-inoculant 3
Gypsum 8
Sulfur 5
Lime 2
Zinc 1
TOTAL 14.5 29 68

65
ECONOMIC AND SECTOR WORK
APPENDIX A — FARMING PRACTICE EFFECT, NUMBER OF ESTIMATES, AND FEATURE IN LAND MANAGEMENT
Latin America
PRACTICESNUMBER OF ESTIMATES SUBTOTALS
MEAN DURATION (yr) MEAN DEPTH (cm)
EXPERIMENTAL DESIGN (%)
Nutrient management 99 9.7 17.2 92
Application of fertilizer 74
Application of manure 25
Tillage and residue management
364 8.9 21.8 90
Reduce or no till 249
Return of crop residues to fi eld
56
Application of mulches 16
Cover crops 33
Graze residues 10
Agroforestry 56 8.1 24.3 61
Inclusion of trees 43
Diversify trees 6
Intercropping 7
Intensifi cation 138 15.5 33.0 64
Intensify rotation 25
Diversify rotation 43
Improved irrigation 34
Improved pasture 15
Improved fallow 8
Annual-to-perennial 13
Land-use change 257 19.0 38.5 5
Pasture-to-forest 62
Crop-to-forest 59
Pasture-to-plantation 53
Grassland-to-plantation 32
Crop-to-plantation 14
Crop-to-pasture 7
Reduced or excluded grazing
30
Other amendments 17 5.2 29.1 82
Biochar 8
Lime 9
TOTAL 931 12.6 28.5 61
Source: This study.


67
ECONOMIC AND SECTOR WORK
APPENDIX B — GENERAL SCENARIO ASSUMPTIONS AND APPLICATION FOR WORLD REGIONS
B.1 BASELINE SCENARIO
Using the initial soil carbon stocks (in t C/ha) from the Harmonized World Soil Database, the models were run in reverse mode to estimate
initial carbon mass of decomposable plant material (DPM),
initial carbon mass of resistant plant material (RPM),
initial carbon mass of fast decomposing biomass (BIO-F),
initial carbon mass of slow decomposing biomass (BIO-S),
initial carbon mass of humifi ed organic matter (HUM), and
initial carbon mass of soil.
All models were run to equilibrium state increasing the organic inputs in 0.1 t C steps until the initial carbon stock represented the equilibrium of the specifi c soil in each stratum. The required addition of organic inputs to the soil varied greatly depending on climate parameters and the clay content of the soil. However, the inputs were in line with observations made by Young (1997), who estimated plant biomass requirements to maintain soil organic matter range between 3.5, 7, and 14 t d.m. per ha per year for semi-arid, subhumid, and humid ecosystems, respectively.
For each stratum, one low organic input baseline scenario was modeled for each crop and crop area, respectively, as-suming a conventional management of 15 percent of resi-dues left on the ground after harvesting.
B.2 GLOBAL MITIGATION SCENARIOS
Residue and Integrated Nutrient Management
This scenario implies additional residue inputs due to crop management improvement. The calculation of residues in-puts from the crops was based on the global crop yield data.
The average fresh yield was converted to amount of residues produced on the basis of IPCC equations (IPCC 2006).
Crop yields were grouped into three bins representing the 25th percentile, the 50th percentile, and the 75th percentile of the yields of a specifi c crop in one stratum to assess the opportunity of adapting the residue management to local situations.
Further, it served as a proxy to consider increase of yields over time due to improved management practices including the increase in application of inorganic fertilizer (integrated nutrient management). For instance, a farmer in a spe-cifi c stratum whose current maize yield is within the 25th percentile may be able to increase the yields to within the 75th percentile due to increased inorganic fertilizer application.
Two scenarios were considered with regard to increased productivity as a result of integrated nutrient management practices: A shift from low productivity to medium produc-tivity (25 percentile to 50 percentile of crop yields in a spe-cifi c stratum) and a shift from medium to high productivity (50 percentile to 75 percentile of crop yields in a specifi c stratum). The crop yields for each stratum are presented in Appendix C.
Manure Management
Generally, manure management can be classifi ed into direct manure application and application of composted manure. Similar to the procedure for residue calculation, the raw manure and composted manure model inputs in tC/ha were estimated by applying IPCC factors to the average amount of farm animals per ha (IPCC 2006). The global data estimated manure application in kg per ha of nitrogen. Therefore, the C input per ha for each kg N was calculated based on Food and Agriculture Organization of the United Nations (FAOSTAT) numbers of cattle, sheep, goats, pigs, and poultry for each region.
Appendix B: GENERAL SCENARIO ASSUMPTIONS AND APPLICATION FOR WORLD REGIONS

68
CARBON SEQUESTRATION IN AGRICULTURAL SOILS
APPENDIX B — GENERAL SCENARIO ASSUMPTIONS AND APPLICATION FOR WORLD REGIONS
The amount of manure/composted manure represents the amount of potential manure production and not the amount of manure actually spread on the fi eld in the baseline. For each stratum, the average manure/composted manure production was calculated for its use in the RothC model. Improved manure and composted manure application are considered mitigation opportunities for all climatic regions.
Green Manure/Cover Crops
Green manure is a type of cover crop grown to add organic matter and nutrients to the soil. On average, such crops yield around 4 t dry matter ha−1 yr−1. The above-ground biomass was converted into t C ha−1 yr−1 using the IPCC equations for N-fi xing forage, non-N-fi xing forage, and grass, and then computing the average value for RothC modeling. Based on this average conversion, the input value for the model was 1.44 t C ha−1, of which 0.43 C ha−1 was allocated as above-ground input and 1.01 C ha−1 as below-ground input.
Agroforestry and Improved Fallow
Agroforestry, including improved fallow, was considered a mitigation potential for all climate regions.
Based on the literature research, the input value for the RothC model concerning improved fallow is found to be simi-lar to that of other agroforestry systems. Take for instance, the following:
In Zambia, improved fallows in maize systems with several nitrogen-fi xing tree species (both coppiced and noncoppiced) resulted in above-ground carbon inputs of 2.8 tC/ha on average (Kaonga and Coleman 2008).
In Asia, the introduction of the mungbean (Vigna radiata) as a grain legume in the short fallow of the wheat-rice system produced a total biomass of 4.5 t d.m./ha (Yaqub et al. 2010).
In Mexico, the use of several varieties of mucuna (Mucuna pruriens) in rotation with maize produced on average 6.8 t d.m./ha (Eilittä et al. 2003).
Compared to green manure/cover crops, a robust average input value was used based on input values from various studies for tropical and temperate climate regions, covering a wide range of different agroforestry practices such as al-ley cropping, trees on cropland, and so forth (Oelbermann, Voroney, and Gordon 2005a, 2005b; Gama-Rodrigues and Antonio 2011). Based on this, the input value for tropical and temperate agroforestry systems averaged 2.3 tC/ha and 1.06 tC/ha, respectively. These values represent the organic input
from trees to the soil, either as litter or through pruning and mulching.
B.3 APPLICATION TO WORLD REGIONS
Africa
In Africa, crop yields have remained stagnant for decades due to continuous depletion of soil organic matter over time from unsustainable practices. To reverse this situation, sus-tainable practices such as cover cropping, water harvesting, agroforestry, and water and nutrient management to improve soil carbon sequestration, increase yields, and enhance resil-ience to climate change need to be adopted.
Agroforestry options that produce high-value crops and ad-ditional sources of farm revenues offer additional mitigation benefi ts. In general, the best package of practices for soil carbon sequestration for the region consists of a combina-tion of manure application, fertilizer application, and residue management.
There is a signifi cant trade-off between residues on the fi eld versus residues used for livestock feeding. Therefore, 50 percent residue retention was assumed, and the remain-ing 50 percent was assumed to be removed as animal feed. All mapping units (see page 45) in Africa were considered for the modeling. A residue management scenario of 50 per-cent of available residues per ha was modeled for each of the main crops in Africa. In addition, manure management (direct and composting), green manuring, and agroforestry were modeled for each cluster.
Asia
In many areas, the most dominant farming system is inten-sive wetland rice cultivation with or without irrigation. Rice is grown in the wet season under dry land farming. In the dry season, a second crop of rice (where irrigated) or another less water–demanding crop (legumes and coarse grains) is grown. Apart from rice, mixed smallholder farming systems are dominant (soybean, maize, wheat, and roots and tubers) with currently low input (organic and inorganic), apart from Southeast Asian countries.
Like Africa, there exists a signifi cant trade-off between resi-dues on the fi eld versus residues used for livestock feeding. All mapping units in Asia were considered for the modeling. A residue management scenario of 50 percent of available residues per ha was modeled for each of the main crops in Asia. In addition, manure management (direct and compost-ing), green manuring, and agroforestry were modeled for each of the strata.

69
ECONOMIC AND SECTOR WORK
APPENDIX B — GENERAL SCENARIO ASSUMPTIONS AND APPLICATION FOR WORLD REGIONS
South America
Several agricultural systems exist in South America. The agricultural systems found in the mapping units/stratum are displayed in Table B.1.
Common land management practices in South America in-clude rotational wheat/soybean and fallow systems, maize and soybean systems with residue management, and tillage. The use of a cover crop during the fallow period was iden-tifi ed as a promising mitigation opportunity. No-tillage was identifi ed as another mitigation option. Residue manage-ment in rice systems was modeled. No-tillage in soybean/maize systems was modeled and applied to the area where soybeans and maize are grown. Cover crop was modeled and applied to the total area of crops for which green manur-ing is practiced.
Central America
The most dominant agricultural systems in Central America are sorghum, beans/maize, rice, and agroforestry (table B.2).
Compared to South America, cover crops and residue man-agement of rice-based systems were identifi ed as mitigation options.
North America
The dominant crops in mapping unit 1 are barley, wheat, soy-bean, maize, and pulses. Those in zone 3 are barley, wheat, soybean, maize, pulses, and sorghum. In zone 7, wheat, soy-bean, and maize predominate. Crops are mostly cultivated during the summer with bare fallow during the winter. In recent years, no-tillage has been adopted by many produc-ers, but there are still opportunities to increase its use. No-tillage was considered a mitigation option in 50 percent of the cropped area. Green manure using winter cover crops during the fallow period was also modeled.
Oceania
The main crops are wheat, barley, and pulses cultivated as winter crops and usually in rotations. No-tillage is used in
TABLE B.1: Agricultural Systems and Mitigation Scenario in South America
MAPPING UNIT/STRATUM
WHEATSOYBEAN
MAIZESOYBEAN
MAIZEBEANSMAIZE RICE AGROFORESTRY
2
4
6
8
9
12
Mitigation options Cover crop Cover crop no-tillage Cover crop Cover cropresidue management
Source: This study.
TABLE B.2: Agricultural Systems and Mitigation Scenario in Central America
MAPPING UNIT/STRATUM SORGHUM
BEANSMAIZE RICE AGROFORESTRY
2
4
6
9
10
12
Mitigation options Cover crop Cover cropResidue management
Source: This study.
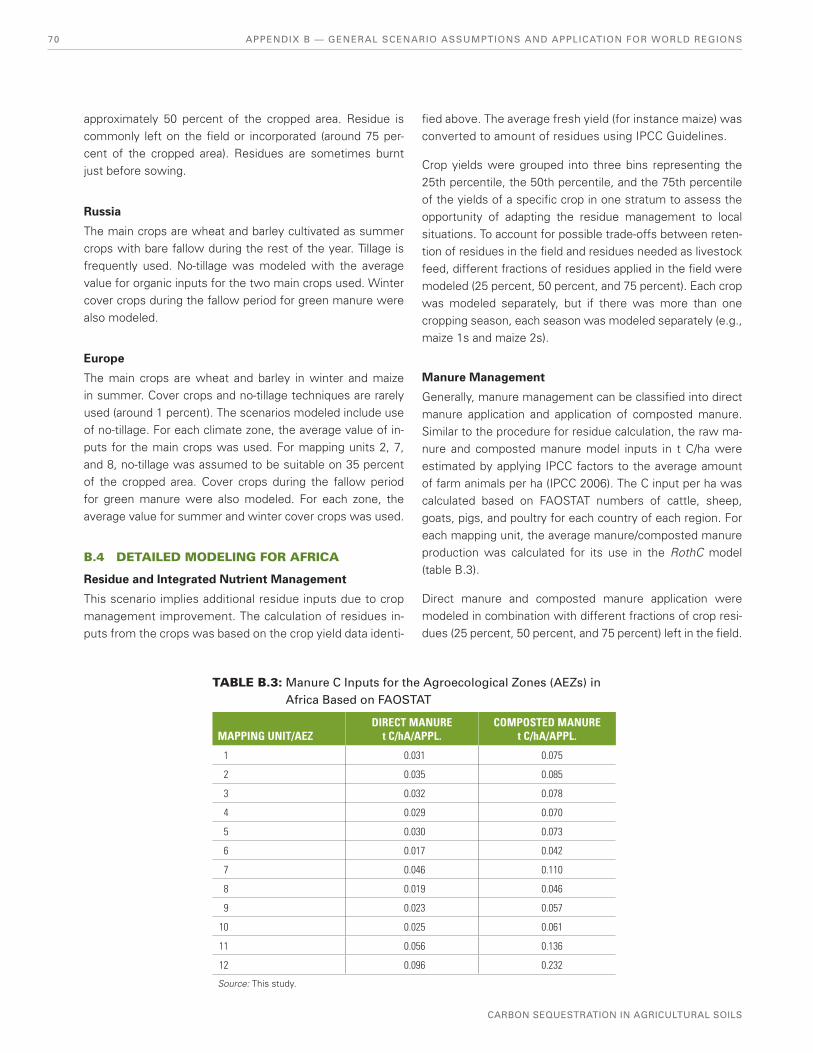
70
CARBON SEQUESTRATION IN AGRICULTURAL SOILS
APPENDIX B — GENERAL SCENARIO ASSUMPTIONS AND APPLICATION FOR WORLD REGIONS
approximately 50 percent of the cropped area. Residue is commonly left on the fi eld or incorporated (around 75 per-cent of the cropped area). Residues are sometimes burnt just before sowing.
Russia
The main crops are wheat and barley cultivated as summer crops with bare fallow during the rest of the year. Tillage is frequently used. No-tillage was modeled with the average value for organic inputs for the two main crops used. Winter cover crops during the fallow period for green manure were also modeled.
Europe
The main crops are wheat and barley in winter and maize in summer. Cover crops and no-tillage techniques are rarely used (around 1 percent). The scenarios modeled include use of no-tillage. For each climate zone, the average value of in-puts for the main crops was used. For mapping units 2, 7, and 8, no-tillage was assumed to be suitable on 35 percent of the cropped area. Cover crops during the fallow period for green manure were also modeled. For each zone, the average value for summer and winter cover crops was used.
B.4 DETAILED MODELING FOR AFRICA
Residue and Integrated Nutrient Management
This scenario implies additional residue inputs due to crop management improvement. The calculation of residues in-puts from the crops was based on the crop yield data identi-
fi ed above. The average fresh yield (for instance maize) was converted to amount of residues using IPCC Guidelines.
Crop yields were grouped into three bins representing the 25th percentile, the 50th percentile, and the 75th percentile of the yields of a specifi c crop in one stratum to assess the opportunity of adapting the residue management to local situations. To account for possible trade-offs between reten-tion of residues in the fi eld and residues needed as livestock feed, different fractions of residues applied in the fi eld were modeled (25 percent, 50 percent, and 75 percent). Each crop was modeled separately, but if there was more than one cropping season, each season was modeled separately (e.g., maize 1s and maize 2s).
Manure Management
Generally, manure management can be classifi ed into direct manure application and application of composted manure. Similar to the procedure for residue calculation, the raw ma-nure and composted manure model inputs in t C/ha were estimated by applying IPCC factors to the average amount of farm animals per ha (IPCC 2006). The C input per ha was calculated based on FAOSTAT numbers of cattle, sheep, goats, pigs, and poultry for each country of each region. For each mapping unit, the average manure/composted manure production was calculated for its use in the RothC model (table B.3).
Direct manure and composted manure application were modeled in combination with different fractions of crop resi-dues (25 percent, 50 percent, and 75 percent) left in the fi eld.
TABLE B.3: Manure C Inputs for the Agroecological Zones (AEZs) in Africa Based on FAOSTAT
MAPPING UNIT/AEZDIRECT MANURE
t C/hA/APPL.COMPOSTED MANURE
t C/hA/APPL.
1 0.031 0.075
2 0.035 0.085
3 0.032 0.078
4 0.029 0.070
5 0.030 0.073
6 0.017 0.042
7 0.046 0.110
8 0.019 0.046
9 0.023 0.057
10 0.025 0.061
11 0.056 0.136
12 0.096 0.232
Source: This study.

71
ECONOMIC AND SECTOR WORK
APPENDIX B — GENERAL SCENARIO ASSUMPTIONS AND APPLICATION FOR WORLD REGIONS
Green Manure/Cover Crops (GMCCS)
Based on a study by Barahona (2004), the largest share of GMCCs worldwide is from Africa (51 percent) with maize cropping systems being the most dominant (66 percent). Other main crops include cassava and sorghum. The most frequently used GMCCs are Mucuna sp., Cowpeas, pigeon peas, and groundnuts. The following GMCCs scenarios are considered for the modeling:
Mucuna sp.: An input value of 3.27 t C/ha/year was used for the modeling in all strata based on Kaizzi et al. (2006) and Anthofer (2005). The activity data for this scenario are potentially the area of all crops.
Cowpea + maize and cowpea + sorghum: This scenario assumes that cowpeas are predominantly inter-cropped with maize and sorghum. The input values are the strata-specifi c combinations of crop residues of cowpeas in addition to the residues of maize and sorghum, respectively. Only mean values of residues
were used for the modeling. The activity data were the crop areas of maize and sorghum.
Groundnuts + maize and groundnuts + sorghum: This sce-nario assumes that groundnuts are intercropped with maize and sorghum. The input values are the strata-specifi c combinations of crop residues of groundnuts in addition to the residues of maize and sorghum, respectively. Only the mean values of residues were used for the modeling. The activity data are the crop areas of maize and sorghum. The input values are shown in table B.4.
Agroforestry, Improved Fallow, and Land Rehabilitation
Five different agroforestry mitigation scenarios were consid-ered in this study.
The General Agroforestry Mitigation Scenario
This scenario can be seen as representative for all agrofor-estry systems on cropland. The input values were calculated
FIGURE B.1: FAO Land-Use Map
FAO Land use systemUndefined
1 Forestry-no use/not managed (Natural)
10 Herbaceous-mod. intensive pastoralism
11 Herbaceous-intensive pastoralism
13 Rainfed agriculture (subsistence/commercial)
14 Agro-pastoralism mod. intensive
15 Agro-pastoralism intensive
16 Agro-pastoralism mod. intensive or higher with large scale irrigation
17 Agriculture-large scale irrigation (>25% pixel size)
18 Agriculture-protected areas
19 Urban areas
20 Wetlands-no use/not managed (Natural)
21 Wetlands-protected areas
2 Forestry-protected areas
4 Forestry-pastoralism moderate or higher
5 Forestry-pastoralism moderate or higher with scattered plantations
6 Forestry-scattered plantations
7 Herbaceous-no use/not managed (Natural)
8 Herbaceous-protected areas
9 Herbaceous-extensive pastoralism
Source: FAO and World Bank.
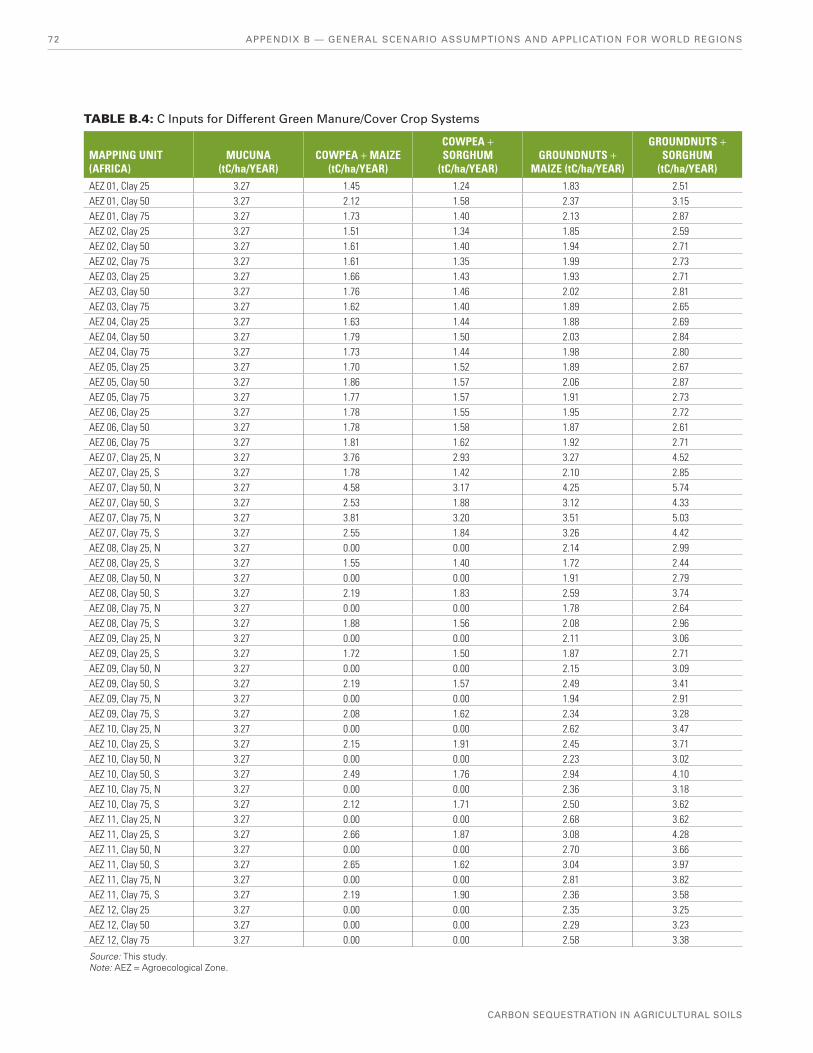
72
CARBON SEQUESTRATION IN AGRICULTURAL SOILS
APPENDIX B — GENERAL SCENARIO ASSUMPTIONS AND APPLICATION FOR WORLD REGIONS
TABLE B.4: C Inputs for Different Green Manure/Cover Crop Systems
MAPPING UNIT (AFRICA)
MUCUNA (tC/ha/YEAR)
COWPEA + MAIZE (tC/ha/YEAR)
COWPEA + SORGHUM
(tC/ha/YEAR)GROUNDNUTS +
MAIZE (tC/ha/YEAR)
GROUNDNUTS + SORGHUM
(tC/ha/YEAR)AEZ 01, Clay 25 3.27 1.45 1.24 1.83 2.51AEZ 01, Clay 50 3.27 2.12 1.58 2.37 3.15AEZ 01, Clay 75 3.27 1.73 1.40 2.13 2.87AEZ 02, Clay 25 3.27 1.51 1.34 1.85 2.59AEZ 02, Clay 50 3.27 1.61 1.40 1.94 2.71AEZ 02, Clay 75 3.27 1.61 1.35 1.99 2.73AEZ 03, Clay 25 3.27 1.66 1.43 1.93 2.71AEZ 03, Clay 50 3.27 1.76 1.46 2.02 2.81AEZ 03, Clay 75 3.27 1.62 1.40 1.89 2.65AEZ 04, Clay 25 3.27 1.63 1.44 1.88 2.69AEZ 04, Clay 50 3.27 1.79 1.50 2.03 2.84AEZ 04, Clay 75 3.27 1.73 1.44 1.98 2.80AEZ 05, Clay 25 3.27 1.70 1.52 1.89 2.67AEZ 05, Clay 50 3.27 1.86 1.57 2.06 2.87AEZ 05, Clay 75 3.27 1.77 1.57 1.91 2.73AEZ 06, Clay 25 3.27 1.78 1.55 1.95 2.72AEZ 06, Clay 50 3.27 1.78 1.58 1.87 2.61AEZ 06, Clay 75 3.27 1.81 1.62 1.92 2.71AEZ 07, Clay 25, N 3.27 3.76 2.93 3.27 4.52AEZ 07, Clay 25, S 3.27 1.78 1.42 2.10 2.85AEZ 07, Clay 50, N 3.27 4.58 3.17 4.25 5.74AEZ 07, Clay 50, S 3.27 2.53 1.88 3.12 4.33AEZ 07, Clay 75, N 3.27 3.81 3.20 3.51 5.03AEZ 07, Clay 75, S 3.27 2.55 1.84 3.26 4.42AEZ 08, Clay 25, N 3.27 0.00 0.00 2.14 2.99AEZ 08, Clay 25, S 3.27 1.55 1.40 1.72 2.44AEZ 08, Clay 50, N 3.27 0.00 0.00 1.91 2.79AEZ 08, Clay 50, S 3.27 2.19 1.83 2.59 3.74AEZ 08, Clay 75, N 3.27 0.00 0.00 1.78 2.64AEZ 08, Clay 75, S 3.27 1.88 1.56 2.08 2.96AEZ 09, Clay 25, N 3.27 0.00 0.00 2.11 3.06AEZ 09, Clay 25, S 3.27 1.72 1.50 1.87 2.71AEZ 09, Clay 50, N 3.27 0.00 0.00 2.15 3.09AEZ 09, Clay 50, S 3.27 2.19 1.57 2.49 3.41AEZ 09, Clay 75, N 3.27 0.00 0.00 1.94 2.91AEZ 09, Clay 75, S 3.27 2.08 1.62 2.34 3.28AEZ 10, Clay 25, N 3.27 0.00 0.00 2.62 3.47AEZ 10, Clay 25, S 3.27 2.15 1.91 2.45 3.71AEZ 10, Clay 50, N 3.27 0.00 0.00 2.23 3.02AEZ 10, Clay 50, S 3.27 2.49 1.76 2.94 4.10AEZ 10, Clay 75, N 3.27 0.00 0.00 2.36 3.18AEZ 10, Clay 75, S 3.27 2.12 1.71 2.50 3.62AEZ 11, Clay 25, N 3.27 0.00 0.00 2.68 3.62AEZ 11, Clay 25, S 3.27 2.66 1.87 3.08 4.28AEZ 11, Clay 50, N 3.27 0.00 0.00 2.70 3.66AEZ 11, Clay 50, S 3.27 2.65 1.62 3.04 3.97AEZ 11, Clay 75, N 3.27 0.00 0.00 2.81 3.82AEZ 11, Clay 75, S 3.27 2.19 1.90 2.36 3.58AEZ 12, Clay 25 3.27 0.00 0.00 2.35 3.25AEZ 12, Clay 50 3.27 0.00 0.00 2.29 3.23AEZ 12, Clay 75 3.27 0.00 0.00 2.58 3.38
Source: This study.Note: AEZ = Agroecological Zone.

73
ECONOMIC AND SECTOR WORK
APPENDIX B — GENERAL SCENARIO ASSUMPTIONS AND APPLICATION FOR WORLD REGIONS
TABLE B.5: C Inputs for Different Agroforestry Systems
MAPPING UNIT (AFRICA)
AGROFORESTRY GENERAL
(tC/ha/YEAR)
COFFEE AND COCOA SHADE TREE
SYSTEMS (tC/ha/YEAR)
LEGUME IMPROVED FALLOW + MAIZE
(tC/ha/YEAR)
COPPICED IMPROVED
FALLOW + MAIZE (tC/ha/YEAR)
LAND REHABILITATION
(tC/ha/YEAR)AEZ 01, Clay 25 1.58 8.19 2.85 4.35 3.843AEZ 01, Clay 50 1.58 8.19 3.27 4.77 3.843AEZ 01, Clay 75 1.58 8.19 3.03 4.53 3.843AEZ 02, Clay 25 5.17 8.19 2.86 4.36 3.843AEZ 02, Clay 50 5.17 8.19 2.94 4.44 3.843AEZ 02, Clay 75 5.17 8.19 2.95 4.45 3.843AEZ 03, Clay 25 5.17 8.19 2.96 4.46 3.843AEZ 03, Clay 50 5.17 8.19 3.05 4.55 3.843AEZ 03, Clay 75 5.17 8.19 2.93 4.43 3.843AEZ 04, Clay 25 5.17 8.19 2.95 4.45 3.843AEZ 04, Clay 50 5.17 8.19 3.05 4.55 3.843AEZ 04, Clay 75 5.17 8.19 3.06 4.56 3.843AEZ 05, Clay 25 5.17 8.19 2.91 4.41 3.843AEZ 05, Clay 50 5.17 8.19 3.04 4.54 3.843AEZ 05, Clay 75 5.17 8.19 2.97 4.47 3.843AEZ 06, Clay 25 5.17 8.19 2.94 4.44 3.843AEZ 06, Clay 50 5.17 8.19 2.89 4.39 3.843AEZ 06, Clay 75 5.17 8.19 2.92 4.42 3.843AEZ 07, Clay 25, N 1.58 8.19 4.03 5.53 3.843AEZ 07, Clay 25, S 1.58 8.19 3.05 4.55 3.843AEZ 07, Clay 50, N 1.58 8.19 4.85 6.35 3.843AEZ 07, Clay 50, S 1.58 8.19 3.80 5.30 3.843AEZ 07, Clay 75, N 1.58 8.19 4.08 5.58 3.843AEZ 07, Clay 75, S 1.58 8.19 3.83 5.33 3.843AEZ 08, Clay 25, N 1.58 8.19 3.09 4.59 3.843AEZ 08, Clay 25, S 5.17 8.19 2.82 4.32 3.843AEZ 08, Clay 50, N 1.58 8.19 2.95 4.45 3.843AEZ 08, Clay 50, S 5.17 8.19 3.46 4.96 3.843AEZ 08, Clay 75, N 1.58 8.19 2.81 4.31 3.843AEZ 08, Clay 75, S 5.17 8.19 3.15 4.65 3.843AEZ 09, Clay 25, N 1.58 8.19 3.06 4.56 3.843AEZ 09, Clay 25, S 5.17 8.19 3.01 4.51 3.843AEZ 09, Clay 50, N 1.58 8.19 3.14 4.64 3.843AEZ 09, Clay 50, S 5.17 8.19 3.48 4.98 3.843AEZ 09, Clay 75, N 5.17 8.19 2.92 4.42 3.843AEZ 09, Clay 75, S 5.17 8.19 3.35 4.85 3.843AEZ 10, Clay 25, N 5.17 8.19 3.44 4.94 3.843AEZ 10, Clay 25, S 5.17 8.19 3.46 4.96 3.843AEZ 10, Clay 50, N 5.17 8.19 3.08 4.58 3.843AEZ 10, Clay 50, S 5.17 8.19 3.83 5.33 3.843AEZ 10, Clay 75, N 5.17 8.19 3.22 4.72 3.843AEZ 10, Clay 75, S 5.17 8.19 3.47 4.97 3.843AEZ 11, Clay 25, N 5.17 8.19 3.72 5.22 3.843AEZ 11, Clay 25, S 5.17 8.19 3.94 5.44 3.843AEZ 11, Clay 50, N 5.17 8.19 3.75 5.25 3.843AEZ 11, Clay 50, S 5.17 8.19 3.91 5.41 3.843AEZ 11, Clay 75, N 5.17 8.19 3.86 5.36 3.843AEZ 11, Clay 75, S 5.17 8.19 3.46 4.96 3.843AEZ 12, Clay 25 5.17 8.19 3.40 4.90 3.843AEZ 12, Clay 50 5.17 8.19 3.33 4.83 3.843AEZ 12, Clay 75 5.17 8.19 3.62 5.12 3.843Source: This study.Note: AEZ = Agroecological Zone.

74
CARBON SEQUESTRATION IN AGRICULTURAL SOILS
APPENDIX B — GENERAL SCENARIO ASSUMPTIONS AND APPLICATION FOR WORLD REGIONS
as mean values of more than 30 different systems taking into account different climate regions (humid, subhumid, and semi-arid) (see Schroeder 1995; Oelbermann, Voroney, and Kass 2005a, 2005b; and Lemma et al., 2006). It is modeled for all areas classifi ed as FAO Land Use System 13-18 (i.e., rain-fed agriculture, agro-pastoralism, and irrigated agricul-ture) (see Figure B.1).
Perennial Crop—Tree Systems
This scenario considered two cash crops: coffee and cocoa. It assumes combinations of improved perennial crop manage-ment (pruning and mulching) and the introduction of shade trees (see Szott, Palm, and Sanchez 1991; Szott, Fernandez, and Sanchez 1991; van Noordwijk et al. 2002; and Dossa et al., 2008).
Improved Fallows + Maize
Improved fallows, in which leguminous trees and coppiced trees and shrubs are grown in association with crops, can sequester substantial amounts of C in plants and the soil. Following a study by Kaonga and Coleman (2008), two im-proved fallow scenarios were modeled in association with maize.
Legume improved fallow + maize: This system assumes a 2-year fallow period and a 1-year trees and maize period. The tree species considered are Tephrosia vogelli, Cajanus cajan, and Sesbania sesban.
Coppiced improved fallow + maize: This system assumes a 3-year fallow period and a 7-year trees and maize period. The tree species considered are Gliricidia sepium, Callliandra callothyrsus, and Senna siamea.
The input values from the trees are mean values of the dif-ferent tree species. In addition, the mapping unit-specifi c maize residues were included as organic inputs in this sys-tem (mean residues of maize). The input values represent the mean annual input values over the whole system (fallow and cropping period). These two mitigation scenarios were modeled for all maize areas.
Land Rehabilitation
Land degradation may be defi ned as the long-term loss of ecosystem function and productivity caused by disturbances from which land cannot recover unaided. Due to the non-availability of reliable spatial data of degraded lands in Africa, the mitigation potential was applied to the FAO Land Use Systems 7-11 (herbaceous land-use systems in Figure B.1). The input value is based on organic inputs from tree-domi-nated fallow systems (Szott et al. 1994). The C inputs for the fi ve agroforestry systems are shown in table B.5.
REFERENCE
Young, A. 1997. Agroforestry for soil management. CAB International, Wallingford, UK

75
ECONOMIC AND SECTOR WORK
APPENDIX C — GLOBAL CROP YIELDS (T HA–1 YR–1) GROUPED INTO 25TH, 50TH, AND 75TH PERCENTILE BINS
BARLEY
STRATUM LOW MEDIUM HIGH(Leer) 1.45 2.72 3.99
10South America 1.97 2.42 2.86
11Asia 0.99 1.58 2.17
11Oceania 2.55 2.61 2.66
12South America 0.61 1.29 1.98
1Asia 1.26 1.52 1.78
1North America 2.50 2.70 2.90
1Russia 1.73 1.73 1.73
2Africa 0.56 1.22 1.87
2Asia 1.35 1.98 2.61
2Europe 1.92 2.42 2.92
2North America 3.42 4.60 5.77
2Oceania 1.79 2.02 2.24
2South America 2.47 2.52 2.56
3Africa 0.63 0.99 1.36
3Asia 1.33 1.92 2.52
3Europe 1.63 2.06 2.49
3North America 2.21 2.78 3.35
3Oceania 2.41 2.55 2.69
3Russia 1.63 1.75 1.88
3South America 1.06 1.15 1.23
4Africa 0.81 1.11 1.41
4Asia 0.93 1.10 1.27
Appendix C: GLOBAL CROP YIELDS (T HA–1 YR–1) GROUPED INTO 25TH, 50TH, AND 75TH PERCENTILE BINS CORRESPONDING TO LOW, MEDIUM, AND HIGH
STRATUM LOW MEDIUM HIGH4North America 3.16 4.13 5.11
4South America 0.69 0.70 0.70
5Asia 0.92 1.37 1.83
5Europe 2.38 2.70 3.02
6Africa 0.97 1.21 1.45
6Asia 1.18 1.89 2.59
6North America 1.15 2.08 3.02
6South America 0.97 1.36 1.75
7Africa 0.71 1.03 1.35
7Asia 2.19 2.79 3.38
7Europe 3.98 4.97 5.96
7North America 3.18 3.60 4.02
7Oceania 3.26 4.29 5.31
7Russia 1.58 1.69 1.81
8Asia 2.14 2.70 3.26
8Europe 2.83 3.60 4.37
8North America 3.50 3.80 4.10
8Oceania 3.47 4.45 5.44
8South America 1.81 2.04 2.26
9Africa 1.33 1.51 1.68
9Asia 1.10 1.16 1.22
9Middle America 0.86 1.35 1.83
9South America 0.56 0.69 0.83

76
CARBON SEQUESTRATION IN AGRICULTURAL SOILS
APPENDIX C — GLOBAL CROP YIELDS (T HA–1 YR–1) GROUPED INTO 25TH, 50TH, AND 75TH PERCENTILE BINS
BEANS
STRATUM LOW MEDIUM HIGH10Africa 0.49 0.65 0.81
10Asia 0.81 0.98 1.15
10Middle America 0.39 0.44 0.50
10South America 0.94 1.24 1.53
11Africa 0.67 0.86 1.04
11Asia 0.75 0.98 1.21
11South America 1.05 1.11 1.17
12Africa 0.49 0.68 0.87
12Asia 0.77 0.82 0.87
12Middle America 0.67 0.78 0.89
12South America 0.67 0.84 1.02
1Asia 1.41 1.47 1.53
1North America 1.60 1.76 1.92
1Russia 1.46 1.46 1.46
2Africa 0.45 0.93 1.40
2Asia 0.52 0.64 0.76
2Europe 0.54 0.87 1.20
2North America 0.76 1.28 1.79
2Oceania 1.03 1.13 1.22
2South America 0.83 1.16 1.48
3Africa 0.58 0.83 1.08
3Asia 1.15 1.36 1.57
3Europe 0.88 1.24 1.60
3North America 1.44 1.78 2.12
3Oceania 1.04 1.09 1.13
3Russia 1.45 1.46 1.47
3South America 0.93 1.03 1.12
STRATUM LOW MEDIUM HIGH4Africa 0.23 0.37 0.51
4Asia 0.48 0.57 0.66
4Middle America 0.70 0.78 0.86
4North America 0.86 1.20 1.54
4South America 0.17 0.32 0.47
5Asia 1.19 1.37 1.54
6Africa 0.50 0.67 0.84
6Asia 0.71 0.92 1.13
6Middle America
0.55 0.69 0.82
6North America 0.43 0.65 0.86
6South America 0.70 0.94 1.18
7Africa 0.42 0.54 0.67
7Asia 0.99 1.22 1.45
7Europe 3.15 3.86 4.56
7North America 1.56 1.71 1.86
7Oceania 0.92 1.35 1.79
7Russia 0.81 0.86 0.92
8Asia 0.73 0.99 1.25
8Europe 2.19 3.39 4.60
8Oceania 1.36 2.02 2.67
8South America 0.73 0.96 1.19
9Africa 0.39 0.54 0.68
9Asia 0.61 0.71 0.80
9Middle America 0.62 0.74 0.87
9North America 0.47 0.55 0.64
9South America 0.36 0.72 1.08

77
ECONOMIC AND SECTOR WORK
APPENDIX C — GLOBAL CROP YIELDS (T HA–1 YR–1) GROUPED INTO 25TH, 50TH, AND 75TH PERCENTILE BINS
MAIZE
STRATUM LOW MEDIUM HIGH
10Africa 0.72 0.89 1.06
10Asia 1.85 2.35 2.86
10Middle America
0.84 1.00 1.16
10South America 1.88 2.98 4.08
11Africa 1.94 3.69 5.43
11Asia 1.88 2.59 3.29
11South America 3.28 4.20 5.12
12Africa 0.66 0.75 0.85
12Asia 1.52 2.11 2.70
12Middle America
1.26 1.84 2.42
12South America 2.02 2.68 3.35
1Asia 4.85 5.81 6.78
1North America 6.30 7.17 8.05
2Africa 1.04 2.53 4.02
2Asia 0.95 1.83 2.70
2Europe 6.12 7.96 9.80
2North America 3.56 6.34 9.12
2Oceania 3.73 5.79 7.86
2South America 4.29 5.59 6.89
3Africa 1.42 2.54 3.66
3Asia 3.82 4.80 5.77
3Europe 2.61 3.82 5.02
3North America 6.44 7.96 9.49
3South America 2.32 3.88 5.44
4Africa 0.83 1.15 1.47
STRATUM LOW MEDIUM HIGH
4Asia 1.15 1.65 2.14
4Middle America 0.78 1.16 1.54
4North America 1.01 1.88 2.75
4South America 0.68 1.38 2.08
5Asia 3.89 4.44 4.99
6Africa 0.84 1.60 2.35
6Asia 2.08 2.87 3.66
6Middle America 1.36 1.70 2.03
6North America 1.23 2.27 3.31
6South America 1.64 2.50 3.35
7Africa 1.55 2.54 3.54
7Asia 3.26 4.11 4.97
7Europe 5.44 7.10 8.76
7North America 6.42 7.53 8.65
7Russia 2.73 3.23 3.73
8Africa 3.86 5.16 6.45
8Asia 2.19 2.96 3.73
8Europe 4.46 6.25 8.04
8North America 5.40 6.38 7.37
8Oceania 6.54 8.28 10.02
8South America 3.33 4.58 5.83
9Africa 0.92 1.22 1.52
9Asia 1.78 2.49 3.21
9Middle America 1.22 1.64 2.05
9North America 0.93 1.45 1.96
9South America 1.56 2.48 3.41
MILLET
STRATUM LOW MEDIUM HIGH
11Asia 1.06 1.18 1.30
1Asia 0.88 1.21 1.54
2Africa 0.34 0.54 0.75
2Asia 0.39 0.67 0.95
2North America 1.05 1.12 1.20
3Africa 0.57 0.59 0.62
3Asia 1.67 1.81 1.96
3Europe 0.79 0.88 0.97
3North America 1.23 1.43 1.62
STRATUM LOW MEDIUM HIGH
4Africa 0.34 0.56 0.79
4Asia 0.53 0.82 1.11
5Asia 1.41 1.50 1.58
6Africa 0.62 0.94 1.26
6Asia 0.55 0.72 0.89
7Asia 1.43 1.71 1.99
8Asia 0.62 0.90 1.18
9Africa 0.80 1.03 1.26
9Asia 0.66 0.92 1.18

CARBON SEQUESTRATION IN AGRICULTURAL SOILS
78 APPENDIX C — GLOBAL CROP YIELDS (T HA–1 YR–1) GROUPED INTO 25TH, 50TH, AND 75TH PERCENTILE BINS
RICE
STRATUM LOW MEDIUM HIGH
10Africa 1.75 2.17 2.59
10Asia 3.29 3.83 4.37
10Middle America 2.40 3.22 4.05
10South America 2.97 4.70 6.44
11Asia 2.83 4.25 5.68
12Africa 1.33 1.62 1.92
12Asia 2.58 3.14 3.70
12Middle America 2.31 3.42 4.53
12South America 2.79 3.74 4.68
1Asia 5.73 6.77 7.82
2Africa 4.15 6.39 8.63
2Asia 2.30 3.05 3.81
2Europe 6.23 6.69 7.15
2North America 7.54 8.29 9.04
2Oceania 8.78 8.93 9.07
2South America 4.33 5.24 6.15
3Asia 3.44 4.91 6.38
3Europe 3.43 4.50 5.57
3North America 9.22 9.27 9.33
3Russia 3.14 3.14 3.14
3South America 5.46 6.18 6.90
4Africa 0.84 1.56 2.28
4Asia 1.62 2.54 3.46
4Middle America 2.66 3.42 4.18
4North America 4.79 5.71 6.64
4South America 2.60 3.71 4.82
5Asia 4.45 4.90 5.36
6Africa 1.36 2.04 2.72
6Asia 3.75 4.99 6.23
6Middle America 3.66 4.37 5.09
6North America 5.39 5.89 6.38
6South America 3.57 4.94 6.30
7Asia 5.17 6.19 7.21
7Europe 5.97 6.34 6.70
7North America 6.35 6.57 6.79
7Russia 3.32 4.05 4.78
8Asia 4.26 5.45 6.63
8Europe 6.01 6.08 6.14
8North America 5.74 6.26 6.77
8South America 4.28 4.97 5.67
9Africa 1.19 1.64 2.09
9Asia 2.38 3.09 3.79
9Middle America 2.65 3.39 4.13
9South America 1.43 2.54 3.66
SORGHUM
STRATUM LOW MEDIUM HIGH
10South America 3.13 3.20 3.27
11Africa 0.73 1.43 2.12
11Asia 0.78 1.90 3.01
11Oceania 2.91 3.18 3.44
12South America 2.37 2.85 3.34
1Asia 3.93 4.12 4.31
2Africa 0.59 1.69 2.80
2Asia 0.45 0.62 0.80
2Middle America 0.70 0.70 0.70
2North America 2.45 3.10 3.75
2Oceania 2.18 2.69 3.21
2South America 4.26 4.55 4.84
3Africa 1.02 1.67 2.33
3Asia 3.08 3.53 3.98
3North America 3.16 3.59 4.01
3Oceania 2.23 2.91 3.59
4Africa 0.51 0.74 0.96
4Asia 0.58 0.80 1.02
4Middle America 0.70 0.70 0.70
4North America 1.61 2.64 3.67
4South America 0.64 1.10 1.56
5Asia 3.81 3.81 3.81
6Africa 0.89 1.24 1.60
6Asia 0.48 0.82 1.16
6Middle America 0.55 1.13 1.71
6North America 4.49 5.52 6.54
6South America 1.60 2.16 2.72
7Asia 3.22 3.70 4.19
7North America 4.48 4.95 5.42
7Oceania 3.26 3.52 3.78
8Asia 0.38 0.77 1.17
8North America 4.20 4.68 5.17
8Oceania 2.24 2.78 3.31
8South America 4.13 4.54 4.96
9Africa 0.81 1.02 1.23
9Asia 0.71 0.95 1.18
9Middle America 0.94 1.54 2.15
9North America 1.45 2.07 2.69
9South America 1.75 2.13 2.51

79
ECONOMIC AND SECTOR WORK
APPENDIX C — GLOBAL CROP YIELDS (T HA–1 YR–1) GROUPED INTO 25TH, 50TH, AND 75TH PERCENTILE BINS
SOYBEANS
STRATUM LOW MEDIUM HIGH
10Asia 1.07 1.17 1.27
10South America 2.63 2.79 2.95
11Asia 0.96 1.28 1.59
11South America 2.40 2.44 2.48
12Asia 1.08 1.16 1.25
12South America 2.35 2.55 2.76
1Asia 1.55 1.95 2.35
1North America 1.80 2.04 2.27
2Africa 1.06 1.81 2.55
2Asia 0.59 0.77 0.95
2Europe 2.23 2.56 2.88
2North America 1.84 2.11 2.39
2Oceania 1.02 1.02 1.02
2South America 2.35 2.45 2.55
3Asia 1.09 1.50 1.90
3Europe 1.46 1.98 2.50
3North America 2.21 2.52 2.83
3South America 2.33 2.34 2.35
4Africa 0.70 0.97 1.25
4Asia 0.74 1.00 1.26
STRATUM LOW MEDIUM HIGH
4North America 0.93 1.06 1.19
4South America 1.63 1.77 1.91
5Asia 1.14 1.45 1.76
6Africa 0.47 0.51 0.55
6Asia 0.98 1.49 2.01
6South America 2.19 2.46 2.72
7Asia 1.40 1.82 2.24
7Europe 2.37 2.86 3.34
7North America 2.13 2.47 2.82
7Russia 1.06 1.21 1.36
8Asia 1.13 1.60 2.07
8Europe 2.61 3.06 3.50
8North America 1.53 1.77 2.02
8Oceania 1.75 1.86 1.96
8South America 2.18 2.41 2.63
9Africa 0.61 0.75 0.89
9Asia 1.10 1.34 1.58
9Middle America 1.69 1.83 1.97
9North America 1.31 1.31 1.31
9South America 2.04 2.29 2.55

WHEAT
STRATUM LOW MEDIUM HIGH
10Asia 1.56 1.74 1.92
10South America 1.95 2.22 2.49
11Africa 1.38 2.28 3.18
11Asia 1.41 1.87 2.33
11Oceania 2.10 2.27 2.44
11South America 2.19 2.30 2.42
12South America 1.48 1.71 1.95
1Asia 0.92 1.48 2.04
1North America 1.98 2.20 2.42
1Russia 1.06 1.26 1.46
2Africa 0.97 2.08 3.19
2Asia 1.72 2.36 3.00
2Europe 1.85 2.41 2.96
2North America 1.76 2.92 4.08
2Oceania 1.55 1.85 2.15
2South America 2.10 2.63 3.16
3Africa 0.96 1.72 2.48
3Asia 1.58 2.67 3.76
3Europe 1.70 2.30 2.91
3North America 1.82 2.60 3.38
3Oceania 1.69 2.03 2.36
3Russia 1.02 1.30 1.58
3South America 1.24 2.11 2.99
4Africa 0.81 1.74 2.66
4Asia 1.13 1.58 2.03
4North America 4.46 5.05 5.63
STRATUM LOW MEDIUM HIGH
4South America 0.68 0.84 1.01
5Asia 1.00 1.77 2.53
5Europe 2.66 3.01 3.36
5Russia 0.87 1.09 1.31
6Africa 1.05 1.33 1.61
6Asia 1.68 2.23 2.77
6North America 2.05 3.30 4.55
6South America 1.05 1.48 1.91
7Africa 0.83 1.23 1.64
7Asia 2.71 3.66 4.61
7Europe 4.33 5.70 7.08
7North America 3.30 3.80 4.31
7Oceania 2.64 4.01 5.39
7Russia 2.61 3.07 3.52
7South America 4.08 4.31 4.54
8Africa 6.11 6.31 6.51
8Asia 1.84 2.55 3.25
8Europe 2.70 3.51 4.32
8North America 2.96 3.29 3.62
8Oceania 2.67 4.27 5.87
8South America 1.83 2.20 2.57
9Africa 1.21 1.48 1.75
9Asia 1.56 1.92 2.29
9Middle America 1.67 1.68 1.69
9North America 1.70 1.85 1.99
9South America 1.19 1.52 1.86
Source: This study.
80 APPENDIX C — GLOBAL CROP YIELDS (T HA–1 YR–1) GROUPED INTO 25TH, 50TH, AND 75TH PERCENTILE BINS
CARBON SEQUESTRATION IN AGRICULTURAL SOILS

81
ECONOMIC AND SECTOR WORK
APPENDIX D — UNCERTAINTY ANALYSIS
Uncertainty in the RothC soil carbon modeling was estimat-ed following the adoption of Sustainable Agricultural Land Management methodology. A precision of 15 percent at the 95-percent confi dence level was chosen as the criterion for reliability.
The analysis calculates the soil model response using the model input parameters with the upper and lower confi -dence levels. The range of model responses demonstrates the sensitivity of the soil modeling. The input parameters for which the uncertainty was estimated were minimum and maximum monthly temperatures, monthly precipitation, and clay content in percent of the soil. Uncertainty analysis took place in two steps:
1. For each mapping unit, the mean values and the standard deviation for the three parameters were calculated. Thereafter, the standard error in the mean was estimated using
,pp
p
SEn
∂=
where
SEp is the standard error in the mean of parameter p in year t,
p∂ is the standard deviation of the parameter p in year t, and
np is the number of samples used to calculate the mean and standard deviation of parameter p.
In this case, np represents the total number of data points of a parameter used in this analysis for each mapping.
2. The minimum Pmin and maximum Pmax values of the confi dence interval for the mean of the parameters
pX were estimated as
min
max
1.96
1.96
p p
p p
P X SE
P X SE
= − ×
= + ×
where
Pmin is the minimum value of the parameter at the 95 percent confi dence interval,
Pmax is the maximum value of the parameter at the 95 percent confi dence interval,
SEp is the standard error in the mean of parameter p in year t, and
1.96 is the value of the cumulative normal distribu-tion at the 95-percent confi dence interval.
Twenty repetitions were selected randomly among the different scenarios and years for which SOC change values were modeled (table D.1). For each of these 20 data points, two separate models were done with the minimum and maximum values as model inputs. Carbon se-questration rates using the minimum and maximum values of the input parameters are given by PRSmin, t and PRSmax, t, respectively.
The uncertainty (UNC) in the output model was fi nally calcu-lated as
max, min, | |.
2 PRSt t
tt
PRS PRSUNC
−=
×
Appendix D: UNCERTAINTY ANALYSIS

CARBON SEQUESTRATION IN AGRICULTURAL SOILS
82 APPENDIX D — UNCERTAINTY ANALYSIS
TABLE D.1: Uncertainty Analyses Using Random Samples from the Mitigation Scenarios
SCENARIO
YEAR UNC tMAPPING UNIT YIELD BIN CROPRESIDUE
FRACTIONMITIGATION SCENARIO
AEZ01-50 50% Maize 1s 50% Residue 2012 2.3%
AEZ02-50 25% Millet 50% Residue 2014 2.1%
AEZ03-50 50% Sorghum 1s 50% Residue 2019 1.4%
AEZ04-50 50% Maize 1s 75% Residue + compost 2019 2.0%
AEZ04-50 75% Rice 2s 25% Residue + compost 2029 1.5%
AEZ06-50 50% Maize 2s 50% Residue 2025 1.5%
AEZ06-50 50% Sorghum 1s 75% Residue 2025 0.9%
AEZ06-50 50% Sorghum 2s 15% Baseline 2021 1.8%
AEZ06-50 75% Sorghum 2s 75% Residue + compost 2030 0.9%
AEZ08-50 N 75% Maize 15% Baseline 2026 6.7%
AEZ09-50 N 75% Maize 25% Residue 2016 9.3%
AEZ09-50 S 75% Maize 25% Residue 2032 2.2%
AEZ10-50 S 25% Maize 75% Residue 2020 3.9%
AEZ10-50 S 50% Maize 75% Residue 2027 6.9%
AEZ10-50 S 75% Maize 25% Residue + manure 2027 3.9%
AEZ11-50 N 25% Barley 75% Residue 2034 10.7%
AEZ11-50 N 50% Wheat 15% Baseline 2035 7.5%
AEZ11-50 N 50% Wheat 25% Residue 2017 10.8%
AEZ12-50 75% Maize 75% Residue + compost 2029 25.9%
AEZ07-50 S Mucuna Cover crop 2024 0.6%
Average: 5.1%
Source: This study.Note: UNC = Uncertainty , AEZ = Agroecological Zone.
The uncertainty ranges from below 1 percent to 26 percent with an average value of 5.1 percent.

83
ECONOMIC AND SECTOR WORK
APPENDIX E — ASSUMPTIONS FOR DERIVING THE APPLICABLE MITIGATION AREA FOR THE LAND MANAGEMENT
E.1 AFRICA
Cropland
The difference between current (table E.1) and projected cropland area (table E.2) under each of the four IPCC sce-narios was allocated to land-use and agroforestry-related land management practices in equal proportion. Tree-crop farming was projected to increase by the same proportion the entire cropland area for the continent increased for A1B and A2 (the more economic focus scenarios), but by just 15 percent under the two other scenarios that are more environ-mentally focused.
No-tillage was assumed to cover 2 percent of cropland area in the B1 and A1B scenarios, but only 1 percent in the re-maining two scenarios. About 3.6 million ha were estimated as having erosion hazard in Africa. Terracing and sloping bar-riers were applied to 75 percent of this land area in equal proportion. Sustainable biochar application was assumed for 15 percent of current tree crop area for B1 and B2 scenarios, and 15 percent of projected tree crop area for the remaining two scenarios.
Rainwater harvesting was assumed applicable to 19.5 million ha under each scenario; about 7 percent increase in potential irrigable area for 1990. The remaining cropland area under each scenario was distributed evenly among inorganic fer-tilizer, manure, cover crops, rotation diversifi cation, rotation intensifi cation, and crop residue application.
Grassland
The respective abatement rates for fertilizer, manure, im-proved pastures, pasture establishment on degraded land, and rainwater harvesting were each applied to one-sixth of projected grassland area for each of the four IPCC scenarios for the continent by 2030 (table E.2).
Asia
Cropland
The difference between current (table E.1) and the projected cropland area (table E.2) under each of the four IPCC sce-narios was allocated to land-use and agroforestry-related land management practices in equal proportion. Organic soil restoration was applied to the estimated degraded peat land area of 13 million ha for each scenario. The abatement rate for organic soil restoration was taken from Smith et al. (2008). The estimated irrigable area in Asia is 270 million ha. Two-thirds of this was applied to improved irrigation and rainwater harvesting in equal proportions. Land devoted to intensive vegetables was assumed to increase by 15 percent under the B1 and B2 scenarios, while it was assumed to in-crease by the same proportion for total cropland area under the remaining two scenarios.
Current land area under biofertilizer is 29 million ha. This was assumed to increase by 5 percent under scenarios A2 and B2 and by 6 percent under the remaining two scenarios. Biochar was applied to only 15 percent of the applicable area for each agroforestry-related practice for each scenario. No-tillage is currently practiced on 3 percent of land in Asia, and it was assumed to increase to 7 percent of current land area by 2030 for all scenarios. The remaining cropland area under each scenario was distributed evenly among inorganic fertil-izer, manure, cover crops, rotation intensifi cation, and crop residue application.
Appendix E: ASSUMPTIONS FOR DERIVING THE APPLICABLE MITIGATION AREA FOR THE LAND MANAGEMENT PRACTICES
TABLE E.1: Estimated Cropland Area in the 2000s
MILLION ha
Africa 165.8
Asia 497.4
Latin America 110.3
Source: Based on Monfreda et al. (2008).

84
CARBON SEQUESTRATION IN AGRICULTURAL SOILS
APPENDIX E — ASSUMPTIONS FOR DERIVING THE APPLICABLE MITIGATION AREA FOR THE LAND MANAGEMENT
Grassland
The respective abatement rates for fertilizer, manure, pas-ture establishment on degraded land, grazing management, rainwater harvesting, improved irrigation, cropland–to-pas-ture, and annual-to-perennial grass were each applied to one-eighth of projected grassland area for each of the four IPCC scenarios on the continent by 2030 (table E.2).
Latin America
Cropland
The difference between current (table E.1) and projected cropland area (table E.2) under each of the four IPCC scenarios was allocated to land-use and agroforestry-related land man-agement practices in equal proportion. No-tillage is currently practiced on 50 Mha. This was assumed to increase to 66 Mha under each scenario by 2030. Sustainable biochar production was assumed applicable to 30 percent of the agroforestry area in each scenario. The potential irrigable area is 77.8 Mha. Two-thirds of this was applied to improved irrigation and rainwater harvesting in equal proportions. The remaining cropland area under each scenario was distributed evenly among manure, residue, cover crops, rotation intensifi cation, and diversifi cation.
Grassland
The respective abatement rates for manure, pasture estab-lishment on degraded land, grazing management, rainwater harvesting, improved irrigation, cropland–to-pasture, and an-nual-to-perennial grass were each applied to one-seventh of projected grassland area for each of the four IPCC scenarios continents by 2030 (table E.2).
REFERENCES
Anthofer J., and Kroschel J. 2005. “Above-Ground Biomass, Nutrients, and Persistence of an Early and Late Maturing Mucuna Variety in the Forest-Savannah Transitional Tone of Ghana.” Agriculture, Ecosystems, and Environment 110: 59–77.
Barahona, M. F., Janssen, M. 2004. Green Manure/Cover Crop Systems of Smallholder Farmers, ed. M. Eilittä et al. Kluwer Academic Publishers, Dordrecht, The Netherlands.
Dossa, E. L., Fernandes, E. C. M., Reid W. S., Ezui K. 2008. “Above- and Below-Ground Biomass. Nutrient and Carbon Stock Contrasting an Open Grown and a Shade Coffee Plantation.” Agroforestry Systems 72: 103–115.
Eilittä, M., Carsky, R. J., Mureithi, J., Szabo, N., Bressani, R., Myhrman, R., Sandoval, C., Muinga, R., Carew, L. B., Capo-chichi, L. J. A., and Teixeira, A. “Future Agenda for Mucuna Research and Promotion.” Tropical and Subtropical Agroecosystems 1 (2-3): 329–343.
Gama-Rodrigues, Antonio C. 2011. “Soil Organic Matter, Nutrient Cycling and Biological Nitrogen-Fixation in Agroforestry Systems. Agroforestry Systems 81 (3): 191–193.
Intergovernmental Panel on Climate Change. 2006. 2006 IPCC Guidelines for National Greenhouse Gas Inventories, ed. H. S. Eggleston, L. Buendia, K. Miwa, T. Ngara, and K. Tanabe. Institute for Global Environmental Strategies, Japan.
Kaonga, M. L., and Coleman, K. 2008. “Modelling Soil Organic Carbon Turnover in Improved Fallows in Eastern Zambia Using the RothC-26.3 Model.” Forest Ecology and Management 256 (5): 1160–1166.
Kaizzi, C. K., Ssali, H., Vlek, P.L. G. 2006. “Differential Use and Benefi ts of Velvet Bean (Mucuna Pruriens Var. Utilis) and N Fertilizers in Maize Production in Contrasting Agro-Ecological Zones of E. Uganda.” Agricultural Systems 88: 44–60.
Lemma, B., Kleja, D. B., Nilsson, I., Olsson, M. 2006. “Soil Carbon Sequestration Under Different Exotic Tree Species in the Southwestern Highlands of Ethiopia.” Geoderma 136: 886–898.
Monfreda, C., Ramankutty, N., and Foley, J. A. 2008. “Farming the Planet: 2. Geographic Distribution of Crop Areas, Yields, Physiological Types, and Net Primary Production in the Year 2000.” Global Biogeochemical Cycles 22: GB1022.
Oelbermann, M., Voroney, R. P., Kass, D. C. L., et al. 2005a. “Above- and Below-Ground Carbon Inputs in 19-, 10-, and 4-year-old Costa Rican Alley Cropping Systems.” Agriculture, Ecosystems, and Environment 105 (1-2): 163–172.
Oelbermann, M., Voroney, R. P., Gordon, A. M. 2005b. “Carbon Sequestration in Tropical and Temperate Agroforestry Systems: A Review With Examples From Costa Rica and Southern Canada.” Agriculture, Ecosystems, and Environment 104 (3): 359–377.
Smith, P., Martino, D., Cai, Z., et al. 2008. “Greenhouse Gas Mitigation in Agriculture. Philosophical Transactions of the Royal Society B 363: 789–813.
TABLE E.2: Estimated Cropland and Grassland Area by 2030 (Million ha)
B1 A1B B2 A2
CROPLAND GRASSLAND CROPLAND GRASSLAND CROPLAND GRASSLAND CROPLAND GRASSLAND
Africa 279.7 813.7 271.2 826.4 321.3 863.5 325.4 891.9
Asia 799.3 656.9 847.3 678.7 943.4 701.7 871.6 714.4
Latin America 351.0 282.1 361.8 295.6 358.2 384.0 414.3 426.0
Source: Based on Smith et al. (2008).

85
ECONOMIC AND SECTOR WORK
APPENDIX E — ASSUMPTIONS FOR DERIVING THE APPLICABLE MITIGATION AREA FOR THE LAND MANAGEMENT
Szott, L. T., E. C. M. Fernandez & P. A. Sanchez. 1991. Soil plant interaction in agroforestry system. Forest Ecology Management 45: 127–152.
Szott, L. T., Palm, C. A., and Sanchez, P. A. 1991. “Agroforestry in Arid Soils of the Humid Tropics.” Advances in Agronomy 45: 275–301.
Szott, L. T., Palm, C. A., and Davey, C. B. 1994. “Biomass and Litter Accumulation Under Managed and Natural Tropical Fallows.” Forest Ecology and Management 67: 177–190.
van Noordwijk, M., Rahayu, S., Hairiah, K., Wulan, Y. C., Farida, A., and Verbist, B. 2002. “Carbon Stock Assessment for a Forest-to-Coffee Conversion Landscape in Sumber-Jaya (Lampunh, Indonesia).” Science in China (Series C) 45: 76–86.
Yaqub, M., Mahmood, T., Akhtar, M., Iqbal, M. M., and Ali, S. 2010. “Induction of Mungbean [Vigna Radiata (L.) Wilczek] as a Grain Legume in the Annual Rice-Wheat Double Cropping System.” Pakistan Journal of Botany 42 (5): 3125–3135.


A G R I C U L T U R E A N D R U R A L D E V E L O P M E N T
Agriculture and Rural Development (ARD)1818 H Street, NWWashington, D.C. 20433 USATelephone: 202-477-1000Internet: www.worldbank.org/ard