Embed Size (px)
Citation preview

Carbon Starved Anther Encodes a MYB Domain ProteinThat Regulates Sugar Partitioning Required for RicePollen Development W OA
Hui Zhang,a,b,1 Wanqi Liang,a,1 Xijia Yang,a Xue Luo,a Ning Jiang,c Hong Ma,d,e and Dabing Zhanga,b,2
a School of Life Science and Biotechnology, Shanghai Jiao Tong University, Shanghai 200240, Chinab Bio-X Research Center, Key Laboratory of Genetics and Development and Neuropsychiatric Diseases, Ministry of Education,
Shanghai Jiao Tong University, Shanghai 200240, Chinac Department of Horticulture, Michigan State University, East Lansing, Michigan 48824d State Key Laboratory of Genetic Engineering, Institute of Plant Biology, Center for Evolutionary Biology, School of Life
Sciences, Fudan University, Shanghai 200433, Chinae Department of Biology, Huck Institutes of the Life Sciences, Pennsylvania State University, University Park, Pennsylvania
16082
In flowering plants, sink tissues rely on transport of carbohydrates from photosynthetic tissues (sources) for nutrition and
energy. However, how sugar partitioning in plants is regulated at the molecular level during development remains unknown.
We have isolated and characterized a rice (Oryza sativa) mutant, carbon starved anther (csa), that showed increased sugar
contents in leaves and stems and reduced levels of sugars and starch in floral organs. In particular, the csa mutant had
reduced levels of carbohydrates in later anthers and was male sterile. The csa mutant had reduced accumulation of 14C-
labeled sugars in anther sink tissue. CSA was isolated by map-based cloning and was shown to encode an R2R3 MYB
transcription factor that was expressed preferentially in the anther tapetal cells and in the sugar-transporting vascular
tissues. In addition, the expression of MST8, encoding a monosaccharide transporter, was greatly reduced in csa anthers.
Furthermore, CSA was found to be associated in vivo and in vitro with the promoter of MST8. Our findings suggest that CSA
is a key transcriptional regulator for sugar partitioning in rice during male reproductive development. This study also
establishes a molecular model system for further elucidation of the genetic control of carbon partitioning in plants.
INTRODUCTION
Plants are highly specialized autotrophic organisms with distinct
tasks for various organs, such as photosynthesis and production
of sugars and other organic nutrients in leaves and uptake of
water and mineral nutrients in roots. To modulate the develop-
ment and nutrient exchange between the organs, plants have
evolved a vascular system composed of the xylem and the
phloem. The xylem is responsible for transporting water and
minerals from the root system to the shoot, and the phloem is
responsible for transporting organic nutrients from source tis-
sues, such as leaves, to sink tissues, such as roots, developing
organs from the shoot apex, and reproductive organs. Photo-
synthetic sugars are key substances in primarymetabolism; they
not only function as the major energy source and provide the
building blocks for macromolecules but also play crucial roles as
signaling molecules (Rolland et al., 2006). Plant cells have the
ability to take up sugars as carbon skeletons for production of
cellular components (i.e., cell wall) and othermetabolites, often in
response to plant hormones and external stresses (Lalonde
et al., 2004; Rolland et al., 2006).
Whereas glucose is the most important form of carbon for
energy and the form transported in animals, the disaccharide
sucrose is the main form of carbon for long-distance transport in
plants (Lemoine, 2000; Lalonde et al., 2004). Carbon partitioning
in plants between the source tissues and the various competing
sink tissues is a dynamic process that includes two key compo-
nents: the loading of photosynthetic assimilates from the source
into the phloem tissue and their unloading from the phloem into
the sink tissues (Lemoine, 2000). Several genes, such asSucrose
Transporters (SUTs), TIEDYED, andH+-ATPase, encoding trans-
membrane proteins have been shown to be important for phloem
loading of sucrose. Mutations in these genes cause excess
carbon accumulation in leaves and reduced or delayed growth
(Gottwald et al., 2000; Rolland et al., 2006; Buttner, 2007; Kocal
et al., 2008; Wang et al., 2008a; Slewinski et al., 2009). The
phloem unloading pathway is required for sink organs, such as
developing anthers, in which sucrose moves from phloem cells
to sink cells via plasmodesmata. Alternatively, sucrose can be
cleaved by cell wall invertases, forming glucose and fructose,
which can be taken up by sink tissues via monosaccharide
1 These authors contributed equally to this work.2 Address correspondence to [email protected] author responsible for distribution of materials integral to thefindings presented in this article in accordance with the policy describedin the Instructions for Authors (www.plantcell.org) is: Dabing Zhang([email protected]).WOnline version contains Web-only data.OAOpen Access articles can be viewed online without a subscription.www.plantcell.org/cgi/doi/10.1105/tpc.109.073668
The Plant Cell, Vol. 22: 672–689, March 2010, www.plantcell.org ã 2010 American Society of Plant Biologists

transporters (MSTs) (Rolland et al., 2006; Buttner, 2007; Kocal
et al., 2008). However, the key genes responsible for regulating
the source–sink interaction for sugar transport remain elusive.
As a nonphotosynthetic male reproductive organ, the anther
obtains photosynthetic assimilates mainly from source organs to
support pollen development and maturation (Goetz et al., 2001).
Within the anther, the developing pollen is immersed in locular
fluid containing nutrients such as sugars and lipids from the
sporophytic (somatic) tissue tapetum (Pacini et al., 2006). The
early stages of pollen development are characterized by active
growth and high metabolic activity in the anther. Thus, anthers
have the highest sink strength in the developing flower, and large
amounts of sugars are mobilized to anthers to support their early
development (Oliver et al., 2007). At late stages, pollen matura-
tion requires the accumulation of starch, which functions as an
energy reserve for germination and thus serves as a marker of
pollen maturity (Datta et al., 2002). Disturbances in sugar
unloading and metabolism in the anther can significantly impair
pollen development and cause male sterility (Goetz et al., 2001;
Datta et al., 2002; Oliver et al., 2005; Mamun et al., 2006; Oliver
et al., 2007). Still, the regulatory mechanism underlying assim-
ilate partitioning remains poorly understood.
In this work, we report the identification of a key regulator gene
in rice (Oryza sativa), Carbon Starved Anther (CSA), encoding a
putative R2R3 MYB-type transcription factor that is involved in
regulating sugar partitioning during male reproductive develop-
ment. Results of sugar measurement and [14C]sucrose labeling
suggest that CSA may control assimilate partitioning in rice from
the topmost leaf (flag leaf) to the sink tissues in the flower,
particularly the anther. Consistent with this, the CSA gene is
preferentially expressed in the vascular tissue and the tapetumof
the anther, as well as in other sinks. Moreover, using chromatin
immunoprecipitation (ChIP) and electrophoretic mobility shift
assay (EMSA), we demonstrate that the CSA protein is able to
bind the promoter region of MST8, which encodes an MST.
RESULTS
Genetic Analysis of the csaMutant
Previously, we used g-ray radiation to generate a rice mutant
library in the 9522 background (O. sativa ssp Japonica) (Chen
et al., 2006a). The csamutant was isolated by its complete male
sterility under the growth condition with 30/24 6 18C day/night
temperature and 50 to 70% relative humidity (Figure 1).When the
csa plant was pollinated with wild-type pollen, all F1 progeny
displayed a normal phenotype, indicating that csa is a recessive
mutant. F2 progeny segregated for 419 normal and 126 mutant
plants (x2 = 1.028 for 3:1, P > 0.05), indicating monofactorial
recessive inheritance of the mutant characteristic.
Morphological Features of the csaMutant
Shorter Culm Length
During the seedling, tillering (formation of multiple shoots near
the base), and heading (formation of the reproductive shoots)
developmental stages, csa plants had no visible difference from
wild-type plants except that they were smaller in size (Figure 1A).
In mature plants, even though panicle (inflorescence) lengths of
wild-type and csa plants were similar (Figures 1C and 1M), the
culm (main stem) length of csa was slightly shorter than that of
the wild type (i.e., 75.26 2.3 cm for the wild type and 65.36 1.8
cm for csa; n = 25) (Figures 1A and 1L). The decreased culm
length of csa was mainly due to the reduced length of the
uppermost four internodes. Compared with the wild type, the
lengthsof internodes I to IV incsawere6.47, 3.27, 0.74, and0.74cm
shorter, respectively (Figures 1B, 1M, and 1N).
Abnormal Pollen Development and Maturation
Despite the reduced culm length, csa plants produced flowers
with apparently normal outer sterile organs called lemma and
palea (Figures 1C to 1E) but failed to generate normal anthers.
The csa anthers were white and smaller than those of the wild
type (Figures 1D to 1G). While examined using scanning electron
microscopy, the anther epidermal cells appeared to be smaller
than wild-type cells at stage 13 during anther development (see
Supplemental Figures 1A, 1B, 1E, and 1F online). Also, unlike
wild-type mature pollen, the csa pollen could not be deeply
stained by iodine–potassium iodide (I2-KI), and csa plants were
complete male sterile (Figures 1J and 1K). The csa pistils
appeared normal (Figures 1H and 1I), and we observed that
csa was able to produce normal seeds when backcrossed with
the wild-type pollen.
To detect possible cellular morphological alteration in the csa
mutant, we examined the wild-type and mutant anther develop-
ment in detail using transverse sections. Based on morpholog-
ical landmarks or cellular events visible under the light
microscope and previous classification of anther development
(Feng et al., 2001; Li et al., 2006), we recently further divided rice
anther development into 14 stages (Zhang and Wilson, 2009).
From stages 1 to 5, anther primordia differentiate and form the
characteristic anther structure with microspore mother cells,
somatic cells, and connective and vascular tissues. During
stages 7 to 9, microspore mother cells undergo meiosis and
generate dyads and then tetrads of haploid microspores.
Morphological defects were not detected in csa anthers until
stage 10 (Figure 2). At this stage, the middle layer of wild-type
anthers was thin and band-like, the endothecium became
narrower, and the tapetum begun to degenerate; also, micro-
spores appeared round and vacuolated (Figure 2C). However,
the csa middle layer and endothecium became abnormally
expanded and thicker than normal at this stage, and the micro-
spore had irregular appearance (Figure 2D). At stage 11, thewild-
type middle layer and endothecium degenerated, and typical
falcate (sickle-like shape) pollen grains were formed (Figure 2E),
whereas csa showed delayed degradation of the middle layer
and endothecium and produced severely abnormal pollen (Fig-
ure 2F). At stage 13, during mature pollen formation, the wild-
type anther wall layers were nearly completely degraded and
invisible. Inside the anther, mature pollen grains were deeply
stained with 0.05% toluidine blue, indicating that the wild-type
microspore is full of starch, lipids, and other storage materials
(Figure 2G) that are important for pollen viability and function.
However, in the csa anther, anther wall layers persisted at stage
CSA Regulates Sugar Partitioning in Rice Anther 673
13. In particular, the endothecium near the connective tissues
expanded, and the developing pollen disintegrated into debris
(Figure 2H).
When pollen grains were stained with 4’,6-diamidino-2-
phenylindole (DAPI), which stains nucleic acids, it was obvious
that late pollen developmental stages were abnormal in csa
mutants (see Supplemental Figures 2A to 2H online). At stage 11,
both wild-type and csa pollen grains could undergo the first
mitosis (see Supplemental Figures 2C and 2G online). Later, the
generative cell in wild-type pollen divided to form two sperm
cells, and the mature pollen was formed containing three cells
(i.e., a larger vegetative cell that surrounded two smaller sperm
cells at stage 13) (see Supplemental Figure 2D online). By
contrast, the second mitosis seemed to be delayed in the csa
pollen, which was smaller than the wild-type pollen, and no
obvious formation of the pollen with two sperm nuclei was
observed at this stage (see Supplemental Figure 2H online).
To further understand csa anther defects, we examined male
reproductive organs using transmission electron microscopy.
Consistent with the above observations, there was no obvious
difference of anther wall layers and microspores between the
wild type and csa at stage 9 (see Supplemental Figures 3A and
3D online). However, developmental defects of csa anther wall
layers and pollen were observed at stage 10. The wild-type
middle layer and tapetal layer appeared condensed and less
visible, and a vacuolated pollen grain with a round shape formed
in the wild type (see Supplemental Figures 3B and 3C online). By
contrast, csa middle layer and tapetal cells seemed less con-
densed and degenerated (see Supplemental Figure 3E online),
and the csa microspore appeared to have uneven cytoplasm
(see Supplemental Figure 3F online). At stage 13, the wild-type
anther wall cell layers were largely degenerated, and the major
remaining structures were cell walls of the epidermis and endo-
thecium, with relatively few (compared with the csa mutant)
Figure 1. Comparison of the Wild Type and the csa Mutant.
(A) Comparison of a wild-type plant (left) and a csa mutant plant (right) after heading. Bar = 20 cm.
(B) Comparison of the internode elongation of the wild type (left) and csa (right) at the heading stage. Bar = 10 cm.
(C) Comparison of the seed setting of the wild type (left) and csa (right). Bar = 5 cm.
(D) and (E) The spikelet of the wild type (D) and csa (E) after removing the palea and half the lemma. Bars = 2 mm.
(F) and (G) The wild-type anther (F) and the csa anther (G). Bars = 2 mm.
(H) and (I) The wild-type pistil (H) and the csa pistil (I). Bars = 2 mm.
(J) and (K) The I2-KI staining pollen grains of the wild type (J) and csa (K). Bars = 100 mm.
(L) Comparison of plant height between a wild-type plant (black bars) and a csa mutant (white bars).
(M) Comparison of the length of panicle and top four internodes (I to IV, where I is the uppermost) between wild-type (black bars) and csa (white bars)
plants. Data presented are means of results from 25 plants. Error bars indicate SD.
(N) Comparison of relative length percentage of top four internodes between wild-type (left) and csa (right) plants.
674 The Plant Cell

hair-like cuticle structures on the anther surface (see Supple-
mental Figure 3G online). At this stage, the wild-type pollen was
full of storage materials, such as starch granules and lipids (see
Supplemental Figure 3H online), with a normal pollen wall con-
taining exine and intine layers (see Supplemental Figure 3I
online). However, the csa epidermis and endothecium seemed
to be less degenerated and abnormally persisted with irregular
cell shape at stage 13 (see Supplemental Figure 3J online). In
addition, at stage 13, scanning electron microscopy analysis
confirmed that the csa anther had an abnormal cuticle (see
Supplemental Figures 1C, 1D, 1G, and 1H online). Although the
csa pollen wall seemed to have normal exine, the intine was less
condensed, and pollen grains collapsed with reduced accumu-
lation of starch and other storage materials (see Supplemental
Figures 3K and 3L online). These observations suggest that CSA
plays a crucial role in anther and pollen development in rice.
Altered Assimilate Partitioning during Pollen Development
Morphological analyses indicated that the csa mutant had de-
fects during late anther development and pollen maturation,
especially the reduction in starch accumulation in the pollen
grain. Nutrients such as starch are preferentially accumulated in
the pollen to provide energy for pollination, and the starch level is
a metabolic marker of pollen maturity (Datta et al., 2002). To test
whether csa was abnormal in sugar partitioning from the source
tissue (the flag leaf) to the sink tissue (the developing anther), we
stained the flag leaf and internode I (the uppermost internode)
using I2-KI to observe starch distribution by the end of the day. At
stage 11, we did not observe obvious starch accumulation in
either wild-type or csa flag leaves (Figure 3A). Meanwhile, strong
starch staining was observed at the base region of the wild-type
internode I, as well as that of the csa internode I (Figures 3C, 3E,
and 3G), confirming the accumulation of starch within the stem
tissue, which acts as a temporary sink during rice reproductive
development (Scofield et al., 2007). At stage 13, starch deposi-
tion was detected at reduced levels in the flag leaf and the stem
of the wild type (Figures 3B, 3D, and 3F), suggesting that the
accumulated starch is converted and allocated for reproductive
development. However, at stage 13, abnormal starch accumu-
lation was observed in the csa internode I region and the flag leaf
(Figures 3B, 3D, and 3H). It appears that the photosynthetic
sugar in csawas not transported normally from the flag leaf to the
anther and other sink tissues during late pollen development.
To measure carbohydrate distribution, we employed gas
chromatography–mass spectrometry (GC-MS) analysis to test
the content of sugars in the anther, lemma/palea, and flag leaf of
the wild type and csa. Results of GC-MS analysis revealed that
the levels of sucrose, glucose, and fructose in the anther de-
creased gradually during wild-type anther development (Figure
4A). The starch level in the wild type showed a 25-fold increase
from stage 9 to stage 13, suggesting that the conversion from
sucrose, glucose, and fructose to starch occurs normally in the
wild-type anther during pollen formation (Figure 4A; see Supple-
mental Table 1 online). Compared with the wild type, the csa
anther had significantly reduced levels of glucose and fructose
from stage 9 to stage 13 (P < 0.05), and sucrose levels were
slightly lower (Figure 4A; see Supplemental Table 1 online),
suggesting that the csa anther likely has defects in importing
sugars from the source tissues. Furthermore, although starch
content in the csa anther seemed to be normal at stage 9, it
decreased to;22% (5.5mg/g freshweight [FW] for thewild type
and 1.2 mg/g FW for csa) and 49% (152.3 mg/g FW for the wild
Figure 2. Transverse Sections Showing Anther and Microspore Devel-
opment of the Wild Type and csa.
Four stages of anther development in the wild type and the correspond-
ing of the csa mutant were compared. Transverse sections were stained
with 0.05% toluidine blue O. Images from wild-type plants are shown in
(A), (C), (E), and (G); (B), (D), (F), and (H) are the csa mutant. (A) and (B),
stage 9; (C) and (D), stage 10; (E) and (F), stage 11; (G) and (H), stage 13.
E, epidermis; En, endothecium; ML, middle layer; T, tapetum; Msp,
microspore; MP, mature pollen; St, stomium. Bars = 15 mm.
CSA Regulates Sugar Partitioning in Rice Anther 675

type and 75.2 mg/g FW for csa) of normal levels at stages 11 and
13, respectively (Figure 4A; see Supplemental Table 1 online).
At early anther development, the rice outer floral organs lemma
and palea likely act as the sink tissue, assimilating carbohydrate
from source tissues; later during pollen starch synthesis, these
outer floral organs were proposed to function as the source
organs supplying carbohydrate for pollen maturation (Abebe
et al., 2004). Consistent with this hypothesis, we observed that
contents of glucose and fructose in the wild-type lemma/palea
decreased from stage 9 to stage 13. The levels of glucose and
fructose in the wild-type lemma/palea were slightly lower than
those of the csa mutant at stage 9 (Figure 4B). The sucrose
amounts in the wild-type and csa lemma/palea were very similar
at stage 9, but the csa lemma/palea at stages 11 and 13 had
notably lower contents of sucrose than those of the correspond-
ing wild-type lemma/palea, respectively. Also, we observed
;30% lower starch content in the csa lemma/palea compared
with the wild type at these stages (Figure 4B; see Supplemental
Table 1 online).
Accompanied by the reduced accumulation of starch in the
csa anther and lemma/palea, the levels of sucrose and starch in
the flag leaf were increased in the csa mutant compared with
the wild type (Figure 4C). In particular, the starch content in the
csa flag leaf increased to about twofold of that in the wild-type
flag leaf at stage 13 (Figure 4C; see Supplemental Table
1 online).
These results suggest that the csamutant likely has defects in
sugar partitioning from the flag leaf to the lemma/palea and
anther. The remarkable decrease of sucrose and starch levels in
the csa anther at the late pollen development stage might have
resulted from the disruption of carbohydrate uptake or utilization
in anther, causing male sterility.
CSA Regulates Carbon Accumulation in the Anthers
To further test the role of CSA in regulating sugar partitioning
during rice male reproductive development, we performed a
[14C]sucrose feeding assay using excised stems containing
leaves and the panicle from the wild type and csa to assess the
sugar distribution from the stem to the sink anther at stages 11
and 13. The excised stem containing internodes I to IV, as well as
the flag leaf and flowers, were placed and incubated in water
containing added [14C]sucrose, with internode IV being sub-
merged in the water directly. After 12 h of treatment, the amount
of isotope was tested using amiddle section of each of internode
I, II, and III; the sections were designated S1, S2, and S3 from the
bottom to the top. At stage 11, the isotope signal strengths in S1
segments were similar in the wild type and the csamutant, but in
the S2 and S3 segments, the csa stem had slightly more isotope
signals than those of the wild type (Figure 5A; see Supplemental
Table 2 online). At the stage 13, from S1 to S3, the levels of
accumulated isotope signal in csa were all higher than those of
the wild type (Figure 5B; see Supplemental Table 2 online).
Conversely, we observed the isotope signals in the wild-type
lemma/palea were higher than those of csa at stages 11 and 13.
This analysis suggested that csa was defective in sugar parti-
tioning from the leaf to flower via stem during rice reproductive
development.
Figure 3. I2-KI Staining the Flag Leaf and Stem in Wild Type and csa.
(A) I2-KI staining of flag leaves from the wild type (left) and csa (right) at stage 11.
(B) I2-KI staining of flag leaves from the wild type (left) and csa (right) at stage 13.
(C) I2-KI staining of stems from the wild type (top) and csa (bottom) at stage 11.
(D) I2-KI staining of stems from the wild type (top) and csa (bottom) at stage 13. Arrows in (C) and (D) indicate starch deposition.
(E) and (G) I2-KI–stained free-hand sections of stem cell division zones of the wild type (E) and csa (G) at stage 11.
(F) and (H) I2-KI–stained free-hand sections of stem cell division zones from the wild type (F) and csa (H) at stage 13.
Arrows indicate starch deposition in (C) and (D); arrows indicate the vascular tissue (VT) in (E) to (H). Bars = 1cm in (C) and (D) and 150 mm in (E) to (H).
676 The Plant Cell

In addition, the [14C]sucrose feeding assay was performed
using the excised panicles that included a portion of internode I
to detect sugar partitioning in the anther and lemma/palea of csa.
After a 12-h treatment, we observed accumulated isotope sig-
nals in thewild-type anther at stages 9, 11, and 13 (Figure 5C; see
Supplemental Table 2 online), indicating that source tissues
supply abundant sugars for pollen development. By contrast,
signals in the csa anthers were very low at stage 9. At stage 11,
the isotope level had an increase in the csa anther, but it was not
as great as that in the wild type (Figure 5C; see Supplemental
Table 2 online). At stage 13, the isotope signals in the csa anther
were clearly lower than that in the wild type (Figure 5C). Similar to
the distribution of isotope signals in the rice anther, we observed
higher isotope signals in the wild-type lemma/palea than in the
csa mutant from stage 9 to stage 13 (Figure 5D; see Supple-
mental Table 2 online). Consistently, the isotope signals in the
csa anther and lemma/palea were observed to be lower than
those of the wild type after 1- and 6-h treatments, respectively
(see Supplemental Figure 4 online), while the accumulated
isotope signals in both the wild type and the csa mutant
increased from 1 to 12 h after treatment. This suggests that the
redistribution of labeled sucrose occurred within a very short
period (an hour), and, not surprisingly, the total amount of
redistributed products increased as time elapsed.
To determine the chemical nature of the labeled molecules in
anthers, we separated the sugars (sucrose and hexoses) in the
soluble extract from anthers after a 1- and 12-h treatment with14C-labeled sucrose using thin layer chromatography. We ob-
served the signals of the labeled sucrose and hexose (glucose
and fructose) in both the wild type and csa (see Supplemental
Table 3 online). The level of both sucrose and hexose, indicated
by the radioactive signal, was lower in the mutant anthers than
thewild-type anthers at any timepoint (seeSupplemental Table 3
online). For wild-type plants, a large proportion of the labeled
products were hexoses an hour after the treatment. In csa
mutants, the level of labeled hexose was only one-third that of
the wild type, while the level of sucrose was only slightly lower
than that of the wild type (see Supplemental Table 3 online). By
12 h after treatment, the fraction of sucrose increased in wild-
type plants, whereas the relative ratio of sucrose and hexosewas
similar to that of the csa mutant (see Supplemental Table 3
online). As a result, the csa mutant anthers seemed to be more
deprived of sucrose compared with the wild-type anthers at this
time point. This observation suggests that the csa mutation has
influenced the redistribution of the radiolabeled sucrose and that
the most immediate and dramatic alteration is the reduced level
of hexose in the csa anthers.
These observations indicated that the csamutation caused the
defect of carbon accumulation in the anther; thus, we named this
gene Carbon Starved Anther.
Isolation of the CSA Gene
To isolate the CSA gene, we initially mapped the CSA locus
between two InDelmolecularmarkers, OS104 andOS106, on the
short arm of rice chromosome 1. Tomore precisely localizeCSA,
750 mutants from a F2 mapping population were identified and
analyzed using seven polymorphic InDel markers (see Supple-
mental Table 4 online). Finally, CSA was located between two
InDel markers Z134 and Z138, which define a region of 23 kb
(Figure 6A). By sequencing the mutant genomic DNA, we found
that both a single nucleotide deletion and a G-to-A transition had
occurred in a gene, with a gene ID Os01g16810 (The Institute for
Genomic Research), Os01g0274800 (National Center for Bio-
technology Information), or Os01t0274800-01 (Rice Annotation
Project Database) (Figure 6B), causing a frame shift and prema-
ture translational termination (see Supplemental Figure 5 online).
Those are the only mutations in the entire gene as well as in the
Figure 4. Sugar and Starch Levels in the Wild Type and csa.
Sugar and starch levels at stages 9, 11, and 13 in anther (A), lemma/
palea (B), and flag leaf (C). Data presented are means 6 SE (n = 3) with
units of mg/g FW. Fru, fructose; Glu, glucose; Suc, sucrose; S, starch.
CSA Regulates Sugar Partitioning in Rice Anther 677

2-kb upstream and 1-kb downstream regions. Furthermore, we
determined the intron-exon pattern of the Os01g0274800 gene
by comparing the genomic sequence with the obtained full-
length cDNA (AK107461) from the Rice Genome Resource
Center (RGRC-NIAS; http://www.rgrc.dna.affrc.go.jp/stock.
html) (Figure 6B).
To further verify the identity of this gene asCSA, we performed
a functional complementation experiment. A binary plasmid
carrying an ;4.3-kb wild-type genomic fragment containing
2157-bp upstream sequence, 1665-bp coding region of
Os01g0274800, and 525-bp downstream sequence from the
BAC clone AP000837 was able to rescue the male-sterile phe-
notype of the csa homozygous plants (Figures 7A to 7C). The
complemented lines displayed yellow anthers with starch-filled
pollen grains (Figure 7C) and high seed-setting rate (right of
Figure 7D), which were similar to those of the wild type (Figure 7A
and left of 7D). The carbohydrate accumulation within the flag
leaf and the internode I base was normal in the complemented
lines at anther stage 13 (Figures 7E and 7F). The reduced
accumulation of starch and increased sucrose level in the flag
leaf of the complemented plants were also observed by sugar
measurements (Figure 7G; see Supplemental Table 5 online).
Those results confirm that the csa mutant phenotype is caused
by Os01g0274800 dysfunction.
The CSA open reading frame encoded a putative R2R3-type
MYB transcription factor of 268 amino acids with two MYB
domains (Figure 6B; see Supplemental Figure 5 online). Phylo-
genetic analysis between CSA and its closest 14 homologs
indicated that CSA is closely related to the R2R3 MYB proteins
MYB56 from Arabidopsis and LOC_ Os08g33800 from rice
(Figure 6I; see Supplemental Figure 6 online). Also, we observed
two putative nuclear localization signal sequences in CSA using
the P-sort program (http://psort.ims.u-tokyo.ac.jp/form.html)
analysis (see Supplemental Figure 5 online). To confirm the
CSA nuclear localization, we constructed a translation fusion
between the full-length CSA coding region and the cDNA for the
green fluorescent protein. The CSA-GFP fusion construct and
the GFP alone control, both driven by the cauliflower mosaic
virus 35S promoter, were introduced into onion epidermal cells
by particle bombardment. As expected, the CSA-GFP fusion
protein was observed exclusively in the nucleus (Figures 6C to
6E). By contrast, the free GFP was found in the nucleoplasm, as
well as in the cytoplasm (Figures 6F to 6H). This result suggests
that CSA is localized to the nucleus.
CSA Expression Is Mainly in Vascular Tissues and
the Tapetum
The main morphological defects of csa occurred in anther
development due to the biochemical abnormality in sugar
partitioning into flower/anther, whereas there was no dramatic
phenotype for vegetative development. To test how CSA acts in
the affected mutant tissues to regulate sugar partitioning, we
analyzed the CSA expression pattern using RT-PCR, promoter-
b-glucuronidase (GUS) fusions, and in situ hybridization.
RT-PCR analysis using total RNA prepared from rice vegeta-
tive and reproductive organs showed that the CSA transcripts
were undetectable in stem and leaf, but detectable in root. In the
sterile empty glume, which surrounds the rice flower, no CSA
expression signal was observed. Strong expression of CSA was
detected in the lemma and palea and weaker expression in the
pistil and seed. As expected, the CSA transcript was clearly
detected in the anther from stage 9 to stage 13 (Figure 8A).
Analysis of transgenic rice lines with the GUS reporter gene
driven by the CSA promoter (;2.3 kb) indicated that in the
germinating seedlings, GUS expression was mainly detected in
coleoptile and root vascular tissue, as well as the primordia of
lateral root (Figures 8B and 8C; see Supplemental Figures 7A and
Figure 5. 14C-Signal Accumulation in the Flower/Anther and Stem of the Wild Type and csa after 12-h Treatment.
(A) 14C-signal accumulation in the stems of wild-type and csa plants at stage 11.
(B) 14C-signal accumulation in the stems of the wild type and csa at stage 13.
(C) 14C-signal accumulation in the anther of the wild type and csa at stages 9, 11, and 13.
(D) 14C-signal accumulation in the lemma/palea of the wild type and csa at stages 9, 11, and 13.
S1 to S3, stem segments from the base to the top. The data are given as means 6 SE (n = 3). The unit is expressed as cpm/mg, FW.
678 The Plant Cell
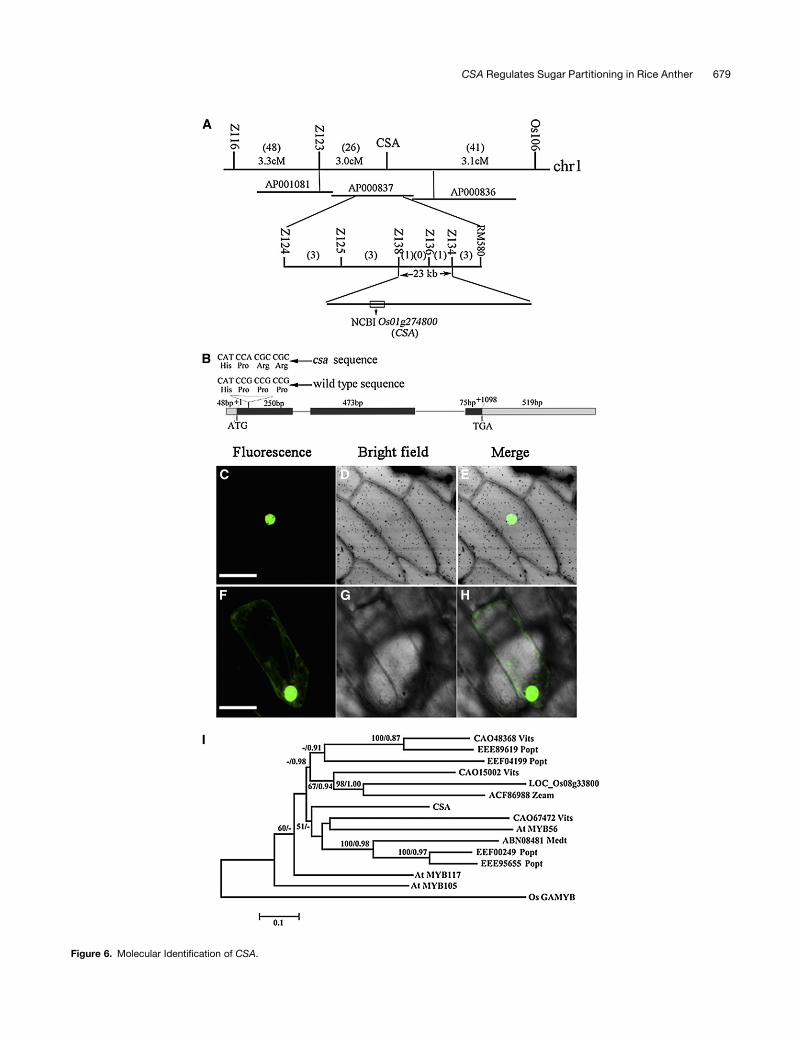
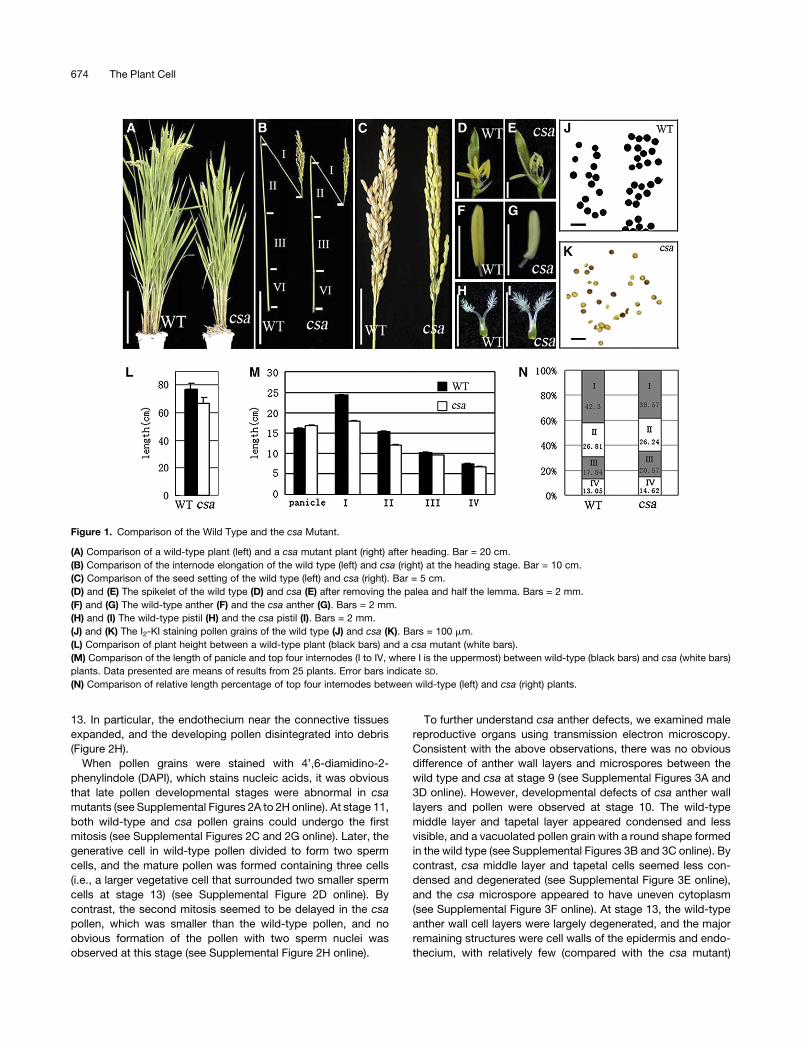
Figure 6. Molecular Identification of CSA.
CSA Regulates Sugar Partitioning in Rice Anther 679
7B online). We did not observe GUS staining in stem and leaf
blades, but the staining was visible in the leaf collar (Figure 8D).
GUS expression was enhanced in the region of wounding and
callus (Figure 8E; see Supplemental Figure 7C online). In flowers,
theGUSexpression could be observed in the veins of the lemma/
palea and pistil (Figures 8F and 8G; see Supplemental Figures 7D
and 7H online). In addition to the expression of GUS in anther
vascular tissue from stage 9 to stage 13 (Figures 8H to 8K; see
Supplemental Figures 7E to 7G online), we found GUS expres-
sion in anther wall layers at stage 9 (Figures 8H and 8I). This
suggests that CSA is likely expressed in the anther wall layers at
the early stage when the tapetum is present. During later stages,
as the tapetum degenerated, the expression of CSA is likely
restricted in the anther vascular tissue. Through the observation
of autofluorescence triggered by UV light, we detected the xylem
cells among the anther vascular tissue where no GUS staining
was detected (see Supplemental Figure 7G online), probably
because these cells are not viable. Also, GUS activity was
observed in the embryo and the dorsal vascular tissues of seeds
(see Supplemental Figures 7H to 7J online).
To further confirm the CSA expression pattern, we performed
RNA in situ hybridization with wild-type floral and root sections.
Figure 6. (continued).
(A) Fine mapping of the CSA gene on chromosome 1. Names and positions of the molecular markers are indicated on the vertical line. AP000837 is the
accession number of the relevant genomic sequence. cM is the unit of genetic distance (centimorgans). Numbers in parentheses represent
recombination events in the appropriate interval. The CSA locus was mapped to a 23-kb region between molecular markers Z134 and Z138.
(B) A schematic representation of the exon and intron organization ofCSA. The mutant sequence has a nucleotide deletion and a G-to-A transition in the
first exon. +1 Indicates the starting nucleotide of translation, and the stop codon (TAG) is +1098. Black boxes indicate exons; intervening lines indicate
introns; gray boxes indicate untranslated regions.
(C) to (E) The onion epidermal cell that expressed CSA-GFP.
(F) to (H) The onion epidermal cell that expressed GFP as control. Bars = 50 mm, all six panels are at the same magnification.
(I) Phylogenetic analysis of CSA and its 14 close homologs. The proteins were named according to their gene names from Arabidopsis thaliana and rice,
and others were according to their National Center for Biotechnology Information accession numbers followed by their species names (abbreviation).
Os GAMYB is defined as an outgroup. The scale bar indicates the number of amino acid substitutions per site. The alignment for the constructed tree is
shown in Supplemental Figure 6 online, with sequences listed in Supplemental Data Set 1 online.
Figure 7. Complementation of the csa Mutant and Phenotype Analysis.
(A) to (C) Anthers and I2-KI–stained pollen grains of the wild type (A), the csa mutant (B), and the complemented line ([C]; CL).
(D) Comparison of the seed setting of the wild type, csa, and the complemented line.
(E) I2-KI–stained flag leaves of the wild type, csa, and the complemented line at stage 13.
(F) I2-KI–stained internode I stems of the wild type, csa, and the complemented line at stage 13.
(G) Sucrose and starch levels in flag leaves of the wild type, csa, and the complemented line at stage 13.
Bars = 2 mm in (A) to (C), 5 cm in (D), and 1 cm in (E) and (F). Suc, sucrose; S, starch.
680 The Plant Cell

Consistent with the GUS staining results, the CSA expression
signals were detected in the vascular tissues of the root and
anther (Figures 8L to 8S). From stage 9 to stage 13, the CSA
expression signals were observed in the tapetum and vascular
tissue of anther connective tissue compared with the control
signals observedwith the sense probe (Figures 8L to 8Q). At stage
9, we also observed CSA expression signals at the microspore
surface (Figure 8L). In addition, detectableCSAexpression signals
were observed in root vascular tissues (Figures 8R and 8S).
Therefore, the location of CSA expression is consistent with
the hypothesis that this gene is associated with the sugar
partitioning into the anther, a major sink organ in rice.
Figure 8. CSA Expression Pattern.
(A) Spatial and temporal expression analyses of CSA by RT-PCR. RNAs were extracted from the root of 15-d-old seedlings, the shoot, leaf, glume, and
lemma/palea from the plants at heading stage. L/P, lemma and palea.
(B) to (K) GUS activity in the pCSA-GUS line.
(B) CSA expression in the root vascular tissue.
(C) GUS activity in the region of lateral root initiation.
(D) GUS activity in the leaf collar.
(E) GUS activity in the wounding tissue.
(F) GUS activity in the lemma/palea.
(G) GUS activity in the pistil.
(H) to (K) GUS activities in anther of stage 9 (H), stage 10 (I), stage 11 (J), and stage 13 (K).
(L) to (S) In situ analyses of the CSA expression in anther at stage 9 ([L] and [M]), stage 11 ([N] and [O]), and stage 13 ([P] and [Q]).
(R) and (S) In situ analyses of CSA expression in the root; pink color in (R) indicates the CSA expression.
(L), (N), (P), and (R) Probed with the CSA antisense probe.
(M), (O), (Q), and (S) Probed with the CSA sense probe.
Arrows indicate theCSA expression positions. T, tapetum; Msp, microspore; VT, vascular tissue. Bars = 1mm in (B) and (C), 1 cm in (D) and (E), 2 mm in
(F) to (K), 30 mm in (L) to (Q), and 60 mm in (R) and (S).
CSA Regulates Sugar Partitioning in Rice Anther 681
CSA Directly RegulatesMST8 in Rice
MSTs have the ability to transport a variable range of monosac-
charides across membrane barriers and have been shown to
play an important role in assimilate supply for sink tissue devel-
opment (Buttner, 2007; Wang et al., 2008b). In rice, one MST
member, MST8 (Os01g38670), is expressed in the tapetum,
microspore, and anther vascular bundle, which has been shown
to be a key component of the anther apoplastic sugar transport
pathway (Oliver et al., 2005, 2007; Mamun et al., 2006). As
expected, MST8 was expressed from stage 9 to stage 13 in the
anthers of wild-type plants (Figure 9A; seeSupplemental Figure 8
online). In the csa mutant, very low MST8 expression was
detectable in the anther from the early stage to the late stage
(Figure 9A; see Supplemental Figure 8 online). In the wild-type
lemma/palea, MST8 had higher expression at stages 11 and 13
(Figure 9B; see Supplemental Figure 8 online). By contrast, only
weak expression was detected in the csa lemma and palea at
these stages (Figure 9B).
CSA is a putative R2R3 MYB transcription factor, which is
expected to regulate gene expression by binding to the pro-
moters of the target genes. Putative MYB binding sequences
(MBSs) were identified using the tools described in plant
CARE (for cis-acting regulatory element) (http://bioinformatics.
psb.ugent.be/webtools/plantcare/html/; Lescot et al., 2002):
CCAAT-box and (pyAAC(G/T)G) in the promoter region ofMST8.
To test whether CSA has the ability to bind the promoter region
of MST8, we developed rabbit polyclonal antibodies against a
bacterially expressed recombinant CSA fragment. The specific-
ity of the CSA antibody was confirmed using protein gel blot
analysis, which detected a product of 30 kD, the expected size of
CSA in the wild-type anther. By contrast, no CSA signal was
observed in the csa mutant (see Supplemental Figure 9 online).
Our quantitative ChIP-PCR results indicated that two DNA frag-
ments, MST8-1 (208 bp) and MST8-2 (191 bp), of the upstream
MST8 region containing the predicted MYB transcription factor
binding sites (CAACGG) were enriched when the affinity-purified
CSA antibodies were used (Figures 9C and 9D). Meanwhile, no
enrichment of either a 191-bpMST8-3 DNA fragment (the 39 endwas 302 bp from the 59 end of the predicted MBS in MST8-2) of
MST8 upstream region without the predicted CCAAT-box or a
318-bp upstream region of ACTIN1 was observed using the
affinity-purified CSA antibodies (Figure 9D).
Furthermore, an EMSA revealed that the recombinant CSA
protein is able to bind a 114-bp DNA fragment containing two
CCAAT-boxes of the MST8 upstream region (Figure 9E). When
unlabeled DNA fragments were present as competitors, the
excess MST8 competitor DNAs reduced the complex formation
in a concentration-dependent manner (Figure 9E). These results
support the hypothesis that CSA directly regulates MST8.
CSA Affects the Expression of Genes Involved in Sugar
Partitioning in Flower/Anther
Because sugar levels were greatly altered during csa anther
development, we examined the mRNA levels of several key
genes involved in the cleavage, transport, and utilization of
sucrose in rice anther and lemma/palea. We compared the
expression of rice INV4, SUT3, UGP2, and GBSS1 at stages 9,
11, and 13 of anther development in the wild type and the csa
mutant using quantitative RT-PCR analysis. The expression
levels of INV4, SUT3, UGP2, and GBSS1 in the anthers and
lemma/palea were comparable between the wild type and the
complemented lines at stages 11 and 13 (see Supplemental
Figure 10 online) but were reduced in the csa mutant (see
Supplemental Figure 10 online). Therefore, we speculated that
either those genes are regulated by CSA or their expression is
influenced by the carbon starvation in csa mutants.
INV4 encodes an extracellular cell wall–bound invertase
(CW-INV, CIN, or INV), which is a key component of the sucrose
phloem unloading pathway, and its activity for cleaving sucrose
is a biochemical marker of sink strength for carbohydrate
partitioning (Ranwala and Miller, 1998; Oliver et al., 2005,
2007). SUT3 is one of five SUTs identified rice (Aoki et al.,
2003). UDP-glucose pyrophosphorylase (UGPase) has the ability
to reversibly convert glucose-1-phosphate and UTP into UDP-
glucose and pyrophosphate. In the anther, UDP-glucose is
primarily involved in the synthesis of starch, and two homologous
UGPase genes,UGP1 andUGP2, are present in the rice genome
(Chen et al., 2007; Woo et al., 2008; Mu et al., 2009). Unlike the
expression alteration of UGP2 in the csa mutant, UGP1 was
observed with no obvious expression change in the csa mutant
during the anther development (see Supplemental Figures 10E
and 10J online). GBSSI encodes a starch synthase (GBSS) that
constitutes the final step in which the glucose moiety of ADP-
glucose is transferred to the nonreducing end of the starch
molecule in the starch granule (Ohdan et al., 2005).
Even though the INV4 promoter contains one CAACTG motif
and the GBSSI promoter contains one CAACGG motif, no
association of CSA with these motifs was detected using ChIP-
PCR assay. Moreover, no predicted MBS was observed in the
promoter regions of SUT3 and UGP2. These results implied that
CSA may indirectly regulate the expression of INV4, SUT3,
UGP2, and GBSS1 during anther development. However, we
cannot exclude the possibility that CSA, in concert with another
unknown factor(s), coregulates the expression of these genes
that have no apparent MYB binding sites in their promoters.
DISCUSSION
CSA Is Required for Anther Development and
Pollen Maturation
Rice is one of the most important crops in the world, and in rice
breeding, the fertility of pollen grains is critical for rice yield. Many
cytoplasmic and nuclear mutations leading to male sterility lines,
which are of agricultural importance for the production of hybrids
to improve rice yield. Production of functional pollen grains in
flowering plants relies on cooperative functional interactions
between gametophytic and sporophytic tissues within the anther
(McCormick, 2004; Scott et al., 2004; Ma, 2005; Zhang and
Wilson, 2009). In this study, we report a novel rice gene, CSA,
which is critical for male gametophyte development. The csa
mutant shows delayed degradation of anther wall cell layers and
aborted pollen maturation during late pollen development.
682 The Plant Cell

The presence of sufficient levels of sucrose is of vital impor-
tance for the growth of the male reproductive cells in plants. In
Lilium, it has been demonstrated that the cells of the outer anther
wall cell layers and the connective tissue are interconnected by
cytoplasmic bridges called plasmodesmata, allowing assimi-
lates to pass, via the symplastic pathway, from cells of the
vascular bundle to the most internal portions of the middle layer
(Clement and Audran, 1995). Because plasmodesmata are not
detected between the middle layer and tapetum, sugars trans-
ported to pollen in the locule have to cross the middle layer and
tapetum by the apoplastic pathway, which requires transport
across the plasma membrane. The mechanism underlying the
apoplastic pathway is complex, involving many enzymatic sys-
tems to enhance the control of sugar transport (Clement and
Audran, 1995). INV4 and MST8 are proposed to be key compo-
nents of apoplastic sugar transport pathway from tapetal cells to
locular fluid because of their similar expression patterns during
anther development (Oliver et al., 2005, 2007; Mamun et al.,
2006). In this study, we show that control of sugar partitioning by
CSA greatly affects male reproductive tissue development in
Figure 9. Regulation of Rice MST8 by CSA.
(A) and (B) Relative mRNA levels of MST8 in the anther (A) and the lemma/palea (B) of the wild type (black), csa (white), and complemented line (CL)
(gray) analyzed by real-time PCR. Error bars indicate SD; each reaction has four quantitative PCR biological replicates.
(C) Predicted CCAAT-boxes of rice MST8 and ACTIN1 upstream regions. Black boxes indicate canonical binding sites for plant R2R3-MYB proteins
of the form pyAAC(G/T)G (CCAAT-box); numbers indicate the position of these motifs relative to the putative transcriptional start site; the bent
arrow denotes the translational start site. The gray fragments (MST8-1,MST8-2,MST8-3, and Actin1) indicate the position used in ChIP-qPCR assays.
MST8-1 and MST8-2 contain the predicted CCAAT-motif, and MST8-3 has no predicted CCAAT-motif as the control. The black fragment (MST8-4)
with two predicted CCAAT-motifs was used in gel shift assays.
(D) ChIP enrichment test by PCR shows the binding of CSA to the regulatory region ofMST8-1 andMST8-2. The fold enrichments in the IP sample over
the minus antibody control are shown. Error bars indicate SD; each reaction has four quantitative PCR biological replicates.
(E) Recombinant CSA binding to the promoter region of MST8-4 with containing two CCAAT-boxes was determined by EMSA. The binding complex
could be outcompeted with increasing quantities of unlabeled MST8-4 DNA fragments (325, 350, and 3100 of unlabeled MST8-4 DNA fragments).
CSA Regulates Sugar Partitioning in Rice Anther 683

rice. The expression levels of the INV4 andMST8 aswell asSUT3
were highly reduced in the csa anther (Figure 9; see Supplemen-
tal Figures 8 and 10 online). Thus, it is likely that the down-
regulation of these genes in csa causes an abnormal sugar
supply of the apoplastic sugar partitioning pathway from the
tapetum to locular fluid during anther development.
CSA Is a Member of the Family of R2R3 MYB
Transcription Factors
MYB domain proteins in plants form a superfamily. In the rice
genome, 183 putative MYB genes have been identified (Chen
et al., 2006b). In rice, GAMYB is an MYB transcription factor
controlling rice pollen development (Kaneko et al., 2004). The
gamyb-2 mutant microspore mother cells were abnormal, and
themutant microspores could not adhere to tapetal cells starting
from the tetrad stage (Kaneko et al., 2004). AID1 encodes a
protein with a single MYB domain that controls anther dehis-
cence and pollen development (Zhu et al., 2004). In addition,
three MYB proteins (MYBS1, MYBS2, and MYBS3), each with a
single MYB domain, can regulate the expression of a-amylase
during rice seed development (Lu et al., 2002). Compared with
these previously studied MYB proteins, the CSA protein likely
has a unique function in the MYB family in controlling carbon
partitioning during the anther development and pollen matura-
tion. Phylogenetic analysis indicates that CSA is most similar to
the rice protein LOC_Os08g33800 and Arabidopsis protein
MYB56. The function of theArabidopsis gene is unknown. Future
experiments are required to test whether those genes are in-
volved in the transport of carbohydrates.
CSA Controls Sugar Partitioning into the Anther
Sucrose is the main metabolic substrate for starch synthesis in
nonphotosynthetic sink tissues (Ohdan et al., 2005). Upon arrival
in sink tissues, sucrose may be cleaved by invertase and
unloaded by hexose transporters. The importance of cleavage
of sucrose by invertase in the apoplastic pathway has been
supported by the identification of hexose transporters (Sherson
et al., 2003; Buttner, 2007). The expression pattern of MSTs
suggests that they act mainly in hexose uptake into the sink. In
Arabidopsis, STP2 encodes a high-affinity, low-specificity MST
with the ability to transport various hexoses and pentoses. This
gene is specifically expressed during pollen maturation and
germination, and it plays a role in callose degradation for pollen
maturation (Truernit et al., 1999). Similarly, Arabidopsis STP6
(Scholz-Starke et al., 2003), STP9 (Schneidereit et al., 2003), and
STP11 (Schneidereit et al., 2005) have been shown to be ex-
pressed during anther/pollen development. Also, several MSTs
from rice have been demonstrated to play a crucial role in sugar
distribution (Toyofuku et al., 2000; Ngampanya et al., 2003;
Mamun et al., 2006; Wang et al., 2007, 2008b).
RiceMST8 has a spatial and temporal expression pattern that
strongly resembles that of INV4, which is expressed in rice
anthers (Oliver et al., 2005, 2007;Mamun et al., 2006), suggesting
thatMST8may function in the same pathway as INV4 controlling
photosynthetic carbon allocation. More intriguingly, expression
analyses revealed that CSA transcripts accumulated in vascular
tissues of the anther, as well as in the tapetum, which is similar to
the pattern seen with MST8. In csa flowers, expression levels of
INV4 and MST8 are dramatically reduced. Therefore, we spec-
ulate that, in the csa mutant due to the downregulated expres-
sion of INV4 and MST8, the sugar unloading may be severely
blocked, impairing the sugar concentration gradients between
sources and organs driving source-to-sink transport (stems/
flowers). In other words, the lack of CSA function may cause
reduced unloading, leading to the accumulation of sugars in the
leaf/stem. This is consistent with results of our feeding experi-
ment with [14C]sucrose. If we consider that, within only 1 h, the
accumulation of labeled products in anthers should reflect the
immediate impact of transport or unloading of sugars, this may
well explain why the hexose level in csa is dramatically lower than
in wild-type anthers (see Supplemental Table 3 online). Further-
more, genes related to sucrose utilization, such as UGP2 and
GBSS1, were downregulated by theCSAmutation during anther
development, resulting in the decreased metabolic capacity to
convert sucrose to starch in the csa mutant (see Supplemental
Figure 10 online). Consequently, sugar distribution indicated by
the [14C]sucrose feeding analysis in the csa mutant is abnormal
during anther development.
More importantly, the fact that CSA could directly bind to the
promoter region of MST8 suggests that CSA is likely a key
transcriptional regulator for photosynthate partitioning from
leaves to anthers. For other genes, such as INV4, it is possible
that they are indirectly regulated by CSA. One way this might
occur, for example, is that the absence of CSA function leads to a
reduction in sugar concentration, which serves as signal to
regulate the expression of INV4 and other genes. It is worth
mentioning that although the uptake of sugars in lemma/palea
seems to be affected in the csamutant, they do not demonstrate
any visible phenotype. It is possible that the morphological
development of lemma/palea largely precedes the time of func-
tional CSA.
In summary, this work characterizes the key role of CSA in
regulating sugar partitioning required for rice anther develop-
ment and pollen maturation. One downstream target gene,
MST8, has been shown to be a likely direct target gene of
CSA. According to our model, the reduced expression level of
MST8 in the csa mutant causes specific defect in sugar uptake
(or unloading) into anthers, which results in carbon starvation and
male sterility. Moreover, the reduced uptake of sugars in anthers
alters the sink-source relationship, and it further influences the
partitioning of assimilates and the expression of other genes in
the pathway. The characterization of the csa mutant provides
new insight into the genetic and transcriptional control of assim-
ilates partitioning in plants.
METHODS
Mutant Material and Growth Conditions
The F2mapping population was generated from a cross between the rice
(Oryza sativa) csamutant (ssp japonica) andGuangLuAi (ssp indica). In the
F2 population, male-sterile plants were selected in the winter season
(short-day light, ;12-h light, in Hainan province, China) for gene map-
ping. Other plants were grown in a greenhouse with a 30/24 6 18C day/
684 The Plant Cell

night temperature, 50 to 70% relative humidity, and a light/dark period of
13 h/11 h.
Characterization of Mutant Phenotype
Plantsmaterials were photographedwith aNikon E995 digital camera and
a Motic K400 dissecting microscope. For cross section observation, the
materials were collected and fixed as described (Li et al., 2006). Floral
tissues were embedded in Spurr’s resin (Sigma-Aldrich); semithin (4 mm)
sections were made using an Ultracut E ultramicrotome (Leica Micro-
systems) and stainedwith 0.05% toluidine blue (Li et al., 2006). Transverse
sectionswere photographed using a Nikon E600microscope and a Nikon
DXM1200 digital camera. For transmission electron microscopy obser-
vation, anthers were fixed, washed, embedded, and stained as described
previously (Li et al., 2006) and examined with a JEM-1230 transmission
electron microscope (JEOL). For scanning electron microscopy observa-
tion, anthers were collected and processed essentially as described by
Keijzer et al. (1996) and observed with a JSM-6360LV scanning electron
microscope (JEOL). For preparing the free-hand sections, the materials
were fixed into a hole of a radish block. Transverse sections were then
madeby hand-sectioning. The sectionswere photographedusing aNikon
E600 microscope and a Nikon DXM1200 digital camera.
For DAPI staining to stain nuclei, samples were fixed overnight in FAA
(50% ethanol, 10% formalin, and 5% acetic acid). Then, the microspores
were squeezed out to the slide and stained with two to three drops of
DAPI stain solution (1.25 mg mL21 in 0.1*PBS). After being covered with a
cover glass, the nuclei were examined under the fluorescence micro-
scope immediately.
Soluble Sugar Assays by GC-MS and Starch Measurement
Metabolites were analyzed essentially as previously described (Lisec
et al., 2006). About fifty milligrams (fresh weight) of anther, lemma/palea,
or flag leaf were harvested and ground into a fine powder in liquid
nitrogen. Seven hundred microliters of methanol was immediately added
to the powder to stop enzymatic activity, and 50 mL of 0.2 ngmL21 rabitol
(Sigma-Aldrich) was then added. After centrifugation at 10,000g for 2min,
the supernatant was transferred to a new tube and dried for sugar assay,
and the remaining pellet was used to assay starch content using a starch
assay kit (product number SA20-1KT; Sigma-Aldrich). For methoxima-
tion, 40 mL of methoxyamine hydrochloride in pyridine (20 mgmL21) was
used at 308C for 90 min. Afterward, 40 mL of N-methyl-N-trimethylsilyl-
trifluoroacetamide was added, and themixture was incubated at 378C for
30 min. GC-MS analysis was performed using an Agilent 6890 series gas
chromatograph fitted with a capillary column (0.25 mm3 30 m, 0.25-mm
film thickness [HP-5MS]). The gas chromatograph was combined with a
quadrupole mass selective detector (Agilent). Samples (2 mL) were
injected at a 1:25 split ratio into a GC-MS system. The detector and
injector temperature were maintained at 2808C. The temperature pro-
gram was as follows: isothermal for 2 min at 708C, followed by a 58C per
min ramp to 1308C, then 108C per min ramp to 1808C, then 58C per min
ramp to 2858C and holding at this temperature for 10 min. Nitrogen was
used as the carrier gas at a flow rate of 20 mL min21.
Radiolabeling
According to the definition by Felker et al. (1984), the wild-type and csa
stems containing internodes I to IV, the flag leaf, and flowers were placed
and incubated in water containing 1 mCi [fructose-U-14C]sucrose
(21.8 GBq mmol21 in 9:1 ethanol:water; MP Biochemicals), and the
internode IV was submerged in the water directly. We detected the
amount of isotope using the middle regions of internodes I, II, and III.
The wild-type and csa panicles with;100 flowers were excised at stages
9, 11, and 13, and each panicle was transferred into 0.1 mL water
containing 1 mCi [fructose-U-14C]sucrose for 1, 6, and 12 h at room
temperature, using the panicle in water without 14C-labeled sucrose as
control. We then collected the lemma, palea, and anther for analysis. The
materials were incubated with 300 mL of 60% HClO4 and 600 mL of H2O2
at 558C for 15 h until the samples appeared clear. After cooling to room
temperature, 3 mL of scintillation fluid [6 g 2,5-diphenyloxazole (PPO),
0.075 g p-bis-2-(5-phenyloxazolyl)-benzene (POPPO), 250 mL Triton
X-100, and toluene to 1 liter] and 5 mL of 2-methoxyethanol were added
and mixed. The radioactivity (cpm) was measured by liquid scintillation
counting (Beckman LS650) (Eksittikul et al., 2001). Counting of isotope
signals was performed with at least three biological replicates.
Thin Layer Chromatography of 14C-Sugars
The 14C-sugars in the anther after a 1- and 12-h treatment were extracted
using 80% ethanol at 808C for 10 min and applied to silica gel 60 F254
plates (20 3 20 cm in size, 0.25 cm in layer thickness; Merck). The
chromatograms were performed using an ascending solvent system of
ethyl acetate:acetic acid:methanol:water (60:15:15:10 by volume). Sug-
ars were detected using 1,3-dihydroxynaphthalene (CAS #132-86-5; Alfa
Aesar) visualizing reagent (Ruan and Patrick, 1995). Standards of su-
crose, glucose, and fructose (Sigma-Aldrich) were used as the reference
control. The corresponding bands were scraped into the isotope tube,
and 2 mL ethanol and 3 mL of scintillation fluid were added and mixed.
The radioactivity (cpm) was measured using the similar conditions as
described above, and three biological replicates were tested.
Molecular Cloning of CSA
For mapping of the CSA locus, total DNA was isolated using the CTAB
(cetyl trimethyl ammonium bromide) method from rice leaves of each
selected plant. InDel (insertion-deletion) markers were developed ac-
cording to the sequence difference between the genome sequence of
Japonica Nipponpare and Indica 9311 (Li et al., 2006). Polymorphism
regions between the two rice subspecies were identified by aligning the
BAC clones sequences of Japonica and Indica, and the primers used for
gene mapping were designed based on the polymorphism regions. The
primers for molecular cloning of CSA are listed in Supplemental Table 4
online. The PCR products were separated on 6% polyacrylamide dena-
turing gels, and bands were visualized by silver staining (Xu et al., 2002).
Complementation of the csaMutant
For complementation, ;4.3-kb genomic DNA fragment containing the
entire CSA coding region, a 2151-bp upstream sequence, and a 525-bp
downstream sequence was amplified from BAC clone OSJNBb0058A16
(kindly provided by B. Han, National Center for Gene Research, Shanghai
Institutes for Biological Sciences, Chinese Academy of Sciences) with
primer MYBPF 59-GGATCCGCTATGCACCTAGACGAGTGTTGTC-39
and MYBR 59-GAATTCGTGACCACTGAGCAAGGAGTAGCTC-39; at-
tached restriction enzyme sites BamHI and EcoRI are underlined. The
amplified fragment was cloned into pMD18-T (TaKaRa), released by
BamHI-EcoRI digestion, and subcloned into BamHI-EcoRI–digested
binary vector pCAMBIA1301 (CAMBIA; hygromycin resistance). Then,
the calli induced using the homogenous csa young panicles, whichmainly
included palea and lemma, were used for transformation with Agro-
bacterium tumefaciens EHA105 carrying the p1301CSA plasmid as
previously described by Hiei et al. (1997).
CSA Nuclear Localization Analysis
The GFP cDNA was amplified from pBSK-GFP vector with the following
primers: 59-CCCGGGATGGGTAAAGGAGAAGAACTTTTCACTG-39 and
59-GAGCTCTTATTTGTATAGTTCATCCATGCCATGTG-39 (attached
CSA Regulates Sugar Partitioning in Rice Anther 685

restriction enzyme sites SacI and SmaI are underlined). The PCR product
was cloned into pMD18-T vector (TaKaRa) and was released by SacI-
SmaI digestion, then was subcloned into the SacI-PmacI–digested
pBI121 vector containing the cauliflower mosaic virus 35S promoter to
generate p121-GFP. The CSA cDNA (AK107461 provided by RGRC) was
amplified from the cDNA clone vector pCMVFL3 (RGRC-NIAS; http://
www.rgrc.dna.affrc.go.jp/stock.html) with primers (59-TCTAGAATGG-
CTCACGAGATGATGGGTG-39 and 59-CCCGGGTGTCGCGCCGACG-
CCGAGGAAG-39, attached restriction site is underlined). The amplified
fragment was digested with XbaI-SmaI and ligated with the same enzyme
digested p121-GFP to create p121-CSA-GFP. Transient expression of
the p121-CSA-GFP fusion and p121-GFP alone (as a control) in the onion
epidermis was performed as previously described (Collings et al., 2000)
using a helium biolistic device (Bio-Rad PDS-1000). The samples were
observed with a confocal laser microscope (Zeiss LSM510).
Phylogenetic Analysis
We constructed neighbor-joining (NJ) trees using the MEGA software
(version 3.1) (http://www.megasoftware.net/index.html) (Kumar et al.,
2004) with the following parameters: Poisson correction, pairwise dele-
tion, and bootstrap (1000 replicates; random seed). The MrBayes soft-
ware (Huelsenbeck and Ronquist, 2001; Ronquist and Huelsenbeck,
2003) was used to construct Bayesian trees after running for 106 gener-
ations, with four Markov chains, and sampled every 1000 generations.
The WAG model was used for amino acid substitutions (Whelan et al.,
2001), and invariable plus eight categories of g-distributed substitution
rateswere used to correct the among-site substitution rate heterogeneity.
NJ tree was shown with bootstrap values fromNJ and Bayesian posterior
probability, unless otherwise indicated. When only one value is shown, it
is the NJ bootstrap values.
RT-PCR and Quantitative PCR Assay
Total RNA was isolated from rice tissues (root shoot, leaf, lemma/palea,
and anthers) at different stages with the Trizol Reagent kit (Invitrogen)
according to themanufacturer’s protocol. The stages of rice anthers were
classified according to Zhang and Wilson (2009). After treatment with
DNase (Promega), the isolated 0.3 mg RNA was reverse transcribed to
synthesize first-strand cDNA using the ReverTra Ace-a-First-Strand
cDNA synthesis kit (TOYOBO). Three microliters of the reverse transcrip-
tion products were used as template in the following PCR reaction. PCR
was performed with TaKaRa Ex Taq DNA polymerase for 34 cycles of
denaturation for 40 s at 948C, annealing for 40 s at 588C, and extension for
1 min at 728C, followed by a final extension for 5 min. Quantitative PCR
analysis was performed using SYBR Premix EX Taq (TaKaRa) on a Rotor-
Gene RG3000A detection system (Corbett Research). All PCR experi-
ments were conducted in a reaction mixture containing 10 pmole each
primer and 3 mMmagnesium chloride, and 2 mL of the reverse transcrip-
tion products were used as template. Samples were denatured for 5 min
at 948C; followed by 40 cycles of 20 s of denaturation at 958C, 30 s of
annealing at 608C, and 30 s of elongation at 728C; followed lastly by one
cycle of 1 s of denaturation at 958C, 30 s of annealing at 658C, and 30 s of
denaturation at 958C. After the renaturation, the melting parameters were
assessed. Each experiment was repeated six times. Data acquisition and
analyses were performed using the method described by Roter-Gene
version 6.0 (Build 38) software. Samples were normalized using ACTIN1
expression; the relative expression levels weremeasured using the 2(2DCt)
analysis method.
In Situ Hybridization
Tissues of wild-type flowers at various developmental stages and roots
were fixed in 5% acetic acid, 50% ethanol, and 3.7% formaldehyde in
water for 16 h at 48C. After dehydration through an ethanol series, tissues
were embedded in Paraplast Plus (Oxford Labware) and sectioned at
8-mm thickness using an YL3-A rotary microtome (Shanghai Instrument
Factory). After sequence analysis, a 389-bp CSA cDNA fragment (577 to
965) and a 263-bpMST8 fragment (1384 to 1646) with less similarity with
other rice genes were amplified using RT-PCR as described above,
respectively. The PCR products were confirmed by sequencing and
cloned into pBluescript II KS+ phagemid vector (Stratagene) at the
BamHI-HindIII sites. Then, these segments were transcribed in vitro
under SP6 or T7 promoter with RNA polymerase using the DIG RNA
labeling kit (Roche). The mixture was prepared for the DIG-labeled RNA
antisense or sense probe. RNA hybridization and immunological detec-
tion of the hybridized probeswere performed according to the protocol of
Kouchi and Hata (1993). Images were obtained using the Olympus Nikon
E600 microscope.
Protein Expression and CSA Antibody Production
To produce the specific antibody for theChIP experiment, aCSA-specific
fragment (the coding sequence, from 487 to 795) was synthesized based
on the bacterial preferred codon usage (Qian et al., 2006) and cloned into
pET-32a vector (Novagen) to produce pET32a-CSA. The fusion protein
expression and purification were performed according to the manufac-
turer’s instructions, and antibody preparation in rabbit was performed as
described by Huang et al. (2003).
For the EMSA experiment, recombinant CSA protein was produced in
Escherichia coli using the full-length coding sequence of CSA synthe-
sized based on the bacterial preferred codon usage (Qian et al., 2006).
The synthesized CSA was cloned into pET30a vector (Novagen). Re-
combinant CSA protein was induced and affinity purified as above.
Protein Gel Blotting
Nuclei extracts were produced following the protocol that was used for
the ChIP experiments, except that the flower material was not fixed.
Proteins were separated on 12%SDS-PAGE gels and electroblotted onto
Hybond-C nitrocellulose membrane (RPN 303C; Amersham). Mem-
branes were blocked for 1 h with 5% BSA in PBS-Tween buffer (137
mM NaCl, 268 mM KCl, 47 mM KH2PO4, 8.1 mM Na2HPO4, and 0.05%
Tween, pH 7.4). Immunoprobing of CSA was conducted with the anti-
CSA polyclonal antibody for 2 h at room temperature at a dilution of 1:500
in PBS. Three washes of 5min eachwere performedwith PBS-Tween. An
anti-rabbit IgG conjugated with alkaline phosphatase was used as the
secondary antibody at 1:3000 dilution for 1 h at room temperature. Three
washes of 5 min each were performed with PBS-Tween, and target
proteins were visualized using 4-nitro blue tetrazoliu chloride (Roche) and
5-bromo-4-chloro-3-indolyl phosphate (Roche), according to the SABC
(streptavidin-biotin-peroxidase complex) method (Xing et al., 2009).
Histone H3 was used as a loading control for protein levels with Anti-
Histone H3 monoclonal antibody (Millipore) at a dilution of 1:1000.
ChIP and Quantitative PCR Analysis
The procedure for ChIP of CSA-DNA complexes in rice wild type was
modified from Haring et al. (2007). Rice spikelets at stages 9 and 11 were
fixed with formaldehyde under vacuum. Chromatin was isolated and
sonicated to produce DNA fragments shorter than 500 bp. Some
untreated sonicated chromatin was reversely cross-linked and used as
the total input DNA control. Immunoprecipitation with CSA-specific
immune antiserum and without any serum was performed as the refer-
ence above.
The amounts of genomic DNA immunoprecipitated were assayed by
real-time quantitative PCR using the same conditions as for quantitative
RT-PCR. For a PCR reaction, 0.5 mL of recovered DNA from ChIP or
686 The Plant Cell

controls or 1 mL of input DNA diluted 50-fold was added as template.
Each reaction was repeated four times. Quantification involved normal-
ization of each immune precipitation (IP) or control sample Ct to the input
DNA sample Ct to obtain a DCt (DCt IP or DCt Control), and then the
relative enrichment of each fragment was calculated using the following
equation: 22(DCt IP 2 DCt control). An unrelated DNA sequence from the rice
ACTIN1 gene was used as an internal control (Li et al., 2006). Primer
sequences used for the ChIP enrichment test are listed in Supplemental
Table 6 online.
EMSA
The DNA fragments containing the two CCAAT-boxes of the rice MST8
regulatory region, AGAAGC—CAACGG—CAACGG—TGGTC, were gen-
erated using PCR amplification with the following specific primers:
EMSAF (59-AGAAGCCAGCCTTGCGTCCAT-39) and EMSAR (59-GAC-
CAACTAATTATTTATCCG-39). The DNA fragment was cloned into
pMD18-T vector (TaKaRa) for sequence confirmation. Then, the fragment
was labeled with DIG-labeled kit (DDLK-010) using the specific primers.
The DNA binding reactions were performed according to Wang et al.
(2002) with the following modifications. Reaction components were
incubated in binding buffer [10 mM Tris-HCl, pH 7.5, 50 mM NaCl,
1 mM EDTA, 5% glycerol, 0.05 mg mL21 poly(dI-dC), and 0.1 mg mL21
BSA] at room temperature for 20 min. The entire reaction mixture was
analyzed on a 5% PAGE gel. After drying the gel, DIG-labeled DNA
fragments were detected.
Accession Numbers
Sequence data from this article for the mRNA and genomic DNA of CSA
can be found in the GenBank/EMBL data libraries under accession
numbers NM_001049255 and NC_008394, respectively. GenBank
accession numbers of all genes used in this study are AY822464
(MST8), AY220486 (INV4), AF419298 (SUT3), AF249880 (UGP2),
DQ395328 (UGP1), X62134 (GBSS1), X16280 (ACTIN1), NP197282 (At
MYB56), NP177115 (At MYB105), NP564261 (At MYB117), BAF23796
(Os08g33800), and CAA67000 (Os GAMYB).
Supplemental Data
The following materials are available in the online version of this article.
Supplemental Figure 1. Scanning Electron Microscopy Observations
of the Wild-Type and csa Anthers at Stage 13.
Supplemental Figure 2. DAPI Staining Showing Microspore Devel-
opment of the Wild Type and csa.
Supplemental Figure 3. Transmission Electron Micrographs of the
Anthers from the Wild Type and csa.
Supplemental Figure 4. 14C-Signal Accumulation in the Anther and
Lemma/Palea of the Wild Type and csa after 1, 6, and 12 h of
Treatment of [14C]Sucrose.
Supplemental Figure 5. Nucleotide and Amino Acid Sequences
of CSA.
Supplemental Figure 6. Sequence Alignment of CSA and Its Close
Homologs.
Supplemental Figure 7. Analysis of GUS Activity in the pCSA-GUS
Line.
Supplemental Figure 8. In Situ Analysis of the MST8 Expression in
the Anther.
Supplemental Figure 9. Protein Gel Blot Analysis of CSA in the
Nuclear Protein Extracts of Wild-Type and csa Flowers.
Supplemental Figure 10. Quantitative PCR Analyses of Relative
mRNA Levels of Genes Involved in Sugar Partitioning in the Anther
and Lemma/Palea.
Supplemental Table 1. Sugar and Starch Level Profiles in the Wild
Type and the csa Mutant.
Supplemental Table 2. 14C-Signal Accumulation in the Wild-Type
and csa Mutant Lemma/Palea, Anther, and Stem.
Supplemental Table 3. Accumulation of [14C]Sucrose and [14C]
Hexose in the Wild-Type and csa Anthers at Stage 13 after 1- and
12-h Treatment.
Supplemental Table 4. List of the Primers Used for Mapping and RT-
qPCR Analyses.
Supplemental Table 5. Sucrose and Starch Levels in the Flag Leaf of
Complemented csa Lines at Stage 13 of Anther Development.
Supplemental Table 6. List of the Primers Used for ChIP Enrichment
Assay.
Supplemental Data Set 1. Text File of the Alignment Used for the
Phylogenetic Analysis Shown in Figure 6I.
ACKOWLEDGEMENTS
We thank the anonymous reviewers for very helpful comments and B.
Han and the RGRC for providing BAC clone and cDNA clone, respec-
tively. We thank Z.-J. Luo and M.-J. Chen for mutant screening and
generation of F2 populations, X.-Y. Gao for plastic sections, scanning
electron microscopy, and transmission electron microscopy and X.-Y.
Chen for isotope detection. We also thank Y.-M. Liu, W. Jia and Y.-P.
Qiu for GC-MS assay. D.-M. Braun, Y. Zhang, and D. Werck-Reichhart
are gratefully acknowledged for their valuable suggestions and editing
on this manuscript. This work was supported by the Funds from the
National Basic Research Program of China (2009CB941500), the Na-
tional “863” High-Tech Project (2006AA10A102 and 2007AA10Z112),
the National Natural Science Foundation of China (30725022, 30830014,
and 90717109), the Chinese Transgenic Project (2009ZX08009-108B),
and the Shanghai Leading Academic Discipline Project (B205).
Received December 21, 2009; revised February 14, 2010; accepted
March 2, 2010; published March 19, 2010.
REFERENCES
Abebe, T., Skadsen, R.W., and Kaeppler, H.F. (2004). Cloning and
identification of highly expressed genes in barley lemma and palea.
Crop Sci. 44: 942–950.
Aoki, N., Hirose, T., Scofield, G.N., Whitfeld, P.R., and Furbank, R.T.
(2003). The sucrose transporter gene family in rice. Plant Cell Physiol.
44: 223–232.
Buttner, M. (2007). The monosaccharide transporter(-like) gene family
in Arabidopsis. FEBS Lett. 581: 2318–2324.
Chen, L., Chu, H.W., Yuan, Z., Pan, A.H., Liang, W.Q., Huang, H.,
Shen, M.S., Zhang, D., and Chen, L. (2006a). Isolation and genetic
analysis for rice mutants treated with 60 Co g-Ray. J. Xiamen Univ. 45:
82–85.
Chen, R., Zhao, X., Shao, Z., Wei, Z., Wang, Y., Zhu, L., Zhao, J., Sun,
M., He, R., and He, G. (2007). Rice UDP-glucose pyrophosphorylase1
is essential for pollen callose deposition and its cosuppression results
in a new type of thermosensitive genic male sterility. Plant Cell 19:
847–861.
CSA Regulates Sugar Partitioning in Rice Anther 687

Chen, Y.H., et al. (2006b). The MYB transcription factor superfamily of
Arabidopsis: expression analysis and phylogenetic comparison with
the rice MYB family. Plant Mol. Biol. 60: 107–124.
Clement, C., and Audran, J.C. (1995). Anther wall layers control pollen
sugar nutrition in Lilium. Protoplasma 187: 172–181.
Collings, D.A., Carter, C.N., Rink, J.C., Scott, A.C., Wyatt, S.E., and
Allen, N.S. (2000). Plant nuclei can contain extensive grooves and
invaginations. Plant Cell 12: 2425–2440.
Datta, R., Chamusco, K.C., and Chourey, P.S. (2002). Starch biosyn-
thesis during pollen maturation is associated with altered patterns of
gene expression in maize. Plant Physiol. 130: 1645–1656.
Eksittikul, T., Chulavatnatol, M., and Limpaseni, T. (2001). Charac-
terization of sucrose uptake system in cassava (Manihot esculenta
Crantz). Plant Sci. 160: 733–737.
Felker, F.C., Peterson, D.M., and Nelson, O.E. (1984). [C]Sucrose
uptake and labeling of starch in developing grains of normal and segl
barley. Plant Physiol. 74: 43–46.
Feng, J.H., Lu, Y.G., Liu, X.D., and Xu, X.B. (2001). Pollen development
and its stages in rice (Oryza sativa L.). Chin. J. Rice Sci. 15: 21–28.
Goetz, M., Godt, D.E., Guivarc’h, A., Kahmann, U., Chriqui, D., and
Roitsch, T. (2001). Induction of male sterility in plants by metabolic
engineering of the carbohydrate supply. Proc. Natl. Acad. Sci. USA
98: 6522–6527.
Gottwald, J.R., Krysan, P.J., Young, J.C., Evert, R.F., and Sussman,
M.R. (2000). Genetic evidence for the in planta role of phloem-specific
plasma membrane sucrose transporters. Proc. Natl. Acad. Sci. USA
97: 13979–13984.
Haring, M., Offermann, S., Danker, T., Horst, I., Peterhansel, C., and
Stam, M. (2007). Chromatin immunoprecipitation: Optimization,
quantitative analysis and data normalization. Plant Methods 3: 11.
Hiei, Y., Komari, T., and Kubo, T. (1997). Transformation of rice
mediated by Agrobacterium tumefaciens. Plant Mol. Biol. 35:
205–218.
Huang, Y., Liang, W., Pan, A., Zhou, Z., Huang, C., Chen, J., and
Zhang, D. (2003). Production of FaeG, the major subunit of K88
fimbriae, in transgenic tobacco plants and its immunogenicity in mice.
Infect. Immun. 71: 5436–5439.
Huelsenbeck, J.P., and Ronquist, F. (2001). MRBAYES: Bayesian
inference of phylogenetic trees. Bioinformatics 17: 754–755.
Kaneko, M., Inukai, Y., Ueguchi-Tanaka, M., Itoh, H., Izawa, T.,
Kobayashi, Y., Hattori, T., Miyao, A., Hirochika, H., Ashikari, M.,
and Matsuoka, M. (2004). Loss-of-function mutations of the rice
GAMYB gene impair alpha-amylase expression in aleurone and flower
development. Plant Cell 16: 33–44.
Keijzer, C.J., Leferink-ten Klooster, H.B., and Reinders, M.C. (1996).
The mechanism of the grass flower: Anther dehiscence and pollen
shedding in maize. Ann. Bot. (Lond.) 78: 15–21.
Kocal, N., Sonnewald, U., and Sonnewald, S. (2008). Cell wall-bound
invertase limits sucrose export and is involved in symptom develop-
ment and inhibition of photosynthesis during compatible interaction
between tomato and Xanthomonas campestris pv vesicatoria. Plant
Physiol. 148: 1523–1536.
Kouchi, H., and Hata, S. (1993). Isolation and characterization of novel
nodulin cDNAs representing genes expressed at early stages of
soybean nodule development. Mol. Gen. Genet. 238: 106–119.
Kumar, S., Tamura, K., and Nei, M. (2004). MEGA3: Integrated
software for molecular evolutionary genetics analysis and sequence
alignment. Brief. Bioinform. 5: 150–163.
Lalonde, S., Wipf, D., and Frommer, W.B. (2004). Transport mecha-
nisms for organic forms of carbon and nitrogen between source and
sink. Annu. Rev. Plant Biol. 55: 341–372.
Lemoine, R. (2000). Sucrose transporters in plants: Update on function
and structure. Biochim. Biophys. Acta 1465: 246–262.
Lescot, M., Dehais, P., Thijs, G., Marchal, K., Moreau, Y., Van de
Peer, Y., Rouze, P., and Rombauts, S. (2002). PlantCARE, a data-
base of plant cis-acting regulatory elements and a portal to tools for in
silico analysis of promoter sequences. Nucleic Acids Res. 30: 325–327.
Li, N., et al. (2006). The rice Tapetum Degeneration Retardation gene is
required for tapetum degradation and anther development. Plant Cell
18: 2999–3014.
Lisec, J., Schauer, N., Kopka, J., Willmitzer, L., and Fernie, A.R.
(2006). Gas chromatography mass spectrometry-based metabolite
profiling in plants. Nat. Protoc. 1: 387–396.
Lu, C.A., Ho, T.H., Ho, S.L., and Yu, S.M. (2002). Three novel MYB
proteins with one DNA binding repeat mediate sugar and hormone
regulation of alpha-amylase gene expression. Plant Cell 14: 1963–
1980.
Ma, H. (2005). Molecular genetic analyses of microsporogenesis and
microgametogenesis in flowering plants. Annu. Rev. Plant Biol. 56:
393–434.
Mamun, E.A., Alfred, S., Cantrill, L.C., Overall, R.L., and Sutton, B.G.
(2006). Effects of chilling on male gametophyte development in rice.
Cell Biol. Int. 30: 583–591.
McCormick, S. (2004). Control of male gametophyte development.
Plant Cell 16(Suppl): S142–S153.
Mu, H., Ke, J.H., Liu, W., Zhuang, C.X., and Yip, W. (2009). UDP-
glucose pyrophosphorylase2 (OsUgp2), a pollen-preferential gene in
rice, plays a critical role in starch accumulation during pollen matu-
ration. Chin. Sci. Bull. 54: 234–243.
Ngampanya, B., Sobolewska, A., Takeda, T., Toyofuku, K.,
Narangajavana, J., Ikeda, A., and Yamaguchi, J. (2003). Charac-
terization of rice functional monosaccharide transporter, OsMST5.
Biosci. Biotechnol. Biochem. 67: 556–562.
Ohdan, T., Francisco, P.B., Jr., Sawada, T., Hirose, T., Terao, T.,
Satoh, H., and Nakamura, Y. (2005). Expression profiling of genes
involved in starch synthesis in sink and source organs of rice. J. Exp.
Bot. 56: 3229–3244.
Oliver, S.N., Dennis, E.S., and Dolferus, R. (2007). ABA regulates
apoplastic sugar transport and is a potential signal for cold-induced
pollen sterility in rice. Plant Cell Physiol. 48: 1319–1330.
Oliver, S.N., Van Dongen, J.T., Alfred, S.C., Mamun, E.A., Zhao,
X., Saini, H.S., Fernandes, S.F., Blanchard, C.L., Sutton, B.G.,
Geigenberger, P., Dennis, E.S., and Dolferus, R. (2005). Cold-
induced repression of the rice anther-specific cell wall invertase gene
OSINV4 is correlated with sucrose accumulation and pollen sterility.
Plant Cell Environ. 28: 1534–1551.
Pacini, E., Guarnieri, M., and Nepi, M. (2006). Pollen carbohydrates
and water content during development, presentation, and dispersal: A
short review. Protoplasma 228: 73–77.
Qian, B., Shen, H., Xiong, J., Chen, L., Zhang, L., Jia, J., Wang, Y.,
Zhang, Z., Yuan, Z., Cao, K., and Zhang, D. (2006). Expression and
purification of the synthetic preS1 gene of Hepatitis B Virus with
preferred Escherichia coli codon preference. Protein Expr. Purif. 48:
74–80.
Ranwala, A.P., and Miller, W.B. (1998). Sucrose-cleaving enzymes and
carbohydrate pools in Lilium longiflorum floral organs. Physiol. Plant.
103: 541–550.
Rolland, F., Baena-Gonzalez, E., and Sheen, J. (2006). Sugar sensing
and signaling in plants: conserved and novel mechanisms. Annu. Rev.
Plant Biol. 57: 675–709.
Ronquist, F., and Huelsenbeck, J.P. (2003). MrBayes 3: Bayesian
phylogenetic inference under mixed models. Bioinformatics 19: 1572–
1574.
Ruan, Y.L., and Patrick, J.W. (1995). The cellular pathway of post-
phloem sugar transport in developing tomato fruit. Planta 196:
434–444.
688 The Plant Cell

Schneidereit, A., Scholz-Starke, J., and Buttner, M. (2003). Functional
characterization and expression analyses of the glucose-specific
AtSTP9 monosaccharide transporter in pollen of Arabidopsis. Plant
Physiol. 133: 182–190.
Schneidereit, A., Scholz-Starke, J., Sauer, N., and Buttner, M. (2005).
AtSTP11, a pollen tube-specific monosaccharide transporter in Arabi-
dopsis. Planta 221: 48–55.
Scholz-Starke, J., Buttner, M., and Sauer, N. (2003). AtSTP6, a new
pollen-specific H+-monosaccharide symporter from Arabidopsis.
Plant Physiol. 131: 70–77.
Scofield, G.N., Hirose, T., Aoki, N., and Furbank, R.T. (2007). In-
volvement of the sucrose transporter, OsSUT1, in the long-distance
pathway for assimilate transport in rice. J. Exp. Bot. 58: 3155–3169.
Scott, R., Spielman, M., and Dickinson, H. (2004). Stamen structure
and function. Plant Cell 16 (suppl.): S46–S60.
Sherson, S.M., Alford, H.L., Forbes, S.M., Wallace, G., and Smith,
S.M. (2003). Roles of cell-wall invertases and monosaccharide trans-
porters in the growth and development of Arabidopsis. J. Exp. Bot.
54: 525–531.
Slewinski, T.L., Meeley, R., and Braun, D.M. (2009). Sucrose trans-
porter1 functions in phloem loading in maize leaves. J. Exp. Bot. 60:
881–892.
Toyofuku, K., Kasahara, M., and Yamaguchi, J. (2000). Characteri-
zation and expression of monosaccharide transporters (OsMSTs) in
rice. Plant Cell Physiol. 41: 940–947.
Truernit, E., Stadler, R., Baier, K., and Sauer, N. (1999). A male
gametophyte-specific monosaccharide transporter in Arabidopsis.
Plant J. 17: 191–201.
Wang, E., et al. (2008a). Control of rice grain-filling and yield by a gene
with a potential signature of domestication. Nat. Genet. 40: 1370–1374.
Wang, H., Tang, W., Zhu, C., and Perry, S.E. (2002). A chromatin
immunoprecipitation (ChIP) approach to isolate genes regulated by
AGL15, a MADS domain protein that preferentially accumulates in
embryos. Plant J. 32: 831–843.
Wang, Y., Xiao, Y., Zhang, Y., Chai, C., Wei, G., Wei, X., Xu, H., Wang,
M., Ouwerkerk, P.B., and Zhu, Z. (2008b). Molecular cloning, func-
tional characterization and expression analysis of a novel monosac-
charide transporter gene OsMST6 from rice (Oryza sativa L.). Planta
228: 525–535.
Wang, Y., Xu, H., Wei, X., Chai, C., Xiao, Y., Zhang, Y., Chen, B.,
Xiao, G., Ouwerkerk, P.B., Wang, M., and Zhu, Z. (2007). Molecular
cloning and expression analysis of a monosaccharide transporter
gene OsMST4 from rice (Oryza sativa L.). Plant Mol. Biol. 65: 439–451.
Whelan, S., Lio, P., and Goldman, N. (2001). Molecular phylogenetics:
state-of-the-art methods for looking into the past. Trends Genet. 17:
262–272.
Woo, M.O., et al. (2008). Inactivation of the UGPase1 gene causes
genic male sterility and endosperm chalkiness in rice (Oryza sativa L.).
Plant J. 54: 190–204.
Xing, L., Li, J., Xu, Y., Xu, Z., and Chong, K. (2009). Phosphorylation
modification of wheat lectin VER2 is associated with vernalization-
induced O-GlcNAc signaling and intracellular motility. PLoS One 4:
e4854.
Xu, S.B., Tao, Y.F., Yang, Z.Q., and Chu, J.Y. (2002). A simple and
rapid methods used for silver staining and gel preservation. Hereditas
24: 335–336.
Zhang, D.B., and Wilson, Z.A. (2009). Stamen specification and anther
development in rice. Chin. Sci. Bull. 54: 2342–2353.
Zhu, Q.H., Ramm, K., Shivakkumar, R., Dennis, E.S., and Upadhyaya,
N.M. (2004). The ANTHER INDEHISCENCE1 gene encoding a single
MYB domain protein is involved in anther development in rice. Plant
Physiol. 135: 1514–1525.
CSA Regulates Sugar Partitioning in Rice Anther 689
DOI 10.1105/tpc.109.073668; originally published online March 19, 2010; 2010;22;672-689Plant Cell
Hui Zhang, Wanqi Liang, Xijia Yang, Xue Luo, Ning Jiang, Hong Ma and Dabing ZhangRequired for Rice Pollen Development
Encodes a MYB Domain Protein That Regulates Sugar PartitioningCarbon Starved Anther
This information is current as of July 26, 2018
Supplemental Data /content/suppl/2010/03/15/tpc.109.073668.DC1.html
References /content/22/3/672.full.html#ref-list-1
This article cites 62 articles, 16 of which can be accessed free at:
Permissions https://www.copyright.com/ccc/openurl.do?sid=pd_hw1532298X&issn=1532298X&WT.mc_id=pd_hw1532298X
eTOCs http://www.plantcell.org/cgi/alerts/ctmain
Sign up for eTOCs at:
CiteTrack Alerts http://www.plantcell.org/cgi/alerts/ctmain
Sign up for CiteTrack Alerts at:
Subscription Information http://www.aspb.org/publications/subscriptions.cfm
is available at:Plant Physiology and The Plant CellSubscription Information for
ADVANCING THE SCIENCE OF PLANT BIOLOGY © American Society of Plant Biologists


![Orchid Micropropagation Regeneration Competence of Anther ......Till now there is one report on anther culture in Orchids [8], but attempts to assess a similar competence of anther](https://img.pdfslide.net/doc/110x75/613f4770a7a58608c268d239/orchid-micropropagation-regeneration-competence-of-anther-till-now-there.jpg)