Embed Size (px)
Citation preview

Carbonaceous aerosol over the Indian Ocean: OC/EC fractions
and selected specifications from size-segregated onboard samples
C. Neusuß,1 T. Gnauk, A. Plewka, and H. HerrmannInstitut fur Tropospharenforschung, Leipzig, Germany
P. K. QuinnPacific Marine Environmental Laboratory, NOAA, Seattle, Washington, USA
Joint Institute for the Study of the Atmosphere and Ocean, University of Washington, Seattle, Washington, USA
Received 4 January 2001; revised 1 October 2001; accepted 15 October 2001; published 15 October 2002.
[1] Concentrations and mass fractions of organic carbon, elemental carbon, and numerousorganic species have been determined for submicrometer and supermicrometer particles inthe Indian Ocean on the cruise of the R/V Ron Brown during INDOEX in February/March1999. The total carbon (TC) concentration was low for air masses originating from thesouthern hemisphere of the Indian Ocean, where only small amounts of organic carbon (OC)could be detected in supermicrometer (sea salt) particles. The OC concentration wastypically more than one order of magnitude higher in the northern Indian Ocean, wherecontinental air masses were encountered, both for submicrometer and supermicrometerparticles. Elemental carbon (EC) was mostly found in submicrometer particles, increasingup to more than two orders of magnitude in the northern part compared to the southern partof the Indian Ocean. The mass fraction of carbonaceous material was in the range of 6–15%and 2–12% for submicrometer and supermicrometer particles, respectively, with the highervalues for more polluted air masses. A high degree of mixing with light scattering material isthe main reason for high-absorption coefficients. The absorption efficiency is higher forlower mass fractions of EC. Various short-chain dicarboxylic and hydroxylated dicarboxylicacids have been determined. Dicarboxylic acids were mostly found in supermicrometerparticles, whereas hydroxylated dicarboxylic acids showed up mainly in submicrometerparticles. Alkanes and polycyclic aromatic hydrocarbons have been found in small amounts,leading to the conclusion that an important part of the organicmaterial is of secondary origin.This is confirmed by the good correlation of the sum of carboxylic acids with OC, nitratewith a less pronounced correlation with sulfate. However, low OC/EC ratios indicate theexistence of primary OC. INDEX TERMS: 0305 Atmospheric Compposition and Structure: Aerosols
and particles (0345, 4801); 0365 Atmospheric Composition and Structure: Troposphere—composition and
chemistry; 0368 Atmospheric Composition and Structure: Troposphere—constituent transport and chemistry;
KEYWORDS: carbonaceous aerosol, size distribution, organic particulate matter
Citation: Neusuß, C., T. Gnauk, A. Plewka, H. Herrmann, and P. K. Quinn, Carbonaceous aerosol over the Indian Ocean: OC/EC
fractions and selected specifications from size-segregated onboard samples, J. Geophys. Res., 107(D19), 8031,
doi:10.1029/2001JD000327, 2002.
1. Introduction
[2] The amount, chemical composition, and the sizedistribution of atmospheric aerosol particles govern theirimpact on climate and toxicity. Carbonaceous material is amajor fraction of atmospheric aerosol particles [e.g., Heint-zenberg, 1989]. Elemental carbon (EC) is of special interestdue to its light-absorbing properties. Organic carbon (OC)contributes to scattering characteristics of atmospheric par-
ticles, for example, Penner [1995] and also contributes tothe absorption of light [e.g., Zappoli et al., 1999].[3] Several studies about carbon concentrations in polluted
continental environments and some for marine environmentsexist reviewed by Duce et al. [1983], Heintzenberg [1989],Penner [1995], and Heintzenberg et al. [2000]. However,there are only very limited data available for size-separatedOC and EC measurements. Due to different sources andeffects such measurements are necessary, especially inmarine environments, where anthropogenic sources influ-ence mainly fine particles, which are mixed with natural seasalt particles with the main mass in the coarse mode. Someexamples for the size distribution of OC and EC can be foundin the works of Countess et al. [1981], McMurry and Zhang
JOURNAL OF GEOPHYSICAL RESEARCH, VOL. 107, NO. D19, 8031, doi:10.1029/2001JD000327, 2002
1Now at Bruker Saxonia Analytik GmbH, Leipzig, Germany.
Copyright 2002 by the American Geophysical Union.0148-0227/02/2001JD000327$09.00
INX2 30 - 1

[1989], Nunes and Pio [1993], Berner et al. [1996], andKleemann et al. [1999]. These studies, however, are dealingwith polluted, continental aerosol samples. Heintzenberg[1982] and Kaneyasu and Murayama [2000] studied the sizedistribution of black carbon (BC) in marine samples.[4] With the exception of natural biomass burning EC
entirely results from anthropogenic combustion processes,whereas OC can have several sources. These include directemission due to incomplete combustion of fossil fuel orbiomass and the atmospheric conversion of volatile organiccompounds (VOCs) into less volatile species which subse-quently transfer into the particulate phase. Direct particleemission as well as the emission of particle OC precursorsoccur as a result of both anthropogenic and natural processes.[5] The knowledge about processes and budgets involving
particulate organic material is rather incomplete. One reasonis the fact that typically only 10% of the organic carbon isassigned to single species [Rogge et al., 1993a] althoughlarger amounts of OC have been identified either in aged airmasses [Neusuß et al., 2000a] or by including more gener-alized groups of compounds such as macromolecular species[Zappoli et al., 1999]. Second, to date the methods to sampleorganic material and to separate OC from EC are not wellcharacterized [Countess, 1990; Hering et al., 1990; Huebertand Charlson, 2000; Jacobsen et al., 2000].[6] A large variety of organic species contribute to the
OC [e.g., Rogge et al., 1993a; Saxena and Hildemann,1996]. Particle organic composition influences the physico-chemical properties of aerosol particles. For example,humidity growth of organics-containing particles isenhanced or decreased with respect to inorganic ions[Saxena et al., 1995] and surface tension may be influenced[Shulman et al., 1996; Facchini et al., 1999] by organics.[7] Dicarboxylic acids are a main fraction of the known
organic material in atmospheric particles [Saxena andHildemann, 1996]. Several measurements indicate theirubiquitous occurrence [e.g., Kawamura et al., 1996a;Kawamura and Sakaguchi, 1999]. Photochemical processesappear to be the main sources of low molecular weightdicarboxylic acids. Direct sources such as combustion offossil fuels are of negligible importance. For sources oforganic acids in atmospheric particles see Schauer et al.[1996] and references therein.[8] In this contribution detailed information is presented
on the concentration and particle size distribution of (i) EC,(ii) OC, and (iii) selected organic species in the marineboundary layer aerosol over the Indian Ocean sampledduring the intensive field phase of the Indian Ocean Experi-ment (INDOEX) [Lelieveld et al., 2001]. Organic speciesinclude low molecular weight dicarboxylic acids, polycyclicaromatic hydrocarbons (PAH), and alkanes.[9] A large number of different methods exist for the
determination of particulate OC and EC. The method appliedhere and in other recent aerosol field studies from ourlaboratory [Muller, 1999; Neusuß et al., 2000a, 2000b,2002] is described in detail and discussed in view of thevariety of other existing methods. Results obtained here arediscussed in the context of the radiative properties of theIndian Ocean aerosol (cf. also Quinn et al. [2002b]).Regional influence on the aerosol composition are discussedby air mass analysis applying 4-day back trajectories [Quinnet al., 2002b]. The data on particulate content of EC, OC, and
speciated organic compounds are linked together and putinto context with results from other recent field campaigns.
2. Methods
2.1. Sampling
[10] Air was isokinetically sampled about 10 m above sealevel in front of the ship’s stack. Only air masses withoutcontamination, indicated by number of particles and relativewind speed and direction, were sampled. To this end, sam-pling was automatically switched off when particle numberconcentration rapidly increased, the relative wind directionwas forward of the beam or the relative wind speedwas below3 m/s. The air was heated slightly (2–10�C) to sample air at aconstant level of 55% RH. For a detailed description of theaerosol sample inlet see Quinn et al. [2002a].[11] Three-stage multijet cascade impactors [Berner et al.,
1979] were used to determine carbon and organic species.The 50% aerodynamic cutoff diameters, Dp, were 10, 1.1,and 0.18 mm, respectively. Thus, supermicrometer particleswere collected in the size range 1.1 mm < Dp< 10 mm andsubmicrometer particles in the range 0.18 < Dp < 1.1 mm.The sampling flow rate was 30 l/min.[12] Aluminum foil was used to sample for the determi-
nation of organic and elemental carbon (OC/EC). Tedlarfilm was used as the substrate for the subsequent analysis oforganic ions by capillary electrophoresis (CE). In the lattercase Pyrofoil
1
covered part of the Tedlar film in order todetermine semivolatile organic species by Curie pointpyrolysis-gas chromatography/mass spectrometry (CPP-GC/MS) from the same sample.[13] The impactors sampling for the analysis of carbon
were equipped with two quartz fiber filters in series behindthe impaction plates to account for particles with Dp < 0.18mm. The second filter should account for positive artifacts dueto adsorption of gas phase organics. However, during thiscampaign the difference of the two filters was in the range offield blanks. Consequently, values of the backup filters aredisregarded. The error caused by this procedure is small ascan be concluded from the carbon size distributions discussedbelow.[14] In total, 41 samples for the determination of carbon
have been taken continuously in time intervals of 12–48 h,depending on the available aerosol concentration. Meanconcentrations are reported as time-averaged values. 7samples have been analyzed for organic species.[15] Furthermore, a 7-stage multijet cascade impactor
(50% cutoffs: 0.18/0.3/0.54/1.1/2.0/4.1/10.3 mm) was usedto obtain three examples of the size distribution of carbon.
2.2. Carbon
[16] Carbon was determined in this study separatingOC/EC with a thermographic method using a commercialcarbon analyzer (C-mat 5500, Strohlein, Germany) consist-ing of a free programmable combustion furnace (IR 05)followed by a resistance oven (D03 GTE) holding the CuOcatalyst (to convert carbon quantitatively to carbon dioxide)at 850�C, and a NDIR detector measuring the IR absorptionof the formed carbon dioxide. Analyses were carried outplacing samples in a quartz tube positioned in the center ofthe IR oven and heating rapidly under different conditions.As carrier gases in a first step nitrogen (5.0) for OC
INX2 30 - 2 NEUSUß ET AL.: CARBONACEOUS AEROSOL OVER THE INDIAN OCEAN

volatilization at 590�C and in a second step oxygen (4.5) forEC combustion at 650�C were applied. In between the tworuns the IR furnace was cooled down to 50�C to avoid EClosses during flushing with oxygen. The duration of eachrun was 8 min and thermograms of every run were stored ina computer. Quantification was performed by integration ofthe area below the thermogram curve.[17] The OC-defining temperature of 590�C was chosen
with respect to the same Curie point temperature of thesampling foils employed simultaneously to detect organicsingle species byCPP-GC/MS (see beneath). Aluminum foilsare the most appropriate substrate for impactor sampling(carbon-free production process resulting in low blank val-ues, cheap). The melting point of 659�C restricts the ECdetermination to this temperature. However, tests with carbonblack and natural soot (sampled on quartz filters) show thatonly 2–3% of the TC evolves between 650�C and 850�C.Thus, EC (and TC) does not contain carbonate carbonevolving at temperatures > 650�C [Petzold and Nießsner,1996].[18] Calibration of the instrument was performed using
external standards (e.g., a solution of potassium hydrogenphthalate containing 10 mg C in 100 ml solution). FivefoldEC analysis of 62 high volume samples result in a coef-ficient of variation of 4.7%.[19] The detection limit of the carbon analyzer was
determined to be 0.3 mg carbon. Several field blanks havebeen taken by handling the aluminum foils in the samematter as the sampled substrates, but without drawing airthrough the impactors. Field blank mean values (averagedover 9 blanks) were 5.8 ± 1.1 mg and 1.3 ± 0.5 mg for OCand EC, respectively, resulting in detection limits (95%confidence level) of 0.16 mg/m3 and 0.07 mg/m3 for OCand EC, respectively, for a typical day/night samplingperiod. Since the sampling period was extended up to awhole day (in one case up to two days) for clean air massesthe detection limit is proportionately lower. These valuescan be taken as uncertainty for the chemical analysis, apartfrom below mentioned OC/EC-split. Sampling artifacts areunknown and therefore have not been corrected for.[20] OC/EC-separation can be carried out inmany different
ways. Methods have been developed including extractionsteps to remove OC with organic solvents, acids, bases andwater [Cadle and Groblicki, 1980; Japar et al., 1984; Kuhl-busch, 1994; VDI 2465 Bl.1, 1996]. Dry thermal desorptionmethods under an inert gas [Malissa et al., 1976;Cadle et al.,1980; Ogren et al., 1983; Ulrich et al., 1990; VDI 2465 Bl.2,1997], air [Cadle and Groblicki, 1980; Cadle et al., 1981] oroxygen atmosphere [Malissa et al., 1976; Novakov, 1982;Cachier et al., 1989; Lavanchy et al., 1999] with a wide rangeof conditions also have been applied. Furthermore, combina-tions of both wet and drymethods have been used [Iwatsuki etal., 1998; Zappoli et al., 1999]. In addition, optical pyrolysiscorrection procedures have been developed and incorporatedin existing instruments [Johnson et al., 1981; Huntzicker etal., 1982; Japar et al., 1984; Chow et al., 1993].[21] With respect to the highly desirable comparability of
carbon measurement values from different research groupsinter-laboratory method comparison studies were performed[e.g., Cadle and Mulawa, 1990; Countess, 1990; Shah andRau, 1991]. Our laboratory participated in the Germany-internal VDI/DIN-comparison experiment for EC determi-
nation [Neuroth et al., 1999] and in the International AerosolCarbon Round Robin Test Carbon Shoot Out Stage I [Schmidet al., 2001] as well as Stage II [manuscript in preparation].[22] All experiments have shown sufficient comparability
of TC values but a wide variety in the results of OC and ECdeterminations. A survey of the results seems to show atendency for higher EC values by pure thermographicmethods resulting in lower OC. However, the basis in thesecomparisons is the mean value of all participants, the truevalue remains unknown.[23] Compared to extraction methods thermal desorption
methods are easier to practice, in fact they seem to be theonly reliable method for impactor samples since extractionof impactor foils bears the risk of washing away part of thesample.[24] With thermal desorption methods a main difficulty
consists of the definition of an OC/EC separation point thatenables complete OC volatilization without EC losses or ECartifact formation by charring processes during volatilization.[25] From test series with organic compounds relevant in
atmospheric processes it was evident that 590�C over 8 minmay not be sufficient for quantitative volatilization in allcases. For methanesulfonate (MSA) or dicarboxylic acidslosses of 5–20%were observed,whereas PAHs like pyrene orbenzo[ghi]perylene were found to be volatilized quantita-tively. Higher temperatures up to 850�C led to higher OCyields indicating that the incomplete OC determination wasnot only caused by charring processes during heating but alsoby incomplete volatilization. Detailed results will not bepresented here since the degree of volatilization of ioniccompounds (accounting for the least volatile species) stronglydepends on total ionic composition. For example, oxalic acid,a major aerosol constituent (see below), will dissociate in wetparticles and, in the presence of calcium (as part of sea salt),possibly form the less soluble calcium oxalate. This speciesdecomposes by heating to form CaCO3 (which is stableagainst further thermal decomposition up to 650�C andhigher) and CO (which will be measured as CO2). Thus, inthe case of total transformation to calcium oxalate only 50%of oxalic acid would be determined as OC. Comparablereactions might occur for other ionic compounds. Suchphenomena have been observed in the analysis of atmos-pheric aerosol particles [Novakov and Corrigan, 1995].[26] With respect to oxidizing methods for the separation
of OC and EC the volatilization procedure used here has theimportant advantage of being short in time (8 min versus 1–3 h) which makes it suitable for the large number of samplesresulting from size-fractionating and long term analysis.Nevertheless, charring is expected to be higher. This meansthat the method applied here provides a lower limit for OCand upper limit for EC. Higher OC volatilization temper-atures result in higher OC/EC ratios. For some samples incentral Europe the difference between 590�C and 650�C hasbeen determined to be in the range of 15%. However, anupper temperature limit of about 650�C due to the meltingpoint of aluminum exists.[27] In summary, there is no generally accepted procedure
for OC/EC separation until now, all results are depending ofthe method applied and therefore results from differentexperiments are difficult to compare. The method used hereleads typically to lower OC/EC ratios compared to relatedtechniques. However, the lack of positive sampling artifact
NEUSUß ET AL.: CARBONACEOUS AEROSOL OVER THE INDIAN OCEAN INX2 30 - 3
and the short analysis time provides are main advantages ofthe applied methods. The OC/EC determination develop-ment and characterization will be discussed elsewhere inmore detail [Gnauk et al., in preparation].[28] To convert organic carbon (OC) to organic matter
(OM) a conversion factor of 1.6 is used. This value resultsfrom an estimation for strongly anthropogenic influencedaerosols based on a recent study by Turpin and Lim [2000].Although the specification of organic material that the citedstudy is based on was incomplete, such conversion factorsare necessary to derive mass fractions of organic material.
The results discussed in this paper show that during theINDOEX campaign highly oxidized material (i. e. carbox-ylic acids that would result in a large conversion factor) wasfound to a much larger extent than low oxidized material(i. e. alkanes, PAHs etc. that would result in low conversionfactors). Thus, the use of a factor of 1.6 is expected to be aconservative estimation of organic matter.
2.3. Absorption
[29] The absorption for submicrometer and supermicrom-eter particles was determined at 550 nm and 55% RH by
Figure 1. Total carbon concentration (OC + EC, submicrometer + supermicrometer) along the RonaldH. Brown cruise trip during INDOEX. The dark marked parts indicate periods with organic specification(A–G). For the beginning and the end of these samples, isentropic 7-day backtrajectories ending in 950hPa are shown. The ship position is indicated for the start and stop times of the carbon samples.
INX2 30 - 4 NEUSUß ET AL.: CARBONACEOUS AEROSOL OVER THE INDIAN OCEAN
measuring the change in transmission through a filter with aParticle Soot Absorption Photometer (PSAP, RadianceResearch). Measured values were corrected for scattering,spot size, flow rate and the manufacturer’s calibrationaccording to Anderson et al. [1999] and Bond et al. [1999].
2.4. Organic Specification
[30] Aliphatic and hydroxylated organic acids as well assemivolatile compounds were determined using a com-bined method of capillary electrophoresis (CE) and Curiepoint pyrolysis-gas chromatography/mass spectrometry(CPP-GC/MS). Both methods require only small sampleamounts and avoid extensive purification or derivatizationprocedures.[31] Briefly, for determination of organic acids the Tedlar
films were cut into small pieces and leached into 0.75 mLpure water. After filtration the solutions were analyzed bycapillary zone electrophoresis with indirect UV detection. Ap-amino-benzoic acid based electrolyte (pH 9.5) and detec-tion at 254 nm is applied. Quantification is performed bycomparing the peak areas with those of external standards.[32] Semivolatile compounds were determined by heating
the exposed Pyrofoil1 (Fe-Ni-alloy) rapidly due to absorp-tion of a radio frequency magnetic field by the ferromag-netic material. At the Curie point temperature (here 590�C),which is reached within milliseconds, the ferromagnetismchanges to paramagnetism and the heating effect ceases.The volatile and semivolatile organic compounds evaporatefrom the foil and are flushed into the GC by helium. Thesubstances were separated by a CP-Sil-5 capillary andidentified by a quadrupol mass spectrometer with an elec-tron impact ionization source (Trio 1000). The quantifica-tion is performed by comparing the peak areas with those ofinternal deuterated standards and calculating response fac-tors with external standards, respectively. The methods aredescribed in detail in the work of Neusuß et al. [2000a].
2.5. Mass
[33] Particle mass was obtained by weighing the substratesbefore and after sampling. A Cahn Model 29 microbalancewas used at a relative humidity of 33 ± 3%. Thus, the massincludes water associated with the sampled particles at 33%RH. A detailed description of the weighing procedure isgiven by Quinn and Coffmann [1998].
[34] The weighing was performed for samples taken by atwo stage impactor resulting in mass concentrations forsupermicrometer particles (Dp = 1.1–10 mm) and submi-crometer particles (Dp < 1.1 mm). Therefore, the submi-crometer mass includes particles with Dp < 0.18 mm, incontrast to the submicrometer carbon mass. From mass sizedistributions with 7-stage impactors (as for the size segre-gated carbon with a filter behind the last stage) a factorconverting the mass of particles with Dp < 1.1 mm to themass of particles with Dp = 0.18–1.1 mm can be derived.This factor was determined to be 0.95 ± 0.01 and 0.85 ±0.05 for polluted and clean air masses, respectively, and wasused for correction.
3. Results
3.1. Meteorological Context
[35] In Figure 1 the cruise track of the Ronald H. Brownduring INDOEX is shown. The results of the organicspecification of the dark colored sampling periods (A–G)will be presented and discussed below. For the lattersamples back trajectories ending in 500 m calculated withHY-SPLIT 4 are shown [cf. Quinn et al., 2002b] (availableat http://www.noaa.gov/ready-bin/fnl.pl).[36] Despite an southwesterly flow bringing pristine air
from the southern Indian Ocean in the beginning of thecruise, a northerly to westerly airflow generally dominated.Thus continentally air mainly from India was transportedover a large part of the Indian Ocean. Air and seawatertemperature were always higher than 25�C, partly slightlyabove 30�C. The relative humidity was mostly higher than70%. Only short rain events occurred on the first legbetween Mauritius and the Maldives and in the Golf ofBengal, however, probably only accounting for a reasonablewash out in the latter case. For details of the meteorologicalcircumstances see the work of W. P. Ball et al. (Bulk andsize-segregated aerosol composition: Continental impactsduring INDOEX 1999, submitted to Journal of GeophysicalResearch, 2001).
3.2. Organic and Elemental Carbon
[37] Along with the cruise track the total carbon (TC)concentration is shown in Figure 1. The TC concentration
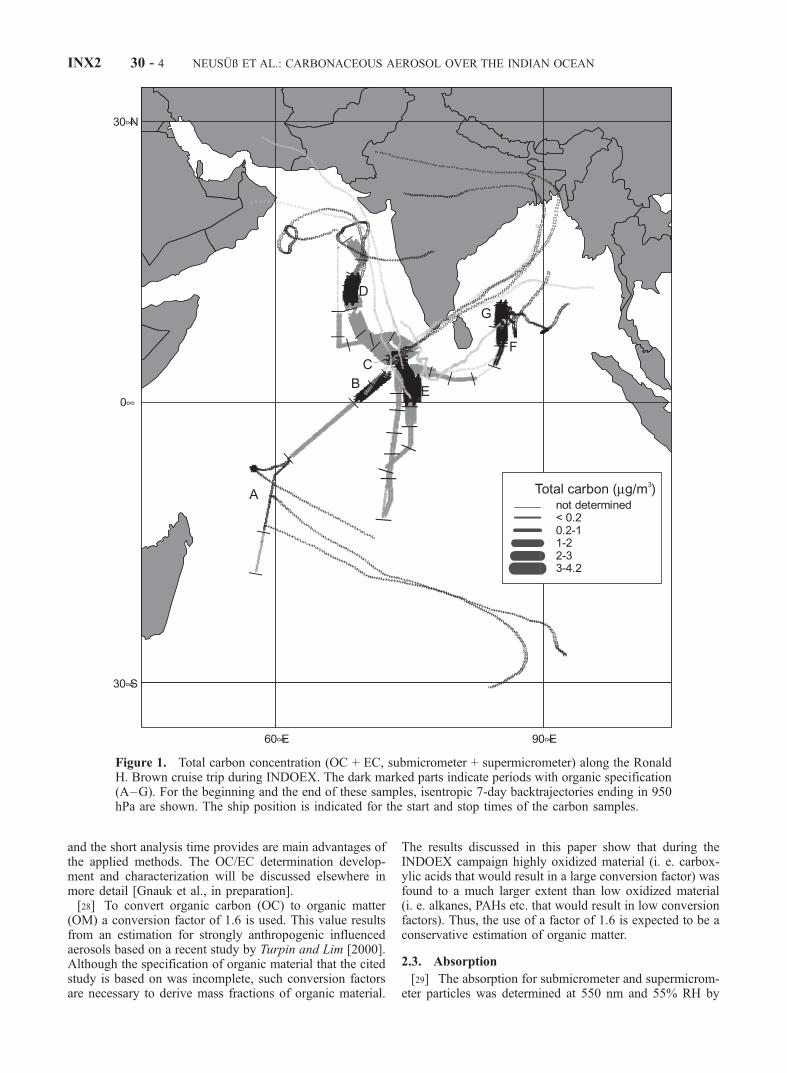
Table 1. Number of Samples, Concentration of OC and EC, Mass Fraction of OM and EC, and Absorption Coefficient for the Different
Air Masses
SouthernIndian Oceana
(n = 3)b
IndianSubcontinent
(n = 6)
Arabia/IndianSubcontinent
(n = 9)
Northern IndianOcean(n = 5)
Arabian Sea/Coastal
India (n = 3)
Bay of Bengal
(n = 2)
Sub Super Sub Super Sub Super Sub Super Sub Super Sub Super
TC conc. [mg/m3] 0.05 0.08 2.47 0.73 1.06 0.69 0.19 0.40 0.76 0.39 1.20 0.18OC conc. [mg/m3] 0.04 0.07 0.81 0.61 0.55 0.59 0.08 0.36 0.35 0.33 0.46 0.13EC conc. [mg/m3] 0.01 0.01 1.67 0.12 0.51 0.10 0.12 0.04 0.41 0.05 0.74 0.05OC/EC ratio 3.4 6.6 0.5 5.1 1.1 5.9 0.7 8.7 0.8 6.6 0.6 2.7Mass fraction of OM [%] 5.0 1.6 6.6 11.1 9.6 5.9 3.9 5.5 6.7 8.5 5.5 4.9Mass fraction of EC [%] 0.9 0.2 8.5 1.4 5.6 0.6 3.6 0.4 5.0 0.8 5.6 1.1Mass fraction of TCMc [%] 5.9 1.8 15.1 12.5 15.2 6.5 7.5 5.9 11.7 9.3 11.1 6.0Abs. coeff. [10�6 m�1] 0.24 0.01d 16.3 0.83d 6.5 0.25d 2.0 0.09d 5.8 0.37d 11.7 0.66d
aBest estimate: detection limit for these sampling periods (95%-level): OC: 0.06 mg/m3, EC: 0.02 mg/m3.bn = number of samples.cTotal carbonaceous matter TCM = OM + EC.dDifference of total and submicrometer absorption coefficients.
NEUSUß ET AL.: CARBONACEOUS AEROSOL OVER THE INDIAN OCEAN INX2 30 - 5

ranged between only partly detected (supermicrometer OC)on the order of magnitude of 0.1 mg/m3 in the southernIndian Ocean to more than 4 mg/m3 southwest of India in thearea of the Maldives. These differences are due to distinctlydifferent air masses encountered by the research vesselduring the cruise through the Indian Ocean.[38] The main data on carbon concentration and content
and absorption coefficients of the particles for different airmasses are summarized in Table 1. Furthermore, OC andEC concentrations (2 a) and OM and EC mass fractions (2 b)for the different air masses are shown in Figure 2. The airmass categories ‘‘East Indian Subcontinent’’ and ‘‘CentralIndian Subcontinent’’ used by Quinn et al. [2002b] are
combined into ‘‘Indian Subcontinent’’ here and the air masscategory ‘‘Arabia’’ is not used due to the lack of data.[39] The atmospheric concentration of carbon for air
masses from the southern hemisphere is much lower thanfor air masses from the northern hemisphere. This is mostpronounced for EC, which is up to more than two orders ofmagnitude higher in the Indian Ocean during airflow fromthe north. In these air masses the concentration of OC incoarse particles, which are dominated by sea salt particles[Quinn et al., 2002b] is a factor of 5–10 higher than in thepristine southern air. The samples of the Bay of Bengal airmasses, however, show only a slight increase in super-micrometer OC concentration compared to the southern
Figure 2. Submicrometer and supermicrometer OC/EC ratio (A), carbon concentration (B), and massfraction (C) for different air masses.
INX2 30 - 6 NEUSUß ET AL.: CARBONACEOUS AEROSOL OVER THE INDIAN OCEAN

hemisphere air masses. EC is found mainly in submicrom-eter particles, whereas OC is found both in sub- and super-micrometer particles.[40] An example of the size distribution of OC and EC for
the ‘‘Arabian Sea/Coastal India’’ air mass is presented inFigure 3. EC shows a maximum in the size range 0.3 mm <Dp < 0.54 mm. OC has its maximum in the same sizefraction but in addition a second maximum in the range2 mm < Dp < 4.1 mm corresponding to the sea salt mode. Avery similar size distribution both for OC and EC isobserved for a sample from ‘‘Arabian Sea/Indian Subcon-tinent’’, which was taken 13 days earlier. The submicrom-eter maximum is very weak and shifted to larger particles(0.54 mm < Dp< 1.1 mm) in the third sample, which wastaken at the farthest north in the Arabian sea, with verylow carbon concentrations.
3.3. Organic Species
[41] By CPP-GC/MS alkanes, fatty acids and partlypolycyclic aromatic hydrocarbons (PAHs) could bedetected. Fatty acids, however, could not be quantifieddue to bad peak shapes in the GC. PAHs have been detectedin levels close to the detection limit in samples B,C, and G.Phenanthrene showed the highest concentration, followedby fluoranthene and pyrene, respectively. Concentrationswere higher in submicrometer particles compared to super-micrometer particles. The sum of these three species forsub- and supermicrometer particles was in the range of 0.2–0.5 ng/m3.[42] The typical pattern of alkanes is shown in Figure 4.
Only small differences between the various air masses wereobserved both for the pattern and the concentration ofalkanes. Hence, no concentration of single alkanes arereported.[43] The anions of oxalic (C2), malonic (C3), succinic (C4,
including methylmalonic acid), tartronic (C3OH), malic acid(C4OH), tartric (C4(OH)2) and methanesulfonic acid (MSA)were found regularly. In some samples glutaric (C5), adipinic(C6) and azelaic acid (C9), including their respective iso-mers, were tentatively identified.
[44] The concentrations of organic acids measured duringINDOEX are shown in Table 2. The area of sampling can beidentified from Figure 1. The first sample (A) correspondsto air masses from the southern hemisphere. All the othersare more or less anthropogenically influenced from theIndian subcontinent and regions nearby, thus leading torepresentative values for organics measured in northernhemisphere air masses during INDOEX.[45] Organic acid concentrations are lowest for the clean
case and highest for those samples where the mass andcarbon concentrations are highest as well (cp. Figure 2).[46] Oxalic acid is the most abundant organic acid in
aerosol particles, followed by malonic and succinic acid forcoarse mode particles. Nevertheless, malic and tartric acidare almost as concentrated and sometimes exceed the oxalicacid concentration in submicrometer particles.
4. Discussion
4.1. Organic and Elemental Carbon
[47] The OC/EC ratios (Table 1) are between 3 and 7 forclean air masses and supermicrometer particles in thepolluted case, which can be attributed to the low ECcontent in this particles. Low OC/EC ratios (0.5–1.1) arefound for submicrometer particles in the polluted airmasses, which is similar to values found in central Europeby applying the same analytical method [Neusuß et al.,2002]. OC/EC ratios close to 1 also were found in urbanaerosols by Countess et al. [1981] and Ohta et al. [1998],where the first group applied a similar analytical procedureas described here. However, higher OC/EC ratios evenclose to source were observed in several other studies[Gray et al., 1986; Bremond et al., 1989; Crutzen andAndreae, 1990; Castro et al.,1999]. The differences areexpected to be at least partly due to different sampling andanalytical methods. However, the low OC/EC ratios foundhere are close to those observed during INDOEX byMayol-Bracero et al. [2002], applying a different samplingand analytical approach.[48] Concentrations of particulate carbon measured in
marine environments have been reviewed by Penner[1995]. For the southern marine hemisphere organic car-bon concentrations of 0.13–0.23 mg/m3 (one value of 0.53mg/m3) are reported. Our values for comparable air masses
Figure 3. Example of the size distribution of organic andelemental carbon during INDOEX (AS-Coastal India).
Figure 4. Alkane pattern of submicrometer particles ofsample C.
NEUSUß ET AL.: CARBONACEOUS AEROSOL OVER THE INDIAN OCEAN INX2 30 - 7

are at the lower limit of these concentrations. OC is mostlyassociated with supermicrometer particles, containingmainly sea salt. Since sea salt concentration dependsstrongly on wind speed [Fitzgerald, 1991] a variation inOC concentration with wind speed is expected, but couldnot be observed here, due to few samples without pollu-tion influence. Penner [1995] summarized OC concentra-tions for 12 remote marine locations in the northernhemisphere, resulting in mean values of 0.2–0.8 mg/m3.Our measurements in the northern Indian Ocean resultedin mean values for the different air masses in the range of0.4–1.2 (Figure 2). The EC concentrations measured herein the northern hemisphere are similar to remote continen-tal concentrations in the United States [Penner, 1995] andto measurements in Falkenberg, Germany during theLindenberg Aerosol Characterization Experiment (LACE)[Neusuß et al., 2002].[49] For the different trajectory groups the differences in
the atmospheric concentrations are much higher than those intheir mass fraction contribution (Figure 2). This indicates thatthe change in the carbon concentration is dominated byphenomena that affect all chemical components, like dilution,dry and wet deposition. However, slightly higher massfractions of carbon are found for air masses with highercarbon concentrations. The carbonaceous fraction of partic-ulate mass for the polluted air masses is in the range of8–15% for submicrometer particles (6–12% for supermi-crometer particles). This is lower than what is generallyobserved in anthropogenically influenced continental airmasses close to sources [e.g., Gray et al., 1986; Heintzen-berg, 1989; Eatough et al., 1996; Neusuß et al., 2002]. Thedifferences cannot be explained by the occurrence of seasalt,since seasalt does not account for a large fraction of submi-crometer particles [Quinn et al., 2002b]. Nevertheless, thefact that the carbon amount over the northern Indian Ocean issomewhat higher than what was observed in aged anthro-pogenically influenced marine air masses from Europe dur-ing ACE-2 [Quinn et al., 2000] implies that the ratio ofcarbonaceous to sulfur emission (gaseous plus particulatephase) is higher in southern Asia than it is in Europe. Thereason is probably the higher degree of biomass burning inSoutheast Asia (S. A. Guazzotti et al., Characterization ofpollution outflow from India and Arabia: Biomass burningand fossil fuel combustion, submitted to Journal of Geo-physical Research, 2001, herinafter referred to as Guazzottiet al., submitted manuscript, 2001) compared to Europe,which is in agreement with estimates based on emissionbudgets [Penner et al., 1993; Mayol-Bracero et al., 2002;Dickerson et al., 2002; M. Reddy and S. Venkataraman, A0.25� � 0.25� inventory of aerosol and sulphur dioxideemissions from India, I, Fossil fuel combustion, submittedto Atmospheric Environment, 2001; M. Reddy and S. Ven-kataraman, A 0.25�� 0.25� inventory of aerosol and sulphurdioxide emissions from India, II, Biomass combustion, sub-mitted to Atmospheric Environment, 2001]. Examples ofaerosol composition showing lower amounts of soluble ionsin India [Kulshrestha et al., 1998] than in Europe [Neusuß etal., 2002] confirm this conclusion.[50] The absorption of submicrometer particles measured
with a PSAP is correlated to the EC concentration (sub-micrometer) for all INDOEX samples in Figure 5. For lowcarbon concentrations (EC < 1 mg/m3) a good regression isT
able
2.ConcentrationofOrganic
Speciesin
Seven
Sam
plesDuringtheCruisea
AB
CD
EF
G
SouthernIndian
Ocean
Indian
Subcontinent
Indian
Subcontinent
Arabia/Indian
Subcontinent
Arabia/Indian
Subcontinent
ArabianSea/
CoastalIndia
Bay
ofBengal
Sub
Super
Sub
Super
Sub
Super
Sub
Super
Sub
Super
Sub
Super
Sub
Super
Oxalate
0.9
18
18
90
59
98
47
77
23
171
17
25
20
55
Tartronate
n.d.
n.d.
n.d.
2.5
8.9
n.d.
8.3
n.d.
3.3
n.d.
1.3
n.d.
2.8
n.d.
Malonate
n.d.
8.6
n.d.
35
13
47
3.6
33
2.5
41
2.7
11
1.6
8.2
Tartrate
n.d.
1.8
21
n.d.
55
n.d.
28
n.d.
19
n.d.
9.8
n.d.
6.4
n.d.
Malate
n.d.
1.2
15
5.4
51
8.7
21
4.4
13
8.2
8.0
n.d.
9.3
1.5
Succinateb
n.d.
n.d.
n.d.
5.5
7.8
9.3
2.2
11
n.d.
14
n.d.
n.d.
n.d.
2.2
Glutarateb
n.d.
n.d.
4.9
n.d.
14
n.d.
3.9
2.7
4.3
n.d.
n.d.
n.d.
2.6
n.d.
Adipinateb
n.d.
n.d.
2.6
n.d.
11
n.d.
2.0
1.0
2.4
n.d.
n.d.
n.d.
2.0
n.d.
�carboxylicacids
0.9
29
61
139
219
163
116
129
66
234
39
36
44
67
MSA
9.2
28
22
3.1
33
5.5
28
5.9
22
4.2
12
n.d.
16
n.d.
aAllvalues
areexpressed
inng/m
3.
bIncludingisomersofsamecarbonnumbers.
INX2 30 - 8 NEUSUß ET AL.: CARBONACEOUS AEROSOL OVER THE INDIAN OCEAN

found. An absorption efficiency of around 14 m2/g is foundfor all air masses except the most polluted cases (‘‘IndianSubcontinent’’). Absorption efficiencies are summarized fordifferent air masses and size classes in Table 3.[51] The good correlation indicates the following. First,
EC is responsible for most of the absorption of the aerosol.Second, absorption and EC measurements are in principleinternally consistent. Furthermore, the absorption efficien-cies obtained here are comparable to the mean level ofprevious studies [Liousse et al., 1993]. Nevertheless, theabsorption efficiency depends on the methods used. OtherOC/EC-separations, using oxygen or accounting for char-ring effects, usually lead to lower EC-fractions. To correcthere for this would increase the absorption efficiency tolevels above those previously reported of about 10 m2/g[Liousse et al., 1993; Petzold et al., 1997]. The differencecould be due to low mass fractions of EC during INDOEX,compared to measurements close to sources and a higherdegree of mixing of absorbing carbon with scattering
material, what is necessary to yield absorption efficienciesof larger than 10m2/g [Martins et al., 1998; Fuller et al.,1999] and what was observed by means of single particleanalysis by Guazzotti et al. (submitted manuscript, 2001).This view is further confirmed by the dependence of theabsorption efficiency on the mass fraction of EC as shownin Figure 6. The decrease of the absorption efficiency withthe increase of mass is likely to be due to an internal mixtureof absorbing material [Liousse et al., 1993] and has alsobeen found by Petzold et al. [1997]. Moreover, theoreticalcalculations by Martins et al. [1998] confirm the quantity ofthe measured absorption efficiency. During INDOEX 5%EC content lead to an absorption efficiency of around 15m2/g (Figure 6). For particles in the size range around 0.3mm < Dp < 0.5 mm (maximum in the observed size-distribution in Figure 3) with 5% EC the calculations byMartins et al. [1998] using a core–shell model yieldabsorption efficiencies around 15 m2/g.
4.2. Organics
[52] To obtain hints on the sources of the particles odd- toeven-number of the alkanes (carbon preference index, CPI)were calculated. Independent of particle size the CPI valueswere found to be in the range of 1–2, being indicative ofmainly anthropogenic input. Fossil fuel emissions lead to CPIindices close to 1.0 [Simoneit and Mazurek, 1982]. Foralkanes, emitted from plant waxes, CPI-values up to 11 aredescribed [Schneider and Gagosian, 1985; Simoneit, 1989].But the lack of odd to even carbon number preference maynot necessarily be the sign of anthropogenic origin, as n-alkanes from the marine biota also show CPIs close to one,though at a much lower concentration levels [Eichmann etal., 1979].[53] The concentration of low molecular weight dicarbox-
ylic acids measured in the pristine Indian Ocean is similar tovalues measured under clean conditions in the Pacific
Table 3. Absorption Efficiency for Different Air Masses and
Particle Sizea
Air Mass Type Absorption Efficiency, m2/g
Dp < 1.1 mm Dp < 10 mm
Southern Indian Ocean . . . . . .Indian Subcontinent 10 ± 1 10 ± 2Arabia/Indian Subcontinent 15 ± 5 13 ± 4Northern Indian Ocean 15 ± 2b 13 ± 3Arabian Sea/Coastal India 14 ± 3 13 ± 3Bay of Bengal 16 ± 4 16 ± 4
aThe range given corresponds to one standard deviation.bOne outlier (29 m2/g) removed.
Figure 5. Absorption coefficient versus EC concentrationfor submicrometer particles during INDOEX.
Figure 6. Absorption efficiency versus mass fraction ofEC for submicrometer particles.
NEUSUß ET AL.: CARBONACEOUS AEROSOL OVER THE INDIAN OCEAN INX2 30 - 9

[Matsumoto et al., 1998; Kawamura and Sakaguchi, 1999],in the Arctic [Talbot et al., 1992; Li and Winchester, 1993;Kerminen et al., 1999] and in the North Atlantic [Neusuß etal., 2000c] (C2: 6–24 ng/m3). Lower values have only beenreported for the Antarctic and Arctic, C2: 2–10 ng/m3
[Kawamura et al., 1996a,b]. These values are relativelyclose together and seem to be the result of a chemistry inremote areas. The concentration of the carboxylic acids inthe polluted air masses during INDOEX (Table 2) is in thesame range as observed for relatively unpolluted locationsin Europe [e.g., Meszaros et al., 1997; Kerminen et al.,2000; Neusuß et al., 2000c], North America [Khwaja,1995], or South Africa [Limbeck and Puxbaum, 1999],but lower than that what is partly found in urban aerosolsamples [e.g., Sempere and Kawamura, 1994; Souza et al.,1999].[54] The contribution of the selected organic compounds
to OC, TC and mass is summarized in Table 4. Thecarboxylic acids account for 2–7% of the fine organiccarbon and up to 15% of coarse OC. This is in the samerange as measured in the highly polluted cities of LosAngeles (3–5% in fine particles [Rogge et al., 1993a])and Tokyo (4–15% for particles with Dp < 10 mm [Sempereand Kawamura, 1994]).[55] The contribution of the determined dicarboxylic
acids to total particle mass (0.4 � 2%) also is in the samerange as that measured by several groups in rural and urbanareas in the USA and Japan [Rogge et al., 1993a; Sempereand Kawamura, 1994; Khwaja, 1995; Lawrence and Kou-trakis, 1996].[56] Especially low molecular weight nonhydroxylated
dicarboxylic acids are found in the coarse mode. This is inagreement with measurements during ACE-2 [Neusuß etal., 2000c], in the Pacific Ocean [Matsumoto et al., 1998],and in the Arctic [Li and Winchester, 1993; Kerminen etal., 1999]. This demonstrates the need of measurements upto Dp = 10 mm and avoidance of sampling only fineparticles.
[57] The OC fraction of sea salt particles (coarse mode) ishigher for polluted air masses. Short-chain carboxylic acidsaccount for up to 15% of this OC. This indicates that thecoarse mode OC consists in polluted cases mainly ofsecondary organic compounds, probably associated withsea salt particles.[58] In Figure 7 the concentration of carboxylic acids
versus organic and total carbon is shown for the sum ofsub- and supermicrometer particles. The sum of dicarbox-ylic acids (as well as oxalic acid alone) show a lineardependence with both OC and TC. Furthermore the regres-sions through the datapoints confirms a linear dependencefor nitrate (R2 = 0.85) and sulfate (R2 = 0.67). Thisindicates similar sources for dicarboxylic acids (and pre-cursors) and particulate carbon, nitrate, and to a lesserextent, sulfate. Different conversion rates of precursors also
Table 4. Account of Organic Compound Classes as Part of Mass, OC, and TC
A (Clean) B–G (Polluted)
Sub Super Suba Supera
Fraction of Mass, %C2–C6 dicarb. acids 0.1 0.7 0.30 (0.19–0.52) 1.54 (0.54–2.17)C3–C4 hydroxyl. dicarb. acids 0.0 0.1 0.38 (0.14–0.57) 0.05 (n.d. –0.13)� alkanes 0.7 0.2 0.07 (0.03–0.11) 0.14 (0.03–0.71)MSA 0.8 0.8 0.17 (0.12–0.29) 0.03 (n.d. –0.05)Total 1.6 1.8 0.98 (0.56–1.32) 1.83 (0.66–2.81)
Fraction of OC, %C2–C6 dicarb. acids
b 15.0 2.5 (0.9–3.1) 6.0 (3.9–14.5)C3–C4 hydroxyl. dicarb. acids
b 1.9 2.9 (1.1–4.3) 0.4 (n.d.–0.5)� alkanes b 10.9 1.2 (0.5–2.7) 2.6 (0.8–19.7)MSA b 6.7 0.5 (0.2–0.8) 0.06 (n.d. –0.1)Total b 34.5 8.1 (2.8–8.5) 8.9 (6.4–34.6)
Fraction of TC, %C2–C6 dicarb. acids
b 13.0 1.1 (0.5–1.6) 4.7 (3.3–10.6)C3–C4 hydroxyl. dicarb. acids
b 1.7 1.2 (0.5–1.7) 0.3 (n.d.–0.4)� alkanes b 9.5 0.6 (0.2–1.1) 2.2 (0.8–14.4)MSA b 5.9 0.2 (0.1–0.4) 0.06 (n.d. –0.1)Total b 30.1 3.1 (1.5–4.2) 6.9 (6.2–25.4)
aMedian (range).bCarbon below detection limit.
Figure 7. Regression of the sum of carboxylic acids to OCand TC.
INX2 30 - 10 NEUSUß ET AL.: CARBONACEOUS AEROSOL OVER THE INDIAN OCEAN

may be responsible for the better correlation of carboxylicacids to nitrate relative to sulfate, since the sampled airmasses are expected to have different ages with respect toanthropogenic emissions.[59] The sources of low molecular weight dicarboxylic
acids and even more hydroxylated dicarboxylic acids arestill not well characterized. Several studies show that fossilfuel combustion is not an important source of dicarboxylicacids. Neither vehicles [Rogge et al., 1993b; Schauer et al.,1999] nor oil [Rogge et al., 1997; Neusuß et al., unpub-lished results, 2001], gas [Rogge et al., 1993c], or coalburning (C. Neusuß et al., unpublished results, 2001) emitsignificant amounts of low molecular weight dicarboxylicacids (C2–C4). Biomass burning seems to contribute to theatmospheric concentration of oxalate and probably otheracids [Andreae et al., 1988; Lefer et al., 1994; Rogge et al.,1994; Allen and Miguel, 1995; Narakuwa et al., 1999],although it is not clear whether they are directly emitted.[60] Generally, low molecular weight carboxylic acids are
mainly photochemically produced in the atmosphere[Chebbi and Carlier, 1990], which is confirmed by reactionchamber results [Hatakeyama et al., 1985, 1987; Behnke etal., 1999] and modeling approaches [Schauer et al., 1996].However, the exact formation mechanisms are still unclear.Nevertheless, there are several indicators that the measureddicarboxylic acids during INDOEX are mainly producedphotochemically in the atmosphere from gaseous precur-sors: The observed mass fraction of oxalate (0.4 � 2%) ismuch higher than what is observed in biomass burningparticles (0.01–0.15%) [Allen and Miguel, 1995]. Lowmolecular weight dicarboxylic acids are mainly found inthe sea salt dominated coarse mode. Due to a low temper-ature of decomposition (138�C [Lide, 1992]) the occurrenceof malonic acid (Table 2) cannot be explained by directemission.[61] Together with low amounts of alkanes and PAHs as
primary pollutants, these facts indicate that the OC is at leastpartly photochemically produced in the atmosphere.
5. Conclusions
[62] Concentrations and mass fractions of organic carbon,elemental carbon and numerous organic species have beendetermined for submicrometer and supermicrometer par-ticles in the Indian Ocean on the cruise of the R/V RonBrown during INDOEX.[63] A strong influence of southern Asia on the concen-
tration of particulate carbonaceous material has beenobserved. OC concentration was typically more than oneorder of magnitude higher in the northern compared to thesouthern Indian Ocean, both for submicrometer and super-micrometer particles. EC was mostly found in submicrom-eter particles, increasing up to more than two orders ofmagnitude in the northern part compared to the southernpart of the Indian Ocean. The mass fraction of carbonaceousmaterial was in the range of 6–15% and 2–12% forsubmicrometer and supermicrometer particles, respectively,with the higher values for more polluted air masses.[64] A high degree of mixing with scattering material in
conjunction with low mass fractions of elemental carbon(relative to close-to-source measurements) results in highabsorption efficiencies. The absorption efficiency is lower
for higher mass fractions (corresponding to higher concen-trations) of elemental carbon.[65] Differences in reaction pathway or vapor pressure are
probably the reason for the occurrence of dicarboxylic acidsin supermicrometer particles, whereas hydroxylated dicar-boxylic acids show up mainly in submicrometer particles. Alarge amount of organic material is probably of secondaryorigin since alkanes and polycyclic aromatic hydrocarbonshave been found only in small amounts. This is confirmedby the good correlation of the sum of carboxylic acids withOC, EC, nitrate, and, to a lesser extent, sulfate. However,low OC/EC ratios argue for the existence of primary OC.Source studies of OC and EC in Southeast Asia are badlyneeded.
[66] Acknowledgments. We thank Brigitte Gerlach for laboratoryassistance and the crew of the R/V Ron Brown. Financial Support of theBundesministerium fur Bildung, Wissenschaft, Forschung und Technik(BMBF) under contract 01 LA-9830/0 is acknowledged. HH acknowledgessupport by the ‘‘Fonds der Chemischen Industrie’’.
ReferencesAllen, A. G., and A. H. Miguel, Biomass burning in the Amazon: Char-acterization of the ionic component of aerosols generated from flamingand smoldering rainforest and savannah, Environ. Sci. Technol., 29, 486–493, 1995.
Anderson, T. L., D. S. Covert, J. D. Wheeler, J. M. Harris, K. D. Perry, B.E. Trost, D. J. Jaffe, and J. A. Ogren, Aerosol backscatter fraction andsingle scattering albedo: Measured values and uncertainties at a coastalstation in the Pacific Northwest, J. Geophys. Res., 104, 26,793–26,807,1999.
Andreae, M. O., et al., Biomass-burning emissions and assoziated hazelayers over Amazonia, J. Geophys. Res., 93, 1509–1527, 1988.
Behnke, W., M. Elend, U. Kruger, and C. Zetzsch, The influence of NaBr/NaCl on the Br-catalysed production of halogenated radicals, J. Atmos.Chem., 34, 87–99, 1999.
Berner, A., C. Lurzer, F. Pohl, O. Preining, and P. Wagner, The size dis-tribution of the urban aerosol in Vienna, Sci. Total Environ., 13, 245–261, 1979.
Berner, A., S. Sidla, Z. Galambos, C. Kruisz, R. Hitzenberger, H. M. tenBrink, and G. P. A. Kos, Modal character of atmospheric black carbonsize distribution, J. Geophys. Res., 101, 19,559–19,565, 1996.
Bond, T. C., T. L. Anderson, and D. Campbell, Calibration and intercom-parison of filter-based measurements of visible light absorption by aero-sols, Aerosol Sci. Technol., 30, 582–600, 1999.
Bremond, M.-P., H. Cachier, and P. Buat-Menard, Particulate carbon in theParis region atmosphere, Environ. Technol. Lett., 10, 339–346, 1989.
Cachier, H., M.-P. Bremond, and P. Buat-Menard, Determination of atmo-spheric soot carbon with a simple thermal method, Tellus, 41B, 379–390,1989.
Cadle, S. H., and P. J. Groblicki, An evaluation of methods for the deter-mination of organic and elemental carbon in particulate samples, Gen.Motors Res. Publ. GMR-3452, Gen. Motors, Warren, Mich., 1980.
Cadle, S. H., and P. A. Mulawa, Atmospheric carbonaceous species mea-surement methods comparison study: General Motors results, AerosolSci. Technol., 12, 128–141, 1990.
Cadle, S. H., P. J. Groblicki, and D. P. Stroup, Automated carbon analyzerfor particulate samples, Anal. Chem., 52, 2201–2206, 1980.
Cadle, S. H., P. J. Groblicki, and P. A. Mulawa, Problems in the samplingand analysis of carbon particulate, Gen. Motors Res. Publ. GMR-3935,Gen. Motors, Warren, Mich., 1981.
Castro, L. M., C. A. Pio, M. Harrison, and D. J. T. Smith, Carbonaceousaerosol in urban and rural European atmospheres: Estimation of second-ary organic carbon concentrations, Atmos. Environ., 33, 2771–2781,1999.
Chebbi, A., and P. Carlier, 1996, Carboxylic acids in the troposphere,occurence, sources, and sinks: A review, Atmos. Environ., 30, 4233–4249, 1990.
Chow, J. C., J. G. Watson, L. C. Pritchett, W. R. Pierson, C. A. Frazier, andR. G. Purcell, The DRI thermal/optical reflectance carbon analysis sys-tem: Description, evaluation and applications in U.S. air quality studies,Atmos. Environ., 27A, 1185–1201, 1993.
Countess, R. J., Interlaboratory analyses of carbonaceous aerosol samples,Aerosol Sci Technol., 12, 114–121, 1990.
NEUSUß ET AL.: CARBONACEOUS AEROSOL OVER THE INDIAN OCEAN INX2 30 - 11

Countess, R. J., S. H. Cadle, P. J. Groblicki, and G. T. Wolff, Chemicalanalysis of size-segregated samples of Denver’s ambient particulate, J. AirPollut. Control Assoc., 31, 247–252, 1981.
Crutzen, P. J., and M. O. Andreae, Biomass burning in the tropics: Impacton atmospheric chemistry and biogeochemical cycles, Science, 250,1669–1678, 1990.
Dickerson, R. R., M. O. Andreae, T. Campos, O. L. Mayol-Bracero, C.Neusuess, and D. G. Streets, Analysis of black carbon and carbon mon-oxide observed over the Indian Ocean: Implications for emissions andphotochemistry, J. Geophys. Res., 107(D19), 8017, doi:10.1029/2001JD000501, 2002.
Duce, R. A., V. A. Mohnen, P. R. Zimmerman, D. Grosjean, W. Cautreels,R. Chatfield, R. Jaenicke, J. A. Ogren, E. D. Pellizzari, and G. T. Wallace,Organic material in the global troposphere, Rev. Geophys. Space Phys.,21, 921–952, 1983.
Eatough, D. J., D. A. Eatough, L. Lewis, and E. A. Lewis, Fine particulatechemical composition and light extinction at Canyonsland National Parkusing organic particulate material concentrations obtained with a multi-system, multichannel diffusion denuder sampler, J. Geophys. Res., 101,19,515–19,531, 1996.
Eichmann, R., P. Neuling, G. Ketseridis, J. Hahn, R. Jaenicke, and C.Junge, n-Alkane studies in the troposphere: I. Gas and particulate con-centrations in the north Atlantic air, Atmos. Environ., 13, 587–599, 1979.
Facchini, M. C., M. Mircea, S. Fuzzi, and R. J. Charlson, Cloud albedoenhancement by surface-active organic solutes in growing droplets, Nat-ure, 401, 257–259, 1999.
Fitzgerald, J. W., Marine aerosols: A review, Atmos. Environ., 25A, 533–545, 1991.
Fuller, K. A., W. C. Malm, and S. M. Kreidenweis, Effects of mixing onextinction by carbonaceous particles, J. Geophys. Res., 104, 15,941–15,954, 1999.
Gray, H. A., G. R. Cass, J. J. Huntzicker, E. K. Heyerdahl, and J. A. Rau,Characteristics of atmospheric organic carbon and its elemental carbonparticle concentration in Los Angeles, Environ. Sci. Technol., 20, 580–589, 1986.
Hatakeyama, S., T. Tanonaka, J.-h. Weng, H. Bandow, H. Takagi, and H.Akimoto, Ozone-cycloalkene reactions in air: Quantitative analysis ofparticulate products and the reaction mechanism, Environ. Sci. Technol.,19, 935–942, 1985.
Hatakeyama, S., M. Ohno, J.-h. Weng, H. Takagi, and H. Akimoto, Me-chanism for the formation of gaseous and particulate products fromozone-cycloalkene reactions in air, Environ. Sci. Technol., 21, 52–57,1987.
Heintzenberg, J., Size-segregated measurements of particulate elementalcarbon and aerosol light absorption at remote Arctic locations., AtmosEnviron., 16, 2461–2469, 1982.
Heintzenberg, J., Fine particles in the global troposphere, a review, Tellus,41B, 149–160, 1989.
Heintzenberg, J., D. S. Covert, and R. van Dingenen, Size distribution andchemical composition of marine aerosols: A compilation and review,Tellus B, 52B, 1104–1122, 2000.
Hering, S. V., et al., Comparison of sampling methods for carbonaceousaerosols in ambient air, Aerosol Sci. Tecnol., 12, 200–213, 1990.
Huebert, B. J., and R. J. Charlson, Uncertainties in data on organic aerosols,Tellus, 52B, 1249–1255, 2000.
Huntzicker, J. J., R. L. Johnson, J. J. Shah, and R. A. Cary, Analysis oforganic and elemental carbon in ambient aerosols by a thermal-opticalmethod, in Particulate Carbon: Atmospheric Life Cycle, edited by G. T.Wolff and R. L. Klimisch, pp. 79–88, Plenum, New York, 1982.
Iwatsuki, M. T. Kyotani, and K. Matsubara, Fractional determination ofelemental carbon and total soluble and insoluble organic compounds inairborne particulate matter by thermal analysis combined with extractionand heavy liquid separation, Anal. Sci., 14, 321–326, 1998.
Jacobsen, M. C., H.-C. Hansson, K. J. Noone, and R. J. Charlson, Organicatmospheric aerosols: Review and state of the science, Rev. Geophys., 38,267–294, 2000.
Japar, S. M., A. C. Szkarlat, R. A. Gorse Jr., E. K. Heyerdahl, R. L.Johnson, J. A. Rau, and J. J. Huntzicker, Comparison of solvent extrak-tion and thermal-optical carbon analysis methods: Application to dieselvehicle exhaust aerosol, Environ. Sci. Technol., 18, 231–234, 1984.
Johnson, R. L., J. J. Shah, R. A. Cary, and J. J. Huntzicker, An automatedthermal-optical method for the analysis of carbonaceous aerosol, in ACSSymposium Series 167, pp. 223–233, Am. Chem. Soc., Washington,D.C., 1981.
Kaneyasu, N., and S. Murayama, High concentration of black carbon overmiddle latitudes in the North Pacific Ocean, J. Geophys. Res., 105,19,881–19,890, 2000.
Kawamura, K., and F. Sakaguchi, Molecular distributions of water solubledicarboxylic acids in marine aerosols over the Pacific Ocean includingtropics, J. Geophys. Res., 104, 3501–3509, 1999.
Kawamura, K., H. Kasukabe, and L. Barrie, Source and reaction pathwaysof dicarboxylic acids, ketoacids and dicarbonyls in arctic aerosols: Oneyear of observations, Atmos. Environ., 30, 1709–1722, 1996a.
Kawamura, K., R. Sempere, Y. Imai, Y. Fujii, and M. Hayashi, Watersoluble dicarboxylic acids and related compounds in Antarctic aerosols,J. Geophys. Res., 101, 18,721–18,728, 1996b.
Kerminen, V.-M., K. Teinila, R. Hillamo, and T. Makela, Size-segregatedchemistry of particulate dicarboxylic acids in the Arctic atmosphere,Atmos. Environ., 33, 2089–2100, 1999.
Kerminen, V.-M., C. Ojanen, T. Pakkanen, R. Hillamo, M. Aurela, and J.Merilainen, Low molecular weight dicarboxylic acids in an urban andrural environment, J. Aerosol Sci., 31, 349–362, 2000.
Khwaja, H. A., Atmospheric concentrations of carboxylic acids and relatedcompounds at a semiurban site, Atmos. Environ., 29, 127–139, 1995.
Kleemann, M. J., L. S. Hughes, J. O. Allen, and G. R. Cass, Source con-tributions to the size and composition distribution of atmospheric parti-cles: Southern California in September 1996, Environ. Sci. Technol., 33,4331–4341, 1999.
Kuhlbusch, T. A. J., Schwarzer Kohlenstoff aus Vegetationsbranden: EineBestimmungsmethode und mogliche Auswirkungen auf den globalenKohlenstoffzyklus, Ph.D. thesis, Univ. of Mainz, Mainz, Germany, 1994.
Kulshrestha, U. C., A. Saxena, N. Kumar, K. M. Kumari, and S. S. Srivas-tava, Chemical composition and association of size-differentiated aero-sols at a suburban site in a semi-arid tract of India, J. Atmos. Chem., 29,109–118, 1998.
Lavanchy, V. M. H., H. W. Gaggeler, S. Nyeki, and U. Baltensperger,Elemental carbon (EC) and black carbon (BC) measurements with athermal method and an aethalometer at the high-alpine research stationJungfraujoch, Atmos. Environ., 33, 2759–2769, 1999.
Lawrence, J., and P. Koutrakis, Measurement and speciation of gas andparticulate phase organic acidity in an urban environment, J. Geophys.Res., 101, 9159–9169, 1996.
Lefer, B. L., R. W. Talbot, and R. C. Harris, Enhancement of acidic gases inbiomass burning impacted air masses over Canada, J. Geophys. Res., 99,1721–1737, 1994.
Lelieveld, J., et al., The Indian Ocean Experiment: Widespread air pollutionfrom South and South-East Asia, Science, 291, 1031–1036, 2001.
Li, S. M., and J. W. Winchester, Water soluble organic constituents inArctic aerosols and snow pack, Geophys. Res. Lett., 20, 45–48, 1993.
Lide, D. R., (Ed.), CRC Handbook of Chemistry and Physics, 73rd ed.,CRC Press, Boca Raton, Fla., 1992.
Limbeck, A., and H. Puxbaum, Organic acids in continental backgroundaerosols, Atmos. Environ., 33, 1847–1852, 1999.
Liousse, C., H. Cachier, and S. G. Jennings, Optical and thermal measure-ments of black carbon aerosol content in different environments: Varia-tion of the specific attenuation cross-section, sigma (s), Atmos. Environ.,27A, 1203–1211, 1993.
Malissa, H., H. Puxbaum, and E. Pell, Zur simultanen relativkonduktome-trischen Kohlenstoff- und Schwefelbestimmung in Stauben, Fresenius Z.Anal. Chem., 282, 109–113, 1976.
Martins, J. V., P. Artaxo, C. Liousse, J. S. Reid, P. V. Hobbs, and Y. Kauf-man, Effects of black carbon content, particle size, and mixing on lightabsorption by aerosols from biomass burning in Brazil, J. Geophys. Res.,103, 32,041–32,050, 1998.
Matsumoto, K., I. Nagao, H. Tanaka, H. Miyaji, T. Iida, and Y. Ikebe,Seasonal characteristics of organic and inorganic species and their sizedistributions in atmospheric aerosols over the northwest Pacific ocean,Atmos. Environ., 32, 1931–1946, 1998.
Mayol-Bracero, O. L., R. Gabriel, M. O. Andreae, T. W. Kirchstetter, T.Novakov, J. A. Ogren, P. J. Sheridan, and D. Streets, Carbonaceousaerosols over the Indian Ocean during INDOEX: Chemical characteriza-tion, optical properties, and probable sources, J. Geophys. Res.,doi:10.1029/2000JD000039, in press, 2002.
McMurry, P. H., and X. Q. Zhang, Size distributions of ambient organic andelemental carbon, Aerosol Sci. Technol., 10, 430–437, 1989.
Meszaros, E., T. Barcza, A. Gelencser, J. Hlavay, G. Kiss, Z. Krivascy, A.Molnar, and K. Polyak, Size distribution of inorganic and organic speciesin the atmospheric aerosol, J. Aerosol Sci., 28, 1163–1175, 1997.
Muller, K., A 3 year study of the aerosol in northwest Saxony (Germany),Atmos. Environ., 33, 1679–1685, 1999.
Narukawa, M., K. Kawamura, N. Takeuchi, and T. Nakajima, Distributionof dicarboxylic acids and carbon isotopic compositions in aerosols from1997 Indonesian forest fires, Geophys. Res. Lett., 26, 3101–3104, 1999.
Neuroth, R., L. Laskus, and D. Dahmann, Interner VDI/DIN-Ringversuchzur Bestimmung von elementarem Kohlenstoff, Gefahrst. Reinhalt. Luft,59, 91–94, 1999.
Neusuß, C., M. Pelzing, A. Plewka, and H. Herrmann, A new analyticalapproach for size-resolved speciation of organic compounds in atmo-spheric aerosol particles: Methods and first results, J. Geophys. Res.,105, 4513–4527, 2000a.
INX2 30 - 12 NEUSUß ET AL.: CARBONACEOUS AEROSOL OVER THE INDIAN OCEAN

Neusuß, C., D. Weise, W. Birmili, H. Wex, A. Wiedensohler, and D. Cov-ert, Size-segregated chemical, gravimetric and number distribution-de-rived mass closure of the aerosol in Sagres, Portugal during ACE-2,Tellus, 52B, 169–184, 2000b.
Neusuß, C., E. Bruggemann, and H. Herrmann, Organic acids in atmo-spheric aerosol particles: Results from different field campaigns in Eur-ope, J. Aerosol Sci., 31, S238–S239, 2000c.
Neusuß, C., H. Wex, W. Birmili, A. Wiedensohler, C. Koziar, B. Busch, E.Bruggemann, T. Gnauk, M. Ebert, and D. S. Covert, Characterization andparameterization of atmospheric aerosol number, mass, and chemical sizedistributions in central Europe during LACE 98 and MINT, J. Geophys.Res., doi:10.1029/2001JD000514, in press, 2002.
Novakov, T., Soot in the atmosphere, in Particulate Carbon: AtmosphericLife Cycle, edited by G. T. Wolff and R. L. Klimisch, pp. 19–41, Plenum,New York, 1982.
Novakov, T., and C. E. Corrigan, Influence of sample composition onaerosol organic and black carbon determinations, presented at ChapmanConference on Biomass Burning and Global Change, AGU, Williams-burg, Va., 13–17 March, 1995.
Nunes, T. V., and C. A. Pio, Carbonaceous aerosols in industrial and coastalatmospheres, Atmos. Environ., 27A, 1339–1346, 1993.
Ogren, J. A., R. J. Charlson, and P. J. Groblicki, Determination of elementalcarbon in rainwater, Anal. Chem., 55, 1567–1572, 1983.
Ohta, S., M. Hori, S. Yamagata, and N. Murao, Chemical characterizationof atmospheric fine particulates in Sapporo with the determination ofwater content, Atmos. Environ., 32, 1021–1025, 1998.
Penner, J. E., Carbonaceous aerosols influencing atmospheric radiation:Black and organic carbon, in Aerosol Forcing of Climate: Report ofthe Dahlem Workshop on Aerosol Forcing of Climate, edited by R. J.Charlson and J. Heintzenberg, pp. 91–108, John Willey, New York,1995.
Penner, J. E., H. Eddleman, and T. Novakov, Towards the developement ofa global inventory for black carbon emissions, Atmos. Environ., 27A,1277–1295, 1993.
Petzold, A., and R. Niessner, Coulometrische Messung der Rußbelastung inder Außenluft - Verfahrensentwicklung und Anwendung an Meßstellenunterschiedlicher Belastung, Gefahrst. Reinhalt. Luft, 56, 173 –177,1996.
Petzold, A., C. Kopp, and R. Niessner, The dependence of the specificattenuation cross-section on black carbon mass fraction and particle size,Atmos. Environ., 31, 661–672, 1997.
Quinn, P. K., and D. J. Coffman, Local closure during the First AerosolCharacterization Experiment (ACE 1): Aerosol mass concentration andscattering and backscattering coefficients, J. Geophys. Res., 103,16,575–16,596, 1998.
Quinn, P. K., T. S. Bates, D. J. Coffman, J. E. Miller, D. S. Covert, J. P.Putaud, C. Neusuß, and T. Novakov, A comparison of aerosol chemicaland optical properties from the first and second aerosol characterizationexperiments, Tellus, 52B, 239–257, 2000.
Quinn, P. K., D. J. Coffman, T. S. Bates, T. L. Miller, J. E. Johnson, K.Voss, E. J. Welton, and C. Neusuß, Dominant aerosol chemical compo-nents and their contribution to extinction during the Aerosols99 cruiseacross the Atlantic, J. Geophys. Res., doi:10.1029/2000JD900577, inpress, 2002a.
Quinn, P. K., D. J. Coffmann, T. S. Bates, T. L. Miller, J. E. Johnson, E. J.Welton, C. Neusuß, M. Miller, and P. Sheridan, Aerosol optical propertiesduring INDOEX 1999: Means, variability, and controlling factors,J. Geophys. Res., 107(D19), 8020, doi:10.1029/2000JD000037, 2002b.
Rogge, W. F., M. Mazurek, L. M. Hildemann, and G. R. Cass, Quantifica-tion of urban organic aerosols at a molecular level: Identification, abun-dance and seasonal variation, Atmos. Environ., 27A, 1309–1330, 1993.
Rogge, W. F., L. M. Hildemann, M. A. Mazurek, G. R. Cass, and B. R. T.Simoneit, Sources of fine organic aerosol: 2. Noncatalyst and catalyst-equipped automobiles and heavy-duty diesel trucks, Environ. Sci. Tech-nol., 27, 636–651, 1993.
Rogge, W. F., L. M. Hildemann, M. A. Mazurek, G. R. Cass, and B. R. T.Simoneit, Sources of fine organic aerosol: 5. Natural gas home appli-ances, Environ. Sci. Technol., 27, 2736–2744, 1993.
Rogge, W. F., L. M. Hildemann, M. A. Mazurek, G. R. Cass, and B. R. T.Simoneit, Sources of fine organic aerosol: 6. Cigarette smoke in the urbanatmosphere, Environ. Sci. Technol., 28, 1375–1388, 1994.
Rogge, W. F., L. M. Hildemann, M. A. Mazurek, G. R. Cass, and B. R. T.Simoneit, Sources of fine organic aerosol: 8. Boilers burning no. 2 dis-tillate fuel oil, Environ. Sci. Technol., 31, 2731–2737, 1997.
Saxena, P., and L. M. Hildemann, Water-soluble organics in atmosphericparticles: a critical review of the literature and application of thermody-namics to identify candidate compounds, J. Atmos. Chem., 24, 57–109,1996.
Saxena, P., L. M. Hildemann, P. H. McMurry, and J. H. Seinfeld, Organicsalter hygroscopic behavior of atmospheric particles, J. Geophys. Res.,100, 18,755–18,770, 1995.
Schauer, J. J., W. F. Rogge, L. M. Hildemann, M. A. Mazurek, and G. R.Cass, Source apportionment of airborne particulate matter using organiccompounds as tracers, Atmos. Environ., 30, 3837–3855, 1996.
Schauer, J., M. J. Kleemann, G. R. Cass, and B. R. T. Simoneit, Measure-ment of emissions from air pollution sources: 1. C1 through C30 organiccompounds from medium duty diesel trucks, Environ. Sci. Technol., 33,1578–1587, 1999.
Schmid, H., et al., Results of the ‘‘Carbon Conference’’ international carbonround robin test stage I, Atmos. Environ., 35, 2111–2121, 2001.
Schneider, J. K., and R. B. Gagosian, Particle size distribution of lipids inaerosols off the coast of Peru, J. Geophys. Res., 90, 7889–7898, 1985.
Sempere, R., and K. Kawamura, Comparative distributions of dicarboxylicacids and related polar compounds in snow, rain and aerosols from urbanatmosphere, Atmos. Environ., 28, 449–450, 1994.
Shah, J. J., and J. A. Rau, Carbonaceous species methods comparisonstudy: Interlaboratory round robin interpretation of results, Research Di-vision, California Air Resources Board, Final Rep. G2E-0024, Sacramen-to, CA, 1991.
Shulman, M. L., M. C. Jacobsen, R. J. Charlson, R. E. Synovec, and T. E.Young, Dissolution behavior and surface tension effects of organic com-pounds in nucleating cloud droplets, Geophys. Res. Lett., 23, 277–280,1996.
Simoneit, B., Organic matter of the troposphere: V. Application of mole-cular marker analysis to biogenic emissions into the troposhere for sourcereconciliations, J. Atmos. Chem., 8, 251–275, 1989.
Simoneit, B. R. T., and M. A. Mazurek, Organic matter of the troposphere:II. Natural background of biogenic lipid matter in aerosol over the ruralwestern United States., Atmos. Environ., 16, 2139–2159, 1982.
Souza, S. R., P. C. Vasconcellos, and L. R. F. Carvalho, Low molecularweight carboxylic acids in an urban atmosphere: Winter measurements inSao Paulo city, Brasil, Atmos. Environ., 33, 2563–2574, 1999.
Talbot, R. W., A. S. Vijgen, and R. C. Harris, Soluble species in the Arcticsummer troposphere: Acidic gases, aerosols, and precipitation, J. Geo-phys. Res., 97, 16,531–16,543, 1992.
Turpin, B.J., and H. Lim, Species contribution to PM 2.5 concentrations:Revisiting common assumptions for estimating organic mass, AerosolSci. Technol., in press, 2000.
Ulrich, E., C. Beckmann, and G. Israel, The characterization of carbonspecies in particulate matter by successive thermal desorption, J AerosolSci., 21, S609–S612, 1990.
VDI-Richtlinie 2465 Bl. 1, Messen von Ruß (Immission): Chemisch-analytische Bestimmung des elementaren Kohlenstoffs nach Extraktionund Thermodesorption des organischen Kohlenstoffs, Beuth, Berlin,1996.
VDI-Richtlinie 2465 Bl. 2, Messen von Ruß (Immission): Thermogra-phische Bestimmung des elementaren Kohlenstoffs nach Thermodesorp-tion des organischen Kohlenstoffs, Beuth, Berlin, 1997.
Zappoli, S., et al., Inorganic, organic and macromolecular components offine aerosol in different areas of Europe in relation to their water solubi-lity, Atmos. Environ., 33, 2733–2743, 1999.
�����������T. Gnauk, H. Herrmann, C. Neusuß, and A. Plewka, Institut fur
Tropospharenforschung, Permoserstr. 15, 04318, Leipzig, Germany.([email protected]; [email protected]; [email protected]; [email protected])P. Quinn, Pacific Marine Environmental Laboratory, NOAA, 7600 Sand
Point Way NE, Seattle, WA 95115, USA. ([email protected])
NEUSUß ET AL.: CARBONACEOUS AEROSOL OVER THE INDIAN OCEAN INX2 30 - 13