Embed Size (px)
Citation preview

Edited by David P. Steen and Philip R. Ashurst
Carbonated Soft DrinksFormulation and Manufacture

Steen: “fm” — 2006/4/27 — 18:30 — page i — #1
Carbonated Soft Drinks:Formulation and Manufacture

Steen: “fm” — 2006/4/27 — 18:30 — page ii — #2

Steen: “fm” — 2006/4/27 — 18:30 — page iii — #3
Carbonated Soft Drinks:Formulation and Manufacture
Edited by
David P. Steenand
Philip R. Ashurst
Steen: “fm” — 2006/4/27 — 18:30 — page iv — #4
© 2006 by Blackwell Publishing Ltd
Editorial Offices:Blackwell Publishing Ltd, 9600 Garsington Road, Oxford OX4 2DQ, UKTel: +44 (0)1865 776868Blackwell Publishing Professional, 2121 State Avenue, Ames, Iowa 50014-8300, USATel: +1 515 292 0140Blackwell Publishing Asia Pty Ltd, 550 Swanston Street, Carlton, Victoria 3053, AustraliaTel: +61 (0)3 8359 1011
The right of the Author to be identified as the Author of this Work has been asserted in accordancewith the Copyright, Designs and Patents Act 1988.
All rights reserved. No part of this publication may be reproduced, stored in a retrieval system, ortransmitted, in any form or by any means, electronic, mechanical, photocopying, recording orotherwise, except as permitted by the UK Copyright, Designs and Patents Act 1988, without the priorpermission of the publisher.
First published 2006 by Blackwell Publishing Ltd
ISBN-13: 978-14051-3435-4ISBN-10: 1-4051-3435-6
Library of Congress Cataloging-in-Publication DataCarbonated soft drinks: formulation and manufacture/edited by David P. Steen and Philip R. Ashurst.
p. cm.Includes bibliographical references and index.ISBN-13: 978-1-4051-3435-4 (alk.paper)ISBN-10: 1-4051-3435-6 (alk.paper)1. Soft drinks. 2. Carbonated beverages. I. Steen, David P. II. Ashurst, P. R.TP630.C38 2006663′.62–dc22
2005035492
A catalogue record for this title is available from the British Library
Set in 10/12 pt Timesby Newgen Imaging Systems (P) Ltd., Chennai, IndiaPrinted and bound in Indiaby Replika Press Pvt, Ltd, Kundli
The publisher’s policy is to use permanent paper from mills that operate a sustainable forestry policy,and which has been manufactured from pulp processed using acid-free and elementary chlorine-freepractices. Furthermore, the publisher ensures that the text paper and cover board used have metacceptable environmental accreditation standards.
For further information on Blackwell Publishing, visit our website:www.blackwellfood.com

Steen: “fm” — 2006/4/27 — 18:30 — page v — #5
Contents
List of Contributors xv
Preface xvii
1 Introduction 1
Bob Hargitt
1.1 Early history 11.2 The growth of carbonates – production 31.3 Technological development 4
1.3.1 Carbon dioxide 41.3.2 Sweeteners 51.3.3 Flavours and colours 71.3.4 Packaging 8
1.4 Recent technological development 101.5 The growth of carbonates – consumption 101.6 Changing public perception and future challenges 13Acknowledgements 14Bibliography 14
2 Water treatment 16
Walter Tatlock
2.1 Introduction 162.2 Water quality 182.3 Town mains water 212.4 Boreholes 232.5 How to achieve the desired water quality 242.6 Sand filtration 252.7 Coagulation 272.8 Alkalinity reduction 282.9 Membrane filtration 292.10 Chlorination and carbon filtration 342.11 Iron removal 352.12 Nitrate removal 362.13 Polishing filters 382.14 Ultraviolet systems 412.15 Ozone technology 42
Steen: “fm” — 2006/4/27 — 18:30 — page vi — #6
vi CONTENTS
2.16 De-aeration 432.17 Factory water distribution systems 442.18 Factory water systems 46References 46
3 Ingredients and formulation of carbonated soft drinks 48
Barry Taylor
3.1 Introduction 483.2 Factors influencing development of the industry 483.3 The move towards standardisation 513.4 The constituents of a soft drink 523.5 Water 54
3.5.1 Requirements 543.5.2 Quality of fresh water 553.5.3 Water hardness 553.5.4 Water treatment 553.5.5 Water impurities and their effect 55
3.5.5.1 Suspended particles 553.5.5.2 Organic matter 563.5.5.3 High alkalinity 563.5.5.4 Nitrates 57
3.6 Saccharides and high-intensity sweeteners 573.6.1 Bulk sweeteners 573.6.2 Intense sweeteners 58
3.7 Carbon dioxide 583.8 Acidulants 59
3.8.1 Citric acid 603.8.2 Tartaric acid 603.8.3 Phosphoric acid 613.8.4 Lactic acid 613.8.5 Acetic acid 623.8.6 Malic acid 623.8.7 Fumaric acid 623.8.8 Ascorbic acid 63
3.9 Flavourings 633.9.1 Flavourings and legislation 653.9.2 Flavourings in application 663.9.3 Water-miscible flavourings 66
3.9.3.1 Flavouring mixtures 663.9.3.2 Flavouring essence 673.9.3.3 Flavouring extract 68
3.9.4 Water-dispersible flavourings 683.9.4.1 Brominated vegetable oil (BVO) emulsions 72
Steen: “fm” — 2006/4/27 — 18:30 — page vii — #7
CONTENTS vii
3.10 Colours 733.11 Preservatives 75
3.11.1 Micro-organisms and beverages 763.11.2 Sulphur dioxide 773.11.3 Benzoic acid and benzoates 783.11.4 Sorbic acid and sorbates 79
3.12 More functional ingredients 793.12.1 Stabilisers 793.12.2 Saponins 803.12.3 Antioxidants 803.12.4 Calcium disodium EDTA 81
3.13 Retrospective investigation of a soft drink 813.14 Food safety 843.15 Future trends 85Bibliography 86
4 Syrup preparation and syrup room operations 87
John Horman
4.1 Introduction 874.2 Syrup composition 884.3 Syrup rooms and proportioning systems 904.4 The modern syrup room 914.5 Instrumentation 964.6 Sugar 97
4.6.1 Sugar dissolving 974.6.2 Liquid sugar storage 99
4.7 Pre-mixes 1004.8 Pasteurisation 101
4.8.1 Tunnel pasteurisation 1014.8.2 Flash pasteurisation 104
4.9 Clean-in-place (CIP) systems 1054.10 Process plant hygiene requirements 1084.11 Syrup room building design 1094.12 Future developments 110
5 Carbon dioxide, carbonation and the principles offilling technology 112
David P. Steen
5.1 Introduction 1125.2 Carbon dioxide 1135.3 Production of carbon dioxide 115
5.3.1 Fermentation 116

Steen: “fm” — 2006/4/27 — 18:30 — page viii — #8
viii CONTENTS
5.3.2 Flue gas recovery 1165.3.3 Membrane separation systems 118
5.4 Specification of carbon dioxide 1195.5 Delivery to the customer 1205.6 Carbon dioxide storage 1235.7 Carbonation 124
5.7.1 Basic considerations 1245.7.2 Carbonation measurement 1265.7.3 De-aeration 128
5.8 Carbonation systems 1295.8.1 Carbonators 1295.8.2 Gas bubble sparging 1315.8.3 Bubbles in a glass of carbonated liquid 1335.8.4 Process control 133
5.9 Filling principles 1335.9.1 Gravity filler 1355.9.2 Counter-pressure filler 137
5.10 Nitrogen 142Further reading 142
6 Modern filling systems for carbonated soft drinks 144
Andrew Wilson and John Medling
6.1 Introduction 1446.2 Modern carbonation systems 1476.3 Counter-pressure fillers 149
6.3.1 Operation 1496.3.2 Level filling 154
6.4 Glass bottle filling 1566.4.1 Operation 1566.4.2 Bottle burst protection 159
6.5 PET (polyethylene terephthalate) bottle filling 1616.5.1 Operation 1616.5.2 Size changing 162
6.6 Can filling 1666.6.1 The volumetric can (VOC) filler 1666.6.2 System expansion – the VOC-C can filler 1686.6.3 Product level- and pressure-control system in a free-standing
product tank 1706.6.3.1 Level control 1706.6.3.2 Filling pressure control 170
6.6.4 Procedural steps of the filling cycle 1706.6.4.1 Flushing phase I 1716.6.4.2 Flushing phase II 171
Steen: “fm” — 2006/4/27 — 18:30 — page ix — #9
CONTENTS ix
6.6.4.3 Pressurising 1716.6.4.4 Filling 1716.6.4.5 Snifting 1726.6.4.6 Recharging the metering chamber 1726.6.4.7 CIP cleaning 173
6.7 Other filler options 1746.8 Clean-in-place 1756.9 Filler hygienic design 1776.10 Conclusions 178
7 Bottle design and manufacture and related packaging 181
David Syrett
7.1 Introduction – the objectives of packaging 1817.2 Glass 182
7.2.1 History of glass making 1827.2.2 Bottle supplier identification marks 1847.2.3 Bottle design and headspace considerations 1847.2.4 Glass bottle manufacturing processes 185
7.2.4.1 The melting process 1857.2.4.2 Glass bottle forming 187
7.2.5 Glass quality faults 1897.2.5.1 Critical defects 1897.2.5.2 Major defects 1897.2.5.3 Minor defects 190
7.2.6 Single and multiple trip bottles 1927.2.7 Lightweighting 1937.2.8 Recycling 194
7.3 Plastic bottles 1947.3.1 Introduction – advantages and limitations 194
7.3.1.1 Advantages 1947.3.1.2 Limitations 195
7.3.2 Polyethylene terephthalate 1957.3.3 History 1957.3.4 PET bottles today 196
7.3.4.1 Preforms 1967.3.4.2 Bottle blowing 196
7.3.5 Multilayer and barrier coating 1987.3.6 Carbonation loss 1987.3.7 Permeability of polymers 1987.3.8 Recycling methods 200
7.4 Closures for carbonated soft drinks 2007.4.1 Introduction 2007.4.2 Headspace pressure 201

Steen: “fm” — 2006/4/27 — 18:30 — page x — #10
x CONTENTS
7.4.3 Roll on metal closures 2027.4.4 Plastic closures 2027.4.5 Development of the PET bottle finish 2037.4.6 Crown corks (pry off/twist off) 2057.4.7 Other closures (vacuum lug/rip off) 205
7.5 Cans and ends 2067.5.1 Introduction 2067.5.2 The can making process 206
7.5.2.1 Front-end processes 2067.5.2.2 Decoration processes 2077.5.2.3 Back-end processes 207
7.5.3 Graphics decoration 2087.5.4 Ends 2087.5.5 The double seam 2087.5.6 Can end stress corrosion 208
7.6 Labels and labelling 2097.6.1 Introduction 2097.6.2 Paper manufacturing 2107.6.3 Labelling 2107.6.4 Patch labellers 2127.6.5 Wraparound labellers 2137.6.6 Sleeving 2157.6.7 Labelling in production 2157.6.8 Date coding (ink jet/laser) 216
7.7 Future trends – putting it all together 216Further reading 217
8 Secondary packaging considerations 218
David Rose
8.1 Introduction 2188.2 Requirements of the supply chain 219
8.2.1 Overview 2198.2.2 Major multiple 221
8.2.2.1 Pallet receipt 2218.2.2.2 Pallet breakdown and load picking 2218.2.2.3 Bar codes 2218.2.2.4 Store delivery 222
8.2.3 Cash & Carry 2248.2.3.1 Pallet breakdown and load picking 2248.2.3.2 Pack graphics 2248.2.3.3 Bar codes 224
8.2.4 Bulk break 2248.2.5 Poor packs – no sale? 225

Steen: “fm” — 2006/4/27 — 18:30 — page xi — #11
CONTENTS xi
8.2.6 Material – performance versus specification 2258.3 Pack styles 227
8.3.1 Shrink wrap 2278.3.2 Trade ready display unit (TRDU) 2288.3.3 Shelf ready packing 2298.3.4 Returnable crate 231
8.4 Shrink film production 2318.4.1 Film considerations 2318.4.2 Shrink wrap packers 2338.4.3 Printed shrink wrap 234
8.5 Corrugated fibreboard 2398.5.1 Specifications 2398.5.2 Corrugated board manufacture 240
8.6 Stretch wrap 2408.6.1 Material 2408.6.2 Stretch wrapping systems 2448.6.3 Pallet wrapping 247
8.7 Pallets and pallet stacking 2488.7.1 Pallets 2488.7.2 Pallet stacking 248
8.8 Case and pallet labelling 2498.9 Getting it wrong 2538.10 Developments and testing 2578.11 Putting it all together 258
9 Production systems 259
David Steen
9.1 Introduction 2599.2 Philosophy of line layouts 2599.3 Glass bottle filling lines 2609.4 Can filling lines 2679.5 PET bottle filling lines 2689.6 Conveying systems 2709.7 Inspection systems 2729.8 Breakdown characteristics 2749.9 Line control and management systems 2779.10 Complete factory layouts 2809.11 Buildings 2839.12 Performance measurement and benchmarking 2859.13 Future trends 288Further reading 289
Steen: “fm” — 2006/4/27 — 18:30 — page xii — #12
xii CONTENTS
10 Production planning and distribution 290
Philip A. Wood
10.1 Introduction 29010.2 Supply chain principles 291
10.2.1 Make versus buy 29210.2.2 Make to order or make to stock 29310.2.3 Purchasing 29410.2.4 The soft drinks supply chain 29610.2.5 The bullwhip effect 298
10.3 Forecasting 29910.3.1 Forecast breakdown or types 30010.3.2 Forecast preparation and accuracy 301
10.4 Planning 30110.4.1 The planning and order cycle 30110.4.2 Central or local planning 304
10.5 Warehousing 30710.5.1 Environment 31410.5.2 Stock control 314
10.6 Transport and legislation 31510.7 Measuring supply chain performance 316
10.7.1 Service 31610.7.2 Costs 31710.7.3 People 31710.7.4 Resources 317
10.8 Conclusions and future developments 317Bibliography 318
11 Quality, environment and food safety systems 319
Ray Helliwell
11.1 Why have systems? 31911.1.1 Definitions 31911.1.2 Space shuttle fails 31911.1.3 Risk management 32011.1.4 A solution? 320
11.2 Management control 32111.2.1 Constraints – legislation 32111.2.2 Stakeholders determine your future 32111.2.3 Size matters 32211.2.4 Experts, but not owners 322
11.3 Management systems 32311.3.1 Four stages 32311.3.2 Decisions 323

Steen: “fm” — 2006/4/27 — 18:30 — page xiii — #13
CONTENTS xiii
11.3.3 Make the product 32311.3.4 Test and record results 32411.3.5 Review 324
11.4 International management systems – why? 32511.4.1 Notice board systems 32511.4.2 Detect and protect 32511.4.3 Automation = automatically wrong 32611.4.4 Quantity and quality 32611.4.5 Systems converge 327
11.5 The standards – a brief background 32711.5.1 ISO 9001 is the master 32711.5.2 Customer pressure 32711.5.3 Customer audits 32811.5.4 A standard is born 32811.5.5 Is ISO 22000 necessary? 32911.5.6 Other standards 33011.5.7 Systems director 33011.5.8 Standards improvement mechanisms 331
11.6 ISO Standards – common elements 33111.7 The quality management system (QMS) – BS EN ISO 9001 332
11.7.1 Resource management [6] 33211.7.2 Contract review [7.2] 33211.7.3 Purchasing [7.4] 33211.7.4 Product realization [7] 33211.7.5 Product development [7.3] 33311.7.6 Control or test [7.5.2] 33311.7.7 Quality assurance – process control 33311.7.8 Quality control – sample testing 33411.7.9 Warehousing [7.5.5] and distribution [7.5.1] 33511.7.10 Control of non-conforming product [8.3] 335
11.8 The food safety management system (FSMS) – BS EN ISO 22000 33511.8.1 The standard of the future? 33511.8.2 Policy [5.2] 33511.8.3 Pre-requisite programmes [7.2] 33611.8.4 Product characteristics [7.3.3] 33611.8.5 HACCP [7.6] 33611.8.6 Decision tree 33711.8.7 No foolproof systems 339
11.9 The environmental management system (EMS) – BS EN ISO 14001 33911.9.1 Drains and skips – duty of care 33911.9.2 Producer responsibility 33911.9.3 Climate change levy 34011.9.4 Pollution prevention and control permits 34011.9.5 EMS policy [4.2] 34011.9.6 Aspects and impacts [4.3.1] 340

Steen: “fm” — 2006/4/27 — 18:30 — page xiv — #14
xiv CONTENTS
11.9.7 Significance [4.3.1(b)] 34111.9.8 Legislation updates [4.3.2] 34111.9.9 Emergency preparedness and response [4.4.7] 341
11.10 Systems – a summary 342
Index 343
Colour plate section appears after page 174

Steen: “fm” — 2006/4/27 — 18:30 — page xv — #15
List of Contributors
Dr Philip Ashurst Dr P. R. Ashurst & Associates, Unit 5, Gooses FootEstate, Kingstone, Hereford, HR2 9HY, UK
Dr Bob Hargitt British Soft Drinks Association, 20–22 StukeleyStreet, London WC2B 5LR, UK
Mr Ray D. Helliwell A.G. Barr plc, Mansell House, Aspinall Close,Middlebrook, Horwich, Bolton, BL6 6QQ,Lancashire, UK
Mr John Horman Diessel Metering Systems Ltd., Cross Edge, GreenHaworth, Accrington, Lancashire, BB5 3SD, UK
Mr John Medling Krones UK Ltd., Westregen House, Great Bank Road,Wingates Industrial Park, Westhoughton, Bolton,Lancashire, BL5 3XB, UK
Mr David Rose Britvic Soft Drinks Ltd., Widford, Chelmsford, CM13BG, UK
Dr David P. Steen Casa Davann, Las Rellanas 26-F, Arboleas 04660,Almeria, Spain
Mr David Syrett Britvic Soft Drinks Ltd., Widford, Chelmsford, UK
Mr Walter Tatlock CBJ Service Ltd., 17 Kirkfell Drive, Astley,Tyldesley, Manchester, M29 7GB, UK
Mr Barry Taylor Dansico Ingredients Ltd., Denington Estate,Wellingborough, NN8 2QJ, UK
Mr Andrew Wilson Krones UK Ltd., Westregen House, Great Bank Road,Wingates Industrial Park, Westhoughton, Bolton,Lancashire, BL5 3XB, UK
Mr Philip A. Wood A.G. Barr plc, Mansell House, Aspinall Close,Middlebrook, Horwich, Bolton, BL6 6QQ,Lancashire, UK

Steen: “fm” — 2006/4/27 — 18:30 — page xvi — #16

Steen: “fm” — 2006/4/27 — 18:30 — page xvii — #17
Preface
The market for carbonated beverages has grown dramatically in most countries,for example, by 128% in the UK since 1984. This growth has required changesin the way factories are run. Soft drinks are now classified as food products andare produced under stringent hygiene conditions. Twenty years ago this was notalways the case – carbonated drinks were often produced in old buildings wherecross-contamination could easily occur. Filling technology has progressed rapidlyto meet the needs of manufacturers and consumers alike. Whilst the basic counterpressure filler is still the main work horse, new generations of electronically andpneumatically controlled filling machines have been developed that allow produc-tion under much more hygienic conditions and to much higher standards of fillingaccuracy and repeatability.
Primary packaging for carbonated soft drinks in most countries appears to havesettled on PET bottles, with 500 ml and 2 l sizes predominating. The returnableglass bottle business is in decline and single-trip glass bottles are now mainlyused for specialist products. The growth of can use appears to have stabilised. The‘lightweighting’ of PET bottles over the last decade appears to be reaching its limits.Work on this will inevitably continue though at a slower rate as a consequence of thehigh cost of oil. Developments in barrier technology and new resins mean that shelflife in small PET bottles is not the problem it once was for carbonated products,although the much higher bottle cost restricts the use of such materials to premiumproduct. Closure technology has also improved over the last 10 years with theadvent of new neck finishes for PET bottles and improvements in closure design.
After an introduction to carbonated soft drinks, this volume considers the speci-fications and treatments for water, the main ingredient of any soft drink. A chapter onthe other ingredients and formulation of carbonated drinks then follows (Chapter 3).Chapter 4 considers how ingredients are blended together to an agreed specification,and includes sections on sugar dissolving and batch and continuous syrup produc-tion. The predominant philosophy now is to manufacture the finished product asready to drink (RTD), and prove that it is within specification prior to carbonation.In this way losses are minimised, uniformity of product is guaranteed and there istight cost control of production.
A chapter on carbon dioxide production and the physics of carbonation thenfollows (Chapter 5). Modern carbonation techniques and feedback control areconsidered, with a discussion of different carbonation methods. The physics offilling carbonated beverages is included, followed by a consideration of the latestgeneration of filling machines (Chapter 6).
Chapter 7 deals with primary packaging – the concepts of containing, protecting,identifying and marketing are considered in the light of environmental, legislativeand cost factors for the three main containers: glass bottles, PET bottles and cans.
Steen: “fm” — 2006/4/27 — 18:30 — page xviii — #18
xviii PREFACE
Chapter 8 is on secondary packaging, explaining its importance during the devel-opment of a new or existing product. The function of secondary packaging is toensure that the primary container is delivered to the consumer in prime condition,at the same time as satisfying the ever increasing demands of the trader.
A further chapter deals with production systems, applying the topics of previouschapters to the production line and factory, discussing glass, PET and can linesand describing principles and inspection systems (Chapter 9). This chapter alsoconsiders plant breakdown characteristics, line control and management systems.An introduction to the requirements for factory layouts and design is then followedby considerations of performance measurement and benchmarking.
Chapter 10 deals with the increasingly important subject of production plan-ning and distribution. As a consequence of the high weight and comparatively lowvalue of carbonated soft drinks, this topic is receiving much more attention thanpreviously. Supply chain management is discussed in relation to soft drinks, high-lighting its importance. It is no longer enough to just produce soft drinks, theymust be produced uniformly every day and be distributed to the customer at thelowest possible cost if the producer is to stay in business. Chapter 11 is on quality,environment and food safety; completing the picture by providing the frameworkwithin which manufacturing and distribution must now exist.
The aim of this volume is to provide an overview of carbonated soft drinksproduction in the early part of the twenty-first century, presenting the latest infor-mation on carbonation and filling methods. Detailed references provide opportunityfor further reading in more specialised areas. Certain topics, such as ingredients andpackaging, are not included in great depth here because they are covered in detailelsewhere in the series. The book is aimed at graduates in food science, chemistry,microbiology and engineering who are considering a career in the soft drinks indus-try, as well as technical staff already employed within the industry and associatedsuppliers.
The editors are greatly indebted to the contributing authors: without them thisbook would not exist. All are experienced in their particular fields and, for most ofthem, the work involved in writing their chapters was a significant extra burden ontop of their already heavy workload.
David Steen
Philip Ashurst
Steen: “chap01” — 2006/4/27 — 18:30 — page 1 — #1
1 IntroductionBob Hargitt
The aim of this introduction is to provide a brief perspective on the historical devel-opment of carbonated soft drinks from their first appearance in the late eighteenthcentury to the present day, and also to consider their future path.
1.1 Early history
The consumption of soft drinks in their various forms has taken place for manycenturies in order to meet the body’s fundamental requirement for hydration. Themost obvious source of hydration is water, but in earlier times the consumption ofwater was very hazardous as it was frequently contaminated by micro-organisms.Outbreaks of cholera, dysentery and other waterborne illnesses were common inmany European cities prior to the twentieth century. The consumption of ‘smallbeers’ – drinks which had been boiled, flavoured with, for example common herbs,and slightly fermented – was widespread. Barley waters, flavoured drinks con-taining pearled barley, were recorded as early as 1320 and the earliest Englishreference to lemonade was published in 1663. The drink contained lemon juiceand was sweetened with sugar or honey and is thought to have originated in Italy.Orangeade was also recorded in the 1660s. All these early drinks were, of course, notcarbonated.
Production of effervescent alcoholic beverages, that is, beers and wines wherethe carbon dioxide was derived directly from fermentation, is recorded as begin-ning at the latest in 1693, when Dom Perignon is credited with the invention ofchampagne. However, references to sparkling wines are found in English literaturewell before this date. Several spas were also known where the water was naturallyeffervescent and during the seventeenth century scientific interest and study grewin the gas which caused this effect, particularly at Spa in Holland and Pyrmont andSeltzer in Germany. There was considerable scientific investigation across Europeof the gas we now know as carbon dioxide (CO2) by the middle of the century. In1741, Brownrigg termed the gas ‘mephitic air’ and produced effervescent watersfrom bicarbonate salts. By 1767, Richard Bewley was selling effervescent ‘mephiticjulep’ for its medicinal properties. In 1764, Macbride in Ireland demonstrated themedicinal uses of effervescent waters and their antiseptic properties.
The discovery of the means of artificially carbonating water by dissolution ofCO2 under pressure is attributed to Dr Joseph Priestley in the late 1760s, thoughthere were many other workers active in this field at the same time who probablydeserve equal credit. He published his work, Directions for Impregnating Water with
Steen: “chap01” — 2006/4/27 — 18:30 — page 2 — #2
2 CARBONATED SOFT DRINKS
Fixed Air in 1772 and Dr John Mervin Nooth developed an apparatus for preparationof effervescent waters, which he reported in the Philosophical Transactions ofthe Royal Society in 1775. Torbern Bergman, Professor of Chemistry at UppsalaUniversity in Sweden, published his work on preparation of artificial mineral watersin 1773. His treatise on Bitter, Seltzer, Spa and Pyrmont Waters has been termedthe world’s first textbook on the manufacture of mineral waters. In 1780, Duchanoyin France published a treatise on the art of imitating naturally occurring mineralwaters. The initial commercial development, deriving from all this scientific work,was that of selling imitation mineral waters, that is, waters to which were addedminerals in the proportions found in naturally occurring mineral waters and thenartificially carbonated. Hence the term in English of ‘aerated mineral waters’, whichbecame synonymous with all carbonated drinks. The commercial development ofcarbonated waters took off very rapidly following the initial scientific and technicaldiscovery.
Thomas Henry, a Manchester apothecary, is generally credited to have been thefirst commercial manufacturer of artificially carbonated water in the late 1770s. Heimproved and developed Nooth’s design to make an apparatus capable of carbon-ating batches of up to 12 gal (54 l). The product was sold in tightly corked glassbottles. Henry recommended consumption of lemon juice and soda water for thestomach but did not state whether the two were combined. By the late 1770s he wasalso selling artificially manufactured Pyrmont and Seltzer waters, that is, imitationsof the naturally occurring spa waters. Thomas’s son, Dr William Henry, was theinventor of Henry’s Law of Gases (1805). The storage of fresh water on board shipsduring long sea voyages, which could last many months, was a serious problem andthe antiseptic effect of carbonation and hence its long ‘shelf-life’, made an imme-diate impact upon the British Admiralty. It was also claimed (wrongly) that sodawater cured scurvy and one of the first uses of carbonated water was on board a ship.Bottles of soda water have been salvaged from the wreck of the ‘Royal George’which sank in 1782. Early effervescent drinks, similar to Bewley’s Mephitic Julep,were manufactured by mixing sodium bicarbonate solution with lemon juice orlime juice, which would of course cure scurvy. This was probably the cause of themisconception that CO2 was a cure for scurvy.
The manufacture of carbonated drinks also rapidly became popular acrossEurope. Paul, Schweppe & Gosse established a successful business in Geneva,before Jacob Schweppe moved to London in 1792 to set up a factory-scale oper-ation there. The production of mineral waters was well established by 1800, andJ. Schweppe & Co opened another factory in Bristol in 1803. His former part-ner, Nicholas Paul also moved to London in 1802 and set up in competition withSchweppe. Paul is credited with the first commercial use of a high pressure gaspump to aid dissolution and achieve high levels of carbonation, his mineral waterswere famous for containing several volumes of CO2.
Carbonated waters were imported into the USA from the UK prior to 1800. Thefirst commercial production is attributed to Benjamin Silliman, who was professorof chemistry at Yale College. He had seen carbonated waters on his travels toEngland and had met Joseph Priestley, who had emigrated to the USA. In partnership

Steen: “chap01” — 2006/4/27 — 18:30 — page 3 — #3
INTRODUCTION 3
with a Mr Twining, he began selling carbonated waters in 1807 in Newhaven. JosephHawkins established an enterprise in Philadelphia the same year and operationsrapidly sprang up in other cities in the north-east, for example, New York, Baltimoreand Boston.
An excellent account of the development of the soft drinks industry in the USAwas written by John J. Riley.
1.2 The growth of carbonates – production
The carbonated soft drinks industry continued to grow steadily as the nineteenthcentury progressed. By 1840, there were at least 50 manufacturers in London. Atthe Great Exhibition, held in London in 1851, J. Schweppe & Co paid £5000 for theconcession to sell ‘soda and other mineral waters’. They sold in excess of 1 millionbottles during the course of the exhibition. Throughout the nineteenth century thepopularity of carbonated soft drinks increased steadily and the number of flavoursexpanded likewise, driven by the popularity of the temperance movement. Thisgrowth of carbonates coincided with the industrial revolution through the nineteenthcentury. Production of soft drinks became more industrialised and a process ofcontinuous improvement soon developed. The Mineral Water Maker’s Manual for1885 lists over 80 patents, which were registered in the previous year, related tothe manufacture and packaging of bottled soft drinks. It also lists approximately300 trademarks which had been approved between the passing of the Trade MarksAct in 1875 and 1881, including that for the Buxton Mineral Water Co., FairfieldWorks, Buxton, in 1876.
Continuous improvement in production and packaging of carbonated soft drinksmeant that by the middle of the nineteenth century a manual bottling line wascapable of filling 100 dozen bottles per day, but the introduction of steam powerincreased that to 300 dozen per day. By 1900, it was estimated that 70,000 peoplewere directly employed in the UK soft drinks industry and 22,000 horses were usedfor product delivery. Total UK production was estimated by Bratby & Hinchcliffeto be almost 300 million dozen half pints (ca. 900 million litres). For comparison, in1990, government statistics show that almost 18,000 people were employed in thesoft drinks industry (manufacturing, distribution, sales and marketing) producing6717 million litres of drinks. In 1899, there were 2763 soft drink bottling plants inoperation in the USA.
The industries of the UK, Europe and USA progressed along slightly differentpaths owing to the differing circumstances found in those regions, although threetypes of beverage were found in each region. The industry in the UK, which wasbecoming more industrialised with large factories supplying products to the masses,progressed along the path of industrial production of soft drinks in returnable bottlessold through shops. In continental Europe the soda siphon type device (i.e. thegasogene or seltzogene) became popular for home use. These were used for thedispensing off of flavoured drinks, not just soda water. The common soda siphonwhich we would recognise today was patented by Charles Plinth in 1813. However,
Steen: “chap01” — 2006/4/27 — 18:30 — page 4 — #4
4 CARBONATED SOFT DRINKS
he used a stop-cock to dispense the contents and the use of a lever-operated devicewas patented by Deleuze and Dutillet in Paris in 1829. The use of a small metal bulbfilled with CO2 to re-charge a siphon of water was patented by Arthur Marescotin 1874.
In the USA, soda fountain equipment, where drinks were produced in shops forconsumption on site, also became very popular. Some carbonates were consumedpurely as a source of refreshment but many retained their medicinal pedigree to agreater or lesser extent. The most notable was probably quinine tonic water, whichwas consumed in tropical regions as a cure for malaria. Dandelion and burdock wasobviously of herbal origin, and another popular drink in late nineteenth-centuryScotland and in London during the 1890s was Kola Tonic. Kola (or cola) was a nutfrom West Africa, which was used by Nigerians as a symbol of hospitality. In 1886,Dr John S. Pemberton combined cola with coca (an extract from the S. Americancoca leaf) to produce his coca-cola ‘brain tonic’ sold in the soda fountain of hisstore in Georgia. In 1892, Asa G. Candler took over the business and incorporatedthe Coca-Cola Company in Atlanta with an aggressive marketing campaign for his‘nutrient beverage and tonic’. The company granted the rights to bottle the productunder licence. The first such plant opened in Chattanooga in 1899, followed rapidlyby many more. Around the same time Dr Pepper was launched by R.S. Lazenby inWaco, Texas (ca. 1888) and Pepsi-Cola was launched at New Bern, North Carolinaby Caleb D. Bradham (ca. 1896, although the name Pepsi-Cola was not coined until1901).
By the close of the nineteenth century most of the common carbonated softdrinks of today were already on sale, for example, soda water, ginger beer,ginger ale, lemonade, orangeade and other citrus drinks, cherryade, quinine tonicwater, bitter lemon, colas, sarsaparilla, root beer, cream soda etc. These would allhave been well known to consumers in the late Victorian era.
There is a difference between the American and British definitions of sodawater. In the USA, soda water is defined simply as carbonated water, but the UKlegislation still requires that soda water must contain a minimum of 550 mg/lsodium bicarbonate. Interestingly the only other legal compositional standard fora soft drink in the UK is for tonic water, which currently must contain a minimumof 57 mg/l quinine (as sulphate).
1.3 Technological development
1.3.1 Carbon dioxide
It had been recognised by many scientists in the early 1700s that the gas producedby brewery fermentation, combustion of wood and addition of acids to chalk/marblewas one and the same. It was given several names including artificial air (Boyle1685), mephitic air (Brownrigg 1741), fixed air (Black 1754), gas acide carbonique(Lavoisier 1782) and finally gaz oxide de carbon (Fourcroy 1805).

Steen: “chap01” — 2006/4/27 — 18:30 — page 5 — #5
INTRODUCTION 5
The most practical/economic means of commercial production was by the actionof sulphuric acid on marble chippings (known as whiting) or, at a later date, onsodium bicarbonate. Crushed marble (or chalk or limestone) was cheap and readilyavailable in large quantities. However, the purity of the marble was critical to thequality of the CO2. Impurities (particularly organic ones) would cause noticeable‘off flavours’ in the finished drink. This forced manufacturers to introduce filtersand scrubbers to remove taints. Bubbling the CO2 through olive oil was a com-monly used method of removing organic taints. The purification of CO2 introducedcomplexity and hence cost to the production process. Although more expensivethan marble, sodium bicarbonate could be obtained in commercial quantities atconsistently high purity and was preferred by some manufacturers. The productof the action of sulphuric acid on marble is calcium sulphate, which is insolu-ble in water. Large quantities of the resulting sludge were difficult to dispose of,particularly when the UK municipal authorities introduced controls in the 1890s.Problems of effluent emissions are not new. The liquification of CO2 by meansof high pressure was reported by Michael Faraday in 1823 and the first practicalmanufacturing equipment was patented by Dr Henryk Beins in Holland in 1877.The commercial manufacture and use of liquid CO2 for the carbonation of drinksbegan in Germany and in the USA in the 1880s. The production of solid CO2 wasdiscovered by Thilorier in 1835, and a patent for the production and use of solidCO2 was granted to Dr Samuel Elworthy in 1897. The handling and transportationof solid blocks of CO2 was much easier than for heavy metal cylinders containingliquid CO2. Though use of liquid or solid CO2 increased in the late nineteenth andearly twentieth century, it was not until the 1950s that transportation of liquid CO2by low pressure bulk road tankers became commonplace.
Production of carbonated drinks was traditionally carried out by means of addingconcentrated syrup to the bottle and then topping up with carbonated water. A con-siderable improvement in speed was achieved in 1937, when the Mojonnier BrothersCorporation of Chicago introduced a continuous blending/cooling/carbonating sys-tem. Such continuous systems have gradually replaced the syrup dosing systems,though some of the latter remained in operation into the 1980s.
1.3.2 Sweeteners
One of the major drivers of growth in carbonates has been the development ofsweeteners and consequent improvement in the quality of low calorie soft drinks,particularly in the USA and UK. Saccharin was invented in about 1874 and veryrapidly became popular as a sweetener for soft drinks, usually blended into sugar toreduce cost. Figure 1.1 shows an advertisement for saccharin, which was publishedin 1890, by which time it was already widely used. A modern supplier may havedifficulty substantiating all of the claims made for it. However, it proved to be a pop-ular sweetener in the UK, particularly when sugar was in very short supply duringthe First World War. A blend of sugar and saccharin (50 : 50 by sweetness) becamethe standard sweetener system for common soft drinks, for example, lemonade.

Steen: “chap01” — 2006/4/27 — 18:30 — page 6 — #6
6 CARBONATED SOFT DRINKS
Figure 1.1 Advertisement for saccharin, 1890.
Steen: “chap01” — 2006/4/27 — 18:30 — page 7 — #7
INTRODUCTION 7
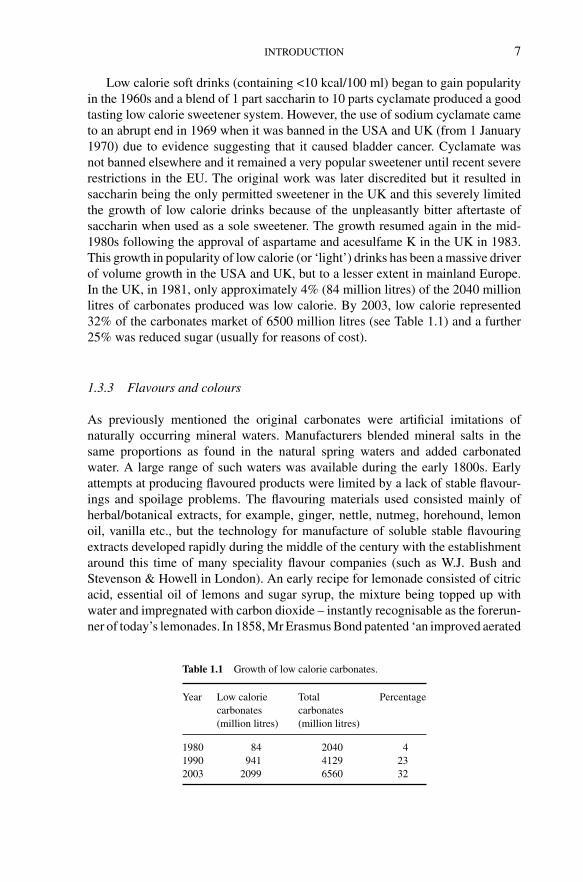
Low calorie soft drinks (containing <10 kcal/100 ml) began to gain popularityin the 1960s and a blend of 1 part saccharin to 10 parts cyclamate produced a goodtasting low calorie sweetener system. However, the use of sodium cyclamate cameto an abrupt end in 1969 when it was banned in the USA and UK (from 1 January1970) due to evidence suggesting that it caused bladder cancer. Cyclamate wasnot banned elsewhere and it remained a very popular sweetener until recent severerestrictions in the EU. The original work was later discredited but it resulted insaccharin being the only permitted sweetener in the UK and this severely limitedthe growth of low calorie drinks because of the unpleasantly bitter aftertaste ofsaccharin when used as a sole sweetener. The growth resumed again in the mid-1980s following the approval of aspartame and acesulfame K in the UK in 1983.This growth in popularity of low calorie (or ‘light’) drinks has been a massive driverof volume growth in the USA and UK, but to a lesser extent in mainland Europe.In the UK, in 1981, only approximately 4% (84 million litres) of the 2040 millionlitres of carbonates produced was low calorie. By 2003, low calorie represented32% of the carbonates market of 6500 million litres (see Table 1.1) and a further25% was reduced sugar (usually for reasons of cost).
1.3.3 Flavours and colours
As previously mentioned the original carbonates were artificial imitations ofnaturally occurring mineral waters. Manufacturers blended mineral salts in thesame proportions as found in the natural spring waters and added carbonatedwater. A large range of such waters was available during the early 1800s. Earlyattempts at producing flavoured products were limited by a lack of stable flavour-ings and spoilage problems. The flavouring materials used consisted mainly ofherbal/botanical extracts, for example, ginger, nettle, nutmeg, horehound, lemonoil, vanilla etc., but the technology for manufacture of soluble stable flavouringextracts developed rapidly during the middle of the century with the establishmentaround this time of many speciality flavour companies (such as W.J. Bush andStevenson & Howell in London). An early recipe for lemonade consisted of citricacid, essential oil of lemons and sugar syrup, the mixture being topped up withwater and impregnated with carbon dioxide – instantly recognisable as the forerun-ner of today’s lemonades. In 1858, Mr Erasmus Bond patented ‘an improved aerated
Table 1.1 Growth of low calorie carbonates.
Year Low caloriecarbonates(million litres)
Totalcarbonates(million litres)
Percentage
1980 84 2040 41990 941 4129 232003 2099 6560 32

Steen: “chap01” — 2006/4/27 — 18:30 — page 8 — #8
8 CARBONATED SOFT DRINKS
liquid, known as Quinine Tonic Water’ and, following the development of a clearsoluble ginger extract, ginger ale was first manufactured in Belfast in the 1870s.
By the second half of the century, carbonate manufacturers could buy a verycomprehensive range of flavours to use in their products and the science of flavourchemistry was well under way, as demonstrated by the development of artificialvanillin by Tiemann and Wallach in 1872. This reduced the cost of vanilla flavourby a factor of more than ×30 (from $300/lb ($555/kg) to less than $10/lb ($19/kg)).As mentioned above, many of the popular drinks of today were on sale before 1900.The quantity of CO2 added to a drink has a pronounced effect upon its character andflavour impact. The solubility of CO2 in water decreases as temperature increasesbut increases with increasing pressure, that is, a given level of carbonation willgenerate a higher pressure as the temperature increases. Ice cold water (0◦C) willdissolve 1.7 volumes (3.4 g/l) of CO2 at atmospheric pressure. At CO2 levelsand at temperatures above this, increased pressure must be applied to retain theCO2 in solution. In some of his early highly carbonated waters Nicholas Paul usedcarbonations of up to eight volumes of CO2 (16 g/l); however, the usual carbonationlevels now range from about two volumes for a slightly sparkling fruit drink toaround five volumes for a mixer drink such as tonic water (see Table 1.2). Mixersrequire higher levels of carbonation because they are intended to be diluted withspirit before consumption.
In the early 1800s, colours were restricted to mainly variants of brown and red,that is, those which could be produced from caramel or cochineal. This remainedthe case until the introduction of synthetic aniline dyes around 1880. The MineralWater Maker’s Manual for 1885 described the manufacture of some colours fromvegetable extracts but stated that there was a trend for these to be replaced bythe new aniline-based dyes, even though these ‘are considered objectionable bymany’. It also strongly warned manufacturers not to use colours such as arsenicsulphate, lead chromate, mercury sulphate and copper arsenite, which it claimedwere sometimes used to colour confectionery.
1.3.4 Packaging
Waters from natural springs were recognised as being safe (even healthy) to drinkfrom earliest times and were transported by whatever means that were available.
Table 1.2 Typical carbonation levels.
Volume (g/l)
Lightly sparkling 2.0 4Fruit juice carbonate 2.5 5Lemonade 3.0–3.5 6–7Cola 4.0 8Mixer 4.5–5.0 9–10
Steen: “chap01” — 2006/4/27 — 18:30 — page 9 — #9
INTRODUCTION 9
Naturally carbonated waters were collected into earthenware containers, whichwere tightly sealed with cork and wax, usually not very successfully. The use ofearthenware bottles proved to be unsatisfactory for the more highly carbonated aer-ated mineral waters and they were soon replaced by glass bottles. Many of the earlyglass bottles had round bottoms ensuring that they were stored on their side, therebykeeping the corks moist and so preventing leakage from corks drying out. The man-ufacture of glass bottles was a skilled job as they were hand blown. Although somesemi-automation had been introduced earlier, the first patent for an automatic glassbottle blowing machine was granted to Michael J. Owens in the USA in 1904.
High pressure generated inside bottles by the carbonation caused frequent leak-age and, although improved by wiring-in-place, corks were generally unsatisfactory.Many alternative forms of seals were patented over the years and these fell broadlyinto three main categories:
1. Wire and rubber sealing devices were especially popular in the USA untilthe early 1900s. The wire could be either an internal spring form, whichheld a seal in place on the inside of the neck, or of the external ‘swing’ type,in which an external wire frame was used to hold a ceramic plug in placeagainst a rubber seal. First patented by Charles de Quillfeldt in 1874, thislatter type is still currently in use for some speciality beers.
2. Variations on the theme of using an internal ball made from rubber, eboniteor glass were developed and used with varying degrees of success. The ballwas held in place by the internal pressure. The most successful of these waspatented by Hiram Codd of London. His bottle was widely used in the UKfrom the 1870s until the 1930s. A similar bottle, but with a floating rubberball acting as seal, was patented in the USA by S. Twitchell in 1883.
3. The third popular alternative was the internal screw top bottle. Unliketoday’s bottles, the thread was on the inside of the bottle neck and an eboniteor wooden stopper screwed into the neck, with a rubber washer being usedto improve the seal. These types of stoppers were in common usage wellinto the 1950s in the UK. Ebonite, an early type of plastic resin materialsoon replaced wood, which had a tendency to absorb moisture, causing itto swell and crack the bottle neck.
A major step forward in sealing development was made by William Painter, whoin 1892 patented the ‘Crown Cork’, founding the Crown Cork and Seal Companyon 1 April 1892. Although initially slow to gain acceptance for two reasons: (a) theexisting large capital investment in returnable bottles and bottling plant, and (b) theneed for a tool to remove the crown, the crown cork eventually became popular,especially for small single serve and beer bottles. Screw stoppers retained theirpopularity for the larger bottles where re-sealability was important.
Except for some speciality earthenware ginger beer containers, glass bottleswere the only form of packaging for carbonates for over hundred years until theintroduction of cans in the 1960s. Then, just as the second half of the nineteenthcentury had been ‘boom-time’ for product development, the second half of thetwentieth century became ‘boom-time’ for packaging and distribution development.
Steen: “chap01” — 2006/4/27 — 18:30 — page 10 — #10
10 CARBONATED SOFT DRINKS
1.4 Recent technological development
Technology certainly played a large part in the growth of soft drinks in the sec-ond half of the twentieth century. The development of cans, plastic bottles, highspeed packaging lines and improvements to distribution systems have been largelyresponsible for the increase in availability, the decrease in real-term cost and theresultant increase in consumption.
The advent of railways and large steam ships in the 1800s made transportationfeasible and indeed drinks were exported from the UK to the USA as early as 1800.The export trade continued to expand and by the mid-1800s significant trade wasbeing done with the far corners of the Empire. This must have involved considerablecost and on a domestic basis the trade was on a much more local scale. The industryevolved as a multitude of local businesses operating in a small geographical area,though some larger companies operated several production plants in different partsof the country. The UK Bottler’s Year Book 1933 listed more than 2000 soft drinkmanufacturing companies but by 1983 the list had shrunk to less than 400, andthe number is now down to less than 100. Likewise the number of bottling plantsin the USA grew to reach a peak of 7920 in 1929, remaining fairly constant untilaround 1950 and then halved to 3727 by 1965 as improved productivity and dis-tribution started to have a significant effect. This halving of the number of bottlingplants took place over a period in which per capita consumption rose by over 60%.More recently, the growth of cans and PET bottles at the expense of returnableglass has played a significant part in this continuing productivity improvement,which has been truly amazing. As recently as 20 years ago a typical returnableglass bottle line producing, say 300 bottles/min, required about 25 operating per-sonnel. Highly automated high speed production lines now fill up to 2000 cans/minusing three operators. Likewise, integrated PET bottle blowing and filling oper-ations have also improved production efficiencies significantly. Other factorscontributing to improved operational/distribution efficiencies (both in time and cost)include:
• use of shrink wrap in place of crates or boxes• micro-processor controlled equipment, for example, for palletisation• automated syrup room operations• centralised computer-controlled warehousing systems• automated bar-coding and traceability systems.
1.5 The growth of carbonates – consumption
The growth of carbonates worldwide has been a remarkable phenomenon, not onlyin the USA and western Europe, but also in Mexico, Brazil, eastern Europe, Chinaand India. In the USA especially, carbonates have dominated the soft drinks marketand the carbonates market has been dominated by cola. This worldwide growth incarbonates can be attributed in large part to the two major American cola companies

Steen: “chap01” — 2006/4/27 — 18:30 — page 11 — #11
INTRODUCTION 11
and their aggressive international sales and marketing campaigns. In the UK, Europeand Japan, cola accounts for almost half of the total carbonated soft drinks marketand in the USA almost 70%. The scale of carbonates consumption globally istruly impressive, amounting to a total of almost 193,000 million litres in 2004. TheAmericas (North and South) accounted for more than half of the total (see Table 1.3)but there is little doubt that at their present rates of growth China and India willsoon start to make an impact on the global scene. However, in the USA and UK it isclear that carbonates’ dominance of the soft drinks market has peaked and begun towane in the past few years, although exact numbers reported vary because of slightdifferences in definitions and methodologies between the research companies. Inthe UK, carbonates volume reached more than half of the total soft drinks market,peaking at around 52% in the mid-1990s. Although the volume of carbonates hadbeen continuing to grow year on year, still drinks have recently been growing morestrongly, increasing their market share because of their perceived ‘more healthy’image. Carbonate volumes increased from 2.18 billion litres in 1982 to 4.27 billionlitres in 1992 and 6.5 billion litres in 2003 (see Table 1.4), however this inexorableclimb in volume appears to have stopped. ACNielsen have reported that in 2004sales value of carbonates fell by 3.3% (4.7% lower by volume) when comparedwith the previous year. Whilst some of the recent fall in sales can undoubtedly be
Table 1.3 Global consumption of carbonates.
Region Volume (million litres) Percentage
North America 63,655 33Latin America 42,437 22West Europe 30,863 16Asia/Australia 28,934 15Africa 9,645 5East Europe 9,645 5Middle East 7,716 4Total 192,895
Source: Zenith International.
Table 1.4 Growth of UK carbonates.
Year Total carbonates(million litres)
1980 20951985 27351990 41291995 53802000 59502003 6560
Steen: “chap01” — 2006/4/27 — 18:30 — page 12 — #12
12 CARBONATED SOFT DRINKS
attributed to comparison with the record breaking hot summer of 2003, it is clearthat carbonates have suffered a slowdown as their market share continues to decline.It has also been reported in trade press that the sales of carbonated drinks in the USAhave been virtually static for several years now, and have in fact declined marginallyon a per capita basis. Beverage Marketing Corporation (BMC) has recently reportedthat total US volume sales of carbonates grew by only 0.7% in 2004 to 58.2 billionlitres. On a per capita basis that represents a fall of 0.2% to 203.5 l/person, the sixthconsecutive year of decline since consumption peaked at 207.7 l/person in 1998.This compares with a western European consumption of around 77 l/person and aUK figure of 111 l/person.
Three factors were largely responsible for the remarkable growth in popular-ity of carbonates: marketing, lifestyle and technology. ‘Demand creation’ by themajor brands using powerful images on a worldwide scale has been a key factor inexciting public interest. This has been coupled with a massive increase in availabil-ity. Carbonates are now available at virtually every location; not just in shops andsupermarkets, but in cinemas, sports centres, garages and railway stations and arefrequently sold from refrigerated vendors for even better refreshment. The trendhas also been influenced by changing lifestyles and greater convenience. For exam-ple, the ‘easy open end’ on cans had a marked impact on their convenience, andhence popularity, from their introduction in the1970s. The introduction of PETenabled larger sizes of bottles to be manufactured than was possible with glass,that is, 2 and 3 litres, and the introduction of ‘multipacks’ for cans and bottles hasencouraged shoppers to purchase larger quantities. This trend has been helped bythe move to out-of-town shopping centres easily accessible by car. A frequentlyignored supply route for carbonates is that of dispensed drinks, that is, where thedrink is supplied to the retail outlet in the form of a concentrated syrup, whichis diluted with cold carbonated water at the point of serving to the customer bymeans of a fixed dispensing system. This type of operation is commonly foundin fast food outlets and large bars. Dispensed carbonates account for 11% of thetotal UK consumption of carbonates (715 million litres) and their growth has beendriven by lifestyle changes resulting in a greater proportion of food and drink nowbeing consumed away from home. The move away from returnable glass to PEThas also provided for much greater flexibility in the range of available bottle sizesand hence consumer satisfaction. In 1980, glass bottles still accounted for 65% ofcarbonated soft drinks in the UK. By 1990 this had fallen to 14% and by 2003 to amere 3%.
The introduction of modern technology has enabled considerable cost savings.This has been achieved by economies of scale, by the ‘light-weighting’ of cans andbottles (thereby saving raw materials), by increased automation, by a reduction inthe use of outer packaging and by savings in distribution costs. UK governmentstatistics show that in the 5 years from 1998, the retail price of soft drinks fellby 1% over a period when general inflation was 12%, that is, a real terms pricereduction of 13% over 5 years. This is just the continuation of a trend, which hasresulted in a very significant long-term fall in the real prices of soft drinks, includingcarbonates.

Steen: “chap01” — 2006/4/27 — 18:30 — page 13 — #13
INTRODUCTION 13
1.6 Changing public perception and future challenges
Unfortunately the very success of carbonated soft drinks, and their resulting highprofile, has provoked hostility towards them. Initially from the environmentalists,who perceived drinks packaging as a major source of waste and litter, becauseeven though it represents only a relatively small percentage of total packagingwaste, it is highly visible. Considerable light-weighting of both cans and bottlesand reductions in both the amount and weight of outer packaging has reduced thewaste associated from drinks and there is significant recycling of the metal contentof cans. However, the introduction of legislation, most notably in Germany, has hada major impact on the industry. Environmental issues will be dealt with in greaterdetail in Chapter 11.
More recently as the media’s attention has focused on obesity, especially whereit affects children, the term ‘fizzy drinks’ has become indelibly linked to ‘junk food’to such an extent that it has become a pejorative term. Fizzy drinks are in danger ofbecoming a hate figure – blamed for the world’s ills. There are currently concertedmoves in many countries to ban fizzy drinks from schools. Indeed some extremistshave gone so far as to propose that they should not be sold within a given fixedradius of any school premises. Some schools already prohibit children from takingcarbonated drinks into school, for example in lunch boxes. The promotion of softdrinks to children, particularly by means of television advertising, has come underscrutiny and may well be restricted in the UK, as it already is in some EU countries,for example Sweden. The headlines in the popular press cry out almost daily thatfizzy drinks are responsible for not only making schoolchildren obese but also fortheir bad behaviour and the stunting of their learning abilities. There have alsobeen anecdotal claims that the consumption of carbon dioxide can lead to depletionof calcium from the body with consequent adverse effects on bone density. Thisremains, however, a theory for which no convincing scientific evidence has beenfound. Scientific studies, for example, by Heaney and Rafferty in 2001, have foundno excretion of calcium from the body associated with elevated consumption ofcarbonated drinks.
At the time of writing, draft legislation is proceeding through the EuropeanParliament concerning the addition of nutrients (in particular vitamins and minerals)to foodstuffs and any nutritional or health claims which may be made about them.There is a strong campaign supporting the proposal that soft drinks, and particularly‘fizzy drinks’, should be prohibited by law from any form of nutritional fortificationand from making any nutritional or health claims. It seems that the passage ofsuch draconian restrictions into legislation is unlikely and there is no doubt thatthe industry has been responding to the consumer’s demands for a greater rangeof products and for products perceived as ‘more healthy’. Sales of diet drinks,waters and fruit juices have shown considerable growth. In particular the increasein UK consumption of bottled waters has been phenomenal (see Table 1.5), froma paltry 25 million litres in 1980 to 2070 million litres in 2003, at a retail value of£1.2 billion (e1.8 billion). The bottled water market is however dominated by stillwaters (<20% carbonated).

Steen: “chap01” — 2006/4/27 — 18:30 — page 14 — #14
14 CARBONATED SOFT DRINKS
Table 1.5 Growth of UK bottled waters.
Year UK consumption(million litres)
1980 251985 751990 4001997 9002000 14152003 2070
The growth in low calorie carbonates since the mid-1980s has been almost asspectacular as that of bottled waters, from 84 million litres in 1981 to 2200 millionlitres in 2003. Indeed almost 60% of carbonated drinks now sold in the UK containsweeteners as a total or partial replacement for sugar. It is generally expected thatthese trends will continue as the consumer seeks a more healthy lifestyle but itmust be remembered that not all consumers seek healthy products and one of thesuccess stories of the past decade has been Red Bull, a so-called energy drink, andits multitude of imitators. Even so, some energy drinks have introduced low calorieversions in recognition of the trend although the author considers the term ‘lowcalorie energy drink’ to be an oxymoron.
There is no intrinsic reason why a still drink should be more ‘healthy’ than acarbonated one. Carbonates can be low sugar, manufactured with ‘natural’ ingre-dients, contain fruits, healthy botanical extracts, antioxidants, etc., and be fullycompatible with a healthy lifestyle, provided that (like all other foodstuffs) they areconsumed in moderation as part of a balanced diet. As part of this trend towardshealthy and natural there has been a rapid growth in the number of drinks makinguse of the healthy heritage of spring or natural mineral waters, in both sweetenedand unsweetened products, usually without colour. It is interesting to see carbon-ates returning full circle towards their late eighteenth-century origins as ‘AeratedMineral Waters’.
Acknowledgements
I wish to thank Mr Colin Emmins for his assistance and the data sources of ZenithInternational and ACNielsen.
Bibliography
The Bottlers’ Year Book 1933. H.C. Vickery, Surrey.The Bottlers’ Year Book 1983. B.Y.B. Limited, Surrey.Emmins, C. Soft Drinks; Shire Album (269). Shire Publications, Buckinghamshire.

Steen: “chap01” — 2006/4/27 — 18:30 — page 15 — #15
INTRODUCTION 15
Heaney and Rafferty (2001) American Journal of Clinical Nutrition.Kirby, F.L.S.W. (1902) The Evolution of Artificial Mineral Waters. Jewsbury & Brown, Ardwick Green,
Manchester.The Mineral Water Maker’s Manual for 1885. J. Gilbert Smith, London.Riley, J.J. (1958) A History of the American Soft Drink Industry – Bottled Carbonated Beverages.
American Bottlers of Carbonated Beverages, Washington DC.(1904) Mineral Waters and Their Uses. Mayfield Press, UK.

Steen: “chap02” — 2006/4/27 — 18:30 — page 16 — #1
2 Water treatmentWalter Tatlock
2.1 Introduction
Water constitutes some 90% of a typical soft drink. The quality of the water usedmust, by necessity, meet very stringent standards, as each bottle or can of a givendrink must be indistinguishable from all others. Statutory requirements as to thequality of a soft drink must be adhered to in each producing country. Any ‘off’taste in the water used will be carried over to the soft drink. For these reasons, allthe water used in a soft drinks plant must conform to an agreed specification. Eachmajor soft drinks manufacturer has its own standards, developed over the yearsthrough trial and error. These standards ensure that wherever a particular drink isproduced the taste and quality are the same. In addition, risk to the consumer andto the business must be considered at all times. If the water used is contaminatedin any way, the risk to the business increases.
If we consider the water cycle shown as Figure 2.1, it can be seen that thesituation is very complex. The figure helps us to understand why water treatment isrequired and why this treatment must be applied consistently because of where watercould come from. The Earth’s water is always in movement, and the water cycle,also known as the hydrological cycle, describes the continuous movement of wateron, above and below the surface of the Earth. Since the water cycle is truly a ‘cycle’,
Water storage in the atmosphereWater storage in the atmosphere
Evapotranspiration
Evaporation
Condensation
Water storagein oceans
Water storage inice and snow
PrecipitationPrecipitationPrecipitation
SublimationSublimation
Surface run-offSurface run-offSurface run-off
SpringFreshwater
storage
Groundwater storageGroundwater storage
Groundwater discharge
Groundwater storage
Groundwater discharge
Streamflow
Evaporation
Snowmelt run-offto streams
Water storage in the atmosphere
Sublimation
InfiltrationInfiltrationInfiltration
Figure 2.1 The water cycle.
Steen: “chap02” — 2006/4/27 — 18:30 — page 17 — #2
WATER TREATMENT 17
there is no beginning or end. Water can change states among liquid, vapour and iceat various places in the water cycle, with these processes happening anywhere fromvirtually instantaneously up to millions of years. Although the balance of water onthe Earth remains fairly constant over time, individual water molecules can comeand go. The water in an orange eaten yesterday may have fallen as rain in somecountry half way around the world last year or it could have been used 100 millionyears ago by some dinosaur.
Quite clearly the water cycle has no starting point. However, as most of theEarth’s water is contained in the oceans, it seems logical to start here. The sun drivesthe water cycle and heats the water in the oceans. Some of the water evaporatesas vapour into the air, and ice and snow can sublimate directly into water vapour.Rising air currents take the vapour up into the atmosphere along with water fromevapotranspiration, which is water that is transpired from plants and evaporatedfrom the soil. The vapour rises into the air, where cooler temperatures cause it tocondense into clouds. Air currents move clouds around the globe; cloud particlescollide, grow and fall from the sky as precipitation. Some precipitation falls assnow and can accumulate as glaciers and ice caps, which can store frozen waterfor thousands of years. Snowpacks in warmer climates often thaw and melt whenspring arrives, and the melted water flows overland as snowmelt. Most precipitationfalls back as rain into the oceans or on to land, where, owing to gravity, it flowsover the ground as surface run-off. A portion of run-off enters rivers in valleys, withstreamflow moving water towards the oceans. Run-off and groundwater seepageaccumulate and are stored as freshwater in lakes. However, not all run-off flowsinto rivers. Much of it soaks into the ground as infiltration. Some water infiltratesdeep into the ground and replenishes aquifers, which are saturated subsurface rockthat stores huge amounts of freshwater for long periods of time. Some infiltrationstays close to the land surface and can seep back into surface-water bodies, as wellas the ocean, as groundwater discharge, and some groundwater finds openings inthe land surface and emerges as freshwater springs.
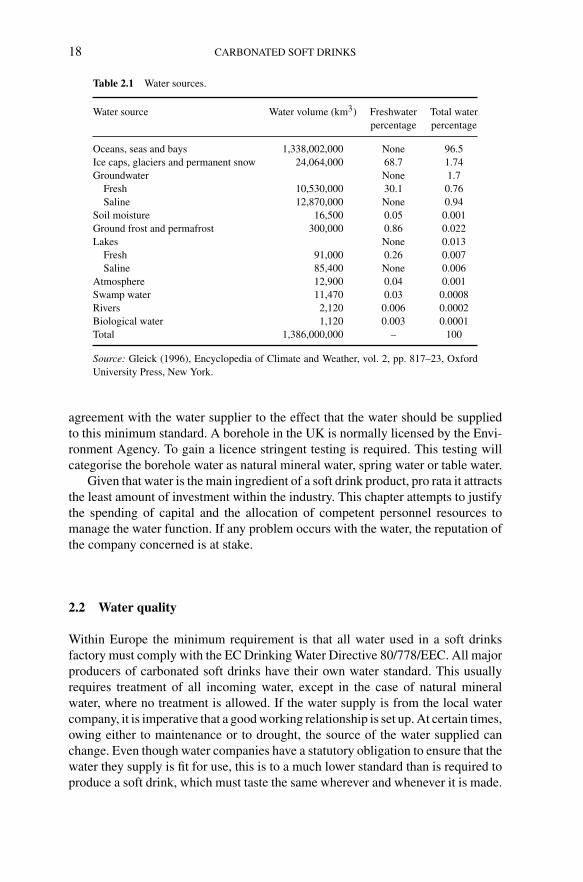
This cycle repeats itself in many ways all the time. The world’s water is dis-tributed and shown in Table 2.1. During this cycle water picks up contaminants:it is said to be the universal solvent. Water has a tendency to dissolve a little ofeverything it comes into contact with. If, for example, it dissolves sulphur from anindustrial chimney, it can form acid rain. As water runs over a particular soil, itdissolves some of the soil’s constituents. When the water seeps through the Earth,it dissolves portions of the minerals present. Agricultural by-products, fertilisers,insecticides, bacteria and other contaminants are all present in the hydrologicalcycle. They can be present in varying amounts in any water source. For this reason,it is important to regularly analyse the water supplied to a soft drinks plant and toinstall water treatment equipment that will ensure the water is treated to remove allcontaminants to achieve the company water standard at all times.
Water is usually supplied from two main sources. A soft drinks bottler eitherbuys the water from a local water company or obtains it from a company bore-hole. If the water is bought from a local water company, it is normally piped to thebottler to a minimum agreed standard. It is the duty of the bottler to have a written
Steen: “chap02” — 2006/4/27 — 18:30 — page 18 — #3
18 CARBONATED SOFT DRINKS
Table 2.1 Water sources.
Water source Water volume (km3) Freshwater Total waterpercentage percentage
Oceans, seas and bays 1,338,002,000 None 96.5Ice caps, glaciers and permanent snow 24,064,000 68.7 1.74Groundwater None 1.7
Fresh 10,530,000 30.1 0.76Saline 12,870,000 None 0.94
Soil moisture 16,500 0.05 0.001Ground frost and permafrost 300,000 0.86 0.022Lakes None 0.013
Fresh 91,000 0.26 0.007Saline 85,400 None 0.006
Atmosphere 12,900 0.04 0.001Swamp water 11,470 0.03 0.0008Rivers 2,120 0.006 0.0002Biological water 1,120 0.003 0.0001Total 1,386,000,000 – 100
Source: Gleick (1996), Encyclopedia of Climate and Weather, vol. 2, pp. 817–23, OxfordUniversity Press, New York.
agreement with the water supplier to the effect that the water should be suppliedto this minimum standard. A borehole in the UK is normally licensed by the Envi-ronment Agency. To gain a licence stringent testing is required. This testing willcategorise the borehole water as natural mineral water, spring water or table water.
Given that water is the main ingredient of a soft drink product, pro rata it attractsthe least amount of investment within the industry. This chapter attempts to justifythe spending of capital and the allocation of competent personnel resources tomanage the water function. If any problem occurs with the water, the reputation ofthe company concerned is at stake.
2.2 Water quality
Within Europe the minimum requirement is that all water used in a soft drinksfactory must comply with the EC Drinking Water Directive 80/778/EEC. All majorproducers of carbonated soft drinks have their own water standard. This usuallyrequires treatment of all incoming water, except in the case of natural mineralwater, where no treatment is allowed. If the water supply is from the local watercompany, it is imperative that a good working relationship is set up. At certain times,owing either to maintenance or to drought, the source of the water supplied canchange. Even though water companies have a statutory obligation to ensure that thewater they supply is fit for use, this is to a much lower standard than is required toproduce a soft drink, which must taste the same wherever and whenever it is made.

Steen: “chap02” — 2006/4/27 — 18:30 — page 19 — #4
WATER TREATMENT 19
No risk of product taint or colour problems as a result of turbidity issues can beallowed.
I particularly like a statement made by Bill Clinton in 1996, who said,‘A fundamental promise we must make to our people is that the food they eat andthe water they drink are safe’. The UK Water Supply (Water Quality) Regulations2000 state that:
The problems associated with chemical constituents of drinking water arise primarily from theirability to cause adverse health effects after prolonged periods of exposure. There are few chemicalconstituents of water that can lead to acute health problems, except through massive accidentalcontamination of a supply. In contrast, contamination of water supplies for a short period withharmful organisms can expose large sections of the population to health risks leading to illness and,in rare cases, to death.
The messages are clear: we should all be aware of the risks that contaminated watercan pose. There is no excuse for not taking the correct actions to ensure that thewater we use is of the required quality.
A typical water quality standard for soft drinks is shown in Table 2.2. To ensurethat this standard is always met, it is necessary to regularly analyse the water: a fullanalysis should be carried out monthly, and on a daily basis basic parameters shouldbe checked. There are now available simple testing kits for basic contaminants, oftenusing tablets that can be added to water in a test tube, with the resultant colour ofthe liquid being compared against a colour chart to determine the concentration ofchlorine and so on. Table 2.3 lists the basic tests that are usually carried out. In addi-tion to these simple chemical tests, regular testing for micro-organisms is necessary.The removal of cryptosporidium has become one of the most important procedures.
The first necessity is for a company chemist to agree the water standard withthe company’s board. This standard needs to be regularly reviewed against what isactually being achieved. Is the standard too rigid and too problematic to achieve?Have any product problems occurred since the previous review? What technicalproblems exist in actually achieving this standard with the water treatment plantavailable? Is further investment in plant required? Do we meet current legislation?What future legislation could affect this standard? Such questions as these willallow the standard to be updated in the commercial world we live in. The key is toprovide consistent water quality at all times without going over the top in terms ofsystem sophistication. Risk analysis is a very necessary part of these deliberations.It is important to minimise risk at all times. We do not want to endanger anyone’shealth. In the simplest terms, all water used for soft drinks must be free frommicro-organisms, taints and odours, clear and colourless and, especially if it is tobe carbonated, free from dissolved oxygen.
At each production site the treated water should be tested for conductivity,turbidity, microbiological levels, taste, odour and appearance, alkalinity and freechlorine. In addition, the incoming raw water should be tested daily for turbid-ity and microbiological levels. Most plants have an in-line turbidity meter thatautomatically shuts off the supply should the alarm limit be reached. Turbidity isdefined as an expression of the optical property that causes light to be scatteredand absorbed rather than transmitted in straight lines through a sample. In simple

Steen: “chap02” — 2006/4/27 — 18:30 — page 20 — #5
20 CARBONATED SOFT DRINKS
Table 2.2 Typical organoleptic, physical, chemical, anionic and cationic standards.
Maximum level Comments
OrganolepticOdour Odourless Taste and odour effectsTaste Tasteless Triangular taste test
PhysicalColour 20 mg/l Pt/Co scale Drink clarityTurbidity 1 FTU Clarity and fobbing
ChemicalAlkalinity 100 mg/l as CaCO3 Affects product acidityBenzene 5 µg/l Can cause anaemia and cancerConductivity 500 µS Action required if >50 µS changeFree chlorine 0.05 mg/l as Cl2 Off flavoursOrganic content 2 mg/l total organic Taints
carbonOxygen absorbed from KMnO4 After de-aeration Micro-organism growth and fobbing
0.05 ppmpH 6.5–8.5 Acid controlPhenols and chlorophenol 0.5 µg/l TastePolycyclic aromatic hydrocarbons 0.01 µg/l Reproductive difficultiesTotal dissolved solids (TDS) 500 mg/l Possibly salty, off tastesVolatile substances extracted 0.1 mg/l Off tastes
by chloroform
AnionicChloride 20 mg/l as chloride Salty taste and can corrosionFluoride 1.5 mg/l as F Teeth mottling and bone diseaseNitrate 20 mg/l as NO3 Can corrosion and organic
pollutionNitrite 0.1 mg/l as NO2 Can corrosion and organic
pollutionPhosphate 3 mg/l as P2O5 Micro-organism growthSulphate 10 mg/l as SO4 Can corrosionSulphite 1 mg/l as SO3 Possible neurotoxin
CationicAluminium 0.2 mg/l as Al Sediment; turbidityArsenic 0.05 mg/l as As Skin damage; circulatory problemsCadmium 5 µg/l as Cd Kidney damageChromium 0.05 mg/l as Cr Allergic dermatitisCopper 3 mg/l as Cu Liver or kidney problems, stomach
distress; toxicCyanide 0.05 mg/l as CN Nerve damage and thyroid problemsIron 0.2 mg/l as Fe Taste and appearanceLead 0.05 mg/l as Pb Kidney problems; affects
mental development in childrenManganese 0.03 mg/l as Mn Sediment; off flavourMercury 1 µg/l as Hg Kidney damageSelenium 0.01 mg/l as Se Hair or fingernail loss; numbnessSodium 150 mg/l as Na Salinity when linked to a chlorideZinc 5 mg/l as Zn Astringent taste

Steen: “chap02” — 2006/4/27 — 18:30 — page 21 — #6
WATER TREATMENT 21
Table 2.3 Daily water checks.
Test Incoming water Treated water
UV efficiency No YesTaste, odour and appearance No YesMicrobiological levels Yesa Yesa
Alkalinity No YesTurbidity metreb Yes YesSilt density Yes YesFree chlorine No Yes
Notes:aThe tests would usually be TVC <500 per 100 ml sample at25◦C with no coliforms present in the same size sample. Faecalstreps should be absent in a 100 ml sample.bThis should also have an automatic data logger.
terms, it is a measure of relative sample clarity. The international standard is ISO7027 (1984 edn). The most widely used unit is the FTU, or formazin turbidity unit,though the United States Environmental Protection Agency uses the NTU, or neph-elometric turbidity unit. The NTU is also most widely used in the UK. The WorldHealth Organization (WHO) states that all water turbidity should be below 5 NTUand ideally below 1 NTU. The principle of a turbidity meter is shown in Figure 2.2.
2.3 Town mains water
The town mains is the principal supply of water. Within the UK this supply iswarranted to be potable, though not always suitable for the production of soft drinks.Each water supply company has its own water supplies, whether from a lake in Walesor the Lake District, a Scottish loch, a borehole, a river or de-salinated from thesea. UK water companies treat all the incoming water to meet the EU regulations.Some companies have dispensations with time limits imposed on them. They arealso responsible for the distribution system from the point of supply to the watertreatment works and from these works to each customer.
A factory usually receives its water from a specific water treatment works.However, water can come from a variety of sources according to the level of drought.If there has been no appreciable rainfall for a considerable time, then the risk to asoft drinks company will increase. The water source will probably be more variableand, although potable, will require different water treatment levels from the norm.Such conditions must be catered for within the factory’s water treatment system.
Another problem in the UK is the state of many pipelines. Although theseare being replaced, some still date back over a century, and such old installationscan lead to contamination problems. Even when pipelines are replaced, the actof replacement causes disruption and may result in ingress of excess silt into thesystem by back-siphoning. The user needs to be vigilant at all times.

Steen: “chap02” — 2006/4/27 — 18:30 — page 22 — #7
22 CARBONATED SOFT DRINKS
G G1
PL1 L2
St
St
L1 Light beam striking the sampleL2 Light beam passing through sampleP SampleSt Scattered lightG/G1 Peripheral rays of scattered light beam used for measurement
Figure 2.2 Turbidity metre working principle.
As all water is metered and water is becoming more expensive every day,it should be conserved as far as possible. Most soft drinks factories use overtwice as much water as they actually bottle – for example, in cleaning systems.Water usage needs to be monitored, as the cost to purchase water and the efflu-ent costs are very similar, especially if the COD (chemical oxygen demand)and BOD (biological oxygen demand) levels are high. Water conservation needsto be practised at all times, commensurate with ensuring the integrity of thefinal product. The UK Integrated Pollution Prevention Control (IPPC) legisla-tion requires that waste be minimised by assessing the environmental impactof all materials used and produced on site, water use, and abatement of point-source emissions to surface water and sewers. Assessment includes identifyinghow much water is taken into and discharged from the site, emissions to ground-water by map location of sewer and drain points, waste handling, basic energyrequirements and TOC (total organic carbon) monitoring of water and seweremission.
By 2007 all industry sectors will have to comply with this legislation. Thisimplies working closely with your water supplier, who will most likely also managethe effluent. The Water Regulations (1999) have replaced local water bylaws withnational legislation. In principle, the regulations govern the use of fixtures andfittings across a site and are designed to protect staff, customers and the environmentfrom poor water quality and unnecessary waste.
Steen: “chap02” — 2006/4/27 — 18:30 — page 23 — #8
WATER TREATMENT 23
The Water Framework Directive (WFD) 2000/60/EC is the most significantpiece of European water legislation to be produced for over 20 years. The WFDrationalised and updated existing water legislation and introduced an integrated andco-ordinated approach to water management in Europe, based on the concept of riverbasin planning. The directive takes a holistic approach to water management andwill update existing EC water legislation through the introduction of a statutory sys-tem of analysis and planning. The major aims of the directive are to prevent furtherdeterioration and to protect and enhance the status of aquatic ecosystems and associ-ated wetlands, to promote the sustainable consumption of water, to reduce pollutionof water with priority substances, to prevent deterioration in the status and to pro-gressively reduce pollution of groundwater and to contribute to mitigating the effectsof floods and droughts. It is clear that we all need to consider the latest legislation –both water supplier and user – and work together to ensure due diligence.
2.4 Boreholes
Although it is not the intention of this chapter to go into boreholes in any real detail,it is useful to go over the basics. More detail can be found in Senior and Dege’sTechnology of Bottled Water (2004).
A borehole with natural mineral water status and sufficient quantity and qual-ity of water to meet current and future demands is every manufacturer’s dream.Often, in fact, the supply has to be treated in some way to ensure that the tasteof the soft drinks produced meets customers’ requirements at all times. In thiscase it is often better just to opt for spring water status, where some treatment isallowable. Most boreholes provide very consistent water quality from the aquiferat a constant temperature. In fact, they often supply water at lower than ambienttemperature, which is highly conducive to efficient carbonation. Only when theaquifer is near the surface is there usually any risk, because little time is requiredto replenish from possibly contaminated land. If a borehole supply does not meetthe EC water standards it cannot be called natural mineral water or spring water,both of which must meet microbiological standards without treatment. Most watersstart off with the categorisation spring water. After two years of testing the localauthority may change the category to natural mineral water, which needs, in theUK, to be registered with the Food Standards Agency.
Before a borehole can be drilled in the UK a hydrogeological survey and theagreement of the Environment Agency are required. If this survey shows that aborehole is feasible, then a drilling company must be approached. The hydrogeol-ogist usually manages this on behalf of the client, as full drilling logs are required.Ideally, the borehole should be located at least 50 m from any possible uphill pollu-tion sources. A typical borehole construction is shown in Figure 2.3. Such boreholesare often in excess of 100 m deep. A simple exploratory borehole is often drilled first,and if water in sufficient quantity and quality is found, a full borehole is then con-structed. The process of obtaining a certificate to operate is lengthy, and only after-wards can the process of certification to natural mineral water status be commenced.

Steen: “chap02” — 2006/4/27 — 18:30 — page 24 — #9
24 CARBONATED SOFT DRINKS
Not to scale.Borehole often in excess of 100 m deep
Borehole pumped water level
Borehole rest water level
Submersible pump
Recommended 7–10 m sump below pump forsediment accumulation
Rising main
Dip tube
Soil, sand,gravel and clay
Rockhead
Top of pump
Electric cable for pump
Pump housefloor level
Pressure grouting
Borehole steel casing,slotted or perforatedat water levels
Figure 2.3 Typical borehole construction.
2.5 How to achieve the desired water quality
Whether the water comes from a borehole or from the town mains, it must complywith current national legislation as well as meet the company water standard. Thisgenerally implies some form of water treatment. In the simplest form of treatment,the water would just be passed through a sand filter to remove any particulates and acarbon filter to remove any organic material and possible taints and odours. Finally a
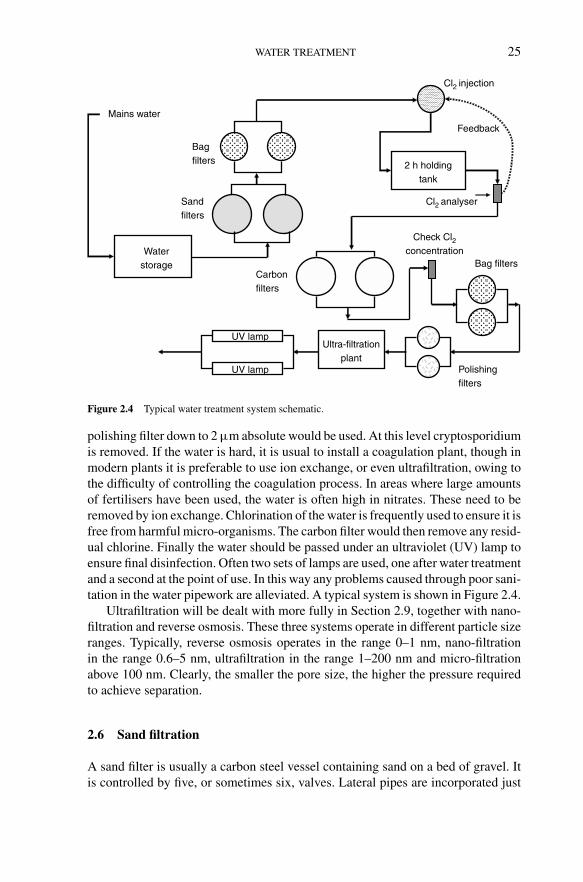
Steen: “chap02” — 2006/4/27 — 18:30 — page 25 — #10
WATER TREATMENT 25
Waterstorage
Mains water
UV lamp
Bag filters
Ultra-filtrationplant
2 h holdingtank
Cl2 injection
Carbonfilters
Feedback
Check Cl2concentration
Cl2 analyser
Bagfilters
UV lamp
Sandfilters
Polishingfilters
Figure 2.4 Typical water treatment system schematic.
polishing filter down to 2 µm absolute would be used. At this level cryptosporidiumis removed. If the water is hard, it is usual to install a coagulation plant, though inmodern plants it is preferable to use ion exchange, or even ultrafiltration, owing tothe difficulty of controlling the coagulation process. In areas where large amountsof fertilisers have been used, the water is often high in nitrates. These need to beremoved by ion exchange. Chlorination of the water is frequently used to ensure it isfree from harmful micro-organisms. The carbon filter would then remove any resid-ual chlorine. Finally the water should be passed under an ultraviolet (UV) lamp toensure final disinfection. Often two sets of lamps are used, one after water treatmentand a second at the point of use. In this way any problems caused through poor sani-tation in the water pipework are alleviated. A typical system is shown in Figure 2.4.
Ultrafiltration will be dealt with more fully in Section 2.9, together with nano-filtration and reverse osmosis. These three systems operate in different particle sizeranges. Typically, reverse osmosis operates in the range 0–1 nm, nano-filtrationin the range 0.6–5 nm, ultrafiltration in the range 1–200 nm and micro-filtrationabove 100 nm. Clearly, the smaller the pore size, the higher the pressure requiredto achieve separation.
2.6 Sand filtration
A sand filter is usually a carbon steel vessel containing sand on a bed of gravel. Itis controlled by five, or sometimes six, valves. Lateral pipes are incorporated just
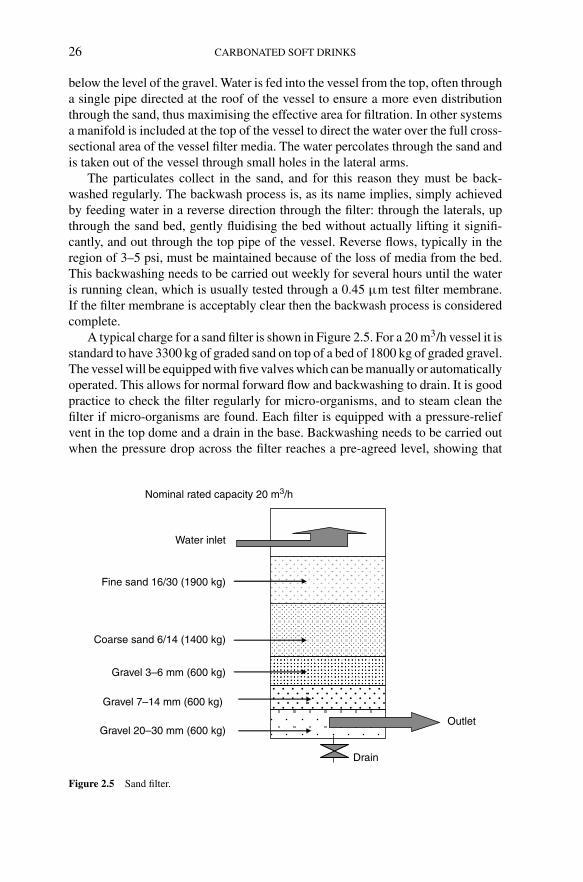
Steen: “chap02” — 2006/4/27 — 18:30 — page 26 — #11
26 CARBONATED SOFT DRINKS
below the level of the gravel. Water is fed into the vessel from the top, often througha single pipe directed at the roof of the vessel to ensure a more even distributionthrough the sand, thus maximising the effective area for filtration. In other systemsa manifold is included at the top of the vessel to direct the water over the full cross-sectional area of the vessel filter media. The water percolates through the sand andis taken out of the vessel through small holes in the lateral arms.
The particulates collect in the sand, and for this reason they must be back-washed regularly. The backwash process is, as its name implies, simply achievedby feeding water in a reverse direction through the filter: through the laterals, upthrough the sand bed, gently fluidising the bed without actually lifting it signifi-cantly, and out through the top pipe of the vessel. Reverse flows, typically in theregion of 3–5 psi, must be maintained because of the loss of media from the bed.This backwashing needs to be carried out weekly for several hours until the wateris running clean, which is usually tested through a 0.45 µm test filter membrane.If the filter membrane is acceptably clear then the backwash process is consideredcomplete.
A typical charge for a sand filter is shown in Figure 2.5. For a 20 m3/h vessel it isstandard to have 3300 kg of graded sand on top of a bed of 1800 kg of graded gravel.The vessel will be equipped with five valves which can be manually or automaticallyoperated. This allows for normal forward flow and backwashing to drain. It is goodpractice to check the filter regularly for micro-organisms, and to steam clean thefilter if micro-organisms are found. Each filter is equipped with a pressure-reliefvent in the top dome and a drain in the base. Backwashing needs to be carried outwhen the pressure drop across the filter reaches a pre-agreed level, showing that
Gravel 20–30 mm (600 kg)
Coarse sand 6/14 (1400 kg)
Fine sand 16/30 (1900 kg)
Nominal rated capacity 20 m3/h
Gravel 7–14 mm (600 kg)
Gravel 3–6 mm (600 kg)
Water inlet
Outlet
Drain
Figure 2.5 Sand filter.

Steen: “chap02” — 2006/4/27 — 18:30 — page 27 — #12
WATER TREATMENT 27
the media is blinding. Automatic valves can be actuated once this pressure dropoccurs. For this reason it is necessary to have several vessels in parallel, to allowfor backwashing while the other vessels are in use. It is good practice to use 316stainless steel pipes to ensure minimal contamination through the pipework. Thevalve matrix allows the pipework to be cleaned without affecting the filter vessel.
2.7 Coagulation
All water contains small particles in suspension. These are known as colloids andhave particle diameters <0.01 mm. They include fine silts, bacteria, viruses andcolour-causing particles. Owing to their fine nature they can stay in suspensionfor long periods. They carry the same charges, and repulsion prevents them fromcombining into larger particulates, which would then settle as a result of gravity.It is necessary to apply some chemical methods to help them settle. This processis known as coagulation. The best-known method is through the addition of anelectrolyte: charged particles combine with ions, neutralising the charges. Theseneutral particles combine to form larger particles which are very damaging to anyform of direct interception membrane because of their ability to block the porestructure.
The most common method employs aluminium sulphate, commonly called filteralum, which is added in a controlled amount to the incoming water. Ferric chlorideis also often used as an alternative coagulant. It is standard to use an in-line mixerto achieve uniform dispersion of the alum as quickly as possible, the amount ofalum added being controlled in relation to the water flow rate. The alum reactsquickly with the water’s alkalinity. This reaction produces a gelatinous precipitateof aluminium hydroxide that traps and absorbs impurities. As the alum has a posi-tive charge, this neutralises the negative charge normally associated with colloidalparticles, thus allowing them to come together. The initial floc formed is made upof very small particles.
The reaction of alum with alkalinity is given by the equation:
Al2(SO4)3 · 14H2O + 3Ca(HCO3)2 → 2Al(OH)3 + 3CaSO4 + 6CO2 + 14H2O
The higher the alkalinity of the raw water, the higher the chemical dose required.Care has to be taken over the amount of coagulant added as overdosing can causea complete charge reversal and restabilisation of the colloid complex, with a resul-tant increase in turbidity. The water moves from the in-line mixing chamber to aflocculation chamber that is gently stirred. This gentle mixing allows the maximumcontact of the floc particles, thereby promoting the formation of larger and heavierfloc. After some 30 min it is normal to be able actually to see these floc particles,which look like cotton wool tufts within the clear water. The clear water is allowedto flow over a weir, and the coagulant sinks to the bottom of the vessel. This sludgehas then to be removed from the tank. It is a problem actually to get rid of the sludge,and this must be considered when installing such plant. As this process reduces the

Steen: “chap02” — 2006/4/27 — 18:30 — page 28 — #13
28 CARBONATED SOFT DRINKS
Watercontainers
Mixers
rpm gauge Drivemotor
Figure 2.6 Coagulation jar tester.
turbidity of the water, it is usual to measure the turbidity level before and after theprocess, thereby ensuring process control at all times. At the end of the process,hydrating lime is added to the water to control the pH.
The amount of coagulant required for the process can be determined by a sim-ple beaker test using a laboratory stirrer which is usually set at 100 rpm initiallyfor 1 min and then reduced to approximately 30 rpm for a further 20 min. Theliquor is then allowed to settle for 45 min before a sample is taken and the tur-bidity is measured in NTU or FTU using a nephelometer. These tests mimic theactual process. Often six jars are set up and the tests are carried out with differentcoagulant additions to determine the optimum result. A typical tester is shown inFigure 2.6.
2.8 Alkalinity reduction
High alkalinity in the product affects the acidity and hence the taste of the soft drink.When dissolved in water, alkalis create a bitter taste. It is necessary to control this to<100 mg/l as calcium carbonate. Alkalinity is often connected to water hardness,hardness being primarily due to calcium and magnesium ions. Alkalinity and pH,though related, should not be used interchangeably. Some forms of alkalinity, suchas hydroxides and phosphates, contribute more to pH than others, such as carbonatesand silicates. Reduction of alkalinity by ion exchange is the most common routetaken. Table 2.4 lists the various systems available. As the chloride anion exchanger,which uses brine as the regenerator, means that no de-carbonator or acid is required,this makes it attractive to many users. The sodium cycle exchange softener uses astrong base anion resin to exchange the alkalinity and sulphates in the effluent forchloride as:
ZCl + NaHCO3 and/or Na2SO4 → NaCl and/or 2NaCl

Steen: “chap02” — 2006/4/27 — 18:30 — page 29 — #14
WATER TREATMENT 29
Table 2.4 Various alkalinity reduction systems.
Process Acid required Raw water solids De-carbonatorreduced required
Chloride-cycle anion exchanger No No NoSplit-stream hydrogen cycle Yes Yes Yes
exchange and raw waterSplit-stream sodium and hydrogen Yes Yes Yes
cycle exchangersSodium-cycle exchanger with Yes No Yes
acid post-mixMixed-bed or mono-bed hydrogen- Yes Yes Yes
sodium-cycle exchangerHydrogen-cycle exchanger Yes Yes Yes
(strong and weak acid)
Chlorides in the softener pass through the de-alkaliser unchanged. A reduced effi-ciency comes about owing to the necessary exchange of sulphates for chlorides andalkalinity leakage. With brine-only regeneration the effluent pH will be in the range5.5–7.5 and the alkalinity will be 5–15% of the incoming raw water alkalinity.
The coagulation process discussed in Section 2.7 often uses hydrating lime,Ca(OH)2, to bring the pH to the required level. The carbonate hardness is precipi-tated as a sludge. In an upward flow system the clarified water flows up and over aweir and the settled particulates are removed by pumping or filtration.
2.9 Membrane filtration
The concept of reverse osmosis was developed in the late 1950s by the US gov-ernment as a method of de-salinating sea water. Such systems are now popular asthe price and operating costs have made them more attractive. The operating prin-ciple of the system is shown in Figure 2.7. The flow containing the componentsretained by the filter is called the retentate flow; the components passing throughthe membrane form the permeate flow. Transport through the membrane is achievedby pressure, concentration, chemical or electrical potential difference. The mem-brane is a semi-permeable barrier through which some particles are transportedfaster than others, thereby causing separation. Three basic systems exist: reverseosmosis, nano-filtration and ultra-filtration. As noted in Section 2.5, these differprimarily in the size of the particles they separate. Ultra-filtration requires muchlower pressures, of the order of 0.5–10 bar, than nano-filtration, which requires5–20 bar, and reverse osmosis, which requires 8–100 bar. Figure 2.8 illustrates theparticle sizes removed by various filtration systems.
Ultra-filtration removes organics over 1000 molecular weight while passing ionsand smaller organics. It can successfully be used instead of the coagulation processto remove colloidal particles. The raw water is fed through the semi-permeable

Steen: “chap02” — 2006/4/27 — 18:30 — page 30 — #15
30 CARBONATED SOFT DRINKS
Permeate
Permeate
Feed
Retentate
Figure 2.7 Membrane filtration principle (courtesy of Keith Milner).
Viruses
Atmospheric dust
Reverse osmosis
Nano-filtration
Ultra-filtration
Micro-filtration
Particle filtration
0.0001 0.001 0.01 0.1 1.0 10.0 100.0µm
Milled flour
Asbestos
Atomicradii
Sugarmolecule
Metal ion
Aqueous salt Carbon black
Bacteria
Spray driedmilk
Tobacco smoke Coal dust
Cement dustSyntheticdye
PollenInsecticidedusts
Metallurgical dustand fumes
Colloidalsilica
Humanhair
Ground talc
Figure 2.8 Particle size removal by filtration.

Steen: “chap02” — 2006/4/27 — 18:30 — page 31 — #16
WATER TREATMENT 31
membrane. Excess water is used to wash the colloids off the membrane surface tothe drain. Unlike in most filtration processes, the membrane, which can be thoughtof as a sieve, does not bind with trapped material, as the colloids are too large tofit into the opening of the sieve. Because the plant is expensive, it is importantto pre-filter so as not to overload the system. Also because of the cost factor it isnormal to operate such systems on a constant-flow basis to a storage tank, thusalleviating the problem of peak flow demand. A sand filter is recommended as theinitial filter to remove the large particulates, followed by a 5 µm absolute cartridgefilter.
A nano-filtration system is a lower power version of reverse osmosis. It is wellsuited to the treatment of well waters. It is used when the high salt rejection ofreverse osmosis is not necessary. It is, however, capable of removing hardnesselements such as calcium and magnesium. In addition, it can remove bacteria,viruses, undesirable hydrocarbons and trihalomethanes (THMs), pesticides andother organic contaminants. It is an attractive alternative to lime or salt softeningtechnologies. As it operates at a lower pressure than reverse osmosis, the operatingcosts are less than those of a comparable reverse osmosis system.
Reverse osmosis removes virtually everything that is presented to it. As itsname implies, it works on the principle of osmosis, which is the physical move-ment of a solvent through a semi-permeable membrane based on a differencein chemical potential between two solutions separated by that semi-permeablemembrane. Although reverse osmosis was initially used for most membranefiltration applications, the other, cheaper systems are currently finding more favour.The choice really depends on the final water quality that is required.
Reverse osmosis is really osmosis in reverse. If we had a tank divided into twoparts by a semi-permeable membrane and salt were added to one side of this tank,then the osmotic pressure would drive the water from one side to dilute the saltsolution on the other side. Eventually, the situation would reach equilibrium, whenthe two chemical potentials and the hydraulic pressure resulting from the headdifference between the two sides equated. This allows a method for measuringosmotic pressure in a given situation.
To reverse this process it is necessary to overcome the osmotic pressure equi-librium across the membrane, as the flow is naturally from dilute to concentrate.This is achieved by increasing the pressure on the raw side of the membrane andforcing the water across. As we force the water through the membrane, so thesalt concentration increases, requiring even greater pressure to obtain high-qualitywater. In all systems the membranes are spiral wound to maximise the surface areaavailable for membrane filtration. They are mounted in high-pressure containers.Usually the membrane stack is two long semi-permeable membranes with a spacermesh between them that is sealed along the two sides. This is then wound into aspiral tube with another spacer to separate the outside of the stack. Between eachmembrane layer is a mesh separator that allows the permeate to flow. Water isforced in at one end of the spiral cylinder and out the other. Backpressure forcesthe water through the membrane, where it collects in the intervening space. Thepermeate then flows around the spiral and is collected in the centre tube. In an

Steen: “chap02” — 2006/4/27 — 18:30 — page 32 — #17
32 CARBONATED SOFT DRINKS
industrial system banks of these membranes are used based on the flow volumerequired.
Pre-treatment is always recommended for reverse osmosis. The incoming rawwater must have a low turbidity to stop the membranes from blinding. As waterpasses through the membrane, the ionic content of the reject stream increases.This increase in total dissolved solids (TDS) can result in calcium and magne-sium precipitating out in the system and plugging the membranes. Calcium andmagnesium can be removed prior to the reverse osmosis treatment, or a chem-ical can be added to the feed water to keep them in solution. Chlorine needsto be removed before using thin-film membranes. This is achieved using car-bon filtration prior to water entering the reverse osmosis system. In a typicalsystem the raw water is filtered and softened to remove hardness and carbonis used to remove the chlorination (membranes are sensitive to oxidisers). Analternative is to dose the system with chemicals to remove the chlorine andhold the hardness ions in solution. A typical installation is shown schematically inFigure 2.9.
After the carbon filter, the water is passed through the membranes, where theconcentrate is recycled back to the front of the system for another pass and a bleedis taken off this line to drain. This recycling allows very high system efficiencies.The permeate line has a TDS level of approximately 4% or less of that of theincoming water depending on the membrane. The pressure required depends onthe concentration of the salt solution of the retentate. For example, a system oper-ating at 1100 ppm on the concentrate side will require some 14 bar pressure tooperate.
High-pressurepump
Recycleflow
First stage
Second stage
DrainFilteredwater
Recycle flow
Figure 2.9 Typical membrane filtration system illustrating recycle flow.

Steen: “chap02” — 2006/4/27 — 18:30 — page 33 — #18
WATER TREATMENT 33
The purity of the permeate is determined by the reject ratio of the membrane(92–99.5%) and also by the type of salts in solution. Membranes are very goodat rejecting high molecular weight compounds and multivalent ions. Monovalentions such as sodium and chlorine are not rejected as well and are called the leakageions. The amount of leakage is determined by the reject ratio. A 95% reject ratiomeans that 5% of the salt concentration leaks through. On this basis, a 200 ppminput stream would result in a 10 ppm output stream. A membrane rated at 99%would result in a 2 ppm output stream. The reject ratio changes over the life ofthe membrane, and leakage increases. Each time a membrane is cleaned it willslightly change its properties, so that after many years the ratio may drop to 90%or less.
Cleaning is fairly simple. A volume of water with a cleaning agent (for hardnessor organic plugging) is recirculated on the high-pressure side of the system for about1 h. The membrane is then flushed to drain and returned to service. If properly setup with effective pre-treatment, a system usually has a 1 h cleaning cycle once permonth or even less frequently when softening is used as a pre-treatment. Reverseosmosis systems are sterilised periodically during cleaning. The water stored froma reverse osmosis system is optionally passed through a UV sterilisation system,which kills any bacteria in the system.
A softener needs to be checked daily for salt level. Pre-filters need a weeklycheck. Usually filters are alarmed according to flow rate, so constant monitoringis not necessary. The operating cost depends on three variables: power, chemistry(pre-treatment and pH adjustment) and labour. The power requirement is about7.5 kW for 7 m3/h. This is constant while the system is running. Labour costs areusually very low due to the automated nature of the systems. If the proper pre-treatment is used, little or no maintenance is required between cleanings exceptfor chemical maintenance for the pH adjustment system and softener or polymersystem. The amount of water rejected will vary with the configuration of the sys-tem. Up to six membranes can be connected in series and the theoretical capturerate is approximately 84% (rejecting 16%). By using oversized systems and redi-recting the reject to the front of a multiple-pass system, recovery levels can beachieved of approximately 92% (half of the reject to drain, half to the systemfeed tank). This also requires oversizing the pumps and system to get the requiredflow rate.
Two types of membrane materials are in widespread use: thin film (TF) andcellulose triacetate (CTA). The TF membrane is chlorine sensitive and requirescarbon pre-treatment to remove the chlorine, whereas the CTA membrane is not.TF membranes have a slightly higher reject ratio and operate over a wider pH rangethan CTA membranes.
Reverse osmosis is sometimes used to reduce the biochemical oxidationdemand, which is high when washing down plant owing to the high sugar con-tent. A typical soft drinks factory will have a BOD of the order of 1–2◦ Brix, whichis equivalent to a BOD of some 7000–14,000 mg/l. A membrane system operatingat 75% water removal will concentrate the sugar solution to an economic level asthe relationship between water removal and sugar concentration is exponential.

Steen: “chap02” — 2006/4/27 — 18:30 — page 34 — #19
34 CARBONATED SOFT DRINKS
2.10 Chlorination and carbon filtration
To prevent bacterial growth, most systems include chlorination. The mains waterfeed will already have been chlorinated to prevent micro-organism growth throughthe system. A certain amount of residual chlorine is left in the water to overcome anyproblems through the pipework system to the customer. If chlorination is included inthe factory water treatment system, as required by many major brands, this usuallyrequires an extended contact time to give the chlorine time to effectively kill anybacteria present. Factories often use 8 ppm for 2 h contact time with a requirementthat total coliform bacteria and faecal coliform (or Escherichia coli) are both totallyabsent (0 cfu per 100 ml). This requires a water storage tank large enough to take thepeak demand flow for the required contact time. Careful dosing of chlorine througha metering system in relation to the water flow rate is required. The outfeed wateralso has to be monitored to ensure that the concentration levels set in the standardhave been achieved. If not, a feedback control system must be incorporated toalter the dosing level to bring the situation back under control. Sometimes chlorinedioxide is used as an alternative to gaseous chlorine. There are some advantages tousing chlorine dioxide over chlorine gas, as it is simpler to use and the dosage ismore readily controlled.
After chlorination it is necessary to remove the chlorine using carbon filters.These vessels are very similar in construction to sand filters. They use activatedcarbon, preferably acid cleaned. The activated carbon is specially prepared for thispurpose by specialist chemical suppliers. It has been claimed that the Romans usedcharcoal to purify water and beer. Activated carbon is produced by the controlledburning up to 1000◦C of carbon-rich materials such as coal, wood and nut shells.This is then steam or chemically activated to develop the internal pore structure. Atypical activated carbon has an internal surface area of the order of 1200 m2/g. Thislarge surface area is what makes activated carbon such an effective absorbent. Sev-eral activated carbon suppliers claim that coconut-shell-based carbons have severaladvantages over carbons made from other materials in that they have a high densityand high purity and are virtually dust-free, since they are harder and more resistant toattrition. Also, the pore structure is very uniform, with the majority of pores falling inthe micropore range (5–10 Å), which is particularly effective for water purificationapplications.
The structure of a carbon filter is shown in Figure 2.10. For a 20 m3/h vesselit is normal to use some 1500 kg of carbon on top of a bed comprising 500 kg of1–2 mm sand, 600 kg of 3–6 mm gravel and 600 kg of 7–14 mm coarser gravel.Often the sand is left out, as it tends to get mixed in with the carbon and affect theperformance of the system. Like sand filters, carbon filters need to be backwashedregularly. This needs to be done carefully to minimise damage to the activatedcarbon. It is always a good precaution to use a bag filter after the carbon filter tocatch any carry-over of carbon that may occur, which usually happens just aftera backwash. Once a month the filters should be steam-cleaned. This will ensurethat any micro-organisms that may be in the carbon bed are effectively killed, as

Steen: “chap02” — 2006/4/27 — 18:30 — page 35 — #20
WATER TREATMENT 35
Gravel 7–14 mm (600 kg)
Gravel 3–6 mm (600 kg)
Sand 1–2 mm (500 kg)
Acid-cleaned coconutcarbon (1500 kg)
Nominal rated capacity 20 cu.m./hOften the sand is left out
Water inlet
Outlet
Normal useBackwashing and steaming
(when steaming control to 95°Cin the headspace for 20 min)
To drain
Infeed
Steam
Figure 2.10 Carbon filter.
well as re-activating to some lesser degree the carbon itself. It is usual to replacethe carbon bed every few years.
2.11 Iron removal
Iron in sufficient quantity tends to discolour water. Iron is not hazardous to health;in fact it is essential as it transports oxygen in the blood. It is kept at 0.3 ppm orbelow for taste and appearance purposes as above this level it tends to taint thewater red, brown or yellow. A UV lamp that has not been cleaned recently used ina high-iron-content water will be significantly stained by iron contamination.
Iron comes in two forms: soluble and insoluble. The insoluble form appears rustyor yellow. It can cause serious appearance and taste problems. Iron bacteria actuallyconsume iron and leave a yellow or reddish brown slime that can clog systems.Soluble iron is the more common form. It appears as reddish-brown particulates ifwater is left to stand in a glass for a few minutes.
Once the form of iron that needs to be removed has been determined, severalprocess options are available. There is no single treatment for all types of ironproblem. Chemical analysis of the water will tell you what type of problem youhave. Soluble iron can be converted to its insoluble form by aeration. Clearly this isa process that is not popular in the carbonated soft drinks business, which wants toeliminate air wherever possible. Filtration media will trap and screen out oxidisediron particulates. This generally requires backwashing to remove the iron fromthe filter. Soluble iron can also be removed by ion exchange. A suitable materialis manganese green sand, which adsorbs dissolved iron. Chemical regenerationis needed. Aerating water with ozone can also convert soluble to insoluble iron.
Steen: “chap02” — 2006/4/27 — 18:30 — page 36 — #21
36 CARBONATED SOFT DRINKS
Chlorination is used to convert soluble to insoluble, filterable iron by sequestration.A catalytic filter medium can be used that enhances the reaction between oxygenand iron and subsequently filters out the insoluble iron.
2.12 Nitrate removal
Nitrate is expressed in reports as either nitrate-N (nitrate as nitrogen) or nitrate asnitrate. The maximum contaminant level (MCL) for nitrate in the USA is 10 ppm(also measured as mg/l). To express nitrate as nitrate, multiply the nitrogen-N figureby 4.43. The MCL for nitrate as nitrate is then 44.3 ppm. The WHO has establisheda guideline of 50 ppm, whereas the EC has a maximum allowable limit of 50 ppmand a guideline of 25 ppm.
Nitrates, measured as nitrate, can cause corrosion above the 20 mg/l level and forbottled products can cause organic pollution above the 50 mg/l level. Infants belowthe age of 6 months who drink water containing nitrates as nitrogen in excess of10 mg/l can become seriously ill and, if untreated, die. Symptoms include shortnessof breath and blue-baby syndrome. The higher pH of infants’ upper respiratorytract accelerates the conversion of nitrates to nitrites. The nitrite in turn oxidises theinfants’ haemoglobin to methaemoglobin, which is unable to carry oxygen in thebloodstream. High nitrate levels are usually caused by run-off from fertiliser use,leaching from septic tanks, sewage and erosion of natural deposits. The salts irritatethe mucous membranes. The cancer-causing effects of nitrates have not been fullyresearched. However, nitrosamines and nitrosamides, nitrate reaction products, arefelt to be potential human carcinogens.
Nitrites, also measured as nitrogen, are caused by the same factors as nitratesand give rise to the same problems. They can cause methaemoglobinaemia (blue-baby syndrome) and they have a direct-acting toxic effect on the nervous systemand blood vessels. It is interesting to note that nitrates are converted into nitrites inthe gastrointestinal tract, whereas nitrites are converted to nitrates in the blood.
Nitrates are highly soluble in water and for this reason can soak into the groundeasily. Often nitrate levels fluctuate seasonally, seemingly based on rainfall. Shallowwells are more quickly and adversely affected than deep, well-constructed ones.If your area or well is prone to nitrate contamination, regular water analysis isrecommended.
Nitrate removal systems include ion exchange, reverse osmosis, distillation, bio-de-nitrification and electro-dialysis. The most commonly used treatment approachis ion exchange, the same technology water softeners employ. With this type ofsystem, chlorides are exchanged for the nitrate, and the high-nitrate waste is flushedinto a holding tank or drain. Depending on the application, it is often more desirableto drill a deeper well or tie in to an alternative water source than to treat the waterfor nitrate because of the high levels of brine discharge from such systems.
Biological de-nitrification is a respiration process whereby bacteria break apartthe nitrate (NO3) molecule. The primary by-products of this respiration are harm-less nitrogen gas (N2) and carbon dioxide (CO2). Water enters a series of reactor

Steen: “chap02” — 2006/4/27 — 18:30 — page 37 — #22
WATER TREATMENT 37
towers which contain naturally occurring, non-pathogenic bacteria. These bacte-ria are stimulated by the automatic addition of a small amount of organic carbon(acetic acid), which the bacteria use to break down the nitrate molecule. The gasesproduced are vented harmlessly into the air.
Electrodialysis was introduced commercially in the early 1960s, about 10 yearsbefore reverse osmosis. The development provided a cost-effective way to de-salt brackish water and spurred considerable interest in this area. It depends onthe following general principles: most salts dissolved in water are ionic, beingpositively (cationic) or negatively (anionic) charged. These ions are attracted toelectrodes with the opposite electric charge. Membranes can be constructed to per-mit selective passage of either anions or cations. The dissolved ionic constituentsin a saline solution, such as Na+, Ca2+ and CO2−
3 , are dispersed in water, effec-tively neutralising their individual charges. When electrodes connected to an outsidesource of direct current, such as a battery, are placed in a container of saline water,electrical current is carried through the solution, with the ions tending to migrateto the electrode with the opposite charge.
To desalinate water, membranes that will allow either cations or anions (but notboth) to pass are placed between a pair of electrodes. These membranes are arrangedalternately, with an anion-selective membrane followed by a cation-selective mem-brane. A spacer sheet that permits water to flow along the face of the membraneis placed between each pair of membranes. One spacer provides a channel thatcarries feed (and product) water and the next carries brine. As the electrodes arecharged and saline feed water flows along the product water spacer at right anglesto the electrodes, the anions in the water are attracted and diverted towards thepositive electrode. This reduces the salt concentration of the water in the productwater channel. The anions pass through the anion-selective membrane but can passno further than the cation-selective membrane, which blocks their path and trapsthe anions in the brine. Similarly, under the influence of the negative electrodecations move in the opposite direction through the cation-selective membrane tothe concentrate channel on the other side. Here, the cations are trapped becausethe next membrane is anion selective and prevents further movement towards theelectrode. Using this arrangement, concentrated and diluted solutions are createdin the spaces between the alternating membranes. These spaces, bounded by twomembranes (one anionic and the other cationic), are called cells. A cell pair con-sists of two cells, one from which the ions migrated (the dilute cell for the productwater) and the other, in which the ions concentrate (the concentrate cell for thebrine stream).
A basic electrodialysis unit consists of several hundred cell pairs bound togetherwith electrodes on the outside and is referred to as a membrane stack. Feedwater passes simultaneously in parallel paths through all of the cells to providea continuous flow of desalted water and brine from the stack. Depending onthe design of the system, chemicals may be added to the streams in the stackto reduce the potential for scaling. Recent advances in membrane technologyand the development of electrodialysis reversal make this a direct competitorto reverse osmosis. These advances have reduced the cost of membranes and
Steen: “chap02” — 2006/4/27 — 18:30 — page 38 — #23
38 CARBONATED SOFT DRINKS
have lowered membrane resistivity to create membranes that are more nitrateselective.
As for reverse osmosis, the raw feed water must be pre-treated to prevent mate-rials that could harm the membranes or clog the narrow channels in the cells fromentering the membrane stack. The feed water is circulated through the stack usinga low-pressure pump with enough power to overcome the resistance of the wateras it passes through the narrow passages.
2.13 Polishing filters
In general, a sand filter followed by a carbon filter removes the trace chemi-cals found in most surface waters. Filtration is then used to polish the water tothe required standard. As with most processes, the quality standard keeps beingimproved, mainly as a result of consumer demands and the changing needs ofindustry.
Over the past few years the need has emerged to provide certified media withthe ability to remove the cryptosporidium organism. Pall Filtration has been at theforefront of this media development. It has produced high surface area membraneswhich have the ability to withstand high flow rates, but it is only just able to validatecartridges for this application. The use of low/medium-UV treatment has a placein the changing water demands as it has been well demonstrated that this processeliminates the cryptosporidium oocyst. The use of reverse osmosis water is now analternative, but it is still a very expensive way to meet the soft drinks companies’requirements.
To polish the water following sand and carbon filtration, it is standard to usepolypropylene depth filters initially. These are often followed by finer filters witha pleated high surface area construction, often made of glass fibre. These impart apositive zeta potential to enhance particle removal. Final filters are used to controlthe microbial content of the water. These can go as low as 0.45 µm absolute.However, the cost of running such filters is high. A 2 µm absolute filter has beenclaimed to remove both the cryptosporidium oocyst and Giardia lamblia, whichtogether are present in over 67% of all surface water and in the USA have beendetected in 39% of drinking water supplies (Clancy et al., 1998). Filters down to1 µm absolute have been developed specifically for the purpose of removing thesetwo oocysts.
Filter bags are being increasingly used as an alternative to cartridge filters.Bag filters have come a long way since they were invented. Initially they wereconsidered as good coarse filters to remove particles in the visible clarity range of40 µm. In the past 15 years, bag filter technology has improved along with improvedmanufacturing techniques from sewing to welding and media technologies fromneedle felt to melt-blown materials. Efficiencies of 99.9% and above at 1 µmabsolute are clearly achievable using filter bags.
GAF Filter Systems Ltd. has played a major role in bringing this innovation tothe marketplace. It led the way with all-welded felt bags in the late 1980s; it then

Steen: “chap02” — 2006/4/27 — 18:30 — page 39 — #24
WATER TREATMENT 39
invented a ‘pressure-reactive’ sealing ring (Sentinel) which eliminated the bypassaround the top of the filter bag. These two developments significantly improved theefficiency of the filter bag as we understood it.
This was followed by the move to melt-blown media. GAF again led the waywith its ABP range of filter bags, rated 99% efficient. It revised the design with somefurther improvements in the welding technology and re-named these AGF bags. In1997 GAF developed an absolute filter bag (PROGAF); this was the first bag onthe market to offer all of the efficiencies of an absolute cartridge, with additionalpre-filters incorporated in to the upstream layers of the same element. This meantthat several stages of cartridges could be replaced with one stage of filter bags. Themajor advantage was the reduction in operating costs and operator time during filterchange-outs.
In several successful applications the introduction of filter bags has reduced theoperating cost below that of the traditional cartridges. This has afforded the changesin bag technology a very central role in helping to provide the technology changeswe have seen in the marketplace. As an example consider flow rates of 80 m3/h oftown mains water being processed through a traditional sand filter followed directlyby a carbon filter. Trials have been carried out using established cartridge filtersin high surface area configuration with differing pore grade structures, startingwith 20 µm, followed by 6 µm and then by 2 µm. All the cartridges tested had atightness rated (Tr) value of 99.98%; in other words, they were wound very tightly.This system was used in conjunction with new UV tubes capable of offering analternative way to ‘sterilise’ the water.
The problems seen were the differing qualities of town potable water beingprovided by the local utility services; although they complied with EU stan-dards, not all had the same filterability. The measure of this is the silt densityindex (SDI). This index quantifies the amount of particulate contamination in awater source. SDI is widely accepted for estimating the rate at which colloidaland particulate fouling will occur in water purification systems. As the qualityof water sources often changes, this test needs to be performed weekly. ASTMD-4189-95 defines this test. The 0.45 µm filter was chosen because it is morelikely to clog from colloidal matter than from hard particles such as sand orscale. SDI is based on the decay in flow rate during a 15 min period across anew 0.45 µm filter installed in a built-in holding fixture. Flow rate measurementaccuracy is ensured by automatically maintaining a constant 30 psi (2.07 bar)across the membrane. Samples of 500 ml are taken at the start of the test andafter 15 min. The time to take each of these samples is measured. SDI is thendefined as:
SDI = (1 − (ti/tf)) × 100
15,
where ti is the original time and tf is the final time to collect a 500 ml sample.SDI tests were carried out at different stages of the filtration system; this allowed
the monitoring of how the medium was performing. In this particular study, the
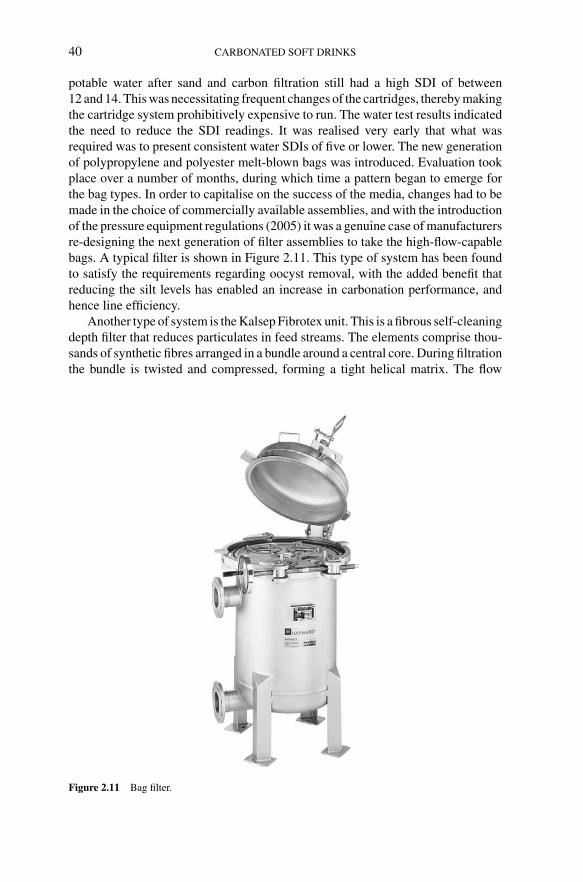
Steen: “chap02” — 2006/4/27 — 18:30 — page 40 — #25
40 CARBONATED SOFT DRINKS
potable water after sand and carbon filtration still had a high SDI of between12 and 14. This was necessitating frequent changes of the cartridges, thereby makingthe cartridge system prohibitively expensive to run. The water test results indicatedthe need to reduce the SDI readings. It was realised very early that what wasrequired was to present consistent water SDIs of five or lower. The new generationof polypropylene and polyester melt-blown bags was introduced. Evaluation tookplace over a number of months, during which time a pattern began to emerge forthe bag types. In order to capitalise on the success of the media, changes had to bemade in the choice of commercially available assemblies, and with the introductionof the pressure equipment regulations (2005) it was a genuine case of manufacturersre-designing the next generation of filter assemblies to take the high-flow-capablebags. A typical filter is shown in Figure 2.11. This type of system has been foundto satisfy the requirements regarding oocyst removal, with the added benefit thatreducing the silt levels has enabled an increase in carbonation performance, andhence line efficiency.
Another type of system is the Kalsep Fibrotex unit. This is a fibrous self-cleaningdepth filter that reduces particulates in feed streams. The elements comprise thou-sands of synthetic fibres arranged in a bundle around a central core. During filtrationthe bundle is twisted and compressed, forming a tight helical matrix. The flow
Figure 2.11 Bag filter.

Steen: “chap02” — 2006/4/27 — 18:30 — page 41 — #26
WATER TREATMENT 41
passes radially from the outside to the inside of the element. Particles are caught upin the fibrous matrix. Automatic backwashing untwists and stretches these fibreswhen a small backwash flow is in operation. Such units are claimed to be suitablefor reverse osmosis pre-filtration. Banks of these bundles are used to provide thenecessary filtration.
2.14 Ultraviolet systems
Strong sunlight disinfects water by permanently de-activating bacteria, spores,moulds and viruses. Scientists a century ago identified the part of the electromag-netic spectrum responsible for this well-known effect, defining the wavelengthsas between 200 and 300 nm, often called UV-C. Ultraviolet sterilisation worksby dissociating the DNA structure of living cells, thus preventing their multi-plication. A UV disinfection unit comprises an enclosed chamber with an innersleeve of high-purity quartz which contains one or more shortwave ultravio-let lamps. Water passes through the chamber and is subjected to the UV-Cwhich shines through the quartz sleeve. As the genetic structure of bacteria orviruses in the water is exposed to the UV-C it will be destroyed. As UV-C can-not pass through particulates, it is important to pre-filter to as low a level asis commercially viable to enable the UV system to work optimally. UV hasbeen shown by Clancy et al. (1998) to kill protozoan (such as cryptosporidium)oocysts.
UV can operate at various pressures. Low-pressure lamps are the oldest source ofUV light and the most common type of lamp, being efficient at converting electricalenergy into disinfection wavelengths as the output is centred around 253.7 nm,which the manufacturers of these systems state to be the optimal wavelength fordisinfection. They also offer the longest lamp life (stated as a minimum of 8000 h).These lamps operate at lower temperatures than other UV lamps and they do notaccelerate internal fouling of optical surfaces. The spectral output is monochro-matic. One of the problems with this type of lamp is the time needed to fire up,which can be of the order of several minutes. Hence care has to be taken to usedelay switches in any system using low-pressure UV systems, such that the processcan operate only when the light is actually on.
Medium-pressure systems tend to use a wavelength of 265 nm, though recentresearch in the USA has shown that 271 and 261 nm wavelength light are the mosteffective for the deactivation of particular target organisms. These lamp types arepolychromatic, with a continuous output from 200 to 300 nm. Typically, the lampsurface will reach 800◦C, which is why a protective sleeve is incorporated into suchsystems. Should the water flow stop for any reason it is necessary to power the lampdown to prevent over-temperature problems.
All these lamps come in a variety of sizes, and many are multi-tubed. In generalthe medium-pressure systems are smaller than their low-pressure equivalents. Allsystems need to have wipers fitted to the tube where the iron and manganese levelsare high, as the iron and manganese tend to bake on to the surface of the tube.

Steen: “chap02” — 2006/4/27 — 18:30 — page 42 — #27
42 CARBONATED SOFT DRINKS
2.15 Ozone technology
Ozone is a gas comprising three oxygen atoms. It can be created naturally, as in alightning strike, or synthetically using an ozone generator. Ozone is the result ofa high electric current being passed through oxygen (O2) molecules. Introducinghigh levels of electricity into oxygen breaks the molecular bond of the O2, creatingtwo single oxygen atoms. These single oxygen atoms then adhere to remaining O2,creating ozone (O3).
It is this third atom being only loosely bonded that makes ozone such a powerfulcleaning agent. With an oxidising power 3000 times greater than that of bleach,ozone is the second most powerful oxidant in existence. When ozone gas is intro-duced into an environment with bacteria, mould or any other organic material, itreadily donates one of the oxygen atoms in its chemical make-up to destroy thatmaterial. Ozone can also destroy some inorganic materials, such as calcium andarsenic, and a number of trace metals, such as iron. Once the third oxygen atomhas been donated to oxidise the organic component, there are only oxygen (O2)molecules left. This is one reason ozone is a preferred oxidant, as opposed to vari-ous chemicals, because it does not leave any type of chemical residue on materials,only pure oxygen.
An ozone generator is utilised to create ozone by using either ambient air or anoxygen concentrator, which is usually incorporated into the generator, and a seriesof plates that produce high electric charges. By using an oxygen concentrator insteadof ambient air, the generator can produce higher concentrations of ozone with lowerquantities of power, resulting in a reduction in the size of generator needed for a par-ticular application, thereby lowering equipment and operating costs. The generatortakes the ambient air or oxygen and passes it across the series of high-electric-current plates. Ozone molecules are formed through the separation and recombina-tion of oxygen atoms, and the resultant ozone gas is discharged through an exit port.
The concentration of ozone in water is usually measured in one of two ways:with an oxidation reduction potential metre or with a direct-read measurement inppm. The former method utilises a scale of measuring the free available electronsand it is difficult to take a true reading from. For this reason the direct-read methodis preferred. This measures the actual dissolved concentration of a gas, in this caseozone, in solution.
It is claimed that ozone is capable of the destruction of bacteria and viruses,the oxidation of iron and manganese, heavy metal precipitation, colour destruc-tion, taste improvement, algae and protozoa destruction, hardness reduction andhydrogen sulphide and mercaptans elimination. A UV lamp generates 0.1% ozoneby weight. UV and ozone react rather violently and in a sense destroy each other,which can result in this combination being used when neither works on its ownbut together they achieve the required result. If this is the case, the reaction takesplace in a few seconds. For water treatment it is usual to have 1–2 ppm ozone incontact for 5–10 min, depending on the water quality. After treatment the mini-mum requirement is to pass the water through a carbon filter to absorb the excess
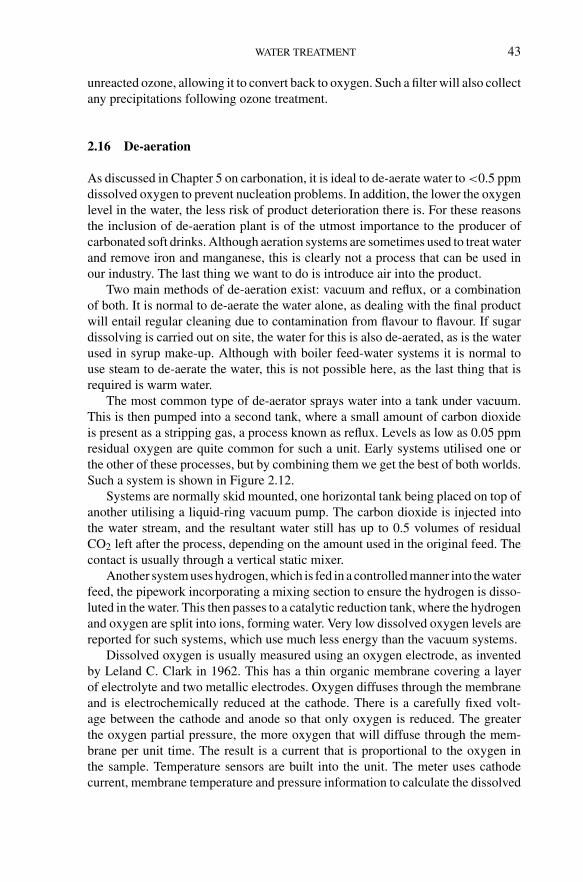
Steen: “chap02” — 2006/4/27 — 18:30 — page 43 — #28
WATER TREATMENT 43
unreacted ozone, allowing it to convert back to oxygen. Such a filter will also collectany precipitations following ozone treatment.
2.16 De-aeration
As discussed in Chapter 5 on carbonation, it is ideal to de-aerate water to <0.5 ppmdissolved oxygen to prevent nucleation problems. In addition, the lower the oxygenlevel in the water, the less risk of product deterioration there is. For these reasonsthe inclusion of de-aeration plant is of the utmost importance to the producer ofcarbonated soft drinks. Although aeration systems are sometimes used to treat waterand remove iron and manganese, this is clearly not a process that can be used inour industry. The last thing we want to do is introduce air into the product.
Two main methods of de-aeration exist: vacuum and reflux, or a combinationof both. It is normal to de-aerate the water alone, as dealing with the final productwill entail regular cleaning due to contamination from flavour to flavour. If sugardissolving is carried out on site, the water for this is also de-aerated, as is the waterused in syrup make-up. Although with boiler feed-water systems it is normal touse steam to de-aerate the water, this is not possible here, as the last thing that isrequired is warm water.
The most common type of de-aerator sprays water into a tank under vacuum.This is then pumped into a second tank, where a small amount of carbon dioxideis present as a stripping gas, a process known as reflux. Levels as low as 0.05 ppmresidual oxygen are quite common for such a unit. Early systems utilised one orthe other of these processes, but by combining them we get the best of both worlds.Such a system is shown in Figure 2.12.
Systems are normally skid mounted, one horizontal tank being placed on top ofanother utilising a liquid-ring vacuum pump. The carbon dioxide is injected intothe water stream, and the resultant water still has up to 0.5 volumes of residualCO2 left after the process, depending on the amount used in the original feed. Thecontact is usually through a vertical static mixer.
Another system uses hydrogen, which is fed in a controlled manner into the waterfeed, the pipework incorporating a mixing section to ensure the hydrogen is disso-luted in the water. This then passes to a catalytic reduction tank, where the hydrogenand oxygen are split into ions, forming water. Very low dissolved oxygen levels arereported for such systems, which use much less energy than the vacuum systems.
Dissolved oxygen is usually measured using an oxygen electrode, as inventedby Leland C. Clark in 1962. This has a thin organic membrane covering a layerof electrolyte and two metallic electrodes. Oxygen diffuses through the membraneand is electrochemically reduced at the cathode. There is a carefully fixed volt-age between the cathode and anode so that only oxygen is reduced. The greaterthe oxygen partial pressure, the more oxygen that will diffuse through the mem-brane per unit time. The result is a current that is proportional to the oxygen inthe sample. Temperature sensors are built into the unit. The meter uses cathodecurrent, membrane temperature and pressure information to calculate the dissolved
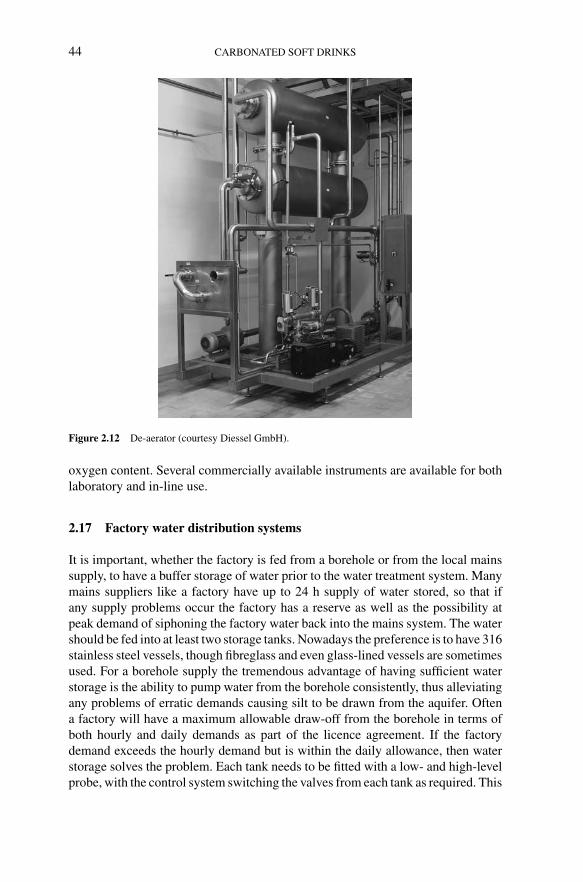
Steen: “chap02” — 2006/4/27 — 18:30 — page 44 — #29
44 CARBONATED SOFT DRINKS
Figure 2.12 De-aerator (courtesy Diessel GmbH).
oxygen content. Several commercially available instruments are available for bothlaboratory and in-line use.
2.17 Factory water distribution systems
It is important, whether the factory is fed from a borehole or from the local mainssupply, to have a buffer storage of water prior to the water treatment system. Manymains suppliers like a factory have up to 24 h supply of water stored, so that ifany supply problems occur the factory has a reserve as well as the possibility atpeak demand of siphoning the factory water back into the mains system. The watershould be fed into at least two storage tanks. Nowadays the preference is to have 316stainless steel vessels, though fibreglass and even glass-lined vessels are sometimesused. For a borehole supply the tremendous advantage of having sufficient waterstorage is the ability to pump water from the borehole consistently, thus alleviatingany problems of erratic demands causing silt to be drawn from the aquifer. Oftena factory will have a maximum allowable draw-off from the borehole in terms ofboth hourly and daily demands as part of the licence agreement. If the factorydemand exceeds the hourly demand but is within the daily allowance, then waterstorage solves the problem. Each tank needs to be fitted with a low- and high-levelprobe, with the control system switching the valves from each tank as required. This
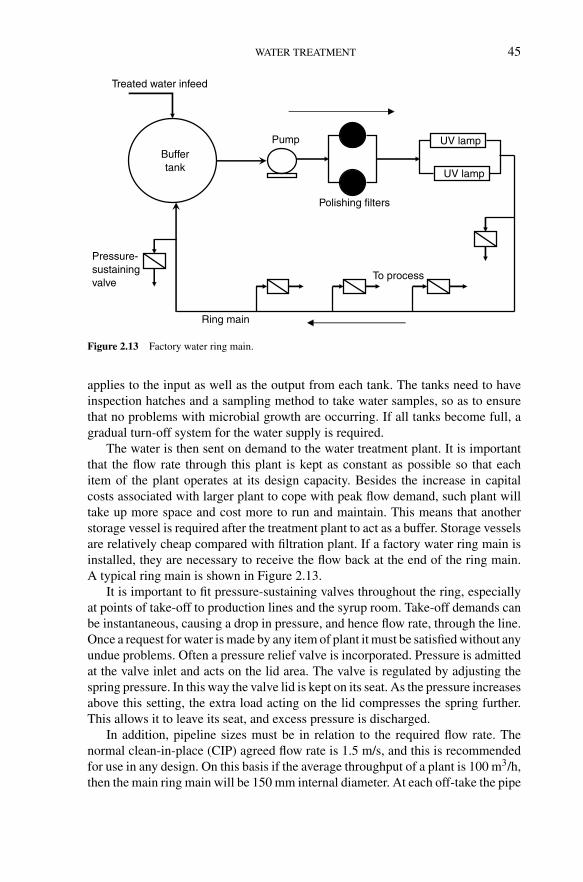
Steen: “chap02” — 2006/4/27 — 18:30 — page 45 — #30
WATER TREATMENT 45
Buffertank
Treated water infeed
UV lamp
UV lamp
Pressure-sustainingvalve
Pump
To process
Polishing filters
Ring main
Figure 2.13 Factory water ring main.
applies to the input as well as the output from each tank. The tanks need to haveinspection hatches and a sampling method to take water samples, so as to ensurethat no problems with microbial growth are occurring. If all tanks become full, agradual turn-off system for the water supply is required.
The water is then sent on demand to the water treatment plant. It is importantthat the flow rate through this plant is kept as constant as possible so that eachitem of the plant operates at its design capacity. Besides the increase in capitalcosts associated with larger plant to cope with peak flow demand, such plant willtake up more space and cost more to run and maintain. This means that anotherstorage vessel is required after the treatment plant to act as a buffer. Storage vesselsare relatively cheap compared with filtration plant. If a factory water ring main isinstalled, they are necessary to receive the flow back at the end of the ring main.A typical ring main is shown in Figure 2.13.
It is important to fit pressure-sustaining valves throughout the ring, especiallyat points of take-off to production lines and the syrup room. Take-off demands canbe instantaneous, causing a drop in pressure, and hence flow rate, through the line.Once a request for water is made by any item of plant it must be satisfied without anyundue problems. Often a pressure relief valve is incorporated. Pressure is admittedat the valve inlet and acts on the lid area. The valve is regulated by adjusting thespring pressure. In this way the valve lid is kept on its seat. As the pressure increasesabove this setting, the extra load acting on the lid compresses the spring further.This allows it to leave its seat, and excess pressure is discharged.
In addition, pipeline sizes must be in relation to the required flow rate. Thenormal clean-in-place (CIP) agreed flow rate is 1.5 m/s, and this is recommendedfor use in any design. On this basis if the average throughput of a plant is 100 m3/h,then the main ring main will be 150 mm internal diameter. At each off-take the pipe

Steen: “chap02” — 2006/4/27 — 18:30 — page 46 — #31
46 CARBONATED SOFT DRINKS
diameter will reduce. Say, for instance, a filling line uses 20 m3/h, then it wouldbe 100 mm internal diameter. In this way the system is balanced. At each take-offpoint a pressure-sustaining valve needs to be installed. Any water not used is fedback to a small holding vessel, usually for a plant of such size of the order of 20 m3.CIP cleaning needs to be incorporated into the ring main design. At each point ofuse, a UV lamp should be sited to minimise any risk due to microbial infectionwithin the system.
2.18 Factory water systems
This chapter has discussed how a modern factory can be set up to provide the waterquality necessary at point of use. Plants need to be designed to satisfy the companywater standard at all times, as well as providing sufficient water quantity as requiredat point of use now and in the foreseeable future. It is no good designing a plant forthe present if this large capital expense cannot satisfy future demands. Althoughnobody has a crystal ball, sales growth rates for the next 5–10 years can be agreedwith the board of a company, and it is then necessary only that any plant item shouldsatisfy this plan.
The plant needs to be automatically controlled. The first step is to ensure that anychange in the quality and/or quantity of the incoming water is sensed immediatelyas this will affect the overall plant performance. With mains supply this could becaused by a burst pipe upstream allowing ingress of Earth into the system or it couldbe that a problem has arisen with the water supplier’s main reservoir, requiring aswitch to an alternative supply with different characteristics. For this, automaticsensors are required which will shut off the supply to the storage tanks until suchtime as a solution to the problem can be found.
All the processes need to be PLC (programmable logic controller), or PC con-trolled, with sensitive in-line instrumentation to allow feedback control systems tooperate effectively. They must be capable of meeting demand day in and day out.Maintenance will be required, depending on the plant type, taking that item of plantout of use for a certain period. This factor must be allowed for in the design of thecomplete system in that more than one of a particular unit needs to be installed. Thisrequirement also applies to the need for regular cleaning through backwashing, etc.As standards are continually being reviewed so must the design of the water treat-ment system. New technologies and improved instrumentation are always beingdeveloped. These have to be followed up, and if they are found to be applicable andto reduce the risks to the product from poor water quality, they should be installedprovided they are also commercially justifiable.
References
Ashurst, P.R. (2004) Chemistry and Technology of Soft Drinks and Fruit Juices (2nd edn). BlackwellPublishing, Oxford.

Steen: “chap02” — 2006/4/27 — 18:30 — page 47 — #32
WATER TREATMENT 47
Binnie, C., Kimber, M. and Smethurst, G. (2002) Basic Water Treatment (3rd edn). Royal Society ofChemistry, London.
Clancy, J.L., Hargy, T.M., Marshall, M.M. and Dyksen, J.E. (1998) UV light inactivation ofcryptosporidium oocysts. Journal of the American Water Works Association, 90(9), 92–102.
Gleick, P.H. (1996) Water resources. In: Schneider, S.H. (Ed.) Encyclopaedia of Climate and Weather,vol. 2, pp. 817–23. Oxford University Press, New York.
Liu, D.H.F. and Liptek, G. (Eds) (1999) Groundwater and Surface Water Pollution. CRC Press, BocaRaton, Florida.
Mallevialle, J. (Ed.) (1995) Water Treatment Membrane Processes. McGraw Hill, New York.Prato, T.A. and Parent, R.G. (1993) Nitrate and nitrite removal from municipal water supplies with
electrodialysis. Proceedings of the American Water Works Association Membrane Conference.Senior, D. and Dege, N.J. (2004) Technology of Bottled Water (2nd edn). Blackwell Publishing, Oxford.Twort, A.C. (Ed.) (1997) Water Supply. Edward Arnold, London.Wagner, G. (2001) Membrane Filtration Handbook (2nd edn). Osmonics Inc., Minnetonka, USA.
Steen: “chap03” — 2006/4/27 — 19:39 — page 48 — #1
3 Ingredients and formulation of carbonatedsoft drinksBarry Taylor
3.1 Introduction
Present-day standards in most countries demand that food and drink, in general,must be of a defined quality and present no health risk to the consumer. It is there-fore essential that at every stage of production correct procedures are adopted andingredients are selected to meet legal requirements of purity and to conform to thelegislative controls that apply.
This chapter will look towards those ingredients whose individual contributionsserve both to stabilise the soft drink during its shelf life as well as ensuring thatit may exhibit a characteristic identity in its organoleptic performance throughout.Typical levels of use in both formulation and application will be indicated.
The wide variety of products encountered in today’s beverage market reflectsa background of intense creativity in terms of the characterisation of drink types.The area of carbonated soft drinks is no exception. The art of producing carbon-ated beverages has developed over more than two hundred years, and the resultinghistory makes interesting reading. It will be useful to consider the background tothe development of the soft drinks industry and how the word ‘additive’ found itsway into the vernacular.
3.2 Factors influencing development of the industry
Soft drinks, or to quote their early designation ‘mineral waters’ or ‘table waters’,emerged as a commercial prospect in the mid-eighteenth century, their developmenttowards full-scale production followed hot on the heels of the industrial revolutiontaking place at that time throughout Europe and the western world. Before this,although freshly pressed, or squeezed, juices were available for direct consump-tion – fitting the description ‘soft drink’ – these were inherently unstable if stored,quickly succumbing to yeast attack and the resulting fermentation. It is not surpris-ing therefore that in the Middle Ages (and before) brewing was the only reliablemethod of producing a stable beverage, as the alcoholic content produced by thefermentation of natural sugars inhibits further yeast or microbial activity.
Brewing became an art, and most country estates of any substance held their ownsupplies of alcoholic beverages. In Northern Europe these tended to be fruit wines,mainly produced from hedgerow stock or, in the case of Mediterranean countries,
Steen: “chap03” — 2006/4/27 — 19:39 — page 49 — #2
INGREDIENTS AND FORMULATION OF CARBONATED SOFT DRINKS 49
from the ubiquitous grape. Beers, ciders, perrys and the like were also widespreadaccording to the locality.
It was the discovery of carbon dioxide that made the stabilisation of a non-alcoholic drink attainable. During the eighteenth century there was great progressin the discovery of gases and the composition of the air we breathe. Effervescingspa waters and natural mineral waters, which carried with them a decided healthbenefit connotation, had been known and consumed for some time, and great sci-entific interest was expressed in the constitution of such waters. However, althoughspa waters were sometimes effervescent, their consumption often fell well shortof anything that could be considered enjoyable. The thought of actually drinkingeffervescent mineral waters did not arise until the eighteenth century. Before thisthe health spas were used primarily for bathing and relaxation. In addition to thepresence of carbon dioxide, the foul sulphurous taste of some spa waters, coveringtrace mineral elements, nonetheless convinced consumers they were being put backon the road to recovery from their ailments.
The identity of carbonic acid gas (otherwise known as fixed air, gas sylvestre,or carbon dioxide) in naturally occurring waters was demonstrated in 1741 byDr Brownrigg, who is also credited as being the first to accomplish the artificialaeration of mineral water (Stevenson & Howell Ltd, 1926).
Later in the century Dr Joseph Priestley, FRS, was able to claim the discovery –and demonstrate the practical implications – of the principle of charging, or satu-rating, water with carbon dioxide by methods similar to those we are familiar withtoday. In 1772 Priestley invented ‘an apparatus for making aerated water’, which heexhibited to the Royal College of Physicians, and upon which the college reportedfavourably.
In 1794 Priestley and his wife moved to Northumberland, Pennsylvania.Although Priestley was acquainted with John Adams and Thomas Jefferson, itseems he did not take up American citizenship, and certainly he kept well away fromthe political affairs of the nation. He may well, however, have retained his interestin aerated waters, for it was at about this time that seltzer fountains caught on in theUSA and a new industry emerged. Fuelled mainly by the temperance movement, thehealthy image of seltzer waters soon grew, and the waters came to include varietiesflavoured with botanical extracts, fruit juices and the like. Soda fountains remainedin vogue in America well into the nineteenth century. Each used a stream of car-bonated water to dilute flavoured syrups; the more sophisticated designs supplieda choice of flavours, with the drinks dispensed for direct consumption.
Among the earliest soda water manufacturers in Europe were Jacob Schweppeand Nicholas Paul, who were business partners in Geneva before going their sep-arate ways and moving to England. Schweppe set up in London in 1792 to makehis artificial carbonated waters on what was effectively a factory scale. Paul wasoperating commercially in London by 1800, and it is to this period that we caneffectively date the origins of ‘soda water’ as an accepted term for a product.
Meanwhile, attention was turning to the problem of keeping the gas in the bottle,for it was well known that corks, unless wet and in contact with the liquid contents,fell well short of requirements. As a result, there followed different designs of bottle
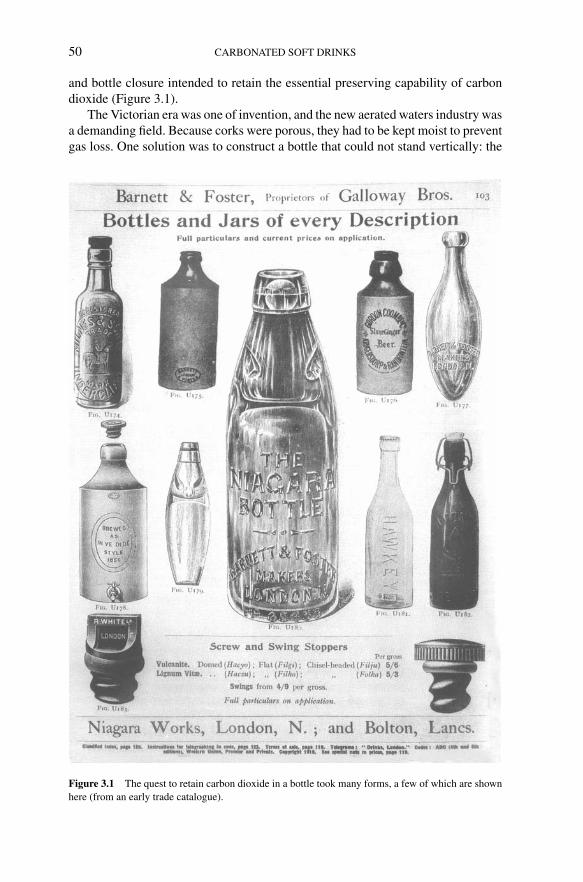
Steen: “chap03” — 2006/4/27 — 19:39 — page 50 — #3
50 CARBONATED SOFT DRINKS
and bottle closure intended to retain the essential preserving capability of carbondioxide (Figure 3.1).
The Victorian era was one of invention, and the new aerated waters industry wasa demanding field. Because corks were porous, they had to be kept moist to preventgas loss. One solution was to construct a bottle that could not stand vertically: the
Figure 3.1 The quest to retain carbon dioxide in a bottle took many forms, a few of which are shownhere (from an early trade catalogue).

Steen: “chap03” — 2006/4/27 — 19:39 — page 51 — #4
INGREDIENTS AND FORMULATION OF CARBONATED SOFT DRINKS 51
egg-shaped ‘side-lying’ Hamilton bottle (ca. 1809) kept its cork permanently incontact with the liquid and was used successfully for a time, but it had disadvan-tages in terms of filling and of quantity storage. Glass and earthenware stoppers,and then screw stoppers made of earthenware, were tried (ca. 1843) with vary-ing degrees of success. In 1870 Hiram Codd, a Londoner, introduced his patentedglobe-stoppered bottle. This was so constructed that the pressure of carbon dioxidegas from the charged liquid forced a glass ball against a rubber ring inserted in agroove in the bottle’s neck. This formed a secure closure but needed only a slightdownward force on the ball to release the pressure and allow the bottle to be emp-tied. A ridge of glass at the base of the neck prevented the ball from falling backinto the liquid contents.
About this time the screw (vulcanite)-stoppered bottle and the ‘swing’ (ceramic)stopper, operated by a wire spring, were also in widespread use. Then towards theend of the nineteenth century there appeared an entirely new closure concept, the‘crown cork’. This was devised in Baltimore, Maryland, in 1889, and a patent waslater awarded in the UK during April 1892. The crown cork consisted of a thinmetal disc crimped at the edges and originally lined with cork which was clampedaround the bottle opening using external mechanical force. Such closures are stillin use today, although the cork liner has now been replaced with a soft plasticcoating. When introduced, the crown cork had the advantages of both lower costand, because of its one-time use, greater hygiene than other types of closure.
The interest in aerated waters was, of course, due to the stabilising effect ofthe dissolved carbon dioxide gas, the first additive of major importance. As partof the developments around the filling and containerising of the new drinks therewere other changes in formulation that fall under the term ‘additive’.
3.3 The move towards standardisation
Flavourings, colourings, acidulants and new preservatives were tried, at times withdisastrous results. There is ample evidence that with the lack of early statutorycontrols, the contents of some bottled products would have been lethal to the con-sumer. An early edition of Skuse’s Complete Confectioner, published ca. 1890,contained information on cordials and other beverages and, in a section on flavoursand colours, seriously admonished against the use of chrome yellow (lead chro-mate) as it had been known for certain confectioners to use a little chrome yellowfor stripes in sweets. Heaven forbid it should also be used in beverages! Much of thehazard was created by the presence of impurities in some of the materials used in themanufacture of certain additives. Frequently, the sulphuric acid or vitriol used in thegeneration of carbon dioxide from whiting, or more effectively from bicarbonate ofsoda, was contaminated with metallic impurities, including arsenic and nitrous com-pounds, and care had to be exercised to select the best grades. A recurring problem,again centred on impurities, was the risk of contamination owing to contact of thematerials used in the preparation of soft drinks with lead and copper.
The Mineral Waters Trade Review and Guardian, January issue, 1875, dwells onthe subject at some length and a particular case is cited where lemon oils imported
Steen: “chap03” — 2006/4/27 — 19:39 — page 52 — #5
52 CARBONATED SOFT DRINKS
from Messina, Italy, were found to be heavily contaminated with lead following aperiod of storage in copper cans. The contact surfaces had been ‘tinned’, and it wasestablished that the solder used for the purpose contained relatively high levels oflead in its blend. Today the limits of impurities are well defined in legislation. UnderEuropean regulations non-alcoholic beverages for consumption without dilution aregiven maximum limits for lead (0.2 mg/kg), arsenic (0.1 mg/kg), copper (2 mg/kg)and zinc (5 mg/kg).
In terms of food and drink additives, custom and use eventually indicated whatdosage levels were acceptable, but there was no rigid system of assessment forthese. In England, the Mineral Water and Food and Drugs acts were placed on thestatute books in 1875. These instruments informed very clearly, but neverthelesswith some generality, what the industry should not do but omitted to indicate whatmight be done without fear of the consequences. For instance, Section 3 of the Actof 1875 stated, ‘No person shall mix colour, stain, or powder . . . any article of food,with any ingredient or material so as to render the article injurious to health with theintent that the same may be sold in that state’. There was no restriction on colouringmaterial of any kind other than that nothing ‘injurious to health’ could be used.
The absence of standards of quality or composition, apart from those relatingto pharmaceutical products (the reference here was the British Pharmacopoeia),caused confusion in the early years. Toxicology was in its infancy as a scienceand many of the ingredients used in the manufacture of beverages to stabilise andstandardise the drink in apparent safety have subsequently been determined to beinjurious to health at the levels used. It has been said that in the area of food anddrink ‘Everything is a poison: it just depends on the dosage or intake’. Assessmentand control have developed to the point where, by and large, all food ingredientsare now controlled by legislation. When and where appropriate, certain ingredientsare removed from the permitted list or limited to an acceptable daily intake (ADI).
Different countries employ their own legislative controls for food ingredients,but two main areas exert great influence upon world opinion: the European systemcontrolled by the EU parliamentary council using designated E-number listing forpermitted food additives and the system used in the USA, where at federal levelthe Federal Food, Drug, and Cosmetic Act (FFDCA) lays down the framework forfood safety.
3.4 The constituents of a soft drink
The term ‘soft drink’ applies to beverages containing flavourings and/or fruit juicestogether with other constituents of technological or nutritional value designed toenhance the appearance and stability of the product and to ensure its organolepticproperties are maintained for a reasonable shelf life. In order to meet currentstringent quality and legislative controls a new beverage is subjected to extensivetrials to assess the suitability and performance of all its components, and it is essen-tial to arrive at the correct formulation to achieve a reproducible product. Table 3.1
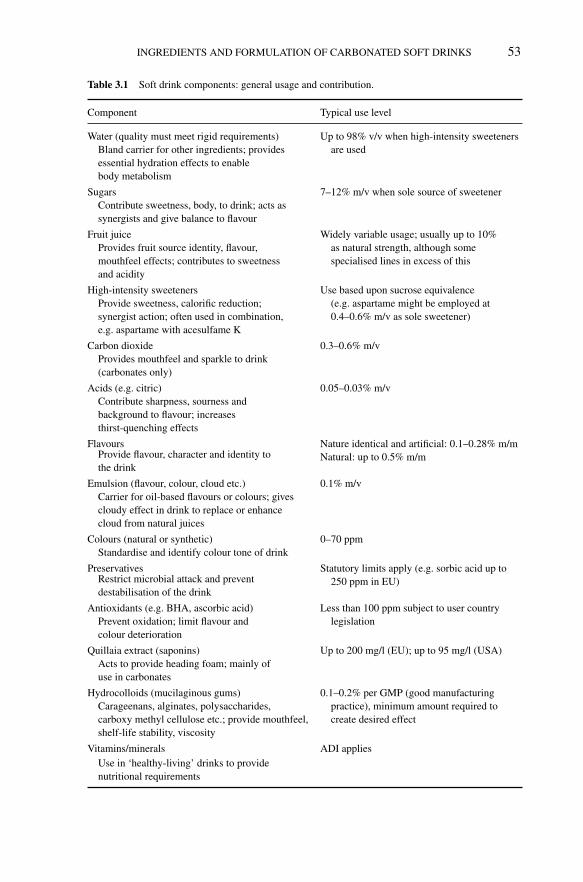
Steen: “chap03” — 2006/4/27 — 19:39 — page 53 — #6
INGREDIENTS AND FORMULATION OF CARBONATED SOFT DRINKS 53
Table 3.1 Soft drink components: general usage and contribution.
Component Typical use level
Water (quality must meet rigid requirements)Bland carrier for other ingredients; providesessential hydration effects to enablebody metabolism
Up to 98% v/v when high-intensity sweetenersare used
Sugars 7–12% m/v when sole source of sweetenerContribute sweetness, body, to drink; acts assynergists and give balance to flavour
Fruit juice Widely variable usage; usually up to 10%as natural strength, although somespecialised lines in excess of this
Provides fruit source identity, flavour,mouthfeel effects; contributes to sweetnessand acidity
High-intensity sweeteners Use based upon sucrose equivalence(e.g. aspartame might be employed at0.4–0.6% m/v as sole sweetener)
Provide sweetness, calorific reduction;synergist action; often used in combination,e.g. aspartame with acesulfame K
Carbon dioxide 0.3–0.6% m/vProvides mouthfeel and sparkle to drink(carbonates only)
Acids (e.g. citric) 0.05–0.03% m/vContribute sharpness, sourness andbackground to flavour; increasesthirst-quenching effects
Flavours Nature identical and artificial: 0.1–0.28% m/mNatural: up to 0.5% m/mProvide flavour, character and identity to
the drink
Emulsion (flavour, colour, cloud etc.) 0.1% m/vCarrier for oil-based flavours or colours; givescloudy effect in drink to replace or enhancecloud from natural juices
Colours (natural or synthetic) 0–70 ppmStandardise and identify colour tone of drink
Preservatives Statutory limits apply (e.g. sorbic acid up to250 ppm in EU)Restrict microbial attack and prevent
destabilisation of the drink
Antioxidants (e.g. BHA, ascorbic acid) Less than 100 ppm subject to user countrylegislationPrevent oxidation; limit flavour and
colour deterioration
Quillaia extract (saponins) Up to 200 mg/l (EU); up to 95 mg/l (USA)Acts to provide heading foam; mainly ofuse in carbonates
Hydrocolloids (mucilaginous gums) 0.1–0.2% per GMP (good manufacturingpractice), minimum amount required tocreate desired effect
Carageenans, alginates, polysaccharides,carboxy methyl cellulose etc.; provide mouthfeel,shelf-life stability, viscosity
Vitamins/minerals ADI appliesUse in ‘healthy-living’ drinks to providenutritional requirements

Steen: “chap03” — 2006/4/27 — 19:39 — page 54 — #7
54 CARBONATED SOFT DRINKS
lists the functional constituents of soft drinks and their typical usage levels. Moredetailed discussion follows.
3.5 Water
Water, as the main component of a soft drink, usually accounts for between 85 and95% of the product and acts as a carrier for the other ingredients. It must conform torigid quality requirements and not interfere with the taste, appearance, carbonationor other properties of the drink. Depending on the location of the bottling plant, thesource of water and the product specifications, it may be necessary to treat the waterused in the manufacture of soft drinks. In most urbanised areas of the world, publicwater supplies can meet consumer potability requirements, but for the soft drinksmanufacturer this is not always a suitable qualification to use the water as a rawmaterial, and most soft drinks factories carry out their own treatments to counteractpossible changes in quality. This is most important in areas where changes resultfrom the use of a national grid system for water supply.
Public water supplies in developed countries are continually monitored to ensurecompliance with national water supply regulations and to minimise the risk ofcontamination. In the UK, in accordance with the Water Supply (Water Quality)Regulations 1989 and 2000, water companies are required to make public a registercontaining information about water supply zones. The register includes informationon undertakings, relaxations, departures and sample analysis results for each watersupply zone.
In less developed countries, water treatment becomes even more essential wher-ever microbial loading could provide cause for concern and it is necessary for afull water treatment to effectively ensure the wholesomeness of water supplies forboiling.
3.5.1 Requirements
Water should be free from
• high levels of elements and mineral salts• objectionable tastes and odours• organic material.
It should also be
• clear and colourless• free from dissolved oxygen• sterile, that is, free from micro-organisms.
Ideally, a non-variable supply of water should be available at all times of the yearto allow a standard manufacturing process to be established.

Steen: “chap03” — 2006/4/27 — 19:39 — page 55 — #8
INGREDIENTS AND FORMULATION OF CARBONATED SOFT DRINKS 55
3.5.2 Quality of fresh water
The quality of fresh water supplies depends on the geology of the catchment area.All fresh water is derived from rainfall, which filters through the upper layers ofsoil, extracting minerals and organic material en route. For example, rainfall onchalk areas will result in a supply of water with a high dissolved solids content,high alkalinity and total hardness, whereas the opposite is the case when rain fallson granite.
In marshlands and peaty areas water may well be pale yellow and containsappreciable amounts of dissolved organic matter. Such waters are sometimes termed‘humic’ (because the yellow colour derives from the humic and fulvic acids present)and are likely to possess an unpleasant odour and bitter taste.
3.5.3 Water hardness
The term ‘hardness’ refers to the presence of calcium and magnesium salts. ‘Tempo-rary hardness’ is due to the presence of the bicarbonates of calcium and magnesium,and ‘permanent hardness’ to calcium and magnesium chlorides, sulphates andnitrates. ‘Total hardness’ is the sum of temporary and permanent hardness. Mea-surement is expressed as the equivalent concentration of calcium carbonate inmilligrams per litre or parts per million metre per volume and is also termed ‘degreeof hardness’. Approximate classifications are
Soft: <50 mg/l as CaCO3
Medium-soft: 50–100 mg/l as CaCO3
Hard: 100–200 mg/l as CaCO3
Very hard: 200–300 mg/l as CaCO3.
Water for use in soft drinks should ideally be soft or medium-soft.
3.5.4 Water treatment
The tried and tested form of water purification involves continuous treatment witha coagulant (e.g. Al2(SO4)3, Fe2(SO4)3) and chlorine, together with lime to reducethe alkalinity as necessary (Figure 3.2). A gelatinous precipitate, or ‘floc’, forms(hydroxides of aluminium or iron) which absorbs foreign organic matter. Thechlorine sterilises the water by virtue of its microbiocidal and oxidising properties.
After treatment, the water is passed through a sand filter and then an activatedcarbon filter to remove traces of chlorine. It is then passed through a polishing filter(usually a cartridge filter of pore size <10 µm).
3.5.5 Water impurities and their effect
3.5.5.1 Suspended particlesSuspended particles may consist of complex inorganic hydroxides and silicates or,sometimes, organic debris. Particles too small to be easily distinguished can cause
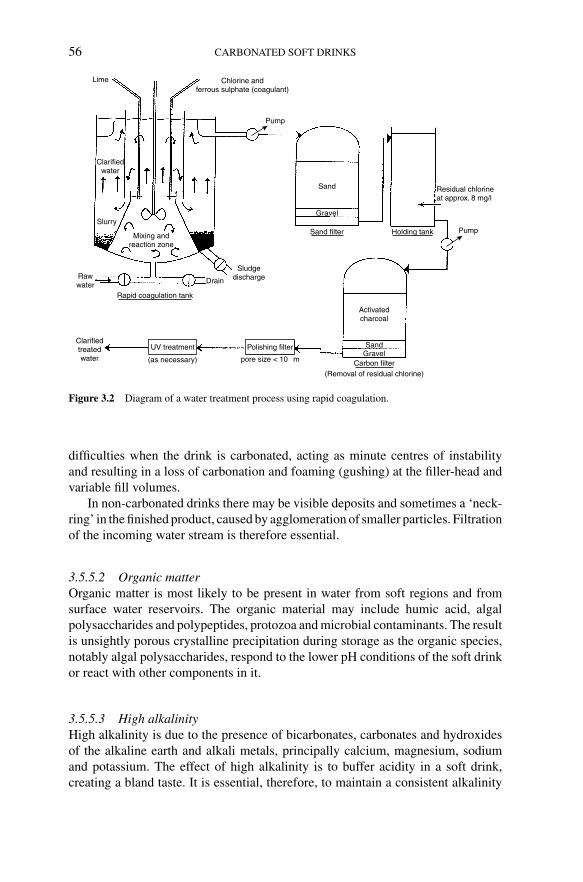
Steen: “chap03” — 2006/4/27 — 19:39 — page 56 — #9
56 CARBONATED SOFT DRINKS
Chlorine andferrous sulphate (coagulant)
Clarifiedwater
Slurry
Mixing andreaction zone
DrainRawwater
Sludgedischarge
Clarifiedtreatedwater (as necessary)
Activatedcharcoal
Carbon filter(Removal of residual chlorine)
SandGravel
Sand Residual chlorineat approx. 8 mg/l
Gravel
pore size < 10 µm
Rapid coagulation tank
Lime
Pump
Sand filter Holding tank Pump
Polishing filterUV treatment
Figure 3.2 Diagram of a water treatment process using rapid coagulation.
difficulties when the drink is carbonated, acting as minute centres of instabilityand resulting in a loss of carbonation and foaming (gushing) at the filler-head andvariable fill volumes.
In non-carbonated drinks there may be visible deposits and sometimes a ‘neck-ring’ in the finished product, caused by agglomeration of smaller particles. Filtrationof the incoming water stream is therefore essential.
3.5.5.2 Organic matterOrganic matter is most likely to be present in water from soft regions and fromsurface water reservoirs. The organic material may include humic acid, algalpolysaccharides and polypeptides, protozoa and microbial contaminants. The resultis unsightly porous crystalline precipitation during storage as the organic species,notably algal polysaccharides, respond to the lower pH conditions of the soft drinkor react with other components in it.
3.5.5.3 High alkalinityHigh alkalinity is due to the presence of bicarbonates, carbonates and hydroxidesof the alkaline earth and alkali metals, principally calcium, magnesium, sodiumand potassium. The effect of high alkalinity is to buffer acidity in a soft drink,creating a bland taste. It is essential, therefore, to maintain a consistent alkalinity
Steen: “chap03” — 2006/4/27 — 19:39 — page 57 — #10
INGREDIENTS AND FORMULATION OF CARBONATED SOFT DRINKS 57
level, and the majority of manufacturers aim for <50 mg/l as CaCO3. Alkalinitycan be reduced by coagulation treatment or by ion exchange.
3.5.5.4 NitratesModern methods of intensive farming using nitrate-based fertilisers have led toa noticeable increase in nitrate levels from aquifers lying beneath agriculturalland. The recommended limit for nitrates has been given as 50 mg/l by the WorldHealth Organization (WHO). The health risk of nitrates is a condition known asmethaemoglobinaemia seen in infants. This condition signifies that blood containsexcessive methaemoglobin, an abnormal substance formed by the oxidation of theiron in haemoglobin (the pigment in red blood cells).
3.6 Saccharides and high-intensity sweeteners
In the early years of the soft drinks industry, what else would be required to providethe element of sweetness but sugar? ‘Sugar’ is the disaccharide sucrose, which isthe benchmark for other sweetener types. In acid solutions sucrose can undergo aprocess known as inversion, breaking down into its constituent monosaccharides,glucose (or dextrose) and fructose (or laevulose). Glucose is less sweet than sucrose(relative sweetness = 0.6) and fructose is sweeter (relative sweetness = 1.5).Consequently, a desired sweetness profile can be achieved by selective combinationof these different carbohydrate types.
3.6.1 Bulk sweeteners
The term ‘bulk sweeteners’ is used for sugars whose normal usage level in beveragesplaces them as the second ingredient, behind carbonated water, in the product dec-laration. This level is typically at 7–12%, depending upon product type and marketpreference. Both dry and liquid forms are available. Granulated sugar (sucrose) isthe dry, crystallised, highly purified form produced via extraction of sugar cane andsugar beet. Liquid sugar, which is widely used, is the standard product, an aqueoussolution of sucrose at 67% m/m (67◦ Brix) at 20◦C. Other bulk sweeteners, oftenreferred to as ‘corn syrups’, are glucose syrup and high fructose glucose syrup(HFGS). Both are formed by the controlled hydrolysis of starch. In the preparationof HFGS, an enzyme system is used whereby a proportion of the glucose present isisomerised to fructose, giving a similar composition to invert sugar: for example,glucose 42%, fructose 42%, other sugars (maltose, maltotriose, higher dextrins etc.)16%. These syrup types are used extensively in the soft drinks industry.
Fructose in its pure form has also attracted interest in recent years. It is commer-cially available as an anhydrous crystalline powder or in its aqueous solution andhas been successfully used as a replacement for sucrose as its increased sweetnessenables use at lower levels. Fructose is very soluble and relatively more hygroscopic

Steen: “chap03” — 2006/4/27 — 19:39 — page 58 — #11
58 CARBONATED SOFT DRINKS
than sucrose (Danisco Sweeteners 2003, Tech. bulletin). It has a distinctive cleantaste and may be used in synergy with other bulk sweeteners, and also some high-intensity sweeteners, to improve overall taste profiles. When fructose is ingested,its metabolism is not dependent upon insulin, and for this reason it can provide animportant element in the diet of people suffering from diabetes.
3.6.2 Intense sweeteners
The use of intense sweeteners has increased significantly over the past 20 yearsowing to the appearance, and acceptance, of new types in the market. Saccha-rin, the first intense sweetener to be used on a commercial scale, has a difficulttaste profile that can seldom be masked with any success in application. During itslong history (initially being employed as a substitute for sugar in the case of dia-betic patients around 1890), consumers have had to accept its often bitter/metallicaftertaste.
In 1983 aspartame and acesulfame K were approved for use under the EuropeanSweeteners Directive/Amendment 96/83/EC and immediately found favour in thesoft drinks industry (aspartame in particular) as a replacement for saccharin.Although aspartame provides a clean, lasting sweetness, it has the disadvantageof undergoing hydrolysis and loss of potency during storage. Below pH 3 andabove pH 5, hydrolysis will occur relatively swiftly; hence conditions in the rangepH 4.2–4.3 are required, where maximum stability is achieved. Aspartame andsaccharin have been successfully used in combination, and also with acesulfameK, where a more sugar-like taste may be achieved. Because of the phenylalaninecontent in aspartame, a warning statement is required on the label of products con-taining the sweetener. In the UK the words ‘contains a source of phenylalanine’must appear on the label to enable those who suffer from phenylketonuria (an inher-ited disorder in which the enzyme that converts phenylalanine into another aminoacid, tyrosine, is defective) to factor the consumption of aspartame into their dailyintake calculations.
3.7 Carbon dioxide
Before turning our attention to the acidulants used in soft drinks, it is worth notingthat in carbonated beverages there is an additional effect of dissolved carbon dioxidegas. Although it is not officially recognised as an acidulant, its inclusion providesextra sparkle, mouthfeel, flavour and sharpness to the drink. Carbon dioxide is acolourless gas; it is a product of animal respiration and is also formed during thecombustion of carbon. As of 2006, the earth’s atmosphere was about 0.038% byvolume (380 µl/l) CO2. The unit of measurement of dissolved carbon dioxide isvolumes of the gas corrected to normal temperature and pressure (i.e. NTP = 0◦Cand 760 mmHg), per volume of the liquid. More recently, it has been expressed asgrams per litre. (Note: 1 l CO2 at NTP weighs 1.97 g.)
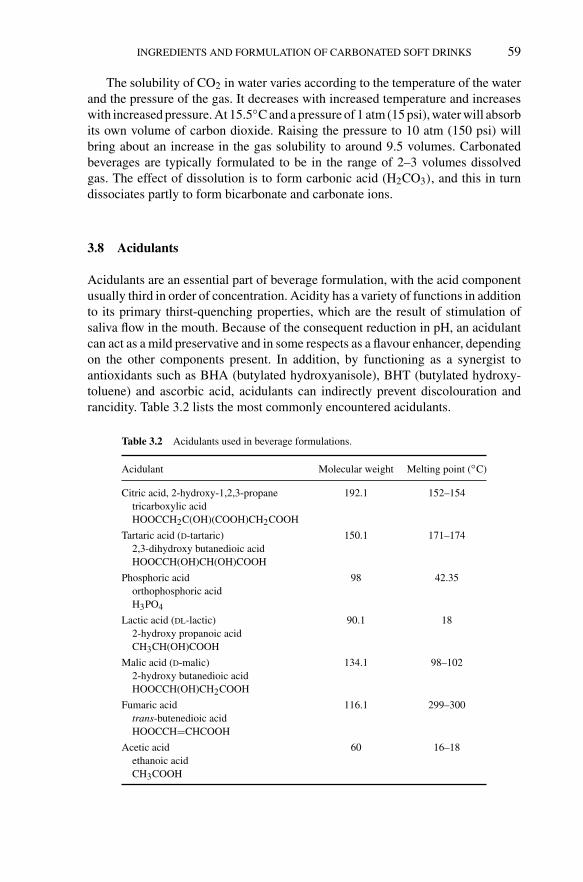
Steen: “chap03” — 2006/4/27 — 19:39 — page 59 — #12
INGREDIENTS AND FORMULATION OF CARBONATED SOFT DRINKS 59
The solubility of CO2 in water varies according to the temperature of the waterand the pressure of the gas. It decreases with increased temperature and increaseswith increased pressure. At 15.5◦C and a pressure of 1 atm (15 psi), water will absorbits own volume of carbon dioxide. Raising the pressure to 10 atm (150 psi) willbring about an increase in the gas solubility to around 9.5 volumes. Carbonatedbeverages are typically formulated to be in the range of 2–3 volumes dissolvedgas. The effect of dissolution is to form carbonic acid (H2CO3), and this in turndissociates partly to form bicarbonate and carbonate ions.
3.8 Acidulants
Acidulants are an essential part of beverage formulation, with the acid componentusually third in order of concentration. Acidity has a variety of functions in additionto its primary thirst-quenching properties, which are the result of stimulation ofsaliva flow in the mouth. Because of the consequent reduction in pH, an acidulantcan act as a mild preservative and in some respects as a flavour enhancer, dependingon the other components present. In addition, by functioning as a synergist toantioxidants such as BHA (butylated hydroxyanisole), BHT (butylated hydroxy-toluene) and ascorbic acid, acidulants can indirectly prevent discolouration andrancidity. Table 3.2 lists the most commonly encountered acidulants.
Table 3.2 Acidulants used in beverage formulations.
Acidulant Molecular weight Melting point (◦C)
Citric acid, 2-hydroxy-1,2,3-propanetricarboxylic acidHOOCCH2C(OH)(COOH)CH2COOH
192.1 152–154
Tartaric acid (d-tartaric)2,3-dihydroxy butanedioic acidHOOCCH(OH)CH(OH)COOH
150.1 171–174
Phosphoric acidorthophosphoric acidH3PO4
98 42.35
Lactic acid (dl-lactic)2-hydroxy propanoic acidCH3CH(OH)COOH
90.1 18
Malic acid (d-malic)2-hydroxy butanedioic acidHOOCCH(OH)CH2COOH
134.1 98–102
Fumaric acidtrans-butenedioic acidHOOCCH=CHCOOH
116.1 299–300
Acetic acidethanoic acidCH3COOH
60 16–18
Steen: “chap03” — 2006/4/27 — 19:39 — page 60 — #13
60 CARBONATED SOFT DRINKS
3.8.1 Citric acid
Citric acid is the most widely used acid in fruit-flavoured beverages. It has a lightfruity character that blends well with most fruit flavours, which is to be expected asit occurs naturally in many fruit types. Unripe lemons contain 5–8% citric acid. Itis also the principal acidic constituent of currants and cranberries and is associatedwith malic acid in apples, apricots, blueberries, cherries, gooseberries, loganberries,peaches, plums, pears, strawberries and raspberries. It is associated with isocitricacid in blackberries and tartaric acid in grapes.
Citric acid was originally produced commercially from lemons, limes or berg-amots by pressing the fruit, concentrating the pressed juice and precipitating citricacid as its calcium salt, from which it was subsequently purified. It is now producedby the action of enzymes on glucose and other sugars.
Citric acid is a white crystalline solid; it can be purchased as a granular powderin its anhydrous state or as the monohydrate. Present-day soft drinks formulationsusually employ the anhydrous form, which has cost-in-use advantages over themore traditionally used monohydrate.
3.8.2 Tartaric acid
Tartaric acid occurs naturally in grapes as the acid potassium salt. During thefermentation of grapes, tartaric acid precipitates out from solution as crystals asits solubility decreases with the increasing alcoholic concentration of the wine.Tartaric acid is also a natural component of numerous other fruits such as currants,blackberries and cranberries.
Tartaric acid can be obtained in four forms: dextro, laevo, meso and the mixed-isomer equilibrium, or racemic, form. Commercially, it is usually available asdextro-tartaric acid. It has a sharper flavour than citric acid and may thereforebe used at a slightly lower level to give equivalent palate acidity. (Note: palate acid-ity is a purely subjective measurement and it is generally agreed that a number ofacids can be used at concentrations different from those indicated by their chemicalacid equivalent; see Table 3.3.)
Tartaric acid can be isolated from the crude deposit of tartrates obtained duringwine fermentation, in a similar manner to the process for citric acid, that is, byleaching the deposit with boiling HCl solution, filtering it and re-precipitating thetartrates as the calcium salt. The free acid is obtained by treating the calcium tartratewith sulphuric acid and further purification by crystallisation.
Tartaric acid (dextro-form) is a white crystalline solid with melting point (m.p.)171–174◦C. Tartaric acid has a strong, tart taste and it complements natural andsynthetic fruit flavours, especially grape and cranberry. For use in beverages, tartaricacid must be perfectly pure and guaranteed for food use. One problem that may needto be addressed is that tartaric acid salts, particularly the calcium and magnesiumtartrates, have lower solubility than citric acid. There is consequently a tendency
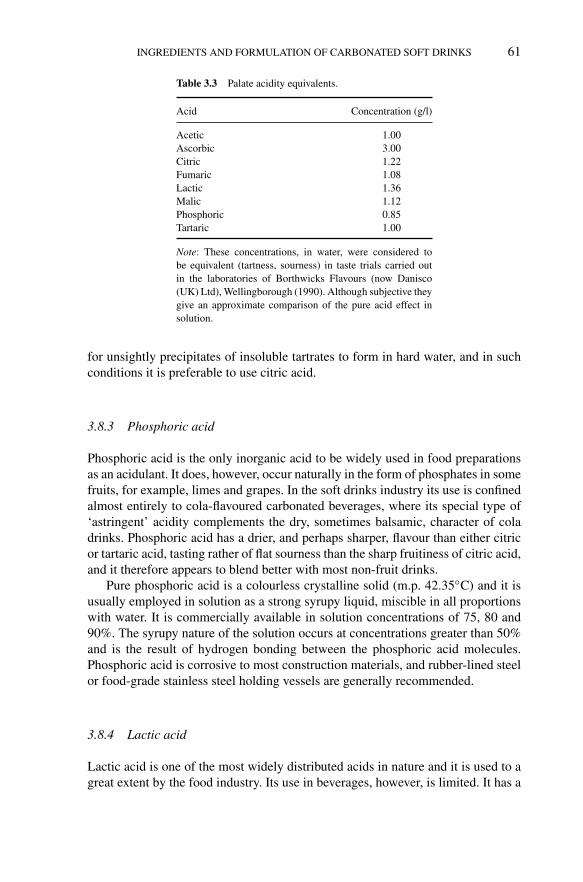
Steen: “chap03” — 2006/4/27 — 19:39 — page 61 — #14
INGREDIENTS AND FORMULATION OF CARBONATED SOFT DRINKS 61
Table 3.3 Palate acidity equivalents.
Acid Concentration (g/l)
Acetic 1.00Ascorbic 3.00Citric 1.22Fumaric 1.08Lactic 1.36Malic 1.12Phosphoric 0.85Tartaric 1.00
Note: These concentrations, in water, were considered tobe equivalent (tartness, sourness) in taste trials carried outin the laboratories of Borthwicks Flavours (now Danisco(UK) Ltd), Wellingborough (1990). Although subjective theygive an approximate comparison of the pure acid effect insolution.
for unsightly precipitates of insoluble tartrates to form in hard water, and in suchconditions it is preferable to use citric acid.
3.8.3 Phosphoric acid
Phosphoric acid is the only inorganic acid to be widely used in food preparationsas an acidulant. It does, however, occur naturally in the form of phosphates in somefruits, for example, limes and grapes. In the soft drinks industry its use is confinedalmost entirely to cola-flavoured carbonated beverages, where its special type of‘astringent’ acidity complements the dry, sometimes balsamic, character of coladrinks. Phosphoric acid has a drier, and perhaps sharper, flavour than either citricor tartaric acid, tasting rather of flat sourness than the sharp fruitiness of citric acid,and it therefore appears to blend better with most non-fruit drinks.
Pure phosphoric acid is a colourless crystalline solid (m.p. 42.35◦C) and it isusually employed in solution as a strong syrupy liquid, miscible in all proportionswith water. It is commercially available in solution concentrations of 75, 80 and90%. The syrupy nature of the solution occurs at concentrations greater than 50%and is the result of hydrogen bonding between the phosphoric acid molecules.Phosphoric acid is corrosive to most construction materials, and rubber-lined steelor food-grade stainless steel holding vessels are generally recommended.
3.8.4 Lactic acid
Lactic acid is one of the most widely distributed acids in nature and it is used to agreat extent by the food industry. Its use in beverages, however, is limited. It has a

Steen: “chap03” — 2006/4/27 — 19:39 — page 62 — #15
62 CARBONATED SOFT DRINKS
mild taste relative to the other acids and is used in soft drinks as a flavour modifieror enhancer rather than as an acidulant.
Lactic acid is supplied commercially as an odourless and colourless vis-cous liquid. It is produced via the fermentation, using lactic acid bacteria, ofcarbohydrates such as corn, potato or rice starch, cane or beet sugar or beet molasses.
3.8.5 Acetic acid
Acetic acid has a very limited use in beverages, only finding use where its vinegarycharacter can contribute to a suitable flavour balance in the product. It is seldomused in fruit beverages. Pure glacial acetic acid is a colourless crystalline solid (m.p.16◦C) with a suffocating, pungent aroma. It is one of the strongest of the organicacids, and as such can displace carbonic acid from carbonates.
3.8.6 Malic acid
Malic acid, which occurs widely in nature, is closely associated with apples. It is thesecond major acid, after citric, found in citrus fruits and it is present in most berryfruits. Malic acid is slightly stronger than citric in perceived acidity, imparting afuller, smoother fruity flavour.
Malic acid is a crystalline white solid (m.p. 100◦C) and is highly soluble inwater. As it is less hygroscopic than citric acid it provides good storage propertiesand shelf life. Unlike tartaric acid, its calcium and magnesium salts are highlysoluble and it therefore presents no problem in hard-water areas.
Malic acid finds use in a variety of products, mostly in fruit-flavoured car-bonates. It is the preferred acidulant in low-calorie drinks and in cider and appledrinks, enhancing flavour and stabilising colour in carbonated and non-carbonatedfruit-flavoured drinks. Malic acid can also be used to mask the off-taste of somesugar substitutes. Blends of malic and citric acids are said to exhibit better tastecharacteristics than either acidulant individually.
3.8.7 Fumaric acid
Fumaric acid is not permitted under UK or European legislation for direct use in softdrinks, although it is permitted, under Annex IV of Directive 95/2/EC (modifiedby Directive 98/72/EC), within strict limits, in instant powders for fruit-, tea- orherbal-based drinks. Fumaric acid finds wide use as an acidulant in other countries,notably in the US market, where it has GRAS (‘Generally Recognised As Safe’)status. Fumaric acid is currently manufactured in the USA via the acid-catalysedisomerisation of maleic acid. In terms of equivalent palate acidity it can be used
Steen: “chap03” — 2006/4/27 — 19:39 — page 63 — #16
INGREDIENTS AND FORMULATION OF CARBONATED SOFT DRINKS 63
at lower levels than citric acid, and typical replacement is suggested at two partsfumaric per three parts citric acid in water, sugar water and carbonated sugar water.
The main drawback to the use of fumaric acid is its slow solubility rate incomparison with citric acid and the need for special methods in its dissolution.
3.8.8 Ascorbic acid
Ascorbic acid, better known as vitamin C, is used not only as a contributory acidulantbut also as a stabiliser within the soft drinks system, and its antioxidant propertiesserve to improve the shelf-life stability of flavour components. Many of the ingredi-ents used in flavourings are susceptible to oxidation, particularly aldehydes, ketonesand ketoesters. Ascorbic acid shields these from attack by becoming preferentiallyoxidised and lost, leaving the flavour component unaffected.
It should be noted that although ascorbic acid acts well as a browning inhibitorin unprocessed fruit juices, its effect can be destroyed if the juice is subsequentlypasteurised or heat-treated. In such cases ascorbic acid can initiate its own chemicalbrowning reaction.
Another disadvantage of ascorbic acid is its effect on some colours in the pres-ence of light. In the case of azo colours, such as carmoisine, a light-catalysedreaction occurs, resulting in cleavage of the –N=N– linkage and consequentdestruction of the chromophore. The bleaching will be specific to light of a cer-tain wavelength and, where the phenomenon occurs, will account for the suddenloss of colour occuring in perhaps only part of a consignment of bottled product,containing, say, ascorbic acid, and colourings, carmoisine and sunset yellow, in itsformulation, positioned in direct sunlight, whereas the remainder having been leftin conditions of north facing light, or partial shade, will remain unchanged.
3.9 Flavourings
It is the flavour of a drink that provides not only a generic identity but also itsunique character. This part of the sensory profile is responsible for pleasing andattracting the consumer. For example, having decided on a cola drink, the consumerwill be able to differentiate between colas by virtue of the background flavouringcomponents, which collectively provide a reference point to which the consumercan return, consciously or not, on future occasions whenever a particular brand ofdrink is tried.
A flavouring consists of a mixture of aromatic substances carefully balanced toconvey the right message to the sensory receptors of the consumer. The preparationof such a mixture is a serious matter: the flavourist, like the perfumer, must be wellversed in the technique, creative and able to translate ideas into a practical product.Although it is often difficult for the consumer to describe taste, the flavourist hasno such limitations. The professional flavourist is seldom at a loss to describeorganoleptic attributes, calling on a personal library of stored knowledge relating

Steen: “chap03” — 2006/4/27 — 19:39 — page 64 — #17
64 CARBONATED SOFT DRINKS
to flavouring substances and types. For example, some descriptors that might beapplied to a peach-flavoured drink are
sweet juicy fruity lactonic astringentacidic skinny floral estery aldehydicripe fresh stewed jammy perfumed
Depending on the desired profile, the flavourist may add to, or subtract from, acentral theme until an acceptable blend is reached. Where work on a new product isto be collaborative, it is often necessary for the technical teams concerned to agreeupon a suitable vocabulary of flavour terms.
Although the art of the flavourist depends largely on individual sensory abili-ties, it is frequently necessary in present-day flavour work to enlist analytical aidat an early stage of the project. Modern instrumental analytical techniques arecapable of detection to extremely low limits, but it is still usually necessary to pre-pare an extract, or concentrated version, of the target flavour before carrying outthe analysis. This can be achieved by such methods as solvent extraction, distilla-tion, adsorption chromatography, dialysis, headspace concentration and cryogenicor adsorbent trapping.
A good gas chromatographic/mass spectometric (GC/MS) system can be used toidentify profiles of compounds and individual flavouring substances up to, say, 98%of the target flavour, thus bypassing much of the time-consuming preliminary workassociated with organoleptic flavour matching. GC/MS can provide an extremelyrapid and reliable assessment so that a tolerable flavour match requires only slight‘tuning’ adjustments for completion of the work.
A technique more recently employed to provide additional information on themechanisms involved in the sensorial aspects of eating and drinking, and thein situ production/release of flavour molecules, is proton transfer reaction massspectroscopy (PTR/MS). Whereas standard GC/MS involves the formation andconsequential fragmentation of molecular ions, forming a characteristic profile ofthe resulting ions sorted by their mass/charge ratio, PTR/MS employs a less drastic,soft ionisation approach whereby there is noticeably less fragmentation and a sim-pler profile to assess. The procedure provides a powerful tool in understanding howthe flavouring is perceived by the consumer. It is an extremely sensitive methodof analysis that has been applied to flavour volatiles released to the oral and nasalcavities during eating or drinking. The performance of a flavouring will frequentlybe influenced by its mode of application, synergistic effects between individualcomponents and, not least, changes in the substrate during consumption of the fooditself. PTR/MS analysis can provide useful and accurate information on this latteraspect.
In the creation of a flavouring there is inevitably a component of comparisonagainst what is already accepted as the generic base. Thus a strawberry flavour is atonce typical, to a marked degree, of the fruit itself; however, on a commercial levelthe characterisation of this base flavour into something new will set the productapart from the competition and may lead to success in the market. Descriptorssuch as fresh, cooked, jammy, green, wild, ripe, full-bodied, creamy, estery, sweet,
Steen: “chap03” — 2006/4/27 — 19:39 — page 65 — #18
INGREDIENTS AND FORMULATION OF CARBONATED SOFT DRINKS 65
artificial and natural may be applied in the assessment as the taster searches for anadjective to best describe what is being conveyed via neurological pathways fromtaste sensors to brain. At best, the subjective nature of such an assessment will findsome commonality across several tasters. It is at this point that the flavour may beidentified as a winner, although even now success will depend upon applicationtype, marketing strategies and so on.
Gas chromatography has enabled remarkable progress in the identification ofvolatile flavouring constituents occurring naturally in fruits and botanicals, forexample, and also in food and drink products. From approximately 500 in 1955, ithas grown to some 7000. Many ingredients are available to choose from, althoughin practical terms there is little need to select outside a group of 2000 when creat-ing that extra modification that will distinguish the new flavouring. The majority offlavourings on the market are derived from fewer than 800 or so of these ingredients.A typical commercial flavouring will contain between 15 and 60 components,although among these there may be natural extracts carrying a composite blendof constituents in their own right.
3.9.1 Flavourings and legislation
Most food ingredients have been well investigated in terms of use and effect,categorised and registered on permitted lists as appropriate to local legislation.Flavourings, however, by virtue of their complexity have always existed as a sepa-rate group. Distinction is made under various systems as to whether flavouringsare of natural origin. This follows adoption by the UN Food and AgricultureOrganization (FAO)/WHO Food Standard Programme, the Codex AlimentariusCommission, of a proposal put forward by the International Organization of theFlavour Industry (IOFI) (ca. 1975) to divide flavouring substances into threecategories:
• Natural flavours and natural flavouring substances are preparations and sin-gle substances, acceptable for human consumption, obtained exclusively byphysical processes from vegetable, and sometimes animal, raw materialseither in their natural state or processed for human consumption.
• Nature-identical flavouring substances are substances chemically isolatedfrom aromatic raw materials or obtained synthetically. They are chemi-cally identical to substances present in natural products intended for humanconsumption, whether processed or not.
• Artificial flavouring substances are, for the purpose of the Codex Alimenta-rius, those substances which have not yet been identified in natural productsintended for human consumption, whether processed or not. They are henceonly made available via synthesis.
Perhaps the most frequently cited register of flavouring substances appears inthe GRAS listings compiled by the ‘Flavor and Extract Manufacturers’ Association(FEMA) of the USA. They comprise those substances ‘Generally Recommended As

Steen: “chap03” — 2006/4/27 — 19:39 — page 66 — #19
66 CARBONATED SOFT DRINKS
Safe’ when used in the minimum quantities required to produce the intended physi-cal (i.e. sensory) effect and in accordance with the principle of good manufacturingpractice. Each substance is allocated a FEMA number to enable cross-referencingwith other listings, for example, those of the Council of Europe (CoE), US Foodand Drug Administration (FDA) and Chemical Abstracts Service (CAS).
In Europe, flavourings have generally been considered to be compound ingre-dients, and concern has been expressed about the safety of their ‘undeclared’components. Following extended interaction with representatives of the Europeanflavour industry, trade associations and other bodies, a new list has been drawn upof all chemical substances currently in use, for flavourings, in the member coun-tries. This was published in the Official Journal of the EC on 27 March 1999. Theregister currently has in the region of 3000 entries for flavouring substances usedin or on foodstuffs. Work continues in assessing the level of health risk that may beassociated with these ingredients, with a view to limiting their use as necessary.
Food safety within the European Community is now the responsibility of the‘European Food Safety Authority’ (EFSA) which was established by the EuropeanParliament in 2002 to replace the ‘Scientific Committee for Food’ of the EU andother technical bodies such as the Committee of Toxicology (COT) in the UK.EFSA became fully operational by June 2003, its two main areas of work are RiskAssessment and Risk Communication. Existing as a separate legal entity its role isto provide the European Commission with independent scientific advice.
3.9.2 Flavourings in application
Flavourings for soft drinks are of two main types: water miscible and water dis-persible. Water-miscible flavourings are formulated to dissolve easily in water,forming a clear bright solution at dosages usually in the region of 0.1%. Theytypically contain mainly oxygenated, highly polar compounds. Water-dispersibleflavourings are, strictly speaking, ‘insoluble’, including in their make-up a relativelynon-polar oil phase, usually citrus, which conveys the characteristic zest-like contri-bution from the peel. This type of flavouring is introduced in the form of an emulsion,enabling oil-based flavouring substances to be incorporated in a soluble form.
3.9.3 Water-miscible flavourings
3.9.3.1 Flavouring mixturesRelatively simple mixtures of flavouring substances, carefully dispensed, are dis-persed/dissolved in a suitable carrier solvent system such as ethyl alcohol orpropylene glycol. Such mixtures tend to exhibit variation in sensory profile follow-ing the immediate blending operation, and a short period of maturation is necessaryto allow the flavouring to settle as the components may interact and stabilise. Theseinner workings reflect the reactive nature of the oxygenates responsible for the per-ception of flavour. Aldehydes, alcohols, esters, ketones, lactones, phenols, terpenederivatives and so on may interact to form a kind of equilibrium mixture containing,

Steen: “chap03” — 2006/4/27 — 19:39 — page 67 — #20
INGREDIENTS AND FORMULATION OF CARBONATED SOFT DRINKS 67
for example, acetals, ketals and additional ester types from interactions betweenalcohols and acids present in the original mix and also from transesterification reac-tions. Once it has settled, the new flavouring remains in a relatively stable conditionthroughout its allocated shelf life under recommended storage conditions.
3.9.3.2 Flavouring essenceAn essence is a traditional flavouring product prepared by washing a selected oilblend (predominately citrus oils) with an aqueous alcoholic solvent mixture (e.g.60% ethanol/40% water). The process is carried out under cool temperatures, forexample, 5–10◦C, either batch-wise or by counter-current extraction. It is an extrac-tion process in which the aqueous extract phase becomes the flavouring. The solubleoxygenated flavouring constituents present in the essential oil blend (e.g. citral inlemon oil) are effectively partitioned between the two phases of the mixture. The lowtemperatures employed ensure that the transfer of any oil into the hydro-alcoholicphase is minimised, as a poorly processed essence will tend to cloud when used inthe drink formulation.
Table 3.4 lists the components of a sample water-miscible flavouring. Initialmixing should be vigorous and thorough to establish a homogeneous state thaton settling and separating out will again form two layers, the lower of which isthe essence. The separation stage is critical in the traditional mix-and-settle batchmethod and may take several days to achieve. Counter-current processes involving,
Table 3.4 Example of a water-miscible flavouring – peachflavouring.
Vanillin 50.000SVR (ethyl alcohol 95%) 95.000Cinnamic aldehyde 0.225Terpinyl acetate 0.720Methyl anthranilate 0.720Linalyl acetate 0.940Benzaldehyde 1.200Oil of neroli bigarade 1.440Geraniol 2.820Oil of petitgrain, terpeneless 3.925Oil of petitgrain 4.000Amyl butyrate 4.800Amyl acetate 4.800Amyl valerate 9.000Amyl formate 10.800Ethyl hexanoate 10.800Ethyl valerate 26.400Aldehyde C14 75.000Propylene glycol (solvent) 600.000Water (solvent) 100.000
Note: Prepare mixture (in order shown), mixing well at each stage.Leave to stand for 24 h. Separate from an upper oil phase. Filter toproduce a clear, bright product.

Steen: “chap03” — 2006/4/27 — 19:39 — page 68 — #21
68 CARBONATED SOFT DRINKS
for example, the use of spinning disc or pulse column techniques do not involvethe same degree of pre-mixing and achieve separation in a shorter period of time.However, as they are continuous processes, it is essential to correctly size theplant required in order to maintain an adequate stock. Unlike the batch process,counter-current techniques cannot always easily accommodate a sudden escalationin product order.
3.9.3.3 Flavouring extractThe term ‘flavouring extract’ is usually applied to liquid extracts prepared by solventextraction of botanical materials, for example, vanilla pods and ginger root. Tra-ditionally, the process has been one of maceration, whereby the chopped, kibbledor ground botanical is loaded into a percolator column together with the chosensolvent system (usually ethyl alcohol/water combinations). The components areallowed to steep in the cold.
Periodically (e.g. daily) liquid is run off from the bottom of the percolator andreturned to the top. After a prescribed time, equilibrium is considered to have beenreached and the extract is drained off and replaced as necessary, with fresh solventto provide a combined extract to meet specifications. This may be used as it is orin combination with other flavours. This basic procedure of liquid/solid extractionhas been improved upon by a number of ingenious systems whereby, in most cases,the solvent is pumped through the botanical mass, using different techniques. If thesolvent is warmed, extraction time can be reduced considerably.
3.9.4 Water-dispersible flavourings
The important water-dispersible type of flavouring is more commonly referred toas an ‘emulsion’ and is designed to introduce oil-soluble flavouring substancesinto a beverage system. Emulsions can provide both flavour and cloud effects andare produced by the mechanical dispersion of an oil phase carrying the flavouringcomponents into an aqueous phase containing selected hydrocolloid materials.
A typical sequence used in emulsion manufacture is shown in Figure 3.3. In orderto achieve optimum product performance, great care is required at the mechanicalstage of emulsion manufacture, and the uniformity and size of droplets in the dis-persed oil phase are critical. If the emulsion is to be used to promote a stable cloudin the beverage and to maximise optical density then the ideal is a droplet of approx-imately 1–2 µm in diameter. Above this limit, and if the particle distribution curveis not strictly Gaussian, instability will occur as a result of the oil droplets coalesc-ing, and effects such as ‘clearing-up’, ‘clearing-down’, ‘ringing’ and ‘creaming’will be observed, sometimes within a few days and certainly on storage. If particleor droplet size remains uniform, stable emulsions can be produced with a particlesize average well below 1 µm (say, between 0.3 and 0.5 µm), but there will be areduced cloud effect (see Figure 3.4). This is not a problem when the dispersion isintended primarily for flavouring.

Steen: “chap03” — 2006/4/27 — 19:39 — page 69 — #22
INGREDIENTS AND FORMULATION OF CARBONATED SOFT DRINKS 69
Mix,warm to dissolve
Decant/filterDiscard sediment
High-shear stirrer(e.g. Silverson-type Turbo-head)
Citrus (e.g. orange) oilor terpenes
Typical sequence:
10 l
8–10 kg Ester gum or similar
Gum Arabic solution(e.g. 405 m/v)
Objective: uniform stable dispersionof oil in water phase. Droplet size to
be in the range 1–2 µm
Aqueous phase: Hydrocolloids, gum Arabic,used primarily in admix
with other gumsOil phase: Usually citrus-oil-based with ‘weighting agent’: Brominated vegetable oil (restricted use, not permitted in the UK) Ester gum Gum elemi Gum damar SAIB Sucrose acetate isobutyrate Beeswax
Allow to settle
Pre-mix
Fill-out
Homogenise under specific conditions(e.g. 2 passes at 2000 psi)
Figure 3.3 Cloud and flavour emulsions.
Mechanical parameters are important, but they are not the only area of control.Selecting the correct mix of stabiliser components is also critical. Beverage emul-sions are essentially different from food emulsions. Their application in a mobile,liquid phase at concentrations in the region of 0.1% results in the formation of auniform dispersion of the component droplets. In order to be stable and to avoid theeffects mentioned in the previous paragraph, these must remain separate from eachother and must not interact with other components of the beverage formulation. Forexample, should another emulsion be present (say, a β-carotene colour emulsion),the likely differences in particle size will result in a tendency for mutual attraction,with resulting instability.
Oil phase: Oil-phase components comprise the base oil (usually citrus asorange/lemon oils or terpenes) and a suitable dissolved cloudifying/stabiliser agentsuch as ester gum or the glyceryl ester of wood rosin (E445), gum damar, gum

Steen: “chap03” — 2006/4/27 — 19:39 — page 70 — #23
70 CARBONATED SOFT DRINKS
1.0 1.5 2.0
Target zonefor stability
Ineffectivehomogenisation: unstabledistribution profile
20.03.0
Droplet diameter (µm)
Con
cent
ratio
n
5.0 10.0
Figure 3.4 Particle distribution in emulsions.
elemi, sucrose acetate isobutyrate (SAIB) (E444) or beeswax (propolis) (E901).Legislation governing the use of cloudifying agents varies throughout the world,with the most regulated areas being the USA and the EU. Currently, ester gum andSAIB are permitted for use in non-alcoholic cloudy drinks under European law,whereas beeswax is limited to use as a glazing agent for confectionery or in certaincolouring materials. Ester gum is permitted in the USA, whereas SAIB is not. Thegum exudates, damar and elemi, are effective cloudifiers, but their use is subject tonational interpretation and practice. Of the two, gum damar is the more interestingas it is the only truly naturally sourced cloudifying/stabilising agent of any con-sequence. Propolis is also used successfully in certain applications, although likedamar it is not officially recognised in Europe or America.
Ester gum is produced by the action of glycerol on pinewood rosin to produceits esterified form, a mixture of di- and tri-glycerides, then purified by a process ofsteam-stripping in order to de-aromatise it, providing an odourless, tasteless, gumof m.p. 80–90◦C. SAIB is produced by controlled esterification of sucrose usingacetic and isobutyric acid anhydrides, and its composition consequently dependson reaction conditions.
Water phase: The water phase is, of course, complementary to the oil phase in thatits hydrocolloidal components tend to provide a protective buffer zone around eachoil droplet. One theory is that the polymeric molecules of the hydrocolloid are drawnto the oil–water interface by charge effects promoted by the oil-soluble cloudifiercomponents referred to above. These micelles exhibit a composite charge, repellingneighbouring micelles of similar charge to prevent coalescence and maintain a stablesystem.

Steen: “chap03” — 2006/4/27 — 19:39 — page 71 — #24
INGREDIENTS AND FORMULATION OF CARBONATED SOFT DRINKS 71
Of the many water-soluble polymers that can act in this manner as emulsifyingagents, the most regularly used are gum acacia (also referred to as gum Arabic)and the modified starches. Gum acacia has been employed for many years as anemulsifier in beverage emulsions. Unlike other vegetable gums (e.g. tragacanth,guar) it has the advantage that it can remain relatively mobile in aqueous solutionat concentrations of 30% m/m and above. The gum is obtained as the exudationfrom selected species of acacia. Upwards of 500 species of acacia are to be foundover Africa, Asia, Australia and Central America, but only the varieties grown inAfrica are of commercial interest. Of these, Acacia senegal and A. seyal are themost important. It is A. senegal that is the accepted standard for beverages. Thetwo species are grown widely in a broad band of countries across west Africathrough to Sudan and Ethiopia. The gum tears are hand picked and sorted by localpeople and transferred to central agencies for grading and distribution on the worldmarkets. Apart from raw form and physical quality, the main feature differentiatingthe two species is the optical rotation. A. senegal is laevo-rotatory, with a specificoptical rotation of −25 to −35◦ whereas A. seyal is dextro-rotatory, with a specificoptical rotation of +30 to +45◦. Gum acacia is a complex polysaccharide withprotein groupings. The level of protein present is thought to be a major factor in itsfavourable performance as a beverage emulsifier. It has not been unusual for blendsof the two types to be offered to the beverage industry as gum Arabic arrangedso that the optical rotation would be always laevo-rotatory but falling short ofthe optimum required purity. The purity specification issued by JECFA (the JointFAO/WHO Expert Committee on Food Additives, 1995) refers to gum Arabic asthe ‘dried exudation from stems and branches of Acacia Senegal (L.) Willdenowor closely related species of Acacia (fam. Leguminosae)’. An earlier reference(JECFA, 1990) to the use of specific rotation and nitrogen content as purity criteriahas been dropped, which facilitates the use of mixtures of different acacia gumsunder the description ‘gum Arabic’.
As with all natural products, the quality and harvest yields of gum Arabic aresubject to climatic conditions. In addition, in Sudan and Ethiopia availability hasalso been affected by political factors. Since 1984 prices have shown major fluc-tuation and, at times, have been far higher than those of other polysaccharides.Because of this, the starch industry has made great efforts to develop replacements.Perhaps the most successful, to date, have been the starch sodium octenylsuccinates,where native starches have been modified by substitution with 1-octasuccinic anhy-dride (OSA). The introduction of a hydrophobic grouping onto the starch polymerresults in highly effective emulsion-stabilising properties. The conditions duringmanufacture can be controlled to give some variety in performance to the rangeof modified starches available, but in general a key attribute is the low viscosityof their aqueous solutions, which can enhance the formation of uniform dropletsduring the homogenisation stage of emulsion manufacture. Typical concentrationsof the OSA starches used for beverage emulsions are approximately 10–12%.Starch octenylsuccinates are registered as E1450 under European legislation andare generally permitted additives under Annex 1 of Directive 95/2/EC.

Steen: “chap03” — 2006/4/27 — 19:39 — page 72 — #25
72 CARBONATED SOFT DRINKS
3.9.4.1 Brominated vegetable oil (BVO) emulsionsThis section is included more for academic than practical interest as the use ofbrominated oils has been severely restricted under European legislation over thepast twenty years, although until comparatively recently brominated oils werein use in India and parts of Asia. The term ‘weighted’ is frequently used whendescribing the oil phase, alluding to the early use of BVO to adjust the den-sity of the oil phase in order to stabilise the dispersion in ready-to-drink (RTD)beverages.
The reaction of bromine with vegetable oils, such as peanut or maize oil, involvesthe addition of bromine atoms at the unsaturated double-bond sites of the oil toproduce a progressive increase in the molecular weight and hence the density, whichmay thereby be easily adjusted to a predetermined value. Densities in the range of1.24–1.4 are usually achieved. For example, the density of an oil phase comprising‘folded’ orange oil can be adjusted from 0.875 up to, say, 1.03 by the addition ofbrominated oil, placing it in the density region of the target beverage and henceensuring a stable system. The amount of weighting oil required can be calculatedfollowing the method devised by Pearson:
1. Write the target gravity of the finished beverage in the centre of a square.2. Enter the specific gravities of the essential oil and weighting oil in the upper
and lower left-hand corners, respectively.3. Subtract the larger from the smaller number on each diagonal and place the
resulting difference (omitting the decimal point) in the empty right-handcorner, giving the volume ratio required.
In Figure 3.5, for example, 475 parts by volume of the oil mix will comprise 320parts citrus oil plus 155 parts of the weighting oil, giving a gravity of 1.030, identicalto that of the finished beverage.
0.875
Specificgravity
Flavour oil(citrus)
Weighting oil(brominated)
RequiredRTD
gravity
Volumerequired
(ml)
320
1.350 155
(475)
1.030
Figure 3.5 Example of the use of weighting oil.

Steen: “chap03” — 2006/4/27 — 19:39 — page 73 — #26
INGREDIENTS AND FORMULATION OF CARBONATED SOFT DRINKS 73
3.10 Colours
Those of us fortunate enough to be able to distinguish a variety of colours willappreciate the influence that this sensory dimension exercises on our judgementin matters important to our well-being, such as food and drink. The perception ofcolour influences the taster’s reception of a drink, and thus colouring is inevitablycontroversial. One point of view states that colours, which possess no measurablenutritional value, can have no role in food or drink other than that of deceiving theconsumer. To a certain extent this is true, but to appreciate the full value of colouras a food additive, or more specifically as a soft drink additive, it is necessary toappreciate the synergy between the sensory responses of sight and taste.
Colour provides a means of correctly presenting a beverage to the consumerso that the perceived organoleptic attributes are correctly ordered in a sequence ofappreciation. Both quality and quantity of colour are of importance, and certaincolours will evoke, or perhaps complement, a particular taste. Reds will favourthe fruitiness of soft drinks, for example, blackcurrant, raspberry and strawberry.Orange and yellow tend towards the citrus flavours. Greens and blues reflect thecharacter of peppermints, spearmint and cool flavours, sometimes herb-like and bal-samic, and the browns align with the heavier flavours, for example, colas, shandiesand dandelion and burdock. Therefore, the deceit, if it can be so termed, is aimed atensuring the consumer is able to maximise the enjoyment of the beverage concerned.
When a soft drink is based in part on fruit juices, it may be necessary to restore theappearance of the juice if its natural colours have been destroyed by heat processingor to intensify the colour when the contribution from the juice is weaker than thatnormally associated with the effect the compounded drink is intended to convey.Colour adjustment may also be necessary to ensure uniformity of product and tooffset natural variations in colour tone and intensity associated with the juice typeemployed in the beverage formulation.
Above all, colour is a major parameter in the assessment of quality, serving at thetime of production to standardise the product. It can also provide useful informationabout quality changes during storage, such as colour deterioration resulting fromtemperature fluctuations or microbial spoilage effects.
The use of food colours is carefully controlled under various pieces of legis-lation. There is at present no universal listing of colours for soft drinks, and it isnecessary to investigate the permitted list to ensure compliance for goods to bemanufactured in, or exported to, a specific country.
Both the EU and the FDA have published lists that are regularly reviewed. Mostconcern has been expressed over the use of azo colours, to which some people havean allergic reaction – most frequently to sunset yellow (E110, FD&C yellow no. 6)and tartrazine (E102, FD&C yellow no. 5).
Although a number of food colours are suitable for use in soft drinks, it should beappreciated that the contribution of any one of these cannot be entirely predictable.In any soft drink formulation the colour component, as with all other ingredients,has to be carefully selected for its performance in the presence of certain acids,

Steen: “chap03” — 2006/4/27 — 19:39 — page 74 — #27
74 CARBONATED SOFT DRINKS
flavourings, antioxidants and even preservatives. It is essential, therefore, at allstages of development that meaningful storage trials are completed to ascertain thereal contribution from colour in the newly finished beverage.
Food colours are broadly divided into two classes: natural (Table 3.5) andartificial. In the USA these are listed as either ‘exempt from certification’ or ‘cer-tified colourants’. The natural colours are botanical extracts, with the exception ofcarmine (a red colour), which should perhaps be termed an entomological extract asit is obtained from the insect Dactilopius coccus, or cochineal beetle, which breedsand feeds on particular cacti indigenous to Central America (Table 3.6).
Table 3.5 Permitted food colourings derived from natural sources (EU Directive 94/36/EC).
Colour Sources Shade E-no. Stability
Light Heat
Anthocyanins Grape skins, elderberry,red cabbage, hibiscus
Red–purple–blue,pH dependent
E163 Good Good
Water soluble; natural indicators; red in acidic solutions (most stable) and bluer as pH increases
Beetroot Red Red beetroot(Beta vulgaris)
Pink to red E162 Poor Poor
Water soluble; limited stability to heat, light and oxidation; most stable between pH 3.5 and 5
Carmine Cochineal insect(Dactilopius coccus)
Strawberry red,orange/red hues
E120 Excellent Excellent
Soluble in alkaline waters, solubility decreasing with lowering of pH; will precipitate below pH 3
Annatto Seeds of annatto shrub(Bixa orellana)
Orange E160(b) Fair Good
Bixin is oil soluble and frequently used for beverages in the form of an emulsion; norbixin is watersoluble in alkaline conditions and will precipitate in acid pH; versions stabilised to about pH 3are available
Beta-carotene Carrots, algae, palm,synthesised
Yellow toorange
E160(a) Fair Good
Oil soluble; colour sensitive to oxidation; shade varies with concentration; water-dispersibleversions available
Paprika Red pepper(Capsicum annum)
Orange to red E160(c) Fair Good
Oil soluble; sensitive to oxidation; water-dispersible versions available
Lutein Aztec marigold(Tagetes erecta)
Yellow E161(b) Good Good
Oil soluble; egg-yellow colour; good stability; the xanthophyll lutein is a carotenoid colour whichoccurs in green leaves, vegetables, eggs and some flowers
Curcumin Turmeric (rhizomes ofCurcuma longa)
Yellow E100 Poor Good
The purified colour, curcumin, is not water soluble, but water-dispersible systems are available
Chlorophylls Green-leafed plants Green E140; E141 Poor; Good Poor; GoodNatural chlorophyll (E140) is oil soluble, but water-dispersible forms are available; copper
chlorophylls (E141), effectively chemical modified natural extracts, are water soluble
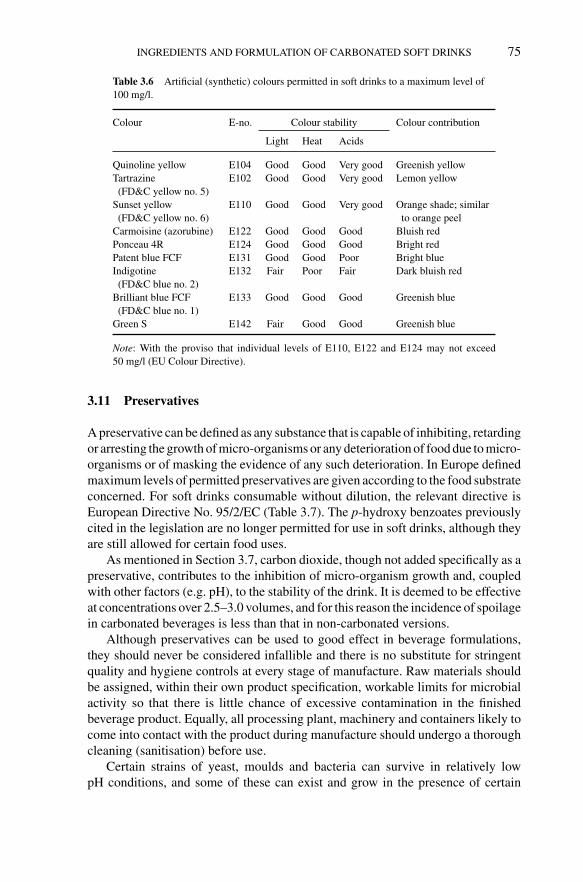
Steen: “chap03” — 2006/4/27 — 19:39 — page 75 — #28
INGREDIENTS AND FORMULATION OF CARBONATED SOFT DRINKS 75
Table 3.6 Artificial (synthetic) colours permitted in soft drinks to a maximum level of100 mg/l.
Colour E-no. Colour stability Colour contribution
Light Heat Acids
Quinoline yellow E104 Good Good Very good Greenish yellowTartrazine
(FD&C yellow no. 5)E102 Good Good Very good Lemon yellow
Sunset yellow(FD&C yellow no. 6)
E110 Good Good Very good Orange shade; similarto orange peel
Carmoisine (azorubine) E122 Good Good Good Bluish redPonceau 4R E124 Good Good Good Bright redPatent blue FCF E131 Good Good Poor Bright blueIndigotine
(FD&C blue no. 2)E132 Fair Poor Fair Dark bluish red
Brilliant blue FCF(FD&C blue no. 1)
E133 Good Good Good Greenish blue
Green S E142 Fair Good Good Greenish blue
Note: With the proviso that individual levels of E110, E122 and E124 may not exceed50 mg/l (EU Colour Directive).
3.11 Preservatives
A preservative can be defined as any substance that is capable of inhibiting, retardingor arresting the growth of micro-organisms or any deterioration of food due to micro-organisms or of masking the evidence of any such deterioration. In Europe definedmaximum levels of permitted preservatives are given according to the food substrateconcerned. For soft drinks consumable without dilution, the relevant directive isEuropean Directive No. 95/2/EC (Table 3.7). The p-hydroxy benzoates previouslycited in the legislation are no longer permitted for use in soft drinks, although theyare still allowed for certain food uses.
As mentioned in Section 3.7, carbon dioxide, though not added specifically as apreservative, contributes to the inhibition of micro-organism growth and, coupledwith other factors (e.g. pH), to the stability of the drink. It is deemed to be effectiveat concentrations over 2.5–3.0 volumes, and for this reason the incidence of spoilagein carbonated beverages is less than that in non-carbonated versions.
Although preservatives can be used to good effect in beverage formulations,they should never be considered infallible and there is no substitute for stringentquality and hygiene controls at every stage of manufacture. Raw materials shouldbe assigned, within their own product specification, workable limits for microbialactivity so that there is little chance of excessive contamination in the finishedbeverage product. Equally, all processing plant, machinery and containers likely tocome into contact with the product during manufacture should undergo a thoroughcleaning (sanitisation) before use.
Certain strains of yeast, moulds and bacteria can survive in relatively lowpH conditions, and some of these can exist and grow in the presence of certain
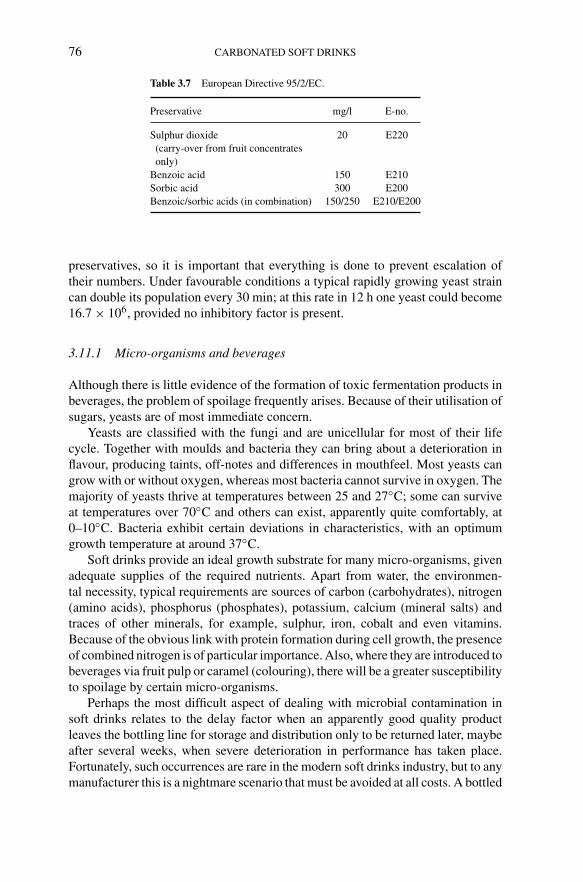
Steen: “chap03” — 2006/4/27 — 19:39 — page 76 — #29
76 CARBONATED SOFT DRINKS
Table 3.7 European Directive 95/2/EC.
Preservative mg/l E-no.
Sulphur dioxide(carry-over from fruit concentratesonly)
20 E220
Benzoic acid 150 E210Sorbic acid 300 E200Benzoic/sorbic acids (in combination) 150/250 E210/E200
preservatives, so it is important that everything is done to prevent escalation oftheir numbers. Under favourable conditions a typical rapidly growing yeast straincan double its population every 30 min; at this rate in 12 h one yeast could become16.7 × 106, provided no inhibitory factor is present.
3.11.1 Micro-organisms and beverages
Although there is little evidence of the formation of toxic fermentation products inbeverages, the problem of spoilage frequently arises. Because of their utilisation ofsugars, yeasts are of most immediate concern.
Yeasts are classified with the fungi and are unicellular for most of their lifecycle. Together with moulds and bacteria they can bring about a deterioration inflavour, producing taints, off-notes and differences in mouthfeel. Most yeasts cangrow with or without oxygen, whereas most bacteria cannot survive in oxygen. Themajority of yeasts thrive at temperatures between 25 and 27◦C; some can surviveat temperatures over 70◦C and others can exist, apparently quite comfortably, at0–10◦C. Bacteria exhibit certain deviations in characteristics, with an optimumgrowth temperature at around 37◦C.
Soft drinks provide an ideal growth substrate for many micro-organisms, givenadequate supplies of the required nutrients. Apart from water, the environmen-tal necessity, typical requirements are sources of carbon (carbohydrates), nitrogen(amino acids), phosphorus (phosphates), potassium, calcium (mineral salts) andtraces of other minerals, for example, sulphur, iron, cobalt and even vitamins.Because of the obvious link with protein formation during cell growth, the presenceof combined nitrogen is of particular importance. Also, where they are introduced tobeverages via fruit pulp or caramel (colouring), there will be a greater susceptibilityto spoilage by certain micro-organisms.
Perhaps the most difficult aspect of dealing with microbial contamination insoft drinks relates to the delay factor when an apparently good quality productleaves the bottling line for storage and distribution only to be returned later, maybeafter several weeks, when severe deterioration in performance has taken place.Fortunately, such occurrences are rare in the modern soft drinks industry, but to anymanufacturer this is a nightmare scenario that must be avoided at all costs. A bottled

Steen: “chap03” — 2006/4/27 — 19:39 — page 77 — #30
INGREDIENTS AND FORMULATION OF CARBONATED SOFT DRINKS 77
drink constitutes a unique system, which can inhibit or enhance the growth ofmicro-organisms. Micro-flora, if present, will enter a dormant stage during whichtheir chances of survival are assessed in relation to the immediate surroundings.Following this ‘lag’ stage, during which specific micro-flora may adapt to theirnew environment and start to grow, there is a burst of species-dependent activity,during which the population doubles repeatedly at a steady rate. As a bottled drinkis a ‘closed’ system, waste products and diminishing nutrients will serve to slowdown the growth and eventually bring it to a standstill, at which point the deathrate increases and all activity stops. Although the product is perhaps not a healthhazard, it has been spoiled and can no longer satisfy its intended function.
3.11.2 Sulphur dioxide
Because of its ease of production, gaseous SO2 was one of the first chemical com-pounds manufactured and used by human beings. In early times it was used as apreservative by burning sulphur prior to sealing wine into barrels or storage jars. Itis one of the most versatile agents used in food preservation and is well known forits microbiocidal effect on bacteria, moulds and yeasts. Nowadays it is generallyemployed in the form of a sulphur-dioxide-generating salt (Table 3.8). For example,sodium metabisulphite is converted in acid medium:
Na2S2O5 + H2O → 2NaHSO3(190)
2NaHSO3 + 2H+ → 2Na+ + 2H2O + 2SO22 × (64)
that is, 190 parts of the metabisulphite produce 128 parts SO2.
Table 3.8 Preservatives and their salts.
Preservative E-no. Alternative form used at equivalent level E-no.
Benzoic acid (m.p. 122◦C)C6H5COOHBenzene carboxylic acid
E210 Sodium benzoatePotassium benzoateCalcium benzoate
E211E212E213
Sorbic acid (m.p. 133◦C)CH3CH=CH2–CH2=CHCOOH2,4-hexadienoic acid
E200 Sodium sorbatePotassium sorbateCalcium sorbate
E201E202E203
Sulphur dioxide (gas)SO2Sulphurous anhydride
E220 Sodium sulphiteSodium hydrogen sulphite,
sodium bisulphiteSodium metabisulphitePotassium metabisulphiteCalcium sulphiteCalcium hydrogen sulphite,
calcium bisulphitePotassium bisulphite
E221E222
E223E224E226E227
E228
Steen: “chap03” — 2006/4/27 — 19:39 — page 78 — #31
78 CARBONATED SOFT DRINKS
The microbiocidal effect increases as the pH falls below 4.0 and, because ofthis, SO2 is ideally suited for most soft drinks formulations. However, its preservingaction is impaired by a tendency to react with many fruit components of soft drinksto form organic sulphites, in which state the SO2 is said to be ‘bound’. Althoughthe preservative properties are mainly due to free SO2, it is necessary to analyse fortotal SO2 (i.e. free plus bound) as legislation for safe working requirements refersonly to maximum total concentrations.
Although SO2 is used to good effect in the preservation of concentrated cit-rus juices, with typical concentrations of 1000–2000 ppm m/v, it is now limitedunder European legislation to no more than 20 ppm in non-alcoholic flavoureddrinks containing fruit juice, and only as carry-over from concentrates (95/2/EC;see Table 3.7). A number of specific drink products under the same legislationare permitted to have higher levels (e.g. concentrates/dilutables based on fruitjuice and containing not less than 2.5% barley [barley water]), but for the major-ity this much-reduced limit (previously set at 70 ppm) clearly emphasises theimportance of improved manufacturing practices in terms of plant hygiene. JECFAhas recommended an acceptable daily intake of not more than 0.7 mg/kg bodyweight for SO2.
Disadvantages associated with SO2 are that some people can detect it as anunpleasant backnote or taint and that it can provoke allergic reactions. Asthma suf-ferers tend to be susceptible to the effect of gaseous SO2, small traces of which canpromote an asthmatic attack, and foods containing sulphites can have an associatedrisk of gas liberation when they are swallowed.
3.11.3 Benzoic acid and benzoates
Benzoic acid occurs naturally in some fruits and vegetables – notably in cranberries,where it occurs in amounts of the order of 0.08% m/m (Fellers and Esselen, 1955).It is also found in some resins, chiefly in gum benzoin (from Styrax benzoia) and incoal tar. Commercially available benzoic acid is produced by chemical synthesis.
Pure benzoic acid is a white powdery crystalline solid (m.p. 122◦C) only spar-ingly soluble in water at normal temperatures. Because of this it is added to thedrink in the soluble form of its sodium or potassium salts. It is normal practice tocompletely disperse the benzoate during batch make-up before the acid componentis added (resulting in pH reduction) to avoid localised precipitation of the free ben-zoic acid owing to its solubility having been exceeded (the solubility of benzoicacid = 0.35% m/v at 20◦C). It is the free or undissociated form of benzoic acid thatexhibits preservative action and hence its use is only effective at low pH values,ideally below pH 3, where the degree of dissociation reduces to below 10%.
Benzoic acid is generally considered to exhibit an inhibitory effect on microbialgrowth. Improved synergistic results are obtained when it is used in conjunc-tion with other preservatives, for example, SO2 or sorbic acid. It is interestingto note that the current European directive, which expresses individual limits of300 mg/l for sorbic and 150 mg/l for benzoic acids in non-alcoholic flavoured

Steen: “chap03” — 2006/4/27 — 19:39 — page 79 — #32
INGREDIENTS AND FORMULATION OF CARBONATED SOFT DRINKS 79
drinks, nevertheless permits a joint preservative use of up to 250 mg/l sorbic acidwith 150 mg/l benzoic acid.
Allergic reactions to benzoic acid have been reported, particularly among chil-dren known to be hyperactive in response to other agents, for example, tartrazine.The maximum ADI for benzoic acid, recommended by JECFA, is 5 mg/kg bodyweight.
3.11.4 Sorbic acid and sorbates
Sorbic acid is found naturally in a number of fruits and vegetables – notably inthe juice of unripe mountain ash berries (from Sorbus aucuparia), where it occurstogether with malic acid. Sorbic acid and its salts are among the most widely usedpreservatives in the world. In soft drinks the most commonly used form is potassiumsorbate because, as with benzoic acid, there are problems in preparing its solution(the solubility of sorbic acid = 0.16% m/v at 20◦C). In common with benzoic acid,as a microbial inhibitor, sorbic acid and its sorbates show reduced effectivenesswith increased pH. Although activity is greatest at low pH values, sorbates have theadvantage of being effective at pH values as high as 6.0–6.5, in contrast to benzoicacid, for which the comparative range is pH 4.0–4.5. The undissociated form, aswith benzoic acid, is primarily responsible for its preservative action.
In the USA sorbates are classified as GRAS and have maximum permissiblelevels in various foods of 0.05–0.3%. The EU permits levels within the range0.015–0.2%, although in soft drinks the limit is 0.03% (300 ppm m/v). In additionto being less toxic than benzoates, sorbates seem to be less obtrusive in terms oftaste detection by certain individuals and allergenic reactions. Overall, sorbates areconsidered to be among the safest food preservatives in use and WHO has set theADI for sorbate at 25 mg/kg body weight.
3.12 More functional ingredients
The functionality of the ingredients already discussed tends to contribute self-evidently to the main identity of the drink. Apart from the preservatives, theseingredients are used primarily for taste and colour. Other ingredients also serve toimprove performance and further characterise the drink.
3.12.1 Stabilisers
Stabilisers have been mentioned in the context of the production of water-dispersibleflavourings and emulsion-based cloudifying systems. In addition to contributing tooverall stability, such additives are also used, where appropriate, in soft drink formu-lations to impart stability to natural clouds, for example, dispersions of fruit solids,and to improve mouthfeel characteristics by increasing the viscosity of the drink.
Under European legislation there are more than 50 E-coded materials with sta-bilising properties for food use, although perhaps no more than 10 are used on a

Steen: “chap03” — 2006/4/27 — 19:39 — page 80 — #33
80 CARBONATED SOFT DRINKS
regular basis in soft drinks formulations. These include the alginates, carrageens,vegetable gums, pectin, acacia, guar, tragacanth, xanthan and carboxy methyl cellu-lose. Also included, under number E999, is extract of quillaia, which is specificallypermitted in soft drinks and, apart from its use as an emulsifier, is valued for itsheading properties.
3.12.2 Saponins
The saponins occur in the roots of many plants, notably the genus Saponaria. Thename derives from the Latin sapo, meaning soap, because of the lather-like reactionthat occurs when parts of these plants are soaked in warm water. This ability togenerate foams is useful in beverages such as ginger beer, shandy, cream soda andcola formulations to improve and standardise heading foam characteristics.
Saponins for beverage use are sourced from quillaia bark (Quillaia saponariaMolina) and the yuccas. Of the latter species, two main varieties are used in theUSA for production of the water extract: the Mohave yucca (Yucca mohavensis)and the Joshua tree (Y. brevifolia).
The effect of saponins in beverages is to create a very stable foam, and at thelevels used they are colourless and tasteless. The dried extract, however, possessesan acrid, astringent taste. Permitted limits are quoted in terms of the dry weight ofthe extract. In Europe, subject to Directive 95/2/EC, quillaia is permitted only innon-alcoholic drinks, to a maximum level of 200 mg/l.
3.12.3 Antioxidants
Perhaps the most common problems encountered during storage are the oxidationeffects involving certain ingredients of a drink. Both flavour and colour componentscan be subject to deterioration in the presence of dissolved oxygen to the detrimentof the product. Antioxidants are therefore included in those formulations containingingredients most vulnerable to oxidation. Oxidation can frequently be attributed tothe oxygen permeability of the plastic materials used in container manufacture, butit is essential that the oxidation process should not start at the production stageof the drink or with any of its ingredients. Citrus-flavoured drinks, notably lemondrinks, are frequently susceptible to oxidation, and so antioxidants may feature intheir formulation.
Oil-based, water-dispersible flavours (emulsions) are protected by the additionof oil-soluble antioxidants such as BHA and BHT to the oil phase before the emul-sification process. The typical usage level in essential oils is 1000 mg/l, and asthe flavour emulsion will be used at the rate of approximately 0.1%, the level ofantioxidant in the finished beverage will be of the order of 1 mg/l, which will safelycomply with an ADI of 5 mg/kg body weight for either additive.
Increasingly, greater use is being made of natural and nature-identical antiox-idants as in many countries use of BHA and BHT continues to be restricted onhealth grounds. Ascorbyl palmitate (6-O-palmitoyl-l-ascorbic acid) and its sodium

Steen: “chap03” — 2006/4/27 — 19:39 — page 81 — #34
INGREDIENTS AND FORMULATION OF CARBONATED SOFT DRINKS 81
and calcium salts, natural extracts rich in tocopherols (vacuum-distilled from soyabean oil, wheat germ, rice germ, cottonseed oil, etc.) and synthetic alpha-, gamma-and delta-tocopherols are used to good effect in preventing oxidative deteriora-tion in oil-based systems. In combination, ascorbyl palmitate and alpha-tocopherol(vitamin E) synergise to exhibit enhanced antioxidant properties.
3.12.4 Calcium disodium EDTA
Calcium disodium EDTA, a mixed salt of ethylene diamine tetraacetic acid, isprepared by reacting the acid with a mixture of calcium and sodium hydroxides. Itacts as a sequestrant by a binding action that removes traces of metal ions from rawmaterials or process water. These metals (e.g. iron) can destabilise the beverage bytheir tendency to catalyse degradation of flavouring components, causing oxidationand off-notes. Their removal serves to maintain stability of the products duringstorage and to increase shelf life.
Under European Directive 95/2/EC, calcium disodium EDTA is permitted onlyin a limited number of foods, including some canned and bottled products, withmaximum levels specified in each case. In the USA (Code of Federal Regulations),it is permitted to a level of 33 ppm in canned carbonated soft drinks, to promoteflavour retention.
3.13 Retrospective investigation of a soft drink
Having considered many of the ingredients used in the preparation of a soft drink, itis now appropriate to look behind the label of a product that contains at least someof the materials reviewed. This will demonstrate how the various parts comple-ment each other. The product to be considered is a notional low-calorie pineappleand grapefruit crush. The term ‘crush’, although no longer falling under any legaldefinition (the 1964 UK Soft Drinks Regulations required a minimum of 5% v/vas single-strength juice), is generally accepted to refer to a carbonated drink con-taining natural fruit juice. The label on this product might carry the followingdescription:
Sparkling low-calorie pineapple and grapefruit crush
and its ingredients panel would be presented in one of the following ways, orpossibly as a combination of both:
Ingredients: Carbonated water. Concentrated fruit juices (pineapple, grapefruit) (5% when reconsti-tuted). Citric acid. Acidity regulator (sodium citrate). Artificial sweeteners (aspartame, saccharin).Flavourings. Preservative (sodium benzoate). Antioxidants (ascorbic acid, ascorbyl palmitate).Colour (lutein).
Ingredients: Carbonated water. Concentrated fruit juices (pineapple, grapefruit) (5% when recon-stituted). Citric acid (E330). Acidity regulator (E331). Artificial sweeteners (aspartame, saccharin)(E951, E954). Flavourings. Preservative (E211). Antioxidants (E300, E304). Colour (E161b).
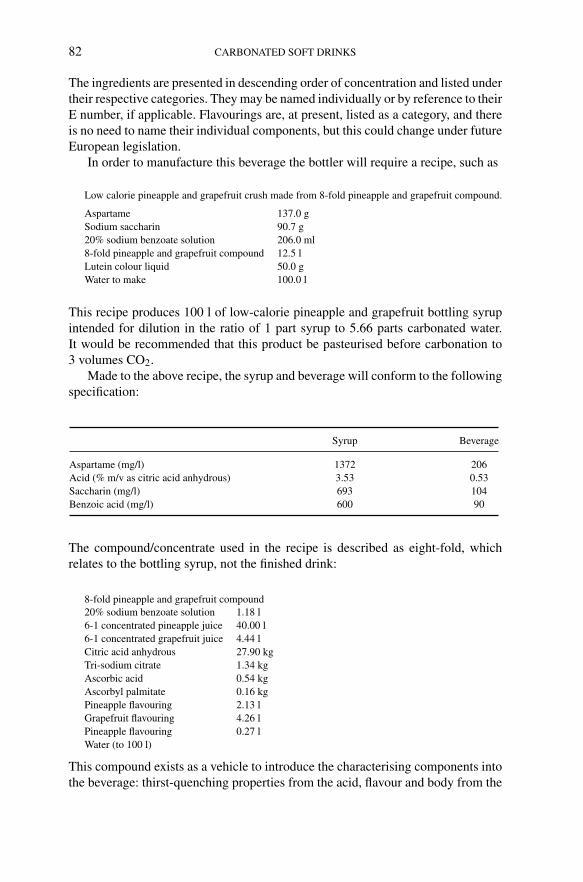
Steen: “chap03” — 2006/4/27 — 19:39 — page 82 — #35
82 CARBONATED SOFT DRINKS
The ingredients are presented in descending order of concentration and listed undertheir respective categories. They may be named individually or by reference to theirE number, if applicable. Flavourings are, at present, listed as a category, and thereis no need to name their individual components, but this could change under futureEuropean legislation.
In order to manufacture this beverage the bottler will require a recipe, such as
Low calorie pineapple and grapefruit crush made from 8-fold pineapple and grapefruit compound.
Aspartame 137.0 gSodium saccharin 90.7 g20% sodium benzoate solution 206.0 ml8-fold pineapple and grapefruit compound 12.5 lLutein colour liquid 50.0 gWater to make 100.0 l
This recipe produces 100 l of low-calorie pineapple and grapefruit bottling syrupintended for dilution in the ratio of 1 part syrup to 5.66 parts carbonated water.It would be recommended that this product be pasteurised before carbonation to3 volumes CO2.
Made to the above recipe, the syrup and beverage will conform to the followingspecification:
Syrup Beverage
Aspartame (mg/l) 1372 206Acid (% m/v as citric acid anhydrous) 3.53 0.53Saccharin (mg/l) 693 104Benzoic acid (mg/l) 600 90
The compound/concentrate used in the recipe is described as eight-fold, whichrelates to the bottling syrup, not the finished drink:
8-fold pineapple and grapefruit compound20% sodium benzoate solution 1.18 l6-1 concentrated pineapple juice 40.00 l6-1 concentrated grapefruit juice 4.44 lCitric acid anhydrous 27.90 kgTri-sodium citrate 1.34 kgAscorbic acid 0.54 kgAscorbyl palmitate 0.16 kgPineapple flavouring 2.13 lGrapefruit flavouring 4.26 lPineapple flavouring 0.27 lWater (to 100 l)
This compound exists as a vehicle to introduce the characterising components intothe beverage: thirst-quenching properties from the acid, flavour and body from the

Steen: “chap03” — 2006/4/27 — 19:39 — page 83 — #36
INGREDIENTS AND FORMULATION OF CARBONATED SOFT DRINKS 83
juice (also contributing to mouthfeel). A major part of the identity of the final drinkis provided by the flavouring ingredients. In order to stabilise and protect these, oil-and water-soluble antioxidants are included.
The exact quantities of flavouring materials can be determined from thefollowing ingredient formulae:
Flavourings Active flavour components (l)
Pineapple flavouring (2.13 l)Ingredients:
Pineapple esters 200-foldcomprising approximately 90% water 0.21
Pineapple flavouring (0.27 l)Ingredients:
Lemon oil, terpeneless 1Sweet orange oil 12-1 2Ethyl caproate 10Isoamyl butyrate 14Allyl caproate 18Ethyl butyrate 59Ethyl propionate 53Glycerol 48Water 232Ethanol (SVR) 563
1000 0.04
Grapefruit flavouring (4.26 l)Ingredients:
Cedarwood oil (10% in isopropyl alcohol) 212/1 concentrated grapefruit oil 44/1 concentrated grape oil 5Lemon essence oil 85/1 concentrated grapefruit 15Grape oil Israeli 20Grapefruit essence oil 48Isopropanol (food grade) 898
1000 0.43
Active flavouring components:Total 0.68
Thus 100 l of the eight-fold pineapple and grapefruit compound containsno more than 0.68 l of flavouring materials. This is used in the bottling syrupat 12.5% v/v, which is diluted 1 part syrup to 5.66 parts carbonated water toprovide the finished drink. The effective flavour dosage rate is given by theproduct of the two dilution factors, that is, 8 × 6.66 = 53.28 times, and thereal concentration of flavouring materials at RTD beverage strength is therefore0.68÷53.28 = 0.0128% v/v or, as it is more frequently expressed in the flavouring
Steen: “chap03” — 2006/4/27 — 19:39 — page 84 — #37
84 CARBONATED SOFT DRINKS
industry, 128 ppm. This is quite a modest input for the level of flavour impact it isable to generate.
3.14 Food safety
Food has always been of major interest to human beings. Although its primaryfunction is survival, it now has additional connotations of health, enjoyment andacceptability. Today’s consumer looks to suppliers and manufacturers for a productwith no associated consumption risk that is marketed in accordance with strictobservance of the laws governing food safety.
Although microbial contamination is always a concern with respect to foodalone, it is much less of a potential hazard for beverages, where the lower pHconditions make the survival of pathogenic species virtually impossible and thelikelihood of food poisoning equally remote. In addition, any attack from, say,yeasts and moulds would manifest itself as spoilage and be easily detectable eithervisually or organoleptically well before any lasting danger could be done. However,to be assured of complete safety it is necessary to look further, below the superficialand into the actual ingredient make-up of the drink itself.
The safety of food additives and other ingredients is monitored according toguidelines issued by the joint committee of JECFA, WHO and the FAO. Knowledgeof health safety is gained primarily as a result of animal feeding trials coupled withrelevant short- or long-term toxicological investigations. In later stages of testinghumans may also be included in the studies to ascertain that their physiologicalreactions are similar to those found in animals.
Because of food’s potentially longer-term ingestion, the standards applied tofood additives in feed trials are significantly more stringent than those applied to,say, pharmaceuticals, where, in order to treat some illness successfully, certainside-effects of the treatment can be tolerated. The ADI is an estimate of the amountof a food additive, expressed in milligrams per kilogram of body weight per day,that can be consumed safely over an entire lifetime. ADI levels are set by JECFAbased on the result of various feeding trials. As a general rule, the ADI value is setat one-hundredth of the intake that produces virtually no toxicological effects inlong-term animal feeding trials.
The registration of a ‘new’ ingredient, or perhaps the retention of an existingone, under the European Miscellaneous Additives Directive is a complicated andlong-drawn-out procedure, not just because of the strict protocols employed inthe assessment itself but also because of the accompanying exchanges betweenall interested parties representing the member states in setting up the applica-tion. The opinions of agricultural and trade associations, consultancies, researchestablishments and other organisations may be called upon in the preparation of asuitable dossier laying out the justification for inclusion of an additive. The asso-ciated costs are enormous. Currently, starting from scratch, the costs involvedin preparing a monograph on the constituent and physical properties of a pro-posed additive, together with a full toxicological study, will be of the order of

Steen: “chap03” — 2006/4/27 — 19:39 — page 85 — #38
INGREDIENTS AND FORMULATION OF CARBONATED SOFT DRINKS 85
£230,000 ($425,000) – so it is little wonder that new additions to the list are few innumber.
An ongoing issue periodically generating media coverage is the intolerance ofmembers of the population to certain food ingredients. This is most concerningwhen serious allergenic reactions occur. The apparent growth in the prevalence ofsevere allergic reaction to peanuts during the 1990s was a case in point. It initiated,throughout the manufacturing industries, a series of controls on the raw materialsupply line to ensure products are, where appropriate, free from nut components andlabelled accordingly. In 1996 the European Scientific Committee for Food (SCF)issued a report on Adverse Reactions to Food and Food Ingredients. The level ofintolerance to food additives was indicated in the report to be 0.026%, equivalentto just under 3 people per 10,000 of the population.
3.15 Future trends
In a world undergoing continual change, with a population well above six billion,the challenge facing the soft drinks industry is perhaps increasingly complex. Toprovide products that are wholesome, durable, acceptable in character and inter-esting to an ever-growing market has been the objective for many years, but withthe increasing realisation that almost anything we consume can have detrimental aswell as beneficial effects, the focus today is very much on additives, processing aidsand functional ingredients. The term ‘functional drinks’ is now part of our vocab-ulary, and this is an area with great scope for future development. The general aimof a functional drink is not just to alleviate thirst but also to contribute to a senseof well-being in the consumer by assisting with diet, metabolism and improvedlifestyle.
Healthy lifestyle drinks, drinks with added vitamins, drinks with pro-bioticproperties and isotonic drinks are already available and provide a base for furtherinnovation. Claims such as ‘rich in fibre’, ‘fat free’, ‘sugar reduced’, ‘beneficial incalcium adsorption by the body’, ‘improving intestinal flora’, ‘pro-biotic’, ‘withascorbic acid’ and ‘energy reduced’ will doubtless continue to be seen and willhave to be supported by sound evidence to comply with labelling regulations.
Although PET (polyethylene terephthalate) bottles and ring-pull aluminiumcans have proved extremely suitable for carbonates, it is likely that there will befresh progress in the area of drinks packaging – particularly so as environmentalconcerns and the recycling of packaging materials have become an issue.
During the past decade, legislative controls have become more stringent, withthe gradual phasing-out or reduction in use of many additives previously consideredan essential part of the production formula, and this trend is bound to continue. Inconjunction with this, improved packaging, aseptic processing techniques and theselection of top-quality raw material ingredients will become prestigious, creatinga highly specialised system of presentation designed at all times to satisfy theconsumer. In the final analysis, it is the customer upon whom the continued successof a beverage product depends. Image is important, but behind the image there must
Steen: “chap03” — 2006/4/27 — 19:39 — page 86 — #39
86 CARBONATED SOFT DRINKS
be substance and quality; performance must satisfy, and this is what the successfulmarketing of soft drinks relies upon.
Bibliography
Barnett & Foster (1916) Bottling Plant Catalogue, Publication No. 179.Bernard, B.K. (Consulting Ed.) (1985) Flavor and Fragrance Materials. Allured Publishing Corp,
Wheaton, IL, USA.Code of Federal Regulations (1989) 21CFR170 to 199, Office of the Federal Register, USA.Fellers, C.R. and Esselen, W.B. (1955) Agr. Expt. Sta. Univ. Mass. Bull. No. 481,13.The Commission of the EC (1999) Official Journal of the European Communities. L84, Vol 42. Register
of Flavouring Substances, per Regulation (EC) No. 2232/96.Hanssen, M. (1987) E for Additives (2nd edn) Thorsons Publishing, Wellingborough, UK.Hofman, T., Rothe, M. and Schieberle, P. (Eds) (21–23 April 2004) State-of-the-art in flavour chemistry
and biology. Proceedings of the 7th Wartburg Symposium, pp. 139–145.Saltmarsh, M. (Ed.) (2000) Essential Guide to Food Additives. Leatherhead Publishing, Surrey, UK.Stevenson & Howell Ltd (1926) The Manufacture of Aerated Beverages, Cordials, etc. (7th edn). Own
Trade Publicity, London.

Steen: “chap04” — 2006/4/27 — 18:30 — page 87 — #1
4 Syrup preparation and syrup room operationsJohn Horman
4.1 Introduction
The modern syrup room bears no relation whatsoever to the syrup room of a centuryago or even, for that matter, twenty years ago. The advent of modern flow meteringsystems and PLC (programmable logic controller) control has made drastic changesto the way we operate. As will be discussed in Chapter 11, legislation, driven byconcerns over product quality, has meant major improvements to the way we run andoperate our plants. Nowadays plants are situated in hygienically designed rooms,with all pipework in 316 stainless steel and hardly a person in sight. Raw materialsare kept in a separate room to minimise any risk of contamination from packaging,etc., which might have originated in some far off third world country. This majorchange in the way our factories are designed and run is part of a gradual ongoingchange in the twenty-first century. Nobody knows what is round the corner exceptthat change and improvements are an ongoing process. Time does not stand still.One possible problem with future development could be the lack of UK trainedscientists and engineers, in what is seen as an unglamorous, poorly paid profession.Government and industry both need to address this issue to ensure that the profileand standing of technologically motivated individuals increases. It is no good havingall these marvellous factories and systems in place without the skilled professionalsto staff them with the necessary experience and qualifications.
The syrup room of old would have operated with small mixing tanks using awooden paddle. Very likely the vessel would originally have been made of woodas well. The very thought of how they cleaned these vessels, and the microbialproblems that must have occurred, does not bear consideration. Raw materialswould be placed in sacks around the room and weighed out to a given recipe usingsimple weighing equipment and measuring jugs. The level of accuracy of thesemeasured quantities and the subsequent drink reproducibility must have been amajor problem. Often without accurate metering sugar and water would be addedto the vessel to a given tank level, measured either by a mark on the side of thetank or by a dip stick. Some of these methods existed up to the late twentiethcentury in some smaller soft drinks plants. During the second half of the twentiethcentury metering systems for sugar and water were incorporated. Often these wereof unhygienic design and construction, and somewhat dubious accuracy. Pipeworkwas usually in unplasticised polyvinyl chloride (UPVC) with poorly made pipejoints and cast iron or plastic valves that gave rise to high micro-biological counts.Such a problem can be seen in Figure 4.1, where a poor pipe joint is shown. It wasonly due to the preservative nature of carbon dioxide and the use of returnable glass

Steen: “chap04” — 2006/4/27 — 18:30 — page 88 — #2
88 CARBONATED SOFT DRINKS
Poorly welded pipe
Expanded section showing microbial growth
Figure 4.1 Poor pipe joint.
bottles which gave rise to a quick turnaround that serious problems rarely arose. Itwas only with the advent of the can, and later PET bottles, that the industry hadto live with long shelf lives and products distributed nationally and internationally.This meant initially increasing preservative levels and then when legislation wasintroduced minimising their use in the development of hygienic processing.
4.2 Syrup composition
This chapter will only consider the basics as whole books have been devoted tothis subject and the previous chapter has dealt with it in some depth. The mainingredients of a carbonated drink product are water, sugar or other sweetener, acid,sometimes fruit juice, flavours and emulsions, colours, preservatives, antioxidantsand of course carbon dioxide.
Acids give the tart taste to a soft drink and are usually the third main ingredi-ent. The three principal acids used are citric, phosphoric and malic acid, thoughother acids such as tartaric, lactic, acetic, fumaric and ascorbic are occasionallyconsidered. These can be delivered either in powder form or as a liquid in bulk.With modern metering systems the use of bulk liquid acid is now becoming thenorm. Citric acid is the most commonly used acid for carbonates. It is very solu-ble in water in that 10 g will dissolve in 100 ml of water at 22◦C. Carl WilhelmScheele, a Swedish chemist first isolated citric acid from a lemon in 1784. Some200,000 tonnes of it is used in the USA alone for food and carbonated drinkspurposes. It is commercially produced by fermenting cane sugar, molasses, anddextrose by use of the fungus Aspergillus niger. The original process of extrac-tion was from fruit juice by adding lime to form a calcium citrate (an insoluble

Steen: “chap04” — 2006/4/27 — 18:30 — page 89 — #3
SYRUP PREPARATION AND SYRUP ROOM OPERATIONS 89
precipitate) that is then exposed to sulphuric acid, thereby recovering the citricacid. Phosphoric acid is used primarily for cola-based drinks. It is available inliquid concentrations between 75 and 90%. Above 50% concentration it is rathersyrupy. Unfortunately it is highly corrosive so it is important when handling to userubber gloves and to process it through 316 stainless steel pipes and plant. Malicacid is allied to apples and, after citric acid, is the most commonly used in the drinksindustry. It is highly soluble in water. The quantity used in a soft drink is dependanton the recipe. Acids prevent the growth of pathogenic organisms within the drinkand pH levels below 4.5 are normally considered free of pathogens. The acid levelfor a typical carbonate is 0.2–0.5% with a pH between 2.6 and 3.0, whereas a coladrink, using phosphoric acid, will have 0.06% acid with a pH of 2.4–2.8.
Besides water, as discussed in Chapter 2, sugar in all sugar drinks representsthe second major ingredient. This is sucrose extracted from either beet or cane. It isobtained by liquid extraction from crushing followed by recrystallisation. Whethera company takes the sugar in a granular form for dissolving on site, or as a liquidis usually dependent on the price. A typical soft drink will have some 10% sugar,normally defined as the ◦Brix level which is the percentage weight for weight ofsucrose present. This may sound excessive until you think that a glass of fruitjuice contains some 10% of natural sugars. Sugar is normally added to enhancetaste. It is a carbohydrate that breaks down in the body to form the energy source,glucose.
For low-calorie drinks sweeteners are used instead of sugar. They have a veryhigh sweetener level so that only small quantities are required in the drink. Themain sweeteners in use are acesulfame-K, aspartame, cyclamates and saccharin.The choice of which sweetener to use in any specific drink depends on the typeof product, the taste, the availability and the price. These sweeteners can also beblended together including sometimes with sugar. They are normally delivered inbag form on pallets.
Preservatives inhibit the growth of micro-organisms thereby allowing the prod-uct to be kept for a considerable time before it deteriorates. They are present inbread and all major foods, as otherwise spoilage rates would be very high and therisk of illness through eating or drinking manufactured items very likely. How-ever, carbon dioxide itself prevents mould growth and high levels of acidity, andcarbonation also assists in inhibiting the growth of yeasts and bacteria. The mostcommonly used preservatives are benzoic acid and sorbic acid, which are effectiveagainst most yeasts and moulds.
Flavourings, which may be natural or artificial in nature, allow a wide varietyof drinks to be produced. Most of those used in the soft drinks industry tend to benatural in origin. A large industry exists just to satisfy the demand for these. Theycan be water miscible or water dispersible, the former as the name implies beingeasily dissolved in water though often they are dissolved in a suitable carrier suchas ethyl alcohol or propylene glycol. Some are used in the form of an emulsion,thereby allowing oil-based flavourings to be supplied in a soluble form.
Colours provide a drink with a perception of what it will likely taste like. Inaddition to a given brand the colour is part of the image, and needs to be reproduced
Steen: “chap04” — 2006/4/27 — 18:30 — page 90 — #4
90 CARBONATED SOFT DRINKS
accurately for each serving. They are normally provided in powder form. Otherpossible ingredients include anti-oxidants, saponins and stabilisers.
The chemist from his or her brief from marketing must develop a recipe tomeet this requirement. From experience and a degree of trial-and-error a recipeis presented and accepted by marketing. This will be after stringent tests on theproduct lifecycle, where any deterioration of taste with time or colour degradationwill be noted. With any brand, any change in any ingredient supply must involvecareful testing to ensure the product profile is unchanged. Above all due diligence isrequired to ensure that at all times the product as specified is safe for the consumer.
4.3 Syrup rooms and proportioning systems
In these systems the syrup is usually prepared in the syrup room in a concentratedform, typically in the ratio 3 parts syrup to 17 parts water. For juice products this ismuch less down to the order of 1 part syrup to 3 parts water. This includes all theingredients with just a small amount of water to ensure that the viscosity was lowenough to promote reasonable flow conditions. The syrup is prepared normally inbatch vessels using water and liquid sugar feed through volumetric flow meters.Often these are not of very hygienic design, having been installed over 25 yearsago. The feed is through a pipe in the top of the vessel often leading down theside of the vessel to the bottom. This was to try and minimise aeration due tofeeding liquid into the air rather than under liquid at all times. The ingredientswould be pre-mixed in a stainless steel bucket and added to the syrup vessel. Highpreservative levels were required in the product to ensure product security. Whilstthe bucket might have disappeared some time ago, the old-fashioned syrup roomstill exists in many factories. Often a pre-mix is made up and metered to the syruptank, using water as the wash through at a metered level. However, the vessels areoften open to atmosphere and have rather crude blending arrangement, rather thanthe more sophisticated mixers used in modern vessels. The state of the syrup roomoften needs attention, in that risks from overhead beams that are difficult to clean,and similar problems associated with older sites, make product quality an ongoingissue. It is only by very stringent cleaning regimes, including operator hygiene, thatthese systems are still in use today.
It is at the proportioner just before the filler that the final product is producedjust prior to carbonation. In fact, most such units incorporate the carbonator. In theMojonnier system a fixed orifice is used to meter the syrup component whilst thewater is fed through a variable orifice. They both operate under a constant head ofpressure as shown in Figure 4.2. A float valve in the product tank ensures a fixedhead feed to the carbonator as well as controlling the water and syrup feeds. Theset-up of such a system always meant that the initial product was out of specification,though once set up it remained accurate. Also the last part of the batch would be outof specification which will cause some loss of product. This is due to the fact thatthe emptying of the syrup tank gives rise to a lower syrup head pressure than that ofthe water. Another such system used dosing pumps one for water and another for
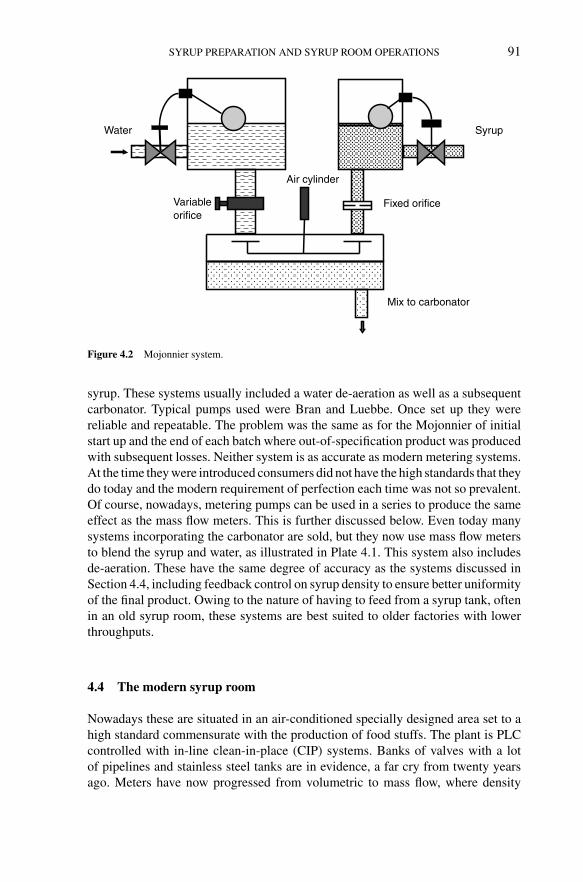
Steen: “chap04” — 2006/4/27 — 18:30 — page 91 — #5
SYRUP PREPARATION AND SYRUP ROOM OPERATIONS 91
SyrupWater
Variableorifice
Air cylinder
Fixed orifice
Mix to carbonator
Figure 4.2 Mojonnier system.
syrup. These systems usually included a water de-aeration as well as a subsequentcarbonator. Typical pumps used were Bran and Luebbe. Once set up they werereliable and repeatable. The problem was the same as for the Mojonnier of initialstart up and the end of each batch where out-of-specification product was producedwith subsequent losses. Neither system is as accurate as modern metering systems.At the time they were introduced consumers did not have the high standards that theydo today and the modern requirement of perfection each time was not so prevalent.Of course, nowadays, metering pumps can be used in a series to produce the sameeffect as the mass flow meters. This is further discussed below. Even today manysystems incorporating the carbonator are sold, but they now use mass flow metersto blend the syrup and water, as illustrated in Plate 4.1. This system also includesde-aeration. These have the same degree of accuracy as the systems discussed inSection 4.4, including feedback control on syrup density to ensure better uniformityof the final product. Owing to the nature of having to feed from a syrup tank, oftenin an old syrup room, these systems are best suited to older factories with lowerthroughputs.
4.4 The modern syrup room
Nowadays these are situated in an air-conditioned specially designed area set to ahigh standard commensurate with the production of food stuffs. The plant is PLCcontrolled with in-line clean-in-place (CIP) systems. Banks of valves with a lotof pipelines and stainless steel tanks are in evidence, a far cry from twenty yearsago. Meters have now progressed from volumetric to mass flow, where density

Steen: “chap04” — 2006/4/27 — 18:30 — page 92 — #6
92 CARBONATED SOFT DRINKS
P P P P
Water
Mixingtank
Mixingtank
Mixingtank
Mixingtank
Filters
Σ
Σ Sugar
M M
Cleaning fluid
CO2
CIP
Pre-mix
P
De-aeratedwater
CIPreturn
Jetmixing
Figure 4.3 Volumetric flow meter system.
correction of key ingredients can be incorporated. The key to these systems is thatthey produce the final beverage on the premise of getting the product right firstbefore carbonating.
The early automated syrup rooms used volumetric flow meters. These wereextremely accurate in terms of the volume of liquid metered through. A typicalsystem is shown in Figure 4.3. A pre-mix of the main ingredients besides water,sugar and acid would be made up. Once the pre-mix had been made up and checked,it was possible to start the syrup batch. The skid unit normally comprised two meters,one for water and one for all the other ingredients. The recipe would have been setin the computer, which interfaced with the PLC control system. The route wouldbe selected on the PC, including which mixing vessel the batch was to be sent to.All pipelines were left with water in them after the previous batch. The amount inthis pipeline to any particular tank is known. The sugar is then metered into thetank. Following this a known amount of water is metered through to wash the lineout. This is then repeated for each ingredient, whether this be citric acid, malicacid, pre-mix or juice. At the end of the batch a further known quantity of wateris added. Early users of these systems used to add less water than the recipe statedso that they could err on the side of caution and add more water when the batchhad been mixed and the Brix measured. Due to the accuracy of such a system thiswas rarely required. If it was required it was usually due to the sugar being slightlyout of specification. The system would allow for this if required through an on-linedensity meter. The final syrup would be produced to a much higher accuracy than

Steen: “chap04” — 2006/4/27 — 18:30 — page 93 — #7
SYRUP PREPARATION AND SYRUP ROOM OPERATIONS 93
the recipe specification, which has led to cost savings as well as better uniformityof product as delivered to the consumer. To minimise the risk of aeration of theproduct all dosed infeeds go through the base of the mixing vessel. Ideally thisshould be a flush-mounted valve to the base of the tank so as not to have any deadareas in the vessel where the product cannot be circulated. Clearly the outfeed tothe filling lines also uses this same valve being routed through the valve matrix.The mixing vessels are normally issued with a sight glass and accompanying lightas well as a hygienic sampling tube.
More modern systems use mass flow meters. These meters can also measuredensity, though to an order of magnitude less than for an actual density meter. Theycan feed to a batch vessel, say of 30,000 l capacity, or direct to the carbonator. Theaccuracy of the mass flow meters is such that they can produce product to within±0.01 ◦Brix, which has been proven on many occasions. A typical skid is shown inFigure 4.4. Any deviation in the liquid sugar brix can be compensated immediatelyby the addition of more or less water. It is even possible to add major flavoursthrough the mass flow metering skid. Clearly this is only of interest on productionlines where major brands are produced. The flavours for these are normally deliveredin special intermediate bulk containers (IBCs), which can be simply coupled up tothe infeed pipework of the skid. Such systems require a sophisticated control systemand can be readily interfaced with the site MRP system. Batch vessels often use
Figure 4.4 Mass flow meter skid (courtesy of Diessel GmbH).

Steen: “chap04” — 2006/4/27 — 18:30 — page 94 — #8
94 CARBONATED SOFT DRINKS
P P
F F
PFF
FP
P
P
P
F
FilterSightglass Auto valve
Manual valve
Pump
Flowmeter
De-aerator
Concentratecontainers
Sugar
Productwater
Productout
Citric acid
Figure 4.5 Continuous blending system (courtesy of Diessel GmbH).
re-circulatory pumps to ensure the product stays well mixed. A densitometer canbe installed in this line if required as a cross check on the system. Similarly, suchan instrument can be installed on the feed line to the carbonator for in line blendingoperations. A continuous blending system using volumetric flow meters is shownin Figure 4.5.
A typical valve matrix is shown in Figure 4.6. It is not uncommon to have over500 such valves within a system. Whilst this may seem to be a heyday for the valvemanufacturers, it is important to ensure that several lines run at once and also whilstone or more is being cleaned. These use block and bleed valves.
For the beverage feed to the filling line two systems are in common use. Onemethod is to pump the product over, then using water to push the last vestiges tothe point of use. As a flow meter accurately measures the quantity of liquid passingthrough it, it is known when the product flow is completed out of a tank and thuswhen the water is to be added. As the flow rate, pipe diameter and distance to thepoint of use is known, it is possible to achieve a reasonably good cut off, taking intoaccount the fact that a certain degree of diffusion of product and water will haveoccurred. A conductivity probe sited at the point of use can act as a safety valve tohelp minimise product loss during transfer.
Another method is to use a pig. This is an object made from food grade silicon orsimilar materials that are tough and flexible that pushes liquid through a pipe. Theyare normally propelled by air or water using special valves at each end of the pipe.The pig is normally returned to its original position after use ready for the next run.A schematic to illustrate the principle is shown in Figure 4.7. As the transfer time issmall, this time lost is of little importance. The pigs can travel round bends and havethe advantage over the water flush method of further minimising product losses.
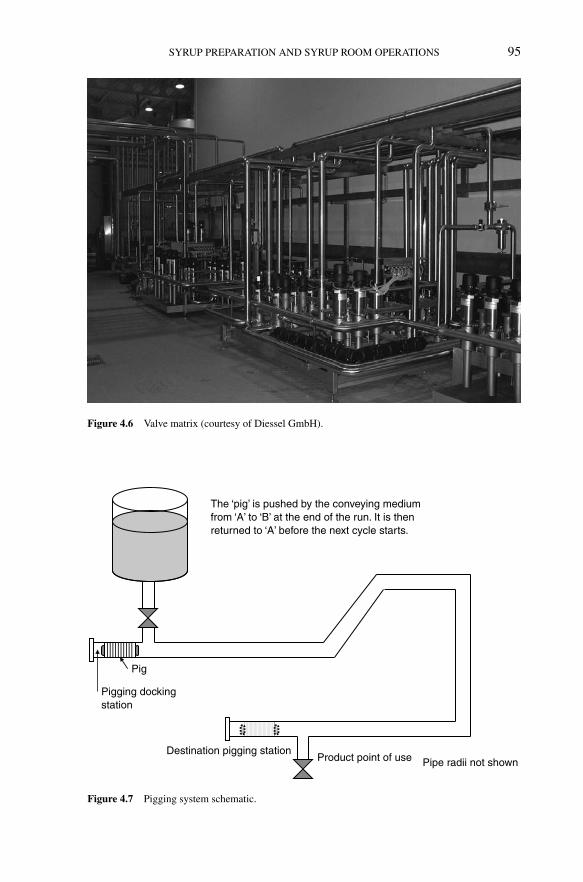
Steen: “chap04” — 2006/4/27 — 18:30 — page 95 — #9
SYRUP PREPARATION AND SYRUP ROOM OPERATIONS 95
Figure 4.6 Valve matrix (courtesy of Diessel GmbH).
Pig
Pigging dockingstation
Product point of useDestination pigging station
Pipe radii not shown
The ‘pig’ is pushed by the conveying mediumfrom ‘A’ to ‘B’ at the end of the run. It is thenreturned to ‘A’ before the next cycle starts.
Figure 4.7 Pigging system schematic.
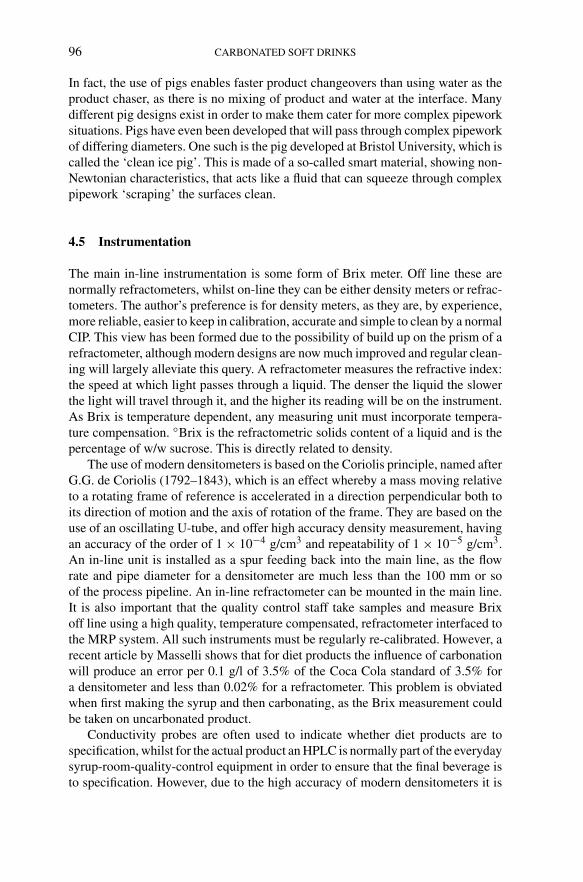
Steen: “chap04” — 2006/4/27 — 18:30 — page 96 — #10
96 CARBONATED SOFT DRINKS
In fact, the use of pigs enables faster product changeovers than using water as theproduct chaser, as there is no mixing of product and water at the interface. Manydifferent pig designs exist in order to make them cater for more complex pipeworksituations. Pigs have even been developed that will pass through complex pipeworkof differing diameters. One such is the pig developed at Bristol University, which iscalled the ‘clean ice pig’. This is made of a so-called smart material, showing non-Newtonian characteristics, that acts like a fluid that can squeeze through complexpipework ‘scraping’ the surfaces clean.
4.5 Instrumentation
The main in-line instrumentation is some form of Brix meter. Off line these arenormally refractometers, whilst on-line they can be either density meters or refrac-tometers. The author’s preference is for density meters, as they are, by experience,more reliable, easier to keep in calibration, accurate and simple to clean by a normalCIP. This view has been formed due to the possibility of build up on the prism of arefractometer, although modern designs are now much improved and regular clean-ing will largely alleviate this query. A refractometer measures the refractive index:the speed at which light passes through a liquid. The denser the liquid the slowerthe light will travel through it, and the higher its reading will be on the instrument.As Brix is temperature dependent, any measuring unit must incorporate tempera-ture compensation. ◦Brix is the refractometric solids content of a liquid and is thepercentage of w/w sucrose. This is directly related to density.
The use of modern densitometers is based on the Coriolis principle, named afterG.G. de Coriolis (1792–1843), which is an effect whereby a mass moving relativeto a rotating frame of reference is accelerated in a direction perpendicular both toits direction of motion and the axis of rotation of the frame. They are based on theuse of an oscillating U-tube, and offer high accuracy density measurement, havingan accuracy of the order of 1 × 10⁻⁴ g/cm3 and repeatability of 1 × 10⁻⁵ g/cm3.An in-line unit is installed as a spur feeding back into the main line, as the flowrate and pipe diameter for a densitometer are much less than the 100 mm or soof the process pipeline. An in-line refractometer can be mounted in the main line.It is also important that the quality control staff take samples and measure Brixoff line using a high quality, temperature compensated, refractometer interfaced tothe MRP system. All such instruments must be regularly re-calibrated. However, arecent article by Masselli shows that for diet products the influence of carbonationwill produce an error per 0.1 g/l of 3.5% of the Coca Cola standard of 3.5% fora densitometer and less than 0.02% for a refractometer. This problem is obviatedwhen first making the syrup and then carbonating, as the Brix measurement couldbe taken on uncarbonated product.
Conductivity probes are often used to indicate whether diet products are tospecification, whilst for the actual product an HPLC is normally part of the everydaysyrup-room-quality-control equipment in order to ensure that the final beverage isto specification. However, due to the high accuracy of modern densitometers it is
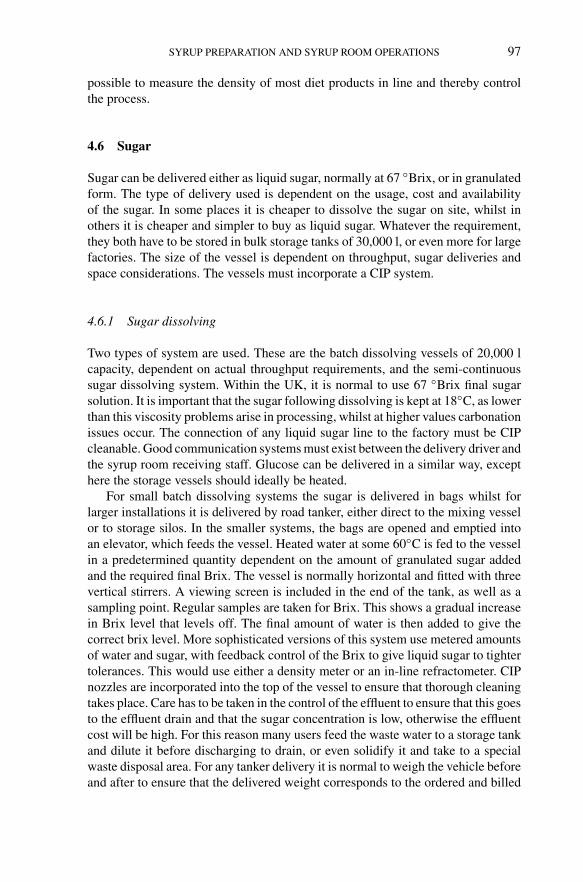
Steen: “chap04” — 2006/4/27 — 18:30 — page 97 — #11
SYRUP PREPARATION AND SYRUP ROOM OPERATIONS 97
possible to measure the density of most diet products in line and thereby controlthe process.
4.6 Sugar
Sugar can be delivered either as liquid sugar, normally at 67 ◦Brix, or in granulatedform. The type of delivery used is dependent on the usage, cost and availabilityof the sugar. In some places it is cheaper to dissolve the sugar on site, whilst inothers it is cheaper and simpler to buy as liquid sugar. Whatever the requirement,they both have to be stored in bulk storage tanks of 30,000 l, or even more for largefactories. The size of the vessel is dependent on throughput, sugar deliveries andspace considerations. The vessels must incorporate a CIP system.
4.6.1 Sugar dissolving
Two types of system are used. These are the batch dissolving vessels of 20,000 lcapacity, dependent on actual throughput requirements, and the semi-continuoussugar dissolving system. Within the UK, it is normal to use 67 ◦Brix final sugarsolution. It is important that the sugar following dissolving is kept at 18◦C, as lowerthan this viscosity problems arise in processing, whilst at higher values carbonationissues occur. The connection of any liquid sugar line to the factory must be CIPcleanable. Good communication systems must exist between the delivery driver andthe syrup room receiving staff. Glucose can be delivered in a similar way, excepthere the storage vessels should ideally be heated.
For small batch dissolving systems the sugar is delivered in bags whilst forlarger installations it is delivered by road tanker, either direct to the mixing vesselor to storage silos. In the smaller systems, the bags are opened and emptied intoan elevator, which feeds the vessel. Heated water at some 60◦C is fed to the vesselin a predetermined quantity dependent on the amount of granulated sugar addedand the required final Brix. The vessel is normally horizontal and fitted with threevertical stirrers. A viewing screen is included in the end of the tank, as well as asampling point. Regular samples are taken for Brix. This shows a gradual increasein Brix level that levels off. The final amount of water is then added to give thecorrect brix level. More sophisticated versions of this system use metered amountsof water and sugar, with feedback control of the Brix to give liquid sugar to tightertolerances. This would use either a density meter or an in-line refractometer. CIPnozzles are incorporated into the top of the vessel to ensure that thorough cleaningtakes place. Care has to be taken in the control of the effluent to ensure that this goesto the effluent drain and that the sugar concentration is low, otherwise the effluentcost will be high. For this reason many users feed the waste water to a storage tankand dilute it before discharging to drain, or even solidify it and take to a specialwaste disposal area. For any tanker delivery it is normal to weigh the vehicle beforeand after to ensure that the delivered weight corresponds to the ordered and billed
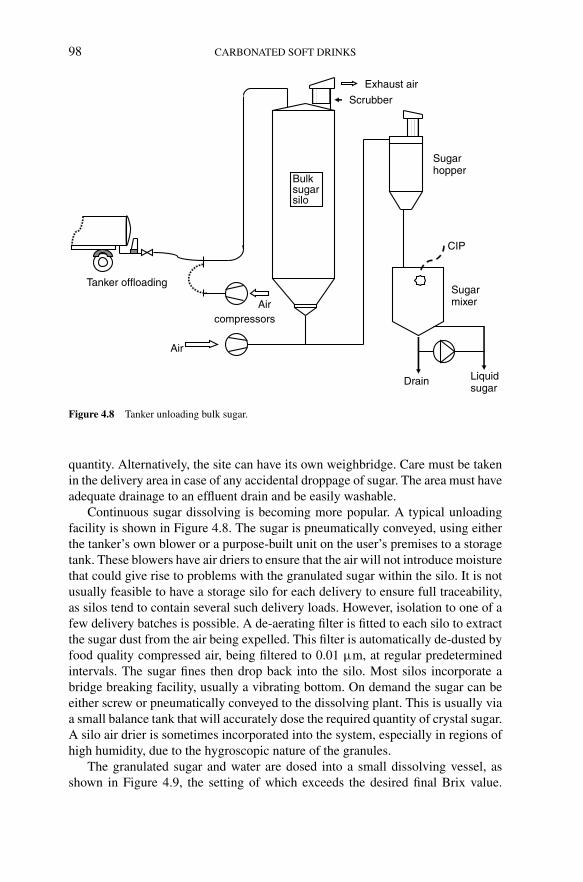
Steen: “chap04” — 2006/4/27 — 18:30 — page 98 — #12
98 CARBONATED SOFT DRINKS
Bulksugarsilo
CIP
Sugarhopper
Scrubber
Exhaust air
Sugarmixer
Drain Liquidsugar
Air
Air
Tanker offloading
compressors
Figure 4.8 Tanker unloading bulk sugar.
quantity. Alternatively, the site can have its own weighbridge. Care must be takenin the delivery area in case of any accidental droppage of sugar. The area must haveadequate drainage to an effluent drain and be easily washable.
Continuous sugar dissolving is becoming more popular. A typical unloadingfacility is shown in Figure 4.8. The sugar is pneumatically conveyed, using eitherthe tanker’s own blower or a purpose-built unit on the user’s premises to a storagetank. These blowers have air driers to ensure that the air will not introduce moisturethat could give rise to problems with the granulated sugar within the silo. It is notusually feasible to have a storage silo for each delivery to ensure full traceability,as silos tend to contain several such delivery loads. However, isolation to one of afew delivery batches is possible. A de-aerating filter is fitted to each silo to extractthe sugar dust from the air being expelled. This filter is automatically de-dusted byfood quality compressed air, being filtered to 0.01 µm, at regular predeterminedintervals. The sugar fines then drop back into the silo. Most silos incorporate abridge breaking facility, usually a vibrating bottom. On demand the sugar can beeither screw or pneumatically conveyed to the dissolving plant. This is usually viaa small balance tank that will accurately dose the required quantity of crystal sugar.A silo air drier is sometimes incorporated into the system, especially in regions ofhigh humidity, due to the hygroscopic nature of the granules.
The granulated sugar and water are dosed into a small dissolving vessel, asshown in Figure 4.9, the setting of which exceeds the desired final Brix value.
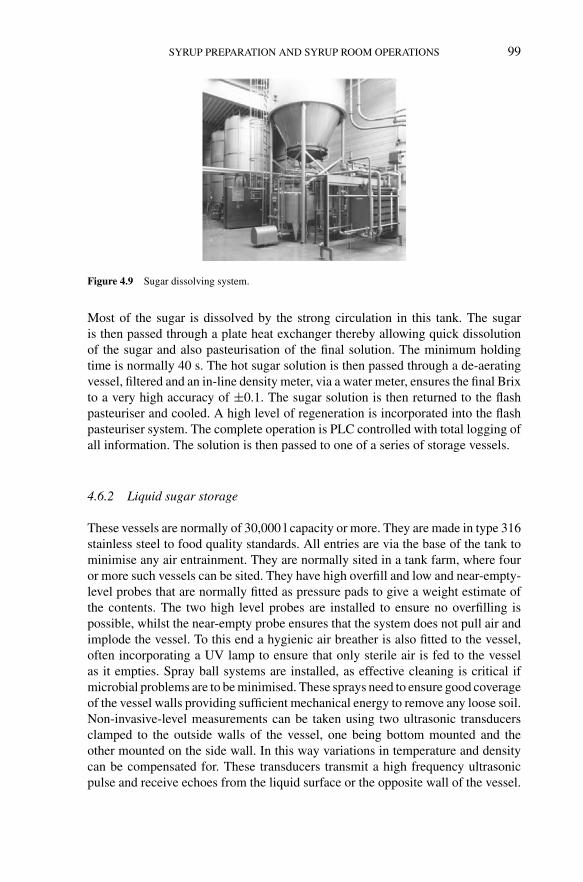
Steen: “chap04” — 2006/4/27 — 18:30 — page 99 — #13
SYRUP PREPARATION AND SYRUP ROOM OPERATIONS 99
Figure 4.9 Sugar dissolving system.
Most of the sugar is dissolved by the strong circulation in this tank. The sugaris then passed through a plate heat exchanger thereby allowing quick dissolutionof the sugar and also pasteurisation of the final solution. The minimum holdingtime is normally 40 s. The hot sugar solution is then passed through a de-aeratingvessel, filtered and an in-line density meter, via a water meter, ensures the final Brixto a very high accuracy of ±0.1. The sugar solution is then returned to the flashpasteuriser and cooled. A high level of regeneration is incorporated into the flashpasteuriser system. The complete operation is PLC controlled with total logging ofall information. The solution is then passed to one of a series of storage vessels.
4.6.2 Liquid sugar storage
These vessels are normally of 30,000 l capacity or more. They are made in type 316stainless steel to food quality standards. All entries are via the base of the tank tominimise any air entrainment. They are normally sited in a tank farm, where fouror more such vessels can be sited. They have high overfill and low and near-empty-level probes that are normally fitted as pressure pads to give a weight estimate ofthe contents. The two high level probes are installed to ensure no overfilling ispossible, whilst the near-empty probe ensures that the system does not pull air andimplode the vessel. To this end a hygienic air breather is also fitted to the vessel,often incorporating a UV lamp to ensure that only sterile air is fed to the vesselas it empties. Spray ball systems are installed, as effective cleaning is critical ifmicrobial problems are to be minimised. These sprays need to ensure good coverageof the vessel walls providing sufficient mechanical energy to remove any loose soil.Non-invasive-level measurements can be taken using two ultrasonic transducersclamped to the outside walls of the vessel, one being bottom mounted and theother mounted on the side wall. In this way variations in temperature and densitycan be compensated for. These transducers transmit a high frequency ultrasonicpulse and receive echoes from the liquid surface or the opposite wall of the vessel.
Steen: “chap04” — 2006/4/27 — 18:30 — page 100 — #14
100 CARBONATED SOFT DRINKS
Accuracies of ±0.2% are claimed. Another method is to use a pressure pad on thebase of the vessel. However, such a system is never fully accurate owing to thepipework connected to the vessel and the pumping of product in and out.
4.7 Pre-mixes
A pre-mix is where all the minor ingredients are produced prior to the main batchof syrup. Some of these may require dissolution in warm water, whilst others mayhave to be dissolved in a weak acid solution, prior to adding to this pre-mix. In someinstances where citric acid is delivered in bags this can also form part of the pre-mixingredients. This leaves only the addition of the pre-mix with liquid sugar, water,possibly juice and another acid such as malic in the main syrup mixing vessel.
‘The traceability of food, feed, food-producing animals and any other substanceintended to be, or expected to be, incorporated into a food or feed shall be estab-lished at all stages of production, processing and distribution.’ So states article 18of EU Directive 178/2002. The implications of this are that systems must be inplace so that all ingredients used in the manufacture of carbonated soft drinks aretraceable. Most major manufacturers were already satisfying this directive wellbefore its introduction, and several commercially available systems are availableon the market. They can be integrated with MRP systems, thereby forming part ofthe main factory control system.
Minor ingredients are normally delivered in drums, whether as a liquid or pow-der. Each drum has a specific barcode identification. For ingredients delivered inbags these should be dumped into plastic or stainless steel drums, to which theproduct barcode can be added thereby ensuring traceability. The bags are normallyopened and dumped via a bag dump station incorporating its own dust extrac-tor. This minor ingredients system integrates with the main syrup room system.Major ingredients are delivered in bulk and separately metered and recorded on themain syrup room system. These systems improve batch accuracy and repeatabilitywhilst maintaining batch traceability. It does increase the ‘right first time’ batchesby a significant amount over traditional paper-based systems as well as increasingproductivity.
The scheduled work plan is fed into the system, which already has all therecipes loaded. For a given batch size the necessary weighings are calculated andthe order of addition listed on the screen. The operator is then prompted for the firstingredient, which they confirm by barcode scanning using RF wireless technology.This gives the ingredient and the lot details which are then recorded. The screens areusually digital with an indicator showing when the weighing is nearing completion.In this way the operator is prompted to slow down the addition thereby increasingthe weighing accuracy, as well as the speed at which it is done. If too much ofa particular ingredient is added erroneously, the system locks out and can onlybe restarted by management intervention. This involves re-sizing the batch which,once agreed, is done automatically by the programme. The other advantage of suchsystems is the updating of stock records for each ingredient. Several work stations

Steen: “chap04” — 2006/4/27 — 18:30 — page 101 — #15
SYRUP PREPARATION AND SYRUP ROOM OPERATIONS 101
can be used. In terms of health and safety it is good practice to install dust extractionat the pre-mix station. These often use a centralised dust extraction system.
For large batches, applicable to long-run lengths on major brands, multi-ingredient weighing systems can be used. These often employ mobile weighingcarriages running on a mono-rail track. These carriages are loaded with a weighingbin. The recipe is fed into the main control system, which then sets in motion theautomated dosing of each ingredient. The carriage moves around the track to eachindividual feed station, where material is dispensed in accordance with the recipe.On completion of the batch the carriage can then be fed to the main syrup blendingtank. Such systems can easily cater for expansion, provided the site area is largeenough.
The actual pre-mix is normally prepared in a small vessel to which the pre-weighed ingredients are added. Often this vessel is equipped with a high shearmixer to ensure complete mixing of difficult-to-dissolve ingredients. This mixer isoften fitted in-line and also acts as the transfer pump to the main syrup vessel. Thepre-mix would circulate through the mixer back into the pre-mix tank until requiredfor use, when a valve would open allowing the transfer across.
4.8 Pasteurisation
Louis Pasteur demonstrated that it was the multiplication of bacteria that causedwine, beer and milk to go sour and that, by heating the liquid, the bacteria wouldbe destroyed. In 1862, in conjunction with Claude Bernard, he developed the firstmilk pasteurisation process. It has been found by experimentation that the numberof pasteurising unit (PU) can be given by the formula:
PU/min = 1.389(T−60)
where T is the temperature in degrees centigrade. Each product will have a requirednumber of PUs which it needs in order to be treated dependent on the risks inherentin the materials used and its shelf life. Two types of pasteuriser are in common usein the soft drinks industry. These are the tunnel and flash pasteuriser.
4.8.1 Tunnel pasteurisation
This is a sophistication of the old retort system, though operating at lower temper-atures, where the product is fed into a special vessel which is sealed and heated toa specified temperature, held at this temperature for a set period and then cooled.Except for very small batches this system is rarely used.
This is the least risk scenario. These are only for can and glass bottles withmetal caps, although PET bottles can if suitably manufactured be pasteurised, thisis not the case for plastic closures. Only low carbonated products are considered,as the pressure built up during pasteurisation would otherwise exceed the inter-nal pressure resistance of the container. A typical tunnel pasteuriser is shown in

Steen: “chap04” — 2006/4/27 — 18:30 — page 102 — #16
102 CARBONATED SOFT DRINKS
Figure 4.10 Tunnel pasteuriser (courtesy of Krones UK Ltd).
Flowprofile
Heat flow
Convection during heating Convection during cooling
Convection
Figure 4.11 Convection flow in a can during tunnel pasteurisation.
Figure 4.10. These machines are relatively sophisticated. They heat and cool thecontainer by the use of water jets whilst passing below these on either a conveyorbed or walking beam. Often they are double-deck machines to accommodate therequired throughput in the minimum space. The heating and cooling of a beveragein a container is by convection set up by the external temperature changes alongthe tunnel bed as illustrated in Figure 4.11.
Steen: “chap04” — 2006/4/27 — 18:30 — page 103 — #17
SYRUP PREPARATION AND SYRUP ROOM OPERATIONS 103
If we just consider the heating cycle initially, as the water jets contact thecontainer surface they heat this surface up. Through the container wall a temperaturegradient exists due to the conduction of heat through the wall. The temperaturewithin the product adjacent to the wall will depend on the wall thickness at that point.This increase in temperature near the container wall will set up convection currentswithin the bottle. Clearly all pasteurisers and containers are different, thus implyingthat separate tests for each new container, pasteuriser and product are required.In modern pasteurisers continuous control of the pasteuriser can be provided bylogging the temperature of the water jets both along and transversely through thetunnel. One problem that has always been a dilemma is the transverse variability dueto blocked jets, etc. This system of monitoring would give an immediate alarm andallow remedial action to be taken. Clearly regular maintenance of the jets wouldhelp reduce this risk as would regular checks on the instrumentation includingre-calibration.
Using modern control techniques with good instrumentation feedback, controlcan be achieved at all times to ensure that pasteurisation is occurring within tightlimits on a time–temperature basis. These can be recorded on a PC for recordpurposes which, as discussed in Chapter 11 of this book, is extremely important. Itis quite usual to also have a multi-pen chart recorder fitted that will give a manualrecord of the process, though at one transverse position through the tunnel only.Use of a Redpost at regular intervals actually measures the pasteurisation withinthe container as it passes through the tunnel. It acts as a check on the pasteuriserperformance, as it allows a full print out of the pasteurisation performance at the timeit was passed through the system. However, as it only passes through at one positionat a time it is a good idea to do three passes using the middle and two sides to ensureuniformity. The time–temperature profile gives the number of PUs the product hasbeen treated to. Typically, the maximum temperature is up to 70◦C for 20 min.
A problem that regularly occurs during tunnel pasteuriser is downstream stop-pages. This causes the pasteuriser to slow down or worse to actually stop. Theproblem is preventing the product from over cooking whilst still ensuring that itreceives the correct number of PUs. Product spoilage is prevented by rapidly reduc-ing temperatures below 60◦C. When the process starts again, the reverse procedureis applied. Control of the conveying speed can also be used to ensure that the correctpasteurisation levels are achieved. A typical tunnel pasteuriser time–temperaturechart for water and product is shown in Figure 4.12. A typical pasteuriser has twoheating zones: an over temperature zone and a holding zone. Also it has two, some-times three, cooling zones. The temperature gradient must be gradual at all times tominimise thermal stress and possible container bursting. Most modern pasteurisersrecycle the water between chambers to minimise the heating up costs of the water aswell as being environmentally friendly. It is normally only the final cooling sectionwater that is sent to drain. This must be very clean as any residues could lead tocan corrosion problems. Anti-fouling agents are used within the water system tominimise any jet problems.
These machines can also be used as can warmers. A can warmer is useful inperiods of high humidity when the risk of can corrosion is high. This warms the cans

Steen: “chap04” — 2006/4/27 — 18:30 — page 104 — #18
104 CARBONATED SOFT DRINKS
0
10
20
30
40
50
60
70
80
0 10 20 30 40 50 60 70 80
Time (min)
Tem
pera
ture
(°C
)Water
Product
Figure 4.12 Time–temperature graph for a tunnel pasteuriser.
above the dew point and reduces the risk of condensation occurring within the sec-ondary packaging. This can give rise to corrosion within the scoring on the ring pull.
4.8.2 Flash pasteurisation
A flash pasteuriser is basically a hygienically designed heat exchanger. They arenormally of plate design but can be tubular if dealing with large fruit cells. A typicalsystem is shown in Plate 4.2. The product is heated and then held at a set temperaturein a holding tube. For a known flow rate the residence time can be determined inthis fixed diameter tube. After this the product is cooled to the required temperaturefor filling. During the heating and cooling process regeneration is used to minimiseenergy costs. Carbonated products can be flash pasteurised within such systemsif required, though clearly parts of the system need to be able to withstand thepressures generated. However, it is normal practice to post carbonate. An argumentexists that once a product has been flash pasteurised then it should be filled as quicklyas possible through the minimum number of processes to prevent re-contaminationoccurring. With flash pasteurising, it has always been a problem to keep the productfree from contamination before it is filled. The use of microbial sprays and good CIPsystems on the filler can allay some of these fears, as the product is never exposedto atmosphere once pastereurised. It is also possible to just flash pasteurise onlythe sensitive components of a beverage and then mix these with the non-sensitiveparts: usually water. If this water is treated and then made microbiologically safeby UV treatment this will produce a similar result to treating the whole productbut at a lower cost, both capital and operating, with no real extra risk involved.Clearly this would have to be used in conjunction with a modern metering systemstraight through to the filler, so that no contact with possible contamination couldoccur. The normal limits for a flash pasteuriser are 30–60 s at 85–93◦C. This wouldgive, at the top end, PUs of 51,188 according to the formula above. Control within

Steen: “chap04” — 2006/4/27 — 18:30 — page 105 — #19
SYRUP PREPARATION AND SYRUP ROOM OPERATIONS 105
±1 PU is possible, which when one considers that this represents a deviation of0.1◦C shows how well these systems have been developed.
The plates are designed to distribute the liquid, whether product or process,uniformly across the width of the plate. The main plate area is designed to promoteturbulent flow, which in turn implies improved heat transfer, taking into accountthe need for minimal pressure drop across the plates. A flash pasteuriser is nor-mally constructed of plates which alternatively carry product and heating or coolingmedium. To give maximum regeneration, the product being heated is placed nextto the product being cooled. It is only at the end of the heating cycle that hot wateris needed and at the exit of the unit that low outlet temperatures are needed. Here itis common to use food quality propylene glycol as the cooling medium. The platescan be welded or gasketed together, it also being possible to glue these gasketsin position if required. These plates are then held together in a frame. The gapbetween these frames allows for fruit cell products to be treated as gaps of up to12 mm are available. It is normal to have a pre- and a post-tank. These are used ifa problem occurs during processing and it is necessary to re-circulate the productthrough the flash pasteuriser again. This implies that great care is required in thedesign and specification for such systems. They need to be fully instrumented withan efficient plc control system. A flash pasteuriser is installed to minimise the riskagainst product spoilage. The system design must ensure that this occurs.
4.9 Clean-in-place systems
Sanitation is principally undertaken to remove all undesirable matter from anysurface in contact with the product to a level at which the residues remainingpresent minimal risk to the product during its shelf life. By shelf life we imply thestated shelf life plus a reasonable period afterwards, such that due diligence can beseen to apply. Undesirable matter includes micro-organisms, ingredient residues,foreign bodies and cleaning materials. The last one is often forgotten about, and it iscritically important to ensure that any chemicals used for sanitation are effectivelyremoved prior to the plant re-commencing production. If we are to ensure anysterility within the filling process it is necessary to ensure that adequate cleaningregimes are in place. It is normal to have a series of tanks to hold the various CIPchemicals, including water, such that several plant items can be cleaned at once.The main aim of a CIP system is to provide sufficient contact time for the chemicals,at the required temperature, whilst at the same time allowing sufficient mechanical‘scouring’ of plant and pipelines, at a velocity in the turbulent regime in excessof 1.5 m/s. Hence a CIP system needs to use the four energy factors of mechanicalor scouring energy, chemical energy, thermal energy and time. A typical systemis shown schematically in Figure 4.13. These systems normally operate on thefollowing basis:
1. Rinse the system out for a predetermined time using water to drain.2. Circulate 1.5% hot caustic at 80◦C for about 15 min. To ensure that the
required temperature of the caustic has been reached it is measured at the

Steen:“chap04”
—2006/4/27
—18:30
—page
106—
#20
106C
AR
BO
NA
TE
DSO
FTD
RIN
KS
Hotwater
Caustic Firstrinse
Finalrinse
Coldwater
Firstcleaningcycle
Hotwaterreturn
Hotwaterin
Causticconcentrate
P
P
P
P
Secondcycle
Sanitiser
Figure 4.13 CIP system schematic.

Steen: “chap04” — 2006/4/27 — 18:30 — page 107 — #21
SYRUP PREPARATION AND SYRUP ROOM OPERATIONS 107
exit from the system being cleaned: this ensures that all parts to be cleanedhave been subjected to a minimum caustic temperature. The clean cycletime is only taken when the temperature is equal to or greater than theset temperature. The caustic lye is returned to the hot caustic tank throughfilters. It is usual to use an in-line heat exchanger to heat the lye.
3. Hot water is then circulated at 75◦C for 15 min, allowing the interface withthe caustic to go to drain. This is done by time, as the flow rate and pipediameter are known. For safety reasons a conductivity probe is often usedas a secondary device to ensure no lye is left within the system. The mainhot water is returned to the lagged hot water tank via a filter.
4. A cold water rinse back to the main system water tank is then used. Thewater, filtered to the order of 2 µm absolute just prior to the tank inlet,within this tank is then used for the next CIP as the initial rinse to drain.Sometimes a sanitiser is added to the final cold water rinse. This needs tobe dosed in accurately, and is kept in the cleaned system until just prior touse, where it is cleaned with clean rinse water.
For certain products an acid also has to be used to ensure full cleaning. This is oftenthe case when dealing with fruit pulp, which tends to stick to pipe surfaces.
The use of such a system is mandatory if product spoilage is to be minimised.Clearly for each product a different set of parameters may have to be used if certainproduct residues are to be completely removed. Some soils may have dried ontosurfaces and be very difficult to remove. Each plant area to be cleaned will bedifferent and a separate programme will be required for each. In any system designseparate circuits for different process areas are required, such that efficient cleaningcan take place whilst other plant items are operating normally. Gone are the dayswhen cleaning was only done at weekends. Now it quite often needs to be doneseveral times a day especially when dealing with sensitive products and processes.If a CIP is not done regularly any soils will be that much harder to remove. It isimperative that a regular cleaning routine is set in place. Full records must be keptof each cleaning operation; this includes records of all return temperatures, flowrates, times and chemical concentrations by interfacing with a simple spreadsheetcomputer programme.
The CIP chemicals normally come in IBCs, which can be stored in an isolatedarea away from all ingredients prior to use. They are normally then lifted onto a smallplatform and connected to the CIP system. For large installations, the chemicalscan be bulk delivered to storage vessels on site. Safety to operatives and spillagerisks need to be considered in this part of the design.
It is important to ensure that the final rinse water is filtered to at least 2 µmabsolute to minimise any risks. All temperature, dosing meters and concentrationprobes must be regularly re-calibrated to ensure that the system will effectivelyclean at all times. For tanks spray balls are used. It is important that the cleaningfluids do not settle in vessels, as this can lead to scum lines which are difficult toremove. Full contact for a given period is required with continuously moving liquidto achieve optimum cleaning conditions.
Steen: “chap04” — 2006/4/27 — 18:30 — page 108 — #22
108 CARBONATED SOFT DRINKS
4.10 Process plant hygiene requirements
Poorly installed plant and pipework will give rise to microbial problems. As dis-cussed in the previous section, CIP will ensure that all these can be kept clean. Itcan only do this if the plant itself has been well designed and installed. Problemsoccur where there are deadlegs in pipe systems, at pipe joints and where valves areinstalled. Only accredited stainless steel welders, working to agreed specifications,should be employed.
Micro-organisms can attach to surfaces and ultimately form layers of biofilmsor can be incorporated in the soil. The numbers of microbes will multiply dependenton time, temperature, available water, nutrient supply and microbial agents. Oftenthis rate of increase can be exponential. It is important in any design that no area isdesigned in to allow these microbes to grow. In the literature many instances of poordesign giving rise to expensive costs due to product recalls, and worse illness andeven death, are given. It is worth spending a bit more on plant items and attentionto detail to minimise such risks. This begins at the system specification stage, andincludes not only major plant items but the valve choices and the pipework layout.Clearly for all these systems sanitation needs to be addressed. It is no use having awell-designed plant if no CIP plant is included. For this reason all plants must becapable of withstanding the chemical and temperature treatments that they are goingto be subject to during their lifetime. Most major plant items are depreciated over tenyears and have up to twenty years of life. This factor has also to be taken into account.Unfortunately there are few international hygiene standards, and those that do existare mainly associated with the dairy industry. The EC Directive 98/37/EC does havea short relevant section which states that plants intended for the preparation andprocessing of foods must be designed and constructed so as to avoid health risks.It has seven hygiene rules that must be observed: the suitability and cleanabilityof materials in contact with food, surface finish and design features such as joints,absence of ridges and crevices, avoidance of the use of fasteners such as screwsand rivets (as these can come loose and fall in the product), the design of internalangles and corners, drainage of residues from plant surfaces, dead spaces and voidsand finally shaft seals and bearings. Compliance to this directive is shown in theCE mark. This directive also includes a section that states that plant suppliers mustindicate the recommended cleaning chemicals and cleaning methods for both openitems such as conveyors and closed items such as pipelines where CIP systems willbe used.
Materials in contact with the product must be resistant to chipping, cracking,flaking, corrosion and abrasion as well as preventing the penetration of unwantedmaterial. They must have adequate strength over the expected temperature range, benon-toxic, non-absorbent and non-tainting. Whilst various grades of stainless steelexist, the use of type 316 seems to satisfy all these requirements. The surface finishis equally important, as soiling can be difficult to remove if the surface roughnessis high. For a process plant where the product is in contact with the surface, andCIP systems need to be employed, a surface finish of 0.8 µm Ra should be used.

Steen: “chap04” — 2006/4/27 — 18:30 — page 109 — #23
SYRUP PREPARATION AND SYRUP ROOM OPERATIONS 109
Due to wear and tear with age any surface will deteriorate. Inspections of pipesurfaces needs to be carried out periodically to ensure that if this is the case, thenthat section of pipe can be replaced. Welds and joints on vessels, such as syrupmixing tanks, need to be smooth and continuous. Flanged joints must be carefullysealed with a gasket to prevent any possible micro-organism ingress. This appliesin flash pasteurisers, for instance. All fasteners should be very carefully considered.Besides the fact that they can come loose and fall into the product, they do presenta microbial risk in themselves. They need to form a bacterial tight seal at all times.Self-drainage from any plant item must not be impaired. It must be designed into anyprocess system. Like the problem of dust in the corners of a room, it is important toensure that no internal angles or corners exist where microbial growth could occur.They must be well radiused.
Probably the most important criteria in any pipeline is to ensure no deadlegs.Whilst the design of the system may well not include any, it is not unknown for themto be introduced during installation for expediency. If they are unavoidable thenthey must be readily accessible for cleaning. Where a bearing or shaft seal is in theproduct area they must use edible lubricant that will not taint the product. How theycan be cleaned as part of the CIP system needs to be carefully considered. Doors,dust covers and panels must be designed and maintained to prevent the ingressof contaminants. Ideally they should be sloped to allow drainage when cleaning.Instrumentation must be constructed of acceptable materials for food use and mustnot contain any liquid that could taint the product; such items include pressuregauges. The design of sampling devices must be carefully considered, as they canlead to possible contamination.
4.11 Syrup room building design
Similar arguments apply to the design of the building such as the ones that apply toprocess plant, and the hygienic design of a building is as important as the hygienicdesign of the plant within it. It needs to be designed to minimise ingress of verminincluding birds. All surfaces must be readily cleanable and the drainage systemmust withstand corrosive chemical attack from cleaning agents. Liquid sugar andconcrete do not go well together. Old syrup rooms used to be potholed due to theaggressive nature of sugar. The buildings need to be split into several parts, so thathazards can be controlled. In the author’s experience the best compromise, as alldesigns are compromises due to the large number of factors that must be satisfied,not least being commercial ones. Raw materials coming in bags and sacks onpallets can well be contaminated. They need to be isolated from the actual processarea. These should be so designed that operatives should weigh out the ingredientsfrom these bags and feed them into a hygienic container, using a sieve to collectany possible unwanted bag or other contaminant. These should then be stored ina separate ingredients room. This ingredients room can then contain the minoringredients weighing station and the pre-mix vessels. As this is this area where the
Steen: “chap04” — 2006/4/27 — 18:30 — page 110 — #24
110 CARBONATED SOFT DRINKS
ingredients are exposed, it is classified as high risk area. Special attention to itsdesign is required. It should be a separate hygienically designed room with securitydoors. The standard of floor and wall finish must be of a high hygienic order. This isnormally a food grade floor, such as epoxy or tiled, with a food quality wall coveredto the floor. This will normally have a suspended ceiling. The light fittings musthave diffusers fitted, and care must be taken to prevent any vermin, insect or birdingress. All holes for pipework through the walls need to be carefully consideredto ensure that they are well sealed.
An area primarily for liquid sugar and citric acid, which can be delivered inbulk, needs to be provided. If juice products are being used then juice tanks need tobe provided. As these vessels will be constructed of 316 stainless steel with suitablevalves and pipework that can be located in the main syrup room. The main syruproom with the metering plant and final product batch tanks, if used, can be installedin the same area as the storage vessels. In all cases the product is fully enclosedand the risk of airborne contamination is low. Often this area is sited in the mainfactory area for ease of access by staff.
The main ingredient store should be sited with an external door. No especialcare should be taken with the construction of this room except that the floor needsto be constructed so as to prevent possible deterioration due to chemical attack.The CIP system should ideally be installed in a separate room, as the chemicalsfor cleaning can be aggressive. However, owing to space and cost constraints theyare often installed in the main factory, in a side area that is well bunded. For safetyreasons it is normal to ensure that safety showers are installed in this area. It isnormal to rack the palletised ingredients. These should allow all pallets to be storedoff the floor so that the area can be effectively cleaned.
The area should include a specially designed cleaning system specifically forwalls and floors. These normally have a ring main from which cleaning lances canbe connected. They can wash down with rinse water, hot water or chemicals to apredetermined programme.
It is important to have a hand wash bay on entering the pre-mix area, such that itis mandatory that all staff to wash their hands on passing through it. The best designfor these is a corridor with wash basins sited such that they present a barrier thathas to be gone round purposefully to avoid using them. Hygienic air hand driers arenormally used in conjunction with these hand wash facilities, though the preferencethese days seems to be for disposable paper towels. Ideally all employees workingin these sensitive areas should be encouraged to take national hygiene courses andobtain the necessary qualifications.
4.12 Future developments
For large plants the trend will continue for in-line blending and carbonation. This isideal for major brand production. For smaller batches batch-continuous productionto large (ca. 30,000) vessels will be usual. It is far better to ensure that you havethe Brix correct before carbonating. In this way the process is fully in control and

Steen: “chap04” — 2006/4/27 — 18:30 — page 111 — #25
SYRUP PREPARATION AND SYRUP ROOM OPERATIONS 111
product loss is minimised. Such systems allow the plant to operate at the lower endof any specification and thus generating money with minimum risk to the product.The increasing cost of transport could well see the return of smaller factories feedingspecific areas of a country. In this case it is likely that one mass flow metering skidcould feed direct on-line to the carbonator for the long-run length products, whilsta second mass flow skid would feed syrup vessels of 10,000 l capacity for the short-run length products. As these short-run length products are more and more likelyto become specialised products of high value the accuracy of metering and gettingit right first time is of paramount importance. This can only be achieved usinghighly accurate and highly reproducible measuring equipment that also allows fulltraceability of product ingredients.

Steen: “chap05” — 2006/4/27 — 18:30 — page 112 — #1
5 Carbon dioxide, carbonation and the principlesof filling technologyDavid P. Steen
5.1 Introduction
Carbonated water is water containing carbon dioxide and is produced by passingcarbon dioxide under pressure through water. To produce a ready to drink (RTD)carbonated soft drink, carbonated water is combined with a syrup.
Naturally occurring carbonated mineral waters have been around for a longtime. These effervescent waters exist due to excess carbon dioxide in an aquiferhaving dissolved under pressure. Whilst claims for the medicinal properties of thesemineral waters have been grossly exaggerated, the presence of carbon dioxide doesmake aerated waters and soft drinks both more palatable and visually attractive.The final product sparkles and foams. It gives the ‘fizz’ to carbonated drinks, thecork pop and bubbles in champagne and the head to beer.
The first non-carbonated soft drinks appeared during the seventeenth century.Joseph Priestley produced the first man-made palatable, carbonated water in 1767,whilst three years later a Swedish chemist Torbern Bergman invented the processthat produced carbonated water from the reaction between chalk and sulphuric acidthus allowing the commercial production of aerated mineral water. A few years laterin 1783 Jacob Schweppe, a young watchmaker and amateur scientist, perfectedan efficient system for manufacturing carbonated mineral water and founded theSchweppes Company in Geneva. He relocated to Drury Lane, London, England in1790. These machines were mass manufactured for sale to others. Since then theaddition of flavourings to aerated waters has seen the development of major softdrinks brands throughout the world. To meet the need for carbonated soft drinks thesoda fountain was developed by Samuel Fahnestock in the USA in 1819. The first USpatent was issued for the ‘means of manufacture of imitation mineral waters’ in 1810to Simons and Rundall. However, it was not until 1832 that carbonated beveragesbecame popular, when John Mathews developed his machine for carbonating water.The notable achievements of patenting the crown cork by William Painter in 1892and the automatic production of glass bottles using a glass blowing machine in1899 by Michael J. Owens, at last allowed carbonated soft drinks to be successfullybottled without significant loss of carbonation. Since then developments in closuretechnology, glass and PET bottle production, can design and manufacture, syrupmaking methods, carbonation technology and filling machine developments as well

Steen: “chap05” — 2006/4/27 — 18:30 — page 113 — #2
THE PRINCIPLES OF FILLING TECHNOLOGY 113
as secondary packaging developments have led to the worldwide beverage industryas we know it today.
In this chapter, we will explore the basic chemistry of carbon dioxide, how itis produced, the required specification, delivery to the customer and storage onsite. We will then look at methods of vaporising the gas and how this gas can beeffectively used to carbonate soft drinks. An introduction to carbonated soft drinksfilling is then considered, forming the basics for a more detailed discussion ofmodern filling techniques in Chapter 6.
5.2 Carbon dioxide
Carbon dioxide was one of the first gases to be described as a substance distinctfrom air. The Flemish chemist Jan Baptist van Helmont in the early seventeenthcentury noted that when he burned charcoal in a closed vessel, the mass of theresulting ash was much less than that of the original charcoal. He interpreted thatthe rest of the charcoal must have been transmuted into an invisible substance hetermed a ‘gas silvestre’, which we now know as carbon dioxide. Carbon dioxidewas studied more thoroughly by a Scottish professor of medicine, Joseph Black. Hefound that limestone (calcium carbonate) could be heated or treated with acids toyield a gas that he called ‘fixed air’. He observed that this fixed air was denser thanair and did not support either flame or animal life. He also found that this gas would,when bubbled through an aqueous solution of lime (calcium hydroxide), precipitatecalcium carbonate. He used this phenomenon to demonstrate that carbon dioxideis produced by animal respiration and microbial fermentation.
Carbon dioxide is a colourless, non-toxic, inert gas that is virtually tastelessand is readily available at a reasonable cost. It is soluble in liquids, the degree ofsolubility increasing as the liquid temperature decreases, and can exist as a gas,liquid or a solid. When dissolved in water it forms carbonic acid. It is carbonic acidthat produces the acidic and biting taste found in carbonated waters and soft drinks.Above a certain level of carbonation carbon dioxide has a preserving property,having an effective antimicrobial effect against moulds and yeasts. It achieves thiswith moulds by depriving the moulds of oxygen required for growth whilst withyeasts it tends to stop the production of more carbon dioxide as a by-product of thefermentation of sucrose to ethanol.
Carbon dioxide gas is heavier than air, having a density of 1.98 kg/m3 at 298 K,some 1.5 times that of air. It has a molecular weight of 44.01 and does not burn,though it will support the combustion of magnesium. As it is fully oxidised, it isnot very reactive. It is a fairly stable compound that only decomposes at very hightemperatures into carbon and oxygen. It can cause death by suffocation if inhaledin large amounts. The gas is easily liquefied by compression and cooling. Whenliquid carbon dioxide is quickly decompressed it rapidly expands and some of itevaporates, removing sufficient heat so that the rest of it cools into solid carbondioxide.
Steen: “chap05” — 2006/4/27 — 18:30 — page 114 — #3
114 CARBONATED SOFT DRINKS
Carbon dioxide is a waste product in organisms that obtain energy from breakingdown sugars or fats with oxygen as part of their metabolism. This process is knownas cellular respiration. This includes all animals, plants, many fungi and somebacteria. Plants utilise carbon dioxide during photosynthesis thereby constructingcarbohydrates. In higher animals carbon dioxide is primarily held in solution inthe blood which transports it from the body’s tissues to the lungs to be exhaled.It makes up some 0.038% by volume of the earth’s atmosphere. In various partsof the world it is formed underground and issues from fissures within the earth.This happens notably in Italy, Java and Yellowstone National Park in the USA.Carbon dioxide is a known contributor to the greenhouse effect, the balance in theatmosphere increasing each year thus disrupting the natural carbon dioxide cycle.The initial carbon dioxide in the earth’s atmosphere was produced by volcanicactivity. This was essential for a warm and stable climate conducive to life. Currentvolcanic releases are some 1% of that released by human activities. The earth’soceans contain a large amount of carbon dioxide in the form of bicarbonate andcarbonate ions and much more than that found in the atmosphere. The carbondioxide is in the form of bicarbonate and carbonate ions, the bicarbonate beingproduced in reactions between rock, water and carbon dioxide. An example is thedissolution of calcium carbonate:
CaCO3 + CO2 + H2O � Ca2+ + 2HCO−3
Such reactions tend to buffer atmospheric changes. Reactions between carbon diox-ide and non-carbonate rocks also add bicarbonate to the oceans. These reactionscan later be reversed to form carbonate rocks thereby releasing half of the bicar-bonate as carbon dioxide. This has produced large quantities of carbonate rocksover the last few million years. So much now exists that if all these carbonate rockswere converted back to carbon dioxide, the resulting level of carbon dioxide wouldweigh 40 times as much as the rest of the atmosphere. Eventually most of thecarbon dioxide added to the atmosphere will be absorbed by the sea and becomebicarbonate ions, the process taking about one hundred years to achieve.
Carbon dioxide can exist as a solid, a liquid or a gas. The effect of temperatureand pressure on the state of carbon dioxide can be seen from the phase diagram asshown in Figure 5.1. At the triple point carbon dioxide can exist simultaneouslyin the three states as a solid, a liquid or a gas by just a small perturbation. Allphases are in a state of equilibrium at the triple point. This exists at 5.11 bar and−56.4◦C. Above 31◦C it is impossible to liquefy the gas by increased pressure. Thisis termed the critical point. At normal temperatures and pressures carbon dioxideis a colourless gas. At high concentrations it has a slightly pungent odour. Carbondioxide cannot exist as a liquid at atmospheric pressure. Liquefying occurs bycompression and cooling between the pressure and temperature limits at the triplepoint and the critical point. Above the critical point of 31◦C it is impossible toliquefy the gas by increasing the pressure above the corresponding critical pressureof 73 bar. When liquid under pressure is released to the atmosphere it is released as agas and a solid only. This appears as a dense white cloud because of the solid content

Steen: “chap05” — 2006/4/27 — 18:30 — page 115 — #4
THE PRINCIPLES OF FILLING TECHNOLOGY 115
0.001
0.01
0.1
1
10
100
1000
–140 –120 –100 –80 – 60 – 40 – 20 0 20 40
Temperature (°C)
Pre
ssur
e (b
ar)
Gas phase
Liquid phase
Solid phase
Triple point – 56.6°C at 5.11 bar
Critical point
Figure 5.1 Carbon dioxide phase diagram.
and the condensation of atmospheric moisture at the low temperatures obtained. Thesolid falls to the ground as snow. The compression of this snow forms a translucentwhite solid known as dry ice.
As carbon dioxide regulates the breathing function, an increase in concentrationcauses an increased breathing rate. The Occupational Exposure Standard (OES),from EH40, which is updated annually, is 0.5%. However, changes in the breathingrate may not be noticed until the concentration reaches 2%. At this concentration thebreathing rate increases to about 50% above the normal level. Prolonged exposureat this level for several hours may cause a feeling of exhaustion and a headache. Athigher concentrations carbon dioxide may cause asphyxiation and can temporarilyparalyse the respiratory system. Breathing in a rich carbon dioxide atmosphere cancause immediate rapid breath and loss of consciousness. Symptoms of asphyxiationcan include rapid and gasping respiration, nausea, vomiting, cyanosis and rapidfatigue. This may lead to loss of consciousness or death from anoxia. Hence thehazards associated with the use of carbon dioxide need to be explained to anypersonnel who may be exposed to it.
5.3 Production of carbon dioxide
Carbon dioxide is produced commercially by several different processes. Theseinclude the combustion of fuel oil, the reaction between sulphuric acid and sodiumbicarbonate, the extraction of carbon dioxide from the flue gas of a boiler or similarheating facility, the distillation of alcohol and the fermentation of beer. It can also beextracted from waste gas streams. Table 5.1 shows the various possible processesused to produce carbon dioxide. Following this extraction the gas must then be

Steen: “chap05” — 2006/4/27 — 18:30 — page 116 — #5
116 CARBONATED SOFT DRINKS
Table 5.1 Various carbon dioxide production systems
Feedstock By-product from Throughputtonne/h
CO2 from fermentation Brewing fuel ≤8ethanol distilleries
CO2 from Hydrogen 1–20solvent-based acid Ammoniagas removal systems Methanol
Other syngasProcessingNatural gasSweetening
CO2 rich off-gas PSA hydrogen 0.1–20Mineral processing
CO2 lean gas PSA hydrogen purification 0.1–20Direct iron ore reduction
Flue gas Process steam boilers 0.1–20Power plantsGas engines
Oil or natural gas N/A 0.1–1
Landfill gas processing N/A
cleaned to ensure it is free from any impurities and is fit for the purpose. The mosteconomical sources of carbon dioxide are carbon dioxide wells and natural gassweetening or synthetic gas purification by-products.
5.3.1 Fermentation
When a sucrose-based solution is mixed with yeast and oxygen in a fermenter,carbon dioxide vapour and alcohol are produced. The carbon dioxide can then bepassed through a separator to remove trace carryover of foam. Once the foam hasbeen removed the carbon dioxide is compressed. It is then scrubbed by water ina packed tower, removing water-soluble impurities such as alcohol and ketones.A typical process flowchart is shown in Figure 5.2. The system can operate withinlet purity as low as 80% recovering up to 99.9% CO2. Such a plant can yieldup to 99.998% pure carbon dioxide. Such plants operate in both breweries anddistilleries. This process normally provides the cheapest source of carbon dioxidewhen it is available in sufficient quantity.
5.3.2 Flue gas recovery
These systems can be directly fired from a self-contained system designed specif-ically to produce a flue gas for carbon dioxide recovery or be a recovery system

Steen:“chap05”
—2006/4/27
—18:30
—page
117—
#6
Foamtrap
Feed gas
Drain
Water
Boostercompressor
Drain
Watercooler
Intercooler
Aftercooler
Liquid CO2 tank
Vent
Liquid CO2 stripping Column
CO2 condenser
Air
CO2 deodoriser/drier
Scrubber
Figure 5.2 Typical carbon dioxide fermentation recovery system.
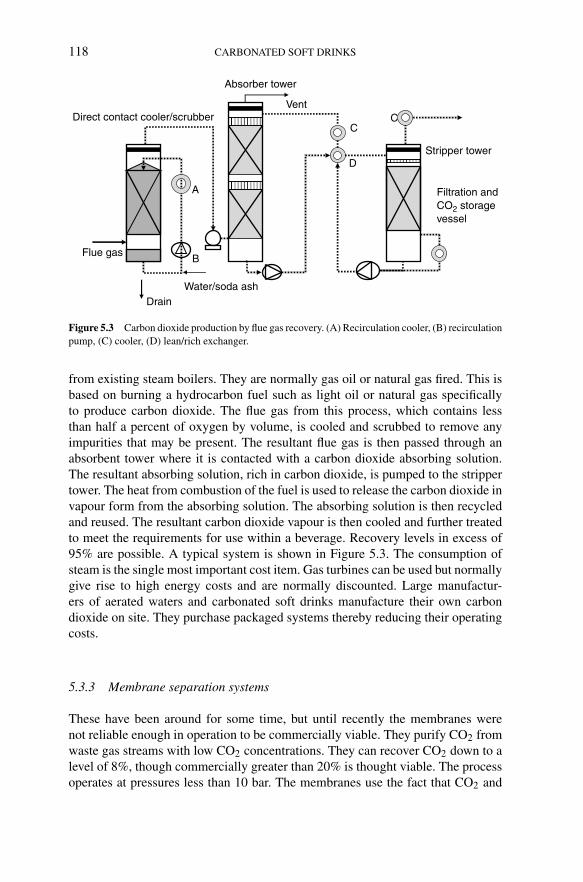
Steen: “chap05” — 2006/4/27 — 18:30 — page 118 — #7
118 CARBONATED SOFT DRINKS
Drain
Flue gas
Water/soda ash
Direct contact cooler/scrubber
Absorber tower
Vent
Stripper tower
Filtration andCO2 storagevessel
A
B
C
D
C
Figure 5.3 Carbon dioxide production by flue gas recovery. (A) Recirculation cooler, (B) recirculationpump, (C) cooler, (D) lean/rich exchanger.
from existing steam boilers. They are normally gas oil or natural gas fired. This isbased on burning a hydrocarbon fuel such as light oil or natural gas specificallyto produce carbon dioxide. The flue gas from this process, which contains lessthan half a percent of oxygen by volume, is cooled and scrubbed to remove anyimpurities that may be present. The resultant flue gas is then passed through anabsorbent tower where it is contacted with a carbon dioxide absorbing solution.The resultant absorbing solution, rich in carbon dioxide, is pumped to the strippertower. The heat from combustion of the fuel is used to release the carbon dioxide invapour form from the absorbing solution. The absorbing solution is then recycledand reused. The resultant carbon dioxide vapour is then cooled and further treatedto meet the requirements for use within a beverage. Recovery levels in excess of95% are possible. A typical system is shown in Figure 5.3. The consumption ofsteam is the single most important cost item. Gas turbines can be used but normallygive rise to high energy costs and are normally discounted. Large manufactur-ers of aerated waters and carbonated soft drinks manufacture their own carbondioxide on site. They purchase packaged systems thereby reducing their operatingcosts.
5.3.3 Membrane separation systems
These have been around for some time, but until recently the membranes werenot reliable enough in operation to be commercially viable. They purify CO2 fromwaste gas streams with low CO2 concentrations. They can recover CO2 down to alevel of 8%, though commercially greater than 20% is thought viable. The processoperates at pressures less than 10 bar. The membranes use the fact that CO2 and
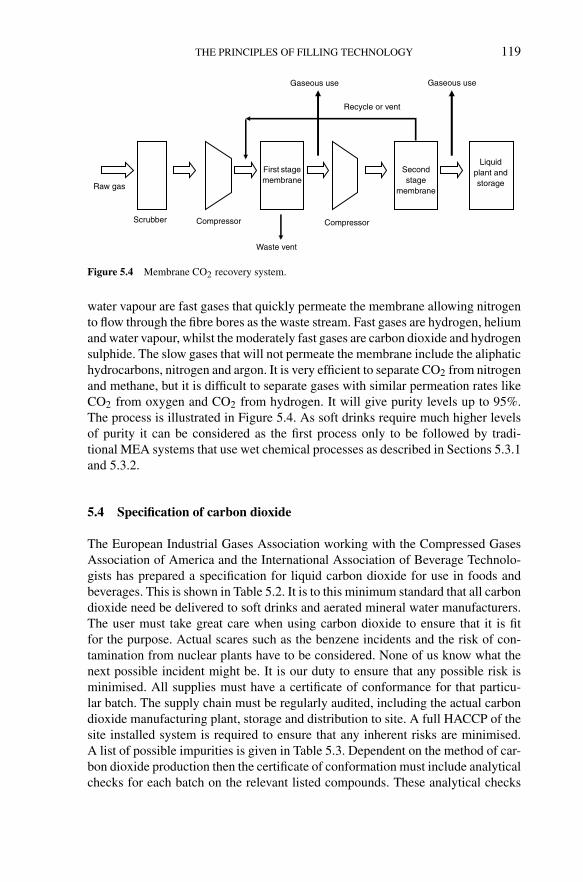
Steen: “chap05” — 2006/4/27 — 18:30 — page 119 — #8
THE PRINCIPLES OF FILLING TECHNOLOGY 119
Gaseous use
Recycle or vent
Compressor
Waste vent
CompressorScrubber
Raw gas
Gaseous use
First stagemembrane
Secondstage
membrane
Liquidplant andstorage
Figure 5.4 Membrane CO2 recovery system.
water vapour are fast gases that quickly permeate the membrane allowing nitrogento flow through the fibre bores as the waste stream. Fast gases are hydrogen, heliumand water vapour, whilst the moderately fast gases are carbon dioxide and hydrogensulphide. The slow gases that will not permeate the membrane include the aliphatichydrocarbons, nitrogen and argon. It is very efficient to separate CO2 from nitrogenand methane, but it is difficult to separate gases with similar permeation rates likeCO2 from oxygen and CO2 from hydrogen. It will give purity levels up to 95%.The process is illustrated in Figure 5.4. As soft drinks require much higher levelsof purity it can be considered as the first process only to be followed by tradi-tional MEA systems that use wet chemical processes as described in Sections 5.3.1and 5.3.2.
5.4 Specification of carbon dioxide
The European Industrial Gases Association working with the Compressed GasesAssociation of America and the International Association of Beverage Technolo-gists has prepared a specification for liquid carbon dioxide for use in foods andbeverages. This is shown in Table 5.2. It is to this minimum standard that all carbondioxide need be delivered to soft drinks and aerated mineral water manufacturers.The user must take great care when using carbon dioxide to ensure that it is fitfor the purpose. Actual scares such as the benzene incidents and the risk of con-tamination from nuclear plants have to be considered. None of us know what thenext possible incident might be. It is our duty to ensure that any possible risk isminimised. All supplies must have a certificate of conformance for that particu-lar batch. The supply chain must be regularly audited, including the actual carbondioxide manufacturing plant, storage and distribution to site. A full HACCP of thesite installed system is required to ensure that any inherent risks are minimised.A list of possible impurities is given in Table 5.3. Dependent on the method of car-bon dioxide production then the certificate of conformation must include analyticalchecks for each batch on the relevant listed compounds. These analytical checks

Steen: “chap05” — 2006/4/27 — 18:30 — page 120 — #9
120 CARBONATED SOFT DRINKS
Table 5.2 Commodity specification for carbon dioxide (CGA/EIGA limiting characteristics).
Component Concentration
Assay 99.9% v/v minMoisture 50 ppm v/v max (20 ppm w/w max)Acidity To pass JECFA testAmmonia 2.5 ppm v/v maxOxygen 30 ppm v/v maxOxides of nitrogen (NO/NO2) 2.5 ppm v/v max eachNon-volatile residue (particulates) 10 ppm w/w maxNon-volatile organic residue (oil and grease) 5 ppm w/w maxPhosphenea ≤0.3 ppm v/vTotal volatile hydrocarbons (calculated 50 ppm v/v max of which 20 ppm v/v max
as methane) non-methane hydrocarbonsAcetaldehyde 0.2 ppm v/v maxBenzene 0.02 ppm v/v maxCarbon monoxide 10 ppm v/v maxMethanol 10 ppm v/v maxHydrogen cyanideb <0.5 ppm v/vTotal sulphur (as sulphur)c 0.1 ppm v/v maxTaste and odour in water No foreign taste or odour
a Analysis necessary only for carbon dioxide from phosphate rock sources.b Analysis necessary only for carbon dioxide from coal gassification sources.c If the total sulphur content exceeds 0.1 ppm v/v as sulphur then the species must be determinedseparately and the following limits applied:
Carbonyl sulphide: 0.1 ppm v/v maxHydrogen sulphide: 0.1 ppm v/v maxSulphur dioxide: 1.0 ppm v/v max
need to be carried out to the ISBT agreed standards. The risk of contamination isvery real. If too much gas is withdrawn off the top of the tank then contaminantscan build up due to distillation of the liquid carbon dioxide within the tank. Otherpossible risks are oil contamination from the transfer pump between the deliverytanker and the user’s tank, degradation of the delivery hose, contaminated hoseconnections by particulates, water, oil or mud or contamination by the backflowof cleaning fluids from the user’s process. Dedicated tankers are required, whichare not used on nuclear plants or such, where a risk of cross contamination exists.As the supplier guarantees the quality of the carbon dioxide with a certificate ofanalysis for each batch delivered, the need to analyse the carbon dioxide is not feltto be necessary for the users.
5.5 Delivery to the customer
Carbon dioxide is delivered as a liquid, most frequently by road tanker. It is thentransferred to pressurised vessels of 5–50 tonne capacity and held at a pressure
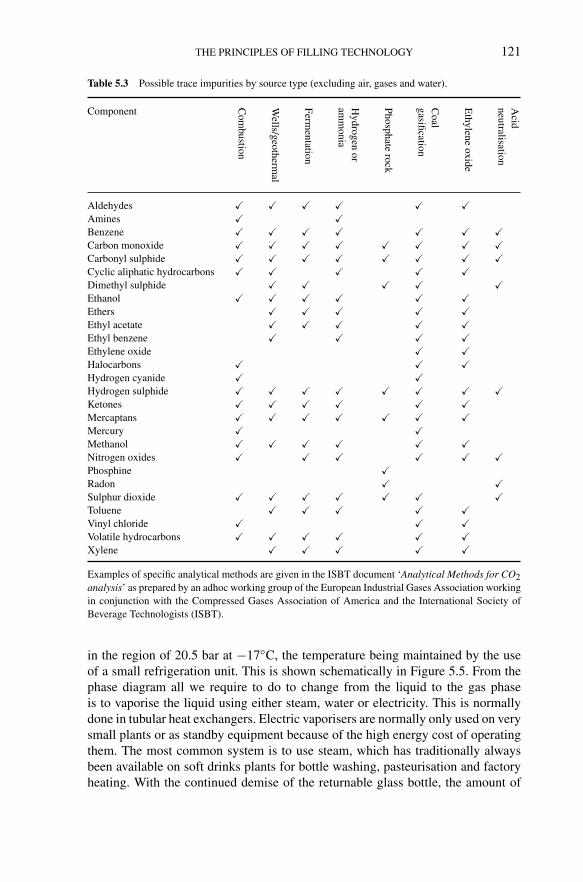
Steen: “chap05” — 2006/4/27 — 18:30 — page 121 — #10
THE PRINCIPLES OF FILLING TECHNOLOGY 121
Table 5.3 Possible trace impurities by source type (excluding air, gases and water).
Component
Com
bustion
Wells/geotherm
al
Fermentation
Hydrogen
oram
monia
Phosphaterock
Coal
gasification
Ethylene
oxide
Acid
neutralisation
Aldehydes � � � � � �Amines � �Benzene � � � � � � �Carbon monoxide � � � � � � � �Carbonyl sulphide � � � � � � � �Cyclic aliphatic hydrocarbons � � � � �Dimethyl sulphide � � � � �Ethanol � � � � � �Ethers � � � � �Ethyl acetate � � � � �Ethyl benzene � � � �Ethylene oxide � �Halocarbons � � �Hydrogen cyanide � �Hydrogen sulphide � � � � � � � �Ketones � � � � � �Mercaptans � � � � � � �Mercury � �Methanol � � � � � �Nitrogen oxides � � � � � �Phosphine �Radon � �Sulphur dioxide � � � � � � �Toluene � � � � �Vinyl chloride � � �Volatile hydrocarbons � � � � � �Xylene � � � � �
Examples of specific analytical methods are given in the ISBT document ‘Analytical Methods for CO2analysis’ as prepared by an adhoc working group of the European Industrial Gases Association workingin conjunction with the Compressed Gases Association of America and the International Society ofBeverage Technologists (ISBT).
in the region of 20.5 bar at −17◦C, the temperature being maintained by the useof a small refrigeration unit. This is shown schematically in Figure 5.5. From thephase diagram all we require to do to change from the liquid to the gas phaseis to vaporise the liquid using either steam, water or electricity. This is normallydone in tubular heat exchangers. Electric vaporisers are normally only used on verysmall plants or as standby equipment because of the high energy cost of operatingthem. The most common system is to use steam, which has traditionally alwaysbeen available on soft drinks plants for bottle washing, pasteurisation and factoryheating. With the continued demise of the returnable glass bottle, the amount of

Steen: “chap05” — 2006/4/27 — 18:30 — page 122 — #11
122 CARBONATED SOFT DRINKS
Refrigerationunit
CO2road tanker
Pump
SteamCO2vaporiser
To carbonatorat around 15 bar pressure
Liquid
Gas
Insulated CO2tank
Gas
Liquid
Figure 5.5 Carbon dioxide delivery schematic.
steam consumed and therefore the amount of steam required to be generated isreducing. This is only partly made up by the increasing requirement to pasteuriseproducts. The use of water is becoming more attractive as it is cheaper to useand the process actually reduces the temperature of the water, though not by asignificant amount. This saves subsequent product cooling costs as well as thecost of steam generation. A typical 2 tonne/h carbon dioxide vaporisation systemrequires a constant flow rate of 50 m3/h of water at ambient temperature to beeffective. Yet another method is the use of ambient air blown across evaporatorcoils. This is stated to achieve significant energy savings over conventional steamvaporisation.
It is important to ensure that both the gas phase and the liquid phase in thetanker and the receiving tank are connected. This allows the gas, displaced bythe liquid, to be delivered to the storage tank, to flow into the tanker and balance thepressure between the two vessels. Non-return check valves must be incorporatedto ensure that no backflow occurs. The system needs to be installed in accordancewith the recommendations of the gas supplier, whilst regular planned maintenanceon the system is necessary to ensure that risks are minimised.
Carbon dioxide fed to the production line should be filtered to remove any pos-sible contaminants. Whilst each batch has a certificate of conformance it is alwaysbetter to be safe than sorry. Risks exist from contamination by sulphur compounds,aromatic hydrocarbons, aldehydes and potentially harmful submicron particulatesand bacteria. Such contaminants can cause off flavours and product spoilage. Mod-ern multi-stage filters can remove water, ethylene glycol, hydrocarbons, ammonia,olefinic hydrocarbons, benzene, volatile oxygenated hydrocarbons, volatile sulphurcompounds, carbonyl sulphide, sulphur dioxide, hydrogen sulphide and other trace
Steen: “chap05” — 2006/4/27 — 18:30 — page 123 — #12
THE PRINCIPLES OF FILLING TECHNOLOGY 123
impurities. The gas is filtered down to 0.01 µm. Again ‘out of sight out of mind’ hasto be taken into consideration. It is critical that if such filters are installed then theseare regularly changed. This is to prevent situations that if a problem has occurred thefilters become saturated and allow the contaminant to leach back into the system.Pressure reducing valves are fitted in the supply line to the carbonator after thevaporiser.
5.6 Carbon dioxide storage
The tanks are either sited vertically or horizontally, with the current preferencebeing for vertical tanks due to space constraints. They are normally sited outsidewith suitable weather protection for the associated electrical equipment. If it isnecessary to situate the vessel inside a building then adequate ventilation and twoseparate exits must be provided. The basic requirement of any tank is to maintain aconstant tank temperature independent of the environment and the withdrawal rateof the gas. For low and medium pressure tanks it is necessary to use refrigerationunits to cool the gas space in the storage tank so as to maintain the gas temperaturewithin pre-described limits. An electric heater is often incorporated within the tankto ensure that if the gas withdrawal rate is too high then the significant tempera-ture drops, and hence pressure drops, within the tank do not occur. If this was tohappen then a temporary disruption to the gas supply would occur. The tank is nor-mally insulated with at least 10 cm thick urethane. This is normally covered with apre-painted aluminium jacket. The actual tank is usually constructed in fine-graincarbon steel. It is normal practice for a bulk vessel to have at least two suitably sizedrelief valves, connected to the vessel via a changeover valve. This allows one valveto be maintained whilst the other is in operation. The outlets from these valvesmust be piped to a suitable safe point, where any carbon dioxide discharge willnot represent a hazard. These relief valves are fitted to prevent over pressurisationwhich could give rise to tank rupture. For a small cost the company logo or brandis often applied to the tank. Tank instrumentation will include the tank operatingpressure, capacity gauge and a high and low audible alarm. The location of the ves-sel needs to take into consideration access for the delivery unit. An unobstructedaccess route is required such that in the case of an emergency in the vicinity of thestorage vessel the delivery vehicle can be disconnected and moved to a safe placewith the minimum of delay. Care needs to be taken to also ensure the security ofthe vessel, which is normally contained in a locked, fenced-in area. It is importantto regularly survey the vessels to ensure that they conform to the Pressure SystemsRegulations, that they satisfy insurance requirements, that the lagging is in goodcondition so as to keep the gas temperature within the required limits, and that theheating and refrigeration systems are operating satisfactorily. The normal storagepressure is in the region of 20.5 bar at −17◦C. This has been found to be the mostpractical operating level and has been adopted as the worldwide standard by mostcarbon dioxide suppliers. Your carbon dioxide supplier must always confirm hisagreement in writing that your storage system is fit for the purpose. Self-contained

Steen: “chap05” — 2006/4/27 — 18:30 — page 124 — #13
124 CARBONATED SOFT DRINKS
breathing apparatus should be made available if the storage vessel is situatedinside.
5.7 Carbonation
5.7.1 Basic considerations
Plate 5.1 shows bubbles of carbon dioxide in carbonated water floating to thesurface. This occurs when the carbon dioxide bubbles out when carbonated wateris depressurised. If we consider a liquid–gas mixture in a sealed container, the stateof equilibrium is said to exist when the rate of gas leaving the liquid solution equalsthat entering it. If you take any PET bottle of carbonated soft drink and shake it, theliquid gas interface will initially fob. However, after a short while, the equilibriumcondition will have been reached and the liquid will be quiescent. If the cap is thenopened and some of the contents poured out, the cap replaced and the procedurerepeated again, it will be noted that before shaking the bottle is limp but aftershaking it becomes hard. In this process gas has come out of the solution to attainthe equilibrium condition. This state is just stable. Any decrease in pressure, orincrease in temperature, will render the mixture metastable, that is, supersaturated,such that the temperature/pressure combination is insufficient to keep the carbondioxide in solution. If this occurs then the gas is spontaneously released giving riseto fobbing. If the mixtures were agitated or some irritant, such as small particulatesadded to the mix, then the rate of gas release will be even more pronounced. Thisis due to nucleation sites being generated by the presence of these particulates orother gases, such as air.
Any carbonated product that is held in a container that is open to the atmo-sphere will gradually lose carbonation. This is due to the gas being liberated tothe atmosphere as the liquid/gas interface continually strives to achieve the equi-librium condition. In a closed container the gas fills the container headspace, thusincreasing the headspace pressure. This happens quickly at first and then slowlyas equilibrium is approached. The rate of transfer of gas from the product to theheadspace depends on the proximity of the headspace pressure to the equilibriumpressure, the temperature of the liquid, the nature of the beverage, the extent of anyagitation and the presence of any irritants. A quiescent, stable product will takemany hours to reach equilibrium when not subjected to any external forces such asagitation, movement, temperature or pressure change. However, the same productroughly shaken will only take seconds to achieve the equilibrium condition. Thefaster the rate of change towards the equilibrium condition the sooner this conditionwill be reached.
For a given volume, the amount of carbon dioxide which a solution can maintaindepends on the temperature and pressure. The higher the temperature the greaterthe pressure required to maintain the carbon dioxide in solution. Conversely, thelower the temperature the greater the amount of carbon dioxide that is retained insolution. Henry’s law was postulated by William Henry (1774–1836) and states,

Steen: “chap05” — 2006/4/27 — 18:30 — page 125 — #14
THE PRINCIPLES OF FILLING TECHNOLOGY 125
0
5
10
15
20
25
30
0 1 2 3 4 5 6 7 8 9
Pressure (bar)
Tem
pera
ture
(°C
)
6 Vols.5 Vols.4 Vols.3 Vols.2 Vols.1 Vol.
Figure 5.6 Carbonation chart.
‘The amount of gas dissolved in a given volume of solvent is proportional to thepressure of the gas with which the solvent is in equilibrium’, whilst Charles’ law(1746–1823) states, ‘The volume of an ideal gas at constant pressure is directlyproportional to the absolute temperature’. These two laws can be combined to formthe universal ideal gas law:
p · V = m · R · T
where p is the absolute pressure, V is the volume, m is the number of moles of gas,R is the gas constant (for that particular ideal gas) and T is absolute temperature.A mole is that quantity of a substance which has a mass numerically equal tothe molecular weight of the substance. For carbon dioxide the molecular weightis 44.01 and R is 0.18892 J/mol K. From this relationship the carbonation chartshown in Figure 5.6 can be deduced. Here the concept of carbonation volumes isintroduced. Volumes ‘Bunsen’ is where the gas volume is measured at atmosphericpressure (760 mmHg) and the freezing point of water (0◦C). It is defined as thenumber of times the total volume of dissolved gas can be divided by the volumeof liquid in the container. As an example, a product with four volumes carbonationwill contain carbon dioxide to the extent of four times the volume of the beverage.A 1 l container carbonated to 2.5 volumes would contain 2.5 l of carbon dioxide,and likewise a 3 l container carbonated to 4 volumes carbonation would contain12 l of carbon dioxide. One volume ‘Bunsen’ is equivalent to 1.96 g carbon dioxideper litre. This is often simplified to 2 g/l. For PET bottles normally, the smallerthe container the higher the carbonation volumes. As will be discussed in moredetail in Chapter 7, the rate of loss of carbon dioxide by permeation due to a highsurface to volume ratio is large. Shelf life is normally defined as 15% carbonationloss in 12 weeks, which a 2 l bottle can easily meet. This will reduce to ca. 9 weeksfor a 500 ml bottle and some 7 weeks for a 250 ml bottle. The light weighting ofPET bottles gives rise to thinner wall thicknesses and hence greater permeation

Steen: “chap05” — 2006/4/27 — 18:30 — page 126 — #15
126 CARBONATED SOFT DRINKS
Pressuregauge
Releasevalve
Piercer
Frame
Can
Figure 5.7 Measurement of carbonation.
and a shorter product shelf life. Cans have carbonation levels up to 3.5 volumes.Any higher internal pressures that can be generated during expected use wouldcause can rupture to occur. Glass bottles can be designed to accommodate higherpressures, such as tonic water which is traditionally a high volume carbonationproduct, dependent on design and wall thickness.
5.7.2 Carbonation measurement
This is measured using a device similar to that shown in Figure 5.7. It consists ofa jig in which the container can be restrained and a piercer which, when used topierce the container, allows the gas pressure to be read. The container is placed inthe jig and is first of all pierced, then shaken, before the pressure is measured. Therelease valve is then opened until the pressure gauge reads zero and all the gas hasbeen exhausted from the container headspace. The release valve is then closed andthe container shaken again. The pressure is retaken. The container is released fromthe jig and the temperature of the contents taken. The carbonation chart is thenused to determine the volumes of carbonation. Why do we need to go to the extentof releasing the pressure from the container before we take the pressure reading?The problem is air inclusion in the beverage. This gives a twin-gas system of air andcarbon dioxide. It is necessary to first release the air to determine how much carbondioxide is present. Air is approximately one-fiftieth the solubility of carbon dioxidein a liquid. Hence any air contained within the beverage will exclude some 50 timesits own volume of carbon dioxide. The Law of Partial Pressures was postulatedby Jon Dalton (1766–1844) as ‘the pressure P of a mixture of gases that do notchemically react is equal to the sum of the pressures of the individual constituentswhen each occupies a volume equal to that of the mixture at the temperature of the

Steen: “chap05” — 2006/4/27 — 18:30 — page 127 — #16
THE PRINCIPLES OF FILLING TECHNOLOGY 127
mixture’. This can be written for a mixture of N number of gases as
Ptotal = PA + PB + · · · + PN
The partial pressure of a constituent gas in a mixture is equal to the product of thetotal pressure and the mole fraction (X) of that gas in the mixture, that is,
Pi = XiPtotal, where i corresponds to an individual component.
the mole fraction X being a method of expressing the composition of a mixture
Xi = mi/�m and XA + XB + · · · + XN = 1
Air is primarily made up of 79% nitrogen and 21% oxygen, ignoring for simplicitythe presence of the inert gases. In any carbonated mixture we will have carbondioxide, nitrogen and oxygen present. Due to the differing solubility and proportionsof oxygen and nitrogen, the dissolved air actually contains 35% oxygen and 65%nitrogen as the solubility of nitrogen is low. It is this enrichment of oxygen thatcan give rise to spoilage problems with the product if care is not taken to minimisethe amount present. The presence of air will also give rise to a higher pressureand hence a false reading of the volumes carbonation from the carbonation chart.The amount of air present clearly has to be minimised when taking carbonationmeasurements. If we consider a bottle with a gas headspace of 5% of the bottlevolume, on the first snift the gas loss would be 5% of the bottle volume. On thesecond snift we would lose a further 5%. If only carbon dioxide were present in theheadspace we would expect to lose 5% pressure on the first shake and some 7% bythe second shake. If other gases were present we would lose more pressure. Thusthe amount of air present in the product can also be estimated during carbonationmeasurement. If excess air is found then actions need to be taken to minimise itspresence. The problem is often caused by air entrainment or poor sealing with thefiller bowl. This can be seen from an example where by volumetric analysis it hasbeen found that the headspace of a carbonated drink container contains 90% carbondioxide, 3.5% oxygen and 6.5% nitrogen.
For our example if the mixture pressure is taken as 4 bar, then we can developthe table below where M is the molecular weight of the particular gas:
Mi Vi/V (Vi/V)Mi mi/m Pi
Oxygen 32 0.035 1.12 0.026 0.14Nitrogen 28 0.065 1.82 0.043 0.17Carbon dioxide 44 0.90 39.60 0.931 3.60Total 1.00 42.54 1.000 4.00
The carbon dioxide pressure is then only 3.6 bar. From the carbonation chart,assuming a temperature of 20◦C, the volumes carbonation at 4 bar would be 4.3but only 4.1 at 3.6 bar. Hence with the presence of air we have lost 0.2 volumes

Steen: “chap05” — 2006/4/27 — 18:30 — page 128 — #17
128 CARBONATED SOFT DRINKS
carbonation. This is the maximum tolerance normally given for volumes carbon-ation during the manufacture of soft drinks. A typical off-line carbonation checkunit will automatically rotate the container at a given speed for a given numberof revolutions, automatically snift, measure the pressure and temperature and givethe actual volumes carbonation. The principle of the unit is that it does everythingthat a manual unit does but does it repeatedly. Anything done by a human must beprone to change. Each individual will do things slightly differently. What is neededfor process control is total repeatability. Automation of quality control will givethis. It does not matter whether the actual value that the unit gives is 100% correct.What matters is that it is repeatable and that similar instruments will give the samereading. The human variable has been eliminated.
5.7.3 De-aeration
As discussed earlier the presence of air in the product causes product deterioration,as well as giving a false reading of the level of carbon dioxide present due to thepartial pressures involved. Hence we should minimise the amount of air presentduring carbonation. Experience has shown that the aim should be to reduce thelevel of air within the product to below 0.5 ppm wherever possible. In this waythe product will be at minimum risk from deterioration due to the presence ofoxygen, and hence will have an improved shelf life, whilst at the same time thisensures minimal filling problems. The presence of air and carbon dioxide givesrise to the phenomenon known as fobbing, due to nucleation sites being generatedby the presence of air within the product. The higher the air content the moredifficult it is to hold carbon dioxide in solution. Two main methods of de-aerationexist, vacuum or reflux, both of which are normally applied to water rather thanthe final product. This is due to the fact that if we only de-aerate the water thenno product contamination of the equipment occurs and consequently less productrisk is involved. Also the frequency of cleaning is increased. In modern plants itis normal to de-aerate all the water used in the product. This also includes thewater used to make up the syrup content, in this way minimising the amount of airthat is present in the final product. The average throw water to syrup is normallyin the range of 5 or 6 to 1. As syrup also contains water it is usual for addedwater to amount to some 85% of the volume of the product. During processingsimple methods such as introducing all liquids into mixing vessels through thebase of the vessel will minimise the entrainment of air, as will careful mixing of theproduct. It is important after de-aeration not to re-introduce air again because of poorpractices.
Chapter 2 has considered the de-aeration process in more detail. Here we willonly go through the basic operations. The most effective method of de-aeration isto atomise water into a vessel held under a vacuum. In this way air is stripped outas the atomised water is exposed to the vacuum. Water is sprayed into a horizontaltank under vacuum. This is then transferred into a second horizontal tank wherea small amount of stripping gas, normally CO2 or N2, is added. This can reduce

Steen: “chap05” — 2006/4/27 — 18:30 — page 129 — #18
THE PRINCIPLES OF FILLING TECHNOLOGY 129
the residual oxygen level down to 0.05 mg/l. It normally leaves some 0.5 mg/lresidual carbonation, which when the product has to be carbonated anyway is no realproblem. Alternatively, by applying a positive carbon dioxide pressure in a sealedvessel the air attaches to the carbon dioxide, in a process known as nucleation, andis then driven off through a vent. Often these two processes are combined, such thatthe effective use of vacuum de-aeration followed by reflux de-aeration will give anair content of well less than 0.5 ppm in the water and 0.5 ppm in the final product,as the syrup will also have been produced from de-aerated water. GEA Tuchenagenhave developed a system based on the catalytic removal of the oxygen. The rateof water flow and the oxygen concentration in the water are measured accurately.From the values obtained the required amount of hydrogen to be added is calculatedand metered into the system. The hydrogen is then dissolved in a static mixer. Thewater with the dissolved oxygen is then fed through a catalyst bed. Levels as lowas 0.01 mg/l residual oxygen are claimed as is very low energy usage compared tovacuum de-aeration.
5.8 Carbonation systems
5.8.1 Carbonators
The physics of carbonation show that it is simpler to carbonate if the product tem-perature is low. Hence early carbonators used refrigeration to carbonate at ca. 4◦C.A typical system is shown sketched as Figure 5.8. The water only is often carbonatedto ensure minimum contamination of the system by syrup. The product is spreadover chilled plates, such that the product runs down the plates as a thin film. Thisis carried out in a constant pressure carbon dioxide atmosphere, the lighter air thatis displaced being bled off. The product being chilled as a film maximises the sur-face area available to the carbon dioxide thus promoting effective carbonation. Thisalso has the added benefit that at a lower temperature the carbon dioxide stays insolution easier, thus minimising future filling problems. However, the energy usageis high and packaging problems are created due to condensation within shrink-wrapped packs as the temperature reaches ambient conditions. This is especially aproblem for steel cans where corrosion can easily occur. To overcome this problemthe packaged product requires to be warmed to ambient conditions thereby furtherincreasing the energy load.
In general, carbonators take the form shown schematically in Figure 5.9. Twobasic methods are possible. These are the injection and dispersion of carbon dioxideinto the liquid to be carbonated, and the fine spraying of the product into a carbondioxide atmosphere. For batch production it has been found by experience that themost effective method is to spray the water into a carbon dioxide atmosphere withina pressurised vessel. Using nozzles to achieve this will give an efficiency of the orderof 75% as will spraying the water over cascade plates. Higher efficiencies up to95% can be achieved by using packings within the pressure vessel column. Owingto the difficulty of effectively cleaning these systems, water rather than product is

Steen: “chap05” — 2006/4/27 — 18:30 — page 130 — #19
130 CARBONATED SOFT DRINKS
Product Air bleed
CO2(under pressure)
Refrigerant out
Refrigerant in
To filler
The product falls over therefrigerated plates as a thinfilm, thus exposing maximumsurface area to the carbondioxide gas
Distributor plate
Carbonated product
Figure 5.8 Refrigerated carbonation system.
CO2
Static(difficult to achieveefficient carbonation)
CO2
Product
Carbonatedproduct
Waterfall(the product descends as awaterfall in the vessel)
Product
CO2 gasbubbles
CO2
Carbonatedproduct
CO2
Bubbler
Figure 5.9 Typical carbonation system.
used during the carbonation process. This implies that higher carbonation valuesmust be achieved with the water, as when it is mixed with the syrup to form theproduct the carbonation levels will be diluted by the throw ratio of the mix and alsoby small losses which will inevitably occur during any process. The rate of flow andthe pressure of the carbon dioxide are critical to ensure that the correct carbonation

Steen: “chap05” — 2006/4/27 — 18:30 — page 131 — #20
THE PRINCIPLES OF FILLING TECHNOLOGY 131
Figure 5.10 Simple in-line carbonator (courtesy Canongate Technology).
level is reached. The greater the liquid surface area exposed to the carbon dioxidethe higher the rate of absorption of the carbon dioxide by the liquid.
In-line carbonation methods are being used increasingly. These either spargecarbon dioxide into the liquid or inject the liquid into a gas stream. When the gas issparged into the liquid this allows small bubbles of gas to be formed which can beeasily absorbed by the liquid. The higher the pressure the smaller the gas bubblesformed at the sparger and the greater the gas bubbles surface area made availablefor the gas to be absorbed by the liquid. Most modern systems inject the liquid intothe gas as this achieves faster dissolution. These injectors can be simply cleanedprior to a product change, therefore ensuring that no product contamination willoccur. They often use a venturi to ensure more contact area and employ speciallydesigned nozzles to maximise the carbonation efficiency, with claims in excess of99% being made. A typical simple in-line carbonator is shown in Figure 5.10.
5.8.2 Gas bubble sparging
On the one hand, the formation of gas bubbles at orifices under constant flow condi-tions occurs when the volumetric flow rate of gas into the bubble remains constantwhilst the bubble grows. On the other hand, under constant pressure formationthe pressure at the orifice remains constant whilst the pressure within the bubblechanges. Between these two regimes there is a transitional region in which resonanteffects play an important role.
The idealised model of constant flow bubbles was proposed by Kumar andKuloor, which can be seen schematically in Figure 5.11 where the two development
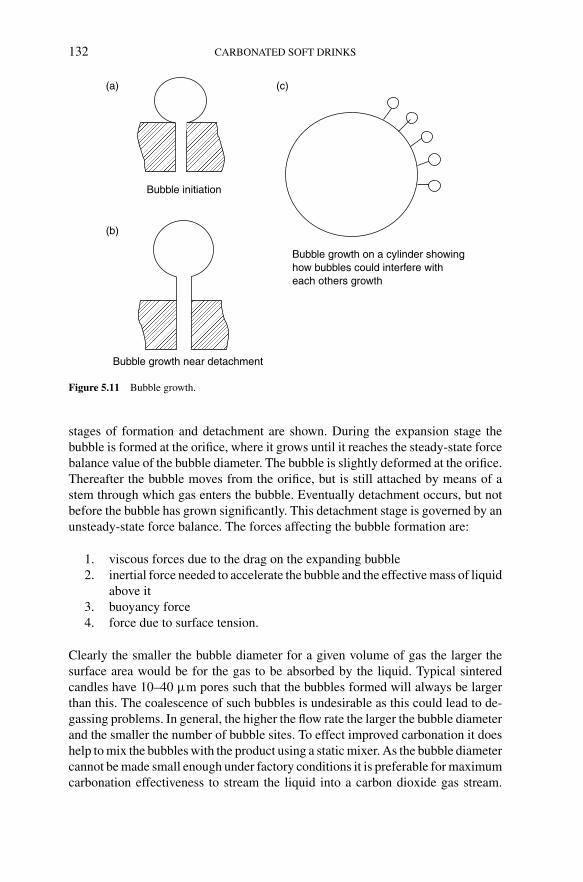
Steen: “chap05” — 2006/4/27 — 18:30 — page 132 — #21
132 CARBONATED SOFT DRINKS
Bubble initiation
Bubble growth on a cylinder showinghow bubbles could interfere witheach others growth
Bubble growth near detachment
(a)
(b)
(c)
Figure 5.11 Bubble growth.
stages of formation and detachment are shown. During the expansion stage thebubble is formed at the orifice, where it grows until it reaches the steady-state forcebalance value of the bubble diameter. The bubble is slightly deformed at the orifice.Thereafter the bubble moves from the orifice, but is still attached by means of astem through which gas enters the bubble. Eventually detachment occurs, but notbefore the bubble has grown significantly. This detachment stage is governed by anunsteady-state force balance. The forces affecting the bubble formation are:
1. viscous forces due to the drag on the expanding bubble2. inertial force needed to accelerate the bubble and the effective mass of liquid
above it3. buoyancy force4. force due to surface tension.
Clearly the smaller the bubble diameter for a given volume of gas the larger thesurface area would be for the gas to be absorbed by the liquid. Typical sinteredcandles have 10–40 µm pores such that the bubbles formed will always be largerthan this. The coalescence of such bubbles is undesirable as this could lead to de-gassing problems. In general, the higher the flow rate the larger the bubble diameterand the smaller the number of bubble sites. To effect improved carbonation it doeshelp to mix the bubbles with the product using a static mixer. As the bubble diametercannot be made small enough under factory conditions it is preferable for maximumcarbonation effectiveness to stream the liquid into a carbon dioxide gas stream.
Steen: “chap05” — 2006/4/27 — 18:30 — page 133 — #22
THE PRINCIPLES OF FILLING TECHNOLOGY 133
Hence, unless the carbonation level required is fairly low the use of spargers isnormally avoided.
5.8.3 Bubbles in a glass of carbonated liquid
A carbonated beverage is a weakly saturated liquid. Bubbles need pre-existing gascavities with radii of curvature greater than the critical radius in order to over-come the nucleation energy barrier and grow freely. Once a bubble is formed ata nucleation site it will rise through the liquid and grow in size as it travels. Ifwe consider a glass full of a carbonated drink it can also be seen that the distancebetween the bubbles also increases as the bubbles rise. Plate 5.1 shows bubblesrising in a liquid. Hence bubble accelerate as they rise. On the free surface thebubbles collapse. It has been found by Liger-Belair and Jeandet that the bubbleruptures in under 100 µs. During this brief initial phase, the bulk shape of thebubble has been frozen. An open cavity remains at the free surface. As the bubblecollapses the bubble cavity gives rise to a high speed liquid jet. Above the freesurface this liquid jet soon becomes unstable and breaks up into small jet droplets.In the final phase droplets form a quasi-spherical shape. Capillary wave trainscentred on the bursting bubble are propagated at the free surface. As hundredsof bubbles are bursting every second during the initial pouring of a carbonateddrink into a glass the free surface of the liquid will be spiked with cone shapedjets. However, since the jet life is short they are difficult to discern; this is termedeffervescence.
5.8.4 Process control
Feedback control systems are required to ensure that the product carbonation iskept within specified limits. One system uses a silicone rubber membrane throughwhich the dissolved carbon dioxide permeates into a sealed, evacuation chamber.The partial pressure and temperature of the gas are then measured, allowing thecarbonation volumes to be calculated. Most systems include a vacuum exhauster toregulate and evacuate the dissolved carbon dioxide. They operate within ±0.04 g/l.Despite the lower permeability of the membrane to oxygen, any dissolved oxygen inthe product will exert a high pressure relative to the dissolved carbon dioxide, whichwill lead to significant errors. This is obviated by the evacuation of the chamber.The problem is also reduced when the product is well de-aerated. The feedbackcontrol system then allows more or less carbon dioxide to be added to the product.
5.9 Filling principles
We have considered how to carbonate a beverage to a given specification. Now wewill look at the principles involved in filling a carbonated beverage into a container at
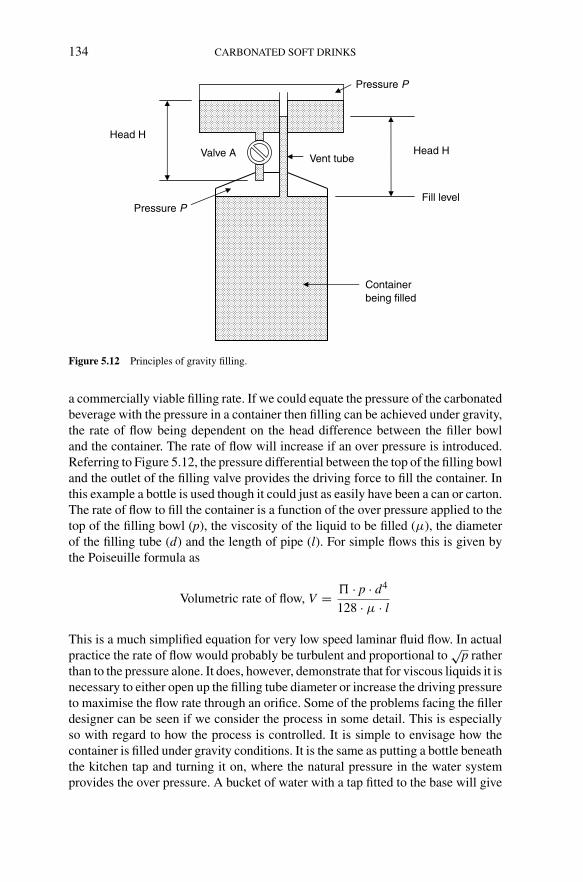
Steen: “chap05” — 2006/4/27 — 18:30 — page 134 — #23
134 CARBONATED SOFT DRINKS
Valve A
Head H
Head H
Pressure P
Pressure P
Containerbeing filled
Vent tube
Fill level
Figure 5.12 Principles of gravity filling.
a commercially viable filling rate. If we could equate the pressure of the carbonatedbeverage with the pressure in a container then filling can be achieved under gravity,the rate of flow being dependent on the head difference between the filler bowland the container. The rate of flow will increase if an over pressure is introduced.Referring to Figure 5.12, the pressure differential between the top of the filling bowland the outlet of the filling valve provides the driving force to fill the container. Inthis example a bottle is used though it could just as easily have been a can or carton.The rate of flow to fill the container is a function of the over pressure applied to thetop of the filling bowl (p), the viscosity of the liquid to be filled (µ), the diameterof the filling tube (d) and the length of pipe (l). For simple flows this is given bythe Poiseuille formula as
Volumetric rate of flow, V = � · p · d4
128 · µ · l
This is a much simplified equation for very low speed laminar fluid flow. In actualpractice the rate of flow would probably be turbulent and proportional to
√p rather
than to the pressure alone. It does, however, demonstrate that for viscous liquids it isnecessary to either open up the filling tube diameter or increase the driving pressureto maximise the flow rate through an orifice. Some of the problems facing the fillerdesigner can be seen if we consider the process in some detail. This is especiallyso with regard to how the process is controlled. It is simple to envisage how thecontainer is filled under gravity conditions. It is the same as putting a bottle beneaththe kitchen tap and turning it on, where the natural pressure in the water systemprovides the over pressure. A bucket of water with a tap fitted to the base will give
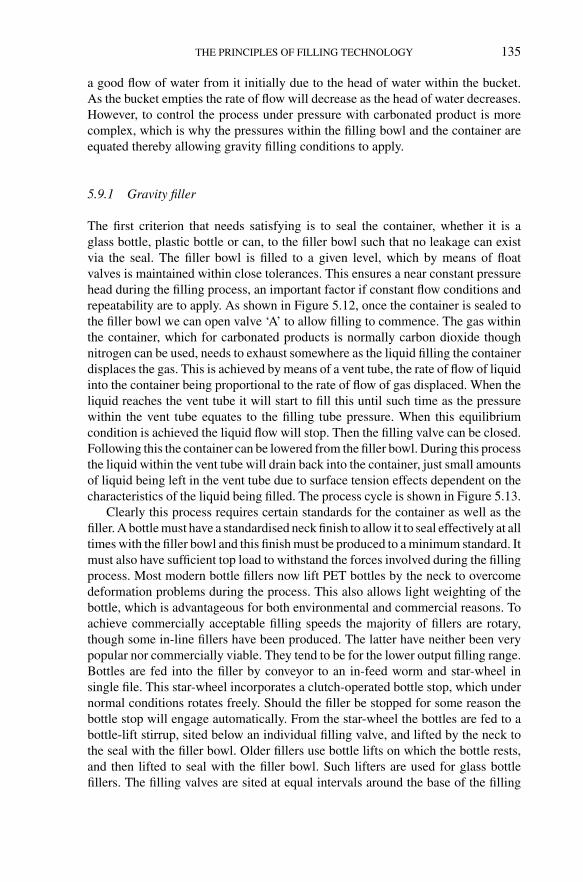
Steen: “chap05” — 2006/4/27 — 18:30 — page 135 — #24
THE PRINCIPLES OF FILLING TECHNOLOGY 135
a good flow of water from it initially due to the head of water within the bucket.As the bucket empties the rate of flow will decrease as the head of water decreases.However, to control the process under pressure with carbonated product is morecomplex, which is why the pressures within the filling bowl and the container areequated thereby allowing gravity filling conditions to apply.
5.9.1 Gravity filler
The first criterion that needs satisfying is to seal the container, whether it is aglass bottle, plastic bottle or can, to the filler bowl such that no leakage can existvia the seal. The filler bowl is filled to a given level, which by means of floatvalves is maintained within close tolerances. This ensures a near constant pressurehead during the filling process, an important factor if constant flow conditions andrepeatability are to apply. As shown in Figure 5.12, once the container is sealed tothe filler bowl we can open valve ‘A’ to allow filling to commence. The gas withinthe container, which for carbonated products is normally carbon dioxide thoughnitrogen can be used, needs to exhaust somewhere as the liquid filling the containerdisplaces the gas. This is achieved by means of a vent tube, the rate of flow of liquidinto the container being proportional to the rate of flow of gas displaced. When theliquid reaches the vent tube it will start to fill this until such time as the pressurewithin the vent tube equates to the filling tube pressure. When this equilibriumcondition is achieved the liquid flow will stop. Then the filling valve can be closed.Following this the container can be lowered from the filler bowl. During this processthe liquid within the vent tube will drain back into the container, just small amountsof liquid being left in the vent tube due to surface tension effects dependent on thecharacteristics of the liquid being filled. The process cycle is shown in Figure 5.13.
Clearly this process requires certain standards for the container as well as thefiller. A bottle must have a standardised neck finish to allow it to seal effectively at alltimes with the filler bowl and this finish must be produced to a minimum standard. Itmust also have sufficient top load to withstand the forces involved during the fillingprocess. Most modern bottle fillers now lift PET bottles by the neck to overcomedeformation problems during the process. This also allows light weighting of thebottle, which is advantageous for both environmental and commercial reasons. Toachieve commercially acceptable filling speeds the majority of fillers are rotary,though some in-line fillers have been produced. The latter have neither been verypopular nor commercially viable. They tend to be for the lower output filling range.Bottles are fed into the filler by conveyor to an in-feed worm and star-wheel insingle file. This star-wheel incorporates a clutch-operated bottle stop, which undernormal conditions rotates freely. Should the filler be stopped for some reason thebottle stop will engage automatically. From the star-wheel the bottles are fed to abottle-lift stirrup, sited below an individual filling valve, and lifted by the neck tothe seal with the filler bowl. Older fillers use bottle lifts on which the bottle rests,and then lifted to seal with the filler bowl. Such lifters are used for glass bottlefillers. The filling valves are sited at equal intervals around the base of the filling
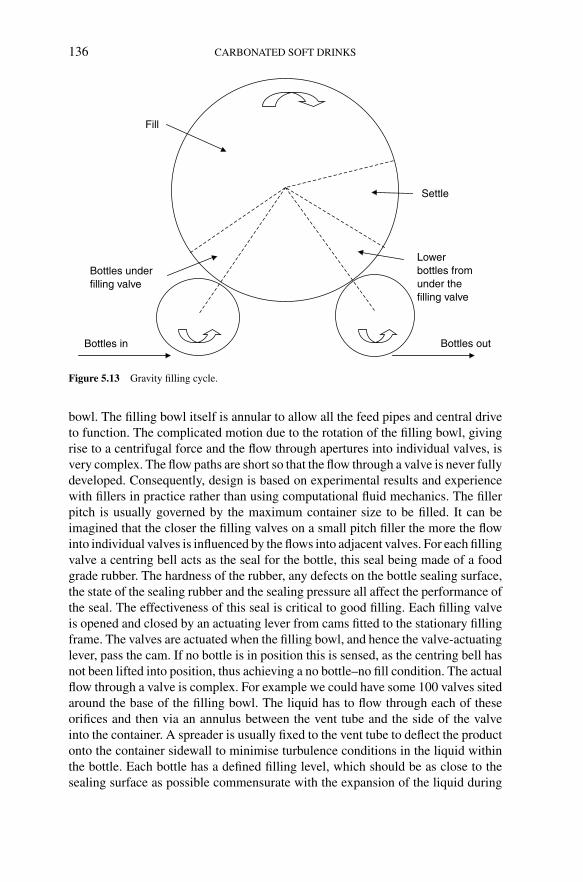
Steen: “chap05” — 2006/4/27 — 18:30 — page 136 — #25
136 CARBONATED SOFT DRINKS
Bottles underfilling valve
Fill
Settle
Lowerbottles fromunder thefilling valve
Bottles in Bottles out
Figure 5.13 Gravity filling cycle.
bowl. The filling bowl itself is annular to allow all the feed pipes and central driveto function. The complicated motion due to the rotation of the filling bowl, givingrise to a centrifugal force and the flow through apertures into individual valves, isvery complex. The flow paths are short so that the flow through a valve is never fullydeveloped. Consequently, design is based on experimental results and experiencewith fillers in practice rather than using computational fluid mechanics. The fillerpitch is usually governed by the maximum container size to be filled. It can beimagined that the closer the filling valves on a small pitch filler the more the flowinto individual valves is influenced by the flows into adjacent valves. For each fillingvalve a centring bell acts as the seal for the bottle, this seal being made of a foodgrade rubber. The hardness of the rubber, any defects on the bottle sealing surface,the state of the sealing rubber and the sealing pressure all affect the performance ofthe seal. The effectiveness of this seal is critical to good filling. Each filling valveis opened and closed by an actuating lever from cams fitted to the stationary fillingframe. The valves are actuated when the filling bowl, and hence the valve-actuatinglever, pass the cam. If no bottle is in position this is sensed, as the centring bell hasnot been lifted into position, thus achieving a no bottle–no fill condition. The actualflow through a valve is complex. For example we could have some 100 valves sitedaround the base of the filling bowl. The liquid has to flow through each of theseorifices and then via an annulus between the vent tube and the side of the valveinto the container. A spreader is usually fixed to the vent tube to deflect the productonto the container sidewall to minimise turbulence conditions in the liquid withinthe bottle. Each bottle has a defined filling level, which should be as close to thesealing surface as possible commensurate with the expansion of the liquid during

Steen: “chap05” — 2006/4/27 — 18:30 — page 137 — #26
THE PRINCIPLES OF FILLING TECHNOLOGY 137
Figure 5.14 Counter-pressure filling cycle diagram.
its possible life cycle due to high temperatures or freezing conditions. Once fillingis completed a short settling period is necessary before the bottles are lowered fromthe filling bowl and passed to the capper to seal the container. This period can beminimised by reducing the amount of agitation within the liquid during the fillingprocess.
5.9.2 Counter-pressure filler
The above process forms the basis of counter-pressure filling of carbonated liquidsinto a container. To achieve gravity filling the pressure within the filling bowl andthe container must be equated. A typical process cycle is shown in Figure 5.14.Once the container is sealed to the filler bowl, the gas valve is opened and the gaswithin the filling bowl head space flows under pressure into the container displacingair at atmospheric pressure. In modern fillers this air is displaced out with the filler.However, in older fillers it is often vented to the filler bowl headspace causingproblems associated with gas mixtures discussed previously, even though as air islighter than carbon dioxide the majority of the air can be vented off. The exampleshown in Figure 5.15 illustrates how evacuating the air from the bottle can reducethe air content prior to filling. It can be seen that it is not feasible to completelyeliminate all the air within a bottle prior to filling, though it can be minimised ifthe air within the bottle is evacuated away from the filler and not into the fillerheadspace. For oxygen-sensitive products this is a necessary requirement.
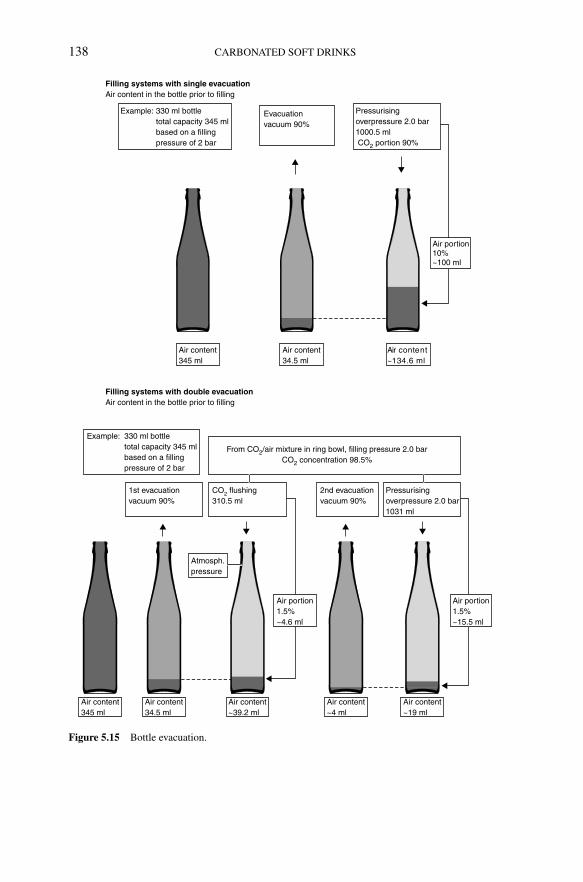
Steen: “chap05” — 2006/4/27 — 18:30 — page 138 — #27
138 CARBONATED SOFT DRINKS
Evacuationvacuum 90%
Filling systems with single evacuationAir content in the bottle prior to filling
Pressurisingoverpressure 2.0 bar1000.5 ml CO2 portion 90%
Air content345 ml
Air content34.5 ml
Air content~134.6 ml
Example: 330 ml bottle total capacity 345 ml based on a filling pressure of 2 bar
Atmosph.pressure
Example: 330 ml bottle total capacity 345 ml based on a filling pressure of 2 bar
1st evacuationvacuum 90%
2nd evacuationvacuum 90%
Filling systems with double evacuationAir content in the bottle prior to filling
CO2 flushing310.5 ml
Pressurisingoverpressure 2.0 bar1031 ml
Air content345 ml
Air content34.5 ml
Air content~39.2 ml
Air content~4 ml
Air content~19 ml
From CO2/air mixture in ring bowl, filling pressure 2.0 barCO2 concentration 98.5%
Air portion10%~100 ml
Air portion1.5%~4.6 ml
Air portion1.5%~15.5 ml
Figure 5.15 Bottle evacuation.
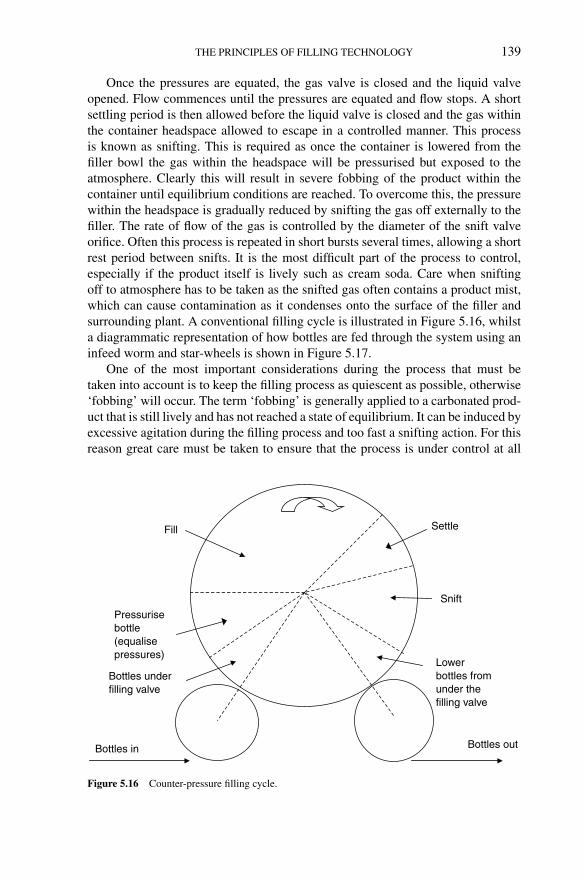
Steen: “chap05” — 2006/4/27 — 18:30 — page 139 — #28
THE PRINCIPLES OF FILLING TECHNOLOGY 139
Once the pressures are equated, the gas valve is closed and the liquid valveopened. Flow commences until the pressures are equated and flow stops. A shortsettling period is then allowed before the liquid valve is closed and the gas withinthe container headspace allowed to escape in a controlled manner. This processis known as snifting. This is required as once the container is lowered from thefiller bowl the gas within the headspace will be pressurised but exposed to theatmosphere. Clearly this will result in severe fobbing of the product within thecontainer until equilibrium conditions are reached. To overcome this, the pressurewithin the headspace is gradually reduced by snifting the gas off externally to thefiller. The rate of flow of the gas is controlled by the diameter of the snift valveorifice. Often this process is repeated in short bursts several times, allowing a shortrest period between snifts. It is the most difficult part of the process to control,especially if the product itself is lively such as cream soda. Care when sniftingoff to atmosphere has to be taken as the snifted gas often contains a product mist,which can cause contamination as it condenses onto the surface of the filler andsurrounding plant. A conventional filling cycle is illustrated in Figure 5.16, whilsta diagrammatic representation of how bottles are fed through the system using aninfeed worm and star-wheels is shown in Figure 5.17.
One of the most important considerations during the process that must betaken into account is to keep the filling process as quiescent as possible, otherwise‘fobbing’ will occur. The term ‘fobbing’ is generally applied to a carbonated prod-uct that is still lively and has not reached a state of equilibrium. It can be induced byexcessive agitation during the filling process and too fast a snifting action. For thisreason great care must be taken to ensure that the process is under control at all
Bottles underfilling valve
Pressurisebottle(equalisepressures)
Fill Settle
Snift
Lowerbottles fromunder thefilling valve
Bottles in Bottles out
Figure 5.16 Counter-pressure filling cycle.
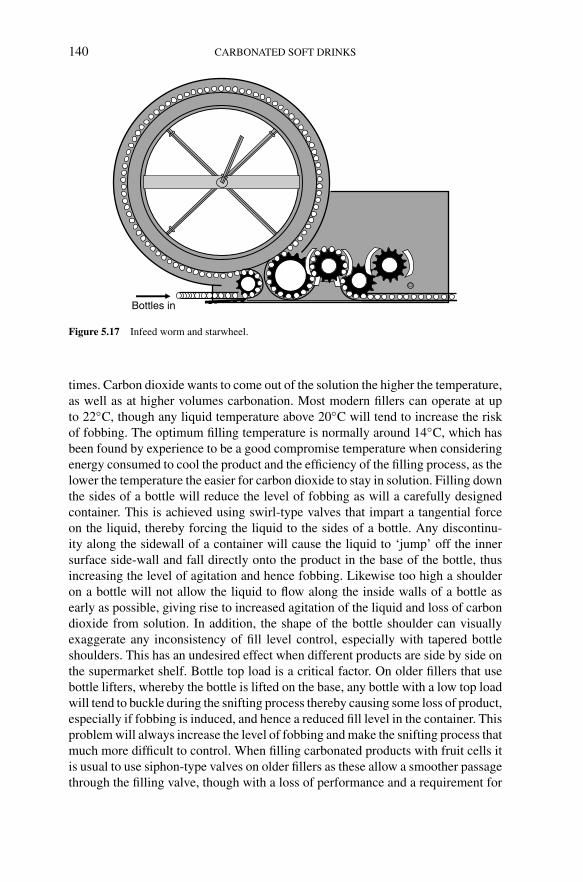
Steen: “chap05” — 2006/4/27 — 18:30 — page 140 — #29
140 CARBONATED SOFT DRINKS
Bottles in
Figure 5.17 Infeed worm and starwheel.
times. Carbon dioxide wants to come out of the solution the higher the temperature,as well as at higher volumes carbonation. Most modern fillers can operate at upto 22◦C, though any liquid temperature above 20◦C will tend to increase the riskof fobbing. The optimum filling temperature is normally around 14◦C, which hasbeen found by experience to be a good compromise temperature when consideringenergy consumed to cool the product and the efficiency of the filling process, as thelower the temperature the easier for carbon dioxide to stay in solution. Filling downthe sides of a bottle will reduce the level of fobbing as will a carefully designedcontainer. This is achieved using swirl-type valves that impart a tangential forceon the liquid, thereby forcing the liquid to the sides of a bottle. Any discontinu-ity along the sidewall of a container will cause the liquid to ‘jump’ off the innersurface side-wall and fall directly onto the product in the base of the bottle, thusincreasing the level of agitation and hence fobbing. Likewise too high a shoulderon a bottle will not allow the liquid to flow along the inside walls of a bottle asearly as possible, giving rise to increased agitation of the liquid and loss of carbondioxide from solution. In addition, the shape of the bottle shoulder can visuallyexaggerate any inconsistency of fill level control, especially with tapered bottleshoulders. This has an undesired effect when different products are side by side onthe supermarket shelf. Bottle top load is a critical factor. On older fillers that usebottle lifters, whereby the bottle is lifted on the base, any bottle with a low top loadwill tend to buckle during the snifting process thereby causing some loss of product,especially if fobbing is induced, and hence a reduced fill level in the container. Thisproblem will always increase the level of fobbing and make the snifting process thatmuch more difficult to control. When filling carbonated products with fruit cells itis usual to use siphon-type valves on older fillers as these allow a smoother passagethrough the filling valve, though with a loss of performance and a requirement for

Steen: “chap05” — 2006/4/27 — 18:30 — page 141 — #30
THE PRINCIPLES OF FILLING TECHNOLOGY 141
Product
CO2 feed
Fillingvalves
Modulating valve A
Bowl fill level Control limits
Fill level probeNormally 3 to 4 fill levelcontrollers are arranged around the bowl that control modulating valve A onthe product line
Figure 5.18 Filler bowl level control.
a lower carbonation level. Modern swirl valves will accommodate most fruit cellcontaining products through improved design and larger flow passages.
The choice of filler depends on the number of bottle sizes being considered touse on it. For example, if 3 l PET bottles are to be filled a 126 mm pitch betweenfilling valves is required. If only small bottles up to 500 ml are to be filled thena 70 mm pitch will suffice. Clearly this has a direct effect on the size of the fillerand the footprint on the factory floor. Unless the filler bowl level is kept withintightly controlled limits, pressure head variations will affect the rate of flow intothe container. Systems such as shown in Figure 5.18 need to be employed. Whereverpossible there should be the minimum amount of contact of any instrumentation withthe product. Conventional float valves should be avoided and simple capacitanceprobes, which are easily cleanable, small and very effective, should be used. It isnot uncommon in older fillers to only have one float valve. This often gives rise tofiller bowl flooding and the consequences that gives of inconsistent fill level andpoor counter-pressurisation of the container pre-filling.
The construction of a filler is usually in 316 stainless steel, to ensure all surfacescan withstand the chemical attack from both the product and cleaning processes,as well as being easily and effectively cleanable. The annular bowl is supportedon a central frame, which also includes the drive motor and pipe work supports.Each valve is individually piped to the central frame, being connected via a rotaryvalve. Most drives are now invertor controlled through a plc, giving a wide rangeof possible operating outputs. Valve design has improved greatly over the last fewyears, such that swirl valves now have sufficiently large passage ways to enablemany fruit, or cell, based drinks to be processed instead of using the slower siphonvalves, with their tendency to give rise to fobbing. Even so due to the nature of thedesign of counter-pressure fillers the vent tube will always contain some product,which is inevitably carried across to the next fill cycle unless blown out prior tothe new cycle commencing. This cut-off with the vent tube occurs at the full filling

Steen: “chap05” — 2006/4/27 — 18:30 — page 142 — #31
142 CARBONATED SOFT DRINKS
rate, thereby never being perfect due to the momentum of the liquid product duringfilling. Clearly the traditional filling valve with its inherent springs can be easilycontaminated as they are submerged in the product itself. This can cause crosscontamination from one product to another following a flavour change unless careis taken to have an effective cleaning regime.
5.10 Nitrogen
Nitrogen was discovered by Rutherford in 1772 and experimentally isolated byCavendish in 1785. Nitrogen gas is slightly lighter than air and only slightly solublein water. This low solubility is because the two nitrogen atoms that make up anitrogen molecule are held firmly together by a triple bond which is exceedinglydifficult to break. Because of this bond, nitrogen gas simply does not participate inany reactions at room temperature, or even at the higher temperatures as found insmall fires, and is therefore described as inert. Only at extremely high temperatures,such as those found near a lightning bolt or in a car engine, or through the use of‘nitrogen fixing’ bacteria, which use a complex set of enzymes instead of heat, canthis triple bond energy be overcome, making nitrogen gas momentarily reactivewhile in an excited state.
Nitrogen is often used as an undercover gas in can seaming as well as providingover pressure when filling still products using a counter-pressure filler. It is usedin beer canning through the use of widgets to produce a creamy texture as foundin traditional draught beers. These widgets work by jetting a stream of nitrogengas into the beer once the can is opened. Liquid nitrogen injection is used in thecanning of still drinks to provide can rigidity through the presence of gas pressureonce the liquid nitrogen is heated up to the gaseous state.
Nitrogen can be produced using pressure swing adsorption, where air is passedthrough a vessel containing one or more adsorbed materials, the nitrogen beingallowed to pass through while selectively removing other components. Anotherproduction method is cryogenic distillation. The liquid nitrogen is stored on site ina refrigerated vessel, delivery being by road tanker. The nitrogen gas is vaporisedusing an air vaporiser. Like carbon dioxide all deliveries require a certificate ofquality conformance and a laboratory analysis. It is always advisable to filter thegas on line as a final fail safe mechanism.
Further reading
Chapel, D.G., Mariz, L.G. and John, E. (1999) Recovery of CO2 from Flue Gases: Commercial Trends.Canadian Society of Chemical Engineers Meeting, Saskatoon.
Giles, G.A. (Ed.) (1999) Handbook of Beverage Packaging. Sheffield Academic Press, Sheffield.Kesson, J. (1984) The diffusion of gases through a silicone rubber membrane, and its application to
an in-line carbonation meter. Technical Quarterly Master Brewers Association of America, 21 (3),143–146.

Steen: “chap05” — 2006/4/27 — 18:30 — page 143 — #32
THE PRINCIPLES OF FILLING TECHNOLOGY 143
Kumar, R. and Kuloor, N. (1970) The formation of bubbles and drops. Advances in ChemicalEngineering, 8, 255–368. Academic Press Inc.
Liger-Belair, G. and Jeandet, P. (2002) Effervescence in a glass of champagne: a bubble story.Europhysics News, 33 (1), 10–14.
Mitchell, A.J. (Ed.) (1990) Formulation and Production of Carbonated Soft Drinks. Blackie, Glasgowand London.
Rogers, G.F.C. and Mayhew, Y.R. (1964) Engineering Thermodynamics, Work and Heat Transfer.Longmans, London.

Steen: “chap06” — 2006/4/27 — 18:30 — page 144 — #1
6 Modern filling systems for carbonated soft drinksAndrew Wilson and John Medling
6.1 Introduction
Modern filling systems for carbonated beverages are based on simple yet wellproven principles, although these can be applied in many different ways dependingon the filling system. Optimum performance during filling, high filling accuracyand the preservation of maximum product quality are simple enough requirementsfor the complexities of a filling process. Different factors, which in their turn willvary depending on product type, have a direct influence on the quality of the productto be filled. The essential factors to be considered are:
1. the gas constituents present in the beverage and the influence those gasesexert during the filling process – for example, carbon dioxide and oxygen
2. pressure and pressure characteristics during filling3. temperature4. viscosity.
By examining these variables and changing them whenever necessary, filling con-ditions can be optimised, filling speed can be maximised and product quality canbe preserved.
The most important considerations for effective filling of carbonated beveragesare maintaining the content, controlling beverage temperature during filling andpreventing oxygen pick-up. As a result of carbonation, CO2 is present in the bever-age in a dissolved state. In an enclosed system, such as a pressurised beverage buffertank, equilibrium will exist after a certain time between the pressure of the gases inthe liquid and the corresponding pressure in the tank. CO2 must be prevented fromcoming out of solution during filling by setting the filling pressure in the filler bowlapproximately 1 bar higher than the saturation pressure for the required beverageCO2 content. Even if saturation pressure is maintained, extreme care must also betaken to ensure that the beverage has been allowed sufficient time to settle prior tofilling and that it is filled gently into the container. The profile of the container canalso be a critical factor in the gentle filling of the beverage. In most filling systems,the beverage is transferred to the inside surface of the container at the highest pos-sible level and then flows to the bottom of the container. Smooth container contourswill allow the gentlest flow of the beverage.

Steen: “chap06” — 2006/4/27 — 18:30 — page 145 — #2
MODERN FILLING SYSTEMS FOR CARBONATED SOFT DRINKS 145
Following this procedure ensures that:
1. CO2 loss in the beverage, with the resultant reduction in quality, is avoided.2. CO2 consumption during carbonation can be more accurately adjusted, and
therefore reduced.3. The filling, settling and snifting times are optimised.4. Product losses as a result of fobbing during snifting are prevented.
Although the CO2 content of the beverage has the primary effect on the performanceand cost efficiency of the filling process, CO2 consumption, settling and sniftingtimes and the oxygen content in the beverage all have a major influence in thepreservation of beverage quality. Oxygen is present in the beverage in dissolvedform and also as a constituent of the air in the container prior to filling. For softdrinks, the consequences of excessive oxygen pick-up during filling are well known.Oxidation of beverage ingredients may cause adverse changes in colour and taste.
Oxygen pick-up by the beverage can be controlled at three stages:
1. oxygen load at the filler inlet (initial load)2. oxygen pick-up during filling3. oxygen contained in the residual air in the container headspace after filling.
Oxygen pick-up upstream of the filler inlet can be caused by several factors:
1. air inclusion in pipes2. insufficient syrup storage time3. over agitation during the mixing process of the beverage4. inadequate de-aeration at the carbonation stage.
Oxygen pick-up during filling is directly correlated to the purity of the CO2 aspressurisation gas in the filler ring bowl and air in the container prior to filling.In order to reduce the content of air in the container, flushing with CO2 can beperformed immediately before filling. For flexible containers, such as PET bottlesand aluminium cans, this takes place as the container is presented to the filling valve,before sealing, when CO2 from the filler ring bowl is flushed into the container toreplace as much of the air as possible. This process can be substantially improvedwhen using rigid glass containers, after sealing to the filling valve, by evacuatinggas from the container using a vacuum prior to pressurising with CO2. This processcan be repeated when filling particularly oxygen-sensitive beverages and an almostpure CO2 environment can be produced in the container.
The filling pressure depends on the required CO2 content of the beverage. Settingthe correct filling pressure in the filler bowl will prevent CO2 coming out of solutionin the beverage during the filling process. If the temperature of the beverage islower, CO2 solubility will be better. Good solubility of the gas at low temperaturesrequires a lower saturation pressure and hence a lower pressure in the filler bowl.The consequence of this is that shorter times are required for pressurisation andsnifting and the occurrence of fobbing will be reduced. Gas consumption will alsobe reduced.

Steen: “chap06” — 2006/4/27 — 18:30 — page 146 — #3
146 CARBONATED SOFT DRINKS
The fourth factor to be considered is beverage viscosity. Higher-viscosityproducts require a different approach to the filling process. However, carbon-ated soft drinks usually have a low viscosity and are free flowing, so this is nota consideration here.
The container and beverage characteristics form the basis of the appropri-ate design for a filling system, and the filling process must not alter or impairthe beverage characteristics. It is important when planning the filling systemthat the appropriate filling steps are matched to the beverage characteristics andcontainer. The filling process can be split into several phases:
1. evacuation2. flushing with gas3. pressurising with gas4. filling at one speed or two speeds5. fill level correction6. settling and snifting.
Evacuation is used only on rigid containers, where the container is subjected to avacuum to remove 90% of the air content before pressurising with gas. This is asignificant process when filling particularly oxygen-sensitive beverages as the stepcan be repeated after pressurising with gas, thus removing 90% of the mixed gas,leaving a highly concentrated gas atmosphere in the container.
Flushing with gas is used primarily for flexible containers such as PET bottlesand aluminium cans, which cannot be subjected to vacuum. This step is carried outas the container is presented to the filling valve, using either gas from the filler ringbowl or pure gas.
Pressurising with gas is carried out after the container is sealed to the fillingvalve. Gas from the filler ring bowl flows into the container until both pressures arethe same.
Filling takes place in a tubeless filling system when the filling valve opens andbeverage flows over a vent tube into the container. A liquid spreader, or deflector,causes the beverage to flow on to the inside wall of the container. Gas in the containeris displaced by the beverage and flows through the vent tube into the filler ringbowl. In the now less common tube filling system, suitable for tall containers,beverage flows into the container through a tube located close to the bottom ofthe container. A two-speed fill can be used here, with slow fill until the beveragereaches the tube, then fast filling to the top. When the fill quantity is reached, eitherthe beverage reaches the gas return point of the vent tube, stopping the filling step,or the vent tube can contain an electronic probe to stop the filling step. Other fillingsystems using the volumetric principle pre-measure the quantity of beverage intothe container.
Fill level correction is used when product cost is high, the container is verynarrow at the fill point and fill level accuracy is particularly important. There arevarious methods used to perform this step, but most commonly the container is firstoverfilled then product is extracted via the vent tube, using vacuum.

Steen: “chap06” — 2006/4/27 — 18:30 — page 147 — #4
MODERN FILLING SYSTEMS FOR CARBONATED SOFT DRINKS 147
Settling and snifting serve to gently lower the pressure in the container andallow the beverage to settle to prevent fobbing of the beverage as it is lowered fromthe filling valve.
6.2 Modern carbonation systems
The most important considerations for effective filling of carbonated beveragesare maintaining the content of carbon dioxide, controlling beverage temperatureduring filling and preventing oxygen pick-up. In the carbonation process, CO2 isinjected into the beverage in an enclosed carbonation tank pressurised with the gas.Equilibrium between the gases in the liquid and the corresponding pressure in thetank will exist after a certain time. CO2 will be absorbed into the beverage and willremain in a dissolved state while the beverage is maintained under pressure. Thecontent of CO2 which can be absorbed by the beverage is dependent on the pressurein the carbonation tank and the temperature of the beverage. The higher the CO2content required, the higher the saturation pressure required at a given temperature.Conversely, the lower the temperature for a given content, the lower the saturationpressure required.
The basic system for carbonation of water is indicated in Figure 6.1. Water ispumped into a carbonation tank which is pressurised with carbon dioxide. Between
1
2
4
3
1 Feed pump2 Injector
3 Carbonation tank4 Dosing pump
Untreatedwater
Carbonatedwater
CO2
CO2 supply
Figure 6.1 Basic carbonation system.

Steen: “chap06” — 2006/4/27 — 18:30 — page 148 — #5
148 CARBONATED SOFT DRINKS
the pump and the tank it passes through a CO2 injector, an efficient and faster methodof promoting absorption than simply exposing the beverage to a CO2 atmosphere.
The CO2 content of the beverage has the primary effect on the filling perfor-mance and cost efficiency of the filling process, CO2 consumption and settling andsnifting times, and the oxygen content in the beverage has a major influence on thepreservation of beverage quality. Also, the lower the air content of the beveragebefore carbonation, the higher the effectiveness of the carbonation process.
The system for the de-aeration and carbonation of water is indicated inFigure 6.2. Water is pumped into a de-aeration tank, which is subjected to a vacuum.This step removes air from the water, which is then pumped into a carbonation tankpressurised with carbon dioxide. Between pump and tank the water passes througha CO2 injector.
Carbonated beverages are most commonly prepared in a beverage mixer/carbonator which combines the de-aeration of water with blending and carbonationof the beverage. Water is pumped into a de-aeration tank under vacuum whichremoves air from the water. De-aerated water and syrup are then pumped through
3
4
6
5
1 Vacuum pump2 De-aeration tank
3 Carbonation pump4 Injector
5 Carbonation tank6 Dosing pump
De-aeratedwater
Carbonatedwater
CO2Untreatedwater
CO2 supply
2
1
Vacuumde-aeration
Carbonation
Figure 6.2 De-aerator and carbonator.
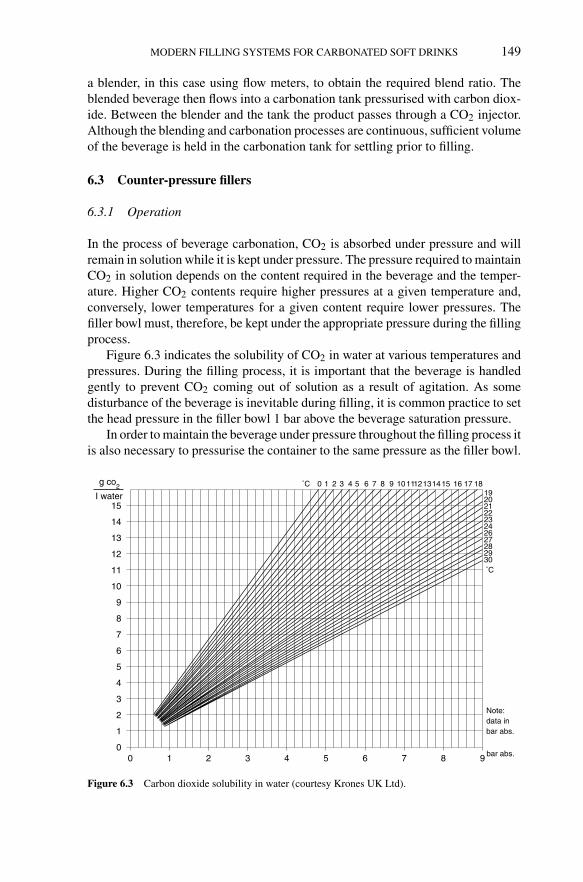
Steen: “chap06” — 2006/4/27 — 18:30 — page 149 — #6
MODERN FILLING SYSTEMS FOR CARBONATED SOFT DRINKS 149
a blender, in this case using flow meters, to obtain the required blend ratio. Theblended beverage then flows into a carbonation tank pressurised with carbon diox-ide. Between the blender and the tank the product passes through a CO2 injector.Although the blending and carbonation processes are continuous, sufficient volumeof the beverage is held in the carbonation tank for settling prior to filling.
6.3 Counter-pressure fillers
6.3.1 Operation
In the process of beverage carbonation, CO2 is absorbed under pressure and willremain in solution while it is kept under pressure. The pressure required to maintainCO2 in solution depends on the content required in the beverage and the temper-ature. Higher CO2 contents require higher pressures at a given temperature and,conversely, lower temperatures for a given content require lower pressures. Thefiller bowl must, therefore, be kept under the appropriate pressure during the fillingprocess.
Figure 6.3 indicates the solubility of CO2 in water at various temperatures andpressures. During the filling process, it is important that the beverage is handledgently to prevent CO2 coming out of solution as a result of agitation. As somedisturbance of the beverage is inevitable during filling, it is common practice to setthe head pressure in the filler bowl 1 bar above the beverage saturation pressure.
In order to maintain the beverage under pressure throughout the filling process itis also necessary to pressurise the container to the same pressure as the filler bowl.
15I water
g co2
14
13
12
11
10
9
8
7
6
5
4
3
2
1
00 1 2 3 4 5 6 7 8 9
Note:data in bar abs.
bar abs.
1920212223242627282930
˚C
˚C
0 1 2 3 4 5 6 7 8 9 101112131415 16 17 18
Figure 6.3 Carbon dioxide solubility in water (courtesy Krones UK Ltd).
Steen: “chap06” — 2006/4/27 — 18:30 — page 150 — #7
150 CARBONATED SOFT DRINKS
This procedure is carried out on a counter-pressure filler. The complete fillingprocess on a counter-pressure filler can be split into the following phases:
1. evacuation2. flushing with gas3. pressurising with gas4. filling5. fill level correction6. settling and snifting.
Each of these phases on a Krones VKPV-CF filler will be examined. This completefilling process is used when filling beverages which are particularly sensitive to oxy-gen and which can also be susceptible to foaming. Other types of counter-pressurefiller utilise only some of the above phases. Figure 6.4 shows a cross-section ofthe filler bowl and filling valve with a glass bottle in position. Some of the stepsdescribed can be carried out only on rigid containers.
The VKPV-CF is a counter-pressure filler with short vent tubes and electro-pneumatic valve control with vacuum chamber and fill level correction. Referringto Figure 6.4a, the electro-pneumatic operations control the following functions:
1. gas needle2. snifting3. vacuum/clean-in-place (CIP)4. liquid stem5. correction.
The various ring channels are as follows:
1. snifting/CIP2. vacuum/CIP3. pure gas.
During the filling process, bottles enter the filling machine and are lifted to the fillingvalve by the lifting cylinder and sealed against the centring bell and filling valve.In this position the gas needle and the liquid stem in the filling valve are closed.
Figure 6.4b shows the evacuation phase. Following an electronic pulse, thevacuum valve opens and produces a connection to the vacuum channel. The bottleis subjected to vacuum and the air content in the bottle is reduced to approximately10% of atmosphere.
Figure 6.4c illustrates the gas flushing phase. A pneumatically controlled gasneedle opens the connection to the ring bowl and, as a result, almost pure CO2flows out of the ring bowl into the bottle, equalising pressure between bottle andring bowl.
Figure 6.4d shows the second evacuation phase. The pneumatically controlledvacuum valve opens again and produces a second vacuum in the bottle. Thevacuum thus generated in the process reduces the percentage of air in the bottle toapproximately 1%.

Steen: “chap06” — 2006/4/27 — 18:30 — page 151 — #8
MODERN FILLING SYSTEMS FOR CARBONATED SOFT DRINKS 151
Correction channel
(a) Control cylinderliquid valve/pressurising
Gas needle
Vacuum channel
Snift channel
Backsite
Cam follower
Syphon type gas lock
Vent tube
(b)
Figure 6.4 Krones VKPV-CF counter-pressure filler. (a) Basic position. (b) First evacuation. (c) Flush-ing phase. (d) Second evacuation. (e) Pressurising. (f) Filling. (g) Completed filling cycle. (h) Correctionphase. (i) Completed correction phase. (j) Snifting (courtesy Krones UK Ltd).

Steen: “chap06” — 2006/4/27 — 18:30 — page 152 — #9
152 CARBONATED SOFT DRINKS
(c) (d)
(e) (f)
Figure 6.4 Continued.

Steen: “chap06” — 2006/4/27 — 18:30 — page 153 — #10
MODERN FILLING SYSTEMS FOR CARBONATED SOFT DRINKS 153
(g)
(i)
(h)
(j)
Figure 6.4 Continued.

Steen: “chap06” — 2006/4/27 — 18:30 — page 154 — #11
154 CARBONATED SOFT DRINKS
Figure 6.4e illustrates the gas pressurising phase. A pneumatically controlledcylinder opens the gas needle, allowing gas mixture from the ring bowl into thebottle via the return air tube. This causes the filling pressure to be built up in thebottle. As a result, the pressure in the bottle and the ring bowl are the same.
Figure 6.4f shows the filling phase. When the pressure is equal, the liquid stemopens under spring control and the filling process begins. Product flows into thebottle along the return air tube and the small spreader, mounted on the return airtube, deflects the liquid to the inside bottle wall to ensure a gentle product flow. Thepressurisation gas is forced out of the bottle during the filling process and flowsback into the ring bowl via the return air tube.
Figure 6.4g illustrates the filling completed phase. As soon as liquid reachesthe lower edge of the return air tube, the gas return flow is interrupted, ending thefilling process automatically. The bottle is purposely over-filled here. The pneumaticdouble-lifting cylinder closes the product stem, and the gas needle remains open.
Figure 6.4h shows the correction phase. Following an electronic pulse, the cor-rection valve opens and pure CO2 flows into the bottle. With a slight over-pressureof approximately 0.2 bar, the over-filled liquid is forced back into the ring bowl viathe return air tube.
Figure 6.4i illustrates the correction completed phase. Owing to the over-pressure of pure CO2, the liquid is completely removed from the return air tube. Asthe quantity of CO2 used is exactly defined, a precise filling level can be achieved.
Figure 6.4j shows the snifting phase. The snift valve opens the connection to thesnift channel. As a result, the pressure present in the bottle neck can escape untilatmospheric pressure is reached again. The lifting cylinder moves downwards, andthe bottle is lowered and transferred to the discharge starwheel.
6.3.2 Level filling
In this section, the development of the mechanical filling valve in a level fillerthrough electro-pneumatic technology is examined. The mechanical filling valve isan extremely efficient piece of technology and still a popular choice when fillingcarbonated beverages. Figure 6.5 indicates a mechanically operated valve in whichall movements are controlled mechanically. Component parts of the filling valvewhich are inside the filler bowl, the product valve and gas needle, are operated bya control lever which, in turn, is raised and lowered by cams external to the ringbowl. Pressurisation and filling phases are controlled by this operation.
The snift phase is operated by the snift button located at the base of the fillingvalve being activated by an external cam. As the filling phases are controlled bycams, this type of filler has to be set up to operate at a fixed speed for optimumfilling.
The operation of the mechanical filling valve was modernised when electro-pneumatic control was introduced, and Figure 6.6 indicates the mechanical fillingvalve with pneumatic control. The well-proven filling valve now has the prod-uct valve and gas needle controlled by a pneumatic cylinder on top of the filler

Steen: “chap06” — 2006/4/27 — 18:30 — page 155 — #12
MODERN FILLING SYSTEMS FOR CARBONATED SOFT DRINKS 155
Figure 6.5 Mechanically operated valve (courtesy Krones UK Ltd).
Figure 6.6 Mechanical filling valve with pneumatic control (courtesy Krones UK Ltd).
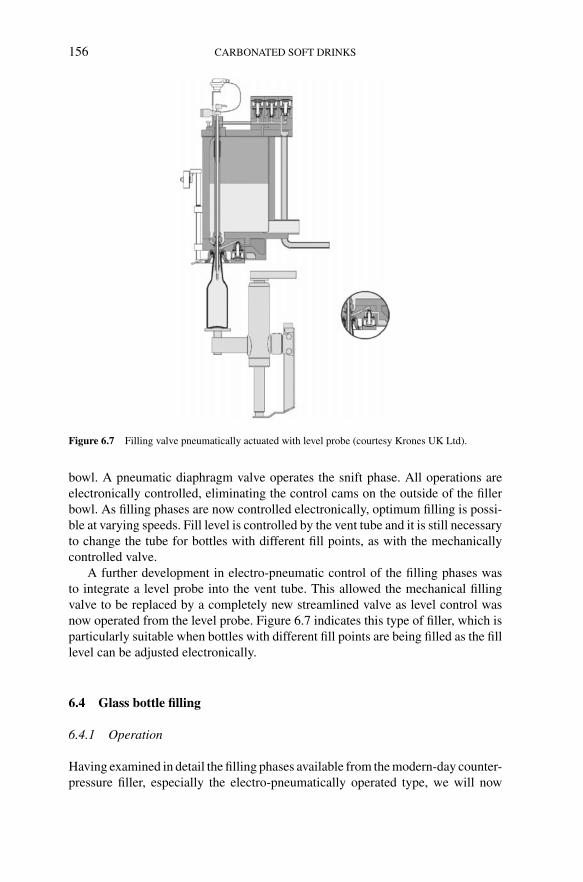
Steen: “chap06” — 2006/4/27 — 18:30 — page 156 — #13
156 CARBONATED SOFT DRINKS
Figure 6.7 Filling valve pneumatically actuated with level probe (courtesy Krones UK Ltd).
bowl. A pneumatic diaphragm valve operates the snift phase. All operations areelectronically controlled, eliminating the control cams on the outside of the fillerbowl. As filling phases are now controlled electronically, optimum filling is possi-ble at varying speeds. Fill level is controlled by the vent tube and it is still necessaryto change the tube for bottles with different fill points, as with the mechanicallycontrolled valve.
A further development in electro-pneumatic control of the filling phases wasto integrate a level probe into the vent tube. This allowed the mechanical fillingvalve to be replaced by a completely new streamlined valve as level control wasnow operated from the level probe. Figure 6.7 indicates this type of filler, which isparticularly suitable when bottles with different fill points are being filled as the filllevel can be adjusted electronically.
6.4 Glass bottle filling
6.4.1 Operation
Having examined in detail the filling phases available from the modern-day counter-pressure filler, especially the electro-pneumatically operated type, we will now

Steen: “chap06” — 2006/4/27 — 18:30 — page 157 — #14
MODERN FILLING SYSTEMS FOR CARBONATED SOFT DRINKS 157
consider the particular requirements for the filling of glass bottles:
1. bottle handling to the filler infeed2. bottle handling around the filler3. lifting the bottle to the filling valve4. air removal from the bottle prior to filling.
Bottle handling to the filler infeed must be carefully controlled to minimisenoise yet still avoid bottle-to-bottle contact as bottles enter the infeed scroll. Intel-ligent conveyor systems which follow the speed of the filler with line sensorsand variable-speed drives go a long way towards gently controlling bottles intothe filler. Filling speeds for glass bottles of 800–1200 bottles/min are now com-monplace, so even greater care is necessary to positively control the infeed to thefiller. One example of this, in the form of a decelerating bottle stop, is shown inFigure 6.8.
This device is used on a filler which operates at a constant filling speed anduses a pneumatic cylinder for bottle control. Bottles are allowed to enter the filler
Figure 6.8 Decelerating bottle stop (courtesy Krones UK Ltd).

Steen: “chap06” — 2006/4/27 — 18:30 — page 158 — #15
158 CARBONATED SOFT DRINKS
Figure 6.9 Bottle transfer in filler (courtesy Krones UK Ltd).
from rest by releasing the bottle stop starwheel and accelerating both filler andinfeed conveyor to operating speed when the first bottle reaches the filling valve.The piston holding the bottle stop starwheel then retracts against the flow of bottlesto its park position upstream of the infeed scroll. When the filler is required to carryout a controlled stop at speed, the now freely rotating bottle stop starwheel is lockedand the force of conveyed bottles causes the cylinder to extend. Cylinder movementis dampened and slows the moving bottles until they come to rest in front of theinfeed scroll.
Bottle handling around the filler must be under complete control to ensurestability, accurate positioning to the filling valve and gentle transfer to the dischargebottle conveyor, as per Figure 6.9. Bottles from the infeed conveyor enter the infeedscroll and are pitched to match the filler pitch and then transferred to the infeedstarwheel. This transfers the bottles to the filler carousel, where the centring bell islowered on to the bottle neck before it leaves the starwheel. Bottles are dischargedfrom the filler carousel in the opposite way, by lifting the centring bell from the bottleas it enters the discharge starwheel before transferring to the discharge conveyor.As the bottles enter the filler carousel they are raised to seal against the filling valveby a lifting cylinder, as seen in Figure 6.10. The cylinders are precisely controlledto gently but quickly raise and lower the bottles.
As described earlier, one important factor when filling oxygen-sensitive bever-ages is the removal of air from the bottle prior to filling. This step can be performed

Steen: “chap06” — 2006/4/27 — 18:30 — page 159 — #16
MODERN FILLING SYSTEMS FOR CARBONATED SOFT DRINKS 159
Figure 6.10 Bottle lifters (courtesy Krones UK Ltd).
by flushing the container with CO2. However, for a more efficient removal of theair, an advantage of filling a rigid container is that a vacuum step can be introducedbefore flushing, as illustrated in Figure 6.11.
6.4.2 Bottle burst protection
When carbonated beverages are filled into glass bottles, there is a risk of bottlesbursting in the filling machine under pressure. This usually occurs if a bottle hasa weak point or has been damaged in some way. It is necessary to protect otherbottles from ingress of glass fragments when a burst occurs on the filling machine,so that the risk of a consumer finding a sliver of glass in the product is minimal.
Filling machines for carbonated beverages in glass bottles are fitted with stain-less steel protective divider plates between the filling valves. These are matched tothe optimum bottle height and protect neighbouring bottles in the event of a bottlebursting.
The most likely place for a bottle burst to occur is at the point of pressuri-sation. Protective stainless steel guards are fitted around the filler carousel at the
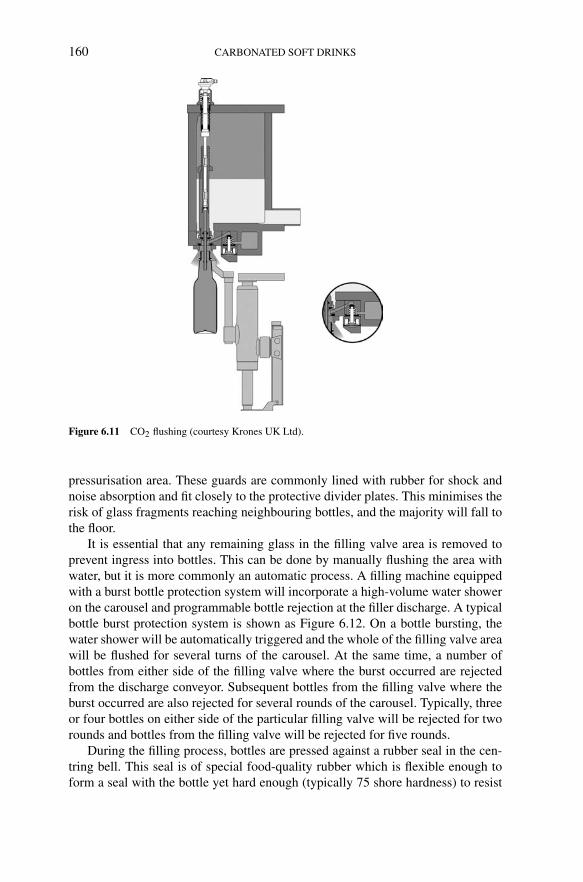
Steen: “chap06” — 2006/4/27 — 18:30 — page 160 — #17
160 CARBONATED SOFT DRINKS
Figure 6.11 CO2 flushing (courtesy Krones UK Ltd).
pressurisation area. These guards are commonly lined with rubber for shock andnoise absorption and fit closely to the protective divider plates. This minimises therisk of glass fragments reaching neighbouring bottles, and the majority will fall tothe floor.
It is essential that any remaining glass in the filling valve area is removed toprevent ingress into bottles. This can be done by manually flushing the area withwater, but it is more commonly an automatic process. A filling machine equippedwith a burst bottle protection system will incorporate a high-volume water showeron the carousel and programmable bottle rejection at the filler discharge. A typicalbottle burst protection system is shown as Figure 6.12. On a bottle bursting, thewater shower will be automatically triggered and the whole of the filling valve areawill be flushed for several turns of the carousel. At the same time, a number ofbottles from either side of the filling valve where the burst occurred are rejectedfrom the discharge conveyor. Subsequent bottles from the filling valve where theburst occurred are also rejected for several rounds of the carousel. Typically, threeor four bottles on either side of the particular filling valve will be rejected for tworounds and bottles from the filling valve will be rejected for five rounds.
During the filling process, bottles are pressed against a rubber seal in the cen-tring bell. This seal is of special food-quality rubber which is flexible enough toform a seal with the bottle yet hard enough (typically 75 shore hardness) to resist
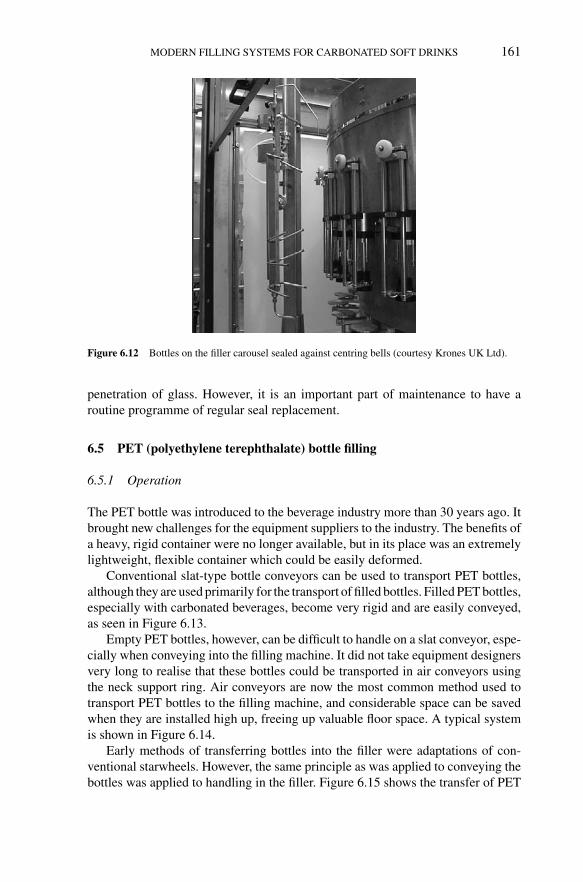
Steen: “chap06” — 2006/4/27 — 18:30 — page 161 — #18
MODERN FILLING SYSTEMS FOR CARBONATED SOFT DRINKS 161
Figure 6.12 Bottles on the filler carousel sealed against centring bells (courtesy Krones UK Ltd).
penetration of glass. However, it is an important part of maintenance to have aroutine programme of regular seal replacement.
6.5 PET (polyethylene terephthalate) bottle filling
6.5.1 Operation
The PET bottle was introduced to the beverage industry more than 30 years ago. Itbrought new challenges for the equipment suppliers to the industry. The benefits ofa heavy, rigid container were no longer available, but in its place was an extremelylightweight, flexible container which could be easily deformed.
Conventional slat-type bottle conveyors can be used to transport PET bottles,although they are used primarily for the transport of filled bottles. Filled PET bottles,especially with carbonated beverages, become very rigid and are easily conveyed,as seen in Figure 6.13.
Empty PET bottles, however, can be difficult to handle on a slat conveyor, espe-cially when conveying into the filling machine. It did not take equipment designersvery long to realise that these bottles could be transported in air conveyors usingthe neck support ring. Air conveyors are now the most common method used totransport PET bottles to the filling machine, and considerable space can be savedwhen they are installed high up, freeing up valuable floor space. A typical systemis shown in Figure 6.14.
Early methods of transferring bottles into the filler were adaptations of con-ventional starwheels. However, the same principle as was applied to conveying thebottles was applied to handling in the filler. Figure 6.15 shows the transfer of PET

Steen: “chap06” — 2006/4/27 — 18:30 — page 162 — #19
162 CARBONATED SOFT DRINKS
Figure 6.13 Full PET bottle conveying (courtesy Krones UK Ltd).
bottles from an air conveyor to a starwheel, using a pitching starwheel. Once insidethe filler, bottles are transferred from the neck-handling starwheel on to the fillercarousel, as shown in Figure 6.16. In the case of multiple starwheels, bottles aretransferred from one to the other, alternately gripping the bottle above and belowthe neck support ring.
As bottles enter the filler carousel, they are raised to seal against the filling valve.The bottle must be pressed against the filling valve to maintain a seal, and early meth-ods to achieve this were adapted bottle lifts incorporating a neck-support extension.It was this support that applied pressure under the neck support to seal the bottle tothe filling valve. Modern neck-handling systems transfer bottles into neck lifts ateach valve position, as illustrated in Figure 6.17. Bottle lifts grip the bottle under theneck-support ring and are then raised by a cam until the bottle seals against the fillingvalve, in the same way as conventional bottle-lift cylinders are used for glass bottles.
As described earlier, one important factor when filling oxygen-sensitive bever-ages is the removal of air from the bottle prior to filling. This step can be performedby flushing the container with CO2. When flexible PET bottles are filled, this stepis carried out as the bottle is raised to the filling valve.
6.5.2 Size changing
Modern filling systems for PET bottles handle bottles by the neck throughoutthe filler and capper. At the infeed to the filler, bottles are transferred from theneck-handling air conveyor using a pitching starwheel. This pitching starwheel has

Steen: “chap06” — 2006/4/27 — 18:30 — page 163 — #20
MODERN FILLING SYSTEMS FOR CARBONATED SOFT DRINKS 163
(a)
(b)
Figure 6.14 Two views of airveying empty PET bottles (courtesy Krones UK Ltd).
replaced the traditional infeed scroll, which had to be changed for each differentbottle diameter.
As the pitching starwheel rotates, a specially shaped point of the starwheelpasses between two bottle necks and forces the bottles apart until they are at thesame pitch as the starwheels and filling valves. This process is repeated for each

Steen: “chap06” — 2006/4/27 — 18:30 — page 164 — #21
164 CARBONATED SOFT DRINKS
Figure 6.15 Empty PET bottle transfer into the filler (courtesy Krones UK Ltd).
Figure 6.16 Filler carousel (courtesy Krones UK Ltd).
bottle and, as the bottles are handled by the neck, there is no need to change thestarwheels for different bottle diameters.
Starwheels have individual grippers for each bottle, and each gripper trans-fers a bottle from the pitching starwheel. If transfer is required from starwheel

Steen: “chap06” — 2006/4/27 — 18:30 — page 165 — #22
MODERN FILLING SYSTEMS FOR CARBONATED SOFT DRINKS 165
Figure 6.17 Neck lifts (courtesy Krones UK Ltd).
to starwheel, then alternate starwheels grip the bottle below then above the neck-support ring. Bottles are transferred from a starwheel to the filler carousel on toneck carriers under each valve, which then raise the bottles to seal against the fillingvalve. Bottles are then transferred from the carousel to a starwheel.
It is common practice to ensure that all bottles handled on such a filling systemhave the same neck finish. As bottles are handled by the neck, the filling system isset up in terms of height to suit the tallest bottle being filled, thus allowing all otherbottles to be handled without height adjustment.
At the capper, bottles are discharged on to a conventional slat chain conveyor.The conveyor is set up to suit the height of the tallest bottle. All other bottlesof shorter height or different diameter will then have an individual dischargestarwheel which incorporates a ramp to lower the bottle to the height of the dischargestarwheel.
The considerable benefit of this system is the minimum changeover requirementbetween bottle sizes. The need for cumbersome change parts to be fitted every time

Steen: “chap06” — 2006/4/27 — 18:30 — page 166 — #23
166 CARBONATED SOFT DRINKS
the bottle size changes is diminishing. In the past, such change parts were often dam-aged during handling and storage, causing downtime during the filling operation.
6.6 Can filling
6.6.1 The volumetric can (VOC) filler
When, in 1994, Krones introduced a new generation of electro-pneumatically con-trolled volumetric can filling systems, the main objective was to provide the brewingand beverage industry with a way of filling cans within a very tight volumetrictolerance. This development was highly appreciated, particularly by breweries incountries where beer is subject to taxation when leaving the brewery gate and sobrewers are most anxious to avoid unnecessary ‘over-fills’.
The flexibility and multi-functionality of the VOC-type filler became very obvi-ous when it was demonstrated that the filling of canned draft beer required aspecial filling technique. The requirements of brewers are not dissimilar to those ofmanufacturers of soft drinks in that high filling accuracy, low product loss and verylow levels of oxygen pick-up are deemed essential requirements in the packagingof high-quality beverages. After the first fillers were put into operation, it was foundthat apart from its unprecedented filling accuracy, this filling system perfectly metthe increasing demands of the industry with regard to improved quality control ofthe filling process.
What enables the VOC filler to achieve significantly lower total package oxygen(TPO) than the conventional, mechanically controlled can filler? The entire fillingprocess is controlled by a micro-processor positioned in the centre of the fillercarousel. All process steps, such as two-stage flushing with CO2, pressurising,filling valve opening/closing and snifting, are controlled not using mechanicalcams but through pneumatic control elements comprising well-proven componentsguaranteeing long service life. These pneumatic control elements are activated viasolenoid valves housed in class IP 65 protection stainless steel terminal boxes. Thesolenoid valves receive time-dependent control impulses from the central proces-sor and the cycle times are parameterised very simply using the liquid crystal entryterminal on the machine’s control panel. The volumetric system utilises a processof maximised inherent accuracy and consistent reproducibility.
All parameters are displayed in plain text. All product-specific requirementsin combination with the can size being handled are simple to program, storeand recall. In addition to the required fill volume, the duration (in milliseconds)of the individual filling phases can be programmed to suit perfectly the fillingcharacteristics of different types of beverage with varying levels of carbonationand gravity. This offers many ideal properties:
1. Optimum setting of the CO2 flushing phases is possible, starting witha thorough sweep of the can at filling pressure (2.0 bar) prior to seal-ing (duration 150 ms), followed by a flushing of the differential pressure
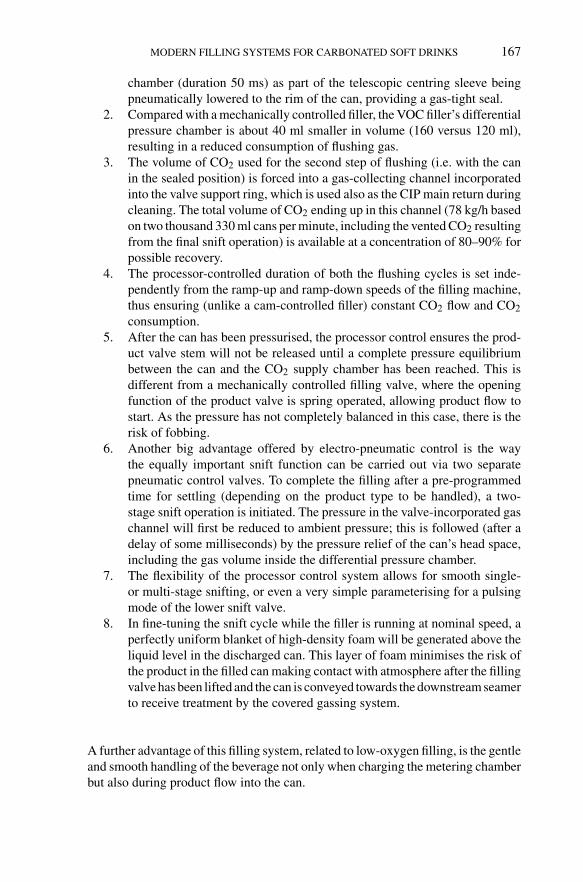
Steen: “chap06” — 2006/4/27 — 18:30 — page 167 — #24
MODERN FILLING SYSTEMS FOR CARBONATED SOFT DRINKS 167
chamber (duration 50 ms) as part of the telescopic centring sleeve beingpneumatically lowered to the rim of the can, providing a gas-tight seal.
2. Compared with a mechanically controlled filler, the VOC filler’s differentialpressure chamber is about 40 ml smaller in volume (160 versus 120 ml),resulting in a reduced consumption of flushing gas.
3. The volume of CO2 used for the second step of flushing (i.e. with the canin the sealed position) is forced into a gas-collecting channel incorporatedinto the valve support ring, which is used also as the CIP main return duringcleaning. The total volume of CO2 ending up in this channel (78 kg/h basedon two thousand 330 ml cans per minute, including the vented CO2 resultingfrom the final snift operation) is available at a concentration of 80–90% forpossible recovery.
4. The processor-controlled duration of both the flushing cycles is set inde-pendently from the ramp-up and ramp-down speeds of the filling machine,thus ensuring (unlike a cam-controlled filler) constant CO2 flow and CO2consumption.
5. After the can has been pressurised, the processor control ensures the prod-uct valve stem will not be released until a complete pressure equilibriumbetween the can and the CO2 supply chamber has been reached. This isdifferent from a mechanically controlled filling valve, where the openingfunction of the product valve is spring operated, allowing product flow tostart. As the pressure has not completely balanced in this case, there is therisk of fobbing.
6. Another big advantage offered by electro-pneumatic control is the waythe equally important snift function can be carried out via two separatepneumatic control valves. To complete the filling after a pre-programmedtime for settling (depending on the product type to be handled), a two-stage snift operation is initiated. The pressure in the valve-incorporated gaschannel will first be reduced to ambient pressure; this is followed (after adelay of some milliseconds) by the pressure relief of the can’s head space,including the gas volume inside the differential pressure chamber.
7. The flexibility of the processor control system allows for smooth single-or multi-stage snifting, or even a very simple parameterising for a pulsingmode of the lower snift valve.
8. In fine-tuning the snift cycle while the filler is running at nominal speed, aperfectly uniform blanket of high-density foam will be generated above theliquid level in the discharged can. This layer of foam minimises the risk ofthe product in the filled can making contact with atmosphere after the fillingvalve has been lifted and the can is conveyed towards the downstream seamerto receive treatment by the covered gassing system.
A further advantage of this filling system, related to low-oxygen filling, is the gentleand smooth handling of the beverage not only when charging the metering chamberbut also during product flow into the can.

Steen: “chap06” — 2006/4/27 — 18:30 — page 168 — #25
168 CARBONATED SOFT DRINKS
The pneumatically controlled product inlet valve is located behind the meteringchamber, providing a link to the flood-filled product ring main integrated into thevalve support. The variable switch points of the ultrasonic level probe can be set toensure that there is always a defined low level of product present inside the meteringchamber, as seen in Figure 6.18. The filling valve compartment is always floodedwith product, and the product entering for the next can to be filled flows gentlyinto the metering chamber as an absolutely bubble-free beverage column. Thisbelow-surface filling process guarantees that the metering chambers are gently filledwithout any turbulence or fobbing, a procedure that can be observed at individuallyinstalled transparent metering chambers made of pressure-resistant glass.
The actual filling valve, which could be referred to as the ‘metering chamberoutlet’, is designed without any springs in the product passages. This is of substantialimportance when considering stringent CIP requirements. Of equal importance isthe achievement of a laminar flow, which is assisted by means of the filling valve’sunbroken 360◦ annular ring-type product discharge orifice.
In a continuous liquid umbrella configuration, product flows down the wallsof the can. The discharge geometry would also allow for flow property variationsbetween different shapes of can. A pre-calibrated volume is ‘drained’ into the can,and the lower trigger point of the probe in the metering chamber generates a signalto close the valve stem pneumatically. This feature is a clear advantage of thevolumetric filling system when compared with conventional height filling systemswith a vent tube and siphon-type gas lock.
Unlike in the case of a mechanical vent tube filler, there is no valve componentmaking contact with the final liquid level in the can. No product can rise into thereturn gas passage. Thus this can filler operates without the need for a scavengefunction, which again helps to achieve a gentle filling process because no residualproduct will be atomised into the empty can during initial CO2 charging. In addition,it reduces the overall CO2 consumption significantly.
The essential VOC system advantages leading to lower TPO figures can besummarised as follows:
1. extremely flexible programming of the flushing mode to achieve the highestpossible CO2 concentration in the can
2. absolute turbulence-free laminar product flow into the can3. utmost flexibility in adjusting the snift process4. no scavenging required.
6.6.2 System expansion – the VOC-C can filler
The second ‘C’ stands for an additional gas channel next to the normal pressurisingchannel to which pure CO2 at the required filling pressure is supplied. All volumetricfillers operate according to the single-chamber principle. This means that the initialpure CO2 cushion in the first pressure channel (connected to the gas compartment ofthe free-standing product tank) is gradually diluted by the CO2/air mixture returnedfrom the can during filling.

Steen:“chap06”
—2006/4/27
—18:30
—page
169—
#26
MO
DE
RN
FILL
ING
SYST
EM
SFO
RC
AR
BO
NA
TE
DSO
FTD
RIN
KS
169
Product
CO2 feed
Fillingvalves
Normally three to four fill levelcontrollers arranged around
the bowl that control themodulating valve ‘A’ on
the product line
Modulating valve ‘A’
Bowl fill level Control limits
Fill level probe
Figure 6.18 Filler bowl level control.

Steen: “chap06” — 2006/4/27 — 18:30 — page 170 — #27
170 CARBONATED SOFT DRINKS
To ensure optimum filling quality, the slightly reduced CO2 concentration fromthe first channel (approximately 98%) is used only for can flushing prior to filling.For can pressurisation, pure CO2 from the second channel is used. This results ina further slight reduction of the TPO figure. During filling, displaced pure CO2flows back into the first gas channel. The two gas channels of the VOC-C-typemachine incorporate separate pressure-control systems and can meet all processrequirements in this respect.
6.6.3 Product level- and pressure-control system in a free-standing product tank
6.6.3.1 Level controlThe annular product channel incorporated into the filling valve carrier ring isconnected via a rotary distributor to a free-standing product tank adjacent to thefiller, with a total volume of 750 l (product and gas compartment). The tank’s filllevel is likewise regulated using an ultrasonic metering probe. The signal is trans-mitted via a central slip ring unit to an electro-pneumatic converter. The pneumaticsignal then activates the modulating valve in the product supply line. After theproduct inlet valve has been opened pneumatically, filling of the metering chamberis governed by the static pressure gradient to the fill level in the free-standing tank.A level-control instrument on the operating panel enables variable adjustment ofthe product supply level in the tank, even during operation, and is independent ofthe set filling pressure. By changing the product supply level, the re-charging speedof the metering chamber can be influenced.
6.6.3.2 Filling pressure controlThe filling pressure in the gas compartment, which is connected by pipe to thefilling valve metering chambers via a rotary gas manifold and the annular gasmain, is matched to the product type concerned by a sensitive, responsive pressure-control system. A pressure transmitter records the filling pressure, and the valueset at the pressure controller incorporated into the operator panel is held con-stant by a so-called split range control system. Two fine-tuned modulation valvesensure proper pressure relief. The ultra-sensitive control system allows for pressurefluctuations within a range of only ±0.1 bar. Filling pressure is also regulated inde-pendently of the product supply pressure. This combination of level and pressurecontrol enables the fundamental rule to keep filling pressure as low as possible andonly as high as necessary to be followed.
6.6.4 Procedural steps of the filling cycle
Before a can is placed under the filling valve, the centring unit is raised under camcontrol by specific venting of the pneumatic cylinder. Thus all that needs to belifted is the weight of the can-centring element itself, without any counter-forces

Steen: “chap06” — 2006/4/27 — 18:30 — page 171 — #28
MODERN FILLING SYSTEMS FOR CARBONATED SOFT DRINKS 171
generated by spring or gas pressure. Compared with conventionally controlled canfillers, wear and tear on cams, rollers and their bearings is thus substantially reduced.
An empty can is positioned exactly under the filling valve by the infeed starwheeland can table guide pockets. Cam-follower controlled, and assisted by the force ofthe meanwhile re-activated pressurised pneumatic cylinder, the can-centring unit ispositively lowered on to the can rim to provide a gap of 2–3 mm and to prepare forthe first operational step.
6.6.4.1 Flushing phase IThe pneumatically opened gas valve ensures thorough CO2 flushing of the emptycan through the centre bore of the valve stem at the adjusted filling pressure,forcing ambient air out of the can. During this initial flushing phase, the major-ity of the CO2 volume used escapes to atmosphere. A flushing-position-installed‘funnel-type’ exhaust system could remove CO2 from the production area, althoughits concentration would be too low for worthwhile recovery. As the flushing/CIP-return valve is opened during this phase too, a small portion of CO2 is forced intothe gas collection/snift channel piped to the rotary distributor.
6.6.4.2 Flushing phase IIIn order to carry out intensive flushing of the lower valve section, which incorporatesa differential pressure can sealing system, allowing the handling of lightweight cans,the centring sleeve is completely lowered to provide a gas-tight seal between can andcentring unit. The pneumatic cylinders with pressure-controlled air supply ensureseal and can-conserving preliminary contact with a top load of approximately 23 kg.
Both gas valves still being open, the CO2 flow into the sealed can is returned,thus flushing the differential pressure chamber. The total volume of flushing gas isforced into the gas collecting channel for recovery via a relief path incorporatedinto the valve.
6.6.4.3 PressurisingIn this phase, the previously mentioned differential pressure system (or pressure-balanced system) becomes effective. The difference between the can rim diameterand the diameter of the telescopic centring sleeve allows the full filling pressure tobe generated with minimum axial load on the can rim after the valve has been closed.
The product valve stem is pneumatically released to allow for its automaticlifting once a pre-set time has elapsed, which ensures that a complete pressure equi-librium between the empty can and the gas compartment in the metering chamberhas been reached. The lifting operation is supported by an externally located spring.
6.6.4.4 FillingOnce the valve cone is lifted, product flows unimpeded by valve internals (noin-built springs) turbulence free into the can along its side wall. A liquid umbrella is
Steen: “chap06” — 2006/4/27 — 18:30 — page 172 — #29
172 CARBONATED SOFT DRINKS
formed by the filling nozzle’s enclosed annular gap. In line with the single-chamberprinciple, gas displaced from the can is fed back into the system through apressurising channel. The lower trigger point of the Transsonar probe in the meter-ing chamber generates the closing signal, which the processor converts into anelectro-pneumatic valve-control operation.
Fill volume accuracy, cautiously guaranteed with a standard deviation of 1.5 mlwhen the system was first introduced, has already been tightened to one standarddeviation of only 0.8 ml for a 330 ml can, owing to excellent results in the field.This is conditional on a dependable fill quantity monitoring system with fillingvalve assignment at the discharge of filler and seamer. Violated limit values canthus be referenced to the valves concerned and quickly corrected at the liquid crystalterminal using the individualised fine-calibration feature of the Transsonar meteringsystem. A standard deviation of 0.8 ml equates to a fill level accuracy of ±0.25 mmfor conventional vent tube filling systems when applied to a can filling machine.
6.6.4.5 SniftingAfter a pre-programmed time for settling (dependent upon product type), the fillingprocess is completed by the snift phase. An upper valve and lower snift valve reducethe head space gas pressure in the can and the connecting gas channels to ambientpressure. Primarily for reasons of loss-free CIP cleaning, both the relief pathslead into the collection channel in the valve support. This means that gas volumesresulting from the snift operation can also be recovered. In this important phaseof the filling cycle, the flexibility of the pneumatic control allows for single- ormulti-stage snifting.
6.6.4.6 Recharging the metering chamberWhen considering filling valve design, the metering chamber, which supplies thecorrect quantity of beverage to the valve, is the most striking feature. The Transsonarultrasonic probe provides very accurate dosing in this chamber. A ball-type stainlesssteel float incorporating a magnet is used as the fill level transmitting element.This level probe provides an extremely high resolution, that is, for each 0.12 mmof travel of the float-incorporated magnet, a trigger signal will be generated.
Product is supplied to the measuring chamber by means of a valve connected tothe annular product channel. The valve is released or closed by means of a pneumaticcylinder. Lifting of the valve cone is again assisted by an externally mounted spring.As soon as the filling of the can is completed, the metering chamber inlet valve willbe opened for the recharging process. The product level travel in the chambercontributes considerably to the success of this type of filler. The lower level triggerpoint is set to ensure a certain residual product volume remains in the chamber/valveblock at the end of each filling cycle. Recharging of the chamber is carried out fromthe lower end through the residual product volume, thus eliminating turbulence andbubble and foam formation.
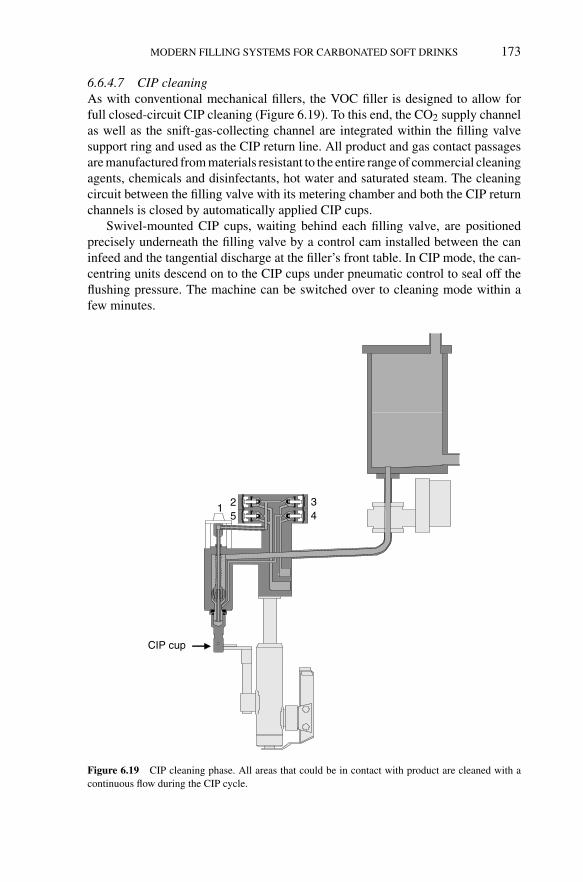
Steen: “chap06” — 2006/4/27 — 18:30 — page 173 — #30
MODERN FILLING SYSTEMS FOR CARBONATED SOFT DRINKS 173
6.6.4.7 CIP cleaningAs with conventional mechanical fillers, the VOC filler is designed to allow forfull closed-circuit CIP cleaning (Figure 6.19). To this end, the CO2 supply channelas well as the snift-gas-collecting channel are integrated within the filling valvesupport ring and used as the CIP return line. All product and gas contact passagesare manufactured from materials resistant to the entire range of commercial cleaningagents, chemicals and disinfectants, hot water and saturated steam. The cleaningcircuit between the filling valve with its metering chamber and both the CIP returnchannels is closed by automatically applied CIP cups.
Swivel-mounted CIP cups, waiting behind each filling valve, are positionedprecisely underneath the filling valve by a control cam installed between the caninfeed and the tangential discharge at the filler’s front table. In CIP mode, the can-centring units descend on to the CIP cups under pneumatic control to seal off theflushing pressure. The machine can be switched over to cleaning mode within afew minutes.
1 2 345
CIP cup
Figure 6.19 CIP cleaning phase. All areas that could be in contact with product are cleaned with acontinuous flow during the CIP cycle.
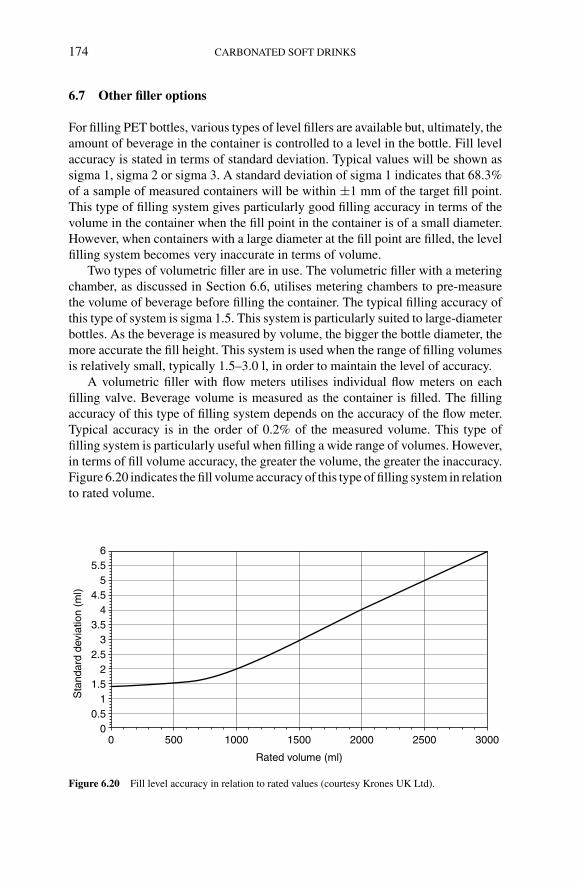
Steen: “chap06” — 2006/4/27 — 18:30 — page 174 — #31
174 CARBONATED SOFT DRINKS
6.7 Other filler options
For filling PET bottles, various types of level fillers are available but, ultimately, theamount of beverage in the container is controlled to a level in the bottle. Fill levelaccuracy is stated in terms of standard deviation. Typical values will be shown assigma 1, sigma 2 or sigma 3. A standard deviation of sigma 1 indicates that 68.3%of a sample of measured containers will be within ±1 mm of the target fill point.This type of filling system gives particularly good filling accuracy in terms of thevolume in the container when the fill point in the container is of a small diameter.However, when containers with a large diameter at the fill point are filled, the levelfilling system becomes very inaccurate in terms of volume.
Two types of volumetric filler are in use. The volumetric filler with a meteringchamber, as discussed in Section 6.6, utilises metering chambers to pre-measurethe volume of beverage before filling the container. The typical filling accuracy ofthis type of system is sigma 1.5. This system is particularly suited to large-diameterbottles. As the beverage is measured by volume, the bigger the bottle diameter, themore accurate the fill height. This system is used when the range of filling volumesis relatively small, typically 1.5–3.0 l, in order to maintain the level of accuracy.
A volumetric filler with flow meters utilises individual flow meters on eachfilling valve. Beverage volume is measured as the container is filled. The fillingaccuracy of this type of filling system depends on the accuracy of the flow meter.Typical accuracy is in the order of 0.2% of the measured volume. This type offilling system is particularly useful when filling a wide range of volumes. However,in terms of fill volume accuracy, the greater the volume, the greater the inaccuracy.Figure 6.20 indicates the fill volume accuracy of this type of filling system in relationto rated volume.
00
0.51
1.52
2.53
3.54
4.55
5.56
500 1000 1500 2000 2500 3000
Sta
ndar
d de
viat
ion
(ml)
Rated volume (ml)
Figure 6.20 Fill level accuracy in relation to rated values (courtesy Krones UK Ltd).

Steen: “colourplate” — 2006/4/27 — 18:31 — page 1 — #1
fromde-aerator
Re-circulation pumpfor carbonation
Booster pumpfor carbonation
Syrup inlet
Product toBuffer tank
Syrup dosing
Plate 4.1 Schematic of a syrup mixer and carbonator.
Support columnInspection cover
Roller assembly
Movable cover Gasket Plate pack Carrying bar
Stud bolt
Fixedcover
Frame foot
ShroudBeering box
Tightening bolt
Lock washer
Tighteningnut
Guide bar
Support foot
Plate 4.2 Flash pasteuriser exploded drawing (courtesy Alfa Laval).

Steen: “colourplate” — 2006/4/27 — 18:31 — page 2 — #2
Plate 5.1 Carbonated bubbles.
Plate 9.1 Airveyor.

Steen: “colourplate” — 2006/4/27 — 18:31 — page 3 — #3
Pressureblock
Threadrollers Thread
rollers
Blockinsert
BlockinsertPressure
block
Tamper-evidentroller
Plate 7.1 Aluminium roll-on closure — BSDA.
Body shell (hard)
Sealing liner(soft)
Inner seal(shell of resilient material)
(a)
(b)
Plate 7.2 Two piece closure — BSDA.

Steen:“colourplate”
—2006/4/27
—18:31
—page
4—
#4
1 Residual draining
2 Pre-soak
3 Pre-jetting 1
4 Recovery
5 Caustic bath 1
6 Caustic bath 2
7 Post-caustic
8 Warm water 1
9 Warm water 2
10 Cold water
11 Post-caustic submerge bath
12 Submerge bath warm water 2
13 Fresh water
Crate washer
Fresh water
Bottle Washer KRONES LAVATEC 682 KD-2-84.....Reku-NT
Plate 9.2 Returnable glass bottle washer (courtesy of Krones UK Ltd).
Steen: “chap06” — 2006/4/27 — 18:30 — page 175 — #32
MODERN FILLING SYSTEMS FOR CARBONATED SOFT DRINKS 175
A capacitance probe filler uses, as its name implies, a capacitance probe todetect the point at which filling should cease. The probe is sited in the centre ofthe filling aperture of the valve and is calibrated along its length so as to detectwhen the fill level is being approached until the actual shut-off at the end of filling.This sophisticated type of filler allows the initial fill through the swirl valve tobe slow to minimise the effect of fobbing; it then allows a fast fill until the filllevel is approached. When the fill level is approached, the probe senses this andallows the fill rate to be reduced, enabling a very accurate end-of-fill cut-off. Theuse of electronic valves within the system ensures the whole operation can beelectronically controlled. The snift can be more finely controlled than in counter-pressure fillers by applying a small back-pressure for the initial snift, followed bya normal snift operation to atmospheric pressure. Owing to the fact that it is morecomplex than traditional fillers, this requires a fuller understanding of the physicsof the operation to achieve the best results.
The valve matrix before the filler allows ease of changeover from product towater rinse to CIP. Valves in the matrix can be automated to open and close accordingto signals from a PLC in the filler. Programs are designed to create different routesthrough the filler for product preparation, filling and CIP. These routes can be setup from a single push-button or, in the case of CIP, selected automatically from theCIP system. A typical valve matrix is shown in Figure 6.21.
Semi-aseptic filling is for acidic carbonated products. Aseptic fillers for carbon-ated products require contact to be made between the filler and the bottle, whichis not required for still products. It is in this contact area that concerns over truesterility arise. It is highly debatable whether the extra expense for such a systemis justified over stringent hygiene with a conventional volumetric filler, say. Theuse of an aseptic filler does allow the production of aseptic products, both stilland carbonated, while still allowing normal carbonated drinks to be filled in theavailable production time.
6.8 Clean-in-place
As discussed under can filling, the majority of modern fillers are designed for CIPto ensure the sterility of the system. These operate from a centrally located CIPsystem that is piped to the filler. They include a return cycle to the CIP set from thefiller, the temperature of the return liquor being sensed at the filler outlet. Speciallydesigned CIP cups are attached to each filling valve to allow the CIP process toact throughout the filler bowl and filling valves and all associated pipework atsufficient velocity and contact time to ensure effective cleaning. In some casesthese cups can be applied automatically. A typical operating cycle would be asfollows:
1. The filler and filling valves are rinsed for a set time using rinse water todrain. This removes particulates. The rinse water used is often the final rinsewater from the preceding CIP operation to conserve water.
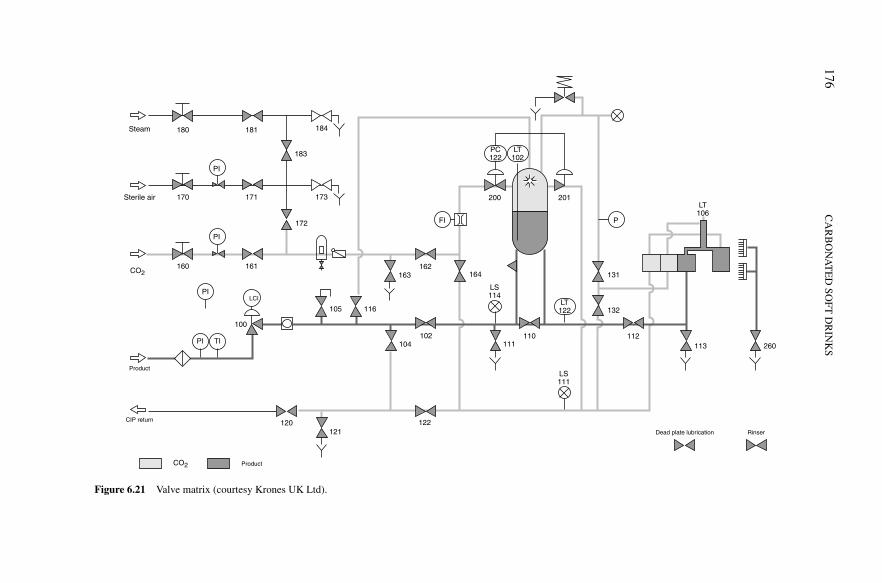
Steen:“chap06”
—2006/4/27
—18:30
—page
176—
#33
176C
AR
BO
NA
TE
DSO
FTD
RIN
KS
Steam
Sterile air
Product
CIP return
Dead plate lubrication Rinser
LCI
180
PI
PI
PI
PI TI
100
120121
122
104102
163162
164
111110
131
132
112113 260
200
LS114
LS111
201
FI P172
173
183
184
105 116
181
170 171
160CO2
161
PC 122
LT 102
LT 122
LT 106
ProductCO2
Figure 6.21 Valve matrix (courtesy Krones UK Ltd).
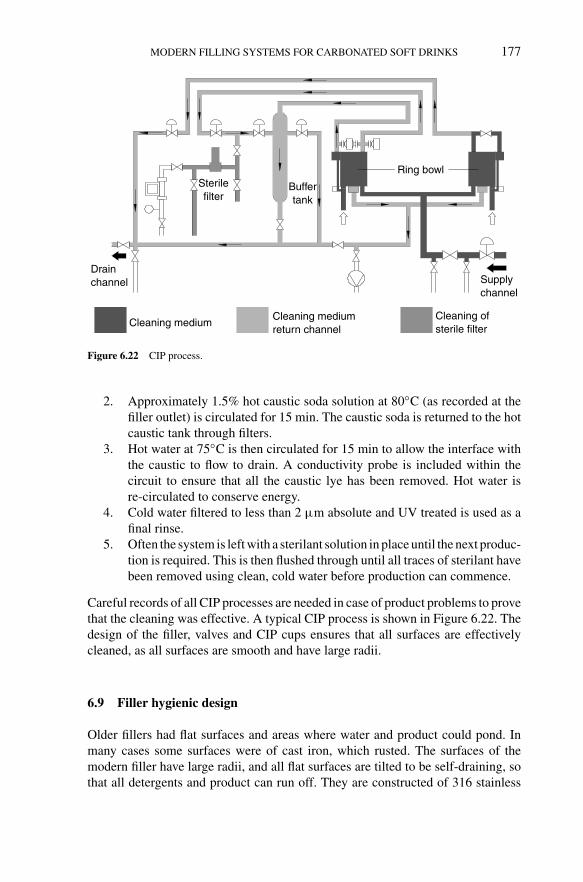
Steen: “chap06” — 2006/4/27 — 18:30 — page 177 — #34
MODERN FILLING SYSTEMS FOR CARBONATED SOFT DRINKS 177
Cleaning mediumCleaning mediumreturn channel
Cleaning ofsterile filter
Sterilefilter
Buffertank
Ring bowl
Supplychannel
Drainchannel
Figure 6.22 CIP process.
2. Approximately 1.5% hot caustic soda solution at 80◦C (as recorded at thefiller outlet) is circulated for 15 min. The caustic soda is returned to the hotcaustic tank through filters.
3. Hot water at 75◦C is then circulated for 15 min to allow the interface withthe caustic to flow to drain. A conductivity probe is included within thecircuit to ensure that all the caustic lye has been removed. Hot water isre-circulated to conserve energy.
4. Cold water filtered to less than 2 µm absolute and UV treated is used as afinal rinse.
5. Often the system is left with a sterilant solution in place until the next produc-tion is required. This is then flushed through until all traces of sterilant havebeen removed using clean, cold water before production can commence.
Careful records of all CIP processes are needed in case of product problems to provethat the cleaning was effective. A typical CIP process is shown in Figure 6.22. Thedesign of the filler, valves and CIP cups ensures that all surfaces are effectivelycleaned, as all surfaces are smooth and have large radii.
6.9 Filler hygienic design
Older fillers had flat surfaces and areas where water and product could pond. Inmany cases some surfaces were of cast iron, which rusted. The surfaces of themodern filler have large radii, and all flat surfaces are tilted to be self-draining, sothat all detergents and product can run off. They are constructed of 316 stainless
Steen: “chap06” — 2006/4/27 — 18:30 — page 178 — #35
178 CARBONATED SOFT DRINKS
steel to allow chemical cleaning. All seals are flush mounted so that the area formicrobial growth is minimised. Washing down a filler is now simple and rapid, aswell as being very effective. Indeed, sprays for washing down the table are oftenbuilt into the machine. Jetting of guide rails is often included. Some manufacturersprefer to mount the machine on several pedestals, whereas others use a single tiltedmetal sheet to cover the innards of the filler, where the shafts, gears and drive motorare sited. So that they do not harbour bacteria, even the machine feet are constructedof stainless steel for ease of wash-down. The machine is designed to allow easeof cleaning of the floor below, with plenty of space to enable debris to be easilynoticed and removed. The main PLC control for the filler is often centrally sitedin a separate panel above the filler. Ideally, these should be protected in at leastan IP 55 enclosure, where the first ‘5’ stands for protection against dust and thesecond ‘5’ for protection against water sprays. (The designation ‘6’ indicates abilityto withstand high-pressure water jets.) The main control panel is usually sited wellaway from the filler, whereas the operator SCADA panel is sited in front of the filler.All electrical cables are waterproof and enclosed in easily cleanable trunking. Allpneumatics and wiring to the parts of the filler are usually installed in stainlesssteel conduit that is well sealed and external to the filler, thus allowing ease ofaccess and cleanability. Machine guards are often pneumatically operated verticallift units for ease of filler access. These are easily washable and are constructed of apolycarbonate resin, or more often nowadays of frameless, multi-layer safety glass.
All this is for a normal carbonated filler. The requirements for aseptic fillingare much more stringent. Infeed and outfeed conveyors, worms and starwheels areof open design so that they can be easily cleaned and often incorporate their ownjetting systems. The days of harbouring bacteria in conveyors owing to difficultiesof access for cleaning are over. Lubrication lines are in plastic and sited so thatthey are cleanable. Often a central lubrication system exists that overcomes theproblem of staff leaning over a machine to grease and lubricate bearings and thelike. A typical modern filler with a tilted table and ease of access for cleaning isshown in Figure 6.23.
6.10 Conclusions
The ultra-high level of competition prevailing in the packaging industry, mechan-ical and electronic technological advances and increasing consumer demands willnaturally lead to further advances in the technology available for beverage fillingand its application in various market sectors.
Recent trends for health drinks have resulted in a massive growth in asepticsystems for the filling of both low- and high-acid products which are sensitive andhave tended to have a short shelf life. Aseptic filling methods allow the extensionof the shelf life without the use of carbonation or preservatives, thus providingthe consumer with a health drink with the convenience previously afforded onlyby carbonated beverages or by beverages utilising traditional preservatives. Asep-tically filled products are without carbonation and as such are not covered by
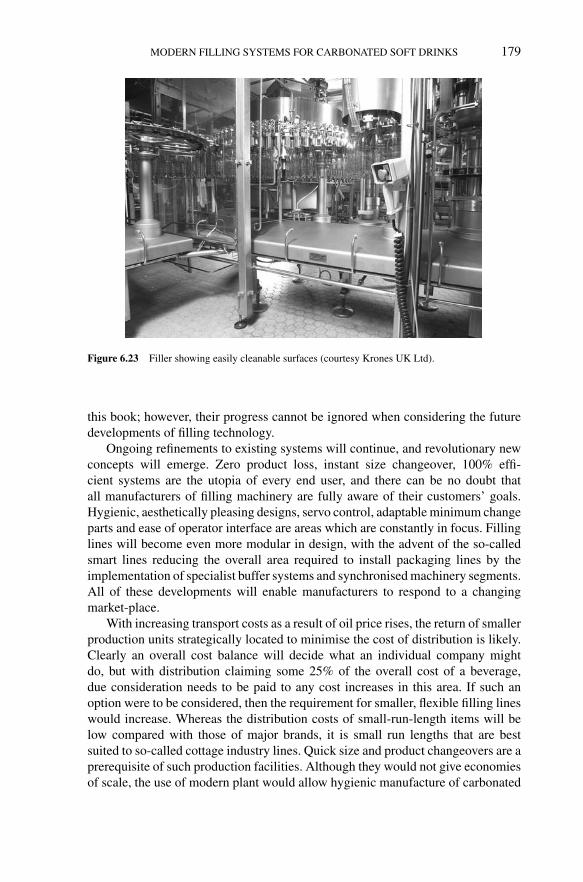
Steen: “chap06” — 2006/4/27 — 18:30 — page 179 — #36
MODERN FILLING SYSTEMS FOR CARBONATED SOFT DRINKS 179
Figure 6.23 Filler showing easily cleanable surfaces (courtesy Krones UK Ltd).
this book; however, their progress cannot be ignored when considering the futuredevelopments of filling technology.
Ongoing refinements to existing systems will continue, and revolutionary newconcepts will emerge. Zero product loss, instant size changeover, 100% effi-cient systems are the utopia of every end user, and there can be no doubt thatall manufacturers of filling machinery are fully aware of their customers’ goals.Hygienic, aesthetically pleasing designs, servo control, adaptable minimum changeparts and ease of operator interface are areas which are constantly in focus. Fillinglines will become even more modular in design, with the advent of the so-calledsmart lines reducing the overall area required to install packaging lines by theimplementation of specialist buffer systems and synchronised machinery segments.All of these developments will enable manufacturers to respond to a changingmarket-place.
With increasing transport costs as a result of oil price rises, the return of smallerproduction units strategically located to minimise the cost of distribution is likely.Clearly an overall cost balance will decide what an individual company mightdo, but with distribution claiming some 25% of the overall cost of a beverage,due consideration needs to be paid to any cost increases in this area. If such anoption were to be considered, then the requirement for smaller, flexible filling lineswould increase. Whereas the distribution costs of small-run-length items will below compared with those of major brands, it is small run lengths that are bestsuited to so-called cottage industry lines. Quick size and product changeovers are aprerequisite of such production facilities. Although they would not give economiesof scale, the use of modern plant would allow hygienic manufacture of carbonated

Steen: “chap06” — 2006/4/27 — 18:30 — page 180 — #37
180 CARBONATED SOFT DRINKS
beverages economically with low labour content. As stock levels would be loweredby the use of supply chain management, and raw and packaging materials could bespecified and purchased centrally, warehousing space would also be low. Hence thesize of a site and the personnel to staff it would not be much more than currentlyexists for large, centrally sited plants. This is yet another challenge that must bemet by the manufacturer of beverage plants.

Steen: “chap07” — 2006/4/28 — 13:25 — page 181 — #1
7 Bottle design and manufacture andrelated packagingDavid Syrett
7.1 Introduction – the objectives of packaging
The objective of any packaging, be it primary – the focus of this chapter in termsof bottles (glass and plastic), cans, closures and labelling – secondary or tertiary,applies equally in that it is designed to contain, protect, market, identify and sell aproduct to bottler’s customers, retailers and their consumers, whilst ensuring thatit has been developed and made with consideration for the environment and all ata minimum cost.
Before considering specific aspects of primary packaging in detail, each ofthe elements mentioned above will now be considered in a little more descriptivemanner.
To contain, thus preventing leakage of the product that the packaging (containerand closure) is designed to contain, whilst holding the stated nominal quantity ofthe product declared on the label.
To protect, by preventing contamination from the environment, atmosphere andsunlight, from the risk of pilferage and the rigors of the distribution supply chain.There is also a need to protect the consumer from the product.
To identify the product to the customer, retailer, and the consumer as well asthe bottlers own and his customer’s distribution systems. To detail on the labeldeclaration as required by law, for example, ingredients, product description (thiscould well be different to the Brand Name) and hazards, for example in termsof handling or opening the package. To give the consumer instructions for useand product shelf life (best before end) information. To provide information onmanufacturing traceability, for example bottlers production location, date, time ofproduction and batch/lot number.
To market to consumers with attractive packaging and label designs. It maybe important to consider consumer acceptability and their restrictions in dexterity.Additionally, there is a need for production and distribution compatibility.
The environment: packaging must be suitable for correct disposal after it hasbeen used, by recycling, reuse or by returning to the supplier to be refilled. Consid-eration must be given for the use of recycled materials, reduction of source materialsby lightweighting and improvements in manufacturing processes.
All at minimum cost, by considering all aspects of the packaging price, that is, thecost of handling, equipment compatibility and ensuring appropriate production lineand distribution efficiency. The contribution of secondary packaging direct productcosts and hence profitability must also be considered. If an element of the packaging
Steen: “chap07” — 2006/4/28 — 13:25 — page 182 — #2
182 CARBONATED SOFT DRINKS
fails before the consumer uses the product then the packaging may have beenincorrectly specified or under specified so whilst including the cost requirementsof the basic materials, additional costs due to the failure of the package to be soldto the consumer may also have been incurred.
In summary, for any soft drinks bottler it is critical to ensure that packagingmaterials are correctly specified and jointly agreed between supplier and bottler.
7.2 Glass
7.2.1 History of glass making
The origins of glass in its natural form of Obsidian (rock of volcanic origin) canbe traced back to use by man to form arrow heads and knives thousands of yearsbefore he found a way to make it for himself for use as a container or bottle. Itis believed that glass was first produced in ancient Egypt to make glass beads andhollow vessels around 1500 to 1350 bc.
Glass bottles were first used for wine and water from around the start of thead 1600s. However, after Joseph Priestley’s discovery of a practical method of mak-ing artificial mineral water in 1772, early soft drinks pioneers like Jacob Schweppeinitially used earthenware bottles. These were not impermeable to high pressure,so soft drinks bottlers turned to glass. Initially an egg-shaped glass bottle (designedto lay on its side to keep the cork moist) devised by Nicholas Paul, partner to JacobSchweppe was used. It was in use before 1809 when William Hamilton describedit in his patent for a continuous carbonation process. Paul explained in his report tothe National Institute of France his preference for glass bottles over earthenware:‘Glass, though more expensive, retains the gas and can be transported more safelythree or four hundred miles by land, or on a voyage to the East or West Indies’.
The glass bottle was initially blown by hand. A gob of molten glass was taken ona blowing tube, put into a mould and blown to shape. A metal rod called a pontil wasthen attached to the base of the bottle. The blown bottle was knocked off leavinga rough edge at the neck. Using the pontil to hold the bottle a second workmanreheated the neck and applied molten glass for the ‘finish’ or neck ring, which heshaped with moulding tools. Finally the bottle would be taken off for annealing.
This method was used to produce a ‘large’ bottle which contained 10 fl oz,12 pint (approx. 275 ml). In about 1870, a half-sized bottle was introduced calledthe ‘split’, it held a 1
4 pint, 5 fl oz (127 ml) The name ‘split’ is still in use todaywhere it is associated, in the UK, with the 180 ml returnable glass bottle used inthe licensed trade for soft drinks. The egg-shaped bottle remained popular until theturn of the century and was still in use until 1916.
Hiram Codd of Camberwell patented his glass bottle with integral glass marblestopper in 1875 as seen in Figure 7.1. The glass stopper contained in the neck of thebottle is forced by the pressure of the gas from the carbonated product up againstthe rubber ring thus forming a seal. When the marble was pushed down by a fingerit opened the bottle and the glass marble fell into a recess formed as part of theshoulder of the bottle. The bottle was popular because it was easily filled and closed

Steen: “chap07” — 2006/4/28 — 13:25 — page 183 — #3
BOTTLE DESIGN AND MANUFACTURE AND RELATED PACKAGING 183
Figure 7.1 Codd bottle (courtesy of British Soft Drinks Assoc.).
and remained in use in the UK until the 1930s, although it is still possible to findthem in use today in places such as parts of India. For more than twenty yearsaround the turn of the twentieth century it was the most popular of all the earlyglass bottles available for use with soft drinks.
William Painter invented the crown cork in 1892 and during the early yearsof the twentieth century, bottles of cylindrical, champagne and egg shapes wereproduced in increasing numbers with the special lips required for the crown. Bythis time, the egg-shaped bottle had developed a flat bottom since there was nolonger a need to store it on its side. The modern bottle with a crown cork finishwas first produced in the 1920s and is still in use today. As glass technology anddesign developed so other neck finishes and closure systems were introduced, such

Steen: “chap07” — 2006/4/28 — 13:25 — page 184 — #4
184 CARBONATED SOFT DRINKS
as the continuous screw thread using aluminium closures which allowed bottles tobe resealed by the consumer.
By the 1960s there were, in the UK, some 40 factories making glass bottles.These factories were located in Scotland, Lancashire, Yorkshire, Nottinghamshire,Kent and the London area. Today there are less than 10, mostly in northern Englandand Scotland.
7.2.2 Bottle supplier identification marks
In order to aid traceability of glass bottle manufacture, producers have traditionallyincluded a maker’s mark, known as a ‘Punt Mark’, embossed on the glass. In theUK these marks have, over time, been supplemented with the addition of a letterand number which identifies the factory. For a complete reference, Emhart GlassZurich have historically published a booklet of worldwide marks, which can beseen by registered users on the website www.emhartglass.com. Usually the marksare embossed around the in-sweep heel of the bottle with the mould number and themeasuring container bottle identification requirements. The alternative place is onthe bottle base. There may also be a collection of dots as part of the markings; theseare used by glass manufacturers for automatic on-line reading of moulds whichallows stock to be rejected if required.
7.2.3 Bottle design and headspace considerations
When first developing a glass bottle design for carbonated soft drinks there are anumber of things to consider. To assist there are some basic guidelines to follow:
1. Bottles must be of circular cross-section, they are all required to containpressure, be it for high or low carbonation products. If the product requiresin-pack pasteurisation, higher pressures will be generated and restrict thecarbonation level achievable for the product.
2. The headspace needs to be set within defined limits, ideally the minimumgiven for all potential products for which that bottle design could be used.
3. The product’s final carbonation level and bottling processing conditions.4. Internal pressure resistance, as the bottle needs to have sufficient strength
to withstand the pressure that results. The levels for various carbonationconditions are shown in Table 7.1.
5. Thermal shock, if the product requires pasteurisation (there are well-definedstandards for glass bottles).
6. Final bottle and pack palletisation by the bottler for shipment to theircustomer. Modern automated distribution and warehousing systems meanthe bottle and the selected secondary packaging format must fit the stan-dard 1000 mm × 1200 mm pallet minimising any overhang and minimalunderhang (±20 mm).
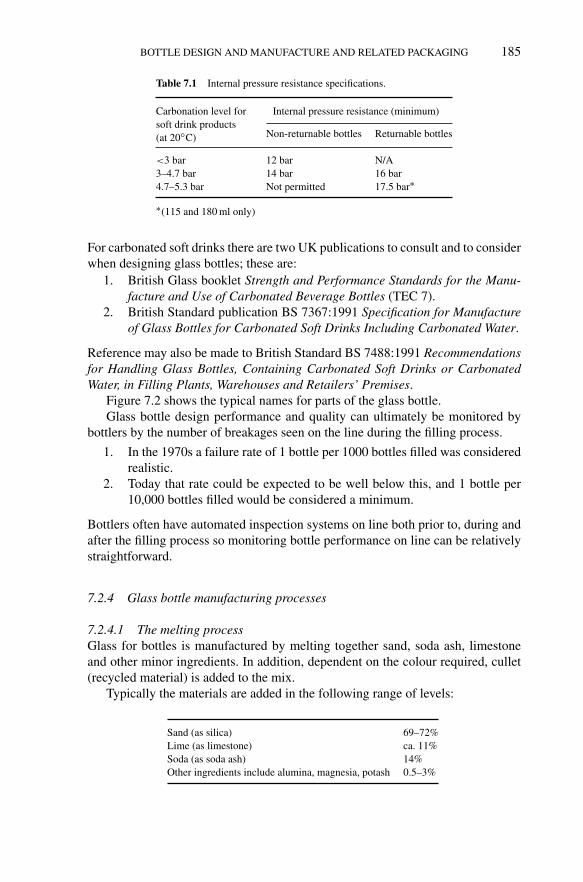
Steen: “chap07” — 2006/4/28 — 13:25 — page 185 — #5
BOTTLE DESIGN AND MANUFACTURE AND RELATED PACKAGING 185
Table 7.1 Internal pressure resistance specifications.
Carbonation level forsoft drink products(at 20◦C)
Internal pressure resistance (minimum)
Non-returnable bottles Returnable bottles
<3 bar 12 bar N/A3–4.7 bar 14 bar 16 bar4.7–5.3 bar Not permitted 17.5 bar∗
∗(115 and 180 ml only)
For carbonated soft drinks there are two UK publications to consult and to considerwhen designing glass bottles; these are:
1. British Glass booklet Strength and Performance Standards for the Manu-facture and Use of Carbonated Beverage Bottles (TEC 7).
2. British Standard publication BS 7367:1991 Specification for Manufactureof Glass Bottles for Carbonated Soft Drinks Including Carbonated Water.
Reference may also be made to British Standard BS 7488:1991 Recommendationsfor Handling Glass Bottles, Containing Carbonated Soft Drinks or CarbonatedWater, in Filling Plants, Warehouses and Retailers’ Premises.
Figure 7.2 shows the typical names for parts of the glass bottle.Glass bottle design performance and quality can ultimately be monitored by
bottlers by the number of breakages seen on the line during the filling process.
1. In the 1970s a failure rate of 1 bottle per 1000 bottles filled was consideredrealistic.
2. Today that rate could be expected to be well below this, and 1 bottle per10,000 bottles filled would be considered a minimum.
Bottlers often have automated inspection systems on line both prior to, during andafter the filling process so monitoring bottle performance on line can be relativelystraightforward.
7.2.4 Glass bottle manufacturing processes
7.2.4.1 The melting processGlass for bottles is manufactured by melting together sand, soda ash, limestoneand other minor ingredients. In addition, dependent on the colour required, cullet(recycled material) is added to the mix.
Typically the materials are added in the following range of levels:
Sand (as silica) 69–72%Lime (as limestone) ca. 11%Soda (as soda ash) 14%Other ingredients include alumina, magnesia, potash 0.5–3%
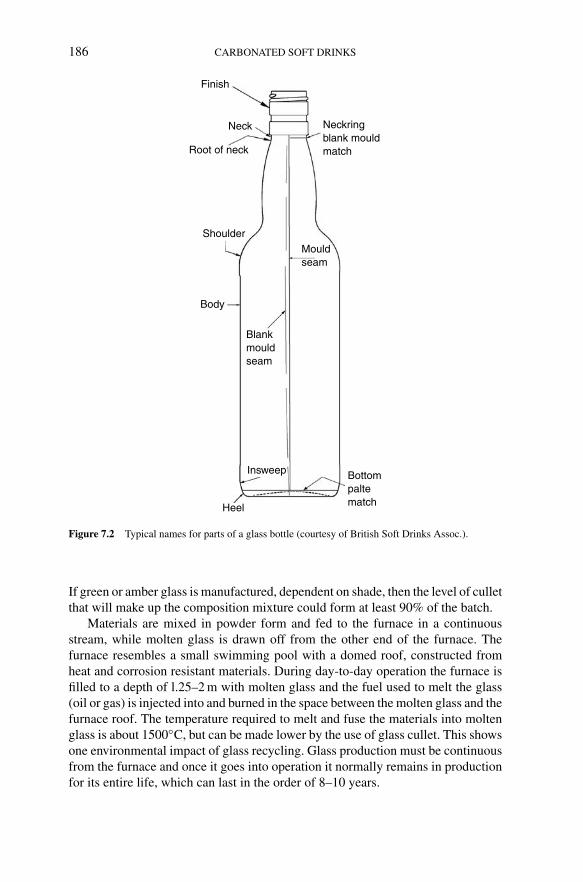
Steen: “chap07” — 2006/4/28 — 13:25 — page 186 — #6
186 CARBONATED SOFT DRINKS
Finish
Neck
Root of neck
Neckringblank mouldmatch
Mouldseam
Shoulder
Body
Blankmouldseam
Insweep
Heel
Bottompaltematch
Figure 7.2 Typical names for parts of a glass bottle (courtesy of British Soft Drinks Assoc.).
If green or amber glass is manufactured, dependent on shade, then the level of culletthat will make up the composition mixture could form at least 90% of the batch.
Materials are mixed in powder form and fed to the furnace in a continuousstream, while molten glass is drawn off from the other end of the furnace. Thefurnace resembles a small swimming pool with a domed roof, constructed fromheat and corrosion resistant materials. During day-to-day operation the furnace isfilled to a depth of l.25–2 m with molten glass and the fuel used to melt the glass(oil or gas) is injected into and burned in the space between the molten glass and thefurnace roof. The temperature required to melt and fuse the materials into moltenglass is about 1500◦C, but can be made lower by the use of glass cullet. This showsone environmental impact of glass recycling. Glass production must be continuousfrom the furnace and once it goes into operation it normally remains in productionfor its entire life, which can last in the order of 8–10 years.
Steen: “chap07” — 2006/4/28 — 13:25 — page 187 — #7
BOTTLE DESIGN AND MANUFACTURE AND RELATED PACKAGING 187
Molten glass is taken from the furnace through individual channels, known asthroats, leading to the bottle forming machines. One furnace will normally providemolten glass for several forming machines, which can be producing different bottledesigns. The flow of glass is controlled by passage through an orifice and immedi-ately below the orifice is a pair of metal shears that cuts the flow of glass into ‘gobs’of the predetermined weight for the bottle design, each gob falling into a mould inthe bottle forming machine.
7.2.4.2 Glass bottle formingOnce a gob enters the forming machine, glass bottles are formed in two stages. Instage one, known as the ‘blank’ or ‘parison’ mould, the gob of glass is blown withair to take up the shape of the mould, in particular the neck and thread finish for theclosure. This is known as the ‘blow/blow’ process. Alternatively, the gob is pressedinto shape with a metal plunger, this being known as the ‘narrow neck press andblow’ process.
In stage two of both processes, the ‘blank’ is then held by the neck and transferredto the second or final mould in which air pressure is used to blow out the bottle toits final design shape as defined by the metal mould.
As mentioned both ‘blow/blow’ and ‘narrow neck press and blow’ can be usedas alternate methods for forming glass bottles. The latter method was first developedfor use with wide mouth containers such as jam jars (and is simply known as ‘Pressand Blow’) but has over time been developed to work on narrow neck bottles such asthose used for soft drinks and is now preferred for lightweight non-returnable softdrinks bottles because the pressing stage gives greater consistency in bottle-wallthickness.
The moulds are made from cast iron, which are machined accurately to give thedesired shape and size of the bottle. When the surfaces of the mould are polished andany lettering or decoration required on the bottle is machined into the mould surface.
After the bottle is moulded, it is taken out of the mould and placed on a heatedconveyor belt. When the outside of the bottle has cooled to about 300◦C and issufficiently rigid to be handled with appropriate tools, but the inside is still very hotand the glass is soft. Due to this uncontrolled cooling, stresses build up in the glassthat would leave the bottle too fragile to be useful. The next stage is to pass thebottles through the annealing oven or ‘lehr’ in which the bottles are reheated to auniform 550◦C, a temperature at which glass can flow slightly allowing the removalof stresses in the newly formed bottle. The bottles are then allowed to cool uniformlyduring their passage slowly through the remainder of the lehr. The strength of abottle lies in its skin and when first formed it is stronger than steel. However 90% ofthe strength is lost through minute scratches resulting from contact with the mouldand other equipment on the manufacturing line. Resistance to this surface damagecan be improved by the application of surface coatings, known as hot and coldcoatings for obvious reasons. For example, before entering the lehr the bottles canbe sprayed with a solution of stannous chloride, the hot end coating. When leavingthe lehr after cooling they are sprayed again with a lubricant, known as the cold end
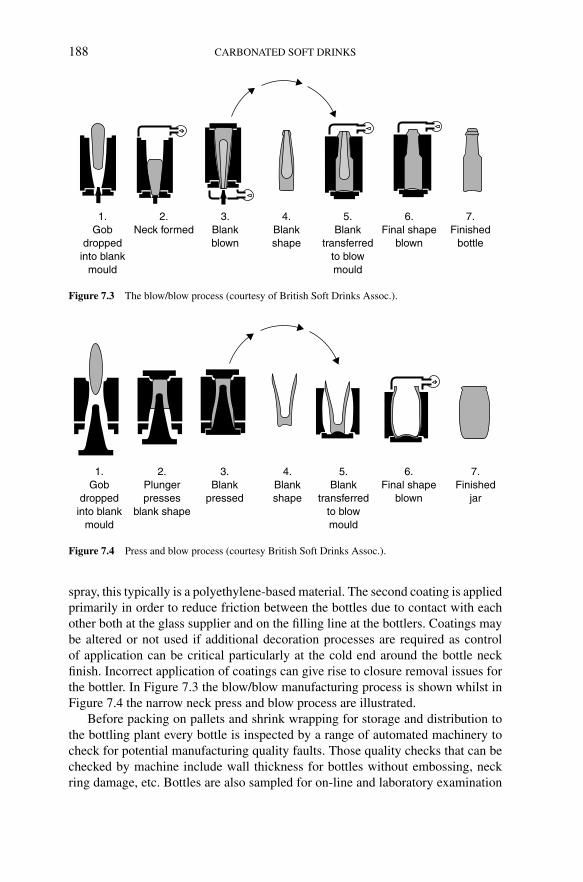
Steen: “chap07” — 2006/4/28 — 13:25 — page 188 — #8
188 CARBONATED SOFT DRINKS
1.Gob
droppedinto blank
mould
2.Neck formed
3.Blankblown
4.Blankshape
5.Blank
transferredto blowmould
6.Final shape
blown
7.Finished
bottle
Figure 7.3 The blow/blow process (courtesy of British Soft Drinks Assoc.).
1.Gob
droppedinto blank
mould
2.Plungerpresses
blank shape
3.Blank
pressed
4.Blankshape
5.Blank
transferredto blowmould
6.Final shape
blown
7.Finished
jar
Figure 7.4 Press and blow process (courtesy British Soft Drinks Assoc.).
spray, this typically is a polyethylene-based material. The second coating is appliedprimarily in order to reduce friction between the bottles due to contact with eachother both at the glass supplier and on the filling line at the bottlers. Coatings maybe altered or not used if additional decoration processes are required as controlof application can be critical particularly at the cold end around the bottle neckfinish. Incorrect application of coatings can give rise to closure removal issues forthe bottler. In Figure 7.3 the blow/blow manufacturing process is shown whilst inFigure 7.4 the narrow neck press and blow process are illustrated.
Before packing on pallets and shrink wrapping for storage and distribution tothe bottling plant every bottle is inspected by a range of automated machinery tocheck for potential manufacturing quality faults. Those quality checks that can bechecked by machine include wall thickness for bottles without embossing, neckring damage, etc. Bottles are also sampled for on-line and laboratory examination

Steen: “chap07” — 2006/4/28 — 13:25 — page 189 — #9
BOTTLE DESIGN AND MANUFACTURE AND RELATED PACKAGING 189
to predetermined sampling plans. It is important for the bottler to be sure thatsampling plans meet their requirements for their product.
7.2.5 Glass quality faults
Glass manufacturers have historically split glass manufacturing quality faults intothree categories dependant on their considered level of severity: critical, majorand minor. Additionally with the major and minor categories bottle manufacturerswould expect to apply acceptable quality levels (AQLs) to certain of the examples.
An alternative view for the bottler to consider with respect to quality and/ormanufacturing faults could be:
1. Could the fault result in health and safety and/or legal issues?2. Could the fault affect consumer perception of the product but is not a bottle
safety issue?3. Could the fault directly affect filling line runability?4. Could the fault affect either the product or production process?
7.2.5.1 Critical defectsA critical defect is defined as one that could result in hazardous or unsafe conditionsfor an individual using the glass bottle and which could be injurious to his or herhealth. Figure 7.5 illustrates typical critical defects. A ‘birdcage’ (also known asaerial, birdswing, monkey swing) is a thread of glass on the inside of the bottleextending between two points of the body or neck. A ‘stuck plug’ is a piece ofglass, usually sharp, projecting inwards just inside the mouth of the bottle. ‘Fusedglass’ is a piece or pieces of glass which could drop inside a glass bottle whilst hotand adheres to the inside surface. ‘Ring finish damage’ is a small fragment of glasson the bottles sealing surface that has broken away without causing the finish tobreak which has left a sharp edge that could cause injury.
7.2.5.2 Major defectsA major defect is one which could result in either failure of the bottle to passsuccessfully through the filling line or failure of the bottle to perform its intendedpurpose. These fault types are normally functional in nature. Figure 7.6 shows majordefect examples. ‘Large body tears’ are large fissures which can occur anywhereon the bottle where sections of the external glass surface have been torn away.‘Deformed necks’ are where the bottle neck is visually out of vertical and is likelyto result in the filler head/tube breaking the bottle or the head/tube being damaged.An ‘under filled neck finish’ is when the bottle neck finish has not been fully formedso whilst the closure and crown could be applied ultimate performance of the bottleis affected and could result in product spoilage. ‘Spinners’ occur when the centreof the bottles base has dropped below the standing/bearing surface such that the
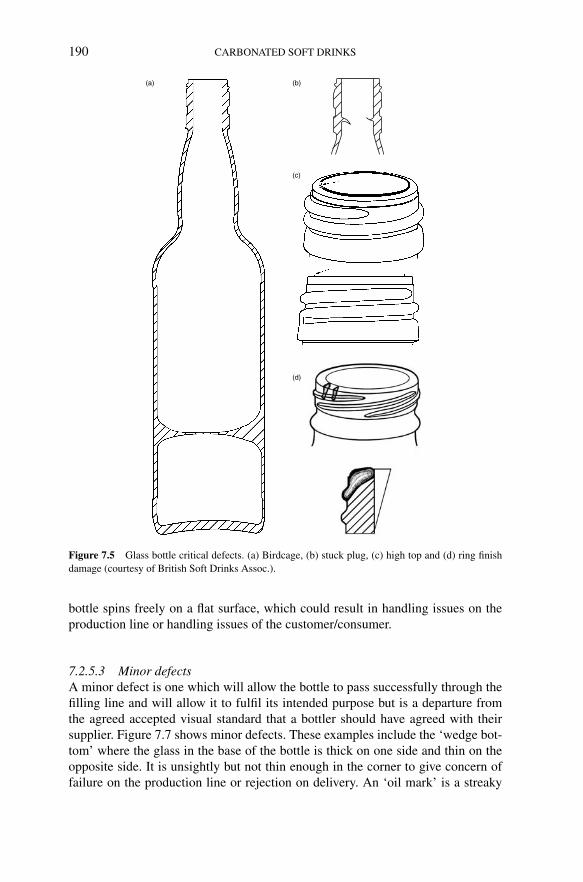
Steen: “chap07” — 2006/4/28 — 13:25 — page 190 — #10
190 CARBONATED SOFT DRINKS
(a) (b)
(c)
(d)
Figure 7.5 Glass bottle critical defects. (a) Birdcage, (b) stuck plug, (c) high top and (d) ring finishdamage (courtesy of British Soft Drinks Assoc.).
bottle spins freely on a flat surface, which could result in handling issues on theproduction line or handling issues of the customer/consumer.
7.2.5.3 Minor defectsA minor defect is one which will allow the bottle to pass successfully through thefilling line and will allow it to fulfil its intended purpose but is a departure fromthe agreed accepted visual standard that a bottler should have agreed with theirsupplier. Figure 7.7 shows minor defects. These examples include the ‘wedge bot-tom’ where the glass in the base of the bottle is thick on one side and thin on theopposite side. It is unsightly but not thin enough in the corner to give concern offailure on the production line or rejection on delivery. An ‘oil mark’ is a streaky

Steen: “chap07” — 2006/4/28 — 13:25 — page 191 — #11
BOTTLE DESIGN AND MANUFACTURE AND RELATED PACKAGING 191
(a)
(b)
(c)
(d)
Figure 7.6 Glass bottle major defects. (a) Large body tear, (b) deformed neck, (c) under filled neckand (d) spinner (courtesy of British Soft Drinks Assoc.).
brown/black discolouration usually found in the body of the bottle. ‘Seeds and blis-ters’ are bubbles in the body of the bottle, but not on the surface of the container,which exceed standards that the bottler has agreed with the supplier as commerciallyacceptable.
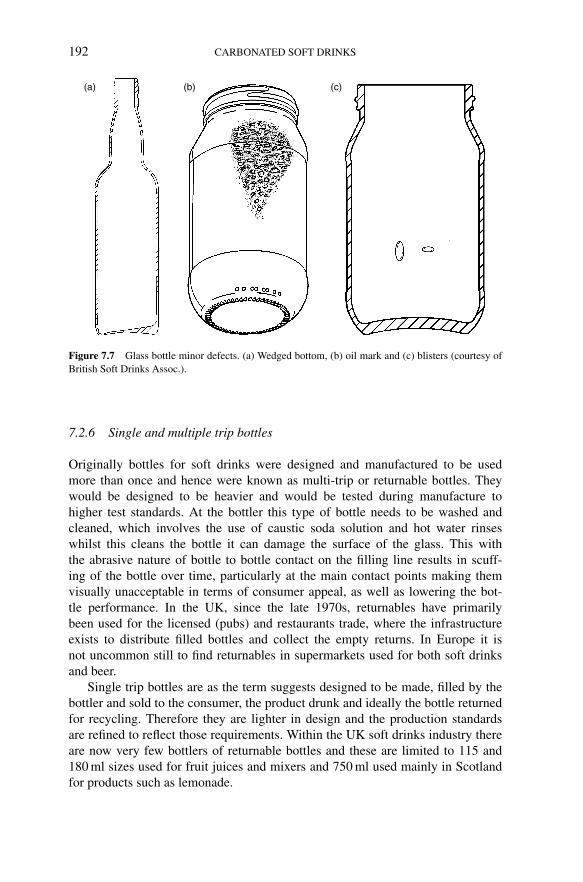
Steen: “chap07” — 2006/4/28 — 13:25 — page 192 — #12
192 CARBONATED SOFT DRINKS
(a) (b) (c)
Figure 7.7 Glass bottle minor defects. (a) Wedged bottom, (b) oil mark and (c) blisters (courtesy ofBritish Soft Drinks Assoc.).
7.2.6 Single and multiple trip bottles
Originally bottles for soft drinks were designed and manufactured to be usedmore than once and hence were known as multi-trip or returnable bottles. Theywould be designed to be heavier and would be tested during manufacture tohigher test standards. At the bottler this type of bottle needs to be washed andcleaned, which involves the use of caustic soda solution and hot water rinseswhilst this cleans the bottle it can damage the surface of the glass. This withthe abrasive nature of bottle to bottle contact on the filling line results in scuff-ing of the bottle over time, particularly at the main contact points making themvisually unacceptable in terms of consumer appeal, as well as lowering the bot-tle performance. In the UK, since the late 1970s, returnables have primarilybeen used for the licensed (pubs) and restaurants trade, where the infrastructureexists to distribute filled bottles and collect the empty returns. In Europe it isnot uncommon still to find returnables in supermarkets used for both soft drinksand beer.
Single trip bottles are as the term suggests designed to be made, filled by thebottler and sold to the consumer, the product drunk and ideally the bottle returnedfor recycling. Therefore they are lighter in design and the production standardsare refined to reflect those requirements. Within the UK soft drinks industry thereare now very few bottlers of returnable bottles and these are limited to 115 and180 ml sizes used for fruit juices and mixers and 750 ml used mainly in Scotlandfor products such as lemonade.

Steen: “chap07” — 2006/4/28 — 13:25 — page 193 — #13
BOTTLE DESIGN AND MANUFACTURE AND RELATED PACKAGING 193
7.2.7 Lightweighting
One of the first lightweight bottles was the 250 ml non-returnable glass bottle for softdrinks which was introduced in the 1970s. The improvements in bottle manufacturethat allowed the introduction of the lightweight bottles are as follows:
1. Designs being closer to a spherical shape, as the strongest structure in glasswill be a sphere.
2. A reduction in the glass defects during manufacture.3. The introduction of the rounded heel in bottle design. The bottle heel was
traditionally the weakest point in a glass bottle where originally it was asharp angle joining the sidewall to the base.
4. Stippling on the bearing surface; this prevented sudden cooling of the baseand thermal shock defects.
5. Glass distribution, the use of narrow neck press and blow for soft drinksbottles allows more control over the evenness of thickness of sidewalls,shoulder and base on bottles.
6. Surface strengthening, the strength of glass lies in its skin, hence the appli-cation of stannous chloride spray at the hot end of the lehr which increasesthe surface strength.
7. Lubrication, such as sprays at the cold end which coat the bottle andreduce surface scuffing causing damaging abrasion due to bottle-to-bottlecontact.
Plastic sleeves which are part of the final label design can offer some degree ofprotection to the surface of a bottle both during transportation to the bottling plant,during the filling process and then through onward distribution to customer andconsumer. In the 1970s and 1980s this was usually in the form a polystyrene sleeveknown as ‘Plastishield’, which was offered by one glass supplier in the UK. It onlycovered two-thirds of the bottle height and the quality of print of the label wassomewhat limited. Today heat shrink sleeve labels covering the full bottle heightoffer high quality graphics, these can be made from plastics such as PET and PVC.These are reverse printed, the printed sleeve being applied to the bottle and shrunkto match its shape using hot air usually combined with steam to achieve the correctapplication. Other premium decoration processes include ACL (applied ceramiclabel), this process uses inks used to print branding and other information on to glassbottles, the process consists of treating unpainted glass bottle by flame cleaning,screen printing up to three colours, one at a time, then finally heat treating the printedbottles to set the ink indelibly. For PSL (pressure sensitive labels), the design isusually printed on a clear plastic label material, the labels are self-adhesive andusually used to maximise the effect of the product branding, and coloured coatingexist for glass bottles, but not all suppliers offer all options. All these applicationsinvolve additional processes thus costs for the bottler are likely to be higher.

Steen: “chap07” — 2006/4/28 — 13:25 — page 194 — #14
194 CARBONATED SOFT DRINKS
7.2.8 Recycling
In the UK, the ‘Producer Responsibility Obligations (packaging waste) Regulations1997’, as amended, impose obligations on all parties in the packaging chain, be thatthe packaging manufacturer, the packaging user, the customer and to an increasingdegree the consumer. For the packaging supplier and bottler part of the obliga-tions are to ensure that the minimum amount of packaging is used to contain therequired product and that packaging which is used is recycled or recovered as far aspossible.
Today, recycled glass from bottle banks, bottling factory line failures, bottlequality rejects and scrap from the glass manufacturers’ own processes, collectivelyknown as cullet, can be used to make new glass. Using cullet has a number ofenvironmental advantages; it helps preserve the countryside by reducing the needfor quarrying of glass’s basic raw materials and it melts more easily than sand, themajor ingredient, therefore saving energy and reducing furnace emissions. Almostany proportion of cullet can be added to the raw material mixture (known as thebatch), provided it is in the right condition and that includes the required colour.Glass made from batch containing 95% of cullet is now not uncommon but is oftenlimited to green and amber bottles due to the difficulty in controlling impuritiesin the cullet sourced via bottle banks when it is added to white flint (clear) glass.Although the glass collected through bottle banks may come from manufacturersworldwide, it can be used anywhere, as container glass compositions are verysimilar.
However, it is important that glass colours are not mixed and are free fromimpurities, especially metals and ceramics. In the UK, there is an excess of greencullet due, in part, to the level of imported wine bottles. It has been known toexport cullet to glass manufacturers abroad to countries as far a field as Brazil.Alternatively it can be used by the construction industry for such things as layingpavement slabs on in place of traditional sand.
7.3 Plastic bottles
7.3.1 Introduction – advantages and limitations
Before looking at the principal material used for plastic bottles for carbonatedsoft drinks, namely PET, it is useful to consider by way of introduction some ofthe general advantages and limitations of plastics materials to allow the reader toconsider the differences with other similar primary packaging, such as glass.
7.3.1.1 Advantages1. Plastics are lighter in weight when compared with glass; for example a
typical 1 l PET bottle weighs 38 g, against a 1 l glass bottle of 600 g.2. No corrosion problems when compared to cans.

Steen: “chap07” — 2006/4/28 — 13:25 — page 195 — #15
BOTTLE DESIGN AND MANUFACTURE AND RELATED PACKAGING 195
3. Versatility in design terms.4. The offer of a larger pack format, for example a typical PET bottle is 2 l in
size, the largest glass bottle offered for soft drinks is 1.1 l, and dimensionallythey would appear similar in size.
5. Impact strengths can be greater than glass and where breakages do occurthere are no splinters.
6. Quietness in use in the bottling plant.
7.3.1.2 Limitations1. Plastics are not complete barriers to either gases or water vapour, this means
carbonation can escape and oxygen ingress can occur over time.2. Some chemicals attack plastics; for example silicone sprays, often used to
lubricate conveyors, can induce stress cracking in PET bottle bases.3. Resistance to abrasion can mean a poor bottle surface appearance, particu-
larly if returnable plastic bottles are being considered.4. There is a potential liability for the build up of static electricity, which can
give rise to two key issues in terms of soft drinks bottling. First, if a bottlerblows their own bottles on site then bottles may stick together on the airconveyor system on route to the filler causing intermittent supply. Second,if the bottles are pre blown or preforms used for bottling on site are not100% clean then static can attract minute particles of dust which may coatthe internal surface of a bottle causing product to fob during filling.
5. When comparing plastic and glass bottles of the same volume then visuallythe plastic bottle will look smaller giving a consumer the perception ofgetting less.
7.3.2 Polyethylene terephthalate
Polyethylene terephthalate (PET) is a polyester polymer consisting of alternateunits of ethylene glycol and terephthalic acid. The chain length is about 30,000double units, depending on application. PET used for carbonated soft drinks has adifferent requirement to that used for still drinks.
7.3.3 History
PET was developed as a textile fibre in the 1940s and is still used as such forcarpets and clothing. Its use in packaging was initially in the mid-to-late 1960s forpackaging films. The use of PET for carbonated soft bottles started in the earlypart of the 1970s, when it was first introduced as a bottle that comprised of twoparts. The main body section, which contained the product, had a cylindrical bodysection with rounded shoulders and a hemispherical base. In order that the bottlecould stand up, a base cup, usually black and made from high density polyethylene

Steen: “chap07” — 2006/4/28 — 13:25 — page 196 — #16
196 CARBONATED SOFT DRINKS
(HDPE) was stuck to the hemispherical bottle base with hot melt adhesive. Themain disadvantage of the two-piece bottle was the fact that gluing of the bottle andbase was a critical aspect of the process which was often its weakest link in terms offinal pack quality. Those first bottles weighed about 65 g excluding the base, whichcompares with today’s modern five foot petaloid 2 l bottle which weighs only 43 g.
7.3.4 PET bottles today
PET bottle production starts with pellets of resin which are moulded into a preform.These are then used to make a bottle in what is typically a two-stage process forcarbonated soft drink bottles.
7.3.4.1 PreformsIn stage one a preform is produced by high-pressure injection moulding in which thepellets of resin which have initially been dried are melted at temperatures of about275◦C. If colour is required for the final design, then it can be added during themelting process at the required dosage, just prior to being injected into the mould.Once melted the molten plastic is injected into a precision mould; the mould iscooled with chilled water, which solidifies the PET. At this point in the process thebottle neck finish, to which the closure will eventually be applied by the bottler, isproduced very accurately. From this point on the handling of the preform throughpackaging, distribution to the bottler and the bottle blowing machine are importantin order to prevent the finish from being damaged, as this can ultimately affect, asa result of micro leakage, not only capping but product performance through to thepoint of consumption by the consumer. A preform can be made and stored for up tosix months before it is converted into a bottle suitable for filling, beyond this timeperiod production of consistently good quality bottles becomes more difficult dueto the preforms attracting moisture from the atmosphere.
7.3.4.2 Bottle blowingIn the second stage the bottle is produced, this can be done by the preform manu-facturers but for larger soft drinks bottlers it is now more common for bottles to beblown on the filling site, either by the bottler themselves or by a third party. Thelatter reduces the cost of transportation of what is in the main air on lorries, forexample a site accepting 100 trucks per week of empty 500 ml bottle could see thisreduced to three or four trucks per week with the equivalent number of preforms ifbottle blowing is on the filling site.
At the start of the bottle blowing process, the preform is heated to about 90◦C. Atthis stage it is critical that the neck finish is protected in the oven, as the incorrectpositioning of heat shields could result in distortion of the neck finish which inturn will affect handling on any air conveyor system on route to the filling andclosure application after filling. Once heated the preform is transferred by the neck

Steen: “chap07” — 2006/4/28 — 13:25 — page 197 — #17
BOTTLE DESIGN AND MANUFACTURE AND RELATED PACKAGING 197
to the bottle mould. The preform is then initially stretched with a metal rod toelongate the preform lengthwise so the tip of the preform is located into the centreof the base section of the mould. Low pressure air at ca. 7–8 bar is applied atthe same time in order to form a balloon inside the mould and then finally highpressure air of up to 40 bar is applied to stretch the material sideways into the finalshape of the bottle mould. These two operations must be done sequentially in orderto get maximum biaxial orientation of the polymer chains.
Orientation is the process of aligning the polymer chains in an orderly fashion bystretching, in biaxial orientation the amorphous polymer (the random arrangementchains) is stretched in both longitudinal and transverse directions simultaneously.Biaxial orientation improves both the tensile strength and the stiffness of the PETbottle. Water vapour and oxygen permeability, critical aspects of achieving goodquality bottles to maximise product shelf life, are thus reduced.
As mentioned already, the early PET bottle had a base cup, which was madeseparately and required assembly with the bottle prior to filling. Today the basecup has been replaced by the ‘petaloid’ base; typically these are of a five footdesign, although examples of the older six foot version still exist and some lowercarbonation products may use four foot or champagne base designs. Generally,these bases are not as stable as other forms of bottle and manufacturers havefound it necessary to replace their slatted conveyor belts with a smoother design.However, base design has progressed over time and today there are a variety ofoptions available in terms of the width and depth of each foot. Although bestpractice recommends that empty bottles are best conveyed suspended by the neckring, bottle base design is perhaps one of the most critical aspects of PET bot-tle blowing and it is important for bottler, preform supplier and mould maker tohave a detailed and clear agreement of the production line and product require-ments when specifying its design. A typical blow moulder installation is shown inFigure 7.8.
Figure 7.8 Typical blow moulder (courtesy of SIG Corpoplast).

Steen: “chap07” — 2006/4/28 — 13:25 — page 198 — #18
198 CARBONATED SOFT DRINKS
7.3.5 Multilayer and barrier coating
In order to improve bottle barrier performance there are an increasing number ofoptions to be considered for the bottler. All have implications, not least that of cost,and limitations which require consideration in relation to the product and bottle-making process. These include multilayer preforms where the centre core can bemade with the addition of nylon and oxygen scavenger systems as either addition ofmaterial to the PET resin to form a monolayer preform or as part of a barrier coating.Other systems such as Sidel’s ‘Actis’ and SIG’s Plasma coating technologies arebeing developed.
7.3.6 Carbonation loss
When considering the use of PET bottles for soft drinks a critical aspect to beconsidered is the rate at which a bottle of a particular size will lose carbonationover time. The smaller the bottle size the higher the rate of loss due to the relationbetween the surface areas of the bottle and the liquid volume it contains.
The rate at which carbonation is lost is dependent on a number of factors but inthe first instance most bottlers increase the level of carbonation in the package at thepoint of production when compared to a can or glass bottle of the same product. Fora cola product this increase is typically in the order of 0.5 volumes. Other factorsthat affect the rate of loss include the PET resin selected for the bottle, the weightof the bottle and the distribution of the material within the bottle, particularly inthe sidewall. For example in the UK the most common weight for a 2 l PET bottlewith a PCO neck finish is 43 g, this is typically 5 g lighter than that used in Europe.Typically for this 2 l bottle the expected loss of carbonation over a 12 week testperiod would be ca. 15–16%. Some of the modern ‘fast reheat’ resins availabletoday can improve carbonation retention by about a week when compared withthe standard material. For a typical 500 ml PET of 26 g that 15–16% loss could beexpected to occur within 8 weeks of bottling and for a 250 ml bottle this would bereduced to 6 weeks. Obviously the factor of carbonation loss has an impact on thelength of time a product can be produced and stored prior to delivery to the consumer.
It is generally believed that with respect to where loss occurs ca. 80% is lostthrough the bottle’s sidewall and 5–10% is lost via both the bottle base and theneck finish/closure system. Figure 7.9 shows typical carbonation loss with time fora high carbonation product.
7.3.7 Permeability of polymers
While considering carbonation loss, PET is not a perfect gas barrier, though it ismuch better than polyethylene or polyvinyl chloride. Carbonation loss occurs ascarbon dioxide permeates through the PET walls. Table 7.2 compares the perme-ability of a range of common packaging plastics to oxygen, carbon dioxide and

Steen: “chap07” — 2006/4/28 — 13:25 — page 199 — #19
BOTTLE DESIGN AND MANUFACTURE AND RELATED PACKAGING 199
4.30
4.20
4.10
4.00
3.90
3.80
Car
bona
tion
(vol
umes
)
3.70
3.60
3.50
3.40
3.300 1 2 3 4 5 6 7 8 9 10 11 12 13
Product age (weeks)
Minimum CO2
PET bottle carbonation loss 20C + 5C Std.Amb. Std.Poly (Amb. Std.)Poly (20C + 5C Std.)
Figure 7.9 Carbonation loss graph (courtesy of David Syrett).
Table 7.2 Permeability comparison.
Permeability Oxygen Carbon dioxide Water
Polystyrene (PS) 6000 17,000 100Low-density polyethylene (LDP) 6000 3000 20Polypropylene (PP) 3600 9500 8High-density polyethylene (HDPE) 2800 9000 5ABS 2000 6000 70Copolymer polyester (PETG) 400 2000 60Polyvinylchloride (PVC) 120 240 20Biaxially stretched polyester (PET) 62 310 17Barx (PAN) 12.4 17 78PVDC 1.6 4.7 1.6EVOH 0.4 1.3 60
water. If carbonation is critical due to product or market conditions then multi-layer or coated PET bottles may be considered essential, in these cases PET can bemarried with a material such as EVOH (copolymer of ethylene and vinyl alcohol).
PET bottles are now in use in countries where there is a returnable distributionsystem. The PET polymer is stronger and the bottles heavier so they can standup to multiple trips and repeated passage through a washer. The washer conditionsmust be carefully controlled with reduced alkalinity and temperature. Plastic is morelikely to absorb odours and contaminants than glass so special gas-chromatographic‘sniffers’ are installed on the line to check all bottles before they are refilled.

Steen: “chap07” — 2006/4/28 — 13:25 — page 200 — #20
200 CARBONATED SOFT DRINKS
The lightness and unbreakability of plastic is a major advantage over glass,be that returnable or non-returnable PET bottle; for example a 2 l non-returnablePET weighs 43 g and a returnable version, which would be expected to survive5–10 trips, weighs about 100 g.
7.3.8 Recycling methods
Used PET, from post-consumer waste, the preform, bottle blowing manufacturingprocesses or the bottling operation can now be incorporated into new bottles afterprocessing by one of several schemes available today. Unused PET from the preformmanufacturing processes can be re-granulated and incorporated up to about 20%, bythe injection moulder into new preforms. However, reprocessing reduces its strengthand not much more than 20% can be recycled. Process control is thus critical.
Where post-consumer PET waste is involved it can be broken down back toits constituent chemical parts, terephthalic acid and ethylene glycol, which can bere-polymerised. So as a bottler thinking of using recycled material it is important toconsider the potential sources of the recyclate to be used and testing against targetproducts and filling operation is a critical element of any approval process.
7.4 Closures for carbonated soft drinks
7.4.1 Introduction
Cork has been used for closing containers since antiquity, the cork bung being thefirst closure used for carbonated soft drinks. The Romans certainly used it as it camefrom their provinces in Spain and North Africa. Its flexibility was ideal for sealingthe irregular openings of the handmade vessels of the time. By forcing cork into thebottle neck they achieved a reasonable fit and used pitch to affect an airtight seal. Themost famous and enduring use of the tied on cork was started by Perignon who, in the1660s, discovered how to make champagne. His method of containing the pressurewas to use strong bottles and tied on corks, then a novelty on the European continent.
The package was ready for the advent of the highly carbonated artificial mineralwaters when Jacob Schweppe started business in Bristol around 1794. Handmadebottles (see Section 7.2 on glass) had wide-ranging dimensions of the finish so theflexibility of the cork to adapt to these variations in size and shape was essential.Egg-shaped bottles, introduced in 1814 by William Hamilton, had to be stored ontheir side ensuring that the liquid stayed in contact with the cork and prevented itfrom drying out and shrinking. The corks were applied by hand; when the bottle wassufficiently full the bottler drove in the cork with a mallet and passed the bottle onto a wiring stand where the wire would be attached. The bottles had a ‘string ring’incorporated into the neck. An experienced man could turn out 150 dozen bottles aday. Hand corking continued into the twentieth century although machines had beeninvented which filled the bottle, applied and hammered home the cork which were
Steen: “chap07” — 2006/4/28 — 13:25 — page 201 — #21
BOTTLE DESIGN AND MANUFACTURE AND RELATED PACKAGING 201
then delivered ready for wiring by hand. It was equally difficult for the customer toremove the cork with the preliminary process of untying the wire. The drinks werecalled ‘pop’ because ‘pop goes the cork when it is drawn’.
Something less tedious had to be invented and many ingenious ideas were putforward like the ‘Lightening’ beer stopper still used by Grolsch and others. Asmentioned previously in 1875, Hiram Codd invented a bottle with a marble stopperin the neck and filled it with ‘Coddswallop’ and this survived, much modified,until about 1930. It was left to William Painter in Baltimore to invent the universalsuccessor to the cork. Internal stoppers had serious drawbacks, they were difficultto clean, harboured bacteria, the costs were high and they could not be consideredreliable by today’s standards. What was needed was something cheap, quick to applyand remove and above all, reliably gas tight. Painter hit upon a top seal, a metalcap containing a compressible packing material with a corrugated flange to crimpon to the bottle neck. Painter envisioned a powerful downward force compressingthe packing when applying the closure to form a seal. The corrugations in the tinplate would adapt to the outside of the finish and lock the closure into position.He tried various materials to line the closure including a composite like linoleumbut eventually settled on cork for its flexibility and sealing power. Painter patentedhis invention and called it the ‘Crown Cork’ because it ‘gives a crowning andbeautiful effect to the bottle’. He also had a machine to fit the closures, hand fed,foot powered, and one at a time crowner. He had tools and gauges to supply to thebottle manufacturers so they could produce the correct contours to the bottle finish.In time Painter produced a steam powered multi-head rotary capping machine withautomatic feed. For automated high speed capping to be fully effective, a machinewas needed to eliminate the handmade bottles and turn out bottles with the sameuniformity as the closures. The invention to match Painter’s crown was made byMichael Owens who, in 1903, produced a fully automatic machine for mouldingbottles, which were all the same size, weight and capacity. Today, Owens’ blow-moulded glass bottle and Painter’s crown closure are still amongst the most popularpackages for carbonated soft drinks and beers in the world.
7.4.2 Headspace pressure
In a carbonated soft drinks bottle the gas in the headspace is under pressure, thedegree being dependent on the carbonation of the product and its temperature. Thispressure must be reduced to ambient atmosphere pressure before the threads of theclosure are released from the bottle. If this is not achieved; there is the possibility thatthe closure could fly off and cause injury. The bottler’s ideal is to use closures thatform a seal with the bottle and a closure that can be removed by hand without theneed for any implement yet replaced and resealed when only the bottle has beenpartly used. The PCO PET bottle neck finish with vent slots and the plastic closurewith its interrupted threads come close to the ideal in terms of venting performanceto release the gas contained in a bottle’s headspace and effect sealing despite beingopened on numerous occasions.

Steen: “chap07” — 2006/4/28 — 13:25 — page 202 — #22
202 CARBONATED SOFT DRINKS
7.4.3 Roll on metal closures
If a bottle is intended to be multi-serving or offers consumer convenience in theform of a degree of resealabilty, then a simple, hygienic closure is required whichcan be resealed. This will allow a portion of the bottle contents to be poured outthen resealed to keep the remainder of the contents in good condition and retainthe carbonation. A screw closure, which was commercially competitive with thecrown cork, was the rust proof aluminium roll on closure.
This closure is delivered to the top of the bottle without a formed thread, toppressure is applied to deform the closure liner to exactly match the bottle finishand thus form a complete seal. Rollers then encircle the closure, pressing the pliantaluminium into the grooves of the screw thread of the bottle neck finish. The result isa closure that is formed exactly to the dimensions of the bottle on which it has beenplaced. There is no need for careful matching of the dimensions of the screw threadof the bottle finish and the closure as each closure’s thread is purpose made for thebottle on which it has been applied. The closure can be used to reseal the bottle for aconsiderable number of times, although chipped glass on the finish will scratch thelacquer from the closure eventually. This convenience gave rise to a new problem,there was no way of telling whether the closure had been taken off and the originalcontents removed or contaminated. Today’s version of the closure has been modifiedto incorporate an extra band on the bottom of the closure skirt, which is attached tothe main body of the closure by a number of thin bridges. Extra rollers are needed onthe capping heads and these tuck the tamper evident band under a new feature at thebottom of the bottle finish, the tamper evident ring. Aluminium closure formationis shown in Plate 7.1. When the closure is first opened, the bridges break and theband falls away from the main body of the closure. Typically for non-returnablebottles the tamper-evident ring remains on the bottleneck and clearly indicates thatthe closure has been removed. Although alternative designs are available wherethe tamper-evident band has splits which open out as the bridges are broken, thedownside of this type of design is reduced effectiveness of the tamper evidence.
The adaptability of the roll on closure means that it can be used for a varietyof bottle finishes. The 28 mm diameter closure is by far the most common butalternatives such as 38 or 43 mm diameters exist for certain products. When PETbottles were initially introduced aluminium closures were used. These had limita-tions; most notably was they were more difficult for the consumer to remove fromthe bottle as the aluminium was often drawn into the vents within the neck finishdesign due to poor capper set-up.
7.4.4 Plastic closures
If a closure could be made with the threads already formed to the same closetolerances achieved on the bottle finish, then it could be applied to the bottle and forma good seal in a simple manner. The closures, which fulfilled these requirements,are made of a rigid plastic, which can be either polypropylene or high density
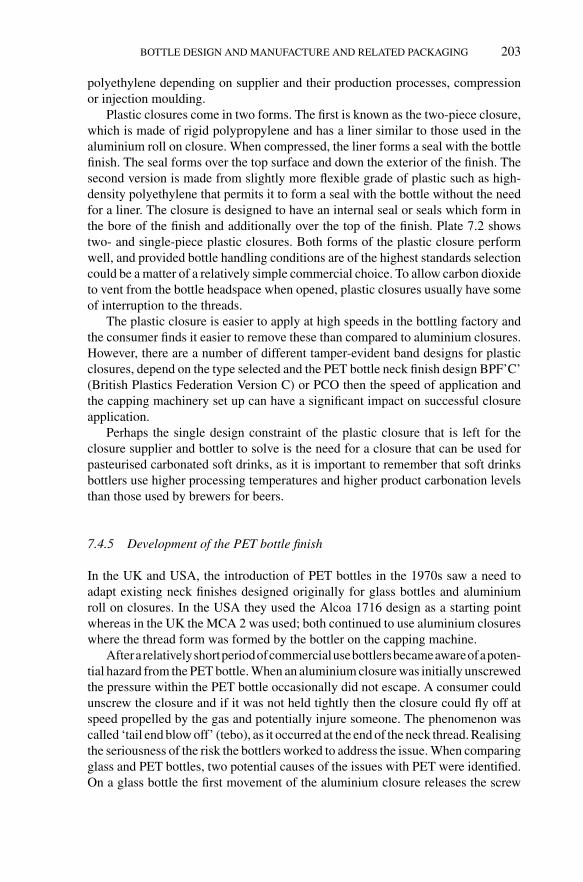
Steen: “chap07” — 2006/4/28 — 13:25 — page 203 — #23
BOTTLE DESIGN AND MANUFACTURE AND RELATED PACKAGING 203
polyethylene depending on supplier and their production processes, compressionor injection moulding.
Plastic closures come in two forms. The first is known as the two-piece closure,which is made of rigid polypropylene and has a liner similar to those used in thealuminium roll on closure. When compressed, the liner forms a seal with the bottlefinish. The seal forms over the top surface and down the exterior of the finish. Thesecond version is made from slightly more flexible grade of plastic such as high-density polyethylene that permits it to form a seal with the bottle without the needfor a liner. The closure is designed to have an internal seal or seals which form inthe bore of the finish and additionally over the top of the finish. Plate 7.2 showstwo- and single-piece plastic closures. Both forms of the plastic closure performwell, and provided bottle handling conditions are of the highest standards selectioncould be a matter of a relatively simple commercial choice. To allow carbon dioxideto vent from the bottle headspace when opened, plastic closures usually have someof interruption to the threads.
The plastic closure is easier to apply at high speeds in the bottling factory andthe consumer finds it easier to remove these than compared to aluminium closures.However, there are a number of different tamper-evident band designs for plasticclosures, depend on the type selected and the PET bottle neck finish design BPF’C’(British Plastics Federation Version C) or PCO then the speed of application andthe capping machinery set up can have a significant impact on successful closureapplication.
Perhaps the single design constraint of the plastic closure that is left for theclosure supplier and bottler to solve is the need for a closure that can be used forpasteurised carbonated soft drinks, as it is important to remember that soft drinksbottlers use higher processing temperatures and higher product carbonation levelsthan those used by brewers for beers.
7.4.5 Development of the PET bottle finish
In the UK and USA, the introduction of PET bottles in the 1970s saw a need toadapt existing neck finishes designed originally for glass bottles and aluminiumroll on closures. In the USA they used the Alcoa 1716 design as a starting pointwhereas in the UK the MCA 2 was used; both continued to use aluminium closureswhere the thread form was formed by the bottler on the capping machine.
Afterarelativelyshortperiodofcommercialusebottlersbecameawareofapoten-tial hazard from the PET bottle. When an aluminium closure was initially unscrewedthe pressure within the PET bottle occasionally did not escape. A consumer couldunscrew the closure and if it was not held tightly then the closure could fly off atspeed propelled by the gas and potentially injure someone. The phenomenon wascalled ‘tail end blow off’ (tebo), as it occurred at the end of the neck thread. Realisingthe seriousness of the risk the bottlers worked to address the issue. When comparingglass and PET bottles, two potential causes of the issues with PET were identified.On a glass bottle the first movement of the aluminium closure releases the screw

Steen: “chap07” — 2006/4/28 — 13:25 — page 204 — #24
204 CARBONATED SOFT DRINKS
threads and allows it to rotate freely. Whilst being removed gas from the headspaceis released by flowing over the threads. However, for PET the first issue was the factthat the volume of gas to be released was greater due to the larger sizes being used(1.5 up to 3 l compared to a typical 1 l on glass). The second issue was the accuracywith which the injection-moulded neck finish was being made, it was acutely round,whereas glass was more likely to have some degree of ovality, this eccentricity andimprecision meant wider spaces to allow gas to escape.
In 1982, vents slots were first introduced into the PET finish to allow theheadspace gas to escape as soon as the consumer started to release the closurewhile it was still engaged on the bottle finish, this was considered a necessarysafety mechanism. However, the use of aluminium closures restricted the width ofthe vent slot, so preventing material going in the slot, making it difficult for theconsumer to remove the closure on opening due to the crystallised syrup. By 1984,following information from the USA on finish performance, bottlers and packagingsuppliers working through the BPF (British Plastics Federation) developed a finishwith improved venting performance by making three improvements. These wereextending the length of the vent slot through the total height of the finish, increasingthe slot depth slightly into the body of the finish and finally increasing the threadlength by a quarter turn by use of a flat top at the start of thread thus preventing anyinterference with the seal surface. This final change made it increasingly impossi-ble for the consumer to remove the closure in one single motion, thus it had to bereleased and then gripped again, hence allowing extra time for the gas to escape.The neck design became known as the BPF’C’ finish, as it was suitable for bothplastic and aluminium closures and is still in relatively common use today.
By the start of the 1990s plastic closures, be they single- or two-piece designs,on PET bottles had in the main replaced aluminium roll on closures. This gaveinterested parties the opportunity to review all the aspects of the existing finishes,integrating the best elements of each into a design that became known as the PCO(plastic closure only) neck finish. The work was coordinated by the InternationalSociety of Beverage Technologists (ISBT). The most common version in use todayfor carbonated soft drinks PET bottles is the 1810 version. When compared to theBPF’C’ finish it is 1.8 mm shorter, the height between the neck support ring andtamper-evident bead being reduced as there was no longer a need for clearance toallow the capping machine forming rollers to push the aluminium into this partof the thread to form the tamper evidence. This offers improved effectiveness ofthe plastic closures tamper-evident band from interference. The vent slots for thePCO finish were widened and shaped like valleys rather than at right angles, alsothe slots were deepened to the same depth as the thread. Both these changes offerfurther improvements in venting performance as the consumer releases the closureon opening, thus increasing the degree of safety. Furthermore, length of the overallthread has been increased from the BPF’C’ design meaning it takes the consumerlonger to remove the closure. The neck support ring was optimised in size andother aspects altered to ensure that the finish was not suitable for aluminium. Anunplanned advantage of these changes was a reduction in weight of at least 1 g forthe neck finish itself.

Steen: “chap07” — 2006/4/28 — 13:25 — page 205 — #25
BOTTLE DESIGN AND MANUFACTURE AND RELATED PACKAGING 205
Detailed specification drawings of the latest versions of the BPF’C’ and PCOPET neck finishes are freely available on the internet on the ISBT website atwww.threadspecs.com.
7.4.6 Crown corks (pry off/twist off)
For small bottles, typically up to 330 ml in size crown corks still offer an attractivecommercial solution for single serve products and they may be applied on bottlinglines at high speeds of over 1000 bpm. Known as ‘Pry Off’, they require a toolto remove the crown. Crown corks are typically made in three stages, the metalsheets are printed and lacquered on both sides, the sheets are then stamped intocrown shells and finally lined, before being packed for shipment. Originally thecrown shell was lined with cork; this was replaced in the 1960s with a foamedplastisol liner, which since the 1990s has gradually been replaced with a mouldedplastic liner. Today a range of plastic lining materials are offered to cater for avariety of needs and therefore can be made with the requirements of the productand processing conditions with increasing accuracy thus offering improved shelf-life benefits when compared with its predecessors. The alternative to the Pry Offversion is known as the ‘Twist Off’ crown, but it is rarely seen in the UK. Asthe name suggests it can be opened by hand. It uses a different neck finish on thebottle which is more prone to damage and application control is closer to closureapplication than crowning. This design is widely used in the USA and to a limiteddegree in Europe, but in the UK it is highly likely that the consumer would still usean opener to remove the crown which increases the risk of the glass finish beingdamaged; not ideal when drinking of the product direct from the bottle has recentlybecome more commonplace.
Generally there are two major drawbacks for crown corks. Firstly it needs a toolto remove it, secondly it can only be used once although this is not a major disad-vantage for single serve sizes of bottles. Some bottlers may consider it necessaryto have an additional feature such as a tamper-evident label as part of the packagewhich incurs extra expense to the overall package.
Discussions on the compatibility of the glass bottle crown finish and crownliner designs continue today as experts from interested parties review the interac-tion of the two variables whilst being applied at increasing bottling speeds. SinceAugust 2005 the agent used to create the foam liner effect in one of the crown lineroptions has changed. However most bottlers now use non-foamed moulded linermaterials, so this change has little impact. This has proved more challenging for softdrinks bottlers particularly for products requiring pasteurisation as typically theyuse higher processing temperatures than beer bottlers.
7.4.7 Other closures (vacuum lug/rip off)
Other closure designs, such as vacuum lug or rip off, do exist but their potentialfor use with carbonated soft drinks are limited, although they could be considered

Steen: “chap07” — 2006/4/28 — 13:25 — page 206 — #26
206 CARBONATED SOFT DRINKS
depending on product and processing characteristics. Typically, vacuum lug clo-sures are wider in diameter than often found on soft drinks bottles and are commonlyused on jam and baby food glass bottles. As their name suggests they are in principledesigned to hold a vacuum, as the type of product on which they are used are filledhot then cooled. Rip off closures are similar in terms of what they are designed todo, namely hold a vacuum but rather than being unscrewed in order to remove thema tab is pulled (ripped) across the top of the closure, thus it can be used to reseal abottle. It can also leave sharp edges which gives bottlers concerns of exposing theconsumer to the risk of cutting themselves during the opening process.
7.5 Cans and ends
7.5.1 Introduction
Cans were originally designed for food preservation rather than soft drinks andwere the result of a competition in 1810 for which Napoleon offered a prize todevelop a package for that purpose. Initial package ideas were corked glass. Hand-made ‘canisters’ made from tinplate followed shortly afterwards and the name wasshortened to ‘cans’. Cans used before 1900 were manually produced in three parts,a cylindrical body and two ends and joins were made and sealed by dipping the partsin hot solder. The food was filled through a hole in one end, then a small plate wassoldered over the opening. At the start of the 1900s a manufacturing process wasdeveloped that saw the introduction of the three piece can and with its introductioncame the double seam, which is still in use now.
Today soft drinks cans are made in two pieces and use the ‘drawn and wallironed’ process, which has seen continued development since the 1960s. Theycome in three traditional sizes in the UK, 330 ml, 250 ml (used mainly for energyand premium value drinks) and 150 ml used on aircraft.
Can diameters are to this day still quoted in imperial units, for example the330 ml can has a body diameter known as 209, which stands for 2 and 9/16 in.,65.09 mm in metric. The current end diameter is known as 202 (2 and 2/16′′), thishas been reduced over the last 15 years as part of lightweighting exercises from209 via 206, this latter diameter is still in use with beer canners. In the UK todaycans are made in both steel and aluminium, however all ends are aluminium.
7.5.2 The can making process
7.5.2.1 Front-end processesThe can maker takes incoming material in coil format which is rotated through 90◦,lubricated and fed into a cupping press in a strip form. The blank and draw pressproduces cups which are wider in diameter and the shallow wall is thicker thanthe final can itself. The cans are discharged and accumulated, whilst the remainingscrap material is taken for collection for recycling.

Steen: “chap07” — 2006/4/28 — 13:25 — page 207 — #27
BOTTLE DESIGN AND MANUFACTURE AND RELATED PACKAGING 207
Cups are passed into the wall ironer, more commonly known as the bodymaker;the process at this stage determines the basic characteristics of the finished canstructure. The cup is carried on a punch and forced through the redraw, then thefirst, second and third ironing rings, which reduce cup diameters and thin the bodywalls to their final specifications. At the end of the stage the can base, known as thedome, is formed. On exit from the wall ironer, the can will have a rough top edgeas a result of the forming process; this is then trimmed to the required final heightand given an accurate cut edge.
The cans are then washed to remove all the lubricants that are added duringthe cupping and wall-ironing processes, the final washing stages also prepare theexternal can surface to take the required decorations for the brand and product.
7.5.2.2 Decoration processesDried bright cans from the washer are ready for decoration, this typically is a two-stage process, first a base coat is applied, this can be a white, clear or colour-tintedbase coat. Cans are placed on free spinning mandrels and come into contact withthe blanket cylinder on which blankets carry the required film thickness of basecoat, each can receiving between two and five wraps of basecoat to ensure an evencoating. The cans then pass through an oven on a pin chain which fully curesthe coating.
Once the can has a cured basecoat it passes on to the decorator, which appliesthe final graphics design; typically this will be in up to six colours although eightis now becoming possible. The decorator will have separate ink stations for eachcolour. The ink for each colour is applied in turn on to a latex blanket until allthe colours are assembled. At this stage the basecoated can is introduced to thedecorator on a mandrel, and during one rotation the can comes into contact withthe blanket and full decoration is transferred from the blanket onto the can surface.The decorated can then enters a second pin oven to cure the inks.
7.5.2.3 Back-end processesThe decorated can now has to pass through a series of finishing processes before itcan be shipped to the bottler for filling. In the first of these processes the cans receivean internal coatings applied by a lacquer spray machine, these coatings are waterbased, and after spraying the coating is cured in an internal bake oven. All cans atthis stage are tested to ensure full internal coverage of the base material, any failuresbeing automatically rejected. The final forming stage for the can is to form the neckprofile and the can’s flange so that it can accept the end after filling. There aredifferent processes for forming the neck profile dependent on the can supplier, butin the UK the final stage results in a spun neck to give a smooth profile. The finalcan, now fully formed, passes through a light tester to look for pinholes in thesidewalls or damage to the flange, so that all defects are rejected. Thus every canfrom the process is individually inspected. Cans are then palletised for shipment tothe soft drinks filling plant; this can be via truck or a ‘hole in the wall’ operation.

Steen: “chap07” — 2006/4/28 — 13:25 — page 208 — #28
208 CARBONATED SOFT DRINKS
7.5.3 Graphics decoration
When considering designs for can decoration it is important to consider the shapeof the can itself including the size of fonts for critical/legal text and the potentialdistortion of the design in the neck after the diameter has been reduced and shaped.It is important to consult the can supplier for any new design as they will be ableto provide guidelines for design layout for each can size.
7.5.4 Ends
The can end is made of aluminium. A shell is formed from coil, the curl is thenformed to match the can flange and allow the packer, after filling, to bring can andend together to form the double seam.
A tab is formed from a separate coil and introduced to the shell and a rivetformed to join the two together.
A compound is then applied into the side area of the curl. When the double seamis formed by the packer a hermetic seal, and hence product integrity, is ensured.
7.5.5 The double seam
The seal is formed by the soft drinks bottler after the can has been filled on theproduction line and an end applied within a seamer. Once in place, a two-stageoperation takes place to form the seam. In the first stage the can flange and endcurl are loosely wrapped around each other, in the second stage of the opera-tion the two elements are rolled closely together to ensure that the compound issqueezed tightly over the exposed edges to ensure an adequate seal as shown inFigure 7.10.
7.5.6 Can end stress corrosion
As has been mentioned the can end is made from aluminium and under normalconditions will give no cause for concern. However under certain conditions offilling and warehousing there is a risk of external corrosion of the end around theopening. If this does not occur then the end may open and product spoilage and/orleakage may occur. This type of failure is commonly known as stress corrosion andtypically occurs when cans are packed in shrink-wrap film in storage or as a resultof poor drying of the cans during production to remove any trace of water fromthe end which may have built up to rinsing etc. following filling and seaming. Therisk increases significantly with rises in storage temperature and humidity and itcan occur in a days or equally it can take several months. One potential indicatorof the risk is that the tab on the end will show visible staining. It is an importantconsideration for the bottle as it can result in loss of stock.

Steen: “chap07” — 2006/4/28 — 13:25 — page 209 — #29
BOTTLE DESIGN AND MANUFACTURE AND RELATED PACKAGING 209
CAN END
CAN BODY
Figure 7.10 Can and end double seam (courtesy of Ball Packaging).
7.6 Labels and labelling
7.6.1 Introduction
Traditionally soft drinks bottlers have used paper to label and brand their prod-ucts. Whilst it is still the largest single material substrate used for this purpose,other materials have become available to use in addition to paper. In this sectionsome of those options and the formats in which they are used and applied will beconsidered.
A label or sleeve will provide the required legislative information in additionto the primary requirement of marketing the product. Many different types of con-tainer decoration now exist, including paper and plastic labels that can be appliedto a container as wraparound or patch, sleeves and neck foils. On modern softdrinks filling lines labels and sleeves are normally applied at relatively high speeds.Due to the very nature of a label or sleeve the interaction between the substrateof the label, the container, the adhesive and the application machine is critical.Sleeves are often applied to the empty bottle by the manufacturer; however, somebottlers are starting to do this operation in house. In certain cases bottles are alsosupplied pre-labelled. These include pressure sensitive labels (PSLs), for specificpurposes such as promotional packs, normally requiring short production runs.A bottler may consider changing the labelling format, that is, it may be possi-ble to apply a shrink sleeve to a bottle that would normally have a PSL, for apromotion.
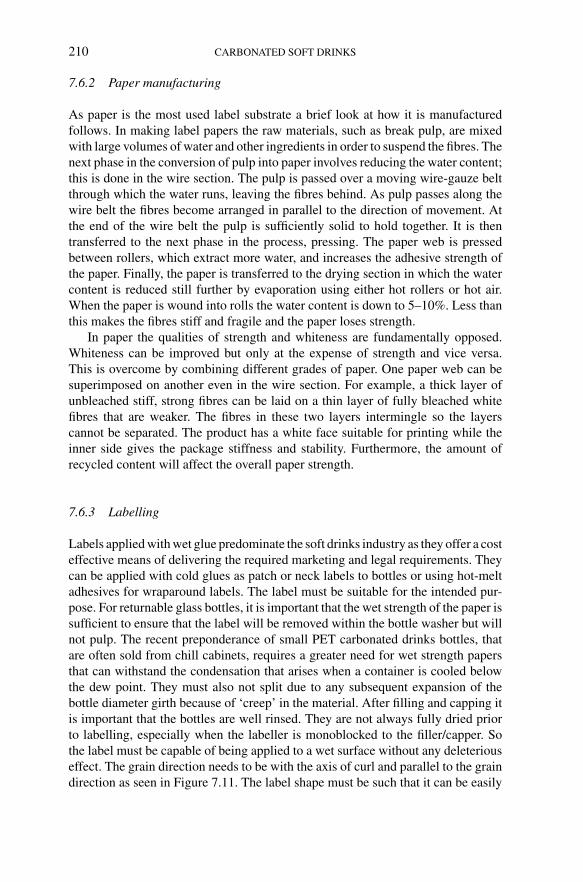
Steen: “chap07” — 2006/4/28 — 13:25 — page 210 — #30
210 CARBONATED SOFT DRINKS
7.6.2 Paper manufacturing
As paper is the most used label substrate a brief look at how it is manufacturedfollows. In making label papers the raw materials, such as break pulp, are mixedwith large volumes of water and other ingredients in order to suspend the fibres. Thenext phase in the conversion of pulp into paper involves reducing the water content;this is done in the wire section. The pulp is passed over a moving wire-gauze beltthrough which the water runs, leaving the fibres behind. As pulp passes along thewire belt the fibres become arranged in parallel to the direction of movement. Atthe end of the wire belt the pulp is sufficiently solid to hold together. It is thentransferred to the next phase in the process, pressing. The paper web is pressedbetween rollers, which extract more water, and increases the adhesive strength ofthe paper. Finally, the paper is transferred to the drying section in which the watercontent is reduced still further by evaporation using either hot rollers or hot air.When the paper is wound into rolls the water content is down to 5–10%. Less thanthis makes the fibres stiff and fragile and the paper loses strength.
In paper the qualities of strength and whiteness are fundamentally opposed.Whiteness can be improved but only at the expense of strength and vice versa.This is overcome by combining different grades of paper. One paper web can besuperimposed on another even in the wire section. For example, a thick layer ofunbleached stiff, strong fibres can be laid on a thin layer of fully bleached whitefibres that are weaker. The fibres in these two layers intermingle so the layerscannot be separated. The product has a white face suitable for printing while theinner side gives the package stiffness and stability. Furthermore, the amount ofrecycled content will affect the overall paper strength.
7.6.3 Labelling
Labels applied with wet glue predominate the soft drinks industry as they offer a costeffective means of delivering the required marketing and legal requirements. Theycan be applied with cold glues as patch or neck labels to bottles or using hot-meltadhesives for wraparound labels. The label must be suitable for the intended pur-pose. For returnable glass bottles, it is important that the wet strength of the paper issufficient to ensure that the label will be removed within the bottle washer but willnot pulp. The recent preponderance of small PET carbonated drinks bottles, thatare often sold from chill cabinets, requires a greater need for wet strength papersthat can withstand the condensation that arises when a container is cooled belowthe dew point. They must also not split due to any subsequent expansion of thebottle diameter girth because of ‘creep’ in the material. After filling and capping itis important that the bottles are well rinsed. They are not always fully dried priorto labelling, especially when the labeller is monoblocked to the filler/capper. Sothe label must be capable of being applied to a wet surface without any deleteriouseffect. The grain direction needs to be with the axis of curl and parallel to the graindirection as seen in Figure 7.11. The label shape must be such that it can be easily

Steen: “chap07” — 2006/4/28 — 13:25 — page 211 — #31
BOTTLE DESIGN AND MANUFACTURE AND RELATED PACKAGING 211
Body labels Champagne typeshoulder labels
Neck-around labels
Shoulder labels
Grain directionabove: right
below: wrong
Figure 7.11 Label grain (courtesy of Krones UK Ltd).
Figure 7.12 Plastic labelling (courtesy of Krones UK Ltd).
formed to the bottle. Paper labels should only be applied to cylindrical, conical orrectangular surfaces. In general, plastic labels should be applied only to cylindricalsurfaces as seen in Figure 7.12.
The paper grammage, texture, permeability and printability all need to be definedand agreed with the supplier to match the line and supply chain requirements with

Steen: “chap07” — 2006/4/28 — 13:25 — page 212 — #32
212 CARBONATED SOFT DRINKS
regard to visual appearance. The type of varnish used on a label will affect itsapplication performance. The type of adhesive used also needs to match the system.
7.6.4 Patch labellers
These are normally indirect transfer machines where pre-cut labels are removedfrom the stationary label magazine by means of a controlled cold glue film appliedto the front surfaces of the glue segments (often referred to as glue pallets and mademainly of aluminium individually profiled to the size and shape of the label tobe handled). A new label shape will usually require new machine parts. Labelsare removed from the pallets by a mechanical gripper cylinder that transfers themto the containers on the main carousel. Patch labelling is shown in Figure 7.13. Asystem of brushes and sponge rollers then smooth the label onto the bottle. Labellerscan be in-line or rotary, though rotary machines are preferable due to the positiveclamping of the bottle allowing the bottle and label to be in control at all times. Theglue handling system allows starch, casein based adhesives or a growing numberof synthetic polymers to be applied precisely in a controlled manner to the gluepallets. The glue is continually recirculated to minimise mechanical ‘stressing’,
Label magazine containingprecut labels
Glue segments
Glue roller
Mechanicalgrippercylinders
Bottle
Brushes
Figure 7.13 Patch labelling (courtesy of Krones UK Ltd).

Steen: “chap07” — 2006/4/28 — 13:25 — page 213 — #33
BOTTLE DESIGN AND MANUFACTURE AND RELATED PACKAGING 213
which can give rise to poor adhesive properties. Glue thickness control on the glueapplication roller is crucial. To maximise the effectiveness of the gluing operationthe glue pallets are made with many small horizontal grooves to allow many smallcontact points to be formed to aid the gluing of the label to the bottle. Both bodyand neck labels can be applied at high speeds of up to 80,000 bottles/h in this way.Modern label magazines tend to be powered allowing far more labels to be heldat a time. The most commonly used glues are casein based due to their ability tolabel cold, wet glass whilst at the same time minimising glue usage especially whenheld at a temperature of 26–30◦C. For this purpose a heater is often incorporatedin the glue supply system. Good consistent control over the thickness of the glueas applied is critical to good labelling.
7.6.5 Wraparound labellers
These labellers directly transfer the label from the magazine to the container. Awraparound labeller is shown in Figure 7.14. The magazine contains a stack oflabels whilst two gluing stations are used. The first station applies a controlledamount of glue to the container in a narrow vertical strip. It is to this glue strip thata label is ‘pulled’ from the label magazine onto the bottle. A second glue stationapplies another vertical strip of glue to the trailing edge of the label by a smalldiameter glue roller. As the bottles are continually rotating at a controlled speedduring this process the labels flow on to the container and are brushed on to form afull wrap around the container. The width of the glue strips, in total, cover less than10% of the label area. The adhesives used are normally hot melt, as a fast bond onto the container is required due to the nature of the application of the label. Theopen time of cold glues is too long for this in normal practice. Great care has tobe taken to ensure that the correct glue is used for the purpose. With modern PETcarbonated drinks bottles the bottle creep due to the pressure within the bottle isa direct function of the initial carbonation volumes and the temperature range towhich the container is subjected. The problem with bottle creep is that the labelpanel on the bottle will expand often causing either the paper label to rip or atworst become detached from the bottle. This can be overcome by using so-calledpressure-sensitive adhesives which allow a degree of slip. When the bottle creeps,the label will slip on the glue. Whilst this leaves the label still attached to the bottleit does give rise to an unsightly and tacky glue surface. These labels cannot be usedfor returnable bottles as the glue is not water soluble.
Reel-fed labellers are becoming the norm, particularly for PET bottles. Thesemachines generally use plastic labels though paper labels can also be supplied onthe reel. The advantage of reel-fed machines is the large number of labels on the reelthat in theory will require less operator interfacing with the machine, for examplea twin station machine running a 2 l bottle could hold up to 36,000 labels, enoughfor 2 h production at typical line speeds. The graphics available on plastic labels dotend to be better than those available with paper labels though the use of modernvarnishes and metallic surfaces have narrowed the gap. Plastic labels do have some

Steen: “chap07” — 2006/4/28 — 13:25 — page 214 — #34
214 CARBONATED SOFT DRINKS
Label magazine
Glue station 2
Glue station 1
(a)
(b)
Figure 7.14 Wraparound labelling (courtesy of Krones UK Ltd).
elasticity built into them which go part way to overcoming the bottle creep problem.However, they can have higher label origination costs than paper labels dependingon the printing process selected and are thus best suited to long-run products. Somelabel suppliers are now providing cut plastic labels for conventional wraparoundlabellers. This process is still in its infancy but must be considered as a specialist
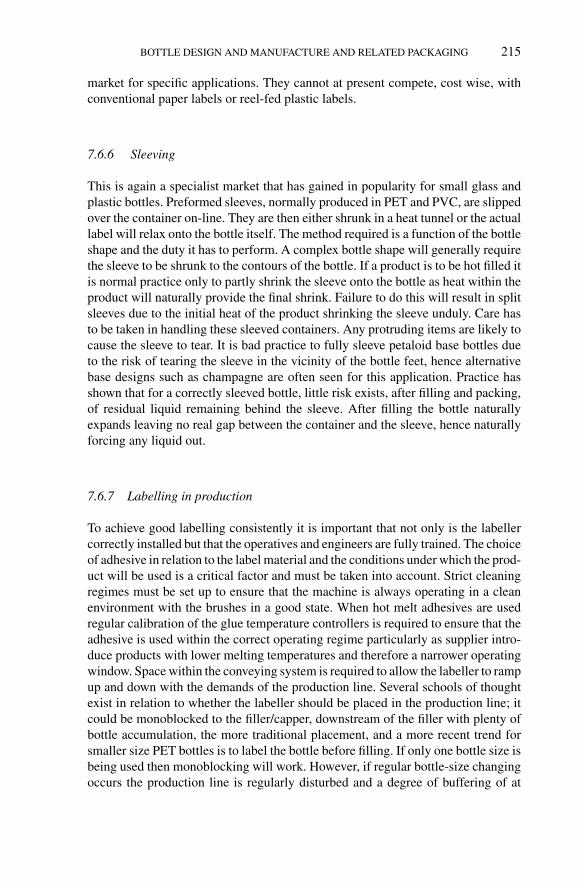
Steen: “chap07” — 2006/4/28 — 13:25 — page 215 — #35
BOTTLE DESIGN AND MANUFACTURE AND RELATED PACKAGING 215
market for specific applications. They cannot at present compete, cost wise, withconventional paper labels or reel-fed plastic labels.
7.6.6 Sleeving
This is again a specialist market that has gained in popularity for small glass andplastic bottles. Preformed sleeves, normally produced in PET and PVC, are slippedover the container on-line. They are then either shrunk in a heat tunnel or the actuallabel will relax onto the bottle itself. The method required is a function of the bottleshape and the duty it has to perform. A complex bottle shape will generally requirethe sleeve to be shrunk to the contours of the bottle. If a product is to be hot filled itis normal practice only to partly shrink the sleeve onto the bottle as heat within theproduct will naturally provide the final shrink. Failure to do this will result in splitsleeves due to the initial heat of the product shrinking the sleeve unduly. Care hasto be taken in handling these sleeved containers. Any protruding items are likely tocause the sleeve to tear. It is bad practice to fully sleeve petaloid base bottles dueto the risk of tearing the sleeve in the vicinity of the bottle feet, hence alternativebase designs such as champagne are often seen for this application. Practice hasshown that for a correctly sleeved bottle, little risk exists, after filling and packing,of residual liquid remaining behind the sleeve. After filling the bottle naturallyexpands leaving no real gap between the container and the sleeve, hence naturallyforcing any liquid out.
7.6.7 Labelling in production
To achieve good labelling consistently it is important that not only is the labellercorrectly installed but that the operatives and engineers are fully trained. The choiceof adhesive in relation to the label material and the conditions under which the prod-uct will be used is a critical factor and must be taken into account. Strict cleaningregimes must be set up to ensure that the machine is always operating in a cleanenvironment with the brushes in a good state. When hot melt adhesives are usedregular calibration of the glue temperature controllers is required to ensure that theadhesive is used within the correct operating regime particularly as supplier intro-duce products with lower melting temperatures and therefore a narrower operatingwindow. Space within the conveying system is required to allow the labeller to rampup and down with the demands of the production line. Several schools of thoughtexist in relation to whether the labeller should be placed in the production line; itcould be monoblocked to the filler/capper, downstream of the filler with plenty ofbottle accumulation, the more traditional placement, and a more recent trend forsmaller size PET bottles is to label the bottle before filling. If only one bottle size isbeing used then monoblocking will work. However, if regular bottle-size changingoccurs the production line is regularly disturbed and a degree of buffering of at

Steen: “chap07” — 2006/4/28 — 13:25 — page 216 — #36
216 CARBONATED SOFT DRINKS
least 5 minutes between the filler/capper and the labeller or the blower for PET isrecommended.
7.6.8 Date coding (ink jet/laser)
There is in most countries a legal requirement to mark products with a ‘Best BeforeEnd’ date. A number of options exist from coding the bottle, the closure or labelon the production line to pre-printing the date on the label.
The common practice is to code on line, as it is more cost effective, this istypically done by machine that generates as a series of dots, and this can be done withink, although the current trend is to use lasers as it offers a more permanent code.
Within UK product labelling regulations the legal requirement is for the productname, contents volume and best before end instruction to be in the same field ofvision. Therefore, when on-line ink jet coding is used the best before end instructionis often worded as ‘See side of cap or neck of bottle’.
Most bottlers use a similar format for coding the bottle starting with the BestBefore End ‘month and year’ indication, followed by the production location iden-tification, the actual date of production in a close code format such as the Juliancode format, that is, 5032 = 1 February 2005, and finally the time of production.Correct date coding like so many aspects of bottling soft drinks is an important partof the production process as it offers full product traceability as and when required.
7.7 Future trends – putting it all together
It is often said that packaging will sell the product to the consumer only once, afterthat repeat purchase by the consumer will be dependent on whether the consumerlikes the product contained within the packaging itself.
However, if the packaging fails to give the consumer the functionality expectedthen no matter how good the product may be the consumer may choose an alternativebrand in similar or even a different packaging format.
It is important that product and packaging are considered together and notin isolation, ensuring that the packaging supplier is fully aware of the product,production and supply chain requirements; soft drinks for distribution and salewithin the UK are highly likely to have different requirements to those being sentfor export.
Documented and agreed specifications for each material are needed, and a reg-ular review with all parties involved should take place. Challenge to historical‘norms’ for a specification may be needed.
So what does the future hold for primary packaging? There will be continu-ing pressures to optimise package weights that may mean a degree of additionalcomplexity/number of material variants for soft drinks bottlers, for example onepreform weight may be used for a number of bottle sizes rather than an optimisedweight for each size. In the UK, we have seen increases in the use of colours for

Steen: “chap07” — 2006/4/28 — 13:25 — page 217 — #37
BOTTLE DESIGN AND MANUFACTURE AND RELATED PACKAGING 217
PET bottles, the introduction of new decoration processes to decorate glass bottles,these are trends which will continue, but need to be carefully considered due to theimpact on the materials ability to be recycled by the consumer after use.
Production line speeds will increase, thus meaning a reduction in the specifica-tion tolerance or production operating window for a packaging material.
Packaging is a dynamic, challenging and changing aspect that needs criticalconsideration as part of the soft drinks production process.
Further reading
Bakker, M. (1986) Encyclopaedia of Packaging Technology. John Wiley & Son, Inc, New York.Beverage Can Makers Europe (Spring 2004) Stress Corrosion – Technical Bulletin.Briston, J. (1983a) Plastics in Packaging Conversion Process. The Institute of Packaging.Briston, J. (1983b) Plastics in Packaging Properties and Applications. The Institute of Packaging.British Soft Drinks Association, Glass Bottle Quality Handling & Use.British Soft Drinks Association, Glass Bottle Quality Sampling & Evaluation.BS 7367 (1991a) Specification for Manufacture of Glass Bottles for Carbonated Soft Drinks Including
Carbonated Water.BS 7488 (1991b) Recommendations for Handling Glass Bottles Containing Carbonated Soft Drinks or
Carbonated Water in Filling Plants and Retailers’ Premises.Emhart Glass Zurich, Punt Marks. www.enhartglass.comISBT Stress Cracking Information. www.bevtech.orgISBT Thread Finishes. www.threadspecs.comKrones, Manual of Labelling Technology.Moody, B. (1977) Packaging in Glass. Hutchinson Benham, London.Paine, F.A. (1997) The Packaging Media. Blackie & Son Ltd., Glasgow.The Producer Responsibility Obligations (Packaging Waste) Regulations (1997) With Amendments.Tec 7 (1994) Strength and Performance Standards for the Manufacture and Use of Carbonated Beverage
Bottle.
Steen: “chap08” — 2006/4/27 — 18:31 — page 218 — #1
8 Secondary packaging considerationsDavid Rose
8.1 Introduction
Secondary packaging is often forgotten or only given scant attention in thedevelopment of new products or primary packs, with companies paying little atten-tion to level of packaging, which is often never seen by the ultimate consumer. Thesetransit or distribution packs are commonly referred to as traded units and, depend-ing on the nature of the primary pack, the complexity and type of the supply chain,these may take a range of formats. The aim of this chapter is to explain the growingimportance of secondary packaging and the increase in customer requirements ofpacks through the supply chain. A well-designed secondary pack, considered as partof the overall development process can significantly contribute to, or even make orbreak, a new launch or promotion. The best bottle or can in the world is of no useif the secondary packaging is not capable of getting it to a shop shelf in a conditionwhich is acceptable to a consumer. However, this position is beginning to changewith the increased use of self-contained display units in major supermarkets andprinted packs for Cash & Carry outlets.
The main function of secondary or collation packaging is to contain or collatea number of primary packs for distribution from the filler to the retailer and pointof sale. An individual primary pack may be distributed in a number of differentsecondary pack sizes or formats depending on the nature of the supply chain andthe retailer.
Although not required to protect a product from microbiological spoilage andgas retention to the same level as primary packaging, secondary packaging mustprotect the former from damage, label scuffing, contamination and theft. The mod-ern supply chain covers a wide variety of systems. It varies from efficient majormultiple chains, where rapid stock turnover will move a pack from initial deliveryto final sale in a few days, to sales via a Cash & Carry outlet, where stock may staywith the final retailer for several months. The conditions are also likely to vary sig-nificantly from clean, dry warehouses to damp, dirty storage sheds. Packs are likelyto be exposed to rain during loading/unloading of vehicles. The manual operationof load picking and assembly and delivery to the retail outlet will involve manualhandling with an inherent level of drops and single-handed pack movement.
As with primary packs, secondary packaging must also inform, but to a differentrecipient with different information. During the pick operation in a distributioncentre, it must inform the load assembler as to the contents, size, flavour etc. In the

Steen: “chap08” — 2006/4/27 — 18:31 — page 219 — #2
SECONDARY PACKAGING CONSIDERATIONS 219
modern supply chain, this does not just mean informing people, but it also includesthe bar codes used for picking in automated warehouses, some of which are 100%reliant on these codes for identification of packs on conveyor systems.
Again, just as in primary packs, secondary packaging must also sell but toa different customer. While not applicable to the major multiple, in Cash &Carry outlets it is the secondary pack that a retailer sees and that influencesthe decision to buy. It may be that the product is a new flavour or promotionalvariant, but without clear communication, this may be overlooked. Pack qualitycould also be considered part of the selling function. Poor secondary pack per-formance during previous visits, such as packs splitting when picked up, may bethe only difference between two competing products that affects the final decisionto buy.
8.2 Requirements of the supply chain
8.2.1 Overview
Before looking in more detail at the different supply chains, materials, packs andformats, the various sectors in the supply chain and their requirements will beconsidered. In Chapter 10 the supply chain in terms of production planning anddistribution rather than in the pure packaging context will also be examined.
While there is considerable overlap in the various distribution sectors, each alsohas its own particular requirements and emphasis on different functions. This differ-ence is sometimes significant and can lead to conflicts between requirements whichin turn can result in added complexity (different pack formats) or additional costs,for example, the graphics for Cash & Carry packs used on packs for major multiples.When developing secondary packaging, it is vital to understand these requirementsand conflicts. This can only be achieved by visiting a range of customers fromeach sector and then using this information and building these requirements whendeveloping packs.
The requirements of the manufacturer are to minimise complexity and reducecosts. This includes material reduction. Ideally, common materials should beused across a range of packs. Pack sizes and formats should minimise machinechangeovers. Pack dimensions and common palletisation patterns should be usedwherever possible. The packs need to comply with local labelling legislation andmust satisfy legal and ethical requirements. This includes, in the UK, the Packag-ing Waste Legislation and recoverability requirements as well as health and safetypack handling considerations. In this context, the weight of traded units needs tobe considered.
The brand owner needs to have the flexibility for ‘on pack’ information, whichcan either highlight consumer promotions for Cash & Carry outlets or retaileroffers. This flexibility drives volume and delivers consumer benefit without addi-tional cost as well as maximising shelf presence and allowing differentiation from

Steen: “chap08” — 2006/4/27 — 18:31 — page 220 — #3
220 CARBONATED SOFT DRINKS
competitors’ products. It is recognisable as part of the brand. For co-packed drinks,the manufacturer may not be the brand owner.
Distribution covers the whole supply chain. These requirements may not all beunder the same control as it covers the fillers’ distribution to the customers’ regionaldistribution centre (RDC) and then on to the individual store. Minimal inventoryis sought through reduced stock keeping units (SKUs), a traded unit by which aconsumer product and pack type is distributed to a retail outlet. Stable palletisedloads requiring no special handling are vital. With reduction in the distributionturnaround times, there is no time to correct unstable pallets. Packs must be capableof being distributed in stable part pallets and as packs in mixed loads as the finalstage of delivery is often a mixed load, either in a cage or on a pallet. Odd-shapedpacks and those that do not protect the unit will create difficulty. Robust casesappropriate for the level of manual handling will prevent pack damage. The loadpicking operation, which packs must survive, is also being reduced, with manypickers on bonuses for speed and accuracy.
As the retailer is often responsible for part of the distribution supply chain,some of the requirements around mixed loads are also requirements of the retailer.The traded unit size must suit actual shop facings. The display may vary from sixor eight (consumer) units in large multiple outlets through two or three units insmaller convenience stores to a single unit in an independent outlet. Easy openingand disposable materials are an important requirement. There is a continual drive formaterial minimisation and/or the use of a single material to reduce disposal volumes.Shelf ready units are required for key packs. Unpacking individual primary unitsand placing them on the display shelf is laborious, time consuming and in today’s24-h world intrusive to a customer. These packs are a development of the twopoints mentioned above, resulting in a quick operation to give rapid replenishmentof shelves. Packs need to be robust to protect the product.
Generally the ultimate consumer does not see the secondary packaging, but iswell aware of these issues if it fails in the supply chain. This is usually in the formof pack damage. However, the consumer does see display units and shelf readyunits (e.g. yoghurt, dry food sachets) in a store and this can influence his or herpurchase if removal of the individual unit is difficult or the secondary packagingjust looks poor. It is important that this packaging looks appealing and enablesbrand recognition. Another important factor is that packs must be easily removablefrom any secondary packaging. They may perceive the outer display as additionalcost or unnecessary, believing it to be excessive packaging that simply adds costwith no real consumer benefit and therefore may not make a purchase as a result.
The three primary supply chains are:
1. Major multiple, that is, supermarkets with their own (or contracted)distribution networks.
2. Cash & Carry, that is, trade/bulk outlets catering to an independent retailer(and some consumers).
3. Bulk break/multi-drop, that is, retailers’ own distribution depots and groupdistribution centres, for example, Golden West (McDonalds), Beer Seller.

Steen: “chap08” — 2006/4/27 — 18:31 — page 221 — #4
SECONDARY PACKAGING CONSIDERATIONS 221
While there is considerable overlap in many areas, each has its own particu-lar requirements. The first sector covers some 95% of the supply chain and itsrequirements generally include most of the key requirements.
8.2.2 Major multiple
8.2.2.1 Pallet receiptLarger retailers now use either fully or semi-automated systems, designed for speedof operation, many using automated gauging for acceptance of pallets. These sys-tems rely on pallets requiring no special handling and have an absolute requirementfor stable palletised loads and accurately measure pallet dimensions on receipt.Loads that are only millimetres over the limit are likely to be rejected. Some mul-tiples now have twice daily deliveries from suppliers, with only 48-h stock holdingin their distribution centres. With reduction in distribution turnaround times, thereis no time to correct unstable pallets.
8.2.2.2 Pallet breakdown and load pickingOnce in the picking area, a robust case appropriate for the level of manual handlingis an absolute requirement to prevent pack damage. To improve case throughput,the time available for the load picking operation is being reduced. Many pickersare on bonuses for speed and accuracy, operating on pre-planned routes with thepick rate/time on a bonus scheme, which in some cases can be substantial. In thesecircumstances, pack strength and handling performance are critical; if a pack failswhen picked, it is often just dumped. Shrink film bullseyes will be used as handlesdespite advice to the contrary; small packs will be picked single handedly or inmultiple lifts. Packs will be pulled and dragged across the top of others. As cagesor conveyors are generally close to the pick location (less than 1 m), it is likely thatsmaller packs will be thrown.
Following the pick operation, the packs must stack in a mixed delivery cage orpallet, without splitting/crushing. While the pick order may be controlled to somedegree, there is still no absolute control over the orientation of packs in the cages.Tall cases may often be laid on their sides if it helps the pack fit, and there is alsono absolute control of what may be stacked on top. In these circumstances, packstrength and handling performance are critical to performance and continued failurewill result in financial penalties or even in a product being de-listed.
8.2.2.3 Bar codesMany of the larger multiples now rely partly or even solely on bar codes for iden-tification and are demanding a minimum of 98% identification on first-time scans.Where the initial recognition is still manual, many then use the bar code to confirmthe identification. Continual failure may result in a product line being temporarilyde-listed, or a handling fee charged if a case bar code has to be entered manually.

Steen: “chap08” — 2006/4/27 — 18:31 — page 222 — #5
222 CARBONATED SOFT DRINKS
8.2.2.4 Store deliveryMore retailers are looking to simplify and speed up the shelf replenishment endof the supply chain. This is becoming the time critical area in the supply chainand with more stores opening for 24 h, needs to be done while the store is open.Many are actively looking for easy opening packs with the elimination of knives,scissors etc. by the use of tear strips or perforations. There is a continual drivefor material minimisation and/or the use of a single material to reduce disposalvolumes. Combining these two requirements has resulted in an increasing focuson shelf ready units for key packs, resulting in a quick operation to give rapidreplenishment of shelves.
Figure 8.1 shows an example of traditional multiple RDC, storage racks andpick area. These have storage racking, typically three or four pallet bays high, above
(a)
(b)
Figure 8.1 Traditional RDC. (a) Pick area and (b) storage racks (courtesy British Soft Drinks Assoc.).
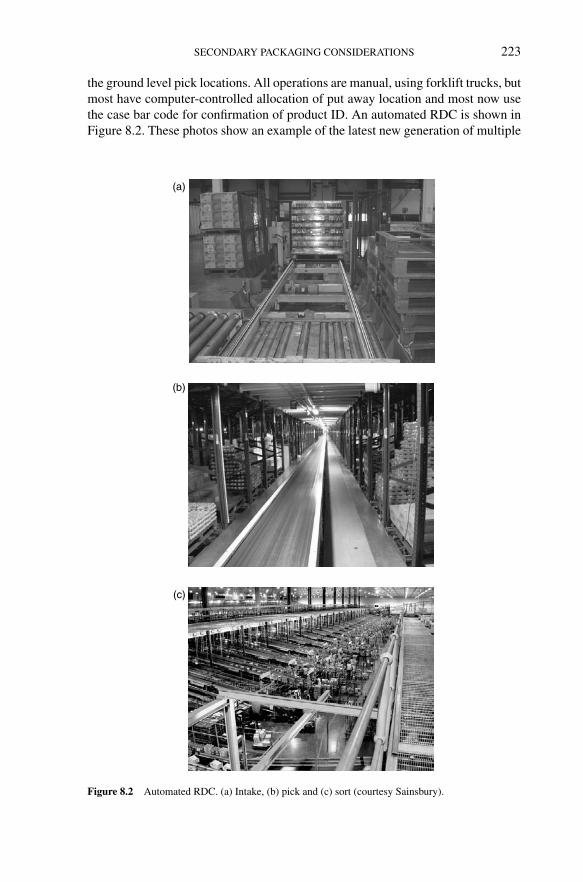
Steen: “chap08” — 2006/4/27 — 18:31 — page 223 — #6
SECONDARY PACKAGING CONSIDERATIONS 223
the ground level pick locations. All operations are manual, using forklift trucks, butmost have computer-controlled allocation of put away location and most now usethe case bar code for confirmation of product ID. An automated RDC is shown inFigure 8.2. These photos show an example of the latest new generation of multiple
(a)
(b)
(c)
Figure 8.2 Automated RDC. (a) Intake, (b) pick and (c) sort (courtesy Sainsbury).

Steen: “chap08” — 2006/4/27 — 18:31 — page 224 — #7
224 CARBONATED SOFT DRINKS
RDC at Sainsbury’s Hams Hall. These have fully automated pallet receipt and putaway into storage racking, up to ten pallets high, with a separate ground level picklocations. All operations rely fully on the pallet and case bar code for product IDand confirmation.
8.2.3 Cash & Carry
8.2.3.1 Pallet breakdown and load pickingWhile these outlets may not have the speed pressure and the absolute pallet dimen-sion requirements of a multiple RDC, they do have the same requirements for stablepallets. However, there are differences in the pallet breakdown operation in that it iscarried out by a greater variation of ‘untrained’ pickers, many of which are retailers.Customers often remove packs randomly, without the logical, pyramid un-stackingusually seen in the multiple RDC. There is also a degree of additional pack handling(pallet to trolley, trolley to trolley at the checkout, trolley to vehicle and vehicleto store).
8.2.3.2 Pack graphicsIn Cash & Carry, the case is the salesman to the retailer, much as the primary packis to the consumer. While this may not be to the same level, as the retailer willalso be considering the primary packs that his customers want – his profit margins,stock holding etc. – a good looking pack can make the difference. A well-presentedpack, maybe highlighting a promotional retail pack or a retailer-based promotion(e.g. two packs free), will influence a sale. A typical Cash & Carry is shown inFigure 8.3, demonstrating that a good display with attractive pack graphics willattract a customer’s attention.
8.2.3.3 Bar codesBar coding is also becoming more important, with many Cash & Carry outlets nowusing the bar codes for the checkout operations. They also require a minimum of98% first-time scans; repeated failures may result in a supplier being de-listed.
8.2.4 Bulk break
A bulk break warehouse has a similar pallet receipt requirement to a traditionalmultiple RDC. They do not have the higher level of automation but the requirementsfor standard, stable pallets remain the same. The main difference is in the pickoperation. While some may pick a mixed load for a single outlet, much as in amultiple RDC, many will pick for a delivery route, aggregating all the individualdeliveries into one pick operation. This will result in a number of mixed pallets,which will then be loaded onto a single vehicle. The driver will then ‘pick’ theindividual customer deliveries on arrival. This results in additional handling as
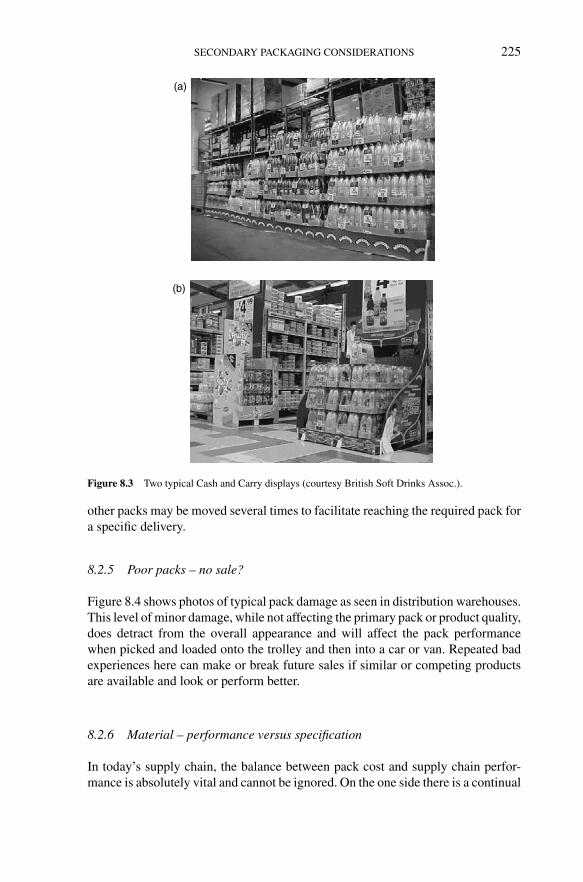
Steen: “chap08” — 2006/4/27 — 18:31 — page 225 — #8
SECONDARY PACKAGING CONSIDERATIONS 225
(a)
(b)
Figure 8.3 Two typical Cash and Carry displays (courtesy British Soft Drinks Assoc.).
other packs may be moved several times to facilitate reaching the required pack fora specific delivery.
8.2.5 Poor packs – no sale?
Figure 8.4 shows photos of typical pack damage as seen in distribution warehouses.This level of minor damage, while not affecting the primary pack or product quality,does detract from the overall appearance and will affect the pack performancewhen picked and loaded onto the trolley and then into a car or van. Repeated badexperiences here can make or break future sales if similar or competing productsare available and look or perform better.
8.2.6 Material – performance versus specification
In today’s supply chain, the balance between pack cost and supply chain perfor-mance is absolutely vital and cannot be ignored. On the one side there is a continual

Steen: “chap08” — 2006/4/27 — 18:31 — page 226 — #9
226 CARBONATED SOFT DRINKS
(a)
(b)
(c)
Figure 8.4 Poor packs – no sale. (a) Loose packs, (b) loose and split film and (c) broken trays (courtesyBritish Soft Drinks Assoc.).

Steen: “chap08” — 2006/4/27 — 18:31 — page 227 — #10
SECONDARY PACKAGING CONSIDERATIONS 227
drive for cost reduction and volume/disposal benefits, in addition to increasing pres-sure being applied as a result of the requirements of material reduction and wasteregulations. On the other side there are increasing performance requirements fromdistribution handling and throughput as well as increasing health and safety stan-dards. There is a balance between these two opposing forces, the optimum of overallpack cost versus supply chain loss. Inappropriate or excessive material reductionscan compromise the supply chain performance of secondary packs, a mistake oftenmade in the past where material performance on the production line was the onlyconsideration. The cost of the whole supply chain, from end of line to customershopping must be taken into consideration. Sometimes an increase in secondarypackaging, and thus cost, can reduce breakage and losses in distribution, resultingin an overall reduction in total cost. This area is becoming more important as thepressures for improved performance and cost reduction increase. Recent develop-ments in multi-layer (co-extruded) shrink wrap films giving improvements in filmperformance have allowed improvements in performance or a reduction in mate-rial usage with no loss of performance. These materials have now largely beenimplemented; further improvements in polymer technology or film production arerequired to enable further progress in this area. Other areas such as trade readyunits or merchandising units are also being developed to make further improve-ments. These demand of the retailers brings issues around the costs of improvedpackaging for increased supply chain performance and who bears them, whereassoft drinks bottlers are under continual financial pressure to reduce material costs.A greater degree of collaboration and co-operation among packaging material sup-pliers, soft drinks fillers and retailers will be required to jointly develop integratedsystems to benefit everyone. Some degree of standardisation (unit dimensions, per-formance standards) will also be required to enable a degree of commonality acrossthe various competitors and avoid unnecessary costs.
8.3 Pack styles
There are three main secondary packaging types used for carbonated soft drinks.Each has its benefits and is used for a variety of reasons.
8.3.1 Shrink wrap
This material is probably the most common pack used today considering cost, linespeed and pack performance. There are three sub-variants: (a) shrink wrap film andcorrugated tray, (b) shrink wrap film and corrugated pad and (c) shrink wrap filmon its own. Shrink wrap trays, pads or film-only packs are used where the primarypack has sufficient strength for load support and impact resistance and where lowcost is important. The choice between the three sub-types is often dictated by thecapability of the packing machine used.

Steen: “chap08” — 2006/4/27 — 18:31 — page 228 — #11
228 CARBONATED SOFT DRINKS
The more modern flow-wrapping packers are capable of running without anytray or pad, this ability being dictated by the bed/transfer system in the collationsection of the machine. Retro fitting this capability is often expensive, or not pos-sible, and so is generally not cost effective. Thus, the same pack made on differentlines sometimes varies in style.
Similarly, the tray style and depth will depend not only on the packing machinebut also on certain supply chain requirements. These include the need for readilyvisible print (product flavour/branding) on the tray, any best before coding or trace-ability details or where bar coding is printed on the tray (bar code minimum size)and the primary pack design, particularly around label height and visibility of thelabel graphics/image.
High-quality labels, or important product identifying graphics, are often hiddenby a generic or even a plain tray. This can make product selection difficult wherethe label (or product) colour differentiation is minimal. Therefore, it is vital toconsider the primary pack graphics or label design and height in conjunction withthe secondary packaging during the design process. Corrugated cases are still widelyused but usually where specific supply chain requirements exist such as where theprimary pack has limited strength (e.g. where low carbonation products are packedin HDPE bottles, pouch packs etc.). These primary packs require the use of heavierduty board so the case can provide the bulk of the strength/support required withinthe palletised load and subsequent pick and mixed load supply chains. Anotheruse is where the product can be considered a ‘premium product’, for example,energy drinks, squash and cordials. The brand image, price category etc. allowsuch packaging where a premium look is beneficial and the additional cost can becovered. These will use higher quality board (white) and print; varnishes may also beused to enhance further the appearance. Under certain conditions where the packsare in extended supply chains, with either additional handling or environmentalextremes, corrugated cases are often used. Export packs are often loose packed intocontainers or subject to repeated manual handling. The corrugated board can also actas a buffer to environmental variation and extremes of temperature and humidity.Such packs may also include the use of internal dividers to further separate andprotect the primary packs, especially if additional manual handling is experiencedwhere an increase in drops/throws is likely. In some parts of the world, it is notunknown for dock workers to climb over cases stacked on the dockside. This isbecoming more uncommon with the advent of containers.
8.3.2 Trade ready display unit (TRDU)
Trade ready display units or merchandising units is a broad term generally takento describe complete sales/display units designed to ship through the supply chainto the retail outlet as a complete load. These units can give significant reductionin shelf replenishment costs (the so-called last 50 yards), but units can be expen-sive if they utilise quality graphics, header boards etc. The term can also coversmaller shelf ready display units, similar to current cases/packs but with enhanced

Steen: “chap08” — 2006/4/27 — 18:31 — page 229 — #12
SECONDARY PACKAGING CONSIDERATIONS 229
opening/graphical functions, designed to speed shelf replenishment and the incor-poration of a degree of ‘point of sale’ display functionality. With major supermarketsnow beginning to focus on the last 50 yards as their most costly part of the supplychain, this area will continue to develop and grow. As their use increases, com-bined with technical developments and capital investment in automated systems,the unit cost will fall. However, whether they will become cost effective as a straightreplenishment system has yet to be decided. This whole area is still developing,with many issues around standardisation of sizes, cost allocation etc. still to beresolved. For example, a number of designs are in use for 2 l PET bottles, differingnot only between the different soft drinks manufacturers but also between differ-ent retailers. These differences may not be immediately obvious but are significantfor automated handling and packing systems. Issues such as this will need to beresolved if the significant capital investment required is to be justified.
Returnable ‘dollies’ are modular, consisting of a wheeled base and a numberof layer trays, are often bespoke to a particular primary pack style (e.g. 2 l PET)and are usually hired from a logistics supplier, for example, CHEP. They are notvisually appealing but are effective for ‘commodity’ products where speed/volumethroughput is critical and visual appearance is not a major requirement, for exam-ple, milk, eggs, sugar etc. An example is shown in Figure 8.5. These are usuallyautomatically palletised on very specialised systems often using robotics to allowrapid changes between different dolly types.
Non-returnable corrugated TRDUs have a greater potential to be visually appeal-ing, but this comes at a price. For this reason, they are often used as part of a pro-motional or new launch strategy. Many such items are manually built off line, or asa contract pack operation, although some similar looking display units are actuallybuilt and filled in the store rather than being shipped through the supply chain.
8.3.3 Shelf ready packing
Shelf ready packing is another area being driven by major supermarkets. The aimis to reduce the time taken for shelf replenishment, using pack styles that can bequickly and easily opened (without the use of knives) and placed on the shelfas a complete unit, so these could also be considered as a development of thetraded unit case. Advantages are again speed/cost of shelf replenishment and theability to include point of sale graphics, but depending on design, the cost can besignificant. Currently they are mostly corrugated board cases with the inclusion ofperforations/tear tapes. Such perforations are used to open the case in such a way soas to produce a display unit that allows the case to be placed on the shelf in one goand individual primary packs to be removed. There are also film developments andmachine options that, combined with certain tray styles, can also serve the samefunction. Some film wrappers can be fitted with mechanical perforation units andthere are now laser units being developed. However, implementation often comesdown to the cost of machine upgrade/replacements and the evaluation of cost andbenefit. Using specialised film polymers and controlled production, it is possible
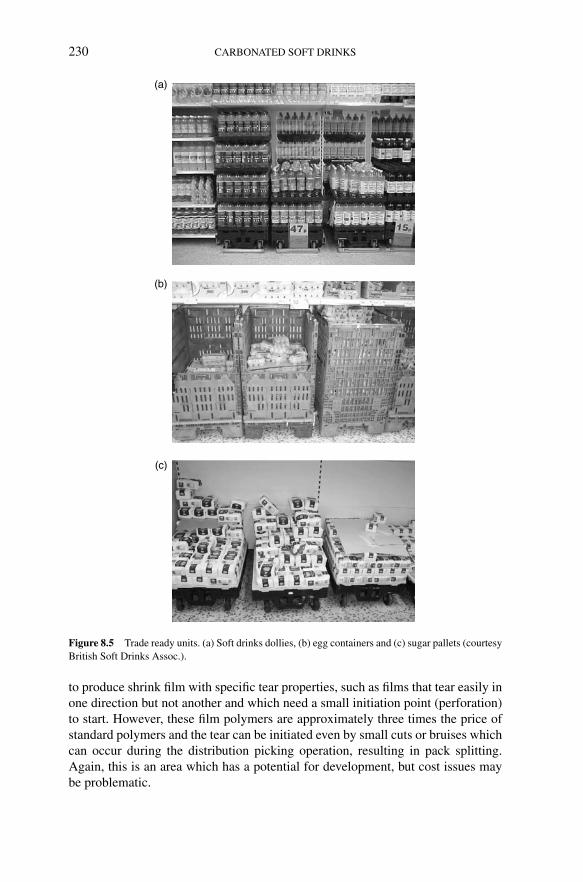
Steen: “chap08” — 2006/4/27 — 18:31 — page 230 — #13
230 CARBONATED SOFT DRINKS
(c)
(a)
(b)
Figure 8.5 Trade ready units. (a) Soft drinks dollies, (b) egg containers and (c) sugar pallets (courtesyBritish Soft Drinks Assoc.).
to produce shrink film with specific tear properties, such as films that tear easily inone direction but not another and which need a small initiation point (perforation)to start. However, these film polymers are approximately three times the price ofstandard polymers and the tear can be initiated even by small cuts or bruises whichcan occur during the distribution picking operation, resulting in pack splitting.Again, this is an area which has a potential for development, but cost issues maybe problematic.
Steen: “chap08” — 2006/4/27 — 18:31 — page 231 — #14
SECONDARY PACKAGING CONSIDERATIONS 231
8.3.4 Returnable crate
This is the traditional pack for returnable bottles which was the major secondarypack for soft drinks for many years. However, its use continues to decline as thereturnable market declines in favour of NRBs (non returnable bottles). Originallywooden crates were used, later to be replaced by injection moulded plastic. How-ever, many of these plastic crates in use are 25 years old or more and are wornand damaged, which is beginning to affect their stability in high-speed automatedsystems. Often, due to company mergers, a high degree of non-uniformity of cratedesign exists. This can give rise to instability problems in pallet loads.
8.4 Shrink film production
8.4.1 Film considerations
Shrink film is a blend of polyethylene (low, medium and high density) using thevariations in polymer chain length and degrees of cross-linking to give specificmaterial properties. The pelletised raw materials are blended and extruded througha circular die. Air is blown up into the ‘bubble’, stretching it outward around thecircumference (transverse direction). At the same time, the material is pulled away(hauled off) from the die, stretching it lengthwise (machine direction) as shownhighlighted in Figure 8.6. The air is chilled, cooling the film while stretched. Thebubble is brought together to produce a flat tube, the edge trimmed off to producetwo webs which can then be slit to multiple reels of the required width. Changes inthe die gap, haul off rate and bubble diameter will give film of different shrink ratiosand thickness. A standardised set of grades is issued by the Packaging and IndustrialFilm Association (PIFA) and is used by most UK-based film manufacturers. Thisis shown in Table 8.1.
Film slip is designated as low, medium or high, though only low slip film is usedfor secondary packaging to assist with the stability of palletised loads. Co-extrudedfilms, typically using three layers, are now commercially available. The overall filmperformance is improved by the use of different material properties in the differentlayers for improved pack performance or same performance for lower overall cost(less film). For example, the centre layer can use longer chain, high-density materialfor stiffness and tensile strength, with low-density film on the outer layers for tearand puncture resistance.
There are several important factors when considering film performance andspecifications. Hot shrink forces are the forces that act on the film when in the shrinktunnel allowing the wrap to conform to the pack contours. Optimum hot forces aregenerally low to prevent holing when film is soft under heat. Cold holding forces arethe reason packs tighten on cooling providing pack stability. Optimum cold forcesare generally high to give maximum pack tightness as the film cools. The ultimateaim, therefore, is a film with a combination of both low hot and high cold forcesto give the greatest pack quality. Tear strength is a particularly important property
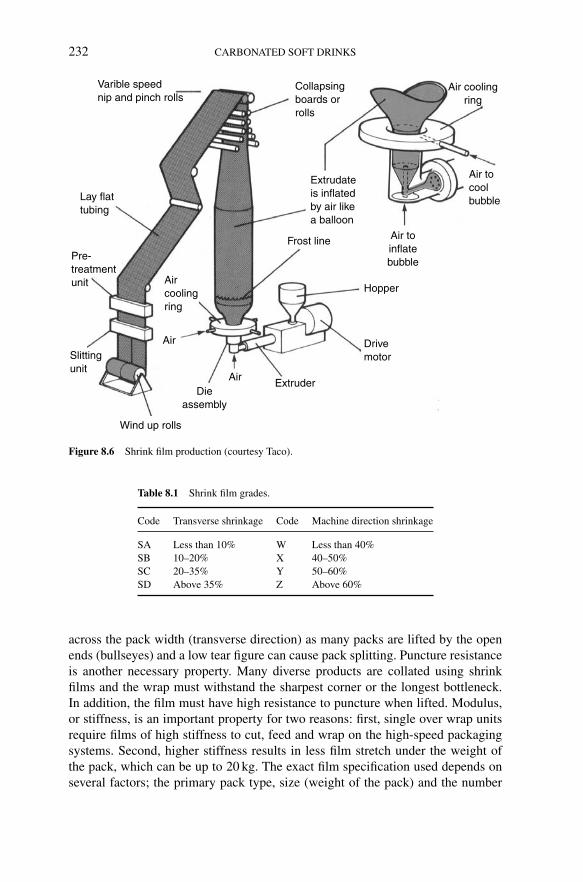
Steen: “chap08” — 2006/4/27 — 18:31 — page 232 — #15
232 CARBONATED SOFT DRINKS
Varible speednip and pinch rolls
Collapsingboards orrolls
Extrudateis inflatedby air likea balloon
Frost line
Hopper
Drivemotor
ExtruderDie
assembly
Air
Air
Wind up rolls
Slittingunit
Pre-treatmentunit
Lay flattubing
Aircoolingring
Air coolingring
Air toinflatebubble
Air tocoolbubble
Figure 8.6 Shrink film production (courtesy Taco).
Table 8.1 Shrink film grades.
Code Transverse shrinkage Code Machine direction shrinkage
SA Less than 10% W Less than 40%SB 10–20% X 40–50%SC 20–35% Y 50–60%SD Above 35% Z Above 60%
across the pack width (transverse direction) as many packs are lifted by the openends (bullseyes) and a low tear figure can cause pack splitting. Puncture resistanceis another necessary property. Many diverse products are collated using shrinkfilms and the wrap must withstand the sharpest corner or the longest bottleneck.In addition, the film must have high resistance to puncture when lifted. Modulus,or stiffness, is an important property for two reasons: first, single over wrap unitsrequire films of high stiffness to cut, feed and wrap on the high-speed packagingsystems. Second, higher stiffness results in less film stretch under the weight ofthe pack, which can be up to 20 kg. The exact film specification used depends onseveral factors; the primary pack type, size (weight of the pack) and the number

Steen: “chap08” — 2006/4/27 — 18:31 — page 233 — #16
SECONDARY PACKAGING CONSIDERATIONS 233
in the collation (pack stiffness) are the key factors to determine the film grade andgauge. Other factors are:
1. The primary container shape where considerations such as whether the filmwill have to form around long, thin bottle necks. This defines the film gradeto be used.
2. Primary pack rigidity, that is, whether they are firm (high carbonated) orsoft (low carbonated).
3. Collation machine type (sealing requirements). This defines the film grade,gauge and stiffness.
4. Supply chain requirements where the number of handling operations, visualappearance etc. need to be taken into account. This defines the film gaugeand grade.
Table 8.2 illustrates the film gauge typically used for different primary packs(Figure 8.7).
8.4.2 Shrink wrap packers
There are two basic types of shrink wrap packing machines, flow wrap and twin web.In a flow wrap machine, a single length of film is cut and wrapped around the pack,the overlap sealed by the heat in the tunnel and belt. Such machines are continuousflow machines, collating the primary packs, forming the tray around or aligningthe pad to (if used) the collation while pre-cutting a length of film. This is thenwrapped around the pack and passed through the tunnel. These are generally high-speed machines up to 120 packs/min, but are more expensive. A typical machine isshown in Figure 8.8. Many modern machines are built on a modular basis as shownin Figure 8.9. This reduces the cost of manufacture (standard modules can be pre-made) and facilitates the addition of modules at a later stage. However, this doesnot apply to all manufacturers. Cheaper or older machines may not be modular.
Table 8.2 Film gauge versus pack.
Pack Weight (kg) Film gauge (µm)
12–24 small (330 ml) PET bottles or cans 10 506–12 large (2 l) PET or (1 l) glass bottles 15 6012–24 medium (500 ml) PET or (330 ml) glass bottles 15 70
Film usage per pack is defined as
Cut length = (2 × L) + (2 × H) + seal,
whilst
Film width = W + H
where L is the pack length, W is the pack width and H is the pack height as shown inFigure 8.7.

Steen: “chap08” — 2006/4/27 — 18:31 — page 234 — #17
234 CARBONATED SOFT DRINKS
L
W
H
Machine direction
Figure 8.7 Pack dimensions (courtesy British Soft Drinks Assoc.).
In the twin web machines, the ends of two reels are joined to form a web; apre-collated pack is pushed through the web, which is then sealed behind the packby two sealing bars. At the same time the film is cut free, creating a new web for thenext pack. These are lower speed machines, up to 30 packs/min due to the stop/startmotion, but are less expensive. The sealing bar is the key area for maintenance; itmust be kept clean and well maintained. A typical machine is shown in Figure 8.10.
Tray formation may be by hand or machine, with manual, semi-automatic orautomatic packing, but the tray is formed prior to packing. In this type of packingoperation, as the tray is filled after formation, tray size tends to be slightly largerthan for a flow wrapper where the tray is folded around the pack collation.
8.4.3 Printed shrink wrap
The development of higher quality flexographic printing and higher speed pressesover the past few years has resulted in the increased use of printed shrink film forcollation as well as for consumer multi-packs. While there are great similarities inthe two, this section will focus on the use for collation packs.
There are two pack styles, registered and unregistered (random) print, both beingused for secondary packs. Registered film requires specific machine capabilities,requiring the addition of sensors and film drive units to control the film feed and alignit with the pack. This film can only run on flow-type wrappers. On new modularmachines, this is one of the module options and can sometimes be retrofitted toolder machines. The design is aligned to the pack faces with a clear seal area tomaximise strength. An eye mark is used to control alignment to the pack, a photocell‘reads’ the eye mark and controls the cut point and the film feed to align the packto film during wrapping. This eye mark can be an integral part of the design ormay be a separate mark, away from the main print in a less conspicuous area. Onalmost all machines, the eye mark is on one edge of the film, ending up in thebullseye area on the finished pack, which may not often be obvious. The colour ofthe eye mark needs to give a good change in transmission so a clear signal can begenerated.
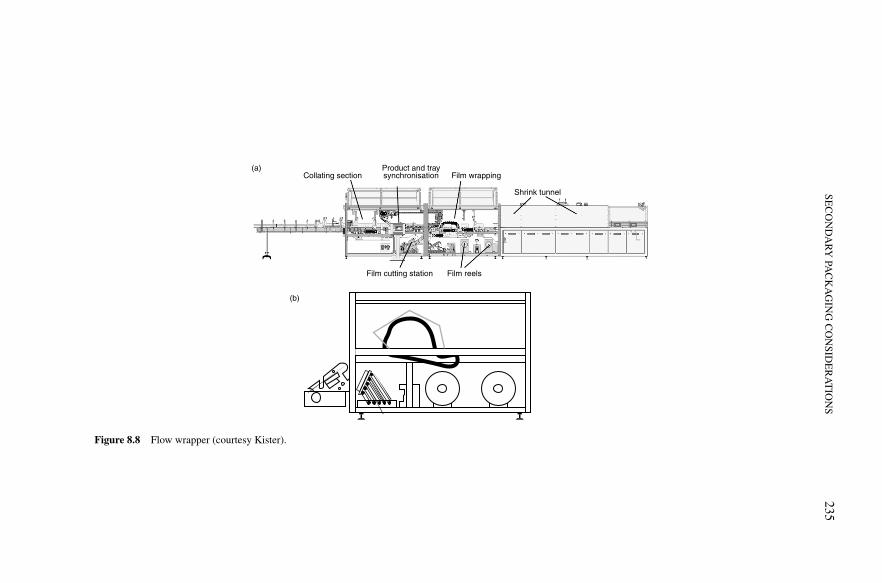
Steen:“chap08”
—2006/4/27
—18:31
—page
235—
#18
SEC
ON
DA
RY
PAC
KA
GIN
GC
ON
SIDE
RA
TIO
NS
235
Collating sectionProduct and traysynchronisation
(a)
(b)
Film wrapping
Shrink tunnel
Film cutting station Film reels
Figure 8.8 Flow wrapper (courtesy Kister).

Steen: “chap08” — 2006/4/27 — 18:31 — page 236 — #19
236 CARBONATED SOFT DRINKS
1 Infeed module
2 Collating module
3 Blank module
4 Tray folding module
5 Film module
7 Stacker modules
8 Pack turner modules
6 Shrink tunnel module
(a)
(b)Example 1: ShrinkPacker
Example 2: PadShrinkPacker
Example 3: TrayShrinkPacker
Example 4: TrayShrinkPacker with Stacker
1 + 2 + 5 6+
1 + 2 + 3 5+ 6+
1 + 2 + 3 4+ 5+ 6+
1 + 2 + 3 4+ 7+ 5+ 6+
Basic modules Option modules
Figure 8.9 Modular machine overview. (a) Basic modules and (b) combining modules to give desiredfinal pack format (courtesy Kister).
The two common eye marks are:
1. Strip eye mark, which is a continuous band of solid colour along one edge,where a single change of transmission triggers the film registration.
2. Block eye mark, which is a small block of solid colour at a key positionalong one edge. This requires greater control of the photocell to recognisethe change in transmission and trigger the film registration.
Unregistered (random) film uses a simple repeating pattern spaced to allow a seal,but still ensuring visibility on the pack. While various designs are used, the criticalpoint is to use a design that still allows at least 75% of the available seal to form asno lap seal will form on the printed areas. Two basic designs are used:
1. A longitudinal strip, which appears as a stripe around the pack. As a rule,the strip should be no wider than 25% of the pack length (machine width).
2. Diagonal strips, angled between 25◦ and 35◦ to the transverse direction(film width) and spaced equally apart to appear on the pack faces. The twokey rules are to leave a minimum of 20% film width clear along each edgeand the spacing along the film length is not less than the width of the underpack seal.
It is vital to ensure that pack sealing is not compromised to maintain supply chainperformance.
The use of printed film, especially registered film will give improved packappearance over plain film. Printed film is commonly used for multi-packs, pre-mium products and promotions, launches etc. The material itself is a similar cost,
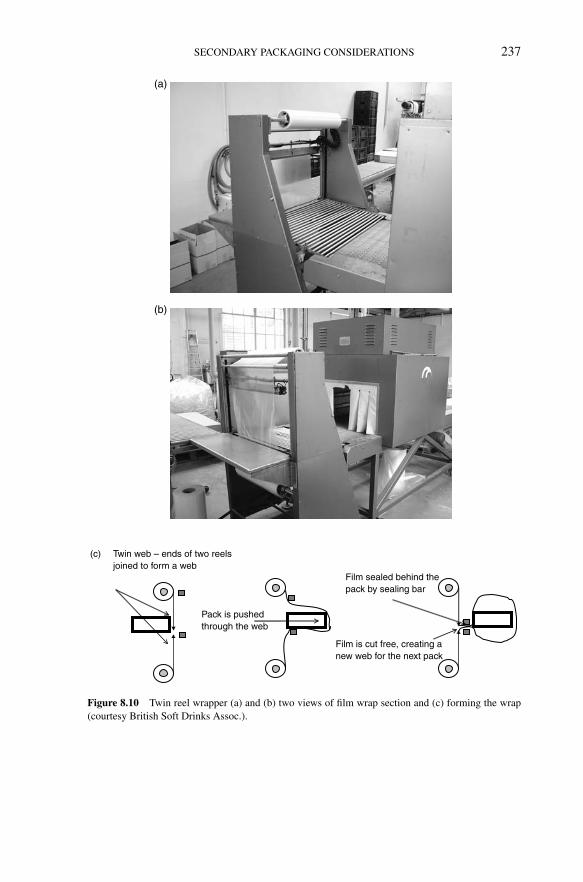
Steen: “chap08” — 2006/4/27 — 18:31 — page 237 — #20
SECONDARY PACKAGING CONSIDERATIONS 237
(a)
(b)
Twin web – ends of two reelsjoined to form a web
(c)
Pack is pushedthrough the web
Film sealed behind thepack by sealing bar
Film is cut free, creating anew web for the next pack
Figure 8.10 Twin reel wrapper (a) and (b) two views of film wrap section and (c) forming the wrap(courtesy British Soft Drinks Assoc.).

Steen: “chap08” — 2006/4/27 — 18:31 — page 238 — #21
238 CARBONATED SOFT DRINKS
depending on the number of colours and quantity of film, the additional cost will bebetween 50 (two colours) and 80% (six colours) compared to plain film. The filmused may be standard shrink wrap, or a high clarity, high gloss blend which can beused to enhance pack appearance (these are often co-extruded films to optimise thefilm properties). The key areas to consider for registered printed film are:
1. Film to pack alignment. The positioning of pack graphics such as logos,branding, promotional and legal text (ingredients) and bar codes.
2. Shrinkage on the various faces. This will vary from pack to pack andbetween machines.
3. Areas of maximum distortion: both shrinkage and stretching.
The machine manufacturer will be able to prepare an outline drawing, detailingthe various panels, positions of eye marks, the film winding on the reel (how thefilm is wound to ensure correct alignment to the pack). The addition of ink on thefilm will retard the film shrinkage by approximately 10–20%. Before printing a fulldesign, use a gridded film (10 mm squares) with a full coverage white backgroundand relevant panel lines, eye mark etc., to check the dimensions and to indicateareas of maximum shrinkage. These can then be considered and incorporated intothe finished pack design. Unfortunately, printed film is not suitable for twin reeltype machines due to sealing issues. The ink builds up on the sealing bars, resultingin poor welds, seal failures and broken packs.
It is important that operating line checks are carried out regularly to ensure thatpacks are well presented. The high cost of such film as well as the high capitalinvestment necessary to produce them require that the secondary pack not onlymeets the functional specification but is also presented to the consumer in the bestpossible way. Parameters (and tolerances) such as film alignment, pack squarenessetc. will be agreed with the machine and film suppliers and are easily measuredusing jigs made of clear Perspex, as shown in Figure 8.11.
Figure 8.11 Film jig (courtesy British Soft Drinks Assoc.).
Steen: “chap08” — 2006/4/27 — 18:31 — page 239 — #22
SECONDARY PACKAGING CONSIDERATIONS 239
8.5 Corrugated fibreboard
8.5.1 Specifications
Corrugated fibreboard, often called cardboard, is used for trays, pads and cartons(boxes). It is composed of three or more layers of paper, two outer layers withfluting fixed between the inner and outer liner. The outer layer or facing may utilisehigher quality material, sometimes white, for printing. The fluting, which givescorrugated board its cushioning characteristics and also achieves excellent rigidityand structural strength, uses lower grade or recycled material. The inner layer orlining may be of lower grade (recycled) board as visual appearance is less critical.These layers are bonded together using adhesives, usually starch based.
Different grades and weights are used for each layer depending on the enduse of the board. Virgin material (Kraft) is the highest grade of paper, comprising80% virgin chemical pulp. The long fibres give better visual appearance and aremechanically stronger. However, it is more expensive and is available in bleached,unbleached, mottled and white top forms.
Recycled material (Test) is cheaper, but has less mechanical strength (reducedfibre length due to the use of recycled material) and less consistent visual appear-ance. There are two grades of test materials: Test Liner 2 and Test Liner 3,with Test Liner 2 being the higher grade (made predominantly from Kraft wastematerial) with similar performance to Kraft material. While Test material is avail-able in the same forms as Kraft, the surface finish cannot meet the same visualstandards.
Fluting is made by two processes. Semi-chemical fluting is made predominantlyfrom 100% virgin fibre using a combination of mechanical and chemical pulpingmethods. Waste-based fluting uses 100% waste material reinforced with starch-based adhesive. The use of virgin material in semi-chemical fluting gives it greaterstrength over other mediums.
Different paper grades, weights and flutings are used for each layer dependingon the end use of the board. For heavy use such as bag in box, a double flute oreven triple flute may be used. The papers used for each layer are referred to bytheir weight in grams per square metre and type (Kraft, Test etc.). For many softdrinks trays/pads, both the facing and liner are made from recycled board as visualappearance is not critical.
The standard flute range includes the coarse ‘A’ and ‘C’ flute, fine ‘B’ and extrafine ‘E’ and ‘F’ flutes. The ‘B’ flute is the most widely used. It is very robust(difficult to crush) and has good compression strength. It is also compact, so lessspace is required during transit or storage. The ‘C’ flute is larger with greatercompression strength but offers less crush resistance and requires more space. Thelatest construction is the ‘N’ flute, which is 48% thinner than ‘E’ fluting and 20%thinner than the ‘F’ flute. The non-standard range includes mini and micro ‘F’flutes. Flutes come in different combinations: single-face web, single-wall boardwith single- or dual-arch fluting and double and triple walls. Double wall packaging
Steen: “chap08” — 2006/4/27 — 18:31 — page 240 — #23
240 CARBONATED SOFT DRINKS
combines ‘B’ and ‘C’ flutes, for applications where compression strength is moreimportant than storage space. More recent innovations have combined ‘E’ and ‘F’flutes. Triple wall is a more rigid board that provides excellent stacking strengthwith good shock and puncture resistance. Typical board and flute details are shownin Figure 8.12.
8.5.2 Corrugated board manufacture
There are essentially three main processes involved in the manufacture of corrugatedboard. The first operation is the making of single-faced board. The fluting materialis passed through pre-heated rollers and then steamed to make it pliable. It is thenpassed between a pair of corrugating rollers to form the flutes. Starch-based adhesiveis applied to the flute tips, which are then brought into contact with the liner material(also pre-heated) forming the single-faced board. This flexible board then passesonto the bridge section which acts as a buffer to the second part of the process.
The single-faced board travels with the corrugations downward over a secondadhesive applicator again applying adhesive to the tips. A second liner (again pre-heated) is applied to the tips to form single-wall corrugated board.
The formed board is dried by passing it over a heated table under a compressionbelt before passing through a cooling section. If required for the finished prod-uct, machine direction creases are added before the board is cut into sheets forconverting.
Simple cases can be finished on a case maker or printer slotter. However, morecomplex cases or high volume items are finished on either flat bed or rotary die cutmachines as illustrated in Figure 8.13.
8.6 Stretch wrap
8.6.1 Material
As with shrink wrap, stretch wrap is a blend of low-, medium- and high-density polyethylene. However, the materials and blends are different with longchain/cross-linked polymers formulated for high puncture resistance, tensilestrength and elasticity. The resulting film must be able to wrap around pallet corners,pack edges and angles and resist abrasive forces through the supply chain.
The force applied to the load is a combination of the amount of film (wraps andthickness) and the tension applied. Stretch wrap cannot compensate for poor packformation or pallet stacking and if the packs are loose or slack, or there are unevengaps between them, the stretch wrap will not prevent load movement.
Blown film production is produced in exactly the same way as shrink film.However, the polymers, blow ratio and haul off rates are different, as the propertiesrequired for the finished material are completely different. Cast film is made using
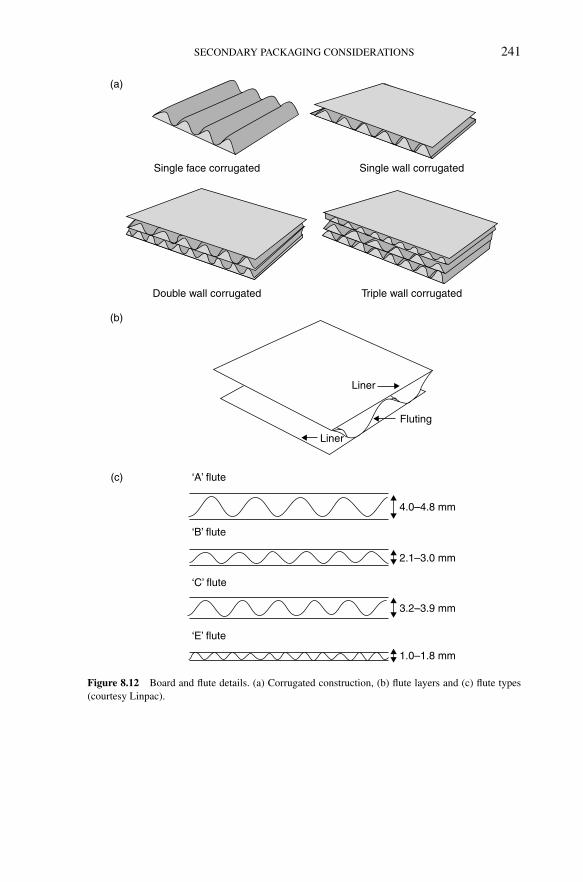
Steen: “chap08” — 2006/4/27 — 18:31 — page 241 — #24
SECONDARY PACKAGING CONSIDERATIONS 241
Single face corrugated Single wall corrugated
Triple wall corrugatedDouble wall corrugated
Liner
Fluting
4.0–4.8 mm
3.2–3.9 mm
2.1–3.0 mm
1.0–1.8 mm
‘A’ flute
‘B’ flute
‘C’ flute
‘E’ flute
(a)
(b)
(c)
Liner
Figure 8.12 Board and flute details. (a) Corrugated construction, (b) flute layers and (c) flute types(courtesy Linpac).

Steen:“chap08”
—2006/4/27
—18:31
—page
242—
#25
242C
AR
BO
NA
TE
DSO
FTD
RIN
KS
Fluting medium in
Glue doctorroll
Glue applicatorroll
Pressure typesteam shower
(a)
Steam showerdrum
Lower corrugating roll
Integralpre-heaters
Liner paper in
Figure 8.13 Corrugated manufacture. (a) Single facer, (b) double backer and (c) creasing/slitting (courtesy Linpac).

Steen:“chap08”
—2006/4/27
—18:31
—page
243—
#26
SEC
ON
DA
RY
PAC
KA
GIN
GC
ON
SIDE
RA
TIO
NS
243
Glue
Bridge
LinerboardPre-heater
GlueSingle facer
Pressureroll
Pre-conditioner
Corrugatingmedium
Linerboard Pre-heatersDouble backer
Hotplates Cooling
section Triplexslitting
and scoring
Cutoff
Pileddelivery
Pressure rollsCorrugatingrolls
Corrugatedboard
Slitter
Waste edge
Upper scorer
Lower scorer
Crease Cut blanksto stackers
(b)
(c)
Figure 8.13 Continued

Steen: “chap08” — 2006/4/27 — 18:31 — page 244 — #27
244 CARBONATED SOFT DRINKS
Figure 8.14 Stretch film production (courtesy Mima).
a different process. The material is extruded through a straight die (at 250–280◦C)onto a chilled roller at 40◦C, then wound onto reels. This is shown in Figure 8.14.
During wrapping, the most important properties are tensile strength and punc-ture resistance. The film must withstand the stretching forces while being appliedto the pallet and resist failure on load protrusions, pallet corners etc.
In transportation, load stability is the most crucial factor. The yield point of thefilm should be high and its elongation to yield point low. A low value for stressrelaxation is also required to maintain the wrap tightness and load rigidity.
Different films have different properties and it is vital to match the film specifica-tion to the wrapping machine and the load being wrapped. This will vary accordingto individual pack types and dimensions. While the graph shows typical differ-ences between cast and blown films, the resin blend and processing will also havean effect. The properties of stretch film are shown in Figures 8.15 and 8.16.
Film suppliers will assess the machine, pack to be wrapped and advise the mostsuitable material and recommend a wrap pattern. This can then be evaluated bytrialling.
8.6.2 Stretch wrapping systems
There are two basic types: pre-stretch and brake stretch as shown in Figure 8.17. Inthe pre-stretch system, the film is pre-stretched between two differentially gearedrollers before being applied to the load. These rollers can be driven by the filmor by a separate drive motor, when it is known as power pre-stretch. Tension iscontrolled by varying the differential gearing between the reels and the feed rate tothe palletised load. The film feed system is driven independently from the rotarycarriage, which generally rotates around the stationary load. This gives very goodtension and application control and can apply high stretch forces to the load. Noforce is applied to the load during wrapping, so it is suitable for less robust loads.This type of machine is generally high speed, up to 2 pallets/min, but is moreexpensive.

Steen: “chap08” — 2006/4/27 — 18:31 — page 245 — #28
SECONDARY PACKAGING CONSIDERATIONS 245
Stretching
%
Relaxation
Snap-back
Figure 8.15 Stretch film properties (courtesy Mima).
Cast filmBlown film
StandardLLDPE
%Elongation
Force
2
Three-layercast
Figure 8.16 Stretching properties (courtesy Mima).
The films used for pre-stretch machines are formulated with higher stretchproperties, up to 700% and can control film stretch up to 300% on the load. Filmsformulated for brake stretch machines would be destroyed at these forces.
With a brake stretch system, the film is stretched between the film reel and theload. Tension is controlled by varying the braking force applied to the reel as thefilm is drawn from the reel. This type of machine can operate either by rotating
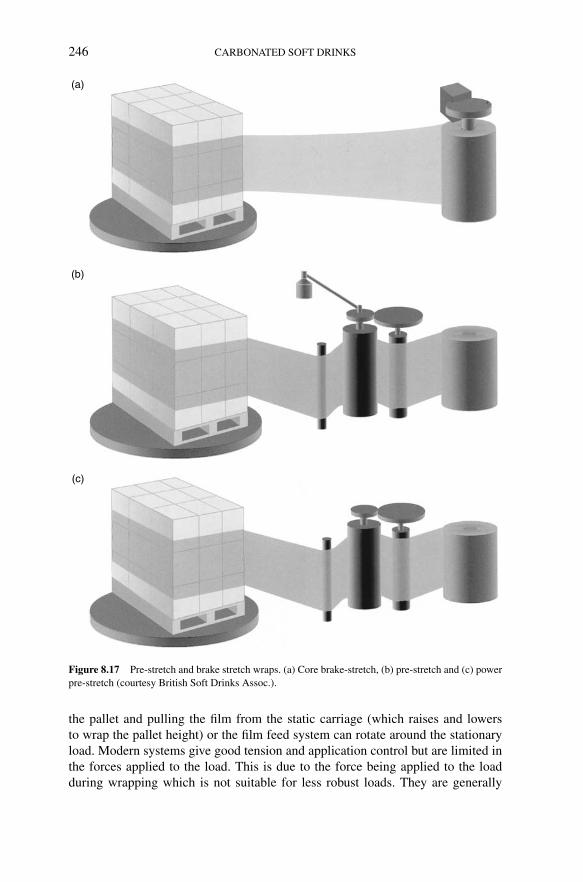
Steen: “chap08” — 2006/4/27 — 18:31 — page 246 — #29
246 CARBONATED SOFT DRINKS
(a)
(b)
(c)
Figure 8.17 Pre-stretch and brake stretch wraps. (a) Core brake-stretch, (b) pre-stretch and (c) powerpre-stretch (courtesy British Soft Drinks Assoc.).
the pallet and pulling the film from the static carriage (which raises and lowersto wrap the pallet height) or the film feed system can rotate around the stationaryload. Modern systems give good tension and application control but are limited inthe forces applied to the load. This is due to the force being applied to the loadduring wrapping which is not suitable for less robust loads. They are generally
Steen: “chap08” — 2006/4/27 — 18:31 — page 247 — #30
SECONDARY PACKAGING CONSIDERATIONS 247
slower speed machines up to 1 pallet every 2 min but are less expensive. The filmsused for brake stretch machines are formulated with lower stretch properties. If filmformulated for power stretch machines is used on brake stretch machines, lowerload stability will result as the film will not be stretched to its optimum load holdingcapability. This is generally overcome by using excess film.
8.6.3 Pallet wrapping
The key aims and attributes are:
1. The load is secured to the pallet, with the film overlapping the pallet byat least 50%. This is absolutely vital to prevent load shift during transit.Many customers will reject pallets where the film is not around the pallet.However, wrapping fully over the pallet can also create difficulties withpallet sensors in automated systems.
2. The wrap pattern locks layers and prevents shearing. Typically this occurson the second layer. Apart from the bottom layer, this layer has the highestvertical load, but the cases stand on the layer below. With narrow neckcontainers such as bottles, this creates a pivot point for the second layer.Biasing the wrap pattern to give an increased restraining force is oftenvital here.
3. The top layer is secured. It is vital to ensure cases are not dislodged, par-ticularly when operating a fork lift truck (FLT) three or four pallets upin racking. However, care must be taken to avoid excessive wrapping ortension causing damage to the primary pack.
4. There are no loose tails, loose ends or excessive film over the top of theload. Loose stretch wrap ends must be removed from empty pallets beforere-use. Wrap starts must not be tied to pallet blocks, but trapped between thepallet and the load. Film ends must not be left loose or trailing but brushed,sealed or trapped under film wraps. Tails are likely to snag on FLTs, trailers,racking etc., and are critical rejects for most customers. One dislodged case(or several if the tail snags) can severely damage a crane in a high bayautomated warehouse as well as all the stock in the bays below. The repairbill and lost time claim could be several thousand pounds.
While achieving the above, it is important to ensure that film tension does notdamage primary containers. This is often a potential problem when handling stillproducts, cartons or pouches and is a balance between load restraint and damage.
Stretch wrap is not like an elastic band. It can be stretched beyond its elasticlimit and then it loses most of its load holding force. It is vital to match the filmspecification to the wrapping machine and the load being wrapped. Increasing thenumber of wraps, using thicker film or altering the bias in the wrap (areas of heavierwrap) may be better than just increasing the tension (assuming the tension was nottoo low).

Steen: “chap08” — 2006/4/27 — 18:31 — page 248 — #31
248 CARBONATED SOFT DRINKS
Different packs and palletised loads also have different properties and it is vitalto match the film specification to the wrapping machine and the load being wrapped.This will vary according to individual pack types and dimensions. The wrap is nor-mally biased to key areas to maximise the load holding force of the film. A minimumof three full wraps should be placed around the bottom of the palletised load. Thesemust overlap the pallet blocks by a minimum of 80 mm below the top boards.
Individual wraps ascending and descending the palletised load must overlapby a minimum of 40%. A minimum of two full wraps should be placed aroundthe top layer of the palletised load. For some materials, particularly shrink wrappacks of bottles, additional wraps around the second layer act as a band to furtherstabilise this area which is the layer most prone to shearing (herring-boning) due tothe combination of high vertical force and the packs standing on the bottom layer.
The wrap tension and the number of wraps will also vary depending uponthe nature of the product, distance travelled, number of handling stages etc. Lowcarbonated products will require less tension but a greater number of wraps tostabilise. The greater the number of fork truck handling operations, the greater thestabilisation required.
8.7 Pallets and pallet stacking
8.7.1 Pallets
Almost all UK distribution systems are now based around the use of returnable,1200 mm × 1000 mm × 162 mm, four-way entry wooden pallets. Almost exclu-sively, these are used on a transfer hire system, where the pallet hire costs aretransferred to the customer on delivery. These returnable pallets are ostensibly toan agreed standard and quality. However, as with pack and palletised load require-ments, the standards required by the latest generation of automated warehousesare increasing. Currently there are ongoing discussions among the major multiples,the pallet suppliers and the users regarding the current quality standards in thepallet pool.
For imported goods, non-returnable pallets are used sometimes. These shouldbe to the same dimensional and quality standards as for returnable pallets. The useof ‘slave’ pallets (simply placing the non-returnable pallet on a returnable pallet)is not accepted by any distribution systems.
8.7.2 Pallet stacking
This is often only an afterthought but it is a vital part of the supply chain and isbecoming more critical. The key aims and attributes of a good stacking pattern are:
1. A good interlock of packs helps lock the load together and helps to main-tain stability when the wrap is removed which improves stability in thebreak/pick warehouse and minimises health and safety risks.

Steen: “chap08” — 2006/4/27 — 18:31 — page 249 — #32
SECONDARY PACKAGING CONSIDERATIONS 249
2. Achieves perimeter stacking. Excessive overhang does not fit pallet rack-ing or defined bays, as most systems are limited to a maximum 20–30 mm.However, it is vital to check as some systems will not tolerate any over-hang at all. New automated systems use laser measurement to gauge palletdimensions and will reject any pallet with overhang. These systems willalso reject loose labels, stretch wrap etc. as these break the same detectorbeams. Excessive under hang (greater than 20 mm) will result in load shiftin transit. With 26 pallets on a vehicle, there is 13 × 20 = 260 mm ofpotential movement.
Matching the primary container size to the pallet is vital to facilitate pallet stability.Therefore, it is vital to consider the pack dimensions and type when designingand specifying the primary pack diameter. This may restrict the design, but theimportance must be emphasised during the briefing process.
A good stacking pattern gives a good interlock of cases to aid stability in transit.This also helps between palletiser and stretch wrapper, as well as in the ware-house when stretch wrap is removed. However, the formation must be capable ofbeing stacked, either manually or automatically. Patterns which are too complexor irregular should be avoided. The fewer the number of cases that need to beturned by automatic palletisers, the more reliable the line is. Figure 8.18 illustratesa typical pallet wrapping pattern whilst Figure 8.19 shows some good stackingpatterns.
8.8 Case and pallet labelling
Bar code identification is now an absolute requirement of most customers, bothmajor multiples and Cash & Carry outlets, with many now rejecting goods and/orlevying handling charges for pallets and cases that fail. Some major retailers nowrequire a minimum 98% first-time scanning for case and pallet labels.
International standards are in place via the European Article Number (EAN)international and the Unified Code Council (UCC) and must be followed at all times.
Base wraps lock load to pallet
Additional stability
Body wraps 40% overlap
Top wraps to stabilise
Figure 8.18 Pallet wrapping patterns (courtesy British Soft Drinks Assoc.).

Steen: “chap08” — 2006/4/27 — 18:31 — page 250 — #33
250 CARBONATED SOFT DRINKS
1200
Interlock
Spiral
1200
1000
1000
(b)
(a)
Figure 8.19 Good pallet stacking patterns (courtesy British Soft Drinks Assoc.).
These standards are used by all the major users, details of which are available fromGS1 UK (formerly the e-centre) www.gs1uk.org. Briefly the current standards areas follows:
1. Each case must carry a minimum of one global trade item (bar code) number,encrypted in the appropriate symbology. The bar code must be positionedon a long side and must be visible when the pack is standing in its normalupright orientation. Packs distributed through normal ambient systems willuse a simple 14-digit ITF code. EAN 128 codes are generally used whereadditional information such as BBE dates is required, usually only wherethe shelf life is less than 48 days.
2. Each pallet must carry two supplier shipping container code (SSCC) labelswith bar codes in EAN 128 symbology. This carries the pallet globaltrade item (bar code) number and a unique pallet identification number.Additional information such as BBE date and batch information are alsoincluded. The SSCC number is composed of the supplier (or retailer in thecase of own label goods) identification code together with a pallet number,allocated by the manufacturer to give an 18-digit number, unique to eachpallet.

Steen: “chap08” — 2006/4/27 — 18:31 — page 251 — #34
SECONDARY PACKAGING CONSIDERATIONS 251
All the relevant details are available from the GS1UK booklet Bar Coding Gettingit Right or their web site. These cover:
1. printing quality and verification standards2. label dimensions, bar code symbology and position3. number creation and allocation.
Bar coding is a whole subject in its own right and realistically cannot be coveredin any detail within this chapter. GS1UK runs a series of 1- or 3-day courses, frombasic to advanced level. These are ideal to gain the necessary understanding of barcode symbology and quality standards.
Trays and cases can have the bar code pre-printed by the board supplier, or thepacker may print the bar code using ink jet printers or apply self adhesive labels(either pre-printed or on-demand print) on the packing line.
Pre-printed items have the advantage of cost and operational simplicity on theproduction line but have the disadvantage of logistics complexity as a differenttray/case is required for each individual SKU produced. This can result in a sig-nificant inventory of packaging materials. They will also still require printing oftraceability data such as Best Before dates, lot numbers etc. usually with ink jet orroller print. The use of on-demand printed self-adhesive labels add to operationalcomplexity (another machine to set up and maintain) but simplifies the inventory ofpackaging materials. They can also include all the traceability information on thesame label. A ‘halfway’ point is to use pre-printed self-adhesive labels; the appli-cation machine is simpler and while a stock of labels by SKU is required, thesetake up much less space. A developing alternative is ink jet printing of bar codeson corrugated trays or cases. At present, the speed of this system is not capable ofmeeting the bar code quality requirements at the higher line speeds on the biggerproduction lines but it is a viable alternative on smaller lines. However, due to thequality issues, most major multiples currently require two bar codes on each caseto ensure that 98% readability is maintained. When using film and pad or film-onlypacks, self-adhesive labels are currently the only viable option as ink jetting ontofilm is not yet possible at line speeds and the film treatment/printing to accept theink makes the process not cost effective. The only exception is when using regis-tered printed film when the bar code can be pre-printed on the film, but the codemust be positioned correctly in an area of minimal and equal distortion.
For pallet labelling, the use of self-adhesive labels is the only realistically viableoption. Labels cannot be tucked into or placed behind the stretch wrap or held onwith adhesive tape as this will compromise bar code readability. The two optionsare either on-demand printed self-adhesive labels (has the same advantage anddisadvantage as with case labels) or pre-printed self-adhesive labels, but these willrequire adding the traceability details at the time of production. Whichever systemis used, there is an absolute requirement for the unique SSCC number so strictcontrols must be in place to allocate numbers and ensure no duplications (theretailer automated systems will reject pallets with duplicate numbers).
For both case and pallet bar code labels, a robust QA process as part of routinedaily checks is vital for checking accuracy and quality to ensure bar code compliance

Steen: “chap08” — 2006/4/27 — 18:31 — page 252 — #35
252 CARBONATED SOFT DRINKS
to the required standards. A good quality code ISO standard bar code verifier is aworthwhile investment as part of this process. A £0.20p charge per case doesn’tsound much, but at 10 m cases per year, 1% failure equals £20,000, a good bar codeverifier costs £2,500.
Bar code based systems have now developed to be fairly sophisticated logisticsmanagement operations. However, there is now a new emerging technology whichis likely to replace bar codes in the next 10 years. Radio Frequency Identification(RFID) involves the tagging of products (pallets, cases or items) with electronic bar-codes (data carrying micro-chips, with in-built aerials that can transmit informationabout the product to a remote reader several metres away). The aim is to facilitatevisible, efficient and collaborative supply chains by tracking products through allthe stages of the product life cycle that is, from manufacturer to consumer, forexample, storage, delivery, shelf fill, point of sale. This technology has been avail-able since the Second World War (used for bomber guidance control), but it is onlyin the past few years that it has been developed to a point where the chip size issuitable. Within the constraints of this book, it is not possible to go into the detailsof how RFID works, but in essence, the system consists of the following:
1. RFID tags which are attached to the product/case/pallet; these contain theelectronic product code (EPC) – globally unique item identification number– and communicate this to the reader.
2. RFID tag activators and readers, which use radio frequency to write infor-mation to and read information from the tags. The data is written at thepoint of packing, and then read at subsequent distribution stages.
3. A network of computers, both local and remote, which processes the infor-mation received from the reader and communicates onwards the detailedproduct information.
However, there are a number of technical and commercial issues to be addressed.Tag and frequency standards are still being finalised. The latest version for tags(Generation 2) has recently been published but now needs to go through a lengthyratification process (12–24 months). Equally manufacturers are now franticallytrying to produce compatible tags and readers in sufficient quantities that actu-ally work. There is also a view that the global standards are unsustainable in themedium term. This is supported by the understanding that no manufacturer etc.has yet agreed to the data and information transfer protocols. It is difficult to seewhere new standards development could come from on the basis that all interestedparties are represented in EPC Global. This reflects a general uncertainty aroundstandards. Also, the physical aspects of liquid and metal, which can severely dis-rupt radio waves and subsequent tag read rate accuracy are yet to be resolved. Thispresents specific issues for soft drinks producers, where the products, factories andwarehouses have high density of liquid and metal substances (packaging and equip-ment). On the wider social aspect, there are major concerns over the quantity andsecurity of the data. Consumer groups have concerns over the data held on the tagsand links to individuals. The majority of these are based on a misunderstanding ofhow the tags work and the data held on them. Talk of ‘spy chips’ being read by

Steen: “chap08” — 2006/4/27 — 18:31 — page 253 — #36
SECONDARY PACKAGING CONSIDERATIONS 253
satellites are completely unfounded; the tags have a read range of a few metres anddo no more than identify a product, although they can also carry the BBE informa-tion and production batch details. However, these issues must be addressed beforewidespread tag use is accepted by the public in general. Equally, RFID creates hugequantities of extra data which suppliers are struggling to make any value-add realtime use of, without significant extra resource.
Through the retail supply chain, it is possible to see where implementing RFIDcould drive benefit, for example, reducing shrinkage, lowering inventory and cuttingout of stocks. However, in order for this to work in retail it is necessary for thesupplier to apply the RFID tag. It is for this reason that retailers are encouragingsuppliers to produce their own internal business case. The major issue is that it hasnot been possible to find a single robust supplier benefits case. In fact, the generalview is that RFID will add no additional benefit to an effectively implemented barcode ‘track and trace’ system.
8.9 Getting it wrong
Some examples are shown in Figure 8.20.Loose film on pallets and stretch tails will jam in conveyors, cranes and racking
causing fallen cases, damage etc. Offset and sheared loads may not look too bad,but are disastrous for an automated system. These will jam in cranes and rackingcausing fallen cases, damage etc. Multiple pallet labels as illustrated show whatyou can see but the bar code scanner cannot. A shot load occurs when truck driverssometimes have to brake hard. While mixed delivery technically is the retailer’sresponsibility, it can be helped by pack design and materials. Where packs aresusceptible, adequate handling guidelines should be given to the warehouse staffand load assemblers to assist in the correct pick order.
One issue is the varying standards applied by the various multiples regardingpallet quality, number and position of labels, palletised load dimensions, tolerancesand methods of measurement. On one side, there are a few major multiples thathave fully automated systems which apply consistent measures to the many wherethe delivery FLT driver makes a judgement on each load. Figure 8.21 shows a wholeload rejected by a major multiple; the arrow indicates the single pallet rejected dueto ‘insufficient shrink wrap’.
While some retailers have very comprehensive documentation covering palletand case quality and acceptance criteria, others have very little. Also, in some cases,these standards are not applied consistently within individual retailer’s depots. Thisadds to the pressure on the suppliers in developing specifications and standards thatsatisfy all customers. There is a growing need for one or more of the industrybodies such as the British Soft Drinks Association, the Institute of Packaging orthe British Retail Consortium to jointly create a standard to cover delivery of filledgoods from the packer filler to the customer distribution centre. While it could neverspecify every parameter, a code of practice outlining key requirements, dimensionsand tolerances, acceptance standards etc. is required to minimise these difficulties.
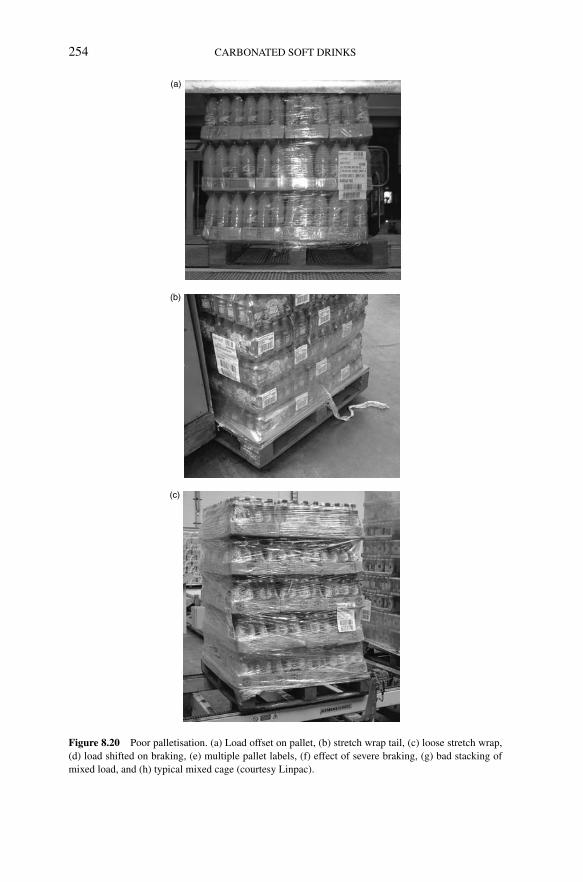
Steen: “chap08” — 2006/4/27 — 18:31 — page 254 — #37
254 CARBONATED SOFT DRINKS
(a)
(b)
(c)
Figure 8.20 Poor palletisation. (a) Load offset on pallet, (b) stretch wrap tail, (c) loose stretch wrap,(d) load shifted on braking, (e) multiple pallet labels, (f) effect of severe braking, (g) bad stacking ofmixed load, and (h) typical mixed cage (courtesy Linpac).

Steen: “chap08” — 2006/4/27 — 18:31 — page 255 — #38
SECONDARY PACKAGING CONSIDERATIONS 255
(d)
(e)
(f)
Figure 8.20 Continued.

Steen: “chap08” — 2006/4/27 — 18:31 — page 256 — #39
256 CARBONATED SOFT DRINKS
(g)
(h)
Figure 8.20 Continued.
The whole supply chain would benefit as any degree of over packaging could beminimised and unnecessary returns reduced. This would allow greater focus on keyissues.
A balance is required between health and safety on the one hand and the costpressures being brought to bear by the major multiples. For example, currentlymost beverage cans (singles and multi-packs) are not stretch wrapped. However,

Steen: “chap08” — 2006/4/27 — 18:31 — page 257 — #40
SECONDARY PACKAGING CONSIDERATIONS 257
Figure 8.21 Reject load (courtesy British Soft Drinks Assoc.).
one major retailer has recently requested wrapping on all pallets of cans due to anincident.
8.10 Developments and testing
A controlled, documented test method, based on actual supply chains is vital toevaluate secondary and tertiary packs and palletised loads as part of a developmentprocess. The aim is to simulate the likely route for the packs under evaluation.As you have seen, it is vital that the appropriate distribution channel is selectedor if considered applicable, several supply chains are used for the evaluation. Forextended journeys, particularly overseas distribution, the use of a travel test simula-tion should be considered. This may be more practical (and cheaper) than an actualtravel test. Equipment is available at packaging consultants which can simulate anyjourney (takes data from loggers on vehicles) and some have a database of varioustypical/worst case journeys from internal lorry to container at sea/vehicle etc. Palletstability and case handling trials may be carried out using the same full goods. Initialtrials will consist of one or two pallets, which can be tested internally using fork lifttruck handling and through inter-site road shipment (minimum 100 miles each way).Pallet stability should be monitored at each stage. After this initial trial, the secondstage of the pallet stability trials should be onwards shipment to the final destinationusing 10–20 pallets as part of several mixed loads. These should also involve manualhandling and be subject to order picking process and manual handling evaluationthrough all relevant supply chains (multiple DC, Cash & Carry etc.).
One major concern is that currently there are no UK industry standards fortravel tests or handling trials through the supply chain. Individual companiescarry out testing to a varying range of degrees, from almost nothing to verydetailed and comprehensive levels. However, with the range of supply chainsand differing standards at the various retailers, there is a need for co-ordinationof test methods and acceptance criteria. Currently there is some work being
Steen: “chap08” — 2006/4/27 — 18:31 — page 258 — #41
258 CARBONATED SOFT DRINKS
done by the UK Packaging Industry Research Association (www.piranet.com)to develop some test and acceptance criteria which may form the basis of a setof industry-wide guidelines. However, to facilitate and optimise future devel-opments and to ensure consistency across the industry and supply chain, thereis a need for a set of standard test criteria to be officially accepted by theIOP/BRC, which could then form part of the quality and acceptance criteria referredto above.
8.11 Putting it all together
It is vital to control secondary and tertiary packaging to the same degree as productand primary packaging. At each stage, it is important to ensure that documentedoperating procedures, which include key machine settings, are in place and opera-tors cannot change them without documenting who, why etc. For shrink wrappingthis includes tunnel temperatures, baffle control settings, machine speed. For stretchwrapping this includes wrap tension settings, machine speed and timing settings.
It is imperative to have agreed material specifications with suppliers, whichare not changed without prior notice. This includes purchasing changing to a newsupplier without successful trials. Any new supplier must have a positive audit andagreed specifications in place before they are used.
It is necessary to have agreed and documented pallet specifications for a cus-tomer acceptable pallet, which includes dimensions, overhang and wrap quality. Itis also necessary to ensure that the producing factory is aware of them and monitorsperformance.
Supply chains should be measured with a system in place to measure and monitortrends in reject loads at depots and customer deliveries. The system should be regu-larly reviewed for key issues, packs etc. Responsibility for adherence to standards,performance and improvements is owned jointly with the producing factory.
Customer feedback should be obtained regularly by visits to the distributioncentres, rather than head office, and their involvement in trials which can becontroversial if aimed at saving money.

Steen: “chap09” — 2006/4/27 — 18:31 — page 259 — #1
9 Production systemsDavid P. Steen
9.1 Introduction
If a container is to be filled efficiently then the complete filling line and othernecessary processes must be correctly designed. This is achieved through a brief.Such a brief could well take several weeks, or even months, to develop correctly.Questions such as what production is wanted now and in the future, the current salespattern and volume and what is expected in 10 years’ time need to be answered.Technology is continually advancing and consumers’ needs are constantly chang-ing. Any design specification must, by its very nature, be flexible. The factory oftoday is very different from the one of 50 or even 20 years ago. Likewise, the factoryof 20 years hence will probably bear little relation to what we have now.
The current trend appears to be ‘big is beautiful’. Large factories operated bylarge companies. Is this going to last or will we see the return of small companiesand/or factories dotted around the country to minimise distribution costs? All thatcan be done now is view the situation as any individual company sees it and usethat as the basis to progress.
In this chapter, the layouts of can lines, glass lines, both returnable and singletrip, and PET lines will be discussed. From this, each process operation, such assyrup preparation and water treatment, warehousing for incoming raw materials,packaging and outgoing goods, personnel requirements, will be developed into anidealised total factory layout. This involves considerations not only of productionprocesses, but also of people movement and facilities, material flows and hygieneconsiderations. Included will be considerations of inspection systems, both in lineand off line, line control systems and factory management systems. It is an attemptto provide a picture of how present and future factories could develop.
9.2 Philosophy of line layouts
Having first listed what and how much production is required, next comes thequestion of working out how many production lines are required and the outputat which each line should be rated. For low throughput applications, should thesebe produced inefficiently on high output lines, or should specifically designed so-called cottage industry lines be used? How much spare space needs to be kept fornew production lines using new technology, such as an aseptic filling line? Wouldsuch a line replace an existing production line or would it be incremental business?These are all questions, with a multitude of others, which must be addressed when
Steen: “chap09” — 2006/4/27 — 18:31 — page 260 — #2
260 CARBONATED SOFT DRINKS
a new factory rationalisation of existing factories or the annual review of currentproduction facilities are being considered or when the cash flow for the followingyear is being planned.
Some designers consider that conveyor buffering, so-called accumulation, isnot needed; others go to the extreme and put in great lengths of accumulatingconveyor. If a dedicated line is used, then it is possible to minimise accumulationwith a compact design such that the few operatives that are manning the line canaccess any problem immediately. This is then a form of accumulation in itself, asthe speed of response of the operative acts as the buffer so that production stoppagesare minimised. Accumulation is only present to ensure that the filler never stopsunless it has to. It is the prime mover in any production line, though in lines fedfrom an on line bottle blower it is often the bottle blower which is considered theline controller. To this end various designs of accumulating conveyor have beendeveloped over the years. A typical design is shown in Figure 9.1.
Machinery manufacturers are increasingly supplying plants in modular formusing standardised components to keep costs under control yet satisfy marketdemand. Such modularisation can include coupling the filler, capper, labeller intoone unit or adding a tray tiering unit to a wrapper. Each filling line has a definedmaximum output for a given beverage and bottle size. This could range from 5000to 120,000 containers/h. All lines in basic concept are similar in principle and thestructure of a typical PET bottle compact filling line is shown schematically inFigure 9.2.
It is vital that not only the filling line but also the package being filled are fullyconsidered within the design process. The package or its elements, be it the closure,decoration format or assembly into the shipper, are all designed to have minimumimpact on the whole filling line as the components are brought together by theconveying system. The packaging technologist needs to have a good appreciationof the engineering of the filling line so as to understand the aspects which affect theconveying of the components though the line. The efficient transfer of a packagefrom one machine to another, across dead plates, over slatted conveyors, roundbends in the plant layout, is vital to maintain the smooth flow of the line to operateat its designed capacity.
9.3 Glass bottle filling lines
A typical glass production line is shown in Figure 9.3. The first operation is tounload the empty bottles or crates onto a conveyor. For very low speed operationsthis is still done manually, but as this activity is very labour intensive, most modernproduction lines do this automatically. Returnable glass bottles are packed in plasticcrates, in 12s for 750 ml bottles and in 24s for small bottles, which have been stackedon the pallet to a pre-determined stacking pattern. The de-palletiser consists of agripper head which is lowered over the layer on the pallet. This gripper head eithergrips the sides of the pallet stack tightly or interlocks into the holes of the crate.The layer is then removed completely from the pallet onto a table where each layer
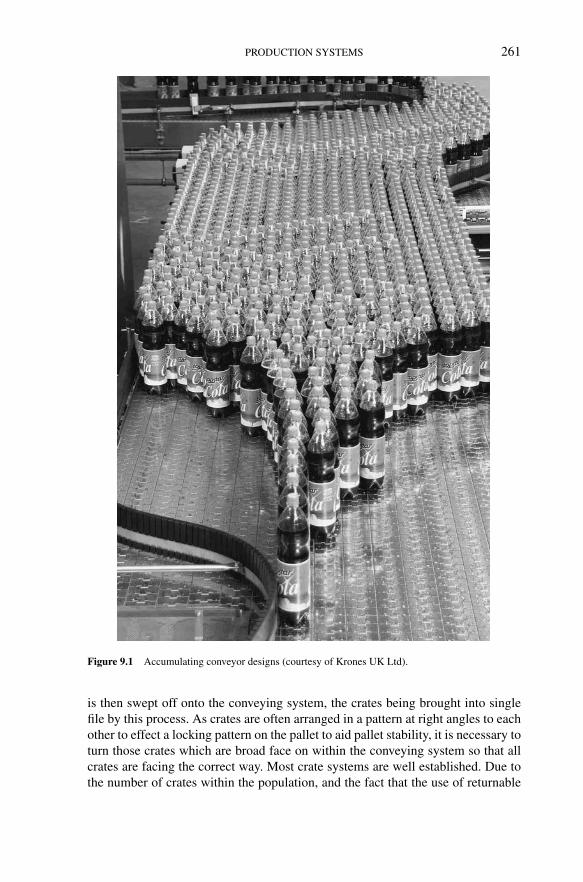
Steen: “chap09” — 2006/4/27 — 18:31 — page 261 — #3
PRODUCTION SYSTEMS 261
Figure 9.1 Accumulating conveyor designs (courtesy of Krones UK Ltd).
is then swept off onto the conveying system, the crates being brought into singlefile by this process. As crates are often arranged in a pattern at right angles to eachother to effect a locking pattern on the pallet to aid pallet stability, it is necessary toturn those crates which are broad face on within the conveying system so that allcrates are facing the correct way. Most crate systems are well established. Due tothe number of crates within the population, and the fact that the use of returnable

Steen: “chap09” — 2006/4/27 — 18:31 — page 262 — #4
262 CARBONATED SOFT DRINKS
20
17
1
23
4
5
6
7
8
9
11
10
12
13
1415
16
18
19
1 Preform loading system 6 Airveyor transfer to filler 11 Conveying system 16 Pack conveyors2 Preform feed unit 7 Bottle filler and capper 12 Plastic labeller 17 Handle applicator3 Preformcheck unit 8 Cap feed 13 Laser coder 18 Palletiser4 Blow moulder 9 Fill level detection unit 14 Label inspector 19 Pallet conveyor5 PET bottle inspector 10 CIP system 15 Shrink wrapper 20 Stretch wrapper
Figure 9.2 Structure of a typical PET bottle compact filling line (courtesy of Krones UK Ltd).
Depalletiser Decrater Sorter Decapper
Washer
Palletmagazine
Palletiser
Cratewasher
Recrater Inspector
Emptybottle
inspector (EBI)
Crown bottles
Filler
Capperor crowner
Rejects
Rejects
Rejects
Rejectsold caps Caustic
Steam
Water
Caps orcrowns
Product
Labeller
Labels
Pallets Crates
Bottles
Empty bottles and boxes palletised
Figure 9.3 Typical returnable glass production line schematic.

Steen: “chap09” — 2006/4/27 — 18:31 — page 263 — #5
PRODUCTION SYSTEMS 263
glass bottles is declining, it is not often economically feasible to re-design andoptimise the number of cases per pallet and to carry out lightweighting to minimisedistribution costs or reduce the risk of bottle damage within the crates by keepingbottle movement in the crate pocket to a minimum.
For single trip containers these are mostly delivered to the bottler’s factorypalletised. The bottles are closely packed on pallets in layers with trays or layerpads between each layer. By this means bottle-to-bottle contact on the neck of thebottle is avoided and the weight of each layer is spread more evenly over the bottlesthus minimising axial load problems. Two main types of de-palletiser are in use.These are the lift off and sweeper types. On the lift off de-palletiser, the layer ofbottles is normally gripped by the neck over the whole layer. For example, if a layerof bottles on the pallet is in a 14 × 14 format, then 14 rows of grippers are loweredonto the bottles and activated, often pneumatically. The gripped bottles are thenelevated and swung onto a discharge table where they are conveyed away to sometype of bottle combiner, which brings bottles into single file or how many bottleswide the conveying system is designed to operate. The other, now more common,type of de-palletiser operates with a ‘sweep off’ action. The pallet is brought intoposition on an elevating platform. The platform elevates the pallet until the firstlayer of bottles is flush with the outfeed conveyor. The top layer pad is removedeither manually or automatically and stacked in a pile. After this action, the rowof bottles is swept off onto the outfeed conveyor. The next layer of bottles is thenelevated into position until the pallet is fully emptied. At this point, the pallet islowered and conveyed to an empty pallet stacker. Newer de-palletiser designs userobots for this purpose, as they are easily re-programmed for different application,and hence are a more flexible option in this era of constant development. A typicalrobot is shown in Figure 9.4.
The maximisation of the number of bottles per pallet involves carefully design-ing the bottle to suit, not only in terms of bottles per layer but also the number oflayers. This will also depend on the size of pallet in use, whether the UK standardof 1200 mm × 1000 mm or the European standard of 1200 mm × 800 mm. Suchconsiderations also include final packs sizes and standardisation of bottle diameterson filling lines to minimise change overs .
In the empty bottle sorting area, prior to bottle washing, it is normal to inspectthe bottle to ensure that it is the bottle required and remove any other manufacturers’containers. From the combiner, bottles are fed to a bottle washer/rinser, which willsimply rinse the bottles using treated water, rinse using ionised air, or in the caseof returnable bottles, fully wash. For sensitive products, ozone treatment is oftenused. The aim of this process is to minimise microbiological contamination of theproduct to be packaged by the container, ensuring that no extraneous objects suchas pieces of glass, etc. are present, and removing any old labels, ink jet coding andsmall particulates such as sand and dust. The washing process must relate to thepurpose to which the bottle is to be put. For example, the risks associated with a lowpreservative content product in a glass bottle will be higher than those for a highpreservative level product. It is not economical to over engineer a process when itis not required.
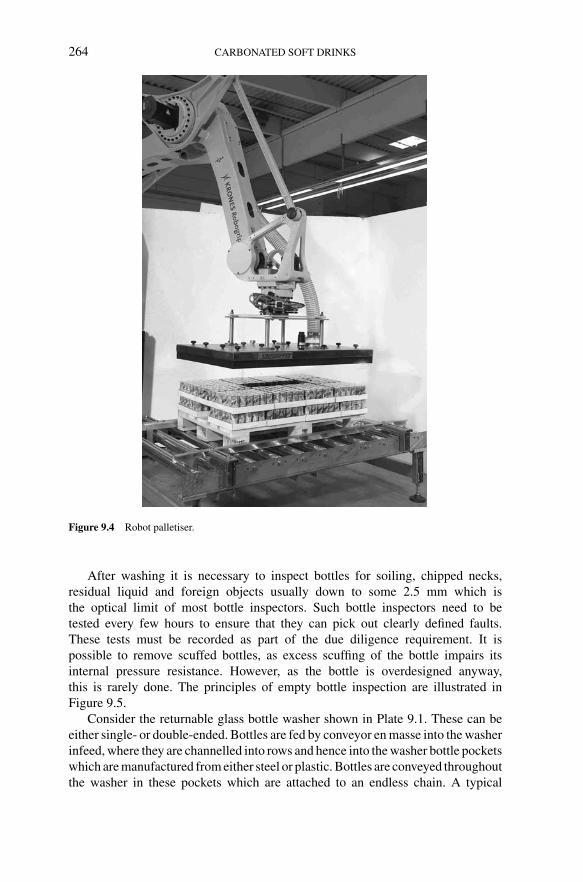
Steen: “chap09” — 2006/4/27 — 18:31 — page 264 — #6
264 CARBONATED SOFT DRINKS
Figure 9.4 Robot palletiser.
After washing it is necessary to inspect bottles for soiling, chipped necks,residual liquid and foreign objects usually down to some 2.5 mm which isthe optical limit of most bottle inspectors. Such bottle inspectors need to betested every few hours to ensure that they can pick out clearly defined faults.These tests must be recorded as part of the due diligence requirement. It ispossible to remove scuffed bottles, as excess scuffing of the bottle impairs itsinternal pressure resistance. However, as the bottle is overdesigned anyway,this is rarely done. The principles of empty bottle inspection are illustrated inFigure 9.5.
Consider the returnable glass bottle washer shown in Plate 9.1. These can beeither single- or double-ended. Bottles are fed by conveyor en masse into the washerinfeed, where they are channelled into rows and hence into the washer bottle pocketswhich are manufactured from either steel or plastic. Bottles are conveyed throughoutthe washer in these pockets which are attached to an endless chain. A typical
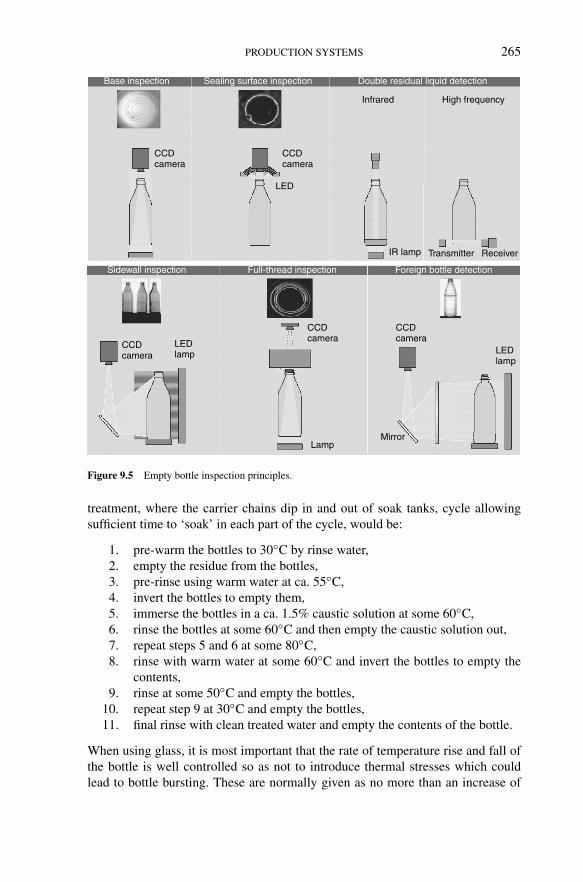
Steen: “chap09” — 2006/4/27 — 18:31 — page 265 — #7
PRODUCTION SYSTEMS 265
Base inspection Sealing surface inspection Double residual liquid detection
Sidewall inspection Full-thread inspection Foreign bottle detection
CCDcamera
CCDcamera
CCDcamera
CCDcamera
CCDcamera
LED
Infrared High frequency
LEDlamp LED
lamp
LampMirror
IR lamp Transmitter Receiver
Figure 9.5 Empty bottle inspection principles.
treatment, where the carrier chains dip in and out of soak tanks, cycle allowingsufficient time to ‘soak’ in each part of the cycle, would be:
1. pre-warm the bottles to 30◦C by rinse water,2. empty the residue from the bottles,3. pre-rinse using warm water at ca. 55◦C,4. invert the bottles to empty them,5. immerse the bottles in a ca. 1.5% caustic solution at some 60◦C,6. rinse the bottles at some 60◦C and then empty the caustic solution out,7. repeat steps 5 and 6 at some 80◦C,8. rinse with warm water at some 60◦C and invert the bottles to empty the
contents,9. rinse at some 50◦C and empty the bottles,
10. repeat step 9 at 30◦C and empty the bottles,11. final rinse with clean treated water and empty the contents of the bottle.
When using glass, it is most important that the rate of temperature rise and fall ofthe bottle is well controlled so as not to introduce thermal stresses which couldlead to bottle bursting. These are normally given as no more than an increase of

Steen: “chap09” — 2006/4/27 — 18:31 — page 266 — #8
266 CARBONATED SOFT DRINKS
Rotary spray nozzle
Figure 9.6 Bottle jetting action by rotating cross-flow spray nozzles.
42◦C or a decrease of 28◦C in any individual step. Within the washer old labelsare removed during the soak operations and conveyed away from the machine to acompactor. Pumps circulate caustic lye, which assists the flushing of label materialinto the drum filters, thus minimising the build up of paper pulp in the soakingbaths. A sluice system allows broken glass to be deposited into bins. Bottles arejet washed internally by rotating cross-flow spray nozzles, the bottles being self-centred in the pockets to maximise this jetting action within the bottle, as shown inFigure 9.6. The caustic lye is normally delivered by tanker and pumped to a storagetank, such that the caustic can be metered to the washer on demand.
Whilst the bottles are being washed, crates go through an ultrasonic case washerthat removes any debris and attempts to keep the crates in reasonable condition.After the washer the bottles are fed by conveyor through an empty bottle inspector tothe filler/capper. Closures are fed to the capper by pneumatic transport in a pipe andseparation through a centrifugal separator or by belt conveyor to the capper hopper.The latter system is preferred as less damage to the cap is likely, especially to thetamper evident band. Often the patch labeller is monoblocked in this operation.In the filler it is important to thoroughly jet wash the bottle neck prior to cappingto avoid syrup sticking. Failure to do so normally means closures that cannot beundone without applying higher torques than most people are capable of and thesubsequent risk of an accident. After labelling, the bottles and crates meet up and thebottles are re-crated and subsequently palletised. Even though the returnable glasswill remain within the operations of the bottling company, bar codes are normallyattached to pallet lots to aid traceability.
For single-trip glass bottles, a rinser replaces the washer and packing is doneeither on a wraparound shrink wrapper or packed into a case prior to palletisation.All secondary packs are bar coded. With all glass handling care has to be taken to
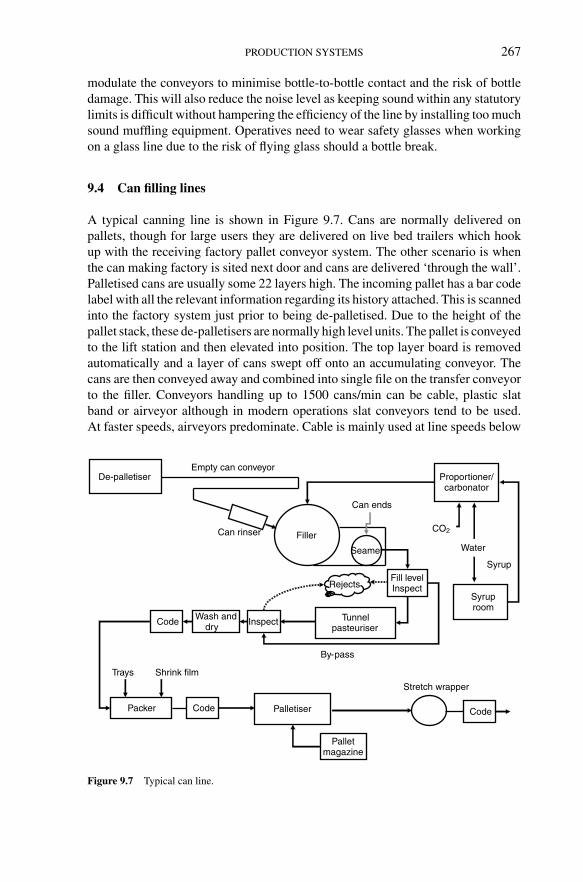
Steen: “chap09” — 2006/4/27 — 18:31 — page 267 — #9
PRODUCTION SYSTEMS 267
modulate the conveyors to minimise bottle-to-bottle contact and the risk of bottledamage. This will also reduce the noise level as keeping sound within any statutorylimits is difficult without hampering the efficiency of the line by installing too muchsound muffling equipment. Operatives need to wear safety glasses when workingon a glass line due to the risk of flying glass should a bottle break.
9.4 Can filling lines
A typical canning line is shown in Figure 9.7. Cans are normally delivered onpallets, though for large users they are delivered on live bed trailers which hookup with the receiving factory pallet conveyor system. The other scenario is whenthe can making factory is sited next door and cans are delivered ‘through the wall’.Palletised cans are usually some 22 layers high. The incoming pallet has a bar codelabel with all the relevant information regarding its history attached. This is scannedinto the factory system just prior to being de-palletised. Due to the height of thepallet stack, these de-palletisers are normally high level units. The pallet is conveyedto the lift station and then elevated into position. The top layer board is removedautomatically and a layer of cans swept off onto an accumulating conveyor. Thecans are then conveyed away and combined into single file on the transfer conveyorto the filler. Conveyors handling up to 1500 cans/min can be cable, plastic slatband or airveyor although in modern operations slat conveyors tend to be used.At faster speeds, airveyors predominate. Cable is mainly used at line speeds below
De-palletiser
Filler
Seamer
Tunnelpasteuriser
Packer Palletiser
Empty can conveyorProportioner/carbonator
Syruproom
CO2
Water
Syrup
Stretch wrapper
Inspect
Fill levelInspectRejects
Palletmagazine
Trays Shrink film
Can ends
Can rinser
Wash and dryCode
By-pass
Code Code
Figure 9.7 Typical can line.
Steen: “chap09” — 2006/4/27 — 18:31 — page 268 — #10
268 CARBONATED SOFT DRINKS
1000 cans/min. Cans are then conveyed to a rinser placed on the down-chute tothe filler. In this gravity rinser, normally at a decline of 30–40◦, cans are internallysprayed with filtered water to remove any possible debris that may have collected inthe can since manufacture. Sufficient length is required to ensure all the rinse waterdrains from the can. The excess water is normally filtered and recycled. The designof these units is specialised to ensure that efficient rinsing occurs without any candamage. Can damage has to be carefully considered, as the light weighting that hasgone on over the last few years has made the side walls susceptible to denting. Allconveyor systems must be designed to take this into account, this includes guiderails, minimal accumulation pressure and dead plate transfers between conveyors.The filler and seamer have been considered in Chapter 6. The carbonator is usuallysited just behind the filler. Ends come in bags, each bag identifiable by a bar code,which are stored on pallets. Automatic end feeding units are available. Quite oftenthe system uses a scissor lift to enable the operator to easily feed the ends into theseamer whilst attending to the main duty of operating the filler. After seaming, thecans are conveyed through a fill check unit, which often incorporates a valve checkmonitor. Any fill level problems are immediately highlighted, allowing remedialaction to be taken. Often an accumulating conveyor is installed downstream givingup to 10 min buffer. Cans then go direct to the tunnel pasteuriser, as describedin Chapter 4, or bypassing this, direct to coding. A further level check, to see ifthe pasteurising process has given rise to any leaking cans and packing may beimplemented. Careful rinsing and air knife drying of the cans will minimise anyproblems associated with end corrosion. Finally, cans are palletised, often withouta layer pad, and very often with no stretch wrap, and delivered to the warehouse.A quality control station is normally sited adjacent to the filler, where seam checks,as well as the normal product tests, are carried out.
9.5 PET bottle filling lines
Consideration of the optimum layout for a carbonated beverage PET bottle fillingline includes the bottle sizes or a design for just one bottle size. Bottle diameter andhow much accumulation should be built into the design also need to be incorporated.
The above list is by no means exhaustive, and a multiplicity of layoutpossibilities exists. A typical design is shown in Figure 9.2. Some modern designs,based primarily on one bottle size, operate with very little bottle accumulation. Forthe throughput required, they tend to be overspecified in terms of each machine out-put. The layout is very compact such that each person working on the line can seehow each individual machine is operating and, if necessary, can quickly interveneif a problem arises. Other designs are more conventional. They include significantaccumulation between the filler and labeller, labeller and packer and between thepacker and the palletiser. Where PET bottles are blow moulded directly onto thefilling line, the latest philosophy is to buffer the bottles between units. For smallbottles up to 500 ml capacity, this is primarily done with empty bottle silos holdingseveral hours production, whilst for large bottles they are either buffered on line
Steen: “chap09” — 2006/4/27 — 18:31 — page 269 — #11
PRODUCTION SYSTEMS 269
with a bottle accumulator of order 10 min capacity or the bottles are palletisedand then de-palletised onto the filling line. Buffering on an airveyor can only beconsidered for short time filler stoppages up to a few minutes at most. Whilst afiller can start virtually instantaneously after a stoppage, a blow moulder has tofirst reach its operating temperature, even though during a stoppage it may only goback to half heat conditions to allow for more efficient re-starts. Any stoppage ofthe blow moulder will inevitably cause preform and bottle losses. As this machineis probably one of the most efficient on any bottling line, it should not be stoppedunless essential. It should be considered the lead machine for the line.
In the early days of stretch blow moulding, blow moulder and filler were rarelydirectly coupled, primarily due to the infancy of airveyors, which regularly jammed,and the fact that the blow moulder rarely ran as fast as the filler. Often this jammingwas caused by electrostatic effects. During the early 1980s, filling lines had theblow moulder feeding either a silo or a palletiser. The blow moulder would run24 h/day, 7 days/week at some 4000 bottles/h. The filling line would, on 2 l bottles,run at 8000 bottles/day on two shifts. The overall efficiency of blow mouldingwould be some 90% against 60% for the filling line in total. As the output of blowmoulders increased, filling lines tended to have the blow moulder directly coupledusing an airveyor to provide minimal buffer. It is not feasible to feed both a silo anda filling line, as bottles tend to shrink during storage. New and older bottles willhave differing fill levels, a situation often not appreciated by marketing departmentswho evaluate consumer reactions.
Silos are designed to minimise the risk of bottles being crushed; they shouldallow a good distribution of bottles within the silo with almost complete emptyingbeing possible. Silos employ catch nets within to lessen bottle damage. Such asilo design allows blow moulding to take place 24 h/day if required to keep a twoshift filling line operation fully operational. Any change of bottle size or preformcolour will not affect filler downtime as that will run off the silo whilst the blowmoulder produces the new bottle to another silo. From a silo, bottles are fed toan unscrambler which produces an outfeed of bottles in single file to an airveyor.As the risk of bottle contamination within the silo exists, all bottles need to be rinsedprior to filling although silo sites must be kept as clean as possible to minimise suchcontamination.
Bottle rinsers, often mono-blocked to the filler/capper, are normally rotarymachines that inject filtered water into the bottles in a prescribed manner to ensuregood rinsing of all the bottle internal surfaces. Bottles are usually fed to the rinser byairveyor supported on their neck rings. They are transferred to the infeed worm andstarwheel of the rinser with the neck gripped and held by this throughout the wholerinsing operation. The bottles are rotated into a vertical upturned position and rinsed,with pre-set cycle time for jetting with a cleaning agent, followed by sterile waterjetting and draining. The timing of these can be made variable, depending on thespeed of the line and the contact times required. These units have a clean-in-placefacility using dummy bottles.
After filling and bottle drying, the bottles are labelled. It is necessary toensure that the bottles are rigid during labelling in that the headspace pressure
Steen: “chap09” — 2006/4/27 — 18:31 — page 270 — #12
270 CARBONATED SOFT DRINKS
has equilibrated with the product carbonation volumes. On mono-blocked units, abottle ‘knocker’ is sometimes used for this purpose. The labels used are primarilyplastic, as this allows for bottle creep with the small amount of give in the plasticthat paper does not have. The packaging end of the line after labelling is increas-ingly becoming more automated. A wraparound shrink wrapper using film only,film and pad or film and tray is usually included in the line. For small bottles,a multi-pack shrink wrapper is often installed prior to this. Such operations arediscussed more fully in Chapter 6. As the multi-packer is not used all the time, itis necessary to have divert systems installed in the conveyor system, as probablyfor a good percentage of the time it will not be used. For larger bottles 2 × 2-land 3 × 2-l sleeved multi-packs with handles can now be produced automaticallyon line using sleeving units. Again these are only used for a small percentage ofany lines output and must be on divert. The use of display pallets by the multiplesfor major brands, using half pallet dollies, has also been automated often usingrobotics. Such a packing operation would be as a bleed off from the main palletiser,which is often also a robot superseding the more traditional palletisers. Followingpalletisation, the pallet lots are then stretch wrapped and delivered either by con-veyor, automated guidance vehicle (AGV) or fork lift truck (FLT) to the warehouse.During this process, the bottle will have been coded, as will the pack and the pal-let. This gives full traceability throughout the supply chain. A degree of bufferingbetween the packaging operations is required. Run out space after a shrink wrapperis needed to ensure that no packs back up into the heat tunnel and consequently‘cook’. Easy divert systems are needed depending on whether a multi-pack option ischosen. Often pack conveyors elevate and then descend to allow personnel ingressinto the area. One of the problems with the increase in multi-pack options is thespace taken by these machines and associated conveyors. In many installationsinsufficient space has been allocated for such possible plant when the line was orig-inally laid out resulting in rather tight operating conditions and subsequent loss ofefficiency.
Bottle design needs to be compatible with good filling and it needs to be opti-mised in terms of bottles per case on a pallet without overhang or underhang.Computer programmes are available that determine optimum pallet patterns for agiven traded unit and bottle size. The shape of the bottle can affect filling perfor-mance. Any discontinuity in the bottle can cause turbulence and fobbing duringfilling. The packaging technologist, preform supplier, blow moulder supplier andthe engineering manager need to work closely together to realise an optimumsolution.
9.6 Conveying systems
The four main types of conveyors used within the soft drinks industry are airveyors,slat, pack and pallet conveyors. They are inverter controlled to suit the conditionsthat may occur and can ramp up and down to suit on a fully programmable logiccontroller (plc) controlled line.
Steen: “chap09” — 2006/4/27 — 18:31 — page 271 — #13
PRODUCTION SYSTEMS 271
Airveyors have developed significantly since they first came into being some30 years ago. The systems rely on conveying a bottle on its neck ring. The problemis they can jack knife and lock in position. Problems can also occur due to theelectrostatic forces present in the PET. This was apparent in the early systemswhere water jets played on the bottles. With the improved PCO neck finish and thelatest designs of neck guides on the airveyors, this is largely overcome. Airveyorsconvey bottles that are neck supported, by applying low pressure, high volumeair jets to provide the driving force to convey them, as shown in Plate 9.2. The airpressure is generated by small centrifugal fans which blow air into a rectangular ductthat have louvres punched into the top and side faces. Due to the transport methodsuch systems have great design flexibility. The layout allows for the bottles to beconveyed above personnel level to provide good access and increased productionspace. Vertical elevation and decline units are available. As most bottles now use the28 mm PCO neck finish, there is rarely a need to change this feature of the conveyor.However, the plastic neck ring support guides can be manually or automaticallyadjusted to suit a variety of bottle neck diameters if so desired. Lanes can becombined and split by gate arrangements. Similarly the bottle body guide rails,which have low friction guide material, can be either manually or automaticallyadjusted to suit different diameters and shapes. A degree of accumulation can beachieved using airveyors, as queuing pressures are low. This is enhanced due tothe high velocities that can be achieved on airveyors, any gaps that occur beingeasily filled. Air filtration on the infeed to the plenum chamber of the airveyorensures minimal problems due to air contamination affecting the bottles. Dust inthe neck of a bottle will promote product fobbing during filling. The whole systemallows controlled line pressure at all times causing no discernable bottle damage.Aseptic designs have now been developed which include air filtration to 0.3 µm,CIP interfacing and full conveyor covers.
The choice of slat type varies with application. For glass bottles it is normalto use steel slat whereas for the softer material of PET containers, plastic slat isused. A variety of suppliers have a multiplicity of options available. The key tosuccess is to ensure that the conveyors are well designed and that the belt is alwayscontrolled. Slat lube in moderation is a necessity. Before packing to cardboard traysor pads, it is always necessary to wash the lubricant from PET bottles to minimisethe risk of stress cracking, which is enhanced by the presence of solidified lubricantthat is reactivated in a humid environment. If the floor area is correctly designed,drainage drip trays to collect excess lubricant are probably not needed. Dry slatlube is sometimes used, whilst slat manufacturers claim that certain plastic beltsare suitable for lubricant-free conveying. Care must be taken with the use of dry slatlube as any that falls on the floor will make this area very slippery and a possibledanger area for operatives. This can only be ascertained by trials and tests with themanufacturers concerned. The type of slat to be used needs to be proven before use.So many designs exist for different applications. For bends magnetic slat band areoften used. Often a plant is provided with a central lubrication system that is pumpedaround the factory with nozzles fitted to each conveyor section. Due to the lubricant,the design of the conveyors needs to allow ease of cleaning. In older designs mould

Steen: “chap09” — 2006/4/27 — 18:31 — page 272 — #14
272 CARBONATED SOFT DRINKS
growth was often seen. The more open modern designs overcome this. However,it is important to clean conveyors internally as part of the regular factory schedule.The automatic rejection of fallen bottles is included in most system designs, eitherby putting guide rails above the bottle diameter or using angled conveyors andgravity.
The actual design of a bottle conveyor buffer falls into three basic categories.Accumulation exists on a conveyor belt which should normally only run some 50%full. Alternatively, the buffer can be designed where the containers are fed onto aconveyor at right angles to the flow. To outfeed containers back onto the conveyingsystem, the conveying direction is reversed. The other type is to utilise part ofthe conveying system that only fills up as accumulation when the containers backinto it. Each system has its own pros and cons. Often the table consists of severalbelts all individually controlled by an inverter, such that they can run at differingspeeds and so minimise any accumulation pressure that normally builds up in suchsystems.
Tray conveyors ideally use a slat rather than a roller bed as less vibration whichcould affect pack stability is imparted to the pack. Some systems still use beltconveyors, which though good with regard to pack stability do not give muchaccumulation unless sections are designed with very short lengths when dead platetransfers may cause problems. Shrink wrap packs need to be kept tight, and vibrationcan easily loosen these leaving skewed packs which will cause problems in thepalletiser as well as through the distribution chain. Whilst such conveyors do notoffer the buffering capability of rollers integrity of the secondary packaging is ofprime consideration. However, small roller slat is now available which gives thebest of both worlds. When a conveyor section becomes full due to an upstreamstoppage, this will stop when the packs build back to the sensor. This is completedthroughout the system until eventually the filler will have to stop. The amount ofrequired accumulation is normally in the region of 5 min, this being dependent onthe palletiser breakdown characteristics. The palletiser must be capable of rampingup to clear any accumulated packs in the system, thereby leaving space for futurebuffering.
Pallet conveyors need to allow accumulation and are often designed with slip-ping rollers or in short sections that transfer the pallet from section to section. Softstart is a necessary requirement as otherwise the stretch wrap around the pallet willloosen giving rise to possible pallet collapse on those palletised loads that are notwell interlocked.
9.7 Inspection systems
Within the EU, all packages must be marked with the weight or volume of thecontents. In the UK, they must conform to the three rules contained within theWeights and Measures Act 1985 and secondary legislation including the Weightsand Measures (Packaged Goods) Regulations 1986. These are currently beingreviewed. Conformance to these regulations, denoted by an ‘e’ mark on the label,
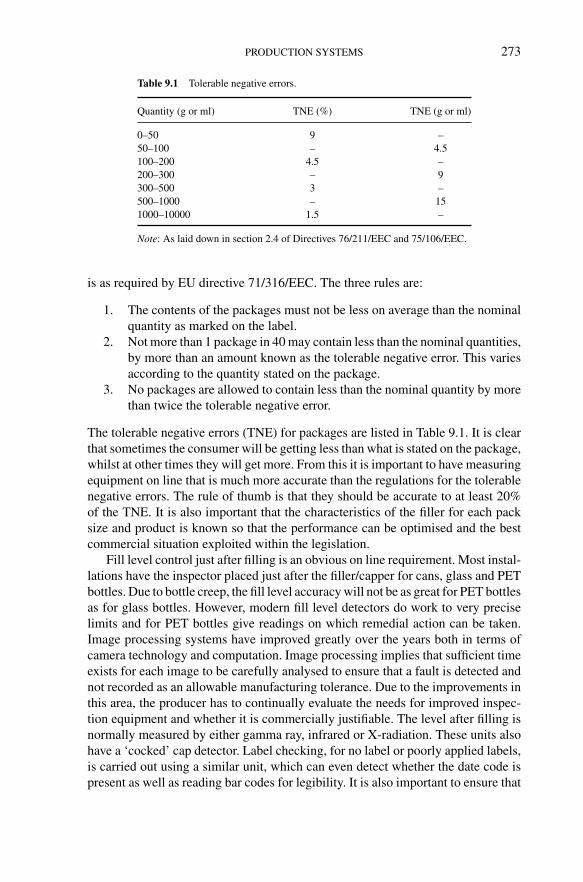
Steen: “chap09” — 2006/4/27 — 18:31 — page 273 — #15
PRODUCTION SYSTEMS 273
Table 9.1 Tolerable negative errors.
Quantity (g or ml) TNE (%) TNE (g or ml)
0–50 9 –50–100 – 4.5100–200 4.5 –200–300 – 9300–500 3 –500–1000 – 151000–10000 1.5 –
Note: As laid down in section 2.4 of Directives 76/211/EEC and 75/106/EEC.
is as required by EU directive 71/316/EEC. The three rules are:
1. The contents of the packages must not be less on average than the nominalquantity as marked on the label.
2. Not more than 1 package in 40 may contain less than the nominal quantities,by more than an amount known as the tolerable negative error. This variesaccording to the quantity stated on the package.
3. No packages are allowed to contain less than the nominal quantity by morethan twice the tolerable negative error.
The tolerable negative errors (TNE) for packages are listed in Table 9.1. It is clearthat sometimes the consumer will be getting less than what is stated on the package,whilst at other times they will get more. From this it is important to have measuringequipment on line that is much more accurate than the regulations for the tolerablenegative errors. The rule of thumb is that they should be accurate to at least 20%of the TNE. It is also important that the characteristics of the filler for each packsize and product is known so that the performance can be optimised and the bestcommercial situation exploited within the legislation.
Fill level control just after filling is an obvious on line requirement. Most instal-lations have the inspector placed just after the filler/capper for cans, glass and PETbottles. Due to bottle creep, the fill level accuracy will not be as great for PET bottlesas for glass bottles. However, modern fill level detectors do work to very preciselimits and for PET bottles give readings on which remedial action can be taken.Image processing systems have improved greatly over the years both in terms ofcamera technology and computation. Image processing implies that sufficient timeexists for each image to be carefully analysed to ensure that a fault is detected andnot recorded as an allowable manufacturing tolerance. Due to the improvements inthis area, the producer has to continually evaluate the needs for improved inspec-tion equipment and whether it is commercially justifiable. The level after filling isnormally measured by either gamma ray, infrared or X-radiation. These units alsohave a ‘cocked’ cap detector. Label checking, for no label or poorly applied labels,is carried out using a similar unit, which can even detect whether the date code ispresent as well as reading bar codes for legibility. It is also important to ensure that

Steen: “chap09” — 2006/4/27 — 18:31 — page 274 — #16
274 CARBONATED SOFT DRINKS
the correct number of bottles is packed into a case, which can be done by photocells.For fill level control, up to six cameras and other sensors such as infrared, X-ray orradiometric detection can be integrated into the system. Such units can also monitorindividual filling valve performance. Can fill levels are traditionally inspected usinggamma ray technology. These provide very accurate readings but have the down-side of requiring radiological protection. X-ray units are being introduced whichgo some way to alleviate this problem.
For a returnable glass line, great care must be taken to ensure no risk to theconsumer. The returned crates can be inspected for the number of bottles per case,foreign bottles and bottles on their side, the latter causing problems at the de-crater.Such systems use real-time image processing with a CCD camera based on inciden-tal and transmitted light and ultrasound measurement to evaluate the height profile.New glass is supplied under an agreed technical specification that is regularlyreviewed and the suppliers audited. Returned glass has to be thoroughly washedand then inspected using an empty bottle inspector as illustrated in Figure 9.5. Dueto the associated possible risks, such a machine must be of a modern specifica-tion and regularly maintained. Such machines use CCD cameras to detect chippednecks, foreign bodies within the bottle, foreign bottles and, a double check withboth infrared and high frequency, for any residual liquid within the base of thebottle. These view internally through the neck of the bottle, with a separate unitbeing used to inspect the bottle for external faults.
Camera systems exist to check filled glass bottles for fragments as small as0.5 mm × 0.5 mm × 0.5 mm even in coloured bottles. Preforms can be checkedprior to use when blow moulding on line. Filled PET bottles can be checked forleaks using a system that guides the containers by a belt drive that exerts a preciselymeasured pressure. If there is a leak in the bottle, gas escapes from the headspace andthe fill level in the bottle rises. If the bottle is leakproof, the fill level remains almostthe same because the gas is only slightly compressed. Even the smallest leakagein a plastic container can be detected by comparative fill level measurements. It isnot always the bottle that leaks as this is often associated with a capping problem.Such a system can, if several bottles leak, highlight quick remedial action beforethe problem gets out of control. Filled bottle inspection can now achieve detectiondown to particle sizes of 0.5 mm × 0.5 mm × 0.5 mm, which is important for glassbottle filling where the possibility of small glass fragments will always exist withinthe filled product. This is achieved through the use of high resolution camerasviewing through the bottle base, strategically placed lighting and modern imageprocessing technology.
Working with systems such as Six Sigma, the number of defects can be analysedand minimised, with the ultimate objective being zero defects.
9.8 Breakdown characteristics
If the filler never stops, maximum output is achieved from a given line. The break-down characteristics of a production line determine how well it will perform. Major

Steen: “chap09” — 2006/4/27 — 18:31 — page 275 — #17
PRODUCTION SYSTEMS 275
0 10 20 30 40 50 60 70 80 90 100
1
2
3
4
5
6
7
Freq
uenc
y (%
)
Duration of individual stoppages (s)
Total of all stoppages 5%
Meantime of breakdown
Figure 9.8 Typical labelling breakdown profile.
breakdowns are rarely of interest as these occur infrequently and no amount ofbuffering would resolve this issue. If major breakdowns occur regularly on a fillingline, then the problem must be resolved by detailed study of the machine causingthe problems and then acting on these results. It is the short duration breakdownsthat are the norm. A typical machine breakdown profile for a labeller is shown inFigure 9.8. A new line, or even if an old line is to be revamped, should be ratedas per Figure 9.9 with the filler rated at 100%, and the minimum percentage ratingfigures given for each plant item. For products and packaging that are difficult tohandle, filling line equipment that is not as reliable as one would like due to ageand condition, or for complex or new technology where the risk of short dura-tion breakdowns are likely, higher ratings should be used. The design should beput through a simulation programme such as Simple ++ (now Technomatix eM),Automod, Arena, Modsim, Taylor II or Witness. These programmes require data onthe short-term breakdown characteristics of each item of plant on the line. Such datais obtained from either the experience of the machine supplier or from monitoringthe actual frequency of in plant breakdowns. This is ideally done by managementinformation systems which build up a history of breakdowns on each machine orby attaching a data logger to the PLC on the machine. Otherwise the informationhas to be gleaned from painstakingly recording all breakdowns manually, a methodthat, by its very nature, is inaccurate as it is dependent on writing down each andevery machine fault with the cause. Experience shows that the data so obtained maybe of little value as recording every stoppage of a few seconds is acceptable for afew minutes but very tedious after an hour. Such data has to be collected automat-ically and suitably recorded and analysed. By feeding this data into a simulationprogramme, the effect of buffer capacity between machines can then be obtained.
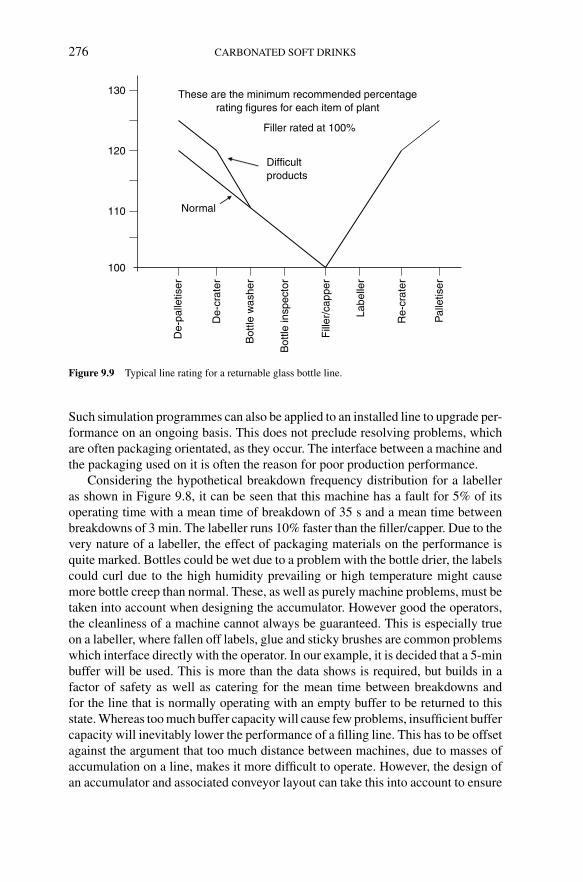
Steen: “chap09” — 2006/4/27 — 18:31 — page 276 — #18
276 CARBONATED SOFT DRINKS
These are the minimum recommended percentagerating figures for each item of plant
Filler rated at 100%
100
110
120
130
De-
palle
tiser
De-
crat
er
Bot
tle w
ashe
r
Bot
tle in
spec
tor
Fill
er/c
appe
r
Labe
ller
Re-
crat
er
Pal
letis
er
Normal
Difficultproducts
Figure 9.9 Typical line rating for a returnable glass bottle line.
Such simulation programmes can also be applied to an installed line to upgrade per-formance on an ongoing basis. This does not preclude resolving problems, whichare often packaging orientated, as they occur. The interface between a machine andthe packaging used on it is often the reason for poor production performance.
Considering the hypothetical breakdown frequency distribution for a labelleras shown in Figure 9.8, it can be seen that this machine has a fault for 5% of itsoperating time with a mean time of breakdown of 35 s and a mean time betweenbreakdowns of 3 min. The labeller runs 10% faster than the filler/capper. Due to thevery nature of a labeller, the effect of packaging materials on the performance isquite marked. Bottles could be wet due to a problem with the bottle drier, the labelscould curl due to the high humidity prevailing or high temperature might causemore bottle creep than normal. These, as well as purely machine problems, must betaken into account when designing the accumulator. However good the operators,the cleanliness of a machine cannot always be guaranteed. This is especially trueon a labeller, where fallen off labels, glue and sticky brushes are common problemswhich interface directly with the operator. In our example, it is decided that a 5-minbuffer will be used. This is more than the data shows is required, but builds in afactor of safety as well as catering for the mean time between breakdowns andfor the line that is normally operating with an empty buffer to be returned to thisstate. Whereas too much buffer capacity will cause few problems, insufficient buffercapacity will inevitably lower the performance of a filling line. This has to be offsetagainst the argument that too much distance between machines, due to masses ofaccumulation on a line, makes it more difficult to operate. However, the design ofan accumulator and associated conveyor layout can take this into account to ensure
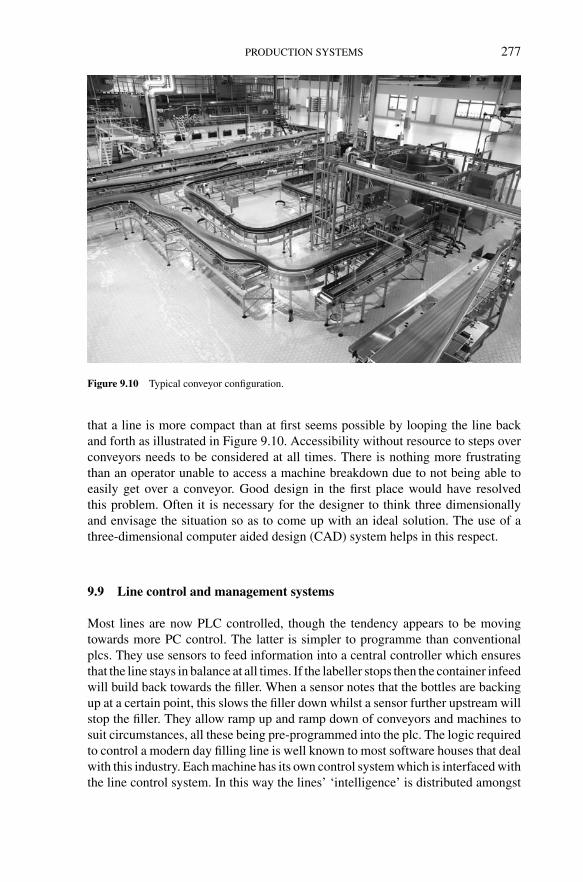
Steen: “chap09” — 2006/4/27 — 18:31 — page 277 — #19
PRODUCTION SYSTEMS 277
Figure 9.10 Typical conveyor configuration.
that a line is more compact than at first seems possible by looping the line backand forth as illustrated in Figure 9.10. Accessibility without resource to steps overconveyors needs to be considered at all times. There is nothing more frustratingthan an operator unable to access a machine breakdown due to not being able toeasily get over a conveyor. Good design in the first place would have resolvedthis problem. Often it is necessary for the designer to think three dimensionallyand envisage the situation so as to come up with an ideal solution. The use of athree-dimensional computer aided design (CAD) system helps in this respect.
9.9 Line control and management systems
Most lines are now PLC controlled, though the tendency appears to be movingtowards more PC control. The latter is simpler to programme than conventionalplcs. They use sensors to feed information into a central controller which ensuresthat the line stays in balance at all times. If the labeller stops then the container infeedwill build back towards the filler. When a sensor notes that the bottles are backingup at a certain point, this slows the filler down whilst a sensor further upstream willstop the filler. They allow ramp up and ramp down of conveyors and machines tosuit circumstances, all these being pre-programmed into the plc. The logic requiredto control a modern day filling line is well known to most software houses that dealwith this industry. Each machine has its own control system which is interfaced withthe line control system. In this way the lines’ ‘intelligence’ is distributed amongst
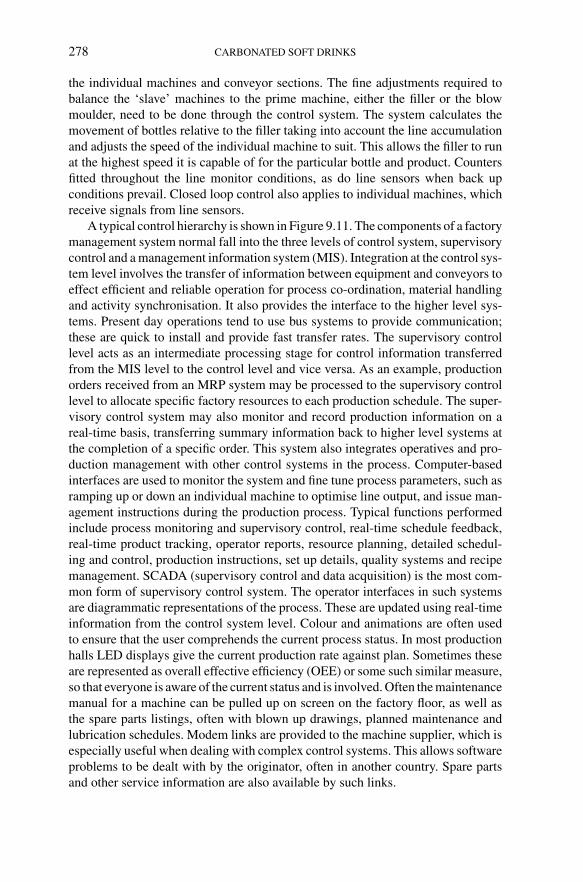
Steen: “chap09” — 2006/4/27 — 18:31 — page 278 — #20
278 CARBONATED SOFT DRINKS
the individual machines and conveyor sections. The fine adjustments required tobalance the ‘slave’ machines to the prime machine, either the filler or the blowmoulder, need to be done through the control system. The system calculates themovement of bottles relative to the filler taking into account the line accumulationand adjusts the speed of the individual machine to suit. This allows the filler to runat the highest speed it is capable of for the particular bottle and product. Countersfitted throughout the line monitor conditions, as do line sensors when back upconditions prevail. Closed loop control also applies to individual machines, whichreceive signals from line sensors.
A typical control hierarchy is shown in Figure 9.11. The components of a factorymanagement system normal fall into the three levels of control system, supervisorycontrol and a management information system (MIS). Integration at the control sys-tem level involves the transfer of information between equipment and conveyors toeffect efficient and reliable operation for process co-ordination, material handlingand activity synchronisation. It also provides the interface to the higher level sys-tems. Present day operations tend to use bus systems to provide communication;these are quick to install and provide fast transfer rates. The supervisory controllevel acts as an intermediate processing stage for control information transferredfrom the MIS level to the control level and vice versa. As an example, productionorders received from an MRP system may be processed to the supervisory controllevel to allocate specific factory resources to each production schedule. The super-visory control system may also monitor and record production information on areal-time basis, transferring summary information back to higher level systems atthe completion of a specific order. This system also integrates operatives and pro-duction management with other control systems in the process. Computer-basedinterfaces are used to monitor the system and fine tune process parameters, such asramping up or down an individual machine to optimise line output, and issue man-agement instructions during the production process. Typical functions performedinclude process monitoring and supervisory control, real-time schedule feedback,real-time product tracking, operator reports, resource planning, detailed schedul-ing and control, production instructions, set up details, quality systems and recipemanagement. SCADA (supervisory control and data acquisition) is the most com-mon form of supervisory control system. The operator interfaces in such systemsare diagrammatic representations of the process. These are updated using real-timeinformation from the control system level. Colour and animations are often usedto ensure that the user comprehends the current process status. In most productionhalls LED displays give the current production rate against plan. Sometimes theseare represented as overall effective efficiency (OEE) or some such similar measure,so that everyone is aware of the current status and is involved. Often the maintenancemanual for a machine can be pulled up on screen on the factory floor, as well asthe spare parts listings, often with blown up drawings, planned maintenance andlubrication schedules. Modem links are provided to the machine supplier, which isespecially useful when dealing with complex control systems. This allows softwareproblems to be dealt with by the originator, often in another country. Spare partsand other service information are also available by such links.
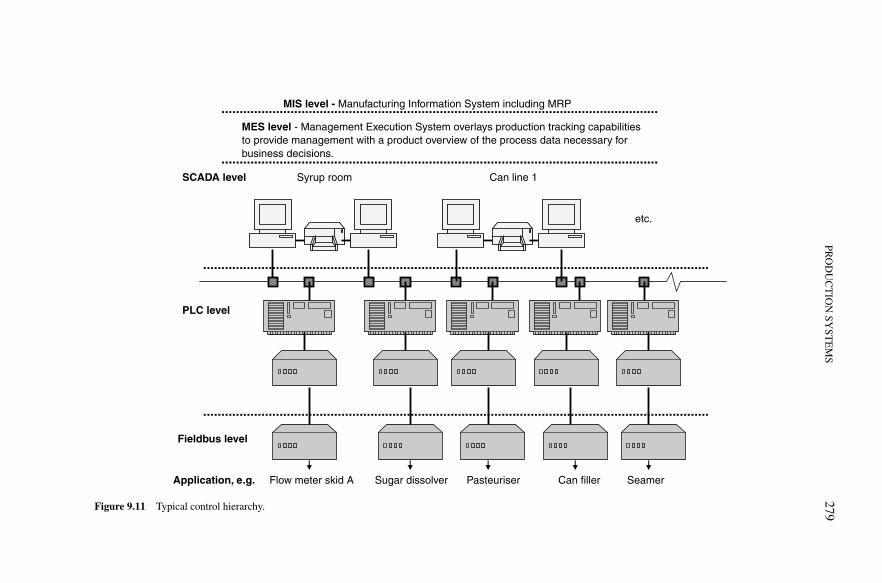
Steen:“chap09”
—2006/4/27
—18:31
—page
279—
#21
PRO
DU
CT
ION
SYST
EM
S279
Syrup room Can line 1SCADA level
MIS level - Manufacturing Information System including MRP
etc.
MES level - Management Execution System overlays production tracking capabilitiesto provide management with a product overview of the process data necessary forbusiness decisions.
PLC level
Fieldbus level
Flow meter skid AApplication, e.g. Can filler SeamerSugar dissolver Pasteuriser
Figure 9.11 Typical control hierarchy.
Steen: “chap09” — 2006/4/27 — 18:31 — page 280 — #22
280 CARBONATED SOFT DRINKS
The two systems so far discussed can then integrate with the MIS level of acompany. The objective of this is to allow operating decisions to be made andimplemented in real time on the basis of accurate, up to date information. Thedevelopment and integration of such systems is beyond the scope of this book. Theintegration at the MIS level will involve computer services personnel skilled inthis area.
These systems can be very useful in determining the reliability of individualprocesses. Breakdown data can be generated which will help in re-designing partsof a production line that can be identified as problem areas. The use of such datafed into simulation programmes will highlight where small improvements can bemade. This will lead to an improved OEE.
One important lesson in all this is not to overcomplicate systems. Too muchinformation can blind most people to the actual picture. It is also wise to usewell-proven systems rather than develop ones based on paper systems that thecompany has always used. These inevitably lead to failure. A clearly defined briefis required to define what is actually required. It is important to have a good work-ing relationship among head office management, factory management and the ITprofessionals to ensure that all understand this brief fully.
9.10 Complete factory layouts
The individual components of a filling line have been considered in this chapterand elsewhere in this book. It is now necessary to pull all these together. If weconsider the schematic factory layout shown in Figure 9.12, it can be seen how itall comes together. The layout must conform to industry standard good manufac-turing guidelines. It is necessary to have a logical flow for raw materials, packagingmaterials, through the various processes to finished goods, the warehouse anddespatch. Personnel movements are key to this, as are peripheral requirements suchas washrooms, rest rooms, canteen, offices, transport parking and roadways, staffcar parking and site security. Environmental aspects need to be carefully considered,as does current and proposed future legislation. This is clearly an idealised state thatis only possible with a green field site. Hygiene considerations play an importantpart in layout development. This includes how waste is handled through the plantand is taken off site. As discussed by Lea (2004), it is necessary, for an aseptic facil-ity, to control each of the operations to minimise the risk of cross-contamination.However, for carbonated beverages this is too elaborate and expensive. Such asepticprocessing needs to be done in a separate facility built specifically for the purpose.Existing plants have usually evolved such that it is often difficult to expand unlesscertain compromises are taken. It may be necessary to demolish old buildings anderect new ones more suitable to the modern day food factory environment. Oftenwarehousing is totally inadequate, with no space existing for future expansion, forexample, into aseptic filling.
In the development of any site, room for possible expansion is necessary. Thereis a limit to how cramped production lines can be before line efficiencies will

Steen:“chap09”
—2006/4/27
—18:31
—page
281—
#23
PRO
DU
CT
ION
SYST
EM
S281
Factory car park
Security entrance
Canteen
Syruproom
Rawmaterials
Full goods warehouse
Ord
er p
icki
ngan
d pr
epar
atio
n
Goo
ds In
/Out
Can
opy
Labo
rato
ry
Entrancehygiene andlockers
Packaging materials
Offices
Production
Pedestrian routeBoi
ler
hous
e Watertanks
CO
2 an
dN
2 ta
nks
Watertreatment
Lorryparking
Compressorsl.p. and h.p.
Engineers
Syrupandglucosetanks
Gatehouse
Space for expansionVehicle route round factory
Sufficient turning circlefor 44 tonne vehicle
Chillers
Figure 9.12 Schematic of a factory layout.

Steen: “chap09” — 2006/4/27 — 18:31 — page 282 — #24
282 CARBONATED SOFT DRINKS
drop. If it is difficult to access raw and packaging materials to a specific plant,and the operators have problems running the plant due to similar access prob-lems, the only solution is to expand the facility. As an example this problemhas arisen in the last few years with the advent of more and more multi-packingoptions.
Staff need to enter the premises from the car park through a security gate andthen proceed to the factory entrance where lockers for changing and wash stationsare sited. Only after they have changed and washed can they proceed to the plant.Designated walkways are required through the factory, especially when AGVs andFLT movements occur. Canteen facilities should be sited adjacent to the entrance,as in this way the deliveries do not affect the factory operation. Raw materialsand essences should be delivered to a small store adjacent to the syrup room, sothat they can be easily accessed through an airlock. Packaging materials, whichtend to take up space, should be sited adjacent to the finished goods warehouseand also to the production lines. Empty cans are normally stored in their own areaadjacent to the can lines, as delivery is normally on the day of use. Ends are storedin the same facility. For a PET facility, blow moulders can operate in the samearea as the production lines, in fact some are close coupled to the fillers. Wheresilo storage of small bottles are used, these should ideally be in a separate roomthat is kept as dust free as possible to prevent bottle contamination. Glass linesshould be kept well away from can and PET filling lines to reduce the risk of cross-contamination by broken glass. Ideally they should be sited in a separate room.Personnel movement areas should be designated and clearly signed to minimiseany possible cross-contamination problems.
Services should be sited external to the factory. These include low- and high-pressure compressors, water chilling, water treatment and water storage, carbondioxide and nitrogen storage vessels. Factory offices should have a view over theproduction facility. A walkway round the inside of the factory is good for visitorsand PR. Quality control facilities should be provided adjacent to the productionlines in specially designed rooms, which are visible to operating staff. No food ordrink facilities should be provided in production areas. Small areas for refreshmentshould be sited around the factory with vending machines in separate but highlyvisible areas. The engineers’ workshop and stores should be sited in an enclosedarea adjacent to the production lines as well as the services. This too should beopen to view from the production hall.
Warehousing will probably be high bay using cranes. This should be sitedat the end of the production lines with material flow towards the order pickingand despatch area. An entrance for heavy goods vehicles (HGVs) should be pro-vided, which ideally is separate to the staff and visitors entrance to minimise anysafety risk. This improves safety and security. Sufficient space for lorry parking isrequired.
The whole site must have room for expansion. Such an eventuality should bebuilt into the site plans such that additional bays for production and warehousingcan be added if required, as well as increases in service requirements. Roadwaysshould also be designed with this in mind.

Steen: “chap09” — 2006/4/27 — 18:31 — page 283 — #25
PRODUCTION SYSTEMS 283
9.11 Buildings
As the requirement for higher hygiene standards grows, the need to improve the stateof the buildings in which the products are manufactured has to improve. Nowadaysit is not good enough to have holes in concrete floors that have been eaten away bythe aggressive nature of sugar. Such areas can be potential microbial hazard areasgiving rise to such problems as Zygosaccharomyces bailii, a key spoilage organismresistant to preservatives. It is good practice to use architects and engineers whowork in the food industry and come with a recommendation. They will be used toworking with food quality materials and be able to design, cost and manage theinstallation on behalf of the client. Ideally they should be evaluated based on theirpast work and by talking to their clients.
Having agreed the line layouts and the overall factory layout, it is necessaryto agree the fabric for each area. Areas which require filtered air, if any, must belisted and whether positive air pressure environments will be required if dealingwith sensitive products. The specification of the drainage system is key to ensurethat there is no hold up of effluent anywhere in the system that can possibly lead tomicrobial growth. Floors need to be adequately drained, with falls so designed toensure that liquids flow towards the drainage channels. No standing pools of watercan be allowed. Where possible drains should be constructed in stainless steel,with removable grids for ease of cleaning and should be half round in section. Theapertures of such drains need to be small enough to prevent the ingress of large debriswithout restricting flow. If high-risk areas have been highlighted, then drainage flowshould be from high- to low-risk areas. Plant items should not be placed directly ontop of drain covers, nor should they be placed next to walls. A distance of 80 cm isrecommended to allow personnel access and to aid cleaning. Debris traps should beincorporated in the drainage system that can be easily accessed. Drainage at entryand exit of a building must be pest proof. Floors must be properly constructed ofa non-absorbent material such as tiles or food grade epoxy coverings that have nopitting, cracks and open joints. Any expansion joint needs to be carefully designed,as does the finish between the drains and the floor. These materials must withstandthe products being used, as well as the cleaning chemicals, without breaking up.The surface must be non-slip and safe to walk on when wet, dry or greasy. Allfloors should be coved to the walls. The design of the floor must take into accountthe loads to be placed on them. Where plant vibrates, it needs to be mounted on aspecially designed plinth that is easily cleanable. An example is the high-pressurecompressors required for blow moulding. Adequate space under the plant is requiredto facilitate cleaning.
Interior walls must be finished with a hygienic, easy to clean continuouslybonded surface. Corners and joints must be sealed with a food grade impervioussealant. Any pipes or services going through walls should be mounted in suitablefittings and sealed against vermin ingress. If these services are subject to expansionor contraction such as for steam pipes, then suitable expansion fittings should beused. No horizontal surfaces must be used as these are not self-draining and couldharbour contaminants. If notices have to be used, then these should be glued rather

Steen: “chap09” — 2006/4/27 — 18:31 — page 284 — #26
284 CARBONATED SOFT DRINKS
than nailed to the wall. Suitable hygienic protection to walls must be provided inFLT areas where possible damage could occur. Such protection is best done intubular stainless steel. All external doors should be of food quality. This can pose aproblem with fire doors. Automatic rapid roll doors are ideal for vehicular traffic.The ingress of birds and insects is a problem that must be addressed, even if astuffed owl is used. Self-closing doors are ideal. For entry to sensitive areas such asthe syrup room, security locking systems should be used that log the persons usingthem thereby restricting access to relevant personnel only.
Windows, if installed, should be fully sealed to prevent vermin ingress. No glassis allowable; they should be constructed of a polycarbonate type material. Anywindow sills or ledges must be sloping and easily cleanable. They must not besuitable for placing objects on them.
Adequate wash facilities are required at the entrance to all key production areas,such areas being so designed that personnel are guided to the hand wash facilities.These facilities need to be trapped and plumbed directly to the drain. In a carbon-ated beverage factory, the risk from dirty footwear is slight, though in an asepticprocessing area, foot wash facilities are required.
All frameworks should be tubular to minimise the accumulation of debris and toease cleaning. This will also reduce the risk of infestation by moulds, ants, etc. Allmain building steelwork should be covered with a false ceiling, especially wheretraditional girders rather than tubular is used. Many soft drinks factories actuallyuse this space to site services such as pipework, electrics and air conditioners. Woodor glass is not allowed in the construction of food factories. Any painted surfaces,where they are unavoidable, must be finished in a non-flaking paint suitable for foodarea use. Any service pipework from this ceiling area should be kept in stainlesstubing and be installed vertically to maximise cleaning effectiveness.
Good lighting levels are required throughout production. Modern fluorescentlights are now energy efficient and should be installed with plastic diffusers flushmounted into the false ceiling. In inspection areas, natural daylight tubes should beused, and if this is not practicable, then special light boxes need to be sited in theseareas.
Adequate temperature and dust control is essential. Ideally all production areasshould be air conditioned to a set temperature in a positive pressure environment.All low-pressure compressed air should be filtered and passed across water andoil traps. The high level system must have adequate falls and automatic drainageincluded. All pipework lagging should eliminate any risk of pipework condensation,which could fall onto product, by suitable insulation with food grade aluminiumor mirror effect stainless steel sheeting covers. They must be readily cleanable.All services should be suitably marked as per BS 4800 and BS1710:1989. Electrictrunking and cable trays must be kept clean by using hygienic designs that arereadily accessible by the electrician and the cleaning crew.
A centralised cleaning system for external cleaning of machines and conveyorsis often installed in beverage factories. These incorporate chemical dosing and hotwater that can be plugged in at strategic points around the factory to provide high-pressure cleaning through hand-held lances. Sweeper/scrubber machines are used

Steen: “chap09” — 2006/4/27 — 18:31 — page 285 — #27
PRODUCTION SYSTEMS 285
for the main alleyways and accessible parts of the factory. Sweepers are used tokeep the factory external roadways clean. Such roadways need to be fit for purposeto take the modern 44 tonne vehicles. Adequate drainage and petrol interceptorsare required.
The warehouse should be a high bay unit. This needs to be designed in con-junction with specialist companies that can provide the building, racking, cranesand warehouse control system.
9.12 Performance measurement and benchmarking
It is always important to benchmark performance against business competitors.Studies have shown that it is not always necessary to invest in the latest plant to beefficient. This is to do with the fact that it takes time for plants to bed in as well as thestaff that operate it to fully understand the new technology. Staff know the old plantand can achieve high output efficiencies from it. An OEE of over 85% is consideredto be of world class manufacturing standard. Generally companies in the EU, USAand Japan that achieve this are those with the least advanced technological processcontrol systems.
Plant efficiency for a bottling line = Bottles into warehouse × 100
Filler speed × run time
This efficiency is influenced principally by the materials fed to the plant, the state ofthe machines within the plant, the workforce capability and morale, the number ofproduction variants and run lengths. Machines must run effectively and staff mustknow how to operate, fault find and rectify problems promptly on them. The aimis to minimise production downtime whilst still maintaining the product quality.Consider a simple cost model for a production line as per Table 9.2. This exampleis for a line running one size of bottle with several flavours to produce at 10,000bottles/h 28 million bottles per year. This gives an ex-works cost of £0.39 excludingoverheads. This is equivalent to an overall line efficiency of 65%. An increase in effi-ciency would reduce costs and increase profits. The more breakdowns the less timethere is for production. Obviously some point must be reached whereby the costsof maintenance outweigh the advantages. This is illustrated in Figure 9.13(a, b),where the optimum cost can be seen.
Performance indicators come in many forms. They include OEE, line efficiency,mean time between failures, planned maintenance task completion rate, ex-worksproduction cost, labour cost, maintenance cost per plant item, maintenance cost perproduction line, ratio of planned to breakdown costs and the number of consumercomplaints. From Table 9.2 we can see that depreciation represents 12.4% of ourcosts. If the plant is not maintained well, it will be necessary to reinvest sooner thananticipated. This will cost further depreciation plus interest costs which could wellcome to some 20% of costs. It would be wrong to just use cost as the main indicatorof productivity. It is necessary to ensure that all the routines and corrective measures
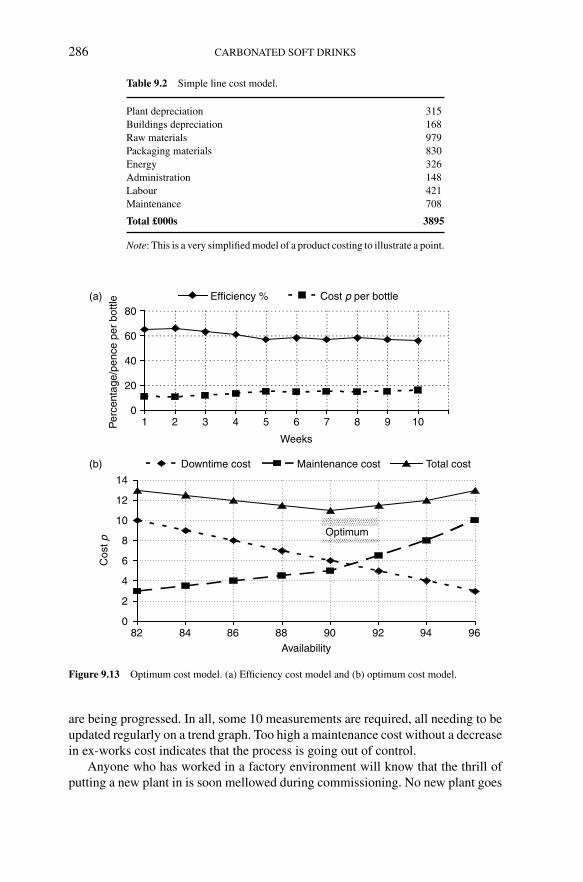
Steen: “chap09” — 2006/4/27 — 18:31 — page 286 — #28
286 CARBONATED SOFT DRINKS
Table 9.2 Simple line cost model.
Plant depreciation 315Buildings depreciation 168Raw materials 979Packaging materials 830Energy 326Administration 148Labour 421Maintenance 708
Total £000s 3895
Note: This is a very simplified model of a product costing to illustrate a point.
0
20
40
60
80
1 2 3 4 5 6 7 8 9 10
Weeks
Per
cent
age/
penc
e pe
r bo
ttle Efficiency % Cost p per bottle
0
2
4
6
8
10
12
14
82 84 86 88 90 92 94 96Availability
Cos
t p
Downtime cost Maintenance cost Total cost
Optimum
(a)
(b)
Figure 9.13 Optimum cost model. (a) Efficiency cost model and (b) optimum cost model.
are being progressed. In all, some 10 measurements are required, all needing to beupdated regularly on a trend graph. Too high a maintenance cost without a decreasein ex-works cost indicates that the process is going out of control.
Anyone who has worked in a factory environment will know that the thrill ofputting a new plant in is soon mellowed during commissioning. No new plant goes

Steen: “chap09” — 2006/4/27 — 18:31 — page 287 — #29
PRODUCTION SYSTEMS 287
0
10
2030
40
50
60
7080
90
100
0 10 20 30 40 50 60 70 80 90 100
Weeks
Per
cent
age
penc
e pe
r bo
ttle
Plant efficiency %
Pence per bottle
Figure 9.14 Typical plant commissioning scenario.
in as well as expected. Even if the new plant meets the contractual performancecriteria, the staff still have to learn how to operate it and take ownership. Experienceshows that on a completely new soft drinks line, it takes at least 12 months, usually18 months, to meet the required efficiency levels. During this time the staff haveto learn how to operate the plant as well as how to fault diagnose and maintain it.Figure 9.14 shows what often happens. Whilst the contractors are on site, the plantsoon improves and meets the contractual performance conditions. The contractorsleave site and the efficiency falls. Extra training is given to staff, the contractors assistwith the maintenance and slowly the plant performance improves. This always costsmore than anticipated. This should be allowed for in the original capital proposal.
If existing plant can meet the foreseeable sales demand, why invest? Surely itis more economical to maintain and improve the performance of the present plant.No increase in depreciation is happening which adds a burden to the ex-works cost ofthe product. The key is to motivate staff, ideally through total planned maintenance(TPM) programmes, to not only ensure that the plant is kept in as good a conditionas the day it was purchased, but also to operate it even better than anticipated.Clearly there are times when new investment is required such as for a new productrange, cost reductions through improved output and new multi-packing options.
Trend analysis is a valuable tool. However, no decision should be based on itunless complete faith can be had in the base data. Ideally non-dimensional param-eters should be used. If these cannot be devised, then cost per bottle is a betterparameter to use than total cost as it is relative to something positive.
How are benchmarking partners found? For a soft drinks manufacturer, it canbe achieved by visiting competitors’ operations and similar plants such as a brew-ery as they deal in bottles and cans at high speeds but lower carbonation levels.Involvement with industry associations, attending industry seminars and visitingexhibitions as well as discussions with plant suppliers are all valuable. On a bench-marking visit, it is important to make clear that benchmarking is the objective andthat a reciprocal facility is offered. The best measure to use is the OEE (overall

Steen: “chap09” — 2006/4/27 — 18:31 — page 288 — #30
288 CARBONATED SOFT DRINKS
effective efficiency) which is defined as:
OEE = availability × performance × quality
where availability = actual run time ÷ planned run time, performance = actualoutput ÷ maximum possible output in the actual run time and quality = right firsttime ÷ total produced.
It is best discussed using an example. A production line is designed to runat 10,000 bottles/h for 5 days at 24 h/day. This defines the planned run time as7200 min. Change overs take 320 min whilst the unplanned downtime is 426 min.The total unproductive time is then 746 min, giving the available production timeas 6454 min. Availability is then 89.65%. In this time the line should have pro-duced 1,075,666 bottles, but actually only made 876,024 bottles. This gives theperformance as 81.4%. Of these bottles produced, 24,806 were put on hold and756 were waste. The units right the first time were then 876,024 bottles giving aquality rating of 97.1%. The OEE then calculates as 70.8%, a long way off worldclass. This example highlights some of the main problem areas. Change overs needto be minimised. Target times should be set for these which need to be monitoredand a trend graph drawn up that is constantly updated and reviewed. Downtimeis another important parameter to be analysed. The factors that influence it arehigh-speed packaging equipment, a good proportion of whose problems are theinteraction between the packaging suitability and the machine, and the shortage ofskilled technicians. In the UK, the virtual demise of apprenticeships and the risein the number of graduates trained academically but not practically has not helpedthis situation. The age of the graduate apprenticeship seems to have unfortunatelygone. Getting the quality of the product right the first time is one of the main keysto success. Low yields are often caused by poor packaging and raw materials. It isimportant that the specifications for these are carefully written and agreed with thesuppliers, that the buyer actually buys to these agreed specifications, and that thesespecifications are regularly reviewed with specific regard to line performance withthe supplier.
9.13 Future trends
It is most likely that factories will become even more hygienic. Machine designs areavailable that are much more compatible with hygiene requirements, with slopingsurfaces and no deadleg areas where microbial problems can rise. Often the mainworking area of a machine, in the wet part of the factory, is sited above the actualframe to aid cleanability. Cabling is in easily cleanable stainless steel trunking ofcable trays, often sited on the sides on conveyors or overhead. Many soft drinksfactories have a high level walkway to enable visitors to see the process withoutdisrupting it. Platforms often exist to house the machine and system control panels.This allows staff ready access to them without hindering production. This alsoprovides a degree of security. Buildings will be purpose built for food production

Steen: “chap09” — 2006/4/27 — 18:31 — page 289 — #31
PRODUCTION SYSTEMS 289
rather than the typical warehouse shell of 20 years ago. They will be sited withborehole water availability, ideally with natural mineral water recognition.
Aseptic filling is going to come even more to the forefront and developmentswill include near-aseptic carbonated drink filling, where low preservative level andnew product innovations can be produced. This will in turn require upgraded syruproom facilities where aseptic product can be prepared.
The elimination of production labour by automation is now a thing of the past.Very few capital proposals can claim any major labour saving. A small reduction inunskilled and semi-skilled personnel will be seen, but a large increase in the skilledworkforce will occur. This needs government and industry to ensure that the supplyof funds to educate the next generation is available. At present the future in this arealooks rather bleak, with a lack of interest in technology especially with universityentrants. Apprenticeships for both craft and graduate entry are required. The dayswhen a graduate can walk into an office job without first learning the rudiments ofhow, for instance, to operate a soft drinks production line or syrup room should bebehind us. The chemist should know how the process works technically as well asunderstand the chemistry of the process. He needs to have worked for a period in asyrup room. He also needs to visit his material suppliers and understand how theirprocesses work and what improvements can be made. The packaging technologistneeds to fully understand the relationship between materials and machines.
New product and packaging development will be a continuing process, probablyat a faster rate than in the last 10 years. This will see a growth in development costsand the need for more flexible production systems. Short run length for specialistproducts must be catered for as much as long run lengths for the major brands.Both must operate at high OEEs with low ex-works costs. This will require carefulattention to factory design and layout as well as the facilities installed.
Further reading
Ashurst, P.R. (Ed.) (2004) Chemistry and Technology of Soft Drinks and Fruit Juices. BlackwellPublishing, Oxford.
Baker, C.G.J. (Ed.) (1997) Food Industries Manual. Springer-Verlag, London.Lea, R.A.W. (2004) Chapter 8, Processing and packaging. In Ashurst, P. (Ed.) Chemistry and Technology
of Soft Drinks and Fruit Juices. Blackwell Publishing, Oxford.Czarnecki, M.T. (1998) Managing by Measuring. Amacon, USA.Design and Construction of Floors for Food Production (No. 39) (2002) Campden and Chorleywood
Food Research Association (CCFRA).Guidelines for the Design and Construction of Walls, Ceilings and Services for Food Production Areas
(2nd edn., No. 41) (2003) Campden and Chorleywood Food Research Association (CCFRA).Guidelines for the Hygienic Design, Construction and Layout of Food Processing Factories (2nd edn.,
No. 41) (2003) Campden and Chorleywood Food Research Association (CCFRA).Hopp, W. and Spearman, M. (2000) Factory Physics (2nd edn.). McGraw Hill, New York.Robinson, S. (2003) Simulation; The Practice of Model Development and Use. John Wiley, Chichester,
UK.Spendolini, M.J. (2003) The Benchmarking Book. Amacon, USA.
Steen: “chap10” — 2006/4/27 — 18:31 — page 290 — #1
10 Production planning and distributionPhilip A. Wood
10.1 Introduction
This chapter will concern itself with the disciplines of logistics and the supply chainof soft drinks. At first glance this may represent to many readers a deviation fromthe main thrust of this book as it is not particularly concerned about formulationor manufacture. However, as you will discover, just being able to formulate andmanufacture carbonated soft drinks effectively will almost certainly not be enoughto succeed in today’s marketplace. Qualities within a company required to maintaina sustainable competitive advantage in the soft drinks marketplace will includebeing able to deliver not only to its customers and consumers both a good consistentproduct at the right price but also to a high level of customer service. It is to thislatter quality that this chapter directs its attention.
What is meant by a high level of customer service? This requires the definitionof customers and consumers of soft drinks. The consumer is the individual whodrinks the product. The customer is either the direct retail outlet or an independentwholesale distributor to independent retailers or a multiple retailer/supermarketchain, whose individual stores are either served directly or via a distribution centre.Today’s customers expect to have 99.5% or more of the cases they have orderedcorrectly delivered to them on the date and, more frequently, time expected. Cus-tomers typically order on day one for delivery on day four (i.e. three days later),however, some with high levels of buying power demand the ability to order withonly 12 h lead time nationally.
It may be considered that this should be relatively straightforward to achieveby simply having full stock ready in anticipation of customers’ orders. There area number of issues that a manufacturer has to deal with logistically for carbonatedsoft drinks. First, the product consists of mainly water which is relatively heavyand bulky. Consequently, warehousing (the physical buildings and people to runthem) and distribution charges (large goods vehicles (LGVs) can only carry around26 tonnes of product on UK roads and a 1000 l of water weighs a tonne) can have asignificant impact on overall product cost. At today’s prices in the UK, these chargesrepresent between 20 and 25% of the total product supply chain costs (i.e. thosefrom raw materials supply to product delivered to the back door of a retail outlet andwithout overheads such as marketing, etc.). The second problem is product flavourdeterioration as a function of time and temperature. Carbonated soft drinks have ashelf life, normally about 12 months from the date of manufacture (see Chapter 7).
Steen: “chap10” — 2006/4/27 — 18:31 — page 291 — #2
PRODUCTION PLANNING AND DISTRIBUTION 291
However, after about 3 months, consumers may be able to differentiate this fromfreshly manufactured product. Many retail customers are aware of this and insistupon minimum shelf life requirements for their consumers. Besides these issues,manufacturing lots of product to be held in stock also means that the business will tieup a lot of its capital/cash in this way. What has therefore developed is a balancingact between the need for low stock levels and that of high levels of customer service.
This should be very achievable if there is a good understanding of what cus-tomers want. However, forecasting customer demand is extremely difficult for softdrinks due to its seasonal nature. Firms have developed some direct correlationswith the average climate temperature and the volume of soft drinks consumed.In the summer, consumer uptake rates can be over five times the normal rates.The other significant problem is that of competitor activity between both differentmanufacturers and customers.
For manufacturers, time-to-time promotional activity associated either with thelaunch of a new product or a brand re-launch or simply a new marketing campaignwhere significant price reductions or multi-buys, such as ‘buy one get one free’or ‘three for the price of two’, can have a dramatic effect on the volumes of anyproducts sold. Such activity can be focused on one or more specific sectors of themarket or even with specific customers within a sector. Some carbonated soft drinksare treated by customers as commodity items. That is those which they normallyhave to stock because consumers expect to find it on their shelves and consequentlyconsumers are well aware of the traded prices. Some customers choose then tocompete by lowering the retail price themselves to encourage additional consumersinto their stores. Such products are known as ‘loss leaders’.
Through this chapter how a soft drinks manufacturer can manage these issuesand what has to be considered after the product leaves the end of the packaging linewill be considered.
10.2 Supply chain principles
Figure 10.1 describes some of the different terms used to describe different partsof the supply chain and its management which is taken from Slack et al. (2001).This provides a simple introduction to the topic using a single operation in thechain as a focal point. This diagram can be expanded for an individual businesswhere there are more factories with different products such as cans, glass or plasticbottles.
The efficient control of this aspect of the business is known as supply chainmanagement (SCM). SCM has also been described in the context of the valuechain (Christopher and Ryals, 1999). Value chain analysis is a tool to breakdown abusiness into its strategically relevant activities in an attempt to identify the sourcesof competitive advantage for an organisation. Broadly the value chain becomes adesign for the business mission, SCM offering the strategic direction with logisticsmanagement the operational implementation vehicle (Christopher and Ryals, 1999).SCM can drive shareholder value through:
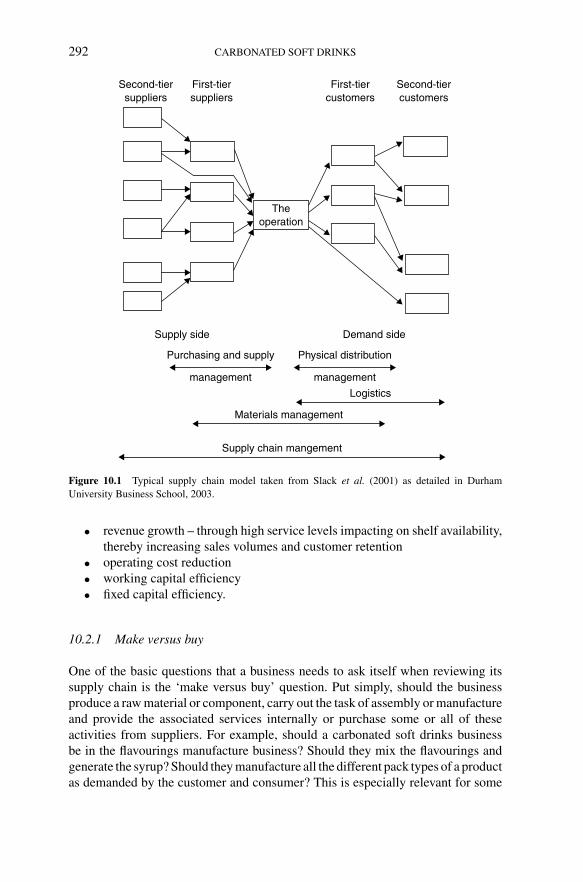
Steen: “chap10” — 2006/4/27 — 18:31 — page 292 — #3
292 CARBONATED SOFT DRINKS
Theoperation
Second-tiersuppliers
First-tiersuppliers
First-tiercustomers
Second-tiercustomers
Supply side Demand side
Purchasing and supply Physical distribution
management management
Logistics
Materials management
Supply chain mangement
Figure 10.1 Typical supply chain model taken from Slack et al. (2001) as detailed in DurhamUniversity Business School, 2003.
• revenue growth – through high service levels impacting on shelf availability,thereby increasing sales volumes and customer retention
• operating cost reduction• working capital efficiency• fixed capital efficiency.
10.2.1 Make versus buy
One of the basic questions that a business needs to ask itself when reviewing itssupply chain is the ‘make versus buy’ question. Put simply, should the businessproduce a raw material or component, carry out the task of assembly or manufactureand provide the associated services internally or purchase some or all of theseactivities from suppliers. For example, should a carbonated soft drinks businessbe in the flavourings manufacture business? Should they mix the flavourings andgenerate the syrup? Should they manufacture all the different pack types of a productas demanded by the customer and consumer? This is especially relevant for some
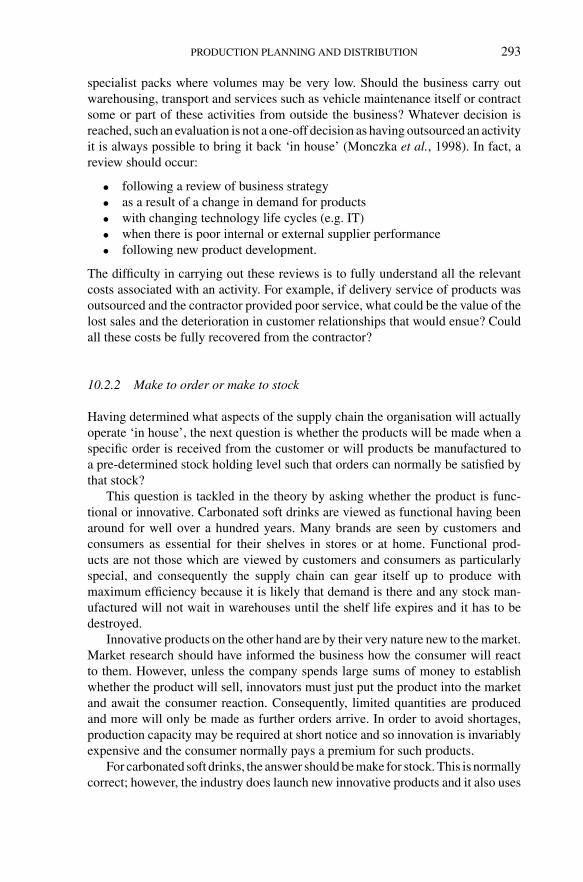
Steen: “chap10” — 2006/4/27 — 18:31 — page 293 — #4
PRODUCTION PLANNING AND DISTRIBUTION 293
specialist packs where volumes may be very low. Should the business carry outwarehousing, transport and services such as vehicle maintenance itself or contractsome or part of these activities from outside the business? Whatever decision isreached, such an evaluation is not a one-off decision as having outsourced an activityit is always possible to bring it back ‘in house’ (Monczka et al., 1998). In fact, areview should occur:
• following a review of business strategy• as a result of a change in demand for products• with changing technology life cycles (e.g. IT)• when there is poor internal or external supplier performance• following new product development.
The difficulty in carrying out these reviews is to fully understand all the relevantcosts associated with an activity. For example, if delivery service of products wasoutsourced and the contractor provided poor service, what could be the value of thelost sales and the deterioration in customer relationships that would ensue? Couldall these costs be fully recovered from the contractor?
10.2.2 Make to order or make to stock
Having determined what aspects of the supply chain the organisation will actuallyoperate ‘in house’, the next question is whether the products will be made when aspecific order is received from the customer or will products be manufactured toa pre-determined stock holding level such that orders can normally be satisfied bythat stock?
This question is tackled in the theory by asking whether the product is func-tional or innovative. Carbonated soft drinks are viewed as functional having beenaround for well over a hundred years. Many brands are seen by customers andconsumers as essential for their shelves in stores or at home. Functional prod-ucts are not those which are viewed by customers and consumers as particularlyspecial, and consequently the supply chain can gear itself up to produce withmaximum efficiency because it is likely that demand is there and any stock man-ufactured will not wait in warehouses until the shelf life expires and it has to bedestroyed.
Innovative products on the other hand are by their very nature new to the market.Market research should have informed the business how the consumer will reactto them. However, unless the company spends large sums of money to establishwhether the product will sell, innovators must just put the product into the marketand await the consumer reaction. Consequently, limited quantities are producedand more will only be made as further orders arrive. In order to avoid shortages,production capacity may be required at short notice and so innovation is invariablyexpensive and the consumer normally pays a premium for such products.
For carbonated soft drinks, the answer should be make for stock. This is normallycorrect; however, the industry does launch new innovative products and it also uses

Steen: “chap10” — 2006/4/27 — 18:31 — page 294 — #5
294 CARBONATED SOFT DRINKS
a range of promotional packs to attract customers and consumers. A good exampleis the so-called price marked packs where normally, if a larger than normal volumeis purchased, a discount is indicated on the packaging. For the manufacturer thismay appear to represent a good deal for the consumer. However, will the customerview the deal as good value? More volume may be sold but will retailers make asmuch profit overall?
The reaction of the customers can usually be gauged by the sales force. Fre-quently because the organisation is ‘funding’ the activity from a budget, quantitiesof the promotional package are often allocated to the customer by fixed volumesonly. Most retailers will normally understand consumer reaction following the firstday that the offer is available.
10.2.3 Purchasing
Soft drinks manufacturing companies spend a high proportion of their business costson materials and services. As a consequence this aspect of business is developingfrom a clerical ordering style activity into a core function that can contribute to abusiness’ strategic competitive position. For example, in a typical manufacturingcompany with an 8% profit margin and 55% material costs, a reduction in materialcosts by 5% would improve the overall company profitability to the same extent asa 29% increase in sales (Durham University Business School, 2003).
The aspects of the role of the purchasing function can vary within an organisa-tion. Whether it is identified separately or working across different functions, therewill be individuals charged with:
1. identifying sources of supply2. evaluating possible suppliers and selecting them3. providing material specifications and technical agreements with suppliers4. carrying out contract negotiations covering prices, service and payment
terms5. raising purchase orders6. receiving ordered goods7. matching receipts with supplier invoices and authorising payment8. supplier management – ensuring the costs and services contracted for are
delivered9. supplier development and improvement including building closer relation-
ships, for example, to assist with new product development10. supplier audits.
Supplier selection will normally be primarily based on cost, quality and deliverycomparisons and criteria. There are secondary factors associated with technicalsupport, business stability and flexibility.
Historically, the buyer–supplier relationship was based on adversarialtransaction-based theory (marketplace bartering/haggling type relationship) and notthat of co-operation for mutual benefit. This is because such relationships are pretty

Steen: “chap10” — 2006/4/27 — 18:31 — page 295 — #6
PRODUCTION PLANNING AND DISTRIBUTION 295
Table 10.1 Differences between historical adversarial transactionsbetween buyer and seller and buyer–supplier relationships.
Adversarial transaction based Buyer–supplier relationship
Suspicion Mutual trustSomeone wins Win–win/shared goalsStructured communications Open communicationsOne-off sale/buy Long-term commitmentResponsibility for failures Team problem solvingLimited involvement Involvement at all levelsPenalties for performance problems Joint Improvement developmentIndependent entity Mutual growthRelationship strictly to the contract Working together, contractTerms hardly ever referred toBusiness secrets Shared technology
straightforward. Both parties place their efforts in limited selection, selling/buyingand negotiating activities. The goods or service is exchanged and utilized and if thebuyer is satisfied, then the seller can hope for further future business.
Organisations are coming to recognise that by undertaking a programme of sup-plier development, which entails developing buyer–supplier relationships with anincreased use of the organisations resources in contrast to an adversarial relation-ship, then there is greater potential for increased value and profits. To achieve thesenew buyer–supplier relationships, a paradigm shift is necessary to generate the fullbenefits for both parties (see Table 10.1).
Adversarial relationships however still take place in modern business. The issuefor buyers who cause suppliers to go out of business as a result of this kind ofrelationship is a reduction in future supplier competition because there will be fewerorganisations in the marketplace. Further, there is the potential for a ‘backlash’ fromthe trade and general public, particularly if the alternative sources are foreign orwith businesses which have poor ethics or worker relations.
Relationships can be ‘dual sourcing’ with more than one supplier able to delivera resource to the organisation. Here the element of trust need not be high, quitesimply because if one supplier fails then there is always another. In ‘single sourcing’or ‘cross-sourcing’ (where a supplier delivers two or more products to a buyer),the relationship trust levels need to be higher. This is because, for both parties,the business relationship is likely to be more significant in terms of overall value.A further relationship type is where a supplier delivers a ‘portfolio of arrangements’where many different resources are bought from only a few different suppliers.Therefore, the number of suppliers tends to be limited and here the trust levels inthese relationships need to be very high. Frequently this type of buyer–supplierrelationship is often developed as an outcome of a supply base reduction exercise.This exercise allows firms to limit the number of invoices processed and allows itsmanagement to focus on the relationship between fewer organisations. Relationship

Steen: “chap10” — 2006/4/27 — 18:31 — page 296 — #7
296 CARBONATED SOFT DRINKS
development between companies is time consuming so if it can be limited to a fewthen expensive management time will be saved.
The first key issue for a company which wishes to develop strong buyer–supplierrelationships is the selection of suppliers and resources. This is because the devel-opment of strong buyer–supplier relationships requires time and effort from thepeople in both organisations and this may simply not be practical. In some organi-sations this need to work with many suppliers may be outsourced to one ‘primary’supplier who manages all the other suppliers on behalf of the buyer. The devel-opment of a relationship where mutual trust exists is one of the main contributorsto the expenditure of time and effort and an integral part in the development oflong-term buyer–seller relationships.
A further critical component must be communication. In the adversarial relation-ship, communication is between a few individuals in both organisations. Broadly thebuying organisation supplies details of the requirement, supply and payment termswith a forecast volume, with the supplier providing quality and price details. Dis-cussions take place over a few meetings with those parties only reconvening shouldone of the parties have encountered a problem. In buyer–supplier relationships,the above discussions still take place, but subsequently regular reviews consideran exchange of key performance indicators as well as cross-functional meetingsincorporating other departments such as Marketing, Research & Development,Manufacturing, Logistics and Finance. Regular updates of forecast demand, mar-ket trends and opportunities for mutual cost saving by either need to be consideredas do developing the resource or service.
10.2.4 The soft drinks supply chain
Key materials and services required for the manufacture of carbonated soft drinksare water, packaging materials, CO2, sugar, energy, flavourings, colourings andpreservatives, fruit juice in its various forms, marketing design services, effluentand waste disposal. Product formulation, packaging development and subsequentshelf life testing for a new product are likely to take the longest time. Figure 10.2provides a typical example of a business with a product development cycle.
For established products, the longest lead time can often be for the developmentand approval of new promotional packaging with subsequently the production ofthe new design material. The lead time for some items can be as long as 12 weeksbefore receipt at the factory.
Understanding the longest lead time and the value of a component for a packis very important when determining the desired stock levels to be held within thebusiness. This will be as either full goods or as a raw material held by either thesupplier or the manufacturer. Critical path analysis can be used for this purpose.
A further key question in the carbonated soft drinks supply chain is to determinethe trade off between manufacturing capacity and stock holding? Is it more costeffective to have very low full stock levels with spare manufacturing capacity where
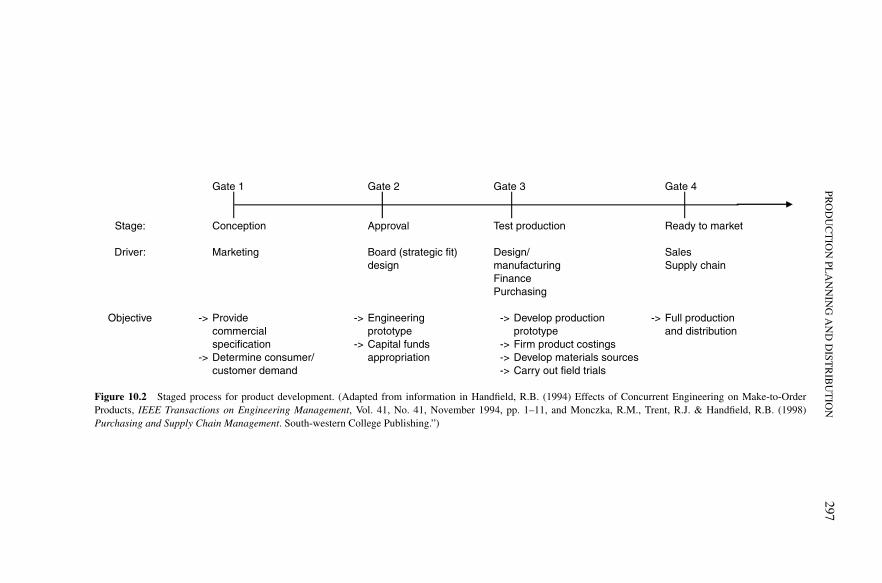
Steen:“chap10”
—2006/4/27
—18:31
—page
297—
#8
PRO
DU
CT
ION
PLA
NN
ING
AN
DD
ISTR
IBU
TIO
N297
Gate 1 Gate 2 Gate 3 Gate 4
Stage: Conception Approval Test production Ready to market
Driver: Marketing Board (strategic fit) Design/ Salesdesign manufacturing Supply chain
FinancePurchasing
Objective -> Provide -> Engineering -> Develop production -> Full productioncommercial prototype prototype and distributionspecification -> Capital funds -> Firm product costings
-> Determine consumer/ appropriation -> Develop materials sourcescustomer demand -> Carry out field trials
Figure 10.2 Staged process for product development. (Adapted from information in Handfield, R.B. (1994) Effects of Concurrent Engineering on Make-to-OrderProducts, IEEE Transactions on Engineering Management, Vol. 41, No. 41, November 1994, pp. 1–11, and Monczka, R.M., Trent, R.J. & Handfield, R.B. (1998)Purchasing and Supply Chain Management. South-western College Publishing.”)

Steen: “chap10” — 2006/4/27 — 18:31 — page 298 — #9
298 CARBONATED SOFT DRINKS
‘make to order’ can be effective or using high stocks to act as a buffer when themanufacturing capacity is exceeded in periods of high demand?
Some manufacturers have fully dedicated packing lines for a specific brandand/or pack/stock keeping unit (SKU) with only limited graphic design changes tothe packaging (for promotional packs) being undertaken. Such lines tend to be lesscomplex and so run extremely efficiently and are in factories where the workforcecan move between the different lines. The advantage of this strategy is that in timesof sudden increases in demand, the manufacturing capacity is available to respond,and it is simply a case of availability of people to run the lines.
An alternate strategy is to install lines capable of producing a large range ofproducts and SKUs. These lines tend to be more complex, costing a lot more than thesimpler packaging lines described above and furthermore they run less efficientlydue to increased complexity and increased downtime due to size changing.
Carbonated soft drinks fit into a group of products known as fast movingconsumer goods (FMCGs). The market in some developed countries is rapidlybecoming dominated by a few supermarket chains known as major multiple retail-ers who have greater market buying power. The alternatives are the impulse sector,including kiosks, garages and corner shops, and the trade sector, comprising pub,restaurant and entertainment chains.
These major multiple retailers normally require delivery directly into their dis-tribution centres of full truck loads (FTLs). Such loads tend to be to the maximumweight that can be legally carried on public roads. Their distribution centres willthen sort the stock into specific store deliveries and deliver carbonated soft drinkswith other similar so-called ambient products directly to their stores.
The impulse sector can be broken down into two groups, those that purchasefrom wholesalers (Cash & Carry outlets) and those that purchase directly from themanufacturer. Volumes for these retailers are often much lower and as a conse-quence the product cost is higher. Manufacturers also maintain product dispensingmachines at, for example, leisure centres or amusement arcades or places wherethe retailer is not open 24 h.
Distribution costs can have a significant impact on the overall cost of the product.A 400 mile journey for an FTL will normally cost about three and a half times morethan a 100 mile journey. So it is important to locate production facilities near to thecentres of population with good access to the transport infrastructure.
10.2.5 The bullwhip effect
A phenomenon associated with some of the supply chain principles faced by thesoft drinks industries is called the bullwhip effect.
This phenomenon was discovered when order patterns for a consistently sup-plied product were examined, it was found that while retails sales fluctuated, theycould not be described as excessive. However, distributor’s orders were foundto be highly variable and further that orders to materials suppliers showed even

Steen: “chap10” — 2006/4/27 — 18:31 — page 299 — #10
PRODUCTION PLANNING AND DISTRIBUTION 299
Table 10.2 Summary of relationship among lead-time distribution, bullwhip effect and supply chainperformance for supply chains with constant lead-time taken from (Impact of lead-time distribution onthe Bullwhip effect and supply chain performance).
Increase in Bullwhip effect Inventory cost Backorder cost Total cost Order fill rate
Information Significantly Increases Significantly Slightly Increasesshared decreases decreases decreases
Skewed Decreases Decreases Decreases Decreases Increasesdecentalisedinformation
Skewed Exactly Approximately Approximately Approximately Approximatelycentalised the same the same the same the same the sameinformation
Skewed with the Approximately Slightly Slightly Slightly Slightlysame division the same decreases decreases decreases increasesbut upstream
Number of Increases Increases Increases Increases Approximatelytiers the same
greater swings. Demand variability became amplified up the supply chain. Thephenomenon was described as the ‘bullwhip effect’.
This effect can cause excessive inventory stocks, poor customer service,reduced productivity, poor usage of transport capacity and unnecessary productionre-scheduling. This often leads to substandard quality and hence returned prod-ucts. Four main causes have been identified for this effect. These are the act ofdelaying orders until an economic lot is accumulated, price fluctuations and pro-motions, product demand exceeding supply and forecasting. Many models havebeen produced including the lead-time distribution as shown in Table 10.2.
The bullwhip effect can also travel down the supply chain. When demandexceeds supply, customers react by raising their orders to ensure that they havea sufficient amount to cover their needs (Donovan, 2001). However, it may be afalse picture compared to the true consumer demand or usage. The effect has beenconsidered through product life cycle (Derrick, 2001) as shown in Figure 10.3.
It has also been found (Reddy, 2001) that the longer the lead times forinformation and material, the stronger the bullwhip effect.
10.3 Forecasting
As discussed earlier, if a carbonated soft drinks manufacturer knew exactly thedemand for its products then it would almost certainly be able to operate its supplychain with maximum efficiency. Full product and material stock levels would bevirtually non-existent. The reality is that this is never achieved as the future cannotbe predicted with certainty. The best that an organisation can achieve is to makean estimate of the likely demand. In SCM this prediction is known as a forecast ofdemand. What it predicts can be measured in terms of accuracy and this performance
Steen: “chap10” — 2006/4/27 — 18:31 — page 300 — #11
300 CARBONATED SOFT DRINKS
Supply cannot meet initial demand resulting in real shortages
Channel partners over-order in an attempt to meet demand and stock shelves
As supply catches up with demand, orders are cancelled or returned
Financial and production planning are not aligned with real demand, therefore production continues
As demand declines, all parties attempt to drain stocks to prevent write offs.
Launchdate End of
life
Units perperiod Supply
Channelorders
5
4
3
2
1
1
2
5
4
3
True end customerdemand
Figure 10.3 The bullwhip effect through product life cycle. Taken from Donovan, 2001.
result should be reviewed at the highest levels within the organisation as it hassignificant implications on the overall efficiency of the business.
10.3.1 Forecast breakdown or types
A forecast for carbonated soft drinks usually comes in three distinct parts whichare subsequently used for different purposes within the company. Sometimes theseparts can be issued or developed as three separate forecasts; if this is the case, thencross-referencing must take place.
The first part is the long-term forecast. It is depicted at the highest level, fre-quently detailed as litres of a brand sold per annum running for at least 5 butoccasionally 10 years. This part of the forecast is often accompanied by a narrativewhich discusses demographics and consumer trends for different product attributesand drinking occasions. They are used to strategically plan the business in terms ofnew product development and for capital investment decisions in plant and facilities.
The second part is the medium-term forecast. It normally covers a rolling12–18 months or so and attempts to define the number of cases expected to be
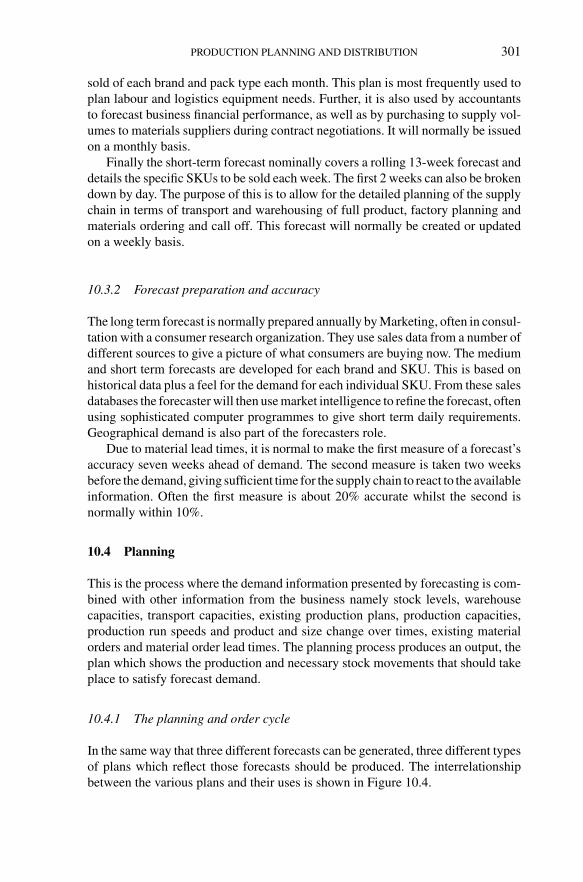
Steen: “chap10” — 2006/4/27 — 18:31 — page 301 — #12
PRODUCTION PLANNING AND DISTRIBUTION 301
sold of each brand and pack type each month. This plan is most frequently used toplan labour and logistics equipment needs. Further, it is also used by accountantsto forecast business financial performance, as well as by purchasing to supply vol-umes to materials suppliers during contract negotiations. It will normally be issuedon a monthly basis.
Finally the short-term forecast nominally covers a rolling 13-week forecast anddetails the specific SKUs to be sold each week. The first 2 weeks can also be brokendown by day. The purpose of this is to allow for the detailed planning of the supplychain in terms of transport and warehousing of full product, factory planning andmaterials ordering and call off. This forecast will normally be created or updatedon a weekly basis.
10.3.2 Forecast preparation and accuracy
The long term forecast is normally prepared annually by Marketing, often in consul-tation with a consumer research organization. They use sales data from a number ofdifferent sources to give a picture of what consumers are buying now. The mediumand short term forecasts are developed for each brand and SKU. This is based onhistorical data plus a feel for the demand for each individual SKU. From these salesdatabases the forecaster will then use market intelligence to refine the forecast, oftenusing sophisticated computer programmes to give short term daily requirements.Geographical demand is also part of the forecasters role.
Due to material lead times, it is normal to make the first measure of a forecast’saccuracy seven weeks ahead of demand. The second measure is taken two weeksbefore the demand, giving sufficient time for the supply chain to react to the availableinformation. Often the first measure is about 20% accurate whilst the second isnormally within 10%.
10.4 Planning
This is the process where the demand information presented by forecasting is com-bined with other information from the business namely stock levels, warehousecapacities, transport capacities, existing production plans, production capacities,production run speeds and product and size change over times, existing materialorders and material order lead times. The planning process produces an output, theplan which shows the production and necessary stock movements that should takeplace to satisfy forecast demand.
10.4.1 The planning and order cycle
In the same way that three different forecasts can be generated, three different typesof plans which reflect those forecasts should be produced. The interrelationshipbetween the various plans and their uses is shown in Figure 10.4.
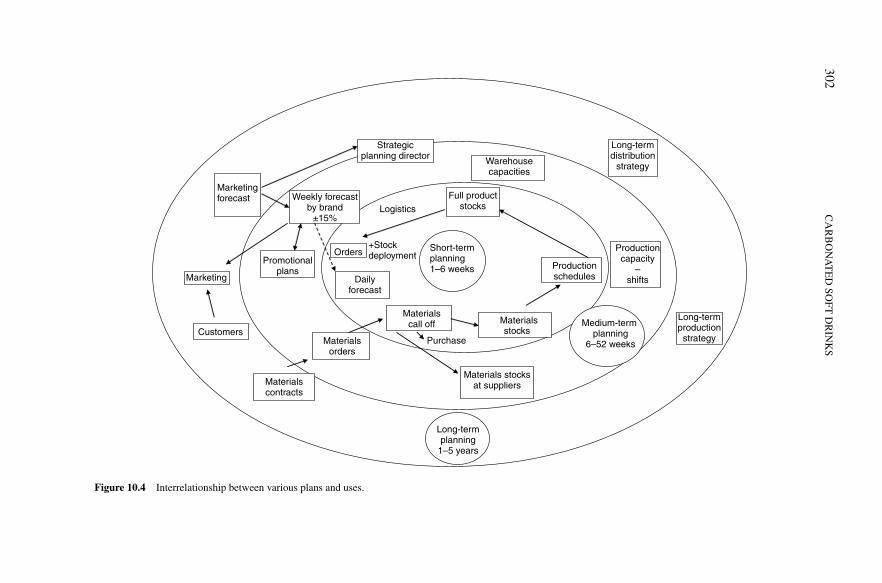
Steen:“chap10”
—2006/4/27
—18:31
—page
302—
#13
302C
AR
BO
NA
TE
DSO
FTD
RIN
KS
Short-term planning1–6 weeks
Marketingforecast
Marketing
Customers
Materialscontracts
Strategicplanning director
Weekly forecastby brand
±15%
Promotionalplans
Materialsorders
Materials stocksat suppliers
Productioncapacity
–shifts
Warehousecapacities
Full productstocksLogistics
Orders
Dailyforecast
Materialscall off
Purchase
Materials stocks
Productionschedules
Medium-term planning
6–52 weeks
Long-termplanning
1–5 years
Long-termdistribution
strategy
+Stockdeployment
Long-termproduction
strategy
Figure 10.4 Interrelationship between various plans and uses.

Steen: “chap10” — 2006/4/27 — 18:31 — page 303 — #14
PRODUCTION PLANNING AND DISTRIBUTION 303
To accommodate the complexity of data, various computer Information Systemshave been developed to support the planners in their decision making. This familyof applications was called ‘Materials Requirements Planning’ or MRP systems,and these were used to calculate dependent demand requirements using a ‘bill ofmaterials’ which details what components go into a product and existing inventoryrecords. Such systems were extended to more complex MRP II systems whichstood for manufacturing resources planning and were used to gather live inventorydata from complex processes together with capacity, human resources and financialinformation. The more recent development has been Enterprise Resource Planningsystems enabling data to be shared across an entire organisation.
The process of gathering the necessary information and producing a plan istermed a planning cycle. The frequency of this activity is most often geared to theproduction of a new forecast. Thus, long-term plans based on the output of thelong-term forecast are produced and reviewed often annually. The plans that theygenerate are used to:
1. Match production and warehousing capacity and facilities to the anticipateddemand. For example, the planning and approval, design, purchase, man-ufacture, delivery installation, commissioning of a new packaging line tobeing fully operational would normally take around 18 months.
2. The purchasing of materials is commonly via a contract. Often there isan annual negotiation but for some materials, for example, cans, extendedagreements of 3 to even 5 years are possible. To commit to these sorts ofcontracts, the purchasing professional requires a forecast of likely demand.
3. Capital investment decisions around materials handling equipment andvehicles are normally taken assuming a 5-year investment and depreciation.
Strategic decisions based on the above are normally taken or reviewed andconfirmed at the board level.
The medium-term plan is produced following the issue of the medium-termforecast on a monthly basis. It will provide factory production volumes normallyby month. Modern MRP II and ERP systems can also provide bills of materials tosupport those plans. The information is used to:
1. prepare budgets and monitor, review and manage financial performance,2. plan the shift patterns of the labour force,3. used for annual materials contract preparation,4. provide material demand forecasts to suppliers,5. plan for plant maintenance overhauls and shutdowns,6. smooth peak demands by building stocks or raising requests to contract
pack volumes elsewhere,7. plan for transport needs and any third party contract requirements,8. plan for warehousing needs and any third party contract requirements.
Finally, the short-term plan is produced on a weekly basis, even though theforecast is only formally updated monthly. It is produced weekly to reflect the
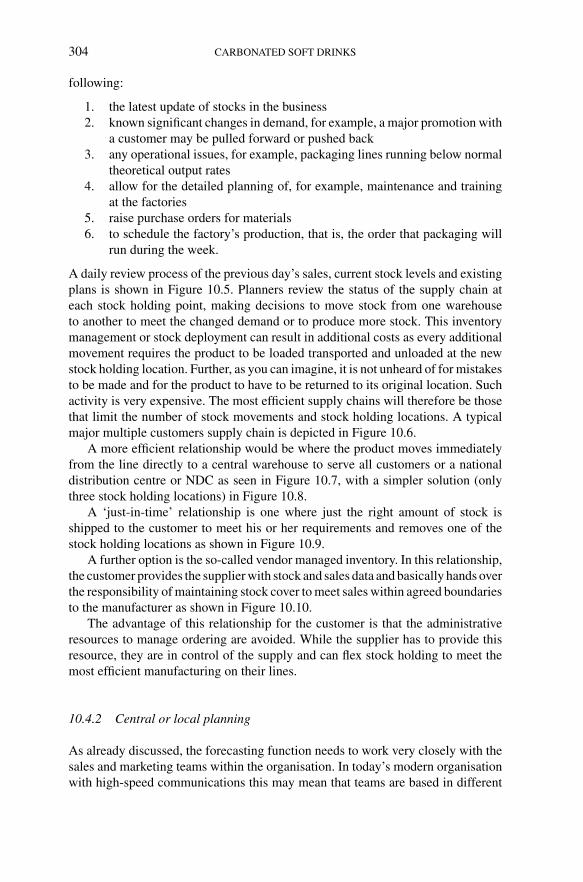
Steen: “chap10” — 2006/4/27 — 18:31 — page 304 — #15
304 CARBONATED SOFT DRINKS
following:
1. the latest update of stocks in the business2. known significant changes in demand, for example, a major promotion with
a customer may be pulled forward or pushed back3. any operational issues, for example, packaging lines running below normal
theoretical output rates4. allow for the detailed planning of, for example, maintenance and training
at the factories5. raise purchase orders for materials6. to schedule the factory’s production, that is, the order that packaging will
run during the week.
A daily review process of the previous day’s sales, current stock levels and existingplans is shown in Figure 10.5. Planners review the status of the supply chain ateach stock holding point, making decisions to move stock from one warehouseto another to meet the changed demand or to produce more stock. This inventorymanagement or stock deployment can result in additional costs as every additionalmovement requires the product to be loaded transported and unloaded at the newstock holding location. Further, as you can imagine, it is not unheard of for mistakesto be made and for the product to have to be returned to its original location. Suchactivity is very expensive. The most efficient supply chains will therefore be thosethat limit the number of stock movements and stock holding locations. A typicalmajor multiple customers supply chain is depicted in Figure 10.6.
A more efficient relationship would be where the product moves immediatelyfrom the line directly to a central warehouse to serve all customers or a nationaldistribution centre or NDC as seen in Figure 10.7, with a simpler solution (onlythree stock holding locations) in Figure 10.8.
A ‘just-in-time’ relationship is one where just the right amount of stock isshipped to the customer to meet his or her requirements and removes one of thestock holding locations as shown in Figure 10.9.
A further option is the so-called vendor managed inventory. In this relationship,the customer provides the supplier with stock and sales data and basically hands overthe responsibility of maintaining stock cover to meet sales within agreed boundariesto the manufacturer as shown in Figure 10.10.
The advantage of this relationship for the customer is that the administrativeresources to manage ordering are avoided. While the supplier has to provide thisresource, they are in control of the supply and can flex stock holding to meet themost efficient manufacturing on their lines.
10.4.2 Central or local planning
As already discussed, the forecasting function needs to work very closely with thesales and marketing teams within the organisation. In today’s modern organisationwith high-speed communications this may mean that teams are based in different

Steen: “chap10” — 2006/4/27 — 18:31 — page 305 — #16
PRODUCTION PLANNING AND DISTRIBUTION 305
Specificwholesale demandforecast for factoryproducts (daily)
Actual customerorders (drawingfrom stock)
Stock holding rules
Daily
Existing factoryscheduledproduction
Materials. Orderadjustments. Finalorder ‘call off’quantities confirmed
Materials stocks and material supplyrestrictions
Full goods stocksGraphical report ofStock position or‘available topromise’ style report.Adjust productionschedules to meetprojected demands
Figure 10.5 Daily planning based around the order cycle.
PackagingSKU A
PackagingSKU B
Intermediatewarehouse
Customer
Warehouse
Warehouse
Figure 10.6 Typical major multiple supply chain.
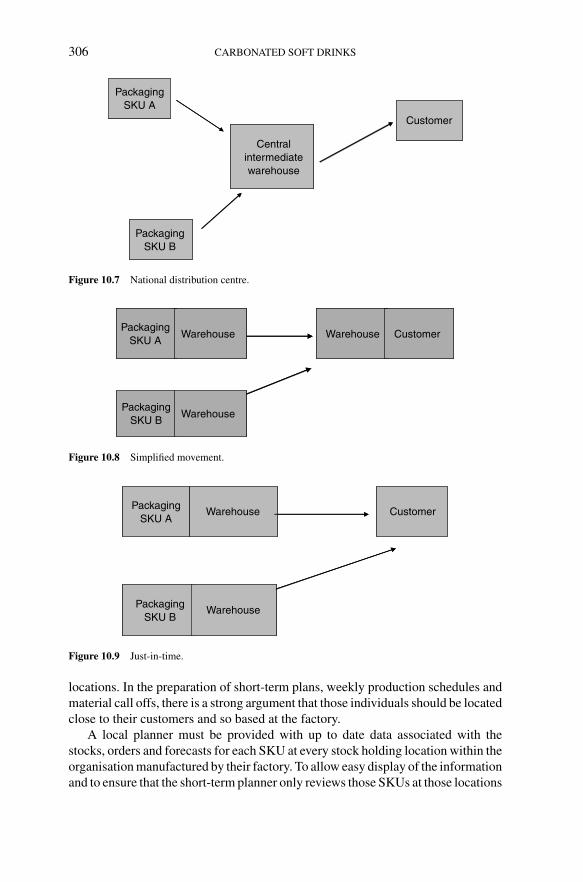
Steen: “chap10” — 2006/4/27 — 18:31 — page 306 — #17
306 CARBONATED SOFT DRINKS
PackagingSKU A
PackagingSKU B
Centralintermediatewarehouse
Customer
Figure 10.7 National distribution centre.
PackagingSKU A
Warehouse Warehouse Customer
PackagingSKU B
Warehouse
Figure 10.8 Simplified movement.
PackagingSKU A
Warehouse Customer
PackagingSKU B
Warehouse
Figure 10.9 Just-in-time.
locations. In the preparation of short-term plans, weekly production schedules andmaterial call offs, there is a strong argument that those individuals should be locatedclose to their customers and so based at the factory.
A local planner must be provided with up to date data associated with thestocks, orders and forecasts for each SKU at every stock holding location within theorganisation manufactured by their factory. To allow easy display of the informationand to ensure that the short-term planner only reviews those SKUs at those locations

Steen: “chap10” — 2006/4/27 — 18:31 — page 307 — #18
PRODUCTION PLANNING AND DISTRIBUTION 307
CustomerWarehousePackagingSKU A
PackagingSKU B
Figure 10.10 Vendor managed inventory.
0
1000
2000
3000
4000
5000
6000
8/3/
07
9/3/
07
10/3
/07
11/3
/07
12/3
/07
13/3
/07
14/3
/07
15/3
/07
16/3
/07
17/3
/07
18/3
/07
19/3
/07
20/3
/07
21/3
/07
22/3
/07
MinMaxStock
Figure 10.11 Brand V 330 ml cans – Middlesborough.
which require his or her attention that day, the information is often presented bythe IT system in a graphical form as shown in Figure 10.11.
10.5 Warehousing
This section is concerned with carbonated soft drinks after the packaging line.Because the product is carbonated, even in fairly weak packaging such as lowweight PET, carbonation provides the package with an internal pressure generatedrigidity. This is very helpful when looking to store and stack the product.
The main customers of carbonated soft drinks receive the product in cases whichare in turn assembled on pallets. Pallets of each SKU are assembled on a pallet bythe palletiser and presented ready for collection. The pallet is normally labelled ontwo sides. The normal standard for this label in the UK and Europe is EAN 128.A typical bar code is illustrated in Figure 10.12.

Steen: “chap10” — 2006/4/27 — 18:31 — page 308 — #19
308 CARBONATED SOFT DRINKS
Min 3 mm fromedge of label
Light marginmin 7 mm
Min
bar
code
hei
ght 3
2 m
m
Magnification 48.7% to 100% (50% = 60 mm)
Min bearer bar height 1 mm
Company name Pack volume
Product description
BBE date/Julian code Average weight
(a)
(b)
Text height min 7 mm
Text height min 3 mm
Light margin min 7 mm
Maximum barcode length (inc. light margin) 165 mm
Magnification 48.7–100%
Min
bar
cod
e he
ight
32
mm
Figure 10.12 Typical barcode label: (a) ITF-14 bar code illustration, (b) EAN-128 bar code illustration.

Steen: “chap10” — 2006/4/27 — 18:31 — page 309 — #20
PRODUCTION PLANNING AND DISTRIBUTION 309
Product is usually collected from the packaging line by some form of mechanicalhandling equipment (MHE). This is more often than not a fork lift truck (FLT) or inmodern larger factories by an automated guidance vehicle (AGV). At this stage theproduct is freshly made and is normally taken by the MHE to a warehouse whichis either adjacent to the packaging line or very close to it. Occasionally becauselines are housed in premises which have insufficient space for a warehouse, theyare immediately loaded onto vehicles and moved to a nearby warehouse facility.
There are three possible types of warehouse or store: manual, semi-automatedand fully automated.
Manual stores involve the ‘free’ movement of product in and around a warehouseby MHE totally by humans such as the equipment shown in Figure 10.13.
Advantages of manual warehouses are as follows:
• Low tech – if a piece of MHE breaks down, it can be replaced easily• Any reasonable building with a solid flat floor will be satisfactory• Lowest cost vehicles• Very low lead time – can hire trucks today for tomorrow• Easy to flex operation by adding men and trucks• Paper stock control acceptable.
Disadvantages:
• High level of semi-skilled labour required• Not secure• High floor area for stacks – some products cannot be stacked more than
1 pallet high• Low utilisation – only 60–70% practically achievable• 5–7-year truck replacement.
Semi-automated stores have both a manual element and some automation in theform of pallet conveyors, or automated picking machines or narrow aisle wireguided typically by ‘man riser’ FLTs (see Figure 10.14).
The advantages of a semi automated warehouse are as follows:
• Low land area – medium bay racked systems, 5–7 high racks• High utilisation – theoretically 99.9% plus• Lower cost• Fairly short lead time: 3–6 months.
Disadvantages:
• High level of unskilled labour required• Not secure• Slower operation – 2–3 min to store or retrieve a pallet• Specialist equipment – maintenance etc.• Specific building – height and floor• 5–7-year truck replacement

Steen: “chap10” — 2006/4/27 — 18:31 — page 310 — #21
310 CARBONATED SOFT DRINKS
(a)
(b)
Figure 10.13 Various types of mechanical handling equipment. (a) Fork lift truck (FLT). (b) A walkwith powered pallet truck (PPT). (c) Ride on PPT. (d) Hand pallet truck.
• Computer stock control system required – bar code readers and radio dataterminals (RDTs).
Automated stores do not involve people with pallet movements. IT-controlled sys-tems are used to automatically store and retrieve products (automatically store
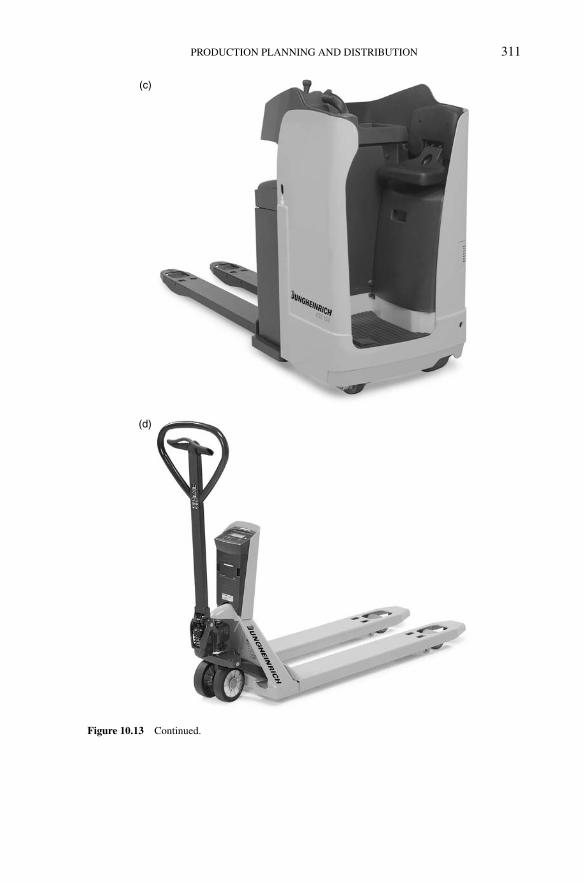
Steen: “chap10” — 2006/4/27 — 18:31 — page 311 — #22
PRODUCTION PLANNING AND DISTRIBUTION 311
(c)
(d)
Figure 10.13 Continued.
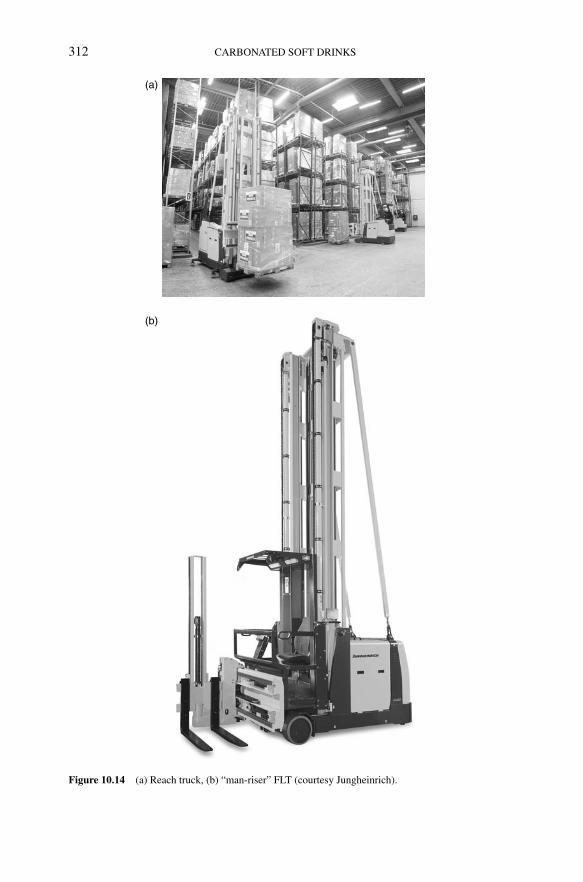
Steen: “chap10” — 2006/4/27 — 18:31 — page 312 — #23
312 CARBONATED SOFT DRINKS
(a)
(b)
Figure 10.14 (a) Reach truck, (b) “man-riser” FLT (courtesy Jungheinrich).
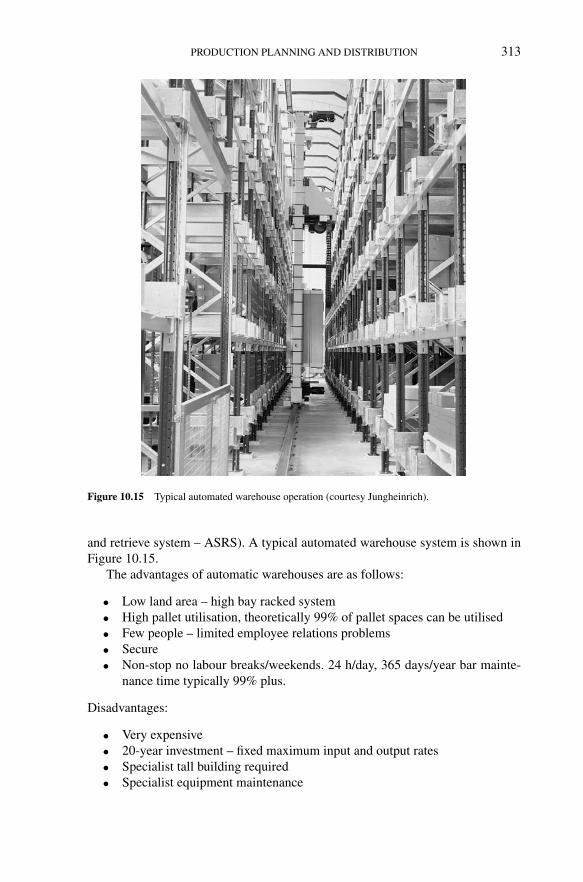
Steen: “chap10” — 2006/4/27 — 18:31 — page 313 — #24
PRODUCTION PLANNING AND DISTRIBUTION 313
Figure 10.15 Typical automated warehouse operation (courtesy Jungheinrich).
and retrieve system – ASRS). A typical automated warehouse system is shown inFigure 10.15.
The advantages of automatic warehouses are as follows:
• Low land area – high bay racked system• High pallet utilisation, theoretically 99% of pallet spaces can be utilised• Few people – limited employee relations problems• Secure• Non-stop no labour breaks/weekends. 24 h/day, 365 days/year bar mainte-
nance time typically 99% plus.
Disadvantages:
• Very expensive• 20-year investment – fixed maximum input and output rates• Specialist tall building required• Specialist equipment maintenance
Steen: “chap10” — 2006/4/27 — 18:31 — page 314 — #25
314 CARBONATED SOFT DRINKS
• Long lead time – 2 years from the initial concept• High pallet quality required or use slave pallets• Sophisticated control systems and interfaces.
A further aspect of warehousing is its location for which the considerations are:
• relative location of stock supply• main customer locations (range and possibly regional significance)• avoidance of ‘doubling back’. Journeys should always be away from the
point of receipt• space required and storage type• cost of facilities in the area• cost of labour• access of vehicles.
Other issues to be considered in the warehouse are temperature, humidity, theenvironment, stock control, health and safety and stock rotation.
Product staling or ageing will increase with temperature. Thus, in hot condi-tions, every effort should be made to keep the product cool or cold. If cardboardpackaging becomes damp, it loses rigidity and strength. Cardboard used in pack-aging, therefore, should be used in the UK within a few months of receipt from thesupplier or it will start to perform badly in the packing machines with more frequentline stoppages and high material wastage. It is normal practice to keep such pack-aging materials in a plastic sleeve so as to minimise any moisture movement. Mostpackaging converters actually do so in a humidity controlled environment. Oncepacked, particularly with shrink film around the package and built onto pallets,there is protection from moisture.
10.5.1 Environment
Carbonated soft drinks are classed as food. Consequently, product protection fromvermin and weather-borne particles, such as dust or fallen leaves etc. is essential.Warehouses holding carbonated soft drinks are commonly fitted with rapid rollerdoors to external locations. These doors operate by detecting the approach of anFLT using sensors (normally in the floor). The door typically opens within a fewseconds and following a fixed time period, closes again quickly. The seal at thebase of the door must not be big enough to allow a pencil to pass under it. This isapproximately all the space a mouse would need to enter the building! Even withthese measures, birds are often a significant issue and must be culled as they canfoul on product.
10.5.2 Stock control
Stock control requires disciplined standard procedures which must be constantlymaintained while the warehouse is in operation in order to keep the physical stock

Steen: “chap10” — 2006/4/27 — 18:31 — page 315 — #26
PRODUCTION PLANNING AND DISTRIBUTION 315
under control using either a paper or a computer system. To that end locations onthis system must represent physical locations in the warehouse.
Common processes to adopt are:
1. In – Check using weighbridge or pallet weighing scales+audited. Bar codescanning. Random management checks of received stock.
2. Internal – Movement of stock with documentation/on system only. Perpetualstock checks. Full stock checks (weekly/monthly/quarterly).
3. Out – Check using weighbridge + auditor, bar code scanning, randomvehicle searches. Leaving driver responsibility, discipline if mistakes.
Warehouse health and safety issues must be considered at all times. Risk assess-ments and other controls must be put in place in warehouses and transport yardsbearing in mind the following:
• Vehicles are responsible for 70% of fatalities at work• Over 50% occur when reversing• Pedestrian control and access – why are people walking around?• Collapsing stacks of full products and materials• Picking and movement of cased product – good manual handling training is
essential.
Stock can be taken out of the warehouse or rotated according to a variety of differentrules or types, for example:
• FIFO – First stock (in the warehouse) first out• FEFO – First expiry first out• LIFO – Last in first out• Smallest location first out• FEFO with customer specific on shelf life remaining.
FEFO is becoming the industry norm, as many customers now require at least70% of a product’s shelf life remaining.
10.6 Transport and legislation
Transport and related legislative issues vary from country to country and should beset up in compliance with local needs.
A variety of vehicle body types are available. Ideally on multi-drop deliveries,the carbonated soft drinks manufacturer service driver wants to be able to accessthe load quickly at the delivery point. Manual handling on and from the vehicleshould be minimised so that the product is as close to the floor as possible. Variousbodies can accompany this. Figure 10.16 shows a typical vehicle used for deliveringproduct to multiple drop customers.

Steen: “chap10” — 2006/4/27 — 18:31 — page 316 — #27
316 CARBONATED SOFT DRINKS
Figure 10.16 A “drinks” multistop delivery vehicle.
10.7 Measuring supply chain performance
The overall measurement of performance in the carbonated soft drinks supply chaincan be fairly complicated. It is essential that a balance is struck between serviceand cost. The performance of people and resources used in the supply chain mustalso be balanced.
10.7.1 Service
On time and delivered in full – the standard service measure is to deliver the orderwith no mistakes or damage at the time specified to the customer. Factors include:
• delivery time• quantity in full – and the handling of customer errors and changes• the quantity that can be legally carried on a vehicle• out of stock problems.
Complaints:
• what constitutes a complaint? Will the complaint be written or verbal?
Production line downtime – lost time due to shortages of materials or because thefull product is not taken from the line in time before the line stops. Production timelost due to changeovers.
1. Does the line need to be changed over because it was running behind pro-gramme and a product scheduled for later in the plan to be brought forwardto satisfy customer demands?
2. Were the materials short because the manufacturer had given the supplier ashorter lead time than was agreed upon for the materials?

Steen: “chap10” — 2006/4/27 — 18:31 — page 317 — #28
PRODUCTION PLANNING AND DISTRIBUTION 317
10.7.2 Costs
Cost per case/pallets/tonne – The costs over a period of time divided by the numberof cases/pallets/tonnes delivered to customers.
10.7.3 People
Productivity – cases/orders handled/transported per warehouse/driver/administratorman hour.
10.7.4 Resources
Warehouse utilisation – expressed as a percentage of the capacity of the location.
10.8 Conclusions and future developments
This chapter has attempted to cover some of the many topics and issues that thecarbonated soft drinks manufacturer must consider when servicing his or her cus-tomers. To survive in today’s modern marketplace, efficient execution of the issuesdescribed above is essential for a business that wishes to survive. How best to costeffectively meet the customers’ needs and remain in control of the supply chain isa difficult challenge but certainly achievable.
Future developments not discussed include Radio Frequency IDentification(RFID) tagging where bar codes, initially on pallets and high value SKUs, arebeing replaced by these tags which can either transmit or reflect a 96-digit numberback to a receiver. It means that the bar code on products does not have to pass thescanner in a specific orientation for the coding details to be read. Developmentsare currently stalled while international standards are developed and agreed. Thepotential is for the ending of most of the manual intervention to read labels onproducts both in the supply chain and within retailer’s stores.
Increases in fuel and energy costs are important factors and could have sig-nificant implications on a national distribution centre and the modern centralisedeconomy of scale factory. Small local factories may in future be able to undercutrivals due to significantly reduced distribution costs!
Traffic congestion is also becoming a real concern in many countries.The apparent unstoppable rise of major multiple retailers with the apparent
decline of local and corner shops must also be a cause of concern in some coun-tries. Strong brands will be all the manufacturers can lever to ensure that theirproducts stay on their shelves although many supermarkets now favour their ownlabel products in preference to other brands.
The final development considered is that of the internet linking the supplychain in ever closer co-operation and company relationships and interdependencies.
Steen: “chap10” — 2006/4/27 — 18:31 — page 318 — #29
318 CARBONATED SOFT DRINKS
This will allow raw material manufacturers access to actual consumer demand forthe carbonated soft drink manufacturers products and their plans so as to furtheroptimise their stocks and production capacity.
Bibliography
Baertschi, M. and Schonslcben, P. (Oct. 2002) What is the bullwhip effect caused by? Presenta-tion by Joerg Nienhaus SCM group Supply Chain World Europe. http://www.beergame.lim.ethz.ch/Bullwhip_Effect.pdf
Carlsson, C. and Fuller, R. (June 2001) A Fuzzy approach to taming the bullwhip effect.www.abo.fi/∼rfuller/acoil00.pdf. Accessed on May 2005.
Christopher, M. and Ryals, L. (1999) Supply chain strategy: it’s impact on shareholder value.International Journal of Logistics Management, 10(1), 1–10.
Davenport, T.H. (1998) Putting the enterprise into the enterprise system. Harvard Business Review,76(4), 121–132.
Derrick, R.D. (June 2001) Accenture: Challenging the bullwhip effect with advanced informationsharing. http://www.accenture.com/xd/xd.asp?it=enweb&xd=ideas%5Coutlook%5Cpov%5C infos-haring.xml. Accessed on May 2005.
Donovan, R.M. (June 2001) Supply chain management: Cracking the bullwhip effect, Part 3.http://www.rmdonovan.com/pdf/SCM_PartIII.pdf. Accessed on May 2005.
DUBS Strategic Supply Chain Management Module Material. This is drawn from:(a) Lee, H.L., Padmanabhan, V. and Whang, S. (Spring 1997) The bullwhip effect in supply chains.
Sloan Management Review, 38(3), 93–102.(b) Taylor, D.H. (2000) Demand amplification: has it got us beat? International Journal of Physics
Distribution and Logistics Management, 30(6), 515–533.Durham University Business School (2003) MBA Distance Learning Strategic Supply Chain Module
Course Material 316M.Factorylogic: The bullwhip effect. 10 June 2001. http://factorylogic.com/nl_19.asp. Accessed on May
2005.Impact of lead-time distribution on the bullwhip effect and supply chain performance. 10 June 2001.
www.comp.nus.edu.sg/∼liyan/leadtime%20distribution.pdf. Accessed on May 2005.Lee, H.L., Padmanabhan, V. and Whang, S. (1997) Information distortion in a supply chain: The bullwhip
effect. Management Science, 43, 546–558.LogicTools: Is better forecasting a solution to the bullwhip effect?. 10 June 2001. http://www.logic-
tools.com/resources/articles/bullwhip.html. Accessed on May 2005.Monczka, R.M., Trent, R.J. and Handfield, R.B. (1998) Purchasing and Supply Chain Management.
South-Western College Publishing.QuickMBA: The bullwhip effect. 10 June 2001. http://www.quickmba.com/ops/bullwhip-effect/.
Accessed on May 2005.Reddy, R. Intelligent enterprise: Taming the bullwhip effect. http://www.intelligententerprise.com/
010613/supplychain1_1.jhtmlSlack, N., Chambers, S. and Johnson, S. (2001) Operations Management (3rd edn). Pearson Educational,
London.

Steen: “chap11” — 2006/4/27 — 18:31 — page 319 — #1
11 Quality, environment and food safety systemsRay Helliwell
11.1 Why have systems?
11.1.1 Definitions
Normally, if a job is to be completed properly, then 50% extra time needs to beallocated to it. This may be mundane, but worthwhile, because that extra effortavoids repetition of those parts that went wrong. Attention to detail; not just com-pleting an action, but recording the fact so that everyone can establish that it hasbeen done, reviewing the consequences to make sure the correct result was obtained,changing the way it is done to make it better, easier, cheaper, quicker next time andinforming or training those who need to know. It takes a special sort of temper-ament to design and implement operational, sensible and cost-effective systems.Persistence and patience, suspicion and cynicism are all needed whilst maintaininga logical approach to achieving the corporate objectives.
Some definitions are as follows:
Quality = Consistency
Environment = Waste produced
Food safety = Risk of hurting someone
Management = Giving instructions
Systems = Getting the job done properly and efficiently
In summary – making good drinks consistently, wasting little and hurting noone.
That puts the very important systems part in perspective. It is easy to say thatemploying someone to design management systems is a pure overhead cost and ismoney off the bottom line, but not designing them takes much more money off thebottom line, and much more unpredictably.
11.1.2 Space shuttle fails
Looked at from another point of view, not only is the unpredictable bill or courtappearance unacceptable but the benefits are also legion, primarily because if theprocedures have been designed at the correct level (i.e. starting with the Chairman),and are agreed by the team below, and implemented by properly trained personnel,
Steen: “chap11” — 2006/4/27 — 18:31 — page 320 — #2
320 CARBONATED SOFT DRINKS
then they will cope with, almost, any circumstances. Why ‘almost’? – human errorcaused even the space shuttle to fail. If too complicated, with many tiers of deci-sion making, communications fail and accidents happen more often. Manufacturersare only asked to be ‘reasonable’ and ‘duly diligent’, not perfect. The skill in thisfield is to know how minimalist an operation can afford to be, yet still protectagainst multiple concurrent human omissions and errors. The term ‘minimalist’ isused because, if a system is designed to be inexplicably labour-intensive or com-plicated, you can be confident that it will not be carried out properly or, worse,not at all, not to mention being over-expensive. Systems need to be logical, easilyunderstood and have a reason. An additional benefit is that each company cannow more easily control the input performance from its suppliers because thesystems used demand records of all critical information, thus providing an audittrail.
11.1.3 Risk management
Another related issue, ‘risk management’, is applied to all company activities. Thishas always been an issue in product quality but, more recently, food safety andenvironmental issues have been added. Quality is a ‘given’ because formalisedmanagement control systems have been applied to it in most companies for adecade and more; these other issues now need the same treatment. Food safetyconcerns (real and imagined) have destroyed major brands and negated profits.Product recalls are now so frequent that there is a web site to list them. How-ever, because recalls are now more common, the stigma of product failure is lessand rarely means the demise of a brand or company. Nonetheless, the impact oncompany profits is often severe, and the resulting internal company conflicts areoften ‘career-changing’. The environment has been largely ignored by most ofthe industry over the decades. Now it has been pushed up the political agendaand the consequences are to be seen in legislation and on budgets in all manu-facturing areas. The new EU style of reporting company results means that thecompany environmental risks (and performance) will need to feature in annualreports.
11.1.4 A solution?
In order to address all these concerns, soft drinks companies need a solid manage-ment control structure, expert technologists, and sound, cost-effective managementsystems to implement the board’s objectives. The author’s perspective is from fac-tory and production control, but there is always an impact on the consumer, customeror the environment for every activity. Achieving control through management sys-tems is the only way forward and the International Standards Organization productscan be used throughout the world.
Steen: “chap11” — 2006/4/27 — 18:31 — page 321 — #3
QUALITY, ENVIRONMENT AND FOOD SAFETY SYSTEMS 321
11.2 Management control
11.2.1 Constraints – legislation
Much of this book is about machinery, technology and the intricacies of theformulation and production of soft drinks. From the beginning of productformulation, much legislation needs to be understood and translated into makingsafe and compliant products. This inexorable introduction of legislation is a fea-ture that will continue. Having understood every other aspect of soft drinks, thereis no point in starting a filling machine until it is possible to make millions ofpackages, all identical, and within specification, with no errors or defects andto continue to do so with certainty to the last bottle or can; this is the crucialpoint. In addition, it is no longer acceptable to be in a manufacturing indus-try if the environmental impacts of the process or, to a lesser extent, products,are outside acceptable limits. Consumer awareness and public access to com-pany activities and performance have provided unprecedented pressures in thisrespect.
Once this fact is accepted, it quickly becomes apparent how ineffective effortsare if not implemented in a controlled way. One can see, above, how there isthe first inkling of the constraints put on the industry – ‘within specification’,and ‘no errors or defects’. These are expected in the products we buy each day,but how can this be made to happen in the beverage industry? If these productquality principles and targets are used, we will automatically meet the require-ments of UK legislation, even the most recent Food Hygiene Regulations 2005.The legislation is designed to protect the consumer and the public at large butfalls far short of any defining management systems’ requirements. These reg-ulations though, for the first time, spell out the obligation to be able to tracethe materials used back to the supplier. It is hard to imagine a soft drinks com-pany that has not done this for many years. There is, also to be implementedin the UK in 2005, the Pollution, Prevention and Control Regulations providingthe additional constraint of managing and minimising the environmental impactof manufacturing. Though the legislation cannot be ignored, it can only real-istically provide a minimum requirement, not act as a leading light for goodpractice.
11.2.2 Stakeholders determine your future
There is a much more exacting, unwritten, agreement with all the stakeholders –consumers, customers, employees and shareholders – based on their expectationsof product quality, product image and, ultimately, the company image. Often thisprovides the means to differentiate between products and between companies in thepublic’s perception. To work at the limits, with weak principles (and systems), justabout meeting legislative requirements, and sometimes compromising on quality

Steen: “chap11” — 2006/4/27 — 18:31 — page 322 — #4
322 CARBONATED SOFT DRINKS
is an uncomfortable place to be. In the lowest margin businesses, it may be bornof necessity. To be ahead of the legislation, taking pride in meeting increasinglychallenging quality, environmental and food safety targets, whilst minimising allaspects of corporate risk, can only be achieved by strict management control of allcompany activities.
11.2.3 Size matters
The size of a company makes a considerable difference to the management tech-niques employed. Management control in a small company is by a close-knit anddedicated management team, with a consistent approach and common (or, busi-ness) sense. Often, such a company can see no point in a systems approach becausethe staff has also been there for many years; control of the processes is achievedthrough regular personal contact with the management team. It also requires a closerelationship with suppliers, customers and with the local authorities. This team maybe the owners or board of directors who will be dedicated to the success of the com-pany (and directly rewarded in relation to that success). This management methodquickly breaks down as a company increases in size. Besides having to maintainthe effort 24 h a day, the management team has to contend with not just local butnational and international legislation, and similarly widespread customers. Proce-dures carried out personally also need to be carried out by others and, thus, need tobe communicated.
11.2.4 Experts, but not owners
For a larger company, the concept of a dedicated management team is just as valid –a team of experts, often with many years of soft drinks experience, but now moreremote from the day-to-day operation and more remote from the ownership of thecompany. The outputs of this team are specifications and documented proceduresto be achieved and implemented by others in the development, production and dis-tribution of consistently high quality and safe drinks. The result is still managementcontrol of the company, except with this additional layer of communications. It isthis need for communications between employees who rarely, if ever, see each otherthat makes the difference between needing and not needing management systemsto achieve the necessary degree of control. That is not to say that managementsystems are not applicable to, or cannot help, smaller companies; the discipline ofapplying the principles of a management system can assist in the efficient runningof any company. Returning to the crucial aspect of ‘success or failure’ – the maincriterion, regardless of size, is how the principles and controls are communicatedand implemented. This chapter will offer an insight into the main managementsystems related to control in the beverage industry. It cannot, however, help muchwith implementation – that remains the domain of the readers (and, if necessary,the management gurus).

Steen: “chap11” — 2006/4/27 — 18:31 — page 323 — #5
QUALITY, ENVIRONMENT AND FOOD SAFETY SYSTEMS 323
11.3 Management systems
11.3.1 Four stages
Any management system has four stages: the generation of a compendium ofmanagement decisions (policies and procedures in a manual), assistance with themethod of implementation (training in the procedures), a list of data requirements(forms or computer records) that must be kept to verify that the managementdecisions have been implemented and the review of the outcome (to act as animprovement mechanism).
11.3.2 Decisions
Decisions provide a formula on how to not just survive, but to prosper within atough legislative framework, to meet the exacting specifications and to control theprocesses.
The management decisions taken in any company, without a system to com-municate them, become just a dusty file on the shelf (or, these days, an unopenedfile on the computer). The word ‘decisions’ can mean specifications, work meth-ods, equipment use, procedures, information-gathering requirements and systemmaintenance reviews. They will not all be in the one manual, or in just one locationthough they are often referred to as ‘The Manual’. One way to help is to make surethat the decisions include informative content and are linked to the forms (or otherinformation-gathering method) to be used. The keys to a good management sys-tem is to have the correct persons taking the decisions, the correct accessibility ofthem by trained staff and, critically, a culture such that personnel, at all levels, haveconfidence in them. On the other hand, staff must be made aware of the limits oftheir freedom to act, that is, to know when circumstances are outside normal oper-ating parameters, how to refer back for new decisions. Once all the decisions arecollected together and written down, we have the wherewithal to run the company– the start of a management system that no-one has any excuse for not complyingwith. It remains for this team of decision makers to maintain them in a current andunambiguous state.
11.3.3 Make the product
Next it is necessary to provide resources, the correct equipment and personnel,and to communicate the decisions fully. Communication alone is sometimes notenough. There is always an awareness of the need to train new employees, rightfrom induction into the company. The fact that new procedures sometimes needmore than just a briefing and a new form printed out is often missed. It is neces-sary to demonstrate how the system fits together, what the logic is, why certain

Steen: “chap11” — 2006/4/27 — 18:31 — page 324 — #6
324 CARBONATED SOFT DRINKS
measurements need to be taken so frequently, why the start-up procedure has tobe carried out in a set order. This sort of communication event forces the decisionmakers to question their output, receive criticism on it, and provide credibility andconfidence in the decisions. No matter how experienced, there is always somethingnew to learn.
11.3.4 Test and record results
Gathering results from tests and confirmation of actions taken during production(or any other process) provide a permanent record of the conditions that pertainedat the time any action was taken or can/bottle was produced. This often results in,later, being able to identify the most likely cause of failure. The most commonoccurrence is when a product goes out of specification, then the production teamidentify and isolate the product(s) affected. The plan is always to isolate slightlymore than is strictly necessary and to re-check it later to see exactly at which pointthe process failed. Many errors can then take place. First, the cut-off and re-startpoints can be miscalculated, particularly, for example, if some of the product wentinto a tunnel pasteuriser. Then, the order of packing onto pallets probably does notquite stay the same as when filled – for example, mixing on the multi-lane conveyor.Then, the person testing misunderstood the pallet numbering sequence, particularlyas the last pallets were removed before getting a pallet label, just to get them out ofthe way. Not to mention that whilst waiting for the last of the product to come outof the pasteuriser, the first pallets were despatched before being isolated becausethe product was desperately needed and it happened at shift change and no-onepassed on the information. It is always a sad conclusion to an investigation whenit is found that everyone knew there was a problem, the product was isolated, butsome of it still escaped to the customer. The system should protect against this.
11.3.5 Review
The final stage is that of review. To complete any system, it is essential that all reportsof system failure are gathered. These can be where new circumstances arose and thesystem was not yet in place. It is the breakdown of communication, the productionof a defective product, out-of date specifications or procedures being used. Some ofthis will be reported internally and some by the auditing of the system and, sadly,some will be reported by the customers. A review of all these items will give riseto amended procedures and, occasionally, a team may need to be gathered to workon an improvement programme for the more intractable problems. This review iscrucial to the well-being of the system.
Those already familiar with the International Standards will, hopefully, recog-nise that I have described the ‘Plan, Do, Check, Act’ cycle for continuousimprovement that is a common feature of the International Standards, of whichmore later, which is tabulated in Table 11.1.
Steen: “chap11” — 2006/4/27 — 18:31 — page 325 — #7
QUALITY, ENVIRONMENT AND FOOD SAFETY SYSTEMS 325
Table 11.1 Plan, Do, Check, Act.
Plan Do Check Act
Put management Train personnel and Do the tests and Reviewdecisions in a make it happen produce the records andmanual of events improve
11.4 International management systems – why?
11.4.1 Notice board systems
Before the introduction of international management systems, written confirmationof decisions was often a notice to employees on a notice board, and was only usedfor the most important issues. The ‘notice board approach’ was mainly used toprotect the management, on the basis, ‘you have been warned’. Now, the writtenconfirmation is a ‘procedures manual’. It would be erroneous to assume that thereal purpose is anything more – the prime objective in a current litigious world is tocarry on the business without resulting in directors spending time in court (or jail!).Fortunately, this is achieved by carrying on our businesses in such a way as to protectour customers from harm – mutually beneficial objectives. The procedures manualis needed because the notice board was not large enough to hold all the essentialinformation. It is now fairly rare to see a notice board with a sign informing that,
‘All employees are responsible for tidying their own work area’
as was the case less than twenty years ago. This sort of information is now morefrequently included in the induction training. The more positive aspect of the proce-dures manual is that it is written by the ‘dedicated management team’, whose wideexperience and certain knowledge that the ‘customer is king’ keep it indispensable.
11.4.2 Detect and protect
The method universally accepted for implementing decisions and for ensuring man-agement control is ‘documented management systems’. For example, a manual maysay that all sales orders must be reviewed for completeness. Alone, this is soundadvice but is useless unless the mechanism is provided. Entering a sales order ontoa computer system from a written order form, the next text in the manual may saythat each order must be entered twice. The computer system will have been set upto prompt and accept the data twice. There will always be an awareness of howdifficult it is to type long lists of numbers with consistent accuracy; a computercannot check against the paper copy, but it can match two sets of data to detectinput or ‘keying’ errors. If it is particularly important, the procedure may be mademore fool-proof by ensuring that the order is entered from two different computer
Steen: “chap11” — 2006/4/27 — 18:31 — page 326 — #8
326 CARBONATED SOFT DRINKS
operators so that anyone with a particular tendency to make a particular type of mis-take is not given the chance to make the same mistake twice. This sort of system isassisted by the computer’s inability to move to the next stage – not registering theorder without the matched inputs. The system needs to be designed with humanfailings foremost in mind, and the machinery (or computers) must be set to detectand protect against them.
11.4.3 Automation = automatically wrong
There is a different problem in a factory where the process continues automaticallyuntil someone intervenes. Having the latest technology is no guarantee that theoutput can be expected to be within specification. Neither can a set of finishedproduct analyses provide a guarantee. Many circumstances arise between the teststo catch out the unwary. Nevertheless, a test regime needs to be set to ensure thatthe process is producing within specification. The frequency of tests is based ontwo criteria: first, based on the level of confidence in the particular aspect to remainwithin specification, and second, based on the cost if a particular test shows that adefective product is being produced.
The first is one that most machine operators can see and agree with. The second ismuch more difficult to decide upon. This sort of cost information is rarely availableat the factory floor level but is essential to understanding the reason for the testregime. Automation does not mean automatically right.
11.4.4 Quantity and quality
The history of how such management systems have come about is distant and intri-cate. Following the industrial revolution, it was necessary to improve the efficiencyof physical labour input. The term ‘work-study’ came into use but it was rarely ratedfor the end result. It did, however, often result in the finding of more efficient waysof performing a task – parallel running, multi-tasking and automation. Automation:once physical effort was made less relevant by the accelerating stages of automation,many companies restructured to remove their ‘work study departments’; getting themaximum physical effort from an employee was no longer important. The politicsof labour relations also played its part. Change, brought about by improving tech-nology, reduced manning but increased the skill levels required. It is certain thatthis has been a factor in redirecting progress as the ‘people skills’ lagged behindtechnological advance, producing the so-called skills gap. The emphasis moved toone that made the newly automated systems maintain their own performance, withmachine setting specifications, tighter tolerance ranges, preventive maintenancetechniques, quality control measurements, action limits and acceptance criteria –all targeting process control. ‘Quality control’ becomes ‘quality assurance’ whenthe process becomes the subject of our attention. It is essential to ensure that weget quantity and quality.
Steen: “chap11” — 2006/4/27 — 18:31 — page 327 — #9
QUALITY, ENVIRONMENT AND FOOD SAFETY SYSTEMS 327
11.4.5 Systems converge
Many countries have been working on management systems. The individual effortshave been coordinated by the International Standards Organization (ISO), bring-ing today, common elements and a convergence in concepts used in each of thestandards. The International Standards Organization has taken ownership of, anddeveloped, the systems that now need to be examined more closely. The threemanagement systems have each followed a different route to becoming interna-tionally recognised, but are now known simply as ISO 9001 (Quality), ISO 14001(Environment) and ISO 22000 (Food Safety).
There is another simplistic way of looking at these standards that might assistwith understanding their raison d’être. ISO 9001 is designed to prevent cus-tomers and consumers from prosecuting the company or its employees, ISO 14001,neighbours and environment watchdogs, and ISO 22000, the food enforcementauthorities. No matter how these standards are viewed or implemented, nor howwe evaluate them, each one has come about through public and political pressure.ISO 9001, came about when we (as a country) could not produce quality goodsand imported too much, ISO 14001, when environmental groups were activatedby seeing the unsustainable exploitation of the earth’s resources, and ISO 22000when globalisation of the food industry meant we affect many more people whena production mistake is made. These three standards were a sensible and measuredresponse to the problems facing the country, also enabling industry to demonstratethat it is both ‘reasonable’ and ‘duly diligent’.
11.5 The standards – a brief background
11.5.1 ISO 9001 is the master
Note that the reason for the three sets of letters is that each is a British Standard(BS), a European Standard (Norme Européenne, or commonly called EuroNorme –EN) and an International Standard (International Standards Organization).
The requirements for a quality management system provides a series of controlsover all the aspects of a business (any business), and often known just as ISO 9001.It would certainly be erroneous to think that the title refers to just product quality; itrepresents all the customer-specified aspects of business: product, delivery, service,invoicing and complaints, that is, the quality of the management system, and thusthe quality of the company.
11.5.2 Customer pressure
Earlier it was demonstrated how industry has moved forwards from the belief thatautomated processes are perpetually under control. It is now rarely acceptable fora retailer to simply replace a defective bottle or can. The complainant has been

Steen: “chap11” — 2006/4/27 — 18:31 — page 328 — #10
328 CARBONATED SOFT DRINKS
Table 11.2 Audit types.
Type Auditors Subject to be audited
1st Internal auditor Internal systems
2nd Senior internal auditors Supplier’s systems
2nd Customer’s auditor Internal systems
3rd Independent auditor Internal systems
inconvenienced, sometimes frightened and, occasionally, physically harmed. Thisreflects badly on both the retailer and the manufacturer. The retailer’s response tothe consumer reflects the degree of commitment to creating a quality corporateimage. The response is always going to be more generous in those instances wherethe manufacturer is going to pick up the bill and more generous still if the retailer istrying to maintain a high level of customer confidence and, thus, loyalty. The policiesdrawn up by larger retailers on the handling of complaints and, more importantly,the allocation of the costs are often seen by manufacturers as draconian. Lettingcustomers or consumers down is not an option.
11.5.3 Customer audits
The soft drinks industry has been subjected to a plethora of second party customeraudits (Table 11.2). These should be fine if based on knowledge of the industry, thespecifications and the risks; an opportunity to see things differently and improvecontrols. Unfortunately, for many years, there was no common standard againstwhich to audit. Each manufacturer had to divert resource from an ‘action’ rôle toa ‘tour guide’ rôle as successive auditors needed attention. The risk of either notappearing to take the customer seriously, or not being able to answer the questions,meant that top technical staff spent weeks every year repeating the same informa-tion. The motivation for these audits was initially to protect the retailer from thelaw – selling products ‘not fit for purpose’ – but also to provide a quality image.If they provided a better product and service than their competitors, they couldjustify a higher price. The pressure seen by the retailers from their customers forbetter quality products came to industry through this route. The response was todevise a common quality system.
11.5.4 A standard is born
The UK Government tasked the British Standards Institute (BSI) and manufactur-ers to produce a set of quality procedures. In 1979 it became BS 5750 (now knownas ISO 9001). This was at a time when British goods could not compete with othernations’ goods because of a perceived quality deficit. Its original target was to createconsistency for ‘Kite-marked’ products. Many products had a British Standard and
Steen: “chap11” — 2006/4/27 — 18:31 — page 329 — #11
QUALITY, ENVIRONMENT AND FOOD SAFETY SYSTEMS 329
gained a Kite-mark status. The credibility of the Kite-mark was at stake because thefactories did not maintain the same standard for all their commercial productionas they did for the samples submitted to BSI for testing purposes. All manufac-turers realised the benefits and their customers were desperate for improvement.The difficulty for BS 5750 was that hygiene standards were not specifically men-tioned and were left to each manufacturer. The only guidance up to this pointhad been the Codex Alimentarius – a post-war (1961) European food standarddevised jointly by the World Health Organization and the Food and AgricultureOrganization. The particularly important extract from this, which was groundbreak-ing, was the development of the concept of Hazard Analysis and Critical ControlPoint (HACCP) food safety studies. But, eventually, the British multiple retailers,through their industry body – the British Retail Consortium (BRC) – came togetherto set food industry hygiene standards. Although the BRC Standard is also notuniversally accepted, it is sufficiently established to have independent accreditedauditing bodies carrying out audits against it with the intention of one audit provid-ing the necessary information and certification for all the retailers. The InternationalStandards Organization (ISO) have, at last, gone one step further, providing the textfor a Food Safety Management Standard – ISO 22000 – which includes the require-ment for a HACCP study. It may be that these two standards can co-exist in the UK.The BRC Standard is audited by reference to a very prescriptive audit checklist,whereas ISO 22000 is audited on the basis that (as with ISO 9001) the companywill identify what is important, then demonstrate how to control it. This leavesthe auditor and manufacturer more flexibility in their approach. Only time will tellwhether ISO 22000 will provide the extra confidence and protection required, orwhether the retailers will continue to insist on maintaining their own system. Allthe systems need to spell out: what to do, how to do it, who is responsible, how youknow when things have gone wrong, how to stop things from going wrong and,essentially, what to do when things go wrong.
11.5.5 Is ISO 22000 necessary?
Anyone writing an ISO 9001 system for food manufacturing management controlwould find it very difficult without having carried out a Hazard Analysis and CriticalControl Point (HACCP) study. In the ISO 22000 and BRC systems, it is requiredto use the HACCP system. This provides the key controls to establish the safetyof the food product. It may be considered that this rather makes the Food SafetyManagement System (ISO 22000) redundant if only HACCP were to be specificallyincluded in ISO 9001. Unfortunately, many industries require some unique set ofcontrols. ISO 9001 would be an encyclopaedia if it included them all. So whydoes ISO 22000 exist? It is also the difference between product quality and productsafety that is at stake. Although ISO 9001 should automatically take care of productsafety, meeting the specification to produce a quality product diverts attention fromvery basic issues relating to product safety and it is important to recognise thedifference.
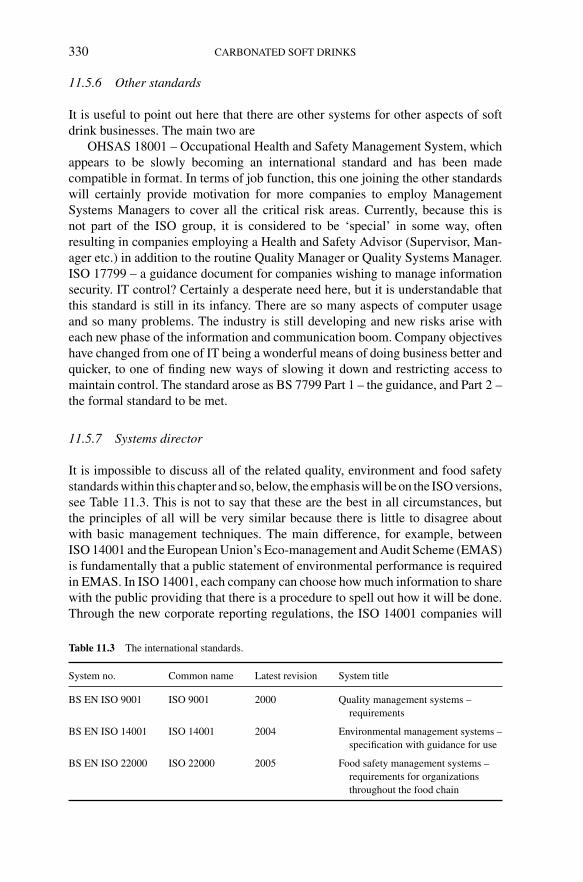
Steen: “chap11” — 2006/4/27 — 18:31 — page 330 — #12
330 CARBONATED SOFT DRINKS
11.5.6 Other standards
It is useful to point out here that there are other systems for other aspects of softdrink businesses. The main two are
OHSAS 18001 – Occupational Health and Safety Management System, whichappears to be slowly becoming an international standard and has been madecompatible in format. In terms of job function, this one joining the other standardswill certainly provide motivation for more companies to employ ManagementSystems Managers to cover all the critical risk areas. Currently, because this isnot part of the ISO group, it is considered to be ‘special’ in some way, oftenresulting in companies employing a Health and Safety Advisor (Supervisor, Man-ager etc.) in addition to the routine Quality Manager or Quality Systems Manager.ISO 17799 – a guidance document for companies wishing to manage informationsecurity. IT control? Certainly a desperate need here, but it is understandable thatthis standard is still in its infancy. There are so many aspects of computer usageand so many problems. The industry is still developing and new risks arise witheach new phase of the information and communication boom. Company objectiveshave changed from one of IT being a wonderful means of doing business better andquicker, to one of finding new ways of slowing it down and restricting access tomaintain control. The standard arose as BS 7799 Part 1 – the guidance, and Part 2 –the formal standard to be met.
11.5.7 Systems director
It is impossible to discuss all of the related quality, environment and food safetystandards within this chapter and so, below, the emphasis will be on the ISO versions,see Table 11.3. This is not to say that these are the best in all circumstances, butthe principles of all will be very similar because there is little to disagree aboutwith basic management techniques. The main difference, for example, betweenISO 14001 and the European Union’s Eco-management and Audit Scheme (EMAS)is fundamentally that a public statement of environmental performance is requiredin EMAS. In ISO 14001, each company can choose how much information to sharewith the public providing that there is a procedure to spell out how it will be done.Through the new corporate reporting regulations, the ISO 14001 companies will
Table 11.3 The international standards.
System no. Common name Latest revision System title
BS EN ISO 9001 ISO 9001 2000 Quality management systems –requirements
BS EN ISO 14001 ISO 14001 2004 Environmental management systems –specification with guidance for use
BS EN ISO 22000 ISO 22000 2005 Food safety management systems –requirements for organizationsthroughout the food chain
Steen: “chap11” — 2006/4/27 — 18:31 — page 331 — #13
QUALITY, ENVIRONMENT AND FOOD SAFETY SYSTEMS 331
soon find that this difference is eroded or removed. There is much talk of integratingthe standards at the implementation stage, and many companies have achieved this.It is perhaps time for the standards to become one, with appendices for each aspectof company activity. Perhaps the main standard should simply be called CorporateManagement Systems, and be controlled by the Management Systems Director.
11.5.8 Standards improvement mechanisms
The standards go through regular ‘updates’ and this is a feature of all the British andinternational standards, about every 6 years. There is intended to be a convergencebetween these standards as the principles and many of the management controlfeatures are common to them all.
The standards set out the requirements which, when applied, can be subjected toindependent audit to establish an organisation’s ability to meet customer, regulatoryand the organisation’s own requirements – as stated at the beginning of ISO 9001.They also include a process-driven approach to continual improvement.
A chart relating to the ‘Plan–Do–Check–Act’ process is present in both ISO9001 and 14001, but embedded within ISO 22000. The text is slightly different totake account of the different objectives, but in summary:
Plan: Establish the objectives and processes necessary to deliver results in linewith the company’s policies.
Do: Implement the processes.
Check: Monitor and measure processes against policies, objectives, targets andlegal requirements and report the results.
Act: Take actions to continually improve the process performance.
It can be seen from this alone that the ‘dedicated management team’ spoken ofearlier needs to consist of a wide range of skills; without these skills, a companywill not be able to produce a manual of procedures to be implemented. Consideringthe credibility of the management system, if the management team is not alignedwith the company aspirations or image or, equally, not in tune with the productioncapability, or available resources, then any management system they design willfail. The executive will consider it an expensive and unnecessary luxury, or theteams implementing it will consider it to be out of touch with reality. Evidenceof both of these is easy to see when auditing. Communication skills are, thereforecrucial to maintaining a cycle of improvement.
11.6 ISO Standards – common elements
Many elements are common to all the Standards. It is not proposed to go intothe detail of these as they are fundamental to good management. Included arethe allocation of responsibility for key actions, allocation of adequate resources,calibration of key measuring equipment, document control, corrective and preven-tive action mechanisms, training, audits and reviews.

Steen: “chap11” — 2006/4/27 — 18:31 — page 332 — #14
332 CARBONATED SOFT DRINKS
This section now discusses the elements that are different in each standard froman auditor’s point of view.
11.7 The quality management system (QMS) – BS EN ISO 9001
Note: For cross-referencing purposes, square brackets [ ] provide the relevantISO Standard paragraph nos.
11.7.1 Resource management [6]
Human resources are important [6.2] and the 9001 Standard deals with the physicalinfrastructure associated with them [6.3]. This clause has the inbuilt control thatthe process equipment and buildings must be to the standard needed to achieveconformity to product requirements. It is subjective unless there is evidence thatsome lack of infrastructure has caused product failure. For example, there are ratdroppings in the syrup room and there is no pest prevention contract in place, or,the bottling plant roof has a rusty/flaky painted girder framework and there are noempty bottle covers prior to the filler and capper in-feed.
11.7.2 Contract review [7.2]
The review of a contract is a case of checking understanding with the customer.The supplier needs to ensure that the customer’s requirements are understood –specification, quality, quantity and service requirements. This is often carried outduring a telephone conversation or from a direct computer link. By this time, thespecification and quality issues will have been agreed; the call is to say how much,when and to where it should be delivered.
11.7.3 Purchasing [7.4]
This is difficult territory with great potential for misunderstandings. Put simply,the raw materials, packaging materials and processing aids must all have an agreedspecification – agreed by the best technical minds a company can afford. Too slacka specification can lead to the purchasing team downgrading the materials to reducethe price (believing the specification provided) with subsequent costs in productionline inefficiencies as the materials fail to perform, customer dissatisfaction as thepacks fail by tearing open and, worse still, consumer dissatisfaction when they findthe lemonade is pink and tainted (hopefully, harmlessly) from cheap materials.
11.7.4 Product realization [7]
The production process is crucial; the need here is to have specifications for theproducts [7.1], a testing regime and the acceptance criteria. In other words, the tests
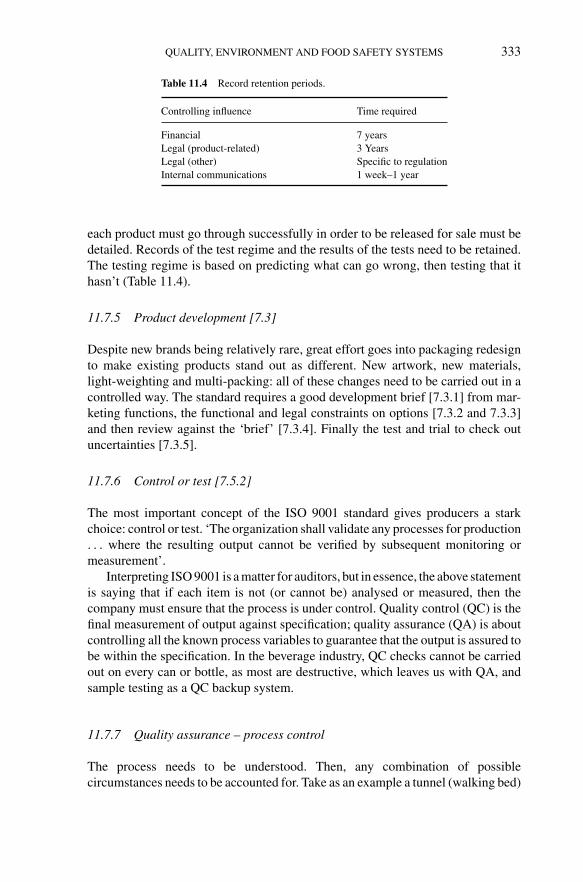
Steen: “chap11” — 2006/4/27 — 18:31 — page 333 — #15
QUALITY, ENVIRONMENT AND FOOD SAFETY SYSTEMS 333
Table 11.4 Record retention periods.
Controlling influence Time required
Financial 7 yearsLegal (product-related) 3 YearsLegal (other) Specific to regulationInternal communications 1 week–1 year
each product must go through successfully in order to be released for sale must bedetailed. Records of the test regime and the results of the tests need to be retained.The testing regime is based on predicting what can go wrong, then testing that ithasn’t (Table 11.4).
11.7.5 Product development [7.3]
Despite new brands being relatively rare, great effort goes into packaging redesignto make existing products stand out as different. New artwork, new materials,light-weighting and multi-packing: all of these changes need to be carried out in acontrolled way. The standard requires a good development brief [7.3.1] from mar-keting functions, the functional and legal constraints on options [7.3.2 and 7.3.3]and then review against the ‘brief’ [7.3.4]. Finally the test and trial to check outuncertainties [7.3.5].
11.7.6 Control or test [7.5.2]
The most important concept of the ISO 9001 standard gives producers a starkchoice: control or test. ‘The organization shall validate any processes for production. . . where the resulting output cannot be verified by subsequent monitoring ormeasurement’.
Interpreting ISO 9001 is a matter for auditors, but in essence, the above statementis saying that if each item is not (or cannot be) analysed or measured, then thecompany must ensure that the process is under control. Quality control (QC) is thefinal measurement of output against specification; quality assurance (QA) is aboutcontrolling all the known process variables to guarantee that the output is assured tobe within the specification. In the beverage industry, QC checks cannot be carriedout on every can or bottle, as most are destructive, which leaves us with QA, andsample testing as a QC backup system.
11.7.7 Quality assurance – process control
The process needs to be understood. Then, any combination of possiblecircumstances needs to be accounted for. Take as an example a tunnel (walking bed)
Steen: “chap11” — 2006/4/27 — 18:31 — page 334 — #16
334 CARBONATED SOFT DRINKS
pasteuriser. The plant has been designed to take a fixed length of time to transfer acan or bottle from one end to the other. This, at the temperature set, will provide thenecessary pasteurisation units (PUs) for this package and product. The tests havebeen done, with time and temperature parameters set to provide perfect product.A development chemist then accounted for the possibility that the pasteuriser willbreak down, and put a ‘maximum time’ in the specification (the point beyond whichthe product is detectably ‘cooked’ to taste). How can it be guaranteed that everypack that goes through it has had the minimum temperature and time, but not morethan the maximum time required?
Thus, the failure modes of the pasteuriser have to be considered. What if oneset of hot water jets fails, or just operates at reduced pressure? What if the walkingbed stops and starts many times in the length of a single cycle (typically about30–45 min)? What if the temperature is not even across the width of the pasteuriser?Add the possible human errors – for example, if the in-feed and discharge conveyorsrun next to each other and samples for an average weight test are taken from thein-feed and returned when tested, to the discharge.
11.7.8 Quality control – sample testing
The concept of sampling has been needed ever since mass production came about.Sampling can be very wasteful. It is always a result of a statistical risk assessmentbut it is necessary to understand the modes of failure. This introduces the conceptof ‘positive release’. The product must not be released from factory control as ‘fitfor sale’ just because it is in a warehouse.
The rules are:
1. decide how it will be physically prevented from leaving control untildeclared as ‘fit for sale’,
2. decide what parameters of the specification are essential (CCPs + keyquality features),
3. decide who is competent to make the ‘fit for sale’ decision and give themthe authority and responsibility,
4. decide which tests need to be done to establish that the product meets theseparameters and make sure they happened.
How can a sampling regime be decided upon? The answers can be different fordifferent products and for different production lines, or even on the same productionline as it deteriorates with age.
Considerations must be given to the natural variability of the process, the fre-quency with which it goes out of specification and the ability to detect when itis going out of specification (including the predictability of this event). Factorssuch as this will determine the frequency and range of checks. The quantity ofproduct for which loss can be afforded will also contribute to the test frequencydecision.

Steen: “chap11” — 2006/4/27 — 18:31 — page 335 — #17
QUALITY, ENVIRONMENT AND FOOD SAFETY SYSTEMS 335
11.7.9 Warehousing [7.5.5] and distribution [7.5.1]
Warehousing of products needs to ensure that the product is subjected to noconditions likely to accelerate deterioration, so, for example, stacking three pal-lets high is not always a good idea. A decision such as ‘stack one pallet high’ needsto be communicated to all – easiest by including this information on the pallet label.Still possible to ignore, but such problems with distribution can cause significantdifficulties.
11.7.10 Control of non-conforming product [8.3]
Despite all best efforts, this is still bound to occur, and it needs to be planned for.It is necessary to identify clearly any product that is not within specification. Thiscan be by location – in an isolation zone – or by labelling differently. The systemused to establish good product from the non-conforming needs to be approved bythe appropriate person and the decision-making process documented. The samplingregime, or stringency of test, needs to be given great consideration. There are threeoutcomes:
1. Scrap the non-conforming product2. Separate and return the good for sale3. Sell non-conforming as sub-standard product (if safe to consume).
These decisions need to be based on both food safety grounds and legality. Anyproduct that is ‘reworked’ in any way must go, again, through at least as challenginga test regime as any normal product.
11.8 The food safety management system (FSMS) – BS EN ISO 22000
11.8.1 The standard of the future?
This food safety management system is the most recent to come under the ISO ban-ner – in 2005. It will, if accepted widely, supplement (or possibly even supersede)the British Retail Consortium’s Global Standard for Food. It is, however, difficult toimagine a company with a sound and well-established ISO 9001 system that doesnot already meet all the requirements of this standard because of the link throughHACCP.
11.8.2 Policy [5.2]
The starting point for this standard is to have a food safety policy. It must berelevant to the company’s position in the food chain and meet the requirements of

Steen: “chap11” — 2006/4/27 — 18:31 — page 336 — #18
336 CARBONATED SOFT DRINKS
both customers and regulatory bodies. Having decided on policy, it must then besupported by measurable objectives.
In addition to the food safety policy, a Food Safety Team Leader [5.5] must beappointed who, regardless of other duties, must head up a Food Safety Team. Thisteam must have multi-disciplinary knowledge of the products, processes, equipmentand food safety hazards. In effect, this is the Hazard Analysis and Critical ControlPoint (HACCP) team but now with wider responsibilities.
11.8.3 Pre-requisite programmes [7.2]
It would be easy to assume that the ISO 22000 standard merely enhanced therequirement for HACCP studies; however, it also includes what it calls pre-requisiteprogrammes (PRPs). These programmes must be determined and implemented to,in effect, give the factory a chance of achieving its hygiene targets. Generally,these can be categorised as controlling the environment in which production takesplace. Layout of buildings, utilities such as air, water and energy, and many othersare listed specifically. This is quite a departure for a standard, to be so detailed[7.2.3].
11.8.4 Product characteristics [7.3.3]
As an early part of hazard analysis, it is necessary to establish all the characteristicsof the materials to be used in the making of the drinks, and those in contact with them[7.3.3.1]. Besides the material specification, this can include delivery packaging,storage conditions and any other factors that may influence the safety of use. Thisinformation-gathering exercise is one input to the HACCP study.
Further, the end-product characteristics [7.3.3.2] need to be listed in a simi-lar fashion, providing a full picture of the correct use and storage characteristics,including shelf life and storage criteria.
11.8.5 HACCP [7.6]
The need for an assessment of the hazards associated with each material used isrequired [in 7.3 and 7.4 in general terms]. However, the standard then goes onto a prescriptive approach, based on the Codex Alimentarius technique. As thisis crucial to ISO 22000, it is summarised here. There are seven principles andtwelve steps required to complete and implement a HACCP approach. The firstprinciple is to carry out the study of hazards and it incorporates the first sixsteps.
Principle 1 – Conduct a hazard analysis (identifying potential biological,chemical or physical contamination that can affect health) A team of experts is

Steen: “chap11” — 2006/4/27 — 18:31 — page 337 — #19
QUALITY, ENVIRONMENT AND FOOD SAFETY SYSTEMS 337
assembled to draw up a full product specification, including its preservativeregime, packaging and distribution method [7.3.3.1]. Mode(s) of use for theproduct and potential misuses or uses by particularly vulnerable groups of thepopulation must be identified [7.3.4]. A flow diagram of all the steps in theproduction process must be constructed [7.3.5.1] and an on-site verification of theflow diagram carried out [7.3.5.1]. All the potential hazards that may reasonablybe expected to occur at each step of the process up to the point of consumptionmust be listed [7.4.2.1].
Principle 2 – Determine the critical control points (CCPs) A decision tree shouldbe used to identify whether any particular point is a CCP or not. If there is nocontrol measure in place at a CCP (or elsewhere to the same effect), then theprocess should be changed to implement one [7.6.2].
Principle 3 – Determine the critical limits Limits should be set for each criticalcontrol point, sometimes several limits at one point [7.6.3 and 7.4.2.3].
Principle 4 – Establish a system to monitor control of the CCPs It is necessarynot only to monitor but also to control, that is, to take corrective action if trendsshow that the limits may soon be exceeded, or alternatively, the responsibleperson notified [7.6.4].
Principle 5 – Establish the corrective action to be taken when monitoringindicates that a particular CCP is not under control Once a CCP limit has beenexceeded, the corrective action is two-fold (as identified in ISO 9001). First, toidentify the action to bring the process back into control. There is often adilemma – does production continue to make a defective product because it iseasier to adjust the process whilst it is running or, is the process stopped and awasteful start-up procedure carried out after fixing the fault? Second, what to dowith the product manufactured during the ‘out of control’ period. Such a productwill need to be isolated, but how much and what can be done with it? [7.6.5, or8.3 in ISO 9001].
Principle 6 – Establish procedures to verify that the HACCP system is workingeffectively Auditing the controls is an obvious verification activity but randomtests or spot-checks can also reveal deficiencies [7.8].
Principle 7 – Establish documentation concerning the procedures needed andkeep appropriate records. The tests carried out to demonstrate that CCPs arebeing monitored and are in control are the most obvious records. Procedures andtraining records for the persons carrying out the CCP monitoring need to beretained. In addition, those who carried out the HACCP study, their findings anddecision-making process need to be documented [4.2 and others].
11.8.6 Decision tree
The ‘decision tree’ is an interesting device to enable clear thinking as to whethera particular control is a critical control point, or not. This is a logical series of
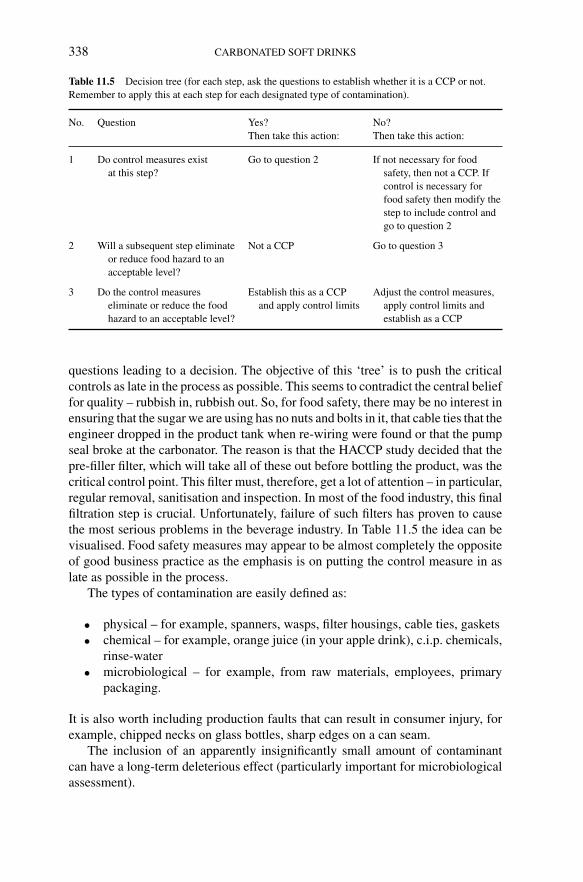
Steen: “chap11” — 2006/4/27 — 18:31 — page 338 — #20
338 CARBONATED SOFT DRINKS
Table 11.5 Decision tree (for each step, ask the questions to establish whether it is a CCP or not.Remember to apply this at each step for each designated type of contamination).
No. Question Yes? No?Then take this action: Then take this action:
1 Do control measures exist Go to question 2 If not necessary for foodat this step? safety, then not a CCP. If
control is necessary forfood safety then modify thestep to include control andgo to question 2
2 Will a subsequent step eliminate Not a CCP Go to question 3or reduce food hazard to anacceptable level?
3 Do the control measures Establish this as a CCP Adjust the control measures,eliminate or reduce the food and apply control limits apply control limits andhazard to an acceptable level? establish as a CCP
questions leading to a decision. The objective of this ‘tree’ is to push the criticalcontrols as late in the process as possible. This seems to contradict the central belieffor quality – rubbish in, rubbish out. So, for food safety, there may be no interest inensuring that the sugar we are using has no nuts and bolts in it, that cable ties that theengineer dropped in the product tank when re-wiring were found or that the pumpseal broke at the carbonator. The reason is that the HACCP study decided that thepre-filler filter, which will take all of these out before bottling the product, was thecritical control point. This filter must, therefore, get a lot of attention – in particular,regular removal, sanitisation and inspection. In most of the food industry, this finalfiltration step is crucial. Unfortunately, failure of such filters has proven to causethe most serious problems in the beverage industry. In Table 11.5 the idea can bevisualised. Food safety measures may appear to be almost completely the oppositeof good business practice as the emphasis is on putting the control measure in aslate as possible in the process.
The types of contamination are easily defined as:
• physical – for example, spanners, wasps, filter housings, cable ties, gaskets• chemical – for example, orange juice (in your apple drink), c.i.p. chemicals,
rinse-water• microbiological – for example, from raw materials, employees, primary
packaging.
It is also worth including production faults that can result in consumer injury, forexample, chipped necks on glass bottles, sharp edges on a can seam.
The inclusion of an apparently insignificantly small amount of contaminantcan have a long-term deleterious effect (particularly important for microbiologicalassessment).
Steen: “chap11” — 2006/4/27 — 18:31 — page 339 — #21
QUALITY, ENVIRONMENT AND FOOD SAFETY SYSTEMS 339
11.8.7 No foolproof systems
On the basis that no matter how much effort goes in to create a foolproof system,this never eliminates human failings and the unexpected. The standard takes thisinto account and insists on having ‘contingency preparedness and response’ [5.7]so that, ‘not if, but when’ the unexpected happens, some forethought has gone intothe process required to protect both the public and the company from the effects.
There is no specific requirement to maintain a record of the rationale behinddocumented changes in ISO 9001 but, in ISO 22000, there is.
11.9 The environmental management system (EMS) – BS EN ISO 14001
11.9.1 Drains and skips – duty of care
The UK government has tightened the controls on industry, starting with the largeoffenders and larger companies but, now, tackling smaller and smaller companies.All soft drinks companies are now affected by the legislation in one way or another.What was once British Standard 7750, a particularly unsuccessful EnvironmentalManagement Standard (EMS) in terms of uptake, succeeded, however, in providingthe template for ISO 14001. The difference between EMS and QMS is that forEMS it is essential to delve into the detail of many pieces of legislation. Mostenvironmental legislation in the UK has until recently been dealt with on a reactivebasis. Liquids went down a drain and solids in a skip. A simplistic but frequently truestate of affairs. The UK Environmental Protection (Duty of Care) Regulations havefor many years controlled how we handle the general waste and the small amountsof ‘special waste’, but this has, more recently, been supplemented by much morespecific and penal regulation. The control of liquid trade effluent, except in thelargest soft drinks plants, is left entirely to the local wastewater treatment works.Consents required can prove difficult to comply with because of the pH of beverages.Cleaning materials also cause pH problems at the alkali end of the scale. The otherkey pollutant, mainly from spilt product and syrup and sugar tank washing, ischemical oxygen demand (COD). Most organic matter (e.g. sugar) provide a highCOD. This source of sugar is an excellent medium for micro-organisms.
11.9.2 Producer responsibility
A general principle has been established that ‘the polluter pays’ and this has resultedin a series of regulations in the UK. An important and early addition was the UKProducer Responsibility (Packaging Waste) Regulations 1997. This was a compli-cated system of shared responsibility (throughout the supply chain) for the wastearising from businesses, resulting in a cost to recover and recycle post-consumerpackaging. As beverage producers are too far from the end user to retrieve packaging
Steen: “chap11” — 2006/4/27 — 18:31 — page 340 — #22
340 CARBONATED SOFT DRINKS
directly, the result was the introduction of ‘compliance schemes’ (e.g. Valpak) whocarry out this task through third party recyclers, but at industry expense.
11.9.3 Climate change levy
Climate change levy was applied in the UK to all corporate energy bills and meantapproximately a 15% increase in, primarily, gas and electricity. The rationale wasto provide an incentive to industry to reduce their carbon dioxide emissions. TheKyoto Protocol is an internationally enforceable agreement to reduce emissions.The UK solution was to provide 80% relief of the levy in return for a commitmentto reduce energy usage.
11.9.4 Pollution prevention and control permits
This is the most significant and far-reaching piece of UK legislation for years whichstarted as a European Directive – Integrated Pollution Prevention and Control – andhas now been implemented in UK legislation as Pollution Prevention and ControlRegulations 2000 – requiring sites above a certain tonnage output (300 tonnesof product per day, averaged over any 90 consecutive working days, excluding theweight of packaging) to apply for a PPC permit. The basis upon which the soft drinksindustry has become involved is rather tenuous – as processors of vegetable material.The inclusion of sugar in beverages has been construed by the UK EnvironmentAgencies as sufficient reason, although water bottlers are excluded.
11.9.5 EMS policy [4.2]
In ISO 14001, a policy statement must additionally include a commitment to pol-lution prevention. This is in line with the concept of continuous improvement, butbecomes an increasing challenge once all the easy gains have been made.
11.9.6 Aspects and impacts [4.3.1]
The standard uses two terms ‘aspects’ and ‘impacts’ that need defining. In imple-menting and maintaining an EMS, these need to be generated for an operation. Theyare simple lists. The ‘aspects’ part is a complete list of activities. It is easy to forgetsome activities, particularly waste disposal, which can cause its own problems. It isoften useful to break the mainstream activities into smaller, more specific activities,then list the environmental ‘impacts’ associated with each. Each activity can haveseveral impacts, for example, the aspect of bottle blowing will have an impact oneffluent (cooling water), refrigerant use, noise from the compressors, releases to airfrom the cooling towers and energy use.
Steen: “chap11” — 2006/4/27 — 18:31 — page 341 — #23
QUALITY, ENVIRONMENT AND FOOD SAFETY SYSTEMS 341
11.9.7 Significance [4.3.1(b)]
Once a list of impacts is completed, each needs to be assessed for significance andthe system decided upon to do this needs to be documented. The mechanism used isentirely your own decision. Typically, there ends up being three simple categoriesof ‘action required’ and so, the mechanism needs to be designed to put the impactsinto these categories:
A. Active monitoring and control (mainly where there is a legal obligation,planning permission requirement or ‘consent’)
B. Less frequent monitoring, probably has impacts with a large cost to thecompany
C. Listed impact, with small cost and small impact (with potential to beupgraded if the activity or company focus changes).
Those in Category A require most attention, with a monitoring frequency, targets[4.3.3], a control mechanism [4.4.6], review [4.5.1] and corrective action plans[4.5.3]. They include any regulatory monitoring, such as trade effluent consentparameters.
Category B is a cash generator – looking at the expensive, but not necessarilyregulated, utilities and services. This can be a useful target for cost savings ifbenchmarked against other companies. A way of reducing the bills is to breakdown where the cost is incurred, and apply tighter controls.
Category C is the ‘just for completeness’ list. Minimal cost, minimal impact.At any time, though, a change in legislation or the business can bring one of theseup into the other categories.
The above is a simple approach which works, but you can definitely design morecomplicated ones. In essence it is A = legislation, B = financial, C = the rest.The assessment of the relevant legislation is crucial to understanding the controlswe apply, or the data we collect, and the significance rating.
11.9.8 Legislation updates [4.3.2]
In all countries there is a requirement to establish a mechanism to keep abreast ofthe relevant legislation.
11.9.9 Emergency preparedness and response [4.4.7]
This standard demands that the business must attempt to predict what is likely togo wrong in terms of accidents and emergencies, eliminate or reduce the risk, andprepare to minimise the impact if it still happens. Some precautions are obvious,and some easy. For example, if a sugar tanker turns up and its hose bursts, wheredoes the spillage go – to surface water or trade effluent? If to surface, then a simpledrain cover mat in place during deliveries can prevent contamination of the local

Steen: “chap11” — 2006/4/27 — 18:31 — page 342 — #24
342 CARBONATED SOFT DRINKS
streams. Spill kits where vehicles re-fuel. Bunded pallets for caustic, acid and oilsare expensive, but provide lasting solutions.
11.10 Systems – a summary
This chapter started with the simple problem of management control in companiesand now has explored an assured and verifiable control of quality, food safety andour environmental impacts. In future, information technology, health and safetyand, possibly, accounts may be controlled with similar systems.

Steen: “steen_index” — 2006/4/27 — 19:30 — page 343 — #1
Index
Acceptable daily intake (ADI), 52Acid
acetic, 62, 88ascorbic, 63, 88carbonic, 113citric, 60, 88, 94, 100, 110fumaric, 62, 88lactic, 61, 88malic, 62, 88phosphoric, 61, 89sulphuric, 89tartaric, 61, 88
Acidity, 89Acidulants, 59Additives, 52Alkalinity, 19, 20, 22, 27–9Analytical checks, 120Antioxidants, 80, 88Apprenticeships, 288, 289Aquifers, 17Article numbering, 249Aseptic filling, 175, 178, 259, 271, 280,
284, 289Automation, 289, 326
Bar coding, 219, 221, 224, 250, 251,252, 308
Barcode identification, 249Barley waters, 1Benchmarking, 285–8Benzoic acid and benzoates, 78, 89Beverage viscosity, 90, 97, 144, 146Boreholes, 18, 23–4, 44, 289Bottle
closures, 200creep, 213–14, 270, 273design, 184–5, 270evacuation, 138, 146, 150headspace, 184–5, 203, 204
pressure, 201lifters, 158(PET) neck finish, 203–5protection, 159–61silos, 269
supplier identification marks, 184washer, 264–6
Bottled watersmarket growth of, 14
Bottlesscuffed, 264single and multi-trip, 192
Breakdowncharacteristics, 274–7frequency, 276profile, 275
Brewing, 48British Retail Consortium (BRC), 329Brix, 33, 89, 92, 96Buffer capacity, 275, 276Buffering, 260, 269, 272, 279Buildings, 283–5Bullwhip effect, 298–9
Camera systems, 274Can
decoration, 207making process, 206–9
Can ends, 208stress corrosion, 208
Can filling, 166–73lines, 267–8
Cans double seams, 208–9Capper, 260, 266, 269, 276Carbon dioxide, 1, 49, 58, 87, 89, 113–15,
147, 282, 340bubbles, 124, 130, 133
sparging, 131–3contamination, 120delivery, 120–3density, 113phase diagram, 115possible trace impurities, 121production, 115–19production by membrane separation,
118–19production from fermentation, 116production from flue gas recovery, 116–8specification, 119–20

Steen: “steen_index” — 2006/4/27 — 19:30 — page 344 — #2
344 INDEX
Carbon dioxide (Contd.)storage, 123–4technological development of, 4, 113trace impurities, 121triple point, 114vaporisation, 121–2
Carbonatedsoft drinks, 290, 296, 298,
314, 317water, 112–13
Carbonated drinksglobal markets, 11growth of, 3, 10
Carbonated watershistory of, 2, 112
Carbonation, 124–9, 147–9bubbler, 130chart, 125in-line, 131levels, typical, 8loss, 125, 198–9measurement, 126–8process control, 133–4static, 130systems, 129–34, 147–9volumes Bunsen, 125, 134waterfall, 130
Carbonators, 129–31, 148, 268Charles law, 125Clean-in-place (CIP)
filler cleaning, 173, 175–7systems, 105–7, 262, 271
Cleaning systems, 284Climate change levy, 340Closures, 200–6, 266
plastic, 202–3roll on metal (RO), 202vacuum lug, 205
Coagulation, 27–8jar test, 28
Codex Alimentarius, 329Cola drinks, 4Colloidal particles, 27, 29, 39Colours, 7,51,73Company size, 322, 335Conductivity, 19Constraints, 321, 333Consumer definition, 290Container size changing, 162Contamination, 336, 338Continuous blending, 94Contract review, 332Control hierarchy, 278–9
Conveying systems, 270–2Conveyors
accumulating, 260, 271, 283air, 161, 271cleaning, 272, 284dead plates, 268modulation, 267pallet, 272slat, 260, 267, 271tray, 270, 272
Coriolis principle, 96Corks, 200Corrective action, 337, 341Corrugated
board manufacture, 240fibreboard specification, 239
Cost savings, 12, 341Counter-pressure filling,
137–41, 149Critical control points, 337–8Crown cork, 9, 51, 183, 201, 205Cryptosporidium, 38Customer
audits, 328definition, 290demand, 292, 316service, 290, 291
Cyclamates, 7
Dalton’s law of partialpressures, 126
Date coding, 216De-aeration, 43–4, 91, 128, 148De-capper, 262De-palletiser, 263Decelerating bottle stop, 158Decision tree, 337Densitometer, 94, 96Display pallets, 228–9, 270Dissolved oxygen, 43Dollies, 229–30, 270Drainage system, 283Drinking water directive, 18Drip trays, 271Dual sourcing, 295Duty of care, 339
Early carbonated drinks, 4EDTA salts, 81Effluent, 22, 283Electro-pneumatic valve
control, 150

Steen: “steen_index” — 2006/4/27 — 19:30 — page 345 — #3
INDEX 345
Empty bottle inspection, 264Emulsions
brominated vegetable oil, 72colour and flavour, 69particle distribution in, 70
Environment, 181, 186, 194, 215, 314,320, 327, 330
agency, 23, 340issues, 13, 103, 280
Environmental Management System,EMS (ISO 14001), 330, 331,339–42
EU Eco-Management and Audit System(EMAS), 330, 339
Evacuation, 134, 138, 146Evapotranspiration, 17
Factorylayouts, 280–2
Factory waterdistribution systems, 44–6ring main, 45
Fermentation, 48Ferric chloride, 27Fill level
accuracy, 146, 172, 174control, 273correction, 146
Fillerbottle handling, 157–8bowl level control, 139, 170capacitance probe type, 175hygienic design, 177–8volumetric, 166–70, 174
Fillingcounter pressure, 137–41glass bottles, 156–61gravity, 135–7pressure, 145
control, 170principles, 134–41process, 146
Filling linescans, 267–8glass bottles, 260–7PET bottles, 268–70
Filling valvemechanically operated, 154–6pneumatically operated with level
probe, 154Filters
bag filters, 38–9polishing, 25, 38–41, 45
Filtrationcarbon, 32, 34–5membrane, 29–33nano, 29, 31ultra, 25, 29
Flavour deterioration, 290Flavoured
drinks, 1extract, 68
Flavouringsapplication, 66legislation, 65water dispersible, 68
Flavours, 7, 51, 63, 88, 93Floors, 283Flow metering
mass, 91, 93, 111volumetric, 90, 92, 94
Fobbing, 20, 124, 128,139, 140, 141Food safety, 84, 319, 320, 322
policy, 335–6management system (ISO 22000) 329,
335–9Food Standards Agency, 23Forecast breakdown, 299Forecasting, 299–301, 306Fruit wines, 48Future developments/trends, 13, 85,
110–11, 178–80, 216–17, 288–9,317
Gas bubble sparging, 131–3Gas bubbles in carbonated liquid, 133Giardia lamblia, 38Glass, 182–94
blowing, 112Glass bottle
forming, 187–9internal pressure resistance, 185light weighting, 193making history, 182–4manufacturing process, 185melt process, 185–7
Glass quality faults, 189–92Glass recycling, 194Greenhouse effect, 114
Hazard Analysis and Critical Control Point(HACCP), 119, 329, 336–7
Heavy metal limits, 52Henry’s law, 124–5Hydrological cycle, 16
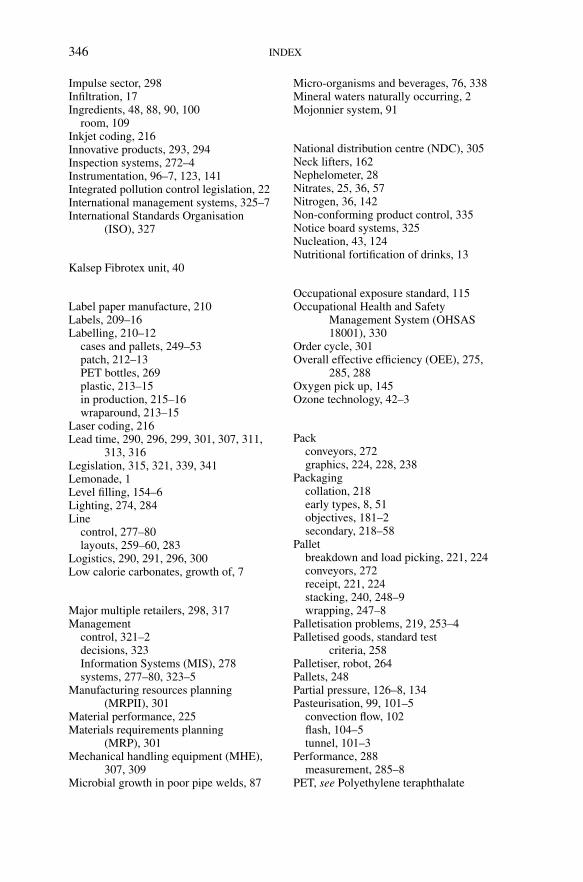
Steen: “steen_index” — 2006/4/27 — 19:30 — page 346 — #4
346 INDEX
Impulse sector, 298Infiltration, 17Ingredients, 48, 88, 90, 100
room, 109Inkjet coding, 216Innovative products, 293, 294Inspection systems, 272–4Instrumentation, 96–7, 123, 141Integrated pollution control legislation, 22International management systems, 325–7International Standards Organisation
(ISO), 327
Kalsep Fibrotex unit, 40
Label paper manufacture, 210Labels, 209–16Labelling, 210–12
cases and pallets, 249–53patch, 212–13PET bottles, 269plastic, 213–15in production, 215–16wraparound, 213–15
Laser coding, 216Lead time, 290, 296, 299, 301, 307, 311,
313, 316Legislation, 315, 321, 339, 341Lemonade, 1Level filling, 154–6Lighting, 274, 284Line
control, 277–80layouts, 259–60, 283
Logistics, 290, 291, 296, 300Low calorie carbonates, growth of, 7
Major multiple retailers, 298, 317Management
control, 321–2decisions, 323Information Systems (MIS), 278systems, 277–80, 323–5
Manufacturing resources planning(MRPII), 301
Material performance, 225Materials requirements planning
(MRP), 301Mechanical handling equipment (MHE),
307, 309Microbial growth in poor pipe welds, 87
Micro-organisms and beverages, 76, 338Mineral waters naturally occurring, 2Mojonnier system, 91
National distribution centre (NDC), 305Neck lifters, 162Nephelometer, 28Nitrates, 25, 36, 57Nitrogen, 36, 142Non-conforming product control, 335Notice board systems, 325Nucleation, 43, 124Nutritional fortification of drinks, 13
Occupational exposure standard, 115Occupational Health and Safety
Management System (OHSAS18001), 330
Order cycle, 301Overall effective efficiency (OEE), 275,
285, 288Oxygen pick up, 145Ozone technology, 42–3
Packconveyors, 272graphics, 224, 228, 238
Packagingcollation, 218early types, 8, 51objectives, 181–2secondary, 218–58
Palletbreakdown and load picking, 221, 224conveyors, 272receipt, 221, 224stacking, 240, 248–9wrapping, 247–8
Palletisation problems, 219, 253–4Palletised goods, standard test
criteria, 258Palletiser, robot, 264Pallets, 248Partial pressure, 126–8, 134Pasteurisation, 99, 101–5
convection flow, 102flash, 104–5tunnel, 101–3
Performance, 288measurement, 285–8
PET, see Polyethylene teraphthalate

Steen: “steen_index” — 2006/4/27 — 19:30 — page 347 — #5
INDEX 347
PET bottlebiaxial orientation, 197blowing, 196–7filling, 145, 161–6
lines, 268permeability, 198silos, 269stretch blow moulding, 269
PET performance, 196multilayer and barrier, 198
PET recycling, 200Photosynthesis, 114Pig systems, 94–6Planning, 301–6Plant efficiency, 285Plastic
bottles, 194–200limitations, 195
crates, 231, 260Pollution prevention and control, 340Polyethylene teraphthalate (PET), 195–6Poor packaging, 219, 220, 225, 238, 240,
254Pre-mixes, 100Preservatives, 74Pressure sustaining valve, 45Primary packaging, 181–217Procedures, 314, 319, 323, 325, 337Process
control, 133–4, 332–3plant hygiene requirements, 108
Producer responsibility, 339–40Product
ageing, 314characteristics, 336development, 293, 294, 296, 300, 333quality, 285realisation, 332–3
Productionavailability, 288cost models, 285‘just in time’, 305plant commissioning, 286
Production linebreakdown characteristics, 274simulation, 275
Proportioning systems, 90–1Purchasing, 294–6, 301, 332
Quality, 288, 290, 294, 326assurance, 333control, 268, 282, 334
Quality management system, QMS (ISO9001) 327, 332–5
Quinine tonic water, 4
Radio frequency identification (RFID),252, 317
Ready to drink (RTD), 112Refractomer, 96–7Refractometric solids content, 96Refrigeration unit, 121, 123, 129Refrigerated carbonation system, 129Regional distribution centres, 220Regulations, UK
Environmental Protection (Duty ofCare), 339
Pollution, Prevention and Control, 321,340
pressure equipment, 40Producer Responsibility (Packaging
Waste), 339Water, 22Water Supply, 19Weights and Measures (Packaged
Goods), 272Resource management, 332Resources, 295, 296, 315, 317, 323, 330Returnable crates, 231Reverse osmosis, 31Risk management, 320Robot, 263, 270
Saccharin, 5Sample testing, 334Sanitisation, 338Saponins, 80School drink restrictions, 13Sealing devices, 9, 51Secondary packaging, 218–58
test methods documentation, 257–8transport simulation, 257–8
Seltzer waters, 49Shelf ready packing, 220, 222, 228, 229–30Shrink
film production, 221, 230, 231–8considerations, 231–3
wrap, 227–8packers, 234printed, 234–8
Silt density index, 39Size changing, 161–6Slat lube, 271Sleeving, 215

Steen: “steen_index” — 2006/4/27 — 19:30 — page 348 — #6
348 INDEX
Snifting, 137, 139, 141, 145, 154,166, 167, 172
Sodafountain, 4, 49siphon, 3water, 4, 49
Soft drinksconstituents, 52future trends, 85investigations, 81supply chain, 296
Solubility of CO2 in water, 126–7, 149Sorbic acid and sorbates, 79Stabilisers, 79Stakeholders, 321–2Stock
control, 314keeping units (SKU), 220, 251
Store delivery major multiples, 222–4Stretch
wrap, 240–8wrap material, 240–4wrapping systems, 244–7
Sugardissolving, batch, 97–8
continuous, 98–9liquid storage, 99tanker unloading, 98
Sulphur dioxide, 77Supervisory control and data acquisition
(SCADA), 278Supplier
development, 294, 295selection, 294shipping container code, 250
Supply chain, 219–27, 270, 290, 292, 293,296–8, 303, 339
costs, 290, 316management, 291, 298people, 316performance measurement, 315–17principles, 291–9requirements, 219resources, 317service, 316
Supply dual sourcing, 295Sweeteners and sweetener
developments, 5, 57Syrup
composition, 88–90room building design, 109–10
Systems definitions, 319
Technological developments, 10, 110–11,112, 179
Tolerable negative errors (TNE), 273Total planned maintenance, 287Trade
ready display units, 228–9sector, 298
Traded unit size, 220Transport, 293, 298, 300, 301, 303, 315Trend analysis, 287Turbidity, 19–23, 27–8, 32
meter, 19, 21–2
Valve matrix, 93–5Vendor managed inventory, 305
Warehousebulk break, 224health and safety issues, 315types, 307
Warehousing, 282, 306–15, 335Wash facilities, 284Water
alkalinity reduction, 28–9chlorination, 25, 32, 34–5cycle, 16daily checks, 21electrodialysis, 37framework directive, 23hardness, 28, 55impurities, 55iron removal, 35–6natural mineral, 18, 23nitrate removal, 36–8ozone technology, 42–3quality, 18–21, 55sand filtration, 25–7softener, 33sources, 18spring, 18, 23standards, 20supply regulations, 19table, 18town, 21, 39treatment, 16–47, 55ultra violet disinfection, 25, 41
Waterborne illnesses, 1Weighting agents, 72Weights and Measures Act, 272Windows, 284World class manufacturing, 285, 288
X-ray systems, 274


![Regulatory Compliance, Quality Control and the … · Inside The Old Glassworks –Quality Control ... syrup –87 child deaths . ... Anthony Rees.ppt [Compatibility Mode]](https://img.pdfslide.net/doc/110x75/5aec06cf7f8b9ad73f8f2b7e/regulatory-compliance-quality-control-and-the-the-old-glassworks-quality.jpg)