Embed Size (px)
Citation preview
Cardiogenic Shock: Monitoring Methods and
end PointsM. Maggiorini
Intensive Care UnitDepartment of Internal Medicine
University Hospital Zurich
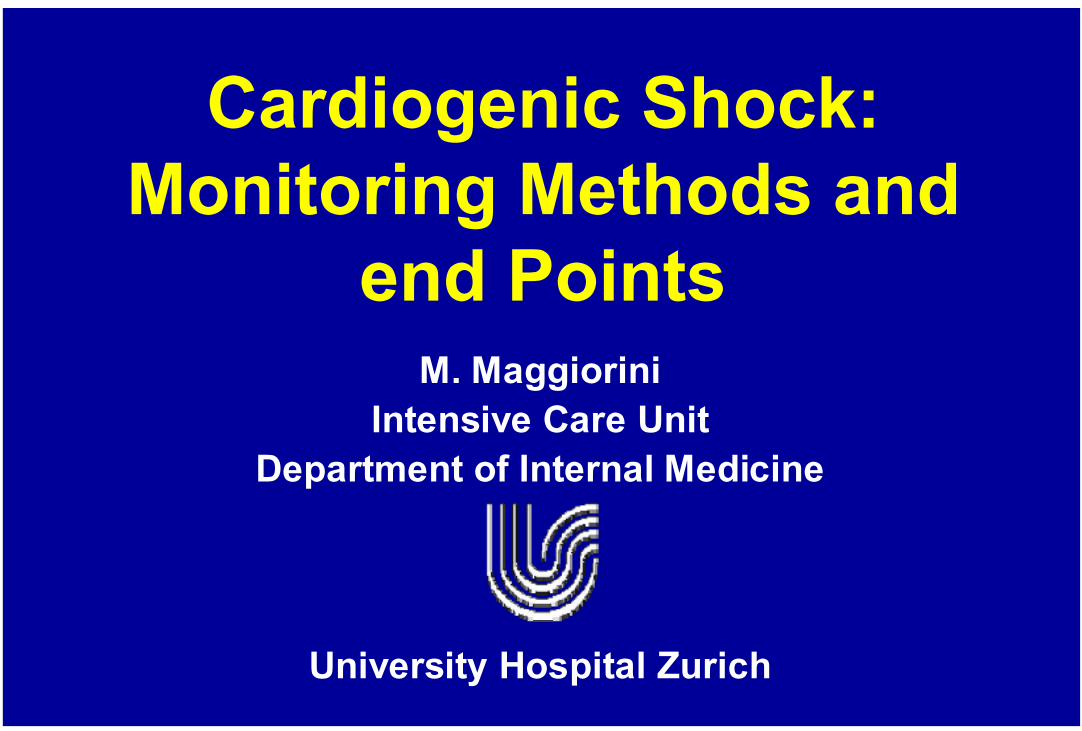
Key elements of cardiac output
Cardiac Output (CO)
AFTERLOAD
STROKE VOLUME
CONTRACTILITY PRELOADAFTERLOAD
STROKE VOLUME HEART RATE
CAVE: Assure organ perfusion pressure !
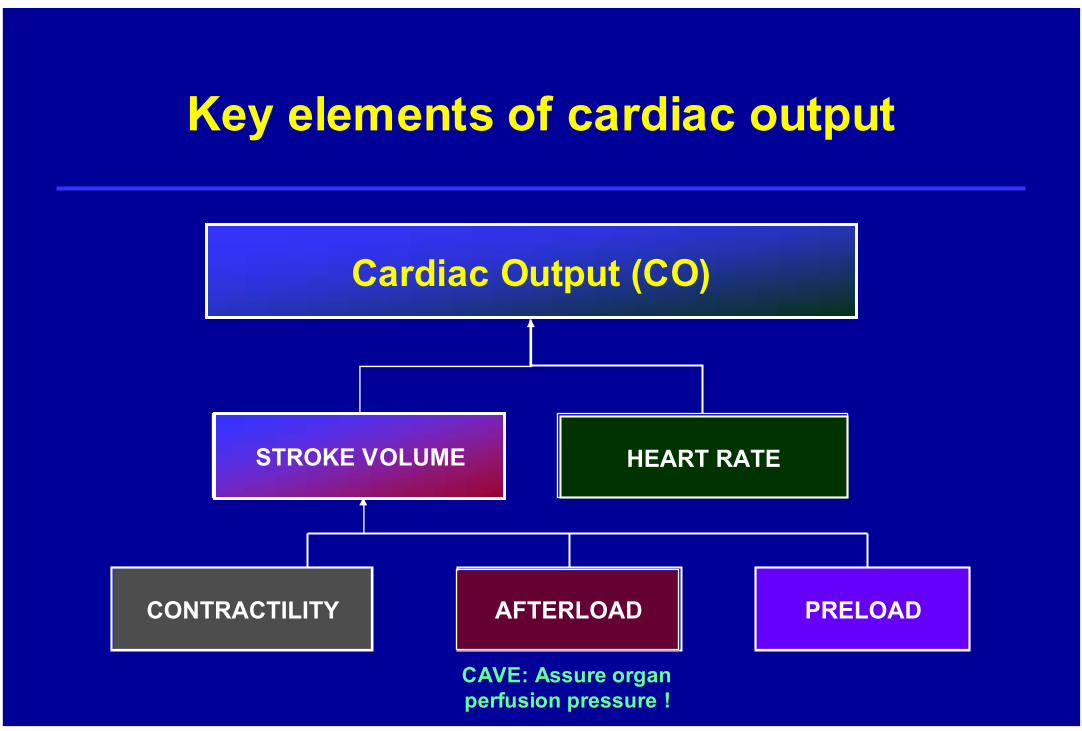
Cardiac Function: Pressure/Volume loop
Maximal LV wall Maximal LV wall stress = LV stress = LV afterloadafterload
LV LV EndiastolicEndiastolic P.P.
DiastDiast. . AorticAortic P.P.
syst. syst. AorticAortic P.P.
activeactivediastdiast. .
relaxationrelaxation≈ DiastDiast. .
compliancecompliance
LV LV EndiastEndiast. . VolumeVolume≈≈ LV LV preloadpreload
Pressure-Volume relationship of the LV
Maximal LV Maximal LV wall stress in wall stress in
failingfailing LVLV
= = maxmax LV LV elastanceelastance
MyocMyoc. . ischemiaischemia
×in LVin LV--
compliancecompliance
LV LV EndiastolicEndiastolic P.P.
LV p
ress
ure
LV end-diastolic volume
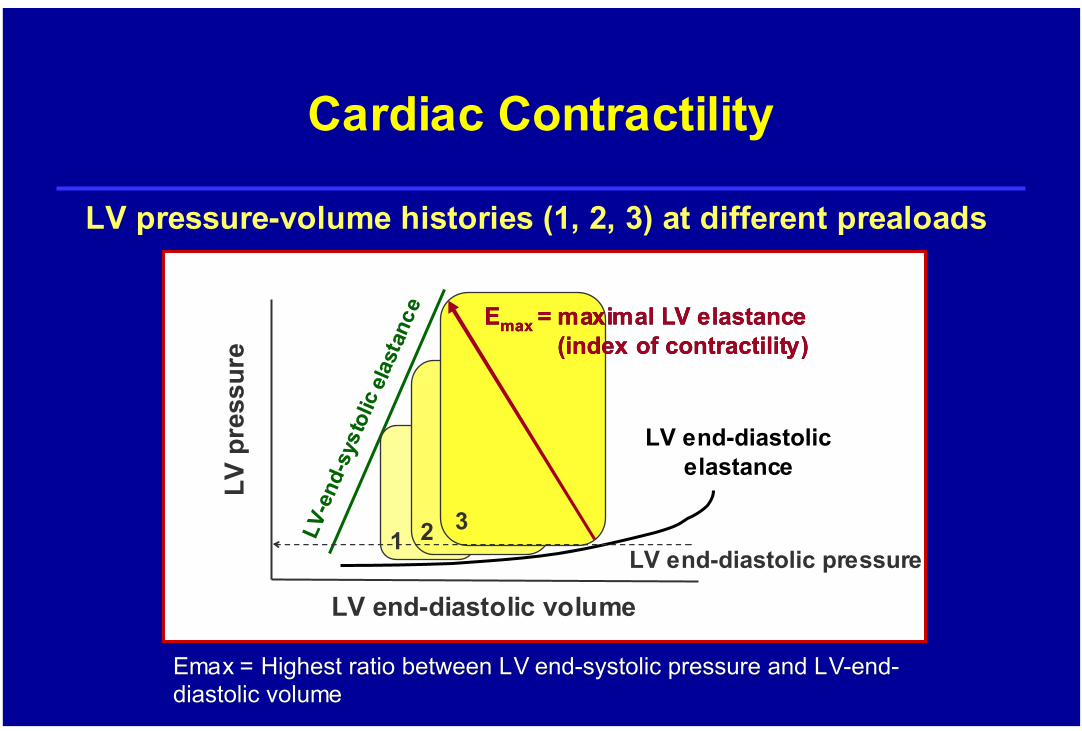
EmaxEmax = = HighestHighest ratioratio betweenbetween LV LV endend--systolicsystolic pressurepressure and and LVLV--endend--diastolicdiastolic volumevolume
LVLV--e
ndend--
syst
olic
syst
olic
elas
tanc
eel
asta
nce
LV end-diastolicelastance
1 2 3
EEmaxmax = maximal LV = maximal LV elastanceelastance((indexindex of of contractilitycontractility))
LV end-diastolic pressure
Cardiac Contractility
LV pressure-volume histories (1, 2, 3) at different prealoads
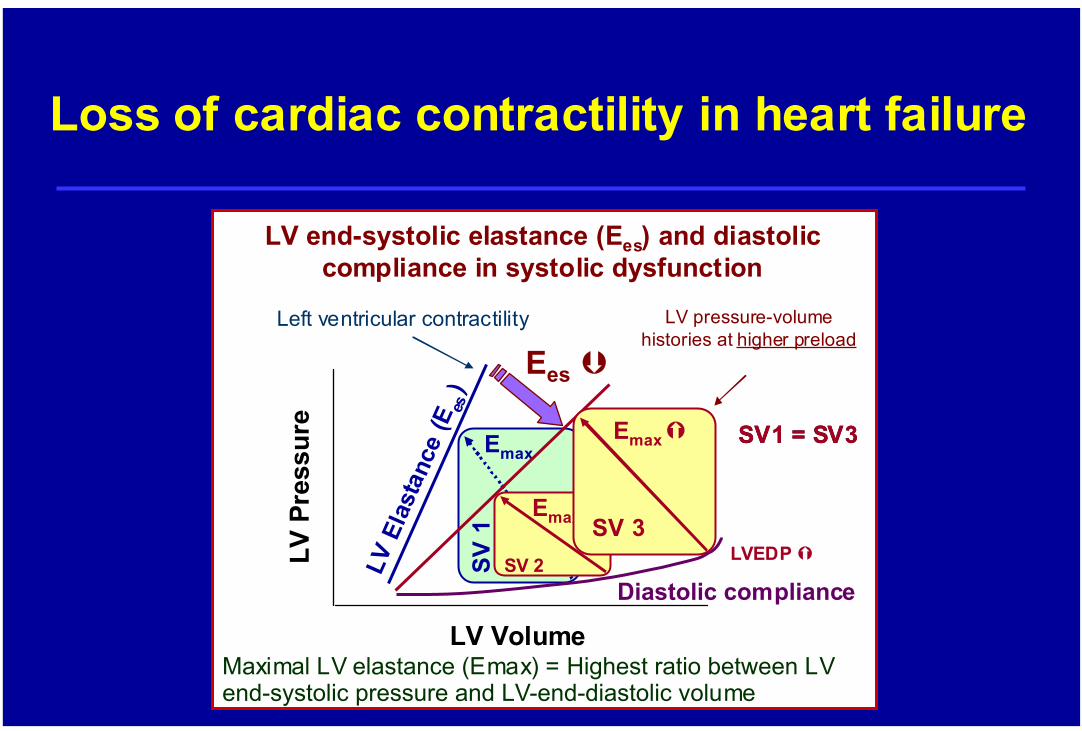
LV end-systolic elastance (Ees) and diastoliccompliance in systolic dysfunction
Diastolic compliance
Left ventricular contractilityLV
Pre
ssur
e
LV Volume
LV E
last
ance
(Ees
)Emax
SV 1
Maximal LV elastance (Emax) = Highest ratio between LV end-systolic pressure and LV-end-diastolic volume
Loss of cardiac contractility in heart failure
Ees
SV 2
Emax
LV pressure-volumehistories at higher preload
SV1 = SV3SV1 = SV3
SV 3
Emax
LVEDP

Cardiac preload(Frank-Starling relationship)
Change in stroke volume after 200 ml fluid challenge
RV/LV end-diastolic volume
Stro
ke v
olum
e
ideal
Energy of Contraction
Degree of stretch of the myocytes during diastole
Intrinsic strength of contraction (contractility) of the myocytes for a givendegree of stretch duringdiastole
Heart failureHeart failure
Stroke Work = ∆ Pressure x Stroke Volume
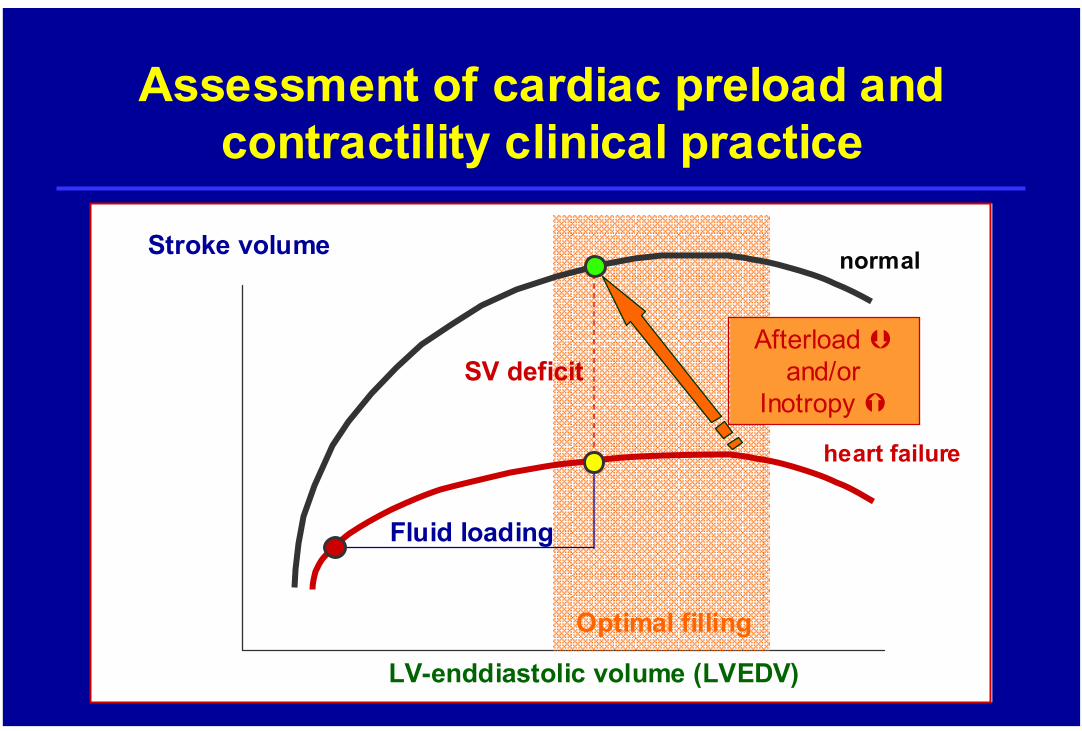
Assessment of cardiac preload and contractility clinical practice
LV-enddiastolic volume (LVEDV)
Stroke volume
heart failure
normal
Optimal filling
Fluid loading
Afterloadand/or
InotropySV deficit
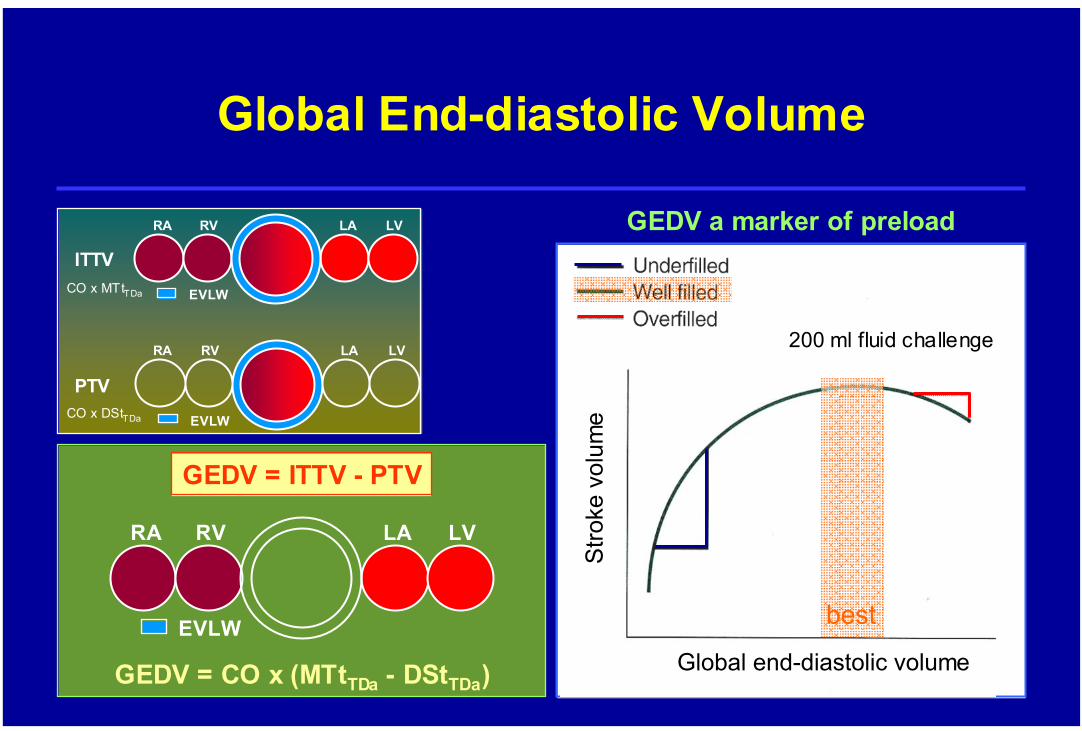
Global End-diastolic Volume
RA RV LA LV
EVLW
GEDV = ITTV - PTV
GEDV = CO x (MTtTDa - DStTDa)
RA RV LA LV
EVLW
RA RV LA LV
EVLW
ITTV
PTV
CO x MTtTDa
CO x DStTDa
Global end-diastolic volume
200 ml fluid challenge
Stro
ke v
olum
e best
GEDV a marker of preload
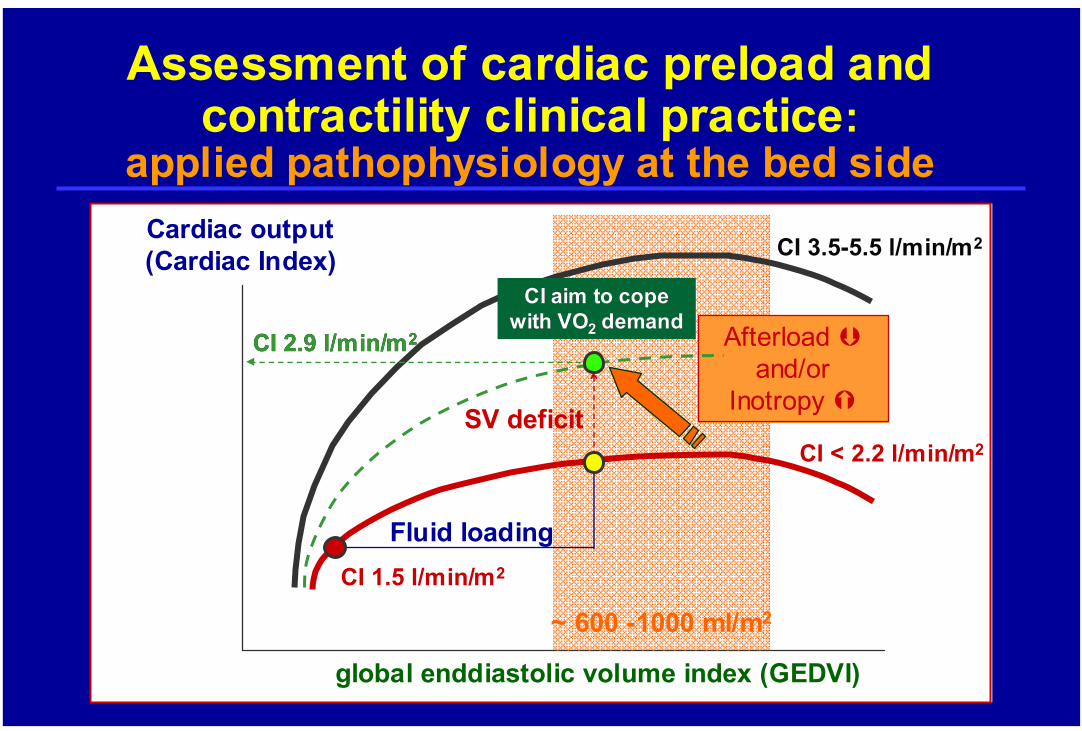
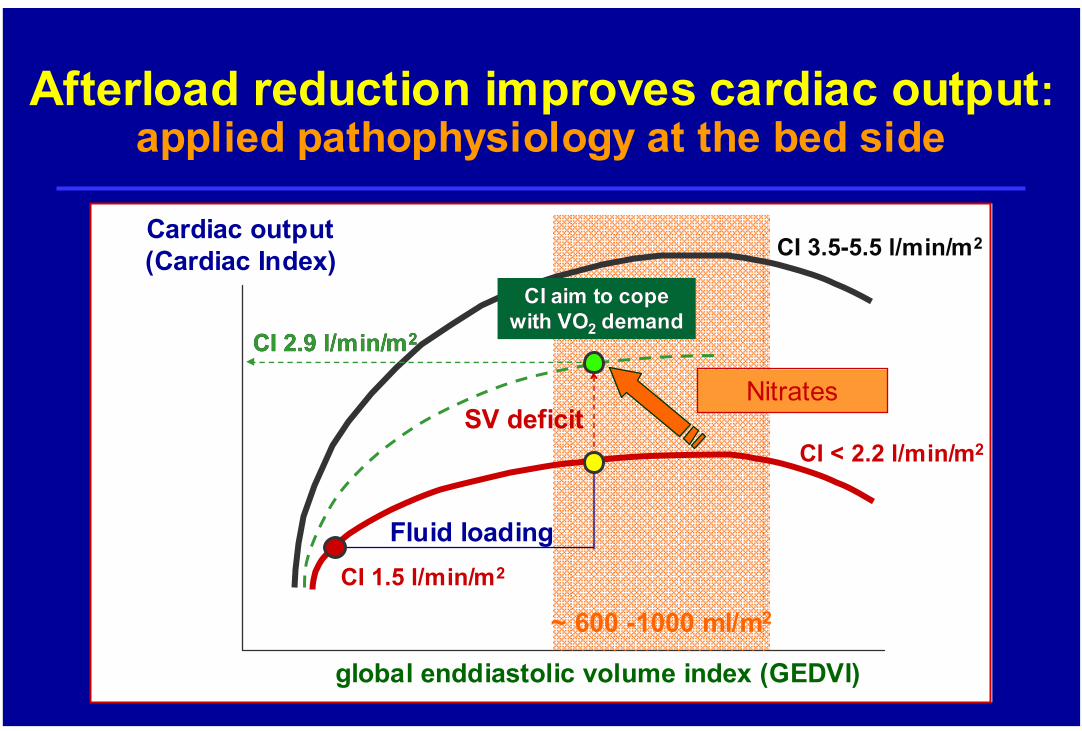
global enddiastolic volume index (GEDVI)
Cardiac output(Cardiac Index)
CI < 2.2 l/min/m2
CI 3.5-5.5 l/min/m2
~ 600 -1000 ml/m2
SV deficit
Assessment of cardiac preload and contractility clinical practice:
applied pathophysiology at the bed side
Fluid loading
Afterloadand/or
Inotropy
CI 2.9 l/min/mCI 2.9 l/min/m22
CI 1.5 l/min/m2
CI aim to cope CI aim to cope with VOwith VO22 demanddemand
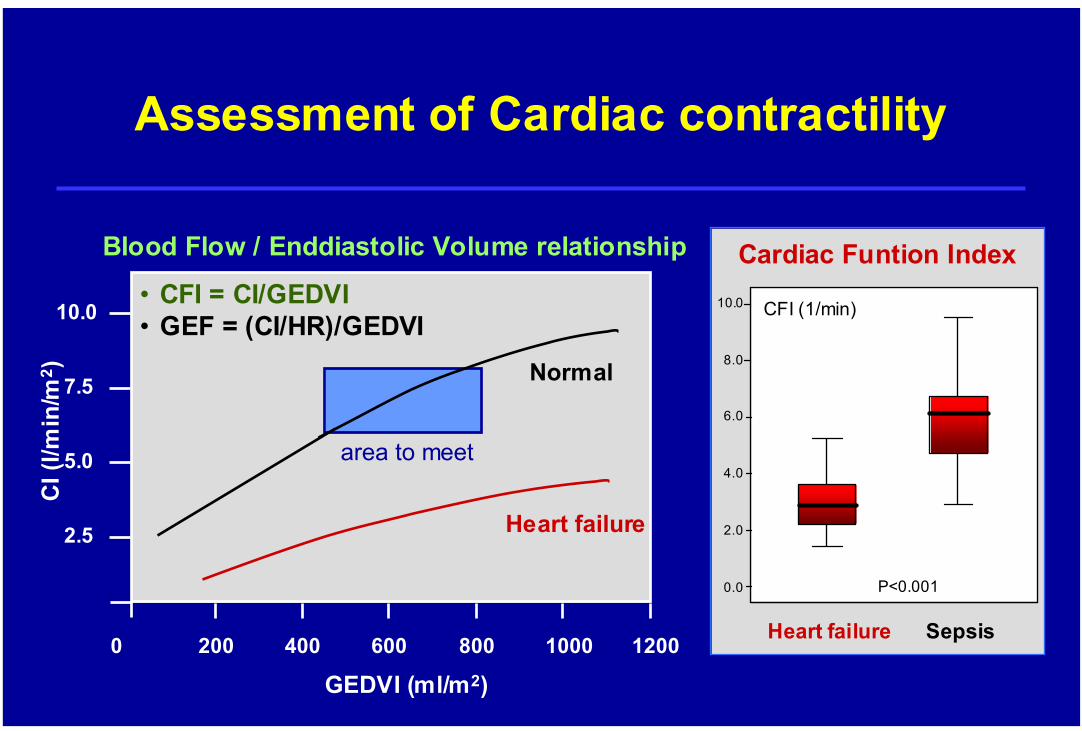
Assessment of Cardiac contractility
Blood Flow / Enddiastolic Volume relationship
GEDVI (ml/m2)0 200 400 600 800 1000 1200
2.5
5.0
7.5
10.0
CI (
l/min
/m2 )
area to meet
Normal
Heart failure
• CFI = CI/GEDVI• GEF = (CI/HR)/GEDVI
0.0
2.0
4.0
6.0
8.0
10.0 CFI (1/min)
Heart failure Sepsis
P<0.001
Cardiac Funtion Index
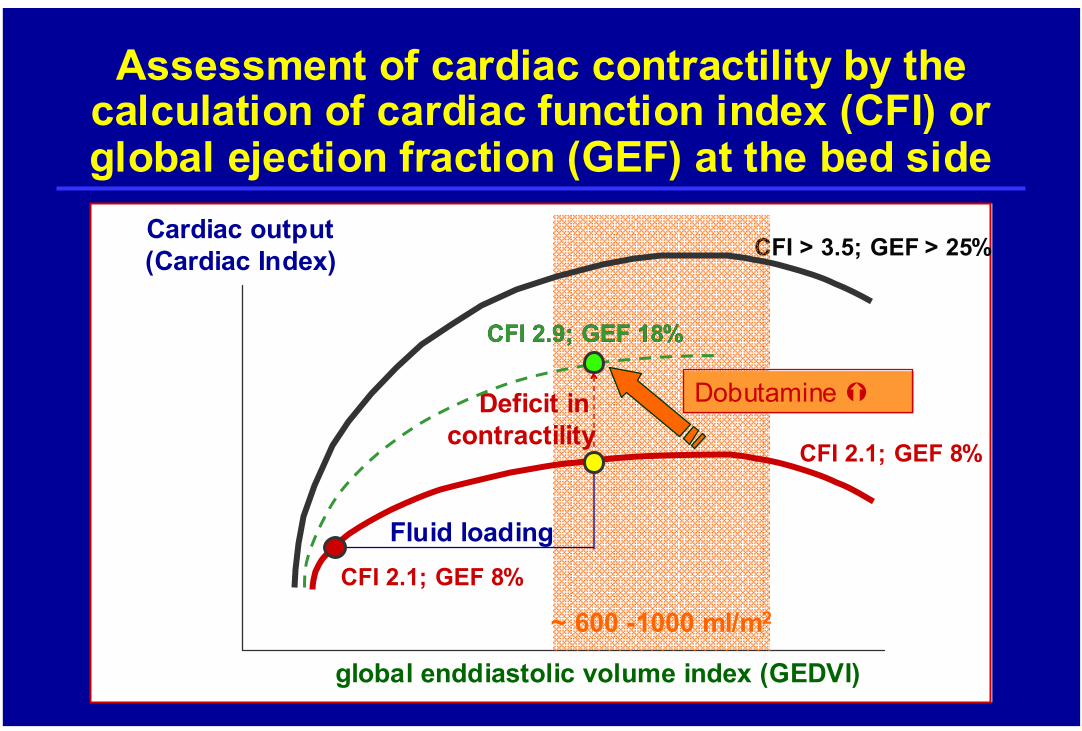
global enddiastolic volume index (GEDVI)
Cardiac output(Cardiac Index)
CFI 2.1; GEF 8%
CFI > 3.5; GEF > 25%
~ 600 -1000 ml/m2
Deficit in contractility
Assessment of cardiac contractility by the calculation of cardiac function index (CFI) or global ejection fraction (GEF) at the bed side
Fluid loading
Dobutamine
CFI 2.9; GEF 18%CFI 2.9; GEF 18%
CFI 2.1; GEF 8%
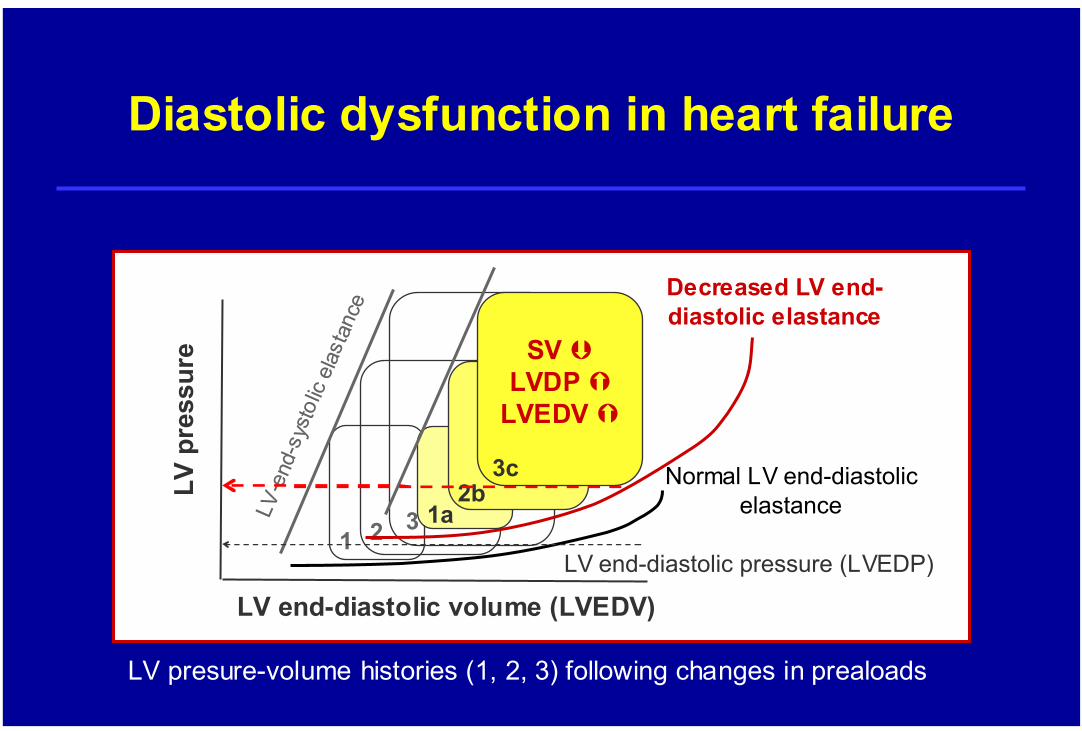
LV p
ress
ure
LV end-diastolic volume (LVEDV)
Normal LV end-diastolicelastance
1 2 3
LV end-diastolic pressure (LVEDP)
LVLV--e
ndend--
sys t
olic
sys t
olic
elas
tanc
eel
asta
nce
Diastolic dysfunction in heart failure
LV presure-volume histories (1, 2, 3) following changes in prealoads
Decreased LV end-diastolic elastance
1a2b
3c
SV LVDP
LVEDV
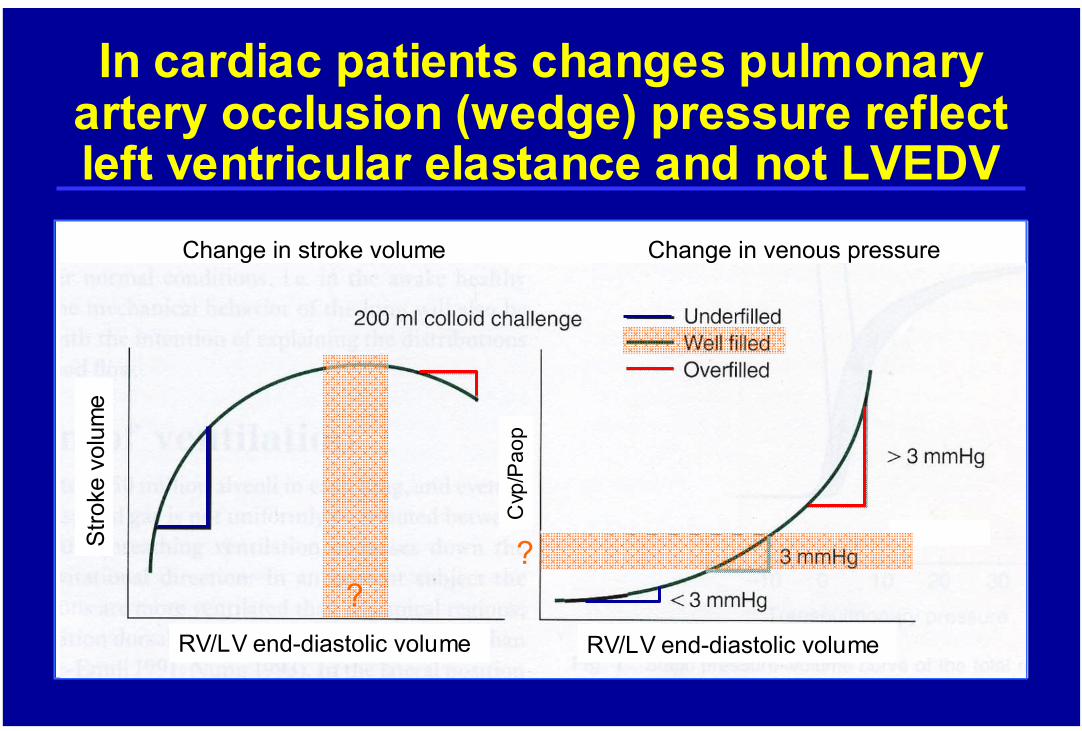
In cardiac patients changes pulmonary artery occlusion (wedge) pressure reflect left ventricular elastance and not LVEDV
Cvp
/Pao
p
RV/LV end-diastolic volume RV/LV end-diastolic volume
Stro
ke v
olum
e
?
Change in stroke volume Change in venous pressure
?
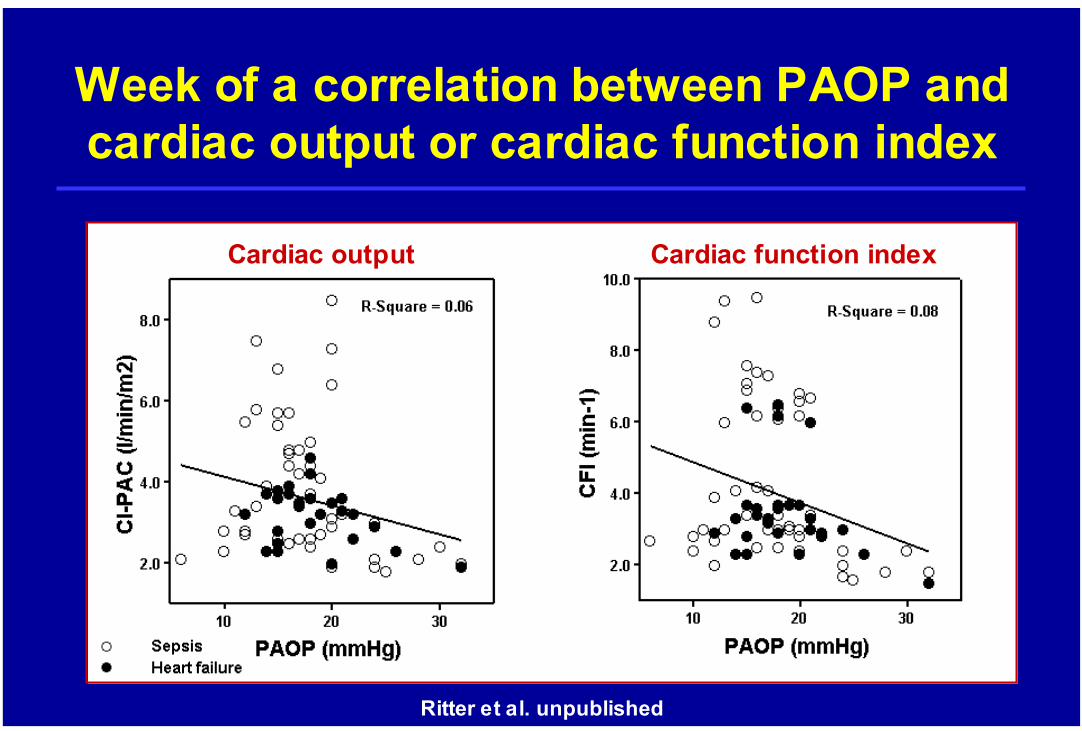
Week of a correlation between PAOP and cardiac output or cardiac function index
Cardiac output Cardiac function index
Ritter et al. unpublished
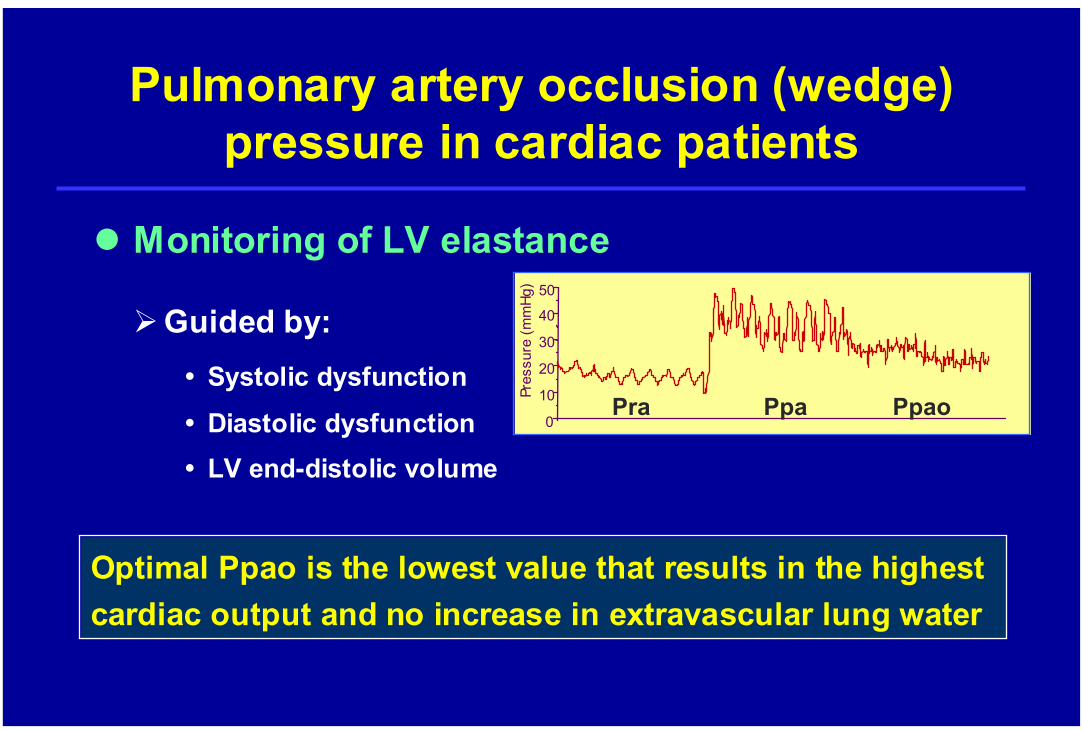
Monitoring of LV elastance
Pulmonary artery occlusion (wedge) pressure in cardiac patients
Optimal Ppao is the lowest value that results in the highest cardiac output and no increase in extravascular lung water
Guided by:Systolic dysfunction
Diastolic dysfunctionLV end-distolic volume
0
10
20
30
40
50
Pres
sure
(mm
Hg)
Pra Ppa Ppao
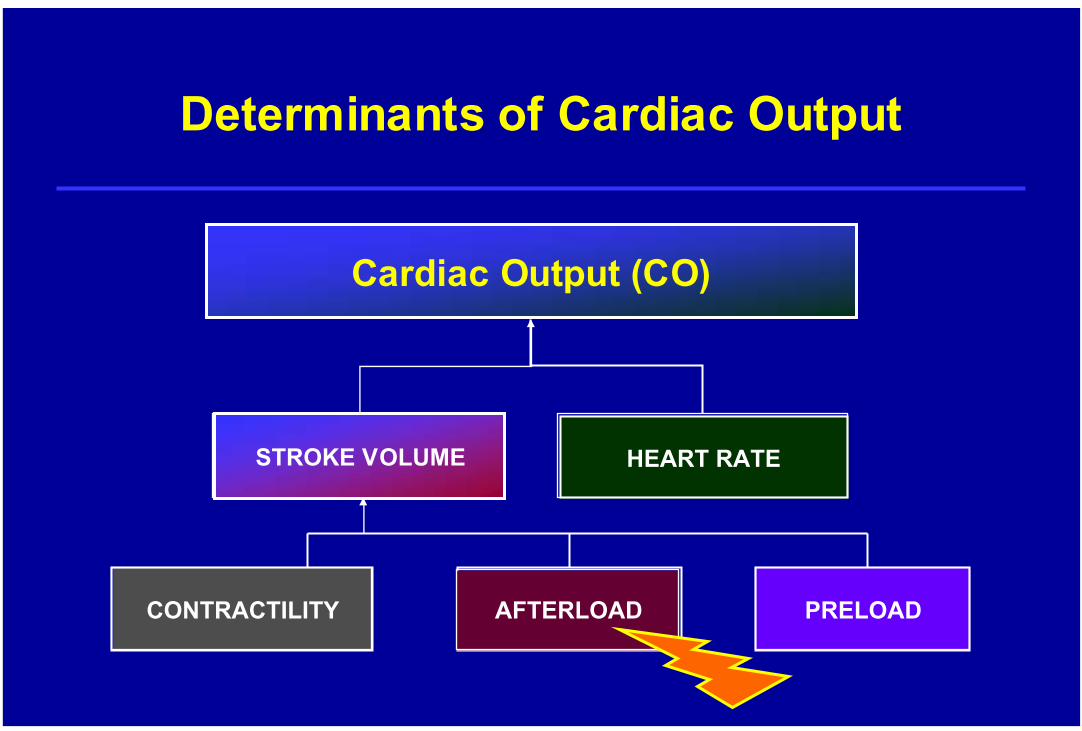
Determinants of Cardiac Output
Cardiac Output (CO)
AFTERLOAD
STROKE VOLUME
CONTRACTILITY PRELOADAFTERLOAD
STROKE VOLUME HEART RATE
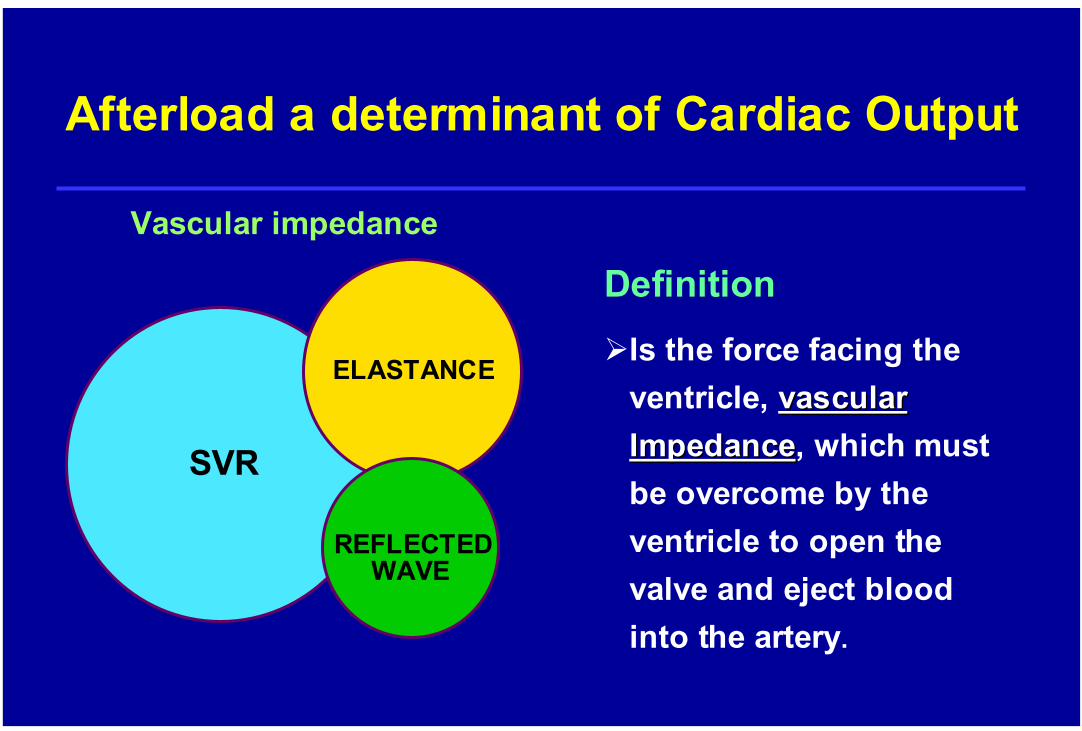
Afterload a determinant of Cardiac Output
SVR
ELASTANCE
REFLECTEDWAVE
Vascular impedance
DefinitionIs the force facing the ventricle, vascular vascular ImpedanceImpedance, which must be overcome by the ventricle to open the valve and eject blood into the artery.
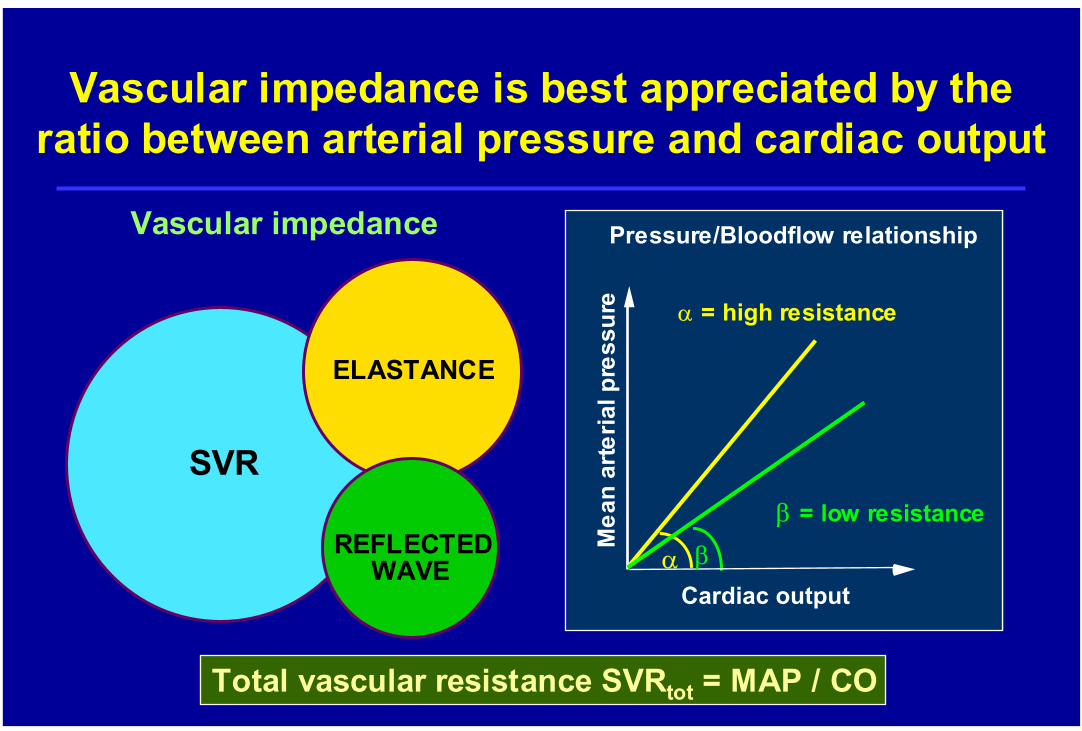
Vascular impedance is best appreciated by the ratio between arterial pressure and cardiac output
Total vascular resistance SVRtot = MAP / CO
Pressure/Bloodflow relationship
Mea
nar
teria
lpre
ssur
e
β = low resistance
0
α = high resistance
Cardiac outputα β
SVR
ELASTANCE
REFLECTEDWAVE
Vascular impedance
global enddiastolic volume index (GEDVI)
Cardiac output(Cardiac Index)
CI < 2.2 l/min/m2
CI 3.5-5.5 l/min/m2
~ 600 -1000 ml/m2
SV deficit
Afterload reduction improves cardiac output:applied pathophysiology at the bed side
Fluid loading
Nitrates
CI 2.9 l/min/mCI 2.9 l/min/m22
CI 1.5 l/min/m2
CI aim to cope CI aim to cope with VOwith VO22 demanddemand
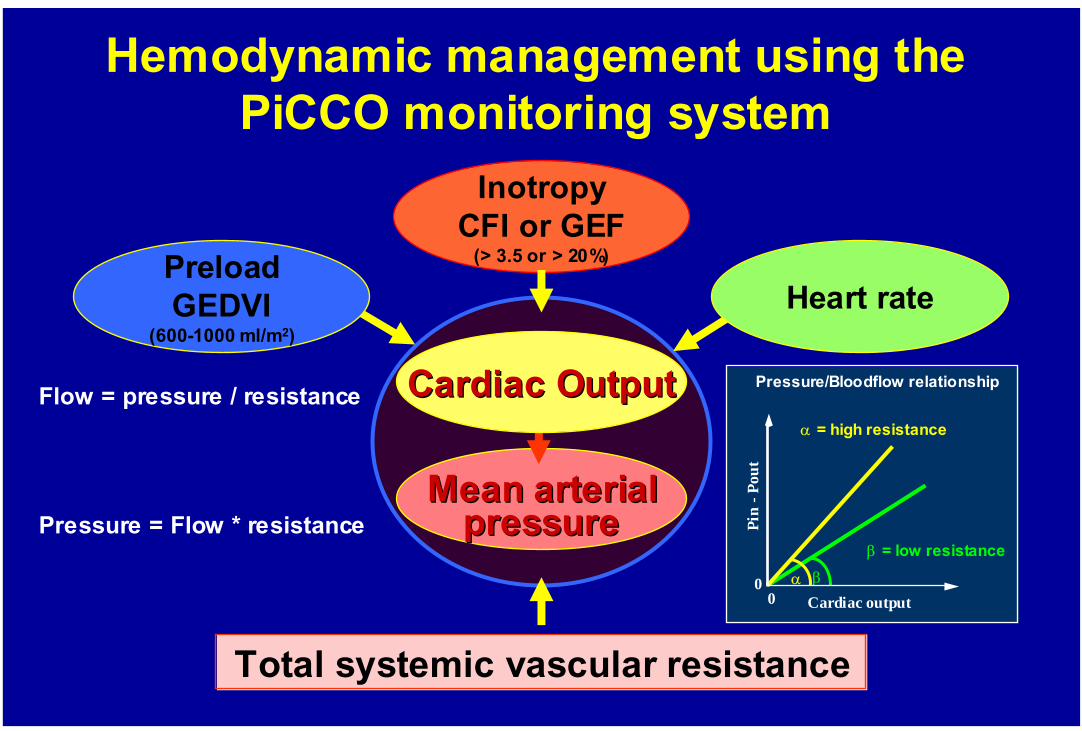
Pressure/Bloodflow relationship
MeanMean arterialarterialpressurepressure
CardiacCardiac OutputOutput
Heart rate
InotropyCFI or GEF
(> 3.5 or > 20%)
Total systemic vascular resistance
Hemodynamic management using the PiCCO monitoring system
PreloadGEDVI
(600-1000 ml/m2)
Flow = pressure / resistance
Pressure = Flow * resistanceβ = low resistance
β
α = high resistance
α
Pin
-Pou
t
00
Cardiac output
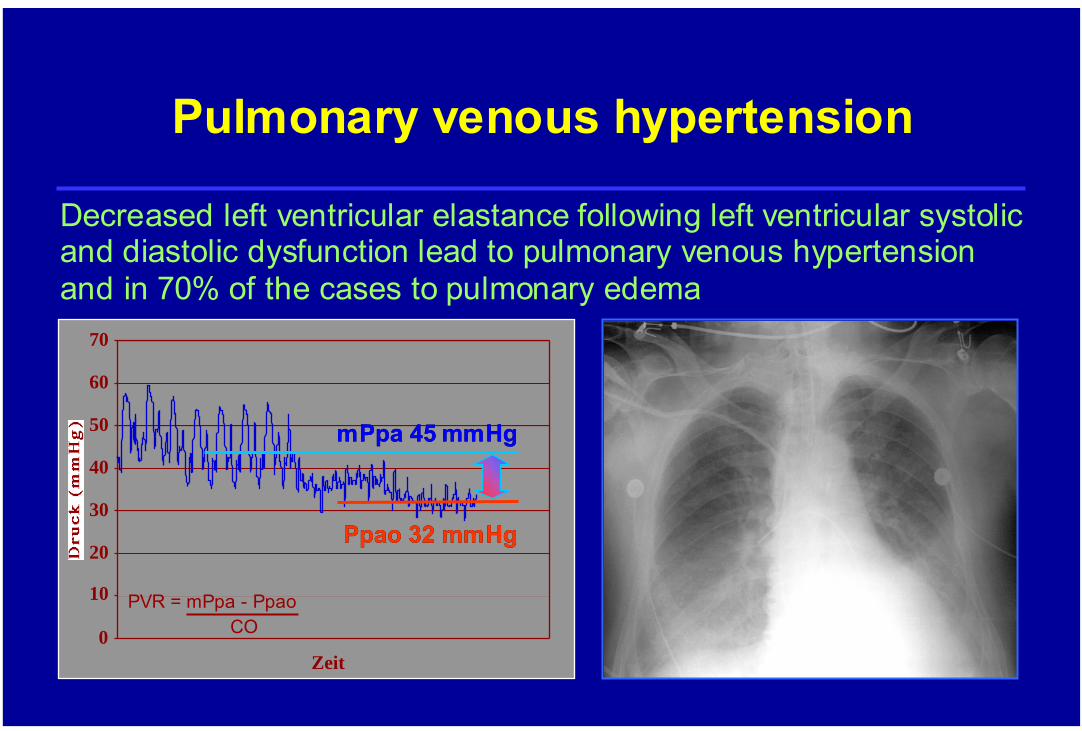
Pulmonary venous hypertension
Decreased left ventricular elastance following left ventricular systolic and diastolic dysfunction lead to pulmonary venous hypertension and in 70% of the cases to pulmonary edema
0
10
20
30
40
50
60
70
Zeit
PpaoPpao 32 mmHg32 mmHg
mPpamPpa 45 mmHg45 mmHg
PVR = mPpa - PpaoCO
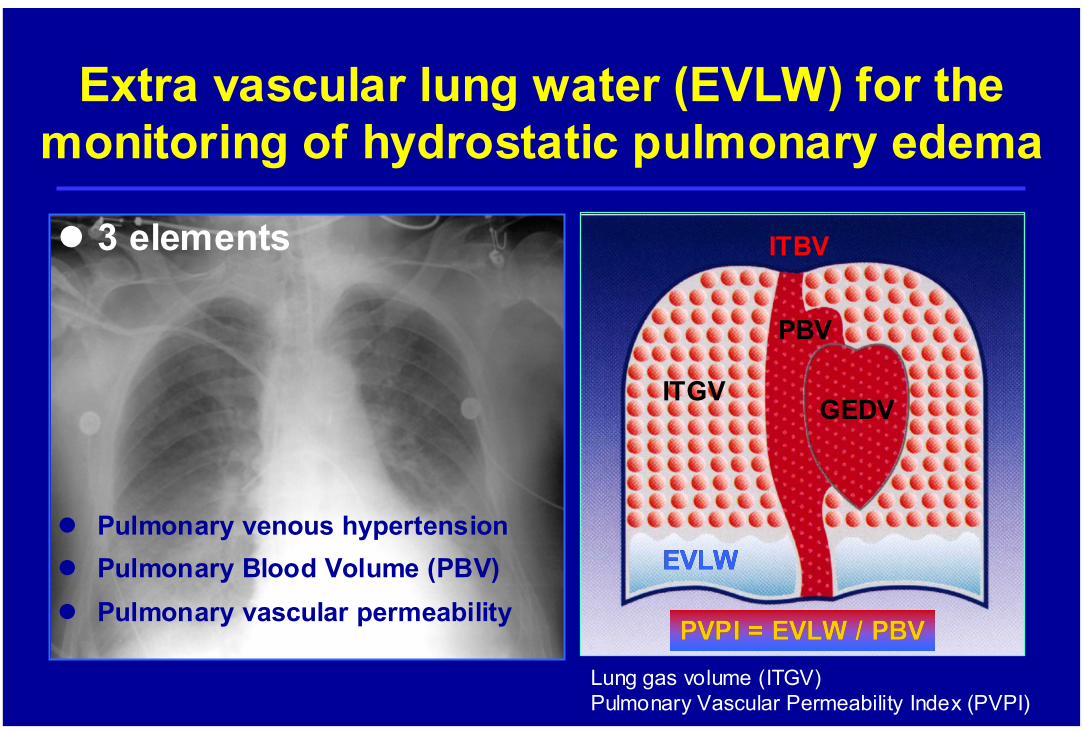
Extra vascular lung water (EVLW) for the monitoring of hydrostatic pulmonary edema
ITGV
ITBV
EVLWEVLW
PVPI = EVLW / PBVPVPI = EVLW / PBVLung gas volume (ITGV)Pulmonary Vascular Permeability Index (PVPI)
GEDV
3 elements
Pulmonary venous hypertensionPulmonary Blood Volume (PBV)Pulmonary vascular permeability
PBV

PiCCO derived Extra-Vascular Lung Water
EVLW = ITTV - ITBVb
RA RV LA LV
EVLW
RA RV LA LV
EVLW
ITTVITTV
ITBVITBVbb
EVLWEVLW
RA RV LA LV
EVLW
ITTV = CO x MTtTDa
ITBVITBVbb = = GEDV * 1.25GEDV * 1.25
ITTV = intrathoracal thermovolumeITBV = ITBV = caluculatedcaluculated (b) (b) intrathoracalintrathoracalbloodvolumenbloodvolumen
EVLW = ITTV - (GEDV * 1.25)
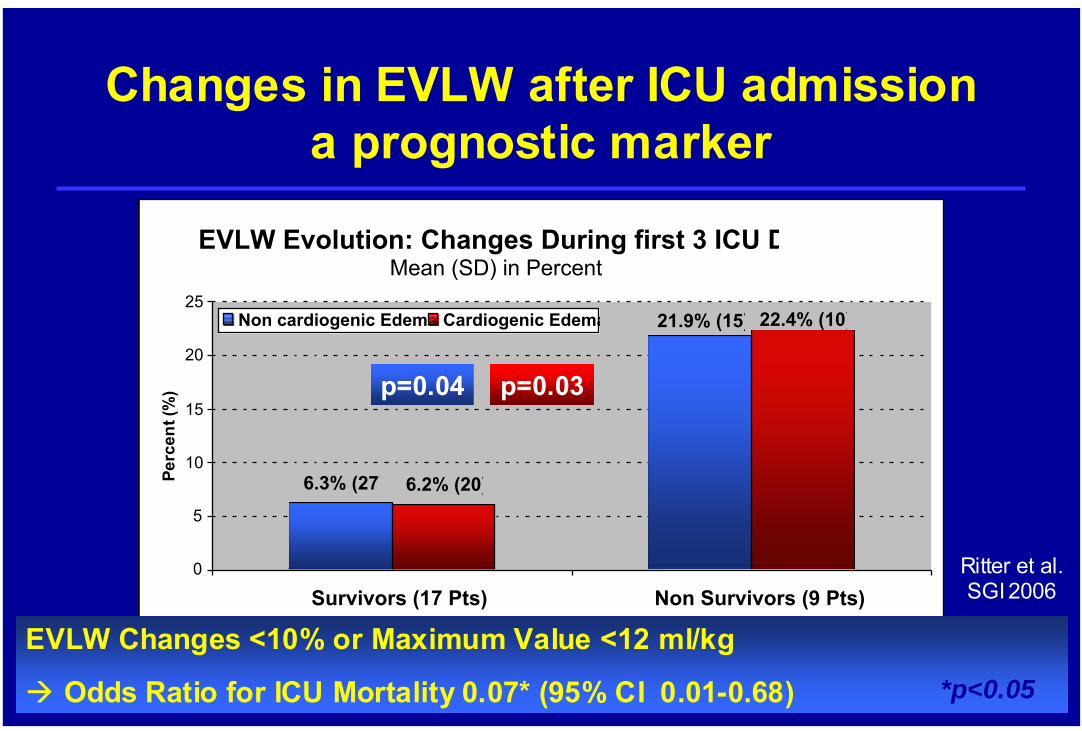
EVLW Evolution: Changes During first 3 ICU DMean (SD) in Percent
21.9% (15)
6.3% (27)
22.4% (10)
6.2% (20)
0
5
10
15
20
25
Survivors (17 Pts) Non Survivors (9 Pts)
Perc
ent (
%)
Non cardiogenic Edema Cardiogenic Edema
p=0.04 p=0.03
EVLW Changes <10% or Maximum Value <12 ml/kg
Odds Ratio for ICU Mortality 0.07* (95% CI 0.01-0.68) *p<0.05
Changes in EVLW after ICU admission a prognostic marker
Ritter et al.SGI 2006
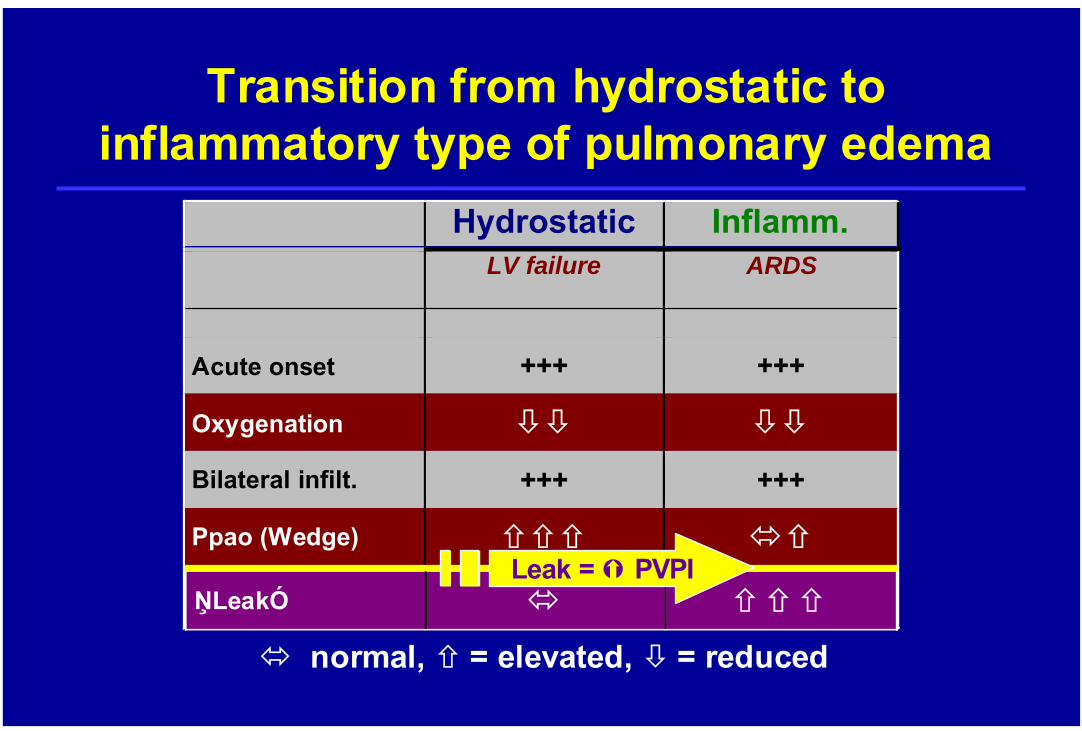
Transition from hydrostatic to inflammatory type of pulmonary edema
Hydrostatic Inflamm. LV failure ARDS
Acute onset +++ +++
Oxygenation
Bilateral infilt. +++ +++
Ppao (Wedge)
????
normal, = elevated, = reduced
ŅLeakÓ
Leak = PVPI
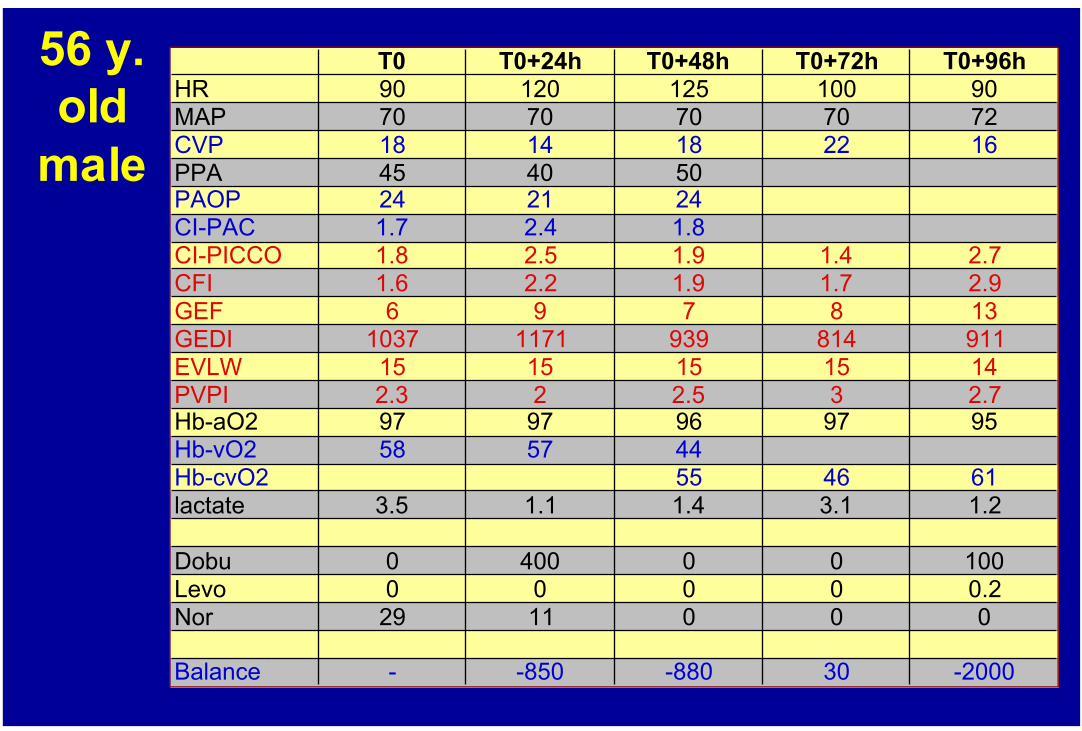
56 y. old
male
T0 T0+24h T0+48h T0+72h T0+96hHR 90 120 125 100 90MAP 70 70 70 70 72CVP 18 14 18 22 16PPA 45 40 50PAOP 24 21 24CI-PAC 1.7 2.4 1.8CI-PICCO 1.8 2.5 1.9 1.4 2.7CFI 1.6 2.2 1.9 1.7 2.9GEF 6 9 7 8 13GEDI 1037 1171 939 814 911EVLW 15 15 15 15 14PVPI 2.3 2 2.5 3 2.7Hb-aO2 97 97 96 97 95Hb-vO2 58 57 44Hb-cvO2 55 46 61lactate 3.5 1.1 1.4 3.1 1.2
Dobu 0 400 0 0 100Levo 0 0 0 0 0.2Nor 29 11 0 0 0
Balance - -850 -880 30 -2000
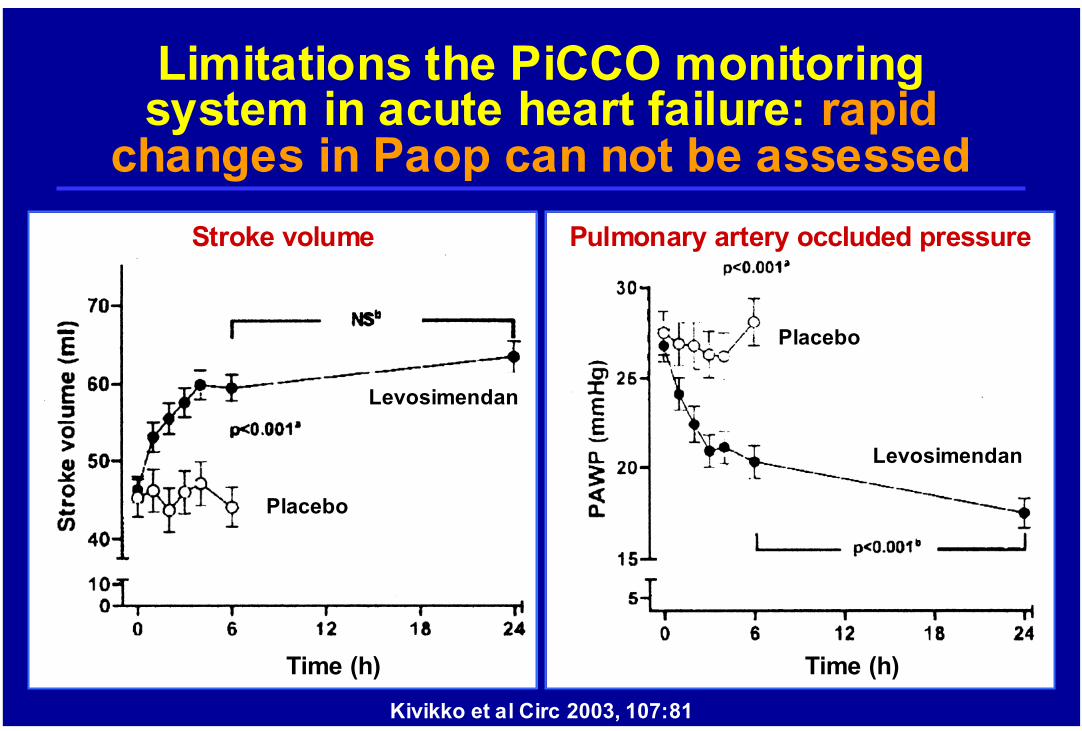
Limitations the PiCCO monitoring system in acute heart failure: rapid
changes in Paop can not be assessed
Kivikko et al Circ 2003, 107:81
Time (h)
Stroke volume
Time (h)
Pulmonary artery occluded pressure
Levosimendan
Placebo
Levosimendan
Placebo
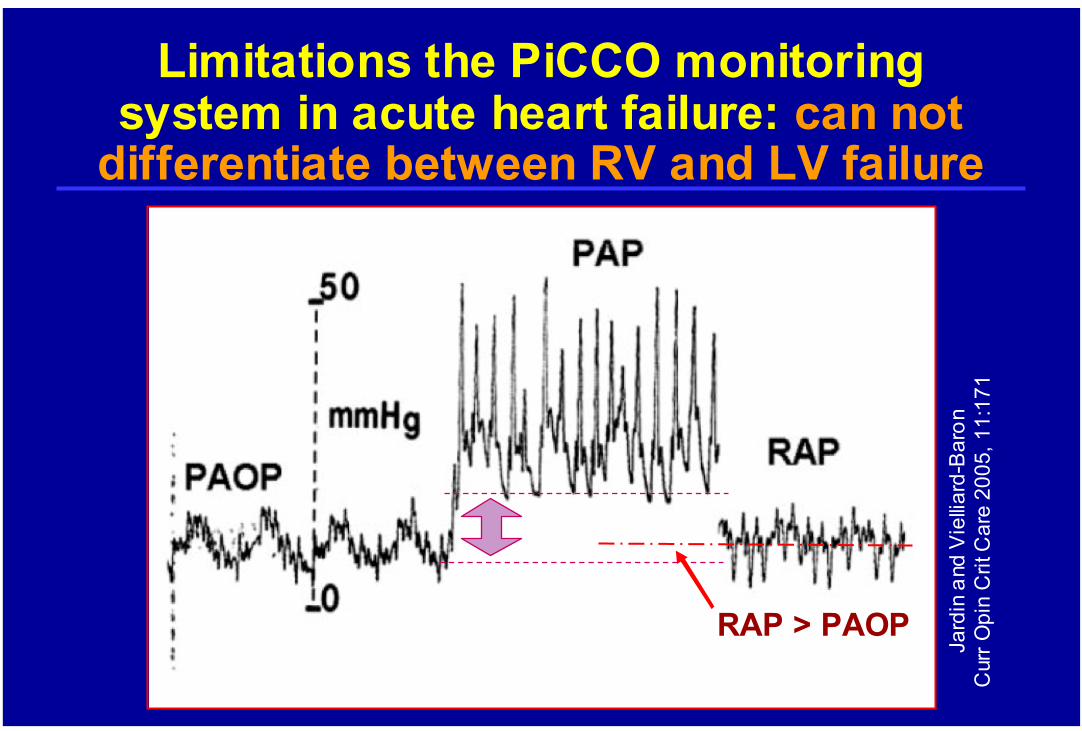
RAP > PAOP
Jard
inan
d V
iellia
rd-B
aron
Cur
rOpi
nC
ritC
are
2005
, 11:
171
Limitations the PiCCO monitoring system in acute heart failure: can not
differentiate between RV and LV failure
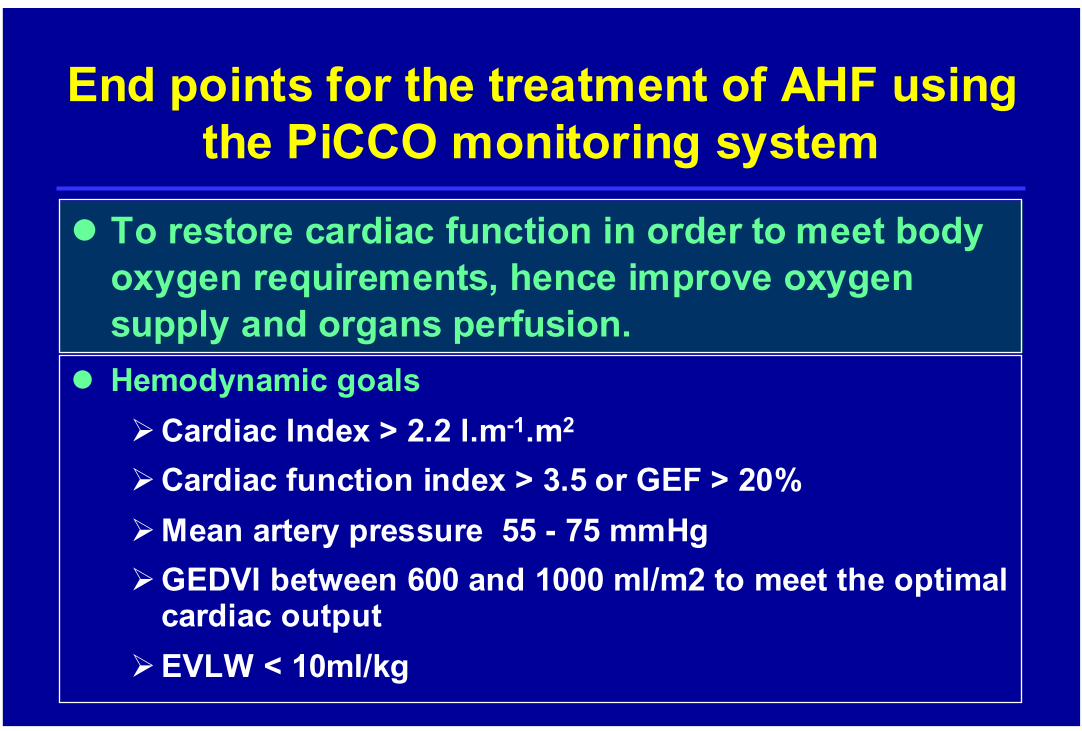
To restore cardiac function in order to meet body oxygen requirements, hence improve oxygen supply and organs perfusion.
End points for the treatment of AHF using the PiCCO monitoring system
Hemodynamic goalsCardiac Index > 2.2 l.m-1.m2
Cardiac function index > 3.5 or GEF > 20%Mean artery pressure 55 - 75 mmHgGEDVI between 600 and 1000 ml/m2 to meet the optimal cardiac outputEVLW < 10ml/kg


![Cardiogenic shock July 2010 3rd [] - rcpt.org · PDF fileCardiogenic shock นพ. ... attempted in patients with MI and pulmonary edema ... Microsoft PowerPoint - Cardiogenic shock](https://img.pdfslide.net/doc/110x75/5ab6fddf7f8b9a86428e42fd/cardiogenic-shock-july-2010-3rd-rcptorg-shock-attempted-in-patients.jpg)