Embed Size (px)
Citation preview
Marilyn G. Klug, PhD
Mandi-Leigh Peterson, MA
Center for Rural Health
The University of North Dakota School of Medicine & Health Sciences
501 North Columbia Road, Stop 9037
Grand Forks, North Dakota 58202
July 2013
Funded byNorth Dakota Department of Human Services, Aging Services Division
This report may also be found at ruralhealth.und.edu/publications/reports
Care Consultation Distances to Potential Caregivers: Weighted Population Estimates
2
Table of Contents List of Figures .................................................................................................................................. 2
List of Tables ................................................................................................................................... 2
Introduction .................................................................................................................................... 3
Methods ......................................................................................................................................... 3
Travel Distances .............................................................................................................................. 4
Adjusted Population ....................................................................................................................... 6
Conclusion ...................................................................................................................................... 8
List of Figures Figure 1. Distance needed to travel from care consultant to caregiver ......................................... 5 Figure 2. Actual population in care consultant areas by median distance traveled ....................... 6 Figure 3. Weighted population in care consultant areas by median distance traveled ................. 7 Figure 4. Percent of weighted population within each median distance area for each care consultant ....................................................................................................................................... 8
List of Tables Table 1. Assignment of person weights based on median travel time and hours added ............... 4 Table 2. Average distance traveled and populations of areas adjusted for distances ................... 6
3
Introduction The North Dakota Department of Human Services, Aging Services Division has funded, and the Alzheimer’s Association of MN-‐ND has administered the Dementia Care Services Program (DCSP) in North Dakota since January 2010. The DCSP provides service to all counties and legislative districts in North Dakota. Two project staff provide supervision and oversight to five regional care consultants. Caregivers interact with the DCSP either through an information help line or a care consultation. The care consultants decide if the caregiver needs are a level 1 (i.e., focuses on one specific topic or objective for the caregiver) or a level 2 (i.e., addresses multiple issues encountered by the caregiver) consultation, either in person or by phone. Follow-‐up care consultations (in person or by phone) are provided to determine if the caregivers have completed their objectives and if they need further help. The DCSP strives to complete the care plan action steps within three visits, usually within a time period of six months. However, there is no formal discharge from the program and a caregiver can return to the DCSP for additional care plans at any time. The care consultants often have to travel to other cities or towns for in-‐person visits with caregivers. This can add extra time to each care consultation if the care consultant has to travel beyond the city where they are located. Travel on gravel roads can also add to the time burden. The purpose of this brief report is to examine the population distributions in areas served by care consultants at the Dementia Care Services Program (DCSP) according to the distance the care consultant has to travel to reach the caregivers in their area.
Methods Six care consultation areas were identified: Minot (DHS regions I and II), Grand Forks, (regions III and IV), Fargo (region V), Jamestown (region VI), Bismarck (region VII), and Dickinson (region VIII). The population age 30 to 64 in each area was estimated using the 2010 census data. This represents approximately 80% of the population of potential (not actual) caregivers that may need DCSP services. It is an underestimate as it does not include transients nor potential caregivers under age 30 or over age 64. Distances between the potential caregivers’ city and the area care consultant’s city were estimated using travel distance formulas between the zip codes of the two cities. This distance was calculated using travel distances on roads, not straight line distances. Distances were divided into seven groups. The median travel time within each group was used to weight the caregiver, with those further from the care consultant having greater weight to reflect travel time. The population in each care consultant’s area was estimated then weighted based on the amount of travel needed to reach each potential caregiver. This weighted population was examined within each care consultant area to determine not just the amount of potential
4
caregivers or where the caregivers were located, but also the time needed to work with them and the associated work load for the care consultant.
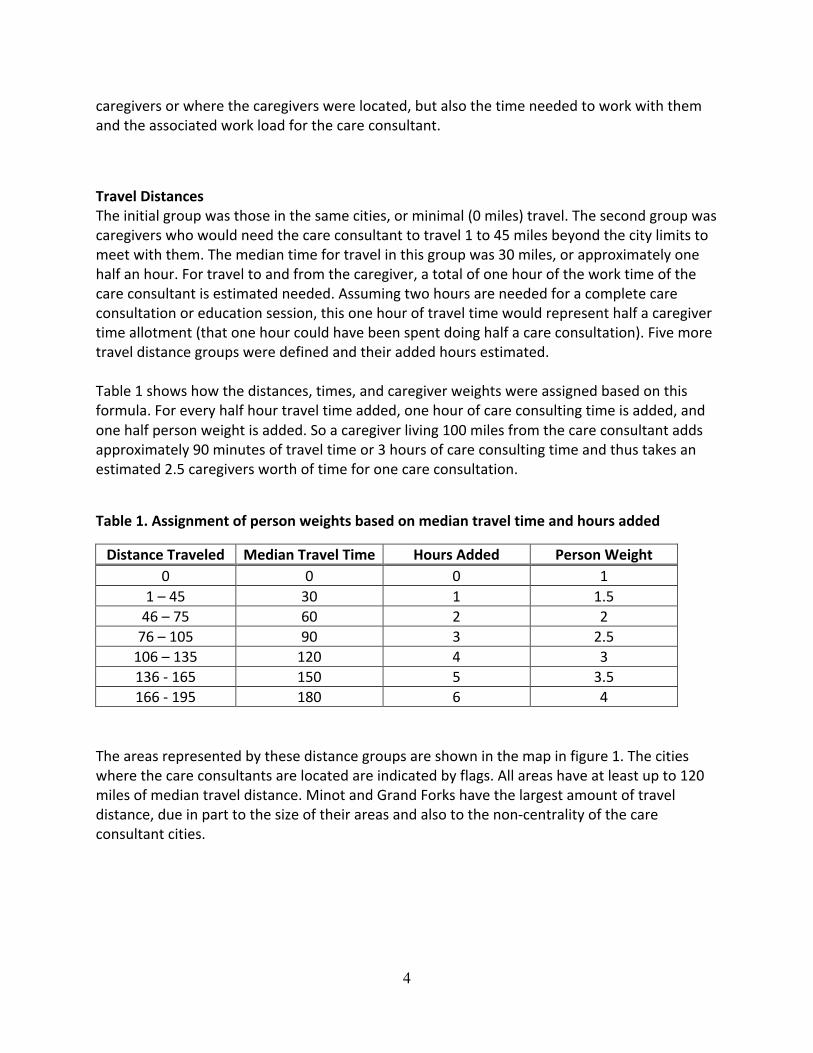
Travel Distances The initial group was those in the same cities, or minimal (0 miles) travel. The second group was caregivers who would need the care consultant to travel 1 to 45 miles beyond the city limits to meet with them. The median time for travel in this group was 30 miles, or approximately one half an hour. For travel to and from the caregiver, a total of one hour of the work time of the care consultant is estimated needed. Assuming two hours are needed for a complete care consultation or education session, this one hour of travel time would represent half a caregiver time allotment (that one hour could have been spent doing half a care consultation). Five more travel distance groups were defined and their added hours estimated. Table 1 shows how the distances, times, and caregiver weights were assigned based on this formula. For every half hour travel time added, one hour of care consulting time is added, and one half person weight is added. So a caregiver living 100 miles from the care consultant adds approximately 90 minutes of travel time or 3 hours of care consulting time and thus takes an estimated 2.5 caregivers worth of time for one care consultation.
Table 1. Assignment of person weights based on median travel time and hours added
Distance Traveled Median Travel Time Hours Added Person Weight 0 0 0 1
1 – 45 30 1 1.5 46 – 75 60 2 2 76 – 105 90 3 2.5 106 – 135 120 4 3 136 -‐ 165 150 5 3.5 166 -‐ 195 180 6 4
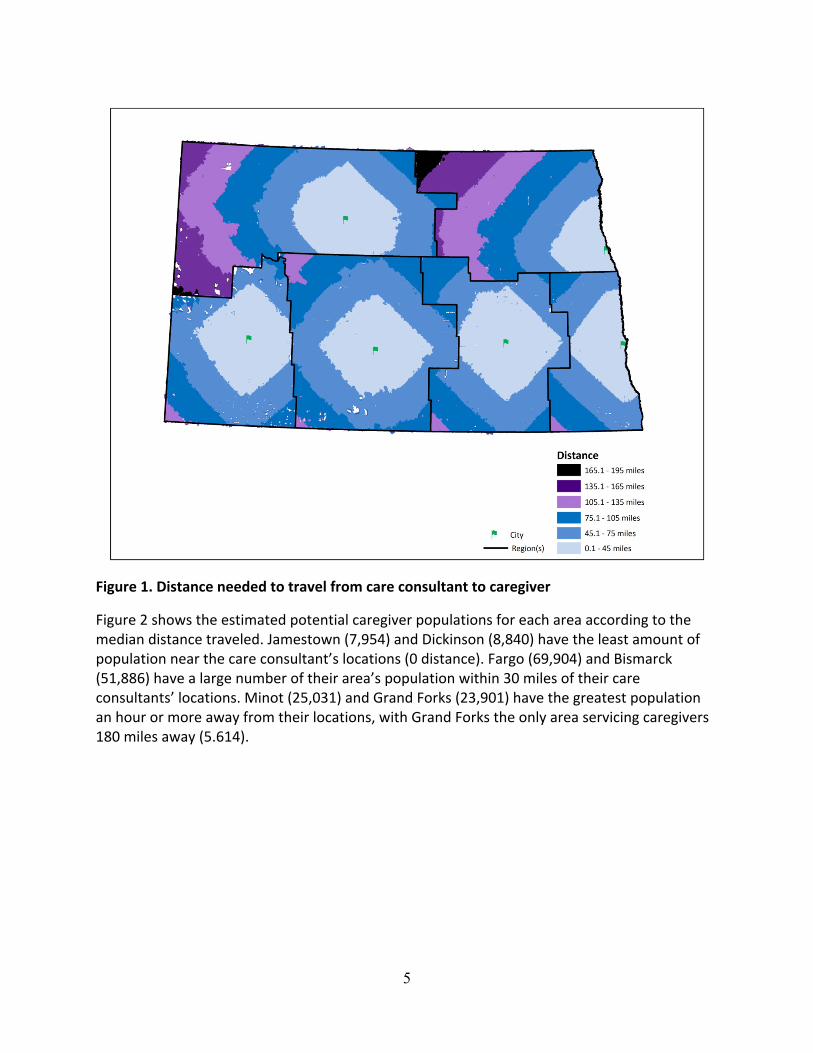
The areas represented by these distance groups are shown in the map in figure 1. The cities where the care consultants are located are indicated by flags. All areas have at least up to 120 miles of median travel distance. Minot and Grand Forks have the largest amount of travel distance, due in part to the size of their areas and also to the non-‐centrality of the care consultant cities.
5
Figure 1. Distance needed to travel from care consultant to caregiver
Figure 2 shows the estimated potential caregiver populations for each area according to the median distance traveled. Jamestown (7,954) and Dickinson (8,840) have the least amount of population near the care consultant’s locations (0 distance). Fargo (69,904) and Bismarck (51,886) have a large number of their area’s population within 30 miles of their care consultants’ locations. Minot (25,031) and Grand Forks (23,901) have the greatest population an hour or more away from their locations, with Grand Forks the only area servicing caregivers 180 miles away (5.614).
6
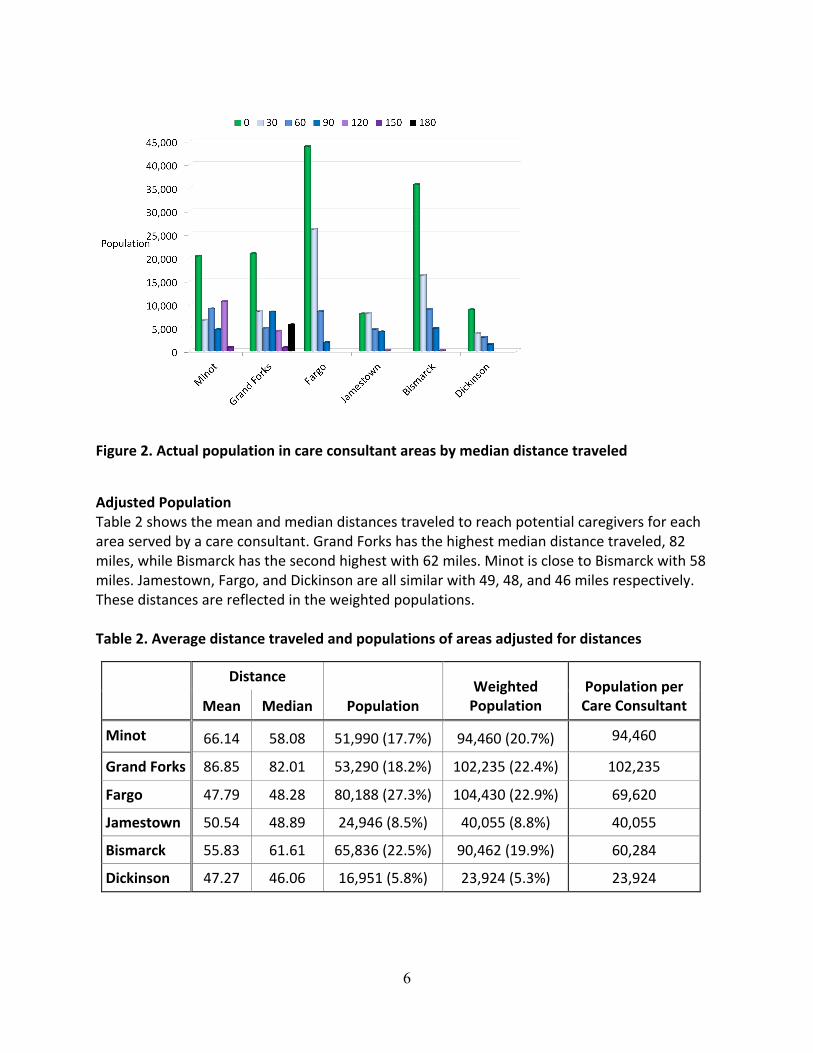
Figure 2. Actual population in care consultant areas by median distance traveled
Adjusted Population Table 2 shows the mean and median distances traveled to reach potential caregivers for each area served by a care consultant. Grand Forks has the highest median distance traveled, 82 miles, while Bismarck has the second highest with 62 miles. Minot is close to Bismarck with 58 miles. Jamestown, Fargo, and Dickinson are all similar with 49, 48, and 46 miles respectively. These distances are reflected in the weighted populations. Table 2. Average distance traveled and populations of areas adjusted for distances
Distance
Population Weighted Population
Population per Care Consultant Mean Median
Minot 66.14 58.08 51,990 (17.7%) 94,460 (20.7%) 94,460
Grand Forks 86.85 82.01 53,290 (18.2%) 102,235 (22.4%) 102,235
Fargo 47.79 48.28 80,188 (27.3%) 104,430 (22.9%) 69,620
Jamestown 50.54 48.89 24,946 (8.5%) 40,055 (8.8%) 40,055
Bismarck 55.83 61.61 65,836 (22.5%) 90,462 (19.9%) 60,284
Dickinson 47.27 46.06 16,951 (5.8%) 23,924 (5.3%) 23,924
7
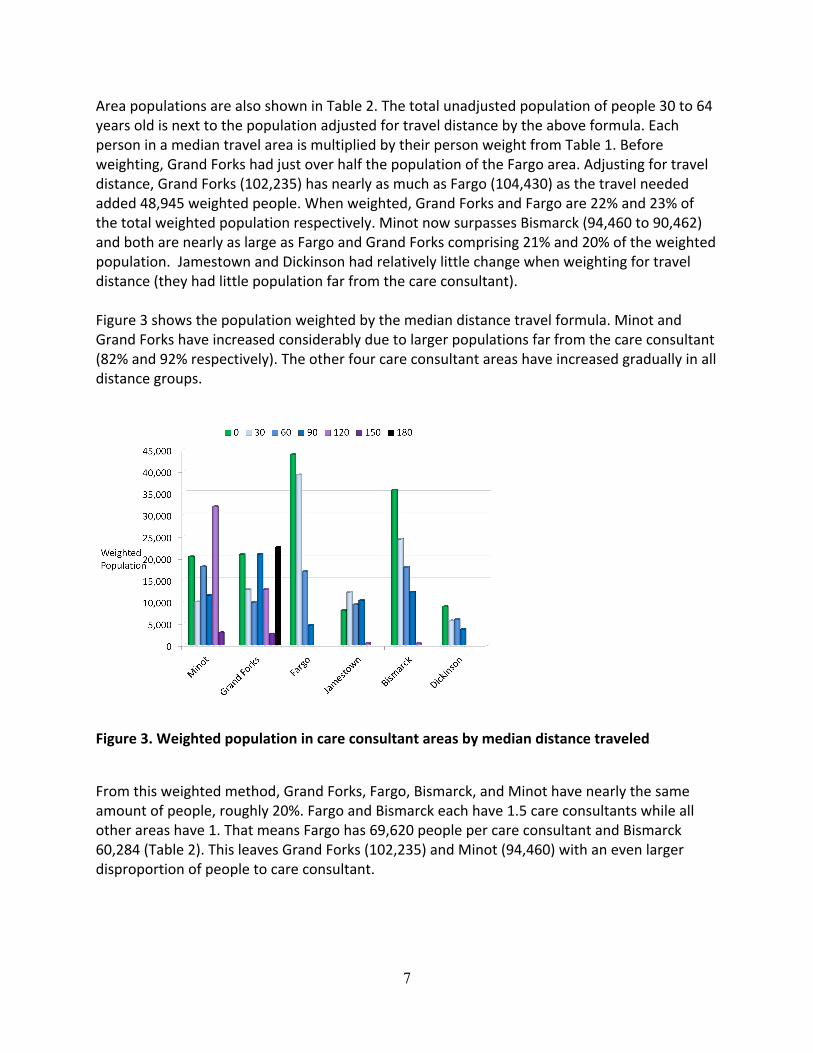
Area populations are also shown in Table 2. The total unadjusted population of people 30 to 64 years old is next to the population adjusted for travel distance by the above formula. Each person in a median travel area is multiplied by their person weight from Table 1. Before weighting, Grand Forks had just over half the population of the Fargo area. Adjusting for travel distance, Grand Forks (102,235) has nearly as much as Fargo (104,430) as the travel needed added 48,945 weighted people. When weighted, Grand Forks and Fargo are 22% and 23% of the total weighted population respectively. Minot now surpasses Bismarck (94,460 to 90,462) and both are nearly as large as Fargo and Grand Forks comprising 21% and 20% of the weighted population. Jamestown and Dickinson had relatively little change when weighting for travel distance (they had little population far from the care consultant). Figure 3 shows the population weighted by the median distance travel formula. Minot and Grand Forks have increased considerably due to larger populations far from the care consultant (82% and 92% respectively). The other four care consultant areas have increased gradually in all distance groups.
Figure 3. Weighted population in care consultant areas by median distance traveled
From this weighted method, Grand Forks, Fargo, Bismarck, and Minot have nearly the same amount of people, roughly 20%. Fargo and Bismarck each have 1.5 care consultants while all other areas have 1. That means Fargo has 69,620 people per care consultant and Bismarck 60,284 (Table 2). This leaves Grand Forks (102,235) and Minot (94,460) with an even larger disproportion of people to care consultant.

8
Figure 4 represents the percent of the weighted population of North Dakota ages 30-‐64 within each travel distance area. For example, 12% of ND’s weighted population is within the city limits of Bismarck. 7% of the ND weighted population is within the city limits of Minot. 1% is within 30 median miles of Dickinson and 1% is within 60 median miles. Fargo’s weighted population is clustered near Fargo. Minot and Grand Forks’ weighted populations fluctuate between 1.5% and 4.99% across their areas.
Figure 4. Percent of weighted population within each median distance area for each care consultant
Conclusion Either at least two care consultants need to be hired, which would put the adjusted number of people per care consultant to near 50,000 per care consultant, or areas have to be re-‐distributed to remove some burden from the northern part of the state to the southern. Further, re-‐locating care consultants to a more central location in their region would reduce travel time. However, these last two suggestions are temporary fixes and do not address the overall burden on care consultants. Unless the ratio of potential weighted people is reduced to 50,000 or below, service has been seen to suffer and will likely continue to do so.