Embed Size (px)
Citation preview
Eastern Kentucky UniversityEncompass
Online Theses and Dissertations Student Scholarship
January 2011
Career and Technical Education ProgramAlignment with Local Workforce NeedsKarla Beth HargisEastern Kentucky University
Follow this and additional works at: https://encompass.eku.edu/etd
Part of the Educational Administration and Supervision Commons
This Open Access Dissertation is brought to you for free and open access by the Student Scholarship at Encompass. It has been accepted for inclusionin Online Theses and Dissertations by an authorized administrator of Encompass. For more information, please contact [email protected].
Recommended CitationHargis, Karla Beth, "Career and Technical Education Program Alignment with Local Workforce Needs" (2011). Online Theses andDissertations. 48.https://encompass.eku.edu/etd/48


Career and Technical Education Program
Alignment with Local Workforce Needs
By
Karla Beth Hargis
Master of Arts in Education
Eastern Kentucky University
Richmond, Kentucky
2005
Master of Arts in Teaching
Eastern Kentucky University
Richmond, Kentucky
2002
Bachelor of Business Administration
Eastern Kentucky University
Richmond, Kentucky
1988
Submitted to the Faculty of the Graduate School of
Eastern Kentucky University
in partial fulfillment of the requirements
for the degree of
DOCTOR OF EDUCATION
December, 2011

ii
Copyright © Karla Beth Hargis, 2011
All rights reserved

iii
DEDICATION
This dissertation is dedicated to family
Mr. David Hargis, Logan and Zachary Hargis
AND
Mrs. Betty Phelps
AND
Mr. and Mrs. Keith Pierce, Bailey and Parker Pierce
AND
The late Mr. L. Howard Phelps
who have supported me invaluably in a multitude of educational efforts.

iv
ACKNOWLEDGMENTS
I would like to thank my husband and sons for their understanding and patience
when the computer and countless volumes of research seemed to be my only repast and
for keeping me on track when it seemed the end was not in sight. David, your name
should be right beside mine. I would also like to thank my committee members for their
encouragement and for reminding me that this too shall pass. I would like to thank my
mother and sister for their love and support which was often counted on. I would like to
thank my friends and family who have prayed for this day and a special thank you to
Mike Centers for asking each Sunday morning, ―Are you a doctor yet?‖ Finally, thank
you to our Lord and Savior Jesus Christ for guidance and focus.
v
ABSTRACT
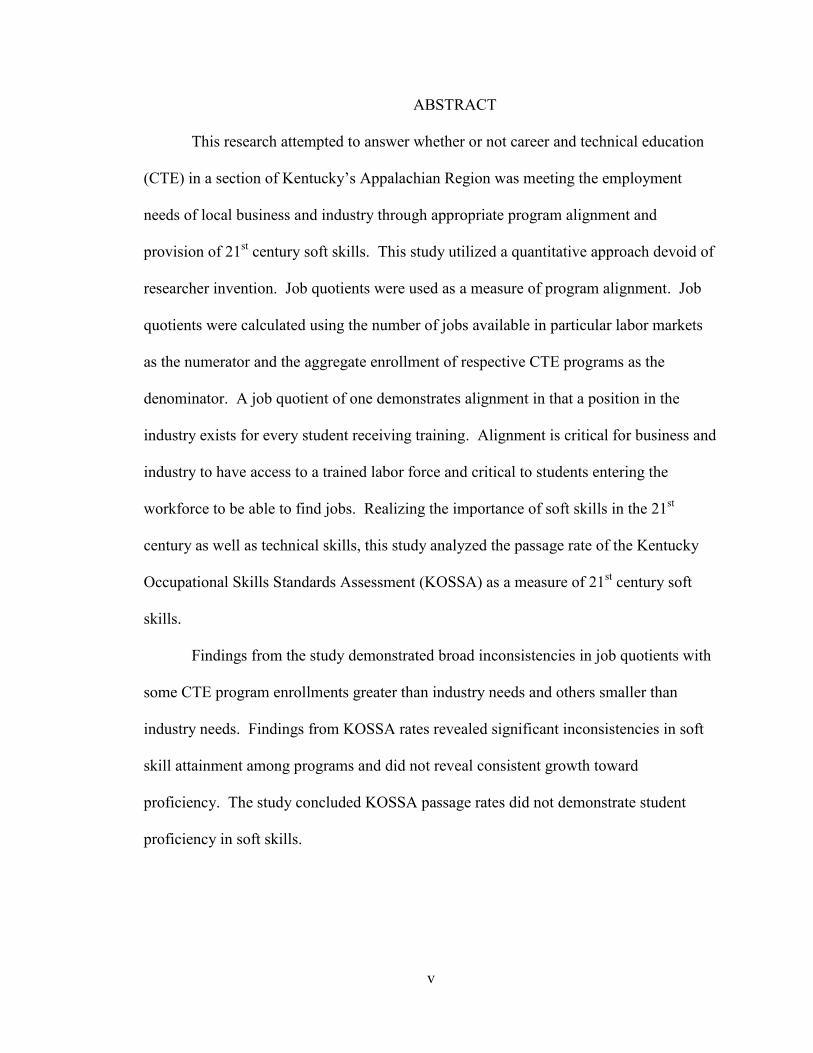
This research attempted to answer whether or not career and technical education
(CTE) in a section of Kentucky’s Appalachian Region was meeting the employment
needs of local business and industry through appropriate program alignment and
provision of 21st century soft skills. This study utilized a quantitative approach devoid of
researcher invention. Job quotients were used as a measure of program alignment. Job
quotients were calculated using the number of jobs available in particular labor markets
as the numerator and the aggregate enrollment of respective CTE programs as the
denominator. A job quotient of one demonstrates alignment in that a position in the
industry exists for every student receiving training. Alignment is critical for business and
industry to have access to a trained labor force and critical to students entering the
workforce to be able to find jobs. Realizing the importance of soft skills in the 21st
century as well as technical skills, this study analyzed the passage rate of the Kentucky
Occupational Skills Standards Assessment (KOSSA) as a measure of 21st century soft
skills.
Findings from the study demonstrated broad inconsistencies in job quotients with
some CTE program enrollments greater than industry needs and others smaller than
industry needs. Findings from KOSSA rates revealed significant inconsistencies in soft
skill attainment among programs and did not reveal consistent growth toward
proficiency. The study concluded KOSSA passage rates did not demonstrate student
proficiency in soft skills.
vi
TABLE OF CONTENTS
CHAPTER PAGE
I. INTRODUCTION .........................................................................................................1
Statement of the Problem .........................................................................................1
Purpose of Study ......................................................................................................9
Research Questions ................................................................................................11
Framework .............................................................................................................11
Assumptions, Limitations, and Delimitations of the Study ...................................15
Definitions..............................................................................................................17
Summary ................................................................................................................19
II. REVIEW OF LITERATURE .....................................................................................21
Introduction ............................................................................................................21
CTE Policy Development .....................................................................................22
Smith-Hughes Act ............................................................................................22
Political influences .....................................................................................23
Influence of leading educators ...................................................................23
1964 Vocational Education Act .......................................................................24
Political influences .....................................................................................25
Carl D. Perkins .....................................................................................26
Contributing factors to passage ..................................................................26
1984 Carl D. Perkins Act .................................................................................27
A nation at risk ...........................................................................................28
Political influences .....................................................................................28
Current Funding ...............................................................................................30
Inadequacies ...............................................................................................31
21st Century Workforce Demands ...................................................................32
Hard skills ..................................................................................................33
Soft skills ...................................................................................................33
Kentucky occupational skills standards .....................................................35
Labor shortages ..........................................................................................36
Employment opportunities .........................................................................37
CTE Initiatives and Governance ............................................................................38
National Perspective .......................................................................................38
Kentucky Initiatives & Governance.................................................................39
Area technology centers .............................................................................39
Assessment ...........................................................................................41
Programs ..............................................................................................42
CTE Benefits .........................................................................................................43
Labor Market Preparation ................................................................................43
Increased Student Engagement ........................................................................44
vii
Hands-on learning ......................................................................................44
Work based learning ..................................................................................45
Academic achievement ..............................................................................45
Post-Secondary Transition ...............................................................................46
Graduation Rates ..............................................................................................47
Human Capital Theory ...........................................................................................48
Community Success ...............................................................................................50
Appalachian variable .......................................................................................51
Literature Conclusion.............................................................................................51
III. METHODOLOGY ......................................................................................................56
Introduction ............................................................................................................56
Context of Study ....................................................................................................57
Instrumentation ......................................................................................................58
Population ..............................................................................................................60
Data Collection ......................................................................................................62
Research Design and Analysis ...............................................................................64
Summary ................................................................................................................68
IV. FINDINGS ...................................................................................................................69
Introduction ............................................................................................................69
Phase 1 ...................................................................................................................71
Phase 2 ...................................................................................................................72
Phase 3 ...................................................................................................................73
Program Job Quotient Results ...............................................................................74
Accounting and Finance ..................................................................................74
Automotive Technology ..................................................................................75
Construction Carpentry ....................................................................................76
Electricity .........................................................................................................77
Health Sciences ................................................................................................78
Horticulture ......................................................................................................79
Industrial Maintenance.....................................................................................80
Information Technology ..................................................................................81
Machine Tool ...................................................................................................82
Office Technology ...........................................................................................83
Welding ............................................................................................................84
Wood Manufacturing .......................................................................................85
Phase 4 ...................................................................................................................86
Accounting and Finance ..................................................................................89
Automotive Technology ..................................................................................89
Construction Carpentry ....................................................................................89
Electricity .........................................................................................................90
Health Sciences ................................................................................................90
Horticulture ......................................................................................................91
viii
Industrial Maintenance.....................................................................................91
Information Technology ..................................................................................91
Machine Tool ...................................................................................................92
Office Technology ...........................................................................................92
Welding ............................................................................................................93
Wood Manufacturing .......................................................................................93
Summary ................................................................................................................94
V. CONCLUSIONS..........................................................................................................96
Interpretation of Findings ....................................................................................100
Program Alignment ........................................................................................100
21st Century Soft Skills ..................................................................................103
Limitations of Research .......................................................................................104
Implications and Future Research ........................................................................106
Conclusion ...........................................................................................................109
REFERENCES ................................................................................................................112
APPENDICES .................................................................................................................128
A. ATC Program Enrollment Capacities ..................................................................128
B. ATC Program Occupational Data ........................................................................130
C. Kentucky Occupational Skills Standards Assessment Passage Rates .................140
ix
LIST OF TABLES
TABLE PAGE
1. LCADD County Geographical Demographics ................................................10
2. Program Offerings in ATC’s located within
the LCADD ......................................................................................................61
3. Enrollment Capacities by Program ..................................................................71
4. Current and Projected Career Cluster Occupations
and Projected Annual Openings for LCADD ..................................................72
5. Program Area Job Quotients ............................................................................73
6. Kentucky Occupational Skills Standards Soft Skills
by Career Cluster .............................................................................................87
7. Total Students Tested and KOSSA Passage Percentage
by Program and Year .......................................................................................88
A1. Enrollment Capacities by Program and ATC ................................................129
B1. Accounting and Finance Data ........................................................................131
B2. Automotive Technology Data ........................................................................132
B3. Construction Carpentry Data .........................................................................133
B4. Electricity Data ..............................................................................................133
B5. Health Sciences Data .....................................................................................134
B6. Horticulture Data ...........................................................................................134
B7. Industrial Maintenance Data ..........................................................................135
B8. Information Technology Data ........................................................................136
B9. Machine Tool Data ........................................................................................136
B10. Office Technology Data .................................................................................137
B11. Welding Data .................................................................................................138
B12. Wood Manufacturing Data ............................................................................139
C1. Casey Co. KOSSA Passage Rate ...................................................................141

x
C2. Clinton Co. KOSSA Passage Rate .................................................................141
C3. Green Co. KOSSA Passage Rate ...................................................................142
C4. Lake Cumberland KOSSA Passage Rate .......................................................142
C5. Pulaski Co. KOSSA Passage Rate .................................................................142
C6. Wayne Co. KOSSA Passage Rate .................................................................143
................................................................................................................................................

xi
LIST OF FIGURES
FIGURE PAGE
1. Framework of CTE’s Impact on Meeting
the Demands of Local Labor Markets ...................................................................14
1
CHAPTER I
INTRODUCTION
Statement of the Problem
Since the industrial revolution, the need for a technically skilled workforce
within the United States has increased securing a niche for technical workers in the labor
market that has been sustained even during a wide range of economic cycles. As the
United States strives to maintain its leadership in a struggling global economy, the need
for technically skilled workers is critical as global companies seek new technologies for
product design and development. Technical skills are specialized aptitudes necessary for
acceptable performance within respective industries and current projections demonstrate
a continued need for skilled laborers despite the current condition of the U.S. economy
(Stone, 2009).
Skills required for success in today’s industrial setting include highly technical
skills in multiple fields including electricity, robotics, and computer technology (Owens,
2010). The need for proficiency in multiple skill sets increases required training and
difficulty for employers to find suitable employees (Owens, 2010). Manufacturers in the
United States have long sounded the need for skilled laborers with studies showing
exorbitant costs in recruiting, training, and lost production resulting from difficulty in
finding the right individuals (Owens, 2010). Owens (2010) speculates the existing skilled
labor shortage, coupled with baby boomer retirements, may only increase the shortage
requiring a change in public policy. Owens suggests the United States should look more
to career and technical education career paths to help with shortages.
2
The 2010-2011 Occupational Outlook Handbooks project for the years 2008-
2018, 14 of the 20 fastest growing occupations will require skills which can be acquired
with training other than a four year post-secondary college degree (U.S. Department of
Labor (BLS), 2010). Career and technical education (CTE) offers technical skills
instruction for a broad range of career fields which are required for a highly skilled labor
force capable of competing in today’s decidedly advanced technological industries. CTE
organizes programs under 16 career clusters with curriculums designed to instruct
common knowledge and skill sets appropriate for relative occupations (Association of
Career and Technical Education, 2010). The Association for Career and Technical
Education, (2010) reports CTE is accessible to students beginning in middle school and
continuing through the post-secondary level which provides students an opportunity for
additional training after high school and acquisition of an associate’s degree or
certification in the respective field. The ACTE reports close to 14 million high school
and college students participated in CTE instruction during the 2008 school year.
The current skilled worker labor market requires workers to be skilled in more
than job specific technical skills. CTE purports efficacy in preparing students for the
labor market by instilling not only job specific tasks, but academic and employability
skills needed for success in both today and tomorrow’s economy (ACTE, 2010).
Successful job skills for the current workforce can be categorized as hard and soft skills.
Hard skills, also known as technical skills, are defined as job specific tasks directly
necessary for successful completion of the job. Dr. Dennis Coates (2006), CEO of
Performance Support Systems, Inc., defines hard skills as ―technical…procedures related
to an organization’s core business‖ (¶2). However, soft skills include a broad range of

3
personal skills related to personal communication, work ethic, critical thinking, and
problem solving skills (Coates, 2006). Dr. Coates (2006) characterizes soft skills as the
basic people skills used everyday including ―how people relate to each other:
communicating, listening, engaging in dialogue, giving feedback, cooperating as a team
member, solving problems, contributing in meetings and resolving conflict‖ (¶3).
The ACTE (2011b) states that CTE has a ―long and rich history in the United
States‖ (¶1) and assesses curriculum and programs to ensure relevant instruction in both
―academic subject matter taught with relevance to the real world‖ and ―employability
skills, from job-related skills to workplace ethics‖ (¶1). As evidence to academics taught
in CTE, Dr. Jim Stone (2008), Director of the University of Louisville’s National
Research Center for Career and Technical Education (NRCCTE) reports students
participating in CTE demonstrate greater math skills than students completing traditional
high school curriculums and exhibit greater interest in post-secondary training as
evidence for the ACTE assertions. Dr. Stone relates CTE’s success to an emphasis on
teaching work ready skills.
Despite CTE’s success in technology instruction relevant for today’s business and
industry, it is impossible to predict what will constitute an adequate skill set for success
in the 21st century as technical skills vary according to industry and technical abilities are
continuously evolving. Bob Regan (2008), Director of kindergarten through twelfth
grade education at Adobe Systems Inc. relates the acquisition of technical skills needed
for the 21st century to early educator John Dewey’s premise that training and learning
come through task performance and ingenuity. Dewey’s emphasis on ingenuity is still
relevant today and suggests employees in the 21st century will need problem solving and

4
critical thinking skills to adapt to emerging skills. As confirmation of the importance of a
wide range of employability skills, Rotundo and Sacket (2004) found proficiency in
broad cognitive abilities rather than precise skills limited to specific tasks were directly
tied to higher wages. If CTE is to adequately prepare students for the future and skills yet
to be developed, it is necessary to not only provide instruction for hard skills, but soft
skills which will enable them to adapt and transition to changes in the workplace.
Though beneficial, CTE instruction is costly and the ability to financially
maintain programs is difficult for educational facilities. Financial assistance for CTE
provision has evolved over the years with CTE legislation providing federal funding
sources. The Vocational Education Act of 1964, renamed the Carl D. Perkins Act upon
its reauthorization in 1984 (Carl D. Perkins Act, 1984; O’Hara, 2009), substantially
impacts the ability of CTE programs to fund the provision of technical skills at the local
level. In 2002, all 50 states were receiving Perkins funding at either the secondary or
post-secondary levels with total appropriations of $1.288 billion dollars for the funding
period (U.S. Department of Education, 2003). Most recently, Perkins IV was authorized
in 2006 providing funding for CTE initiatives for an additional five years (U.S.
Department of Education, 2006). Reiterating the need for skilled workers, President
Obama called for level funding of the Carl D. Perkins Career and Technical Education
Act (Perkins Act) in the 2010 fiscal budget (National Association of State Directors of
Career Technical Education Consortium, 2009). To ensure equitable distribution of
federal tax dollars, continued eligibility for receipt of Perkins funding by states is
contingent on local performance standards including post-secondary placement of
5
students in the workforce or post-secondary education and technical skill attainment
(U.S. Department of Education, 2006).
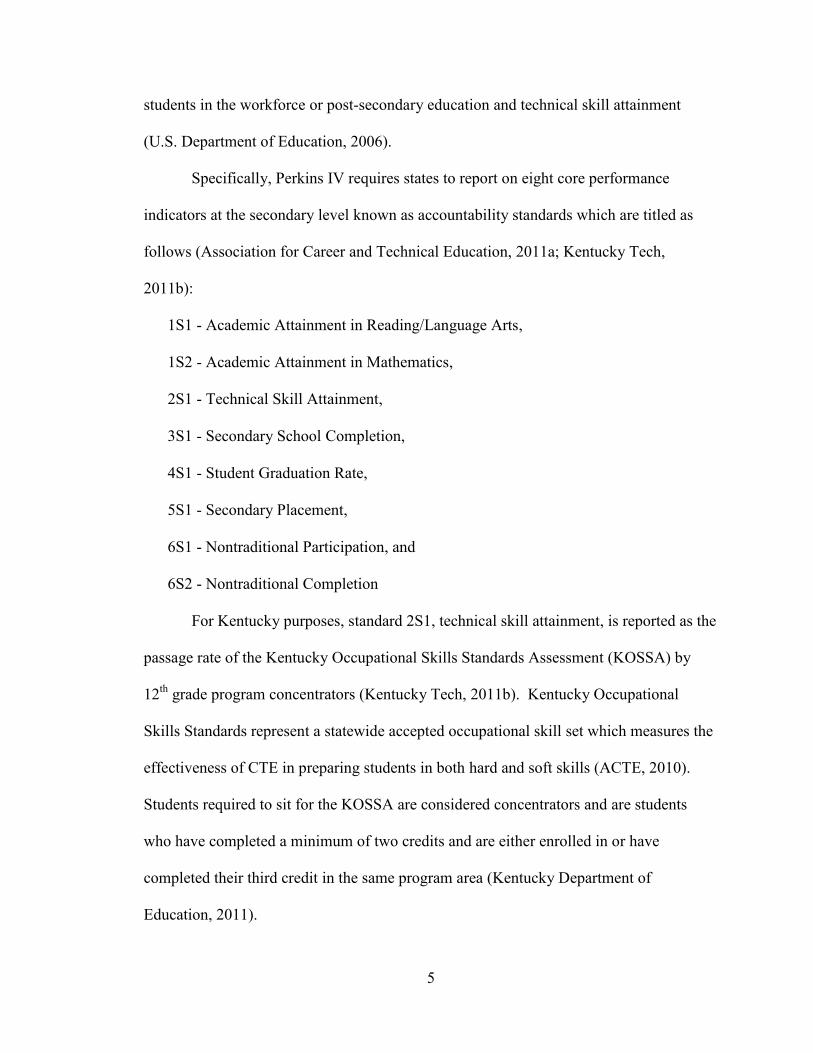
Specifically, Perkins IV requires states to report on eight core performance
indicators at the secondary level known as accountability standards which are titled as
follows (Association for Career and Technical Education, 2011a; Kentucky Tech,
2011b):
1S1 - Academic Attainment in Reading/Language Arts,
1S2 - Academic Attainment in Mathematics,
2S1 - Technical Skill Attainment,
3S1 - Secondary School Completion,
4S1 - Student Graduation Rate,
5S1 - Secondary Placement,
6S1 - Nontraditional Participation, and
6S2 - Nontraditional Completion
For Kentucky purposes, standard 2S1, technical skill attainment, is reported as the
passage rate of the Kentucky Occupational Skills Standards Assessment (KOSSA) by
12th
grade program concentrators (Kentucky Tech, 2011b). Kentucky Occupational
Skills Standards represent a statewide accepted occupational skill set which measures the
effectiveness of CTE in preparing students in both hard and soft skills (ACTE, 2010).
Students required to sit for the KOSSA are considered concentrators and are students
who have completed a minimum of two credits and are either enrolled in or have
completed their third credit in the same program area (Kentucky Department of
Education, 2011).
6
Kentucky students have the opportunity to receive technical and soft skills
instruction through technical programs offered in the high school setting under the
guidance of the Kentucky Department of Education (KDE) and through area technology
centers (ATC’s) operated by Kentucky Tech and administered through Kentucky’s Office
of Career and Technical Education (OCTE). Post-secondary CTE training is available to
students with many training programs offered through Kentucky’s Community and
Technical College System (KCTCS). As part of the OCTE, Kentucky Tech’s 54 ATC’s
offer high school students training in technical and soft skills to meet labor needs in the
local community (Marks, 2009).
In Kentucky, the need for skilled workers with well rounded abilities is just as
important as it is at the national level as the state seeks to improve its economic status
under the harsh economic climate. Kentucky’s Appalachian region includes 54 of its 120
counties (Appalachian Regional Commission, 2010). Of the 13 states with Appalachian
regions, Kentucky ranked last for citizens holding high school diplomas attesting to the
need for increased student achievement and education in the Kentucky Appalachian
Region (ARC, 2010). The importance of educational attainment should not be ignored as
economists have tied education to economic and social growth of local communities for
over 50 years (Shaw, T., De Young, A., & Rademacher, E., 2004). This implies
increased job skills in Appalachia through career and technical education could lead to an
adequately trained and available workforce assisting in recruitment of business and
industry to the region and an ultimate increase in economic growth.
Programs offered in ATC’s are designed to meet the labor needs of local business
and industry for a minimum of 10 years through the provision of technical and soft skills
7
(C. Wells, personal communication, February, 2006). Kentucky Tech’s ATC system
provides training for 25 programs in the areas of agriculture, business and marketing,
communications, construction, health and human services, transportation, public safety,
security, and manufacturing (Kentucky Tech, 2011a). When ATC’s are established, local
and state representatives collaborate and select programs for implementation which are
aligned with current and projected employment needs for the particular areas served by
the ATC’s (C. Wells, personal communication, February, 2006), thus establishing
alignment between employee training and labor supply and employer demands for labor.
Despite alignment of ATC programs with the needs of local business and industry
when the ATC is established, many of Kentucky’s ATC’s have operated with original
programs for well over 30 years. While local labor needs evolve over time due to diverse
economies and fluctuations in supply and demand, it is unclear if existing ATC programs
continue to meet the labor needs of local communities through program offerings relevant
to local industry. When programs are not training students for jobs available within the
local community, the result is program misalignment and a loss of human capital as
students are either forced to leave localities to find employment related to training
received or secure positions in an unrelated field without adequate skills. The
consequences of static and misaligned program offerings are the inability of ATC’s to
meet the needs of local business and industry by either an overabundance of workers in
career fields and/or a shortage of skilled workers in others.
Kentucky CTE curriculum includes skills instruction based on the most recent
technologies available for respective program areas. However, it is unclear if students
participating in Kentucky’s CTE programs in area technology centers receive instruction
8
and training in appropriate soft skills leading to the development of a well rounded
employee capable of adapting to up and coming job skills and meeting employer needs
for the 21st century. The difficulty in determining whether students are adequately
mastering soft skills is twofold. As previously mentioned, it is impossible to completely
predict soft skills necessary for the next century and Kentucky does not isolate
measurement and analysis of soft skills at the time of this research.
Kentucky Tech implements a well established assessment plan for CTE programs.
CTE components assessed in the plan range from students academic and job skill success
to the ability of ATC’s to develop and maintain community relations. However, the
ability to effectively analyze whether programs meet the labor needs of local
communities after initial establishment is not present. As well, the plan does not
effectively measure and analyze skills for the 21st century including the provision of soft
skills. This situation is not unique to Kentucky as there is little evidence of analysis of
CTE and business and industry alignment in the United States.
Robert Carreira studied CTE Tech Prep program alignment to the business and
industry needs of Cochise County, Arizona. Tech Prep designation for CTE programs
requires students to complete two years of CTE at the secondary level and two additional
years at the post-secondary level leading to at least a two year post-secondary degree
(Kentucky Department of Education, 2009). Carreira’s (2009) study investigated two
research issues dealing with how well Tech Prep programs were aligned with current and
future labor needs and how administrators could achieve alignment if misalignment were
found. Carreira (2009) used regression analysis to determine the relationship between
9
Tech Prep programs and current and future labor needs and job quotients as information
for CTE administrators.
Carreira introduced job quotients as a valid measure for program allocative
efficiency. Carreira explained job quotients of one suggest an ―equal number of jobs in
the local economy for each student offered access to the program that prepares students
for those jobs‖ (p. 14). Subsequently, alignment ―ensures workforce shortages are
equitably distributed and career fields and industries within the local economy are
equitably served‖ (p. 14). This study accepts the simplicity and straightforwardness of
job quotients, but does not attempt to explain margins of acceptable efficiency when
calculated job quotients do not purport alignment.
Purpose of Study
The purpose of this study is to add to the body of literature on Kentucky’s
Appalachian CTE programs to determine if programs offered in the Lake Cumberland
Area Development District (LCADD) are aligned with current and future local labor
needs in terms of job availability and 21st century soft skills. The LCADD was selected
for this study due to its locality and accessibility of data for counties included in the
LCADD. The LCADD is one of Kentucky’s 15 Area Development Districts (KADD)
which were organized over thirty-five years ago to assist regional Kentucky communities
in meeting the needs of local business and industry (Kentucky Council of Area
Development Districts, 2009a). Specifically, KADD’s were designed to help ―local
officials and citizens unite to provide for the planned growth of their area‖ (Kentucky
Council of Area Development District, 2009b, ¶1). KADD’s serve local governments
and communities through provision of forums for community members to discuss issues
10
and opportunities and to provide leadership in planning and implementing projects
(KCADD, 2009b).
Under the Kentucky Council of Area Development Districts (2009b) structure, 15
development districts operate under the authority of federal and state statutes assisting
local communities to secure and maintain business and industry and an adequate
workforce. The Lake Cumberland Area Development District (LCADD) includes Adair,
Casey, Clinton, Cumberland, Green, McCreary, Pulaski, Russell, Taylor and Wayne
Counties in Kentucky (KCADD, 2009a). All except Taylor County are part of
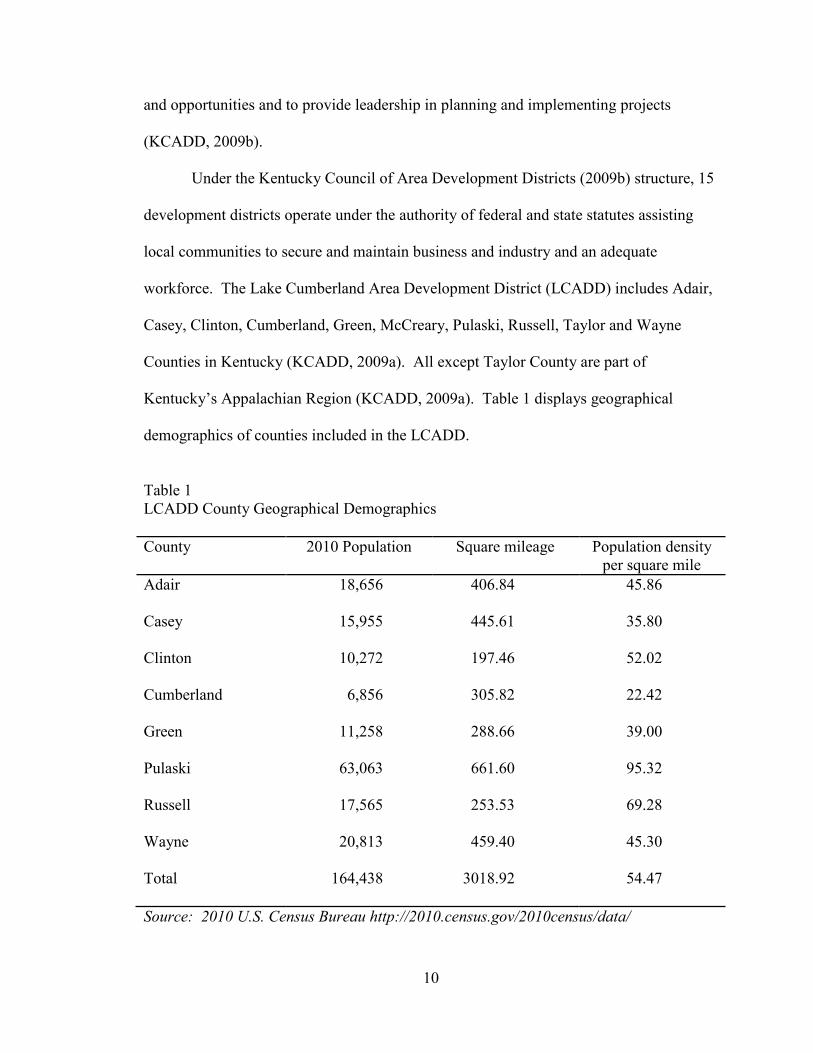
Kentucky’s Appalachian Region (KCADD, 2009a). Table 1 displays geographical
demographics of counties included in the LCADD.
Table 1
LCADD County Geographical Demographics
County 2010 Population Square mileage Population density
per square mile
Adair 18,656 406.84 45.86
Casey 15,955 445.61 35.80
Clinton 10,272 197.46 52.02
Cumberland 6,856 305.82 22.42
Green 11,258 288.66 39.00
Pulaski 63,063 661.60 95.32
Russell 17,565 253.53 69.28
Wayne 20,813 459.40 45.30
Total 164,438 3018.92 54.47
Source: 2010 U.S. Census Bureau http://2010.census.gov/2010census/data/
11
Research on the topic of CTE program alignment and measurement of soft skills
instruction is limited and in the Appalachian region of United States studies regarding
CTE program alignment and instruction are scarce. This study will contribute findings
for Kentucky administrators and decision makers when considering program changes for
area technology centers.
Research Questions
This study addresses the following questions pertaining to career and technical
education programs offered through Kentucky Tech:
1. Are career and technical programs offered by Kentucky Tech’s area
technology centers in central Kentucky aligned with current labor needs in
counties served by the LCADD?
2. Are career and technical programs offered by Kentucky Tech’s area
technology centers in central Kentucky aligned with future labor needs in
counties served by the LCADD?
3. Are CTE preparatory students demonstrating proficiency in 21st century soft
skills required by employers?
Framework
The theoretical framework for this study is based on Gary Becker’s Human
Capital Theory (HCT) which acknowledges the extreme costs for education as an
investment which will lead to higher wages (Becker, 1975). Becker contends that better
education leads to greater wealth of citizens and nations and that all humans are rational
and seek to maximize their individual wealth through appropriate educational attainment
(Vandenberghe, 1999). Becker asserts educational providers are only concerned with

12
pleasing their clients whether the clients are students or industry and will adapt
educational processes to meet those needs (Vandenberghe, 1999). This assertion
increases the relevance of this study as CTE program alignment is necessary to meet the
needs of industry.
Formation of the HCT can be traced to the mid-1700’s to economist Adam Smith
and his Wealth of Nations (Baptiste, 2001). Despite researcher interest in the theory,
modern formation of the HCT was delayed due to the controversy surrounding it
(Baptiste, 2001). To many, it challenged the foundations of human freedom and dignity
by implying humans were nothing more than capital with their education and training
considered an investment in capital (Baptiste, 2001). Opponents of HCT argued that
humans were not to be valued and marketed for their skills, but rather recipients of wealth
(Baptiste, 2001).
In the 1960’s, Gary Becker studied the economics of education and was followed
by significant research solidifying HCT as a widely accepted philosophy (Gilead, 2009).
The philosophy recognizes humans as capital and training expenses or education of
laborers as a human capital investment resulting in education as a generator of human
capital (Becker, 1975; Vandenberghe, 1999). Limitations to the HCT are evident in that
opponents argue that individuals are not always logical and do not always seek to
maximize wealth (Gilead, 2009; Baptiste, 2001). In fact, many individuals are
constrained by their socio-economic placements and are tied to alternative paths that do
not always lead to wealth and prosperity (Baptiste, 2001). Too, not all seek wealth as a
source of happiness and are content in their lifestyles based on values and upbringings.
Likewise, educational providers may not always respond to the needs of students and
13
industry as confounding variables such as political demands may dictate educational
processes (Vandenberghe, 1999).
If the HCT were followed precisely, CTE programs would continually adjust to
market needs as the HCT emphasizes educators’ desire to meet the needs of clients.
Under the HCT, students would only select training for occupations for which there is
adequate demand leading to maximization of personal wealth (Gilead, 2009). However,
this study acknowledges individuals do not always act logically in selecting occupations
and education does not always immediately adjust to market demands. As a result, HCT
is not directly applied to this study. Rather, this study modifies the theory using the
premise that CTE instruction will meet labor needs of respective industries, accordingly
leading to increased salaries.
Figure 1 illustrates how the theory is applied to this study. Factors influencing
career and technical education programs include business and industry needs dictated by
technical skills required by industry standards, student interests, and education policy
required to fund technical programs. It is assumed that students entering the workforce
with appropriate training and educational foundations will benefit employers’ labor needs
by replenishing skilled workers. It is assumed a percentage of high school completers
will continue CTE training at the post-secondary level with subsequent placement in the
appropriate career field. Moreover, this study assumes a percentage of high school
students completing career and technical education programs will transition directly to
the workforce for which CTE instruction was received thus reiterating the importance of
proper alignment between programs and local labor needs. It is also understood a portion
of high school students completing career and technical education programs will further
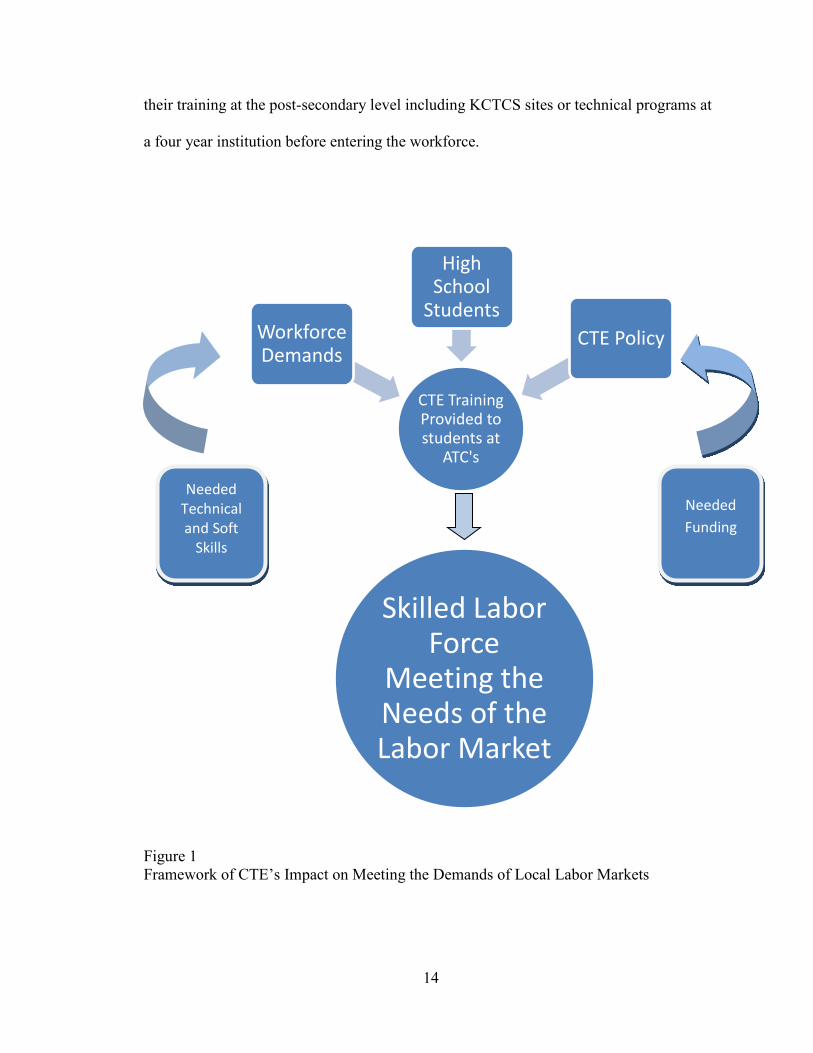
14
their training at the post-secondary level including KCTCS sites or technical programs at
a four year institution before entering the workforce.
Figure 1
Framework of CTE’s Impact on Meeting the Demands of Local Labor Markets
CTE Training Provided to students at
ATC's
Workforce Demands
High School
Students
CTE Policy
Skilled Labor Force
Meeting the Needs of the Labor Market
Needed Technical and Soft
Skills
Needed
Funding
15
Assumptions, Limitations, and Delimitations of the Study
Robert Carreira studied alignment between tech prep programs and the current
and future labor needs in Arizona. This study, replicates Carreira’s 2009 study in part of
Kentucky’s Appalachian region. As a result, this study encompasses many of the same
assumptions, limitations, and delimitations. Following Carreira’s study, assumptions,
limitations, and delimitations will be presented mutually.
First, the focus of this study is on CTE offerings for secondary students within
ATC’s and does not include analysis of technical programs outside of Kentucky Tech’s
ATC’s or at the post-secondary level. It is assumed that post-secondary program
offerings are directly tied to enrollment and are maintained by their ability to sustain
adequate enrollment.
This study assumes equal effectiveness of CTE instruction in all programs,
facilities, and instructional pedagogies across the Lake Cumberland Area Development
District (LCADD). It does not analyze the age or condition of facilities and equipment
and subsequent impacts on instruction. Rather, it is assumed that CTE technical
instruction offered through ATC’s meets the skilled technical training needed by business
and industry and is sufficient for training of secondary students to enter the workforce
with appropriate job specific hard skills.
The study assumes students completing four course credits in a given program
area will complete the program with an acceptable level of skills necessary for successful
employment in the respective occupational field. The study assumes students not
completing programs during their high school tenure may not hold the necessary and
adequate skill set necessary for success in the respective occupational field.
16
Again following Carreira’s study, this study utilizes enrollment capacities of
ATC’s programs as a primary measure of trained students and assumes enrollment equals
capacity. It is understood that actual student enrollment may be the result of student
preferences based on uncontrollable variables such as teacher preferences. While
analysis of program enrollment is outside the scope of this study, it is implicit that
analysis of enrollment capacities is vital to administrative decisions regarding alignment
of programs with labor needs.
It is assumed ATC program alignment with local industry labor needs is
imperative to fulfilling labor needs within the community and subsequent community
sustainment. This assumption is based on the Carl D. Perkins ACT indicating that
funding is conditional on the ability of CTE to promote the competitiveness of the United
States by providing a highly skilled workforce. Likewise, Perkins IV mandates CTE
provide students with ―placement…in employment, including placement in high skill‖
occupations (Carl D. Perkins Career and Technical Education Improvement Act of 2006,
250-15) as well as ―employer involvement in, and satisfaction with, career and technical
education programs and career and technical education students’ preparation for
employment‖ (Carl D. Perkins Career and Technical Education Improvement Act of
2006, 250-22).
A primary constraint of this study is the limited overall business and industry and
subsequent workforce populations within the rural Appalachian research area. To
overcome this limitation, the scope of this study analyzes ATC’s ability to meet current
and future labor needs of existing business and industry without investigation of the
LCADD potential attainment of new labor markets. The population for this study is
17
derived from the LCADD which encompasses 10 counties located in Kentucky’s
Appalachian region and, historically, is most predisposed to economic struggles. This
limitation is exacerbated by the current economic downturn which is even more relevant
in Appalachia. In an effort to minimize economic impacts, counties included in the
study are located on the farthest west side of Kentucky’s Appalachian region and may
not reflect the same economic setbacks as Appalachian counties located in extreme
Eastern Kentucky dependent on coal for their economies and lacking more advanced
infrastructures. Understanding the difficulty associated with macro-economic
assumptions, this study relies on the Workforce Kentucky database for labor market data
(Kentucky Office of Employment and Training (KOET), 2011). The database contains
the largest and most notable information regarding Kentucky’s labor market (KOET,
2011). The database is administered by Kentucky’s Office of Employment and Training
and is directly linked to federal databases for data collection reliability (KOET, 2011).
This study’s delimitations include only evaluation of labor needs of business and
industry in regard to available skilled workers and current and projected available
employment slots. The study does not evaluate specific soft skills required by each
industry within the region nor does the study evaluate individual hiring practices of
business and industry. It is assumed that students initially entering the workforce will
require training specific for the respective employer regardless of their job skill abilities.
Definitions
Career Clusters: Occupations grouped under industry classifications and similar
technical skills (KDE, 2011).
18
Concentrator/Preparatory Students: Students who have completed at least two
credits in a respective program and are enrolled in or have completed their third credit
(KDE, 2011).
Hard Skills: Technical skills specific to respective industries (Carreira, 2009).
Job Quotient: The employment capacity for jobs which CTE programs prepare
students in relation to the enrollment capacity for the respective CTE program (Carreira,
2009).
Kentucky Occupational Skills Standards (KOSS): Business and industry
standards adopted as a benchmark of necessary skills for successful employment
including both hard and soft skills (KDE, 2011).
Kentucky Occupational Skills Standards Assessment (KOSSA): Assessment given
to 12th
grade concentrator students to measure attainment of technical and soft skills
(KDE, 2011).
Non-Completers: Students participating in at least one course in a program area,
but failing to complete four credits.
Program Alignment: Programs offered at area technology centers are aligned
with business and industry labor needs when job quotients are one (Carreira, 2009).
Program Completers: Students completing at least four course credits in a given
CTE program area with a minimum grade of ―C‖ and considered adequately trained to
enter the respective program’s labor market (KDE, 2011).
Technical Preparation (Tech Prep): Federal program requiring student
completion of two years of CTE at the secondary level followed by two years of post-
19
secondary training leading to a certificate or diploma (Carreira, 2009, Kentucky
Department of Education, 2009).
Soft Skills: Interpersonal skills including but not limited to communication and
teamwork that enhance job performance (Coates, 2006).
TEDS: Technical Education Database System maintained by the state of
Kentucky for the collection and reporting of data associated with federal Carl D. Perkins
funds (KDE, 2011).
Summary
As the United States finds itself struggling to emerge from an extreme recession
and remain competitive in a global arena, a primary task facing the U.S. is the ability to
produce not only workers skilled in latest industrial technologies, but workers skilled for
jobs that will be available upon the economy’s ultimate upswing. As educators, it is our
responsibility to ensure students are equipped with skills that enable them to be
productive members of society upon graduation and into the 21st century. CTE is a vital
component of the educational process as its ability to effectively train students for
transition to the workforce as well as transition to post-secondary training makes it a
particularly valuable educational venue at the secondary level.
Though CTE programs are designed to meet the training needs of local business
and industry upon their initial establishment, it is unclear if program alignment remains
intact through economic changes. Currently, there is not a measure in place that provides
full disclosure of this information. This fact is relevant across the country, but even more
so in Appalachian regions that struggle even during favorable economic times.
20
Despite the fact CTE programs prepare students for both hard and soft skills
needed in today’s industrial setting, it is impossible to predict skills needed for the 21st
century. As a result, it is critical for students to possess adequate soft skills that will
enable them to adapt to changing workplace demands in the future. Assessment of CTE
programs does not include analysis of a relationship between CTE curriculum and soft
skills needed for success in future labor markets.
It is hoped this study will begin wide range evaluation across the country
regarding alignment between CTE programs and the needs of business and industry as
well as provision of 21st century soft skills within CTE curriculum. Likewise, it is hoped
this study will provide information useful to policy makers and administrators when
making decisions regarding appropriate CTE instruction.
21
CHAPTER II
REVIEW OF LITERATURE
Introduction
This review of literature provides a historical view and current appraisal of career
and technical education revealing a need for future study. Abundant literature exists for
career and technical education; although literature regarding the scope of this study is
limited. For this review of literature, an in-depth exploration included related terms such
as vocational education, CTE, CTE program alignment, and labor needs. Literature for
this review was obtained electronically through databases accessed through Eastern
Kentucky University’s Educational Leadership and Policy Studies guide within EKU’s
Crabbe Library. Online resources were accessed through Academic Search Premier,
Education Abstracts, ProQuest Dissertation & Thesis Abstracts, Sage Journals online,
and ERIC.
The search revealed a single study regarding CTE program alignment performed
by Robert Carreira in Cochise County, Arizona in 2008. It is evident the topic of CTE
program alignment is greatly understudied. Due to the lack of literature regarding
program alignment, this review of literature categorically scrutinizes the development
and funding of career and technical education (CTE), changing workforce demands,
initiatives and governance, and benefits of CTE instruction to synthesize the current
situation of CTE program alignment and implications for adjustments.
22
CTE Policy Development
Modern CTE offers skills training in preparation of post-secondary employment
to secondary students and has expanded to include technologically advanced skills
training in trade and industry, information technology, and health occupations (Scott &
Sarkees-Wircenski, 2008). Additionally, CTE has transformed into a rigorous
educational program also providing career and post-secondary exploration opportunities
to a broad spectrum of students (Scott & Sarkees-Wircenski, 2008). As a result, the
benefits of CTE prompted Elliot & Deimler (2007) to declare CTE a ―premier
educational delivery system‖ (p. 45).
The current economic situation has increased competition for jobs resulting in
increased enrollment in CTE programs (Career Classes Make a Comeback, 2007).
Specifically, Texas CTE enrollment expanded 170 percent between 1996 and 2006,
marking the increased importance of CTE programs as a component of secondary
education (2007, Career Classes Make a Comeback). It is important not to overlook
CTE’s educational relevance as it offers an educational package that enables students to
become contributing members of society (Scott & Sarkees-Wircenski, 2008).
Smith-Hughes Act
Vocational education policy was first recognized and funded at the federal level
through the Smith-Hughes Act of 1917 also known as the Vocational Act of 1917. The
legislation created the Federal Board for Vocational Education whose membership
included representatives from manufacturing, agriculture, and labor (Smith-Hughes Act,
1917; Dugger, 1965). The Act also provided assistance to states for teacher salaries in

23
agriculture, home economics, and trade and industrial education (Smith-Hughes Act,
1917).
The 1917 Act emphasized meeting the needs of employers and preparing a much
needed workforce (MartiNez, 2001). During the early 1900’s the United States was
already recognized as the industrialized leader of nations and could not fill its need for
skilled laborers in agriculture and industry following World War I despite increased
employment of skilled immigrants (Smith-Hughes Act, 1917; Dugger, 1965;Scott &
Sarkees-Wircenski, 2008). At the same time, formal education provided students an
academic curriculum excluding trade and industrial skills which had long been handed
down through families (Scott & Sarkees-Wircenski, 2008). The Smith-Hughes Act
brought awareness for the integration of skills and academic training in the educational
setting
Political influences. Politically, passage of the Smith-Hughes Act was
influenced by a growing population and the importance of the United States to maintain
its economic position. President Woodrow Wilson created the Commission on National
Aid to Vocational Education in 1914 which, after analysis of 1910 census information,
reported a need for additional vocational education and training (Patterson, n.d.; Kleiver,
1965). The Commission related a significant number of people in vocational careers
lacked appropriate training for their positions (Smith, 1999; Patterson, n.d.). Senator
Hoke Smith, chairman of Wilson’s commission, co-sponsored the Smith-Hughes Act of
1917 following the commission’s report (Smith, 1999; Patterson, n.d.).
Influence of leading educators. Leading up to the Smith-Hughes Act, John
Dewey and Charles Prosser advocated an educational system that would offer realistic

24
training to benefit both individuals and society (Scott & Sarkees-Wircenski, 2008).
Dewey, a strong advocate for vocational education, stressed education should enable
students to be successful in both skills and attitudes during a technological age (Scott &
Sarkees-Wircenski, 2008). Theoretically, Dewey adhered to a progressive approach
believing education should meet the need of the learner in order to bring about success
(Scott & Sarkees-Wircenski, 2008).
In contrast to Dewey, vocational activist Charles Prosser argued an essentialist
approach that vocational education should meet the needs of business and industry (Scott
& Sarkees-Wircenski, 2008). Prosser’s philosophy embraced 16 ideals which were
embedded into the Smith-Hughes Act and guided vocational education for over 50 years
(Scott & Sarkees-Wircenski, 2008). Most prominently, Prosser suggested vocational
education should include real-world activities taking place in real-world settings, include
current workplace technologies, instill critical thinking skills, and perhaps most
progressively, should be taught by individuals trained in the particular field rather than in
general education (Scott & Sarkees-Wircenski, 2008, p. 196).
1964 Vocational Education Act
Following the Smith-Hughes Act, vocational policy remained somewhat static
until the Vocational Education Act of 1964 which secured funding for training to high
school students and adults who were either out of work or needing additional training to
hold their current position (Dugger, 1965). A main purpose of the 1964 Act was to
circumvent increasing demands of labor resulting from a growing population and the
advent of technology (Dugger, 1965). The Act focused on assisting schools in providing
a ―balanced education for those millions of youth who will enter the world of work
25
without a baccalaureate degree‖ (Dugger, 1965, p. 15). In doing so, the Act changed how
funds were distributed to schools in order to prevent training for unneeded skills and to
ensure job placement and post-secondary opportunities for students (Warfield, 1969).
The Act required schools to offer a minimum of five occupational programs for funding
eligibility along with development of work-study opportunities for students in need
(Dugger, 1965). In an attempt at accountability, receipt of federal funding required states
to establish a fiscal agent for fund oversight and administration (Dugger, 1965)
Political influences. During the 1950’s and 60’s, ongoing debate was underway
as to what and how much the federal government’s involvement in overall education
should be (Debray, 2006). The Department of Education had been established in 1867 to
merely provide local educational representatives with sound advice for implementing
effective education (U.S. Department of Education, 2010) not inclusive of funds. John E.
Chubb, a distinguished visiting fellow at Stanford’s Hoover Institution, highlighted
federal funding was less than one percent of total school funding during the 1920’s and
was only 1.8 percent of the next decade’s entire budget (Moe, 2007).
Echoing the national awareness for education reform, President Lyndon Johnson
proclaimed in 1965 that it was more important to approve funding at the elementary and
secondary levels in some form than to worry about whether or not it was sound policy
(Debray, 2006). Even though the proclamation came after passage of the 1964 Act,
President Johnson’s statement provides insight to the pressure politicians were under to
pass a measure of relief. Passage of the Vocational Education Act of 1964 achieved
awareness for vocational skills training and planted a seed for vocational education that
would expand during the 1980’s. However, it did not satisfy advocates for education

26
reform. It was merely a starting point offering federal funding assistance to secondary
programs that incorporated a vocational program into its academic curriculum
(Vocational Education Act, 1964), thus placing the primary focus on the traditional
school curriculum with vocational training merely a beneficiary of the funds.
Carl D. Perkins. Carl D. Perkins, representative from Knott County, Kentucky,
introduced the eventual 1964 Vocational Education Act in response to the overall
education crisis (Kliever, 1965). The Vocational Education Act of 1964 was passed to
―strengthen and improve the quality of vocational education and to expand the vocational
education opportunities in the nation‖ (Vocational Education Act, 1964, p. 1). To
achieve this goal, funds were offered to states in the form of grants to improve vocational
programs for both students and adults (Vocational Education Act, 1964; Dugger, 1965).
This initiative stemmed from investigation of future labor markets anticipating an
overabundance of undereducated workers (Dugger, 1965).
Congressman Perkins’ interest in vocational education stemmed from an
upbringing in an impoverished Appalachian setting and subsequent military service,
where he witnessed plight of the underprivileged and uneducated (Damron, 1990; Smith,
2010). His experiences molded him into a staunch politician who pursued every initiative
through to the end and earned him the respect of politicians from both sides of the
political spectrum (Smith, 2010). His dedication earned not only respect from his peers,
but his constituents who prided themselves in electing an honest congressman (Smith,
2010).
Contributing factors to passage. Throughout history, the nation has struggled to
maintain a skilled workforce and has turned to vocational education to meet the need

27
(Dugger, 1965). Shortages in skilled labor are most evident in war times, but decades
following WWII demonstrated a need for a skilled workforce even during peace times
(Dugger, 1965). After WWII, the country was dealing with multiple issues not limited to
civil rights, the Cuban Missile Crisis, the Soviet Union’s launch of Sputnik, and the
realization of poverty in the U.S (Dugger, 1965; Debray, 2006). The changing global
economic environment reinforced the need for the U.S. to develop a labor force trained in
work related skills and technology. These factors enabled CTE to emerge as an effective
solution for the provision of better equipped laborers to meet the diverse needs of
employers (Drage, 2009; Dugger, 1965).
CTE was not only designed to provide skill labor at a national level, but
specifically for communities where CTE programs reside (Arnold, 1965). In defining a
complete technical education program, Arnold, 1965, reiterated the need for programs to
be aligned with community labor needs first while taking into account labor trends at the
state and national levels.
1984 Carl D. Perkins Act
The 1980’s began with the country suffering a deep recession (Conte, C. & Karr,
A. & United States. Dept. of State. Bureau of International Information Programs, 2001),
but by 1983, the economy was rebounding bringing about economic growth that would
be sustained throughout the rest of the decade (Conte, et al., 2001). Culturally, the
1980’s were impacted by the advent of personal computers in the home (Cogan, 2005),
beginning a technological age still thriving today, the fall of communism, and an
increased interest for conservative politics (CBS News, n.d.). With the age of
technology, the 1980’s witnessed a shift toward a service economy resulting in greater

28
opportunities for highly skilled computer technicians and unemployment for many
industrial workers (Babcock, L., Benedict, M., & Engberg, J., 1998). There was also a
correlation between education of workers and wages indicating the need for training in
required job-related skills (Babcock, et al., 1998).
A nation at risk. In 1981, Secretary of Education Honorable T.H. Bell formed
the National Commission on Excellence in Education to analyze the state of America’s
education (U. S. Department of Education, 1983). The commission’s 1983 report titled A
Nation At Risk, compiled 18 months of study providing insight to the condition of
educational affairs as well as reformation opportunities (U. S. Department of Education,
1983). A Nation At Risk portrayed education in other countries exceeding the United
States despite reform and awareness following Sputnik (U. S. Department of Education,
1983).
During this time, the U.S. suffered from a lackadaisical attitude regarding work
and generated a work force whose training and skills were substantially behind global
competitors who embraced increased training in a technological age (U. S. Department of
Education, 1983). The 1983 report suggested the growing use of technological skills in
the workplace would require education reform for not only current students, but remedial
training of current workers (U. S. Department of Education, 1983) implying a growing
demand for highly skilled workers.
Political influences. In response to the changing times, Congressman Perkins
again introduced legislation in October of 1983 designed to strengthen and expand the
economic base of the Nation, develop human resources, reduce structural unemployment,
increase productivity, and strengthen the Nation’s defense capabilities by assisting the

29
States to expand, improve, and update high-quality programs of vocational-technical
education (Carl D. Perkins Vocational Education Act, 1984, Official Title).
Following Congressman Perkins’ death on August 3, 1984, the bill was expeditiously
signed as Public Law 98-52 or the Carl D. Perkins Vocational Education Act, commonly
referred to as Perkins I, by President Ronald Reagan on October 19, 1984 (Carl D.
Perkins Vocational Education Act, 1984). As tribute to Congressman Perkins’ support of
career and technical education and disadvantaged workers, the 1984 Act included an
amendment changing the name of the 1963 Vocational Education Act to the Carl D.
Perkins Vocational Education Act (Carl D. Perkins Vocational Education Act, 1984).
The 1984 Act expanded vocational education to address issues identified in A
Nation At Risk. Language of the Perkins Act clearly outlined the need for vocational
education reform including the need for program improvement (Muraskin, 1989).
Formation of an adequate assessment program for policy evaluation purposes coincided
with Williamson M. Evers supposition that education reform had been carried out
through additional funding without reliable data to guide funding (Moe, 2001).
Development of the Carl D. Perkins Act of 1984 reflected portions of a network
approach to policy making in that there were a ―large number of actors dealing with
specific policy issues‖ and the actors did not have full control by themselves, but were
―characterized by interactions of public and private actors‖ (Sabatier, 2007. P. 129).
Silke Adam and Hanspeter Kriesi explain that a policy network approach theory involves
mutually independent diverse performers (Sabatier, 2007). When applied to the 1984
Perkins Act, participants included members of the National Commission on Excellence in
Education who drafted A Nation At Risk, as well as the U.S. Department of Education
30
which authorized the commission to report on the status of education in the United States
(U.S. Department of Education, 1983). Likewise, Perkins’ untimely death during the
final stages of the Act, along with A Nation At Risk, may have served as triggering events
worthy to not only influence passage, but change the name of the 1964 Act.
Current Funding
Despite stalemates, the Carl D. Perkins Act continues to serve as the leading
federal funding source of CTE. In 2002, all 50 states were receiving Perkins funding at
either the secondary or post-secondary levels with total appropriations of $1.288 billion
dollars for the funding period (U.S. Department of Education, 2003). The Carl D.
Perkins Act was re-authorized in 1990 (Perkins II) and increased funding to 1.6 billion
through the year 1995 (Library of Congress, 1995-1996). In 1995, the 104th
congress
introduced 14 bills pertaining to the Carl D. Perkins Act including proposals to both
amend and abolish the legislation (Library of Congress, 1995-1996). However, inability
to agree upon amendments resulted in a continuation of Perkins II language and funding.
In October, 1998, President Bill Clinton signed Perkins III legislation which provided
vocational funding through 2003, modified state funding formulas, and increased state
accountability measures (Library of Congress, 1997-1998; O’Hara, 2009). Similar to
1995, the 108th
congress in 2004 was unable to pass further Perkins legislation which
continued funding under Perkins III (Library of Congress, 2003-2004). It was not until
2006 that Perkins IV was authorized to provide funding for a six year period ending 2012
and included an emphasis for curriculum alignment between CTE and academia (Library
of Congress, 2005-2006; U.S. Department of Education, n.d.).

31
Inadequacies. Despite CTE being recognized as a model system for skills
training, funding issues in providing the training format have long been noted. In the
early 1900’s, Charles Prosser recognized the ideal format for CTE would result in greater
expenses than that found in traditional education (Scott & Sarkees-Wircenski, 2008).
The Perkins Act serves to assist schools in funding only those activities which improve
and expand programs rather than providing funding for daily consumables integral to
program operations (ACTE, 2010). With the current state of the economy, educational
institutions are surveying their priorities in order to glean the most effective use of
funding. Unfortunately, literature is scarce regarding funding of daily CTE program
supplies and emphasizes Perkins funding for CTE despite its inability to provide
operational funding.
There were problems in distributing Perkins grants equitably. For example, the
National Assessment of Vocational Education (NAVE) called for accountability after
evaluating services provided under the Perkins act (Muraskin, 1989). Even though A
Nation At Risk moved CTE to increased accountability, NAVE report findings of 1989
indicated inadequacies were still evident as fiscal agents in the states were retaining funds
(Muraskin, 1989). Likewise, Muraskin (1989) points out funds were often distributed to
groups based on ties to the fiscal agent. For example, post-secondary institutions often
received greater allocations when the fiscal agent was itself a post-secondary institution.
Too, NAVE findings demonstrated the need for a more concise state formula for grant
distribution to meet the needs of CTE programs (Muraskin, 1989).

32
21st Century Workforce Demands
Globally, the current recession has resulted in massive layoffs and a stymied
industry base with the U.S. unemployment rate reaching over 10 percent during October
2009 and still holding a strong 9.00 percent in January 2011 (BLS, 2011). Challenger
(2009) predicts continued advancement of skills and technologies despite the current
recessive economy and predicts employers will struggle to find adequately trained
employees when the economy strengthens. Employers expect employees to possess skills
necessary for job completion (Coll & Zegwaard, 2006) and often find proficient
employees are scarce following a recession as workers have found employment in other
fields or lack newly required skills.
To determine frameworks for today’s curriculum, it is important to analyze future
labor markets for anticipated future skills (Barton, 2008). Barton (2008) suggests the
inability to accurately predict needed skills may lead to the U.S. falling behind in the
global economy. However, analysis and prediction of the future in a technological age is
difficult at best and researchers agree the answer to what constitutes needed skills for
future employment often depends on who is answering (Cech, 2007).
The impossibility of forecasting future business needs has prompted industrial and
educational stakeholders to postulate skill sets most likely to be required in the 21st
century (Black, 2009). In order to ensure employees are prepared for future occupational
demands, it is common that needed skill sets include proficiency in thinking and
reasoning skills as a means to master developing technical skills (Silva, 2009). As
affirmation, Bennett (2006), offers workers possessing thinking and reasoning skills are
more likely to adapt to workforce changes. Likewise, literature reveals those most likely
33
to be unemployed in the future are workers with the least relevant skills (Low, 2004).
Low (2004) suggests it is imperative for workers to receive continued training to ensure
possession of adequate skills for the future. Chris Humphries, head of the skills task
force and director-general of the City and Guilds, declares the anticipated skills gap for
the future can be overcome through effective CTE (as cited in Low, 2004).
Hard skills. Hard skills refer to training needed for given vocations and are most
often attained by students through CTE (Careira, 2009; Taylor, 2005; Bennett, 2006).
Morey (2009) defines hard skills as ―skills associated with jobs in the construction,
manufacturing, and repair industries. Also, those skills primarily associated with
manipulating things‖ (p.14). Because of their nature, they are easily identified and
measured on the job (Coats, 2006). Coats (2006) also asserts hard skills are relatively
easy to teach and assess because they are observable and are most often new skills that do
not require a student to unlearn prior methods.
Soft skills. In ever changing global economies, jobs not only require special
technical skills, but interpersonal workplace skills (Bennett, 2006). Literature recounts
the imperativeness of today’s worker having the ability to solve problems and change
with the everyday demands of the position which involves more than basic reading,
writing, and arithmetic (Bennett, 2006) (Harris & Rogers, 2008). Cassel & Kolstad
(1998) report employers need employees who are able to work with fellow employees
and indicate job promotions are largely dependent upon human relations. In a report to
industrial engineers, Zinn and Haddad (2007) suggest that mastery of technical skills is
only part of career success. In fact, they imply technical skills cannot be fully recognized
34
without effective communication and problem solving skills which lie in the soft skills
realm.
Workplace thinking and reasoning skills have become known as soft skills
(Coates, 2006). Effective soft skills enable workers to be more effective in their jobs and
open the door for leadership opportunities (Ranade, S., Tamara, C., Castiblanco, E., &
Serna, A., 2010; Harris & Rogers, 2008). Despite recognition of soft skills as an integral
component of 21st century skills, employers agree employees lack needed skills
(Mitchell, G., Skinner, L., & White, B., 2010).
Soft skills required by employers can be defined as people skills which include
effective listening and communication skills (Ranade, et. al, 2010). Research also
demonstrates a need for employees to possess a positive attitude and ―work smarter‖ to
creatively and efficiently meet job expectations (Bennett, 2006) which falls under the soft
skills umbrella. CTE offers a career path inclusive of needed ―soft‖ skills and Bennett
(2006) asserts that through CTE, students have access to a curriculum which guides
instruction on the essential elements required for success in today’s work environment.
Coates (2006) describes soft skills as the skills individuals use on a daily basis in
relating to each other whether at home or on the job. Black (2009) explains the way
people live their daily lives has changed dramatically as a result of the technological age.
Black makes clear that technological advances have simplified lives by enabling
communication regardless of geographical location. Accordingly, this has heightened the
importance of making communication a required soft skill. Reiterating the importance of
communication, the 21st Century Workforce Commission (2000) asserts the economic
health of United States in the 21st century is tied to an overall increase in literacy. As the

35
importance of literacy skills increases, multiple literacy organizations are working with
business and industry representatives to develop curriculums relating literacy to 21st
century skills (Black, 2009).
Kentucky occupational skills standards. In 1996, Kentucky Governor Paul
Patton called for the development of broad based business and industry standards to be
developed through a joint partnership composed of business and industry representatives,
Workforce and Economic Development Cabinets, and the Kentucky Department of
education (Castellano, M., Stringfield, S.. & Stone, J., 2005). The resulting standards are
known as Kentucky Occupational Skills Standards (KOSS) and measure student ability
for transition to post-secondary or employment (Castellano, et al., 2005). KOSS assesses
student achievement in the areas of academics, employability, and occupational skills
thus providing a measure of soft skills necessary for the 21st century.
Kentucky seniors who have completed two credits within a CTE program area
and are either enrolled in or have completed their third credit are required to take the
Kentucky Occupational Skills Standards Assessment (KOSSA) (KDE, 2011). Students
completing the number of credits required to sit for KOSSA are known as concentrators
or preparatory students (KDE, 2011).
Kentucky Occupational Skills Standards include both technical and employability
skills and are available for 21 CTE career clusters (KDE, 2011). These standards are
categorized into multiple sets including, but not limited to verbal and written
communication, teamwork, and workplace skills along with categories that are technical
skill specific for each career cluster (KDE, 2011). Each category of skill sets include
subcategories which are numbered and may be included in multiple career cluster
36
standards (KDE, 2011). As an example, the category of workplace skills is labeled skill
set EF and includes a numbered subset of 20 skills (KDE, 2011). Kentucky Occupational
Skills Standard EF 001 is the workplace skill ―Demonstrate punctual, regular attendance‖
and is included in multiple career clusters as a measure of employability skills (KDE,
2011). The KOSS skills represent broad based required requirements for the 21st century
with increased relevance from the inclusion of business and industry representatives in
their development.
According to the Association of Career and Technical Education, Kentucky
considered the overall cost of establishing standards electing to create documents within
state professionals rather than contracting with outside vendors (ACTE, 2011c). The
process was lengthy, but was less expensive and more relevant to the state than
purchasing existing products (ACTE, 2011c). The ACTE (2011c) reports Kentucky is
continuing to increase relevance of KOSSA by aligning the exam to current Perkins
accountability and increasing the number of students tested.
Labor shortages. Throughout the industrial age, the United States has
encountered labor shortages including appropriately skilled workers. It is difficult for
employers to appreciate the impacts of worker shortages during economic downturns
(Challenger, 2003). However, Challenger (2003) discusses the relevance of educational
and demographic changes in promoting labor shortages during economic downturns.
Challenger surmises during turbulent economic times, employers seek new methods to
increase business. This in turn increases the possibilities of labor shortages as business
and industry are forced to train workers within their own respective training centers for
newly designed skills. As a result, Westray (2008) explains labor shortfalls impact not
37
only today’s economy, but the ability of the United States to remain competitive in a
global market in the future.
Employment opportunities. The U.S. Census Bureau predicts an approximated
26 percent increase in the population ages 65 and over by the year 2015 (Challenger,
2003). Challenger (2003) also notes a projected decrease in populous age of 40-54 which
will lead to a reduction in the labor force in the near future. However, Challenger also
notes the reduced availability of workers will increase the availability of jobs and need
for training. Challenger surmises the future will demonstrate business and industries
enacting their own training programs to fill labor needs.
The Department of Labor’s Occupational Outlook Handbook (BLS, 2010)
predicts a 10.7 percent increase in the civilian population 16 years of age and older
resulting in an increased workforce of 8.2 percent by 2018. The Department of Labor
projects a 10 percent employment increase which should assist in offsetting the projected
increase in population (BLS, 2010). Although employment in industries producing
consumer goods has declined over the past twenty years, the Department of Labor (BLS,
2010) projects employment to remain fairly constant in the overall industry with
fluctuations in occupations. The 2010-2011 Occupational Outlook Handbook suggests
by 2018 the demand for construction workers will increase by 13 percent while
installation, maintenance, and repair jobs will increase by 8 percent. The 2010-2011
Occupational Outlook Handbook also implies computer occupations may increase at a
rate that is almost double all other occupations. In Kentucky, the employment force is
projected to grow by 7.5 percent by the year 2018 varied by occupation and in state
region (BLS, 2010).
38
CTE Initiatives and Governance
National Perspective
Nationally, emphasis on accountability has been adopted by CTE and Wilcox
(2007) recommends CTE programs implement more specific accountability measures in
order to secure grants for continued sustenance. During the 70’s and 80’s, the American
labor sect witnessed unrest as it became less likely young workers would obtain
employment in the same manufacturing venue that had sustained their parents income
(Castelanno et al., 2003). As a result, federal legislation forced CTE to reassess the needs
of employers and CTE (Castelanno et al., 2003).
Upon the 1989 review of Perkins implementation, NAVE recommended 19
changes to increase accountability measures in the Perkins Act based on funding
discrepancies identified across the country (Muraskin, 1989). As part of re-authorization,
states were required to report progress toward benchmarks set forth by the 1989 NAVE
report. Failure to meet standards could result in termination of the respective state’s
receipt of Perkins funding. This process assisted in ensuring Congress had adequate
information regarding the usefulness and cost-effectiveness when making funding
decisions for the Perkins Act. This process opened the door for effective reforms that
were both systematic and well-defined (Guthrie, 2008).
The Department of Education Website highlights changes made to Perkins III
which enhanced previous versions of the Act in order to prioritize service to non-
traditional demographic groups as recommended in the NAVE report. Most recently,
Perkins IV was authorized in 2006 again providing funding for CTE initiatives for five
more years (U.S. Department of Education, 2006). Financially, the Perkins Act
39
substantially impacts the ability to provide students with technical skills required by the
workforce.
Nationally, CTE is critical for a competitive global economy in that it plays a vital
role in training a future workforce (Reese, 2010). The U.S. Bureau of Labor Statistics’
2010-2011Occupational Outlook Handbook identifies half of the 20 fastest-growing
careers are in the health care field (Reese, 2010) and training can be received through
CTE. The Association of Career and Technical Education (ACTE) stresses that
regardless of the education level required for future careers, CTE must be considered an
integral piece of the curriculum (Peckham, 2010). The ACTE also notes students must
master academic, soft, and hard skills to be adequately prepared for the future and
confirms CTE as an effective training venue (Peckham, 2010).
Kentucky Initiatives & Governance
At the state level, Kentucky found itself debating whether to stress academics or
vocational education during the 1980’s (O’Hara, 2009). In 1985, the non-profit Council
for Better Education garnered support from Kentucky school districts and filed suit for
equitable and adequate education for Kentucky children (Western Kentucky University,
1996). The lawsuit resulted in colossal education reform for Kentucky and led Governor
Wallace Wilkinson to establish the State Board for Adult, Vocational Education, and
Vocational Rehabilitation (O’Hara, 2009) as part of the reform effort. The State Board was
responsible for organizing stakeholder interest and support in order to determine and
ensure appropriate skills and technology for skilled workforce training (O’Hara, 2009).
Area technology centers. Following Kentucky’s landmark education reform of
1990, discussion concerning the governance of vocational education for secondary

40
students led to creation of the Cabinet for Workforce Development (O’Hara, 2009). By
the year 2000, funding had also been re-structured mandating funding to area technology
centers (Legislative Research Commission, 2003). A marketing campaign was launched to
emphasize the technology aspect of Kentucky’s Career and Technical Education Program
and embody the system as a symbol for workforce training (O’Hara, 2009). Kentucky Tech
was selected as the logo for the system of area technology centers and helped identify
Kentucky Tech as the governing system for Kentucky’s secondary technology centers
(O’Hara, 2009). Executive Director of the Kentucky Office of Career and Technical
Education (OCTE), John Marks, emphasizes that the Kentucky Tech School System,
which consists of the area technology centers, is the first technology system in the nation
to be accredited by the Southern Association of Colleges and Schools (SACS) (Marks,
2009). Marks, explains that through the SACS process, Kentucky Tech has established
the national standard for career and technical education. According to Marks, the system
is dedicated to continuous improvement by ensuring Kentucky secondary students
receive quality career and technical education and an overall improvement in student
academic performance.
Funding for area technology centers under the guidance of Kentucky Tech is
provided by Kentucky’s general biennial budget and Kentucky education funding
formula known as Support Education Excellence in Kentucky (SEEK) (Legislative
Research Commission, 2003). For each student enrolled in a Kentucky Tech area
technology center, 80 percent of the SEEK funds provided are designated to OCTE for
operational and instructional expenses and the remaining 20 percent given to the local
district for building maintenance as Kentucky Tech centers are located within locally
owned district buildings (Legislative Research Commission, 2003). Despite established
41
funding arenas for CTE in Kentucky, formulas do not include provisions for increased
costs in CTE instruction and are subject to change in accordance to Kentucky’s fiscal
situation (Legislative Research Commission, 2003).
Assessment. The OCTE implements a legislative mandated assessment program for
CTE programs (Kentucky Tech, 2011b). The assessment plan was put into practice
utilizing 21 assessment standards which were later reduced to 17 standards still currently
in place to effectively measure CTE programs in relation to assessment objectives
(Kentucky Tech, 2011b).
As shown in the following objectives for Kentucky Tech’s assessment plan, the
OCTE assessment encompasses a broad spectrum of CTE components making certain the
plan assesses the CTE instructional goals and is revised bi-annually to ensure relevance
in the assessment process (Kentucky Tech, 2011b):
Increased Student Achievement Program Improvement
Program Consistency
Successful Student Transition
Technical Program Support
Meeting Accountability Criteria
Support for the School Comprehensive Improvement Plan
Alignment with and Support for SACS Accreditation
Bi-annually, ATC’s receive visits from assessment teams comprised of the OCTE
staff, community representatives, and post-secondary representatives (Kentucky Tech,
2011b). Assessment cycle time frames for ATC’s begin one year prior to the bi-annual
assessment visit (Kentucky Tech, 2011b). During the all day assessment visit, each
instructional program located in the ATC presents evidence standard compliance which is
42
measured against the current assessment standards (Kentucky Tech, 2011b). Each
standard is scored on a scale of 0 to 4 with 4 representing adequate evidence of the
standard being met. Scores from each standard are combined to generate an overall
assessment score for each program and each school (Kentucky Tech, 2011b). Each May,
CTE program instructors complete a self assessment study of the standards which
provides an interval measure of their program’s effectiveness and direction for program
improvement (Kentucky Tech, 2011b). The OCTE’s (2011) 17 program assessment
categorical standards include:
1 – Curriculum
2 – Lesson/Unit Plans
3 – Student Achievement
4 – Student Recognition
5 – Postsecondary Links
6 – Perkins Performance Measures
7 – Program Area Safety
8 – Student Safety
9 – Student Organization
10 – Public Relations
11 – Families and Community Contributions
12 – Advisory Committee
13 – Industry Certification
14 – Work-Based Learning
15 – Professional Growth
16 – Program Improvement Plan
17 – Technology
Programs. Today’s CTE is not the same vocational training originally developed
during the early 1900’s as it requires higher level skills for all jobs (Committee on
Vocational Education Research and Development (CVERD), 1976). According to Staten
(2004), CTE programs should include activities related to individual communities and
should be designed to provide human capital for the community. Studies show CTE
43
programs are not always aligned with labor needs in the local communities (Carreira,
2009) which may result in labor shortages for respective industries. Carreira’s (2009)
research reinforces the need to correctly align training programs to the expected labor
market in order to meet the needs of a highly competitive labor force. The Vocational
Education Act of 1963 provided considerable funds for research and development in
vocational education (CVERD, 1976) leading to investigation as to appropriate program
alignment.
CTE Benefits
The National Association of State Directors of Career Technical Education
Consortium (NASDCTEC) (2009) reports findings from studies indicate a positive return
on investment for CTE expenditures. The NASDCTEC (2009) explains CTE
expenditures are recouped through tax bases created by a thriving labor force. Benefits of
CTE are multi-faceted and include preparation for today’s labor market, increased student
engagement, transition to post-secondary education, and increased graduation rates.
Likewise, both students and employers benefit from CTE as it increases skill levels of
potential employees and provides instruction that is more engaging to students.
Labor Market Preparation
The Bureau of Labor and Statistics researches and reports on labor projections for
the United States. Of the top 20 fastest-growing occupations in the United States
forecasted for the years 2008 through 2018, approximately 50 percent of the labor needs
can be fulfilled with training other than a bachelor’s or post-graduate degree (BLS,
2010). Education is the most assured step in moving students into the labor market and is
positively correlated with income (Castellano, M., Stringfield, S., & Stone, J., 2003).
44
While college is not suited for every student, those who do not plan for post-secondary
education can still have successful high-paying jobs in the trade industry (Garcia, 2008).
Again, training for these careers is available through CTE and Garcia (2008) explains this
trend is becoming a nationwide catalyst for career and technical education. In fact, CTE
is redeveloping its model of instruction to include stronger academic skills along with the
necessary technical skills to generate a strong workforce for the future (Garcia, 2008).
Increased Student Engagement
Literature reveals CTE curriculum increases student engagement through hands-
on and work based learning experiences ultimately resulting in increased academic
achievement (Wilcox 2007). In fact, high school graduates participating in career
exploration through CTE are more likely to enroll in college than students not
participating in CTE programs (Visher, M., Bhandari, R., & Medrich, E., 2004). Wilcox
(2007) stresses the importance for school guidance councilors, instructors, and
administrators to understand the value of a hands-on instructional approach that both
actively engages students and increases learning and then to share this information with
both students and parents.
Hands-on learning. Many students in CTE programs choose their program of
study due to the hands-on learning style afforded in the curriculum and report increased
learning (Trinidad, 2008). However, Wilson (2006) states, ―the learner has changed
dramatically, yet many teachers are still using the same rote teaching styles that were
used fifty years ago‖ (p. ix). Studies show only a small percent of students demonstrate a
visual learning style and as a result, visual learning is the least preferred strategy by
students while hands-on instruction is the most preferred (Trinidad, 2008). Based on
45
learning style research, Trinidad (2008) recommends teachers incorporate hands-on
learning activities as a means to encourage student engagement.
Work based learning. CTE programs implement work based learning (WBL)
initiatives which enable students to experience learning in a simulated work setting. The
goal of WBL is to provide students a realistic view of today’s workplace and the skills
required for success as it helps "create a context for creative decision making in uncertain
situations" (Harnish & Wilke-Schnaufer, 1998, p.22). Deborah Reese (2008) found
students participating in intern programs attained multiple positive employment
characteristics including basic work skills, positive attitudes, interpersonal skills,
cooperation, and teamwork.
Job shadowing is also offered by CTE programs and allows students to observe
employees performing their job duties (Reese, 2008). Reese states that one benefit of this
program is that students are able to experience the culture of an occupation in which they
are interested and more likely to pursue as a career. Likewise, job shadowing offers
students an opportunity to experience a day of work (Visher, et al., 2004).
Academic achievement. Research does not show a significant difference in the
grade point average or American College Test (ACT) scores of students completing a
planned CTE curriculum and students only completing one course (Brown, 2007).
However, Brown (2007) suggests that any participation in CTE may lead to increased
academic achievement. Brown’s conclusion is based on the intent of the Carl D. Perkins
CTE legislation which requires CTE students to perform at least as well on academic
standards as other students.
46
School systems receiving federal Perkins funding are required to integrate
academic content into the technical curriculum (Moye, 2011). Moye, 2011, explains
technical education is based on real-world experiences providing relevance to academics
which students might not otherwise understand. Moye also stresses the importance of
collaboration between CTE and academic instructors in order for student academic
achievement to be maximized. Also attesting to the relevance of CTE regarding
academic achievement, James E. (Gene) Bottoms, Southern Regional Education Board
Senior Vice President, stated ―You cannot achieve both rigor and relevance in high
school for most students without modern career and technical education‖ (Bottoms, 2006,
p. 14).
Post-Secondary Transition
Career and technical education is not limited to secondary students. Many two
year colleges offer an Associate of Science (AS) degree which consists of 64 credit hours
with approximately one-half of those dedicated to technical courses (Stumpf, 2007).
Although many states look at an associate degree as a path to a bachelor’s degree, Stumpf
(2007) contends there are still states that look at the AS degree as preparation for
immediate entrance into the workforce. In response to criticism that an associate degree
does not provide enough technical skills training for the entry-level worker to
successfully transition to the workforce, Stumpf relays that colleges have established
options to reinforce employability including internship programs along with other work
based learning initiatives.
Another option for secondary students to be better prepared for transition to
college is through obtaining college credit in high school. Articulated course work is
47
defined as a ―college level technical course that allows high school students to qualify for
college credit through articulation agreements‖ (p.12) between high schools and colleges
(Kim, 2006). Kim (2006) defines dual credit students as ―students who have received
dual credit from both high school and community college by taking dual credit course(s)
while in high school‖ (p.13). Research demonstrates a significant positive correlation
between articulated and dual-credit hours and college readiness indicating that students
should be given greater opportunities to receive dual and articulated credit to be
adequately prepared for college (Kim, 2006).
CTE programs do not diminish the participating students’ college preparedness
(Wilcox 2007). In fact, research shows support for technical education with insignificant
differences between the college readiness of technical and non-technical students
(Wilcox, 2007). Wilcox (2007) recommends CTE programs in order to adequately
prepare students for the technologically advanced positions for which they must compete.
Graduation Rates
Posey (2008) notes that dropout rates are a serious cause for concern nationally
and reports school districts are incorporating smaller learning communities or career
academies to motivate student learning through cohort scheduling, dual enrollment,
differentiated instruction, mentoring, and work based learning all of which are offered
through CTE. Garcia (2008) reports educators are increasing course relevance and
providing an opportunity for students to experiment with courses that offer instruction in
modern technology and lead to well-paying careers. To battle significant dropout rates,
Los Angeles schools turned to CTE in order to provide at risk students with workplace
48
principles and skills that will hopefully stimulate an interest to maintain their academic
endeavors (Garcia, 2008).
Human Capital Theory
Capital is defined as the ―Material wealth used or available for use in the
production of more wealth.‖ (Kleinedler , 2005). Gary Becker, Nobel Memorial Prize
winning economist from the University of Chicago, is credited with the theory of human
capital as a means of increasing one’s wealth (Becker, 1993). Becker’s theory,
straightforward in its simplicity, suggests training and education are directly tied to the
overall value of human worth and ingenuity thus serving as an intangible form of capital.
Becker’s original 1957 study focused on the rate of return for education and formed a
theory which explains multiple research phenomena (Becker, 1975). Becker found
increased income resulted from investments in human capital (Becker, 1993). Becker
(1975) devised the equation, mp=w, meaning wages increase along with marginal
productivity. In turn, education and training are required to increase skill sets and
knowledge; ultimately leading to increased productivity.
Embracing the Human Capital Theory, David Baker (2009), declares
―formal education not only educates individuals, it reconstitutes the very
foundations of society through a pervasive culture of education with a
legitimate capacity to reconstruct work and its central components such as
ideas about human productive abilities, new organisations and
management, widespread professionalism and expertise, and the emerging
educated workplace‖ (p. 163).
49
Baker’s statement implies individuals are not the sole benefactors of human capital
investment, but rather employers profit from increased skills and production. Reiterating
this point, literature contends once knowledge and skills are obtained, they become an
integral part of who the employee is and positively impacts actions and workplace
behaviors (Clark & Allison-Jones, 2011). As a result, employers should consider
investing in additional employee training (Clark & Allison-Jones, 2011).
Becker contends that better education leads to greater wealth of citizens and
nations and that all humans are rational and seek to maximize their individual wealth
through appropriate education attainment (Vandenberghe, 1999). Becker asserts
educational providers are only concerned with pleasing their clients whether the clients
are students or industry and will adapt educational processes to meet those needs
(Vandenberghe, 1999). This assertion increases the relevance of this study as CTE
program alignment is necessary to meet the needs of industry.
Formation of the Human Capital Theory (HCT) can be traced to the mid-1700’s
to economist Adam Smith and his Wealth of Nations (Baptiste, 2001). Despite other
researcher’s interest in the theory, HCT was somewhat controversial as it challenged the
foundation of human freedom and dignity by implying humans were nothing more than
capital with their education and training considered an investment in capital (Baptiste,
2001). Opponents of HCT argued that humans were not to be valued and marketed for
their skills, but rather recipients of wealth (Baptiste, 2001).
Becker’s early studies of the economics of education were followed by significant
research solidifying HCT as a widely accepted philosophy (Gilead, 2009). The
philosophy recognizes humans as capital and training expenses or education of laborers
50
as a human capital investment resulting in education as a generator of human capital
(Becker, 1962; Vandenberghe, 1999). Limitations to the HCT are evident in that
opponents argue that individuals are not always logical and do not always seek to
maximize wealth (Gilead, 2009; Baptiste, 2001). In fact, many individuals are
constrained by their socio-economic placements and are tied to alternative paths that do
not always lead to wealth and prosperity (Baptiste, 2001). Too, not all seek wealth as a
source of happiness and are content in their lifestyle based on values and upbringings.
Likewise, educational providers may not always respond to the needs of students and
industry as confounding variables such as political demands may dictate educational
processes (Vandenberghe, 1999). Becker (1975) admits there are multiple variables
associated with Human Capital Theory and stresses the importance of continued study.
Community Success
Literature shows local community sustainability depends upon economic growth
and job provision (Renski, 2009). Renski, 2009, suggests the success of local
communities is jeopardized when a lack of jobs forces new and younger workers to seek
employment in other areas. Renski also discusses the negative impact of a lost tax base
on community structure when workers move out of the area. Likewise, Morgan (2009)
stresses the need for increased economic growth to sustain local communities and
suggests communities are looking for innovative ideas for business and industry
recruitment in the current economic climate. Morgan (2009), found communities
involved in the dedicated pursuit of economic growth were focusing on garnering a
workforce trained in needed skills for the particular industry needs.
51
Appalachian variable
Wide diversity of the United States’ Appalachian region exists with communities
ranging from vast poverty to characteristics of suburbia (Baumann, 2006). Baumann
(2006) explains Appalachia’s central region, including Kentucky’s Appalachian counties,
is most prone to extreme poverty. From an Appalachian perspective, Shaw, et al., (2004)
contends education is necessary for economic growth of respective communities.
Unfortunately, Appalachia has historically demonstrated under attainment in
education in relation to the rest of the country (Baumann, 2006; Shaw, et al., 2004).
Johnson & Broomhall (1992) found the lack of education within Appalachia resulted in
turning away new industries to the region. Confirming the need for career and technical
education, Hall (2009) reported the lack of educational attainment in Appalachia cannot
be replaced with specific short-term training as it is not a viable alternative to a skilled
labor force. Again sounding the importance of career and technical education within the
Appalachian region, a summation of topics from a 1980’s Appalachian Regional
Commission Conference explained the importance of technical education in relation to
economic growth of the region (Conference Focuses on Jobs and Skills for the Future,
1983). Coming full circle, Shockley (1995) found the CTE program area Appalachian
students participated in were correlated to the students’ career choice recapping the need
for CTE program alignment to the needs of business and industry.
Literature Conclusion
A review of literature reveals that overall CTE provides an educational plan for
students and employers. Literature attests current employers are looking for the total
package in employees including both job skills and interpersonal skills also known as

52
technical and soft skills. Literature suggests employer needs often change with the
advent of new technologies increasing the difficulty of sustaining well trained workers.
Literature also suggests CTE provides instruction leading to successful employability
skills in both technical and soft skills.
Literature reveals the importance of funding in providing education according to
business and industry needs. This is evident in the amount of federal funding allocated to
CTE through the Carl D. Perkins Act and the act’s continued approval. However,
literature shows Perkins funding is available only for CTE program advancement and not
daily program expenditures necessary for daily implementation implying a need for
research regarding CTE operational funding.
Gary Becker theorizes investment in education and training is an investment in
human capital which leads to increased personal wealth. Based on the Human Capital
Theory, literature discloses investment in employee educational obtainment and
continued training not only benefits individual employees, but is profitable to business
and industry. The Human Capital Theory is closely aligned with CTE as it relates
educational costs to personal and organizational benefits.
Both nationally and in Kentucky, CTE has been influenced by various policy models
and frameworks dependent upon both federal and state initiatives. In Kentucky, the success
and vision of policy makers in re-designing CTE demonstrates attributes of multiple policy
making theories. The Council for Better Education lawsuit reflects a triggering event that is
evident in punctuated equilibrium policy model (Sabatier, 2007). Because of the triggering
event, the window of opportunity was opened allowing this policy theory to play the largest
role in the education reform that followed. Not only was the entire educational spectrum
changed for Kentucky, but the governance and implementation of CTE in Kentucky. The
53
premise behind the creation of the Workforce Development Cabinet was to form a
relationship that would benefit the labor needs of business and industry through
employment of highly skilled and educated workers.
Literature implies the overall education system has benefited tremendously from
benefits associated with CTE instruction. Literature attests to the engaging teaching
methods associated with CTE and the positive impact of this strategy on dropout rates
indicating partnerships between CTE and traditional educational programs result in
increased achievement in both formats. Identified benefits increase the credibility of
CTE helping to overcome the premise of CTE only suited students not pursing post-
secondary opportunities.
Within the next generation, vocational education will continue to grow and evolve
by offering expanded programs and higher levels of skills and technology as dictated by
the ever changing needs of business and industry. Over the years, educators in the
vocational system have claimed ownership of technical training and are currently
working to develop a stronger base of operation that will secure a culture of higher order
learning with student achievement levels greater than recognized in the traditional school
setting. However, continued growth and development of CTE programs requires an
increase in valid research to enable stakeholders in the decision making process.
Literature reveals soft skills are a necessary skill set for the 21st century. Soft
skills vary according to industry, but each list generally contains a contiguous skill set
categorized as communication, teamwork, critical thinking, and problem solving skills.
Literature implies CTE promotes soft skills within its curriculum, but lacks specific
measurement and analysis of such. In Kentucky, the Kentucky Occupational Skills
54
Standards depict a relevant skill set necessary for both technical and personal skills for
current and future employment. Likewise, the KOSSA provides relevant information
regarding student achievement, but the assessment does not provide measurement of
stand alone soft skills. Rather the KOSSA includes measurement of technical skills
alongside soft skills as an overall employability benchmark. However, KOSSA
information is included in this study as it provides the most extensive data as a
measurement of soft skills mastery in Kentucky as it was authorized to be imported as a
Perkins Grant accountability tool in the 2006-2007 school year.
Overall, literature reveals a lack of research in the area of CTE program alignment
to the labor needs of local business and industry despite Arnold’s (1965) assertion that
quality CTE programs are directly tied to local communities. There is little question
regarding the ability of CTE to adequately prepare a trained workforce, but the question
not being asked or answered in this review of literature is whether or not specific
workforces are able to find local employment.
Literature also attests the need for economic growth in order to sustain local
communities. Local communities are dependent upon a solid tax base for infrastructure
improvement and stability. Morgan (2009) related innovative communities are working
to secure skilled labor for recruitment purposes. In order to effectively recruit business
and industry to local communities, it is imperative the community is work ready and can
provide adequately skilled labor. This study is directly tied to this premise as CTE is a
cornerstone to the provision of a skilled workforce and solicitation of new business and
industry is dependent upon adequately skilled labor.
55
This review of literature shows the Appalachian region suffers from educational
attainment and subsequent development of business and industry. Again, this study
addresses the need for technical education in Appalachia and is even more relevant
considering Shockley (1995) found the CTE program areas Appalachian students
participated in were correlated to the students’ career choice. Considering this, when
jobs in those career fields are not available due to misalignment, students are more likely
to leave the community to find employment thus contributing to the breakdown of the
community.
The area of CTE program alignment and the provision of 21st century soft skills
are vital in determining the overall success of CTE in meeting the needs of local business
and industry. This review of literature reveals an opening for research regarding CTE
program alignment. Too, literature reflects discrepancies in acceptable broad based soft
skills necessary for 21st century success. This study will add to the vacancy in literature
providing conclusions and recommendations to CTE policy makers regarding CTE
program alignment and provision of 21st century soft skills.
56
CHAPTER III
METHODOLOGY
Introduction
The purpose of this study was to analyze the relationship between CTE training
programs offered to high school students and the labor needs of business and industry.
Secondly, this study analyzed whether CTE preparatory students demonstrate proficiency
in 21st century soft skills. This study’s quantitative design depicted the alignment of CTE
programs to current and future labor needs as well as the relationship between CTE
curriculum and 21st century soft skills through observational information devoid of
experimental research intervention (Sloman, 2010). Research designs applied to this
study provided baselines and predictive factors with relative accuracy for further study
(Sloman, 2010; Jackson, 2009).
The research questions investigated in this study follow:
1. Are career and technical programs offered by Kentucky Tech’s area
technology centers in central Kentucky aligned with current labor needs in
counties served by the LCADD?
2. Are career and technical programs offered by Kentucky Tech’s area
technology centers in central Kentucky aligned with future labor needs in
counties served by the LCADD?
3. Are CTE preparatory students demonstrating proficiency in 21st century soft
skills required by employers?
57
Context of Study
The concept of human capital accentuates skill development as a vital component
for a capable workforce leading to improvement in the standard of living and overall
citizenry (Olaniyan & Okemakinde, 2008). Olaniyan & Okemakinde (2008) reported a
positive correlation between Human Capital Theory and economic development in their
findings, implying developing human resources may result in increased business and
industry productivity and levels of technological skills. Along those lines, Eastern Asia
attributed its advancement in economic growth on this foundation (Olaniyan &
Okemakinde, 2008).
Embracing the Human Capital Theory and its association with education, this
study investigated whether area technology centers in Kentucky’s Appalachian region are
providing the skilled labor force required both currently and in the future for local
community needs. This study took place in Kentucky’s Appalachian counties in the Lake
Cumberland Area Development District (LCADD) located on Kentucky’s western edge
of the Appalachian region. The LCADD region was chosen for the study as it represents
Appalachia which historically displays vast poverty (Ziliak, 2007). Ziliak (2007) reports
the lack of educational attainment in Appalachia has contributed to the lack of human
capital and may explain the significant economic plight of the region. The LCADD
region provided a broad representation of Appalachia’s human capital eliminating
potential bias resulting from stereotypical assumptions associated with Appalachian
people.
This study replicated Robert Carreira’s Aligning Tech Prep Programs with
Current and Future Labor Market Needs study which investigated whether Tech Prep
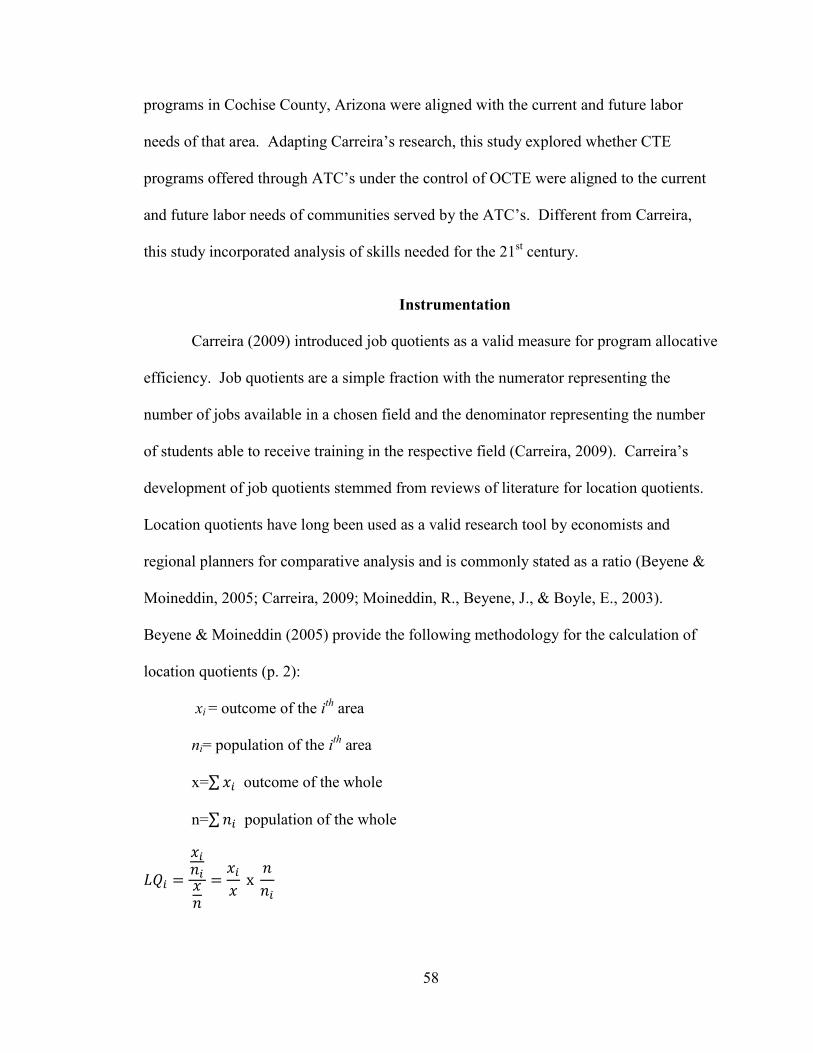
58
programs in Cochise County, Arizona were aligned with the current and future labor
needs of that area. Adapting Carreira’s research, this study explored whether CTE
programs offered through ATC’s under the control of OCTE were aligned to the current
and future labor needs of communities served by the ATC’s. Different from Carreira,
this study incorporated analysis of skills needed for the 21st century.
Instrumentation
Carreira (2009) introduced job quotients as a valid measure for program allocative
efficiency. Job quotients are a simple fraction with the numerator representing the
number of jobs available in a chosen field and the denominator representing the number
of students able to receive training in the respective field (Carreira, 2009). Carreira’s
development of job quotients stemmed from reviews of literature for location quotients.
Location quotients have long been used as a valid research tool by economists and
regional planners for comparative analysis and is commonly stated as a ratio (Beyene &
Moineddin, 2005; Carreira, 2009; Moineddin, R., Beyene, J., & Boyle, E., 2003).
Beyene & Moineddin (2005) provide the following methodology for the calculation of
location quotients (p. 2):
xi = outcome of the ith
area
ni= population of the ith
area
x=∑ outcome of the whole
n=∑ population of the whole
59
Beyene and Moineddin suggest the use of confidence levels with the location quotients to
increase validity of the quotients.
For this study, Carreira’s adaption of job quotients was used without the use of
confidence levels. As Carreira notes, location quotients are not easily interpreted by the
user. Likewise, location quotients in an economic setting are beneficial for comparison
between local and national venues (Moineddin, et al. 2003). This study’s population
encompassed eight counties in Kentucky’s Appalachian region and did not include
national labor markets. In fact, many of the ATC’s in the population offered the same
CTE programs within their area technology centers which provided a better setting for a
regional study. For this study, Carreira’s manipulated job quotients provided a tool that
was easily interpreted by the user addressing the number of jobs in relation to the number
of students trained and did not take into account confidence intervals outside the scope of
this study.
Carreria’s study indicated that the simplicity of job quotients spoke to their
validity as a research method. Carreira explained job quotients of one suggest an ―equal
number of jobs in the local economy for each student offered access to the program that
prepares students for those jobs‖ (p. 14). Subsequently, alignment ―ensures workforce
shortages are equitably distributed and career fields and industries within the local
economy are equitably served‖ (p. 14). This study accepted the simplicity and
straightforwardness of job quotients, but did not attempt to explain margins of acceptable
efficiency when calculated job quotients do not purport alignment.
60
Population
The population for this study included CTE programs in six of Kentucky Tech’s
54 ATC’s which provide CTE instruction to secondary students in Kentucky. ATC’s
included in the population are under direct control of the Kentucky Education and
Workforce Investment Cabinet’s Office of Career and Technical Education. This study’s
sample included the population’s 6 Kentucky Tech ATC’s providing CTE instruction to
students in the LCADD located in south central Kentucky. The study’s sample serves 8
of the 10 counties in the LCADD area which are classified as Appalachian: Adair,
Casey, Clinton, Cumberland, Green, Pulaski, Russell, and Wayne. McCreary County
was not included in the sample as resident students are not served through an ATC and
resident students from Taylor County were omitted as Taylor County is not included in
the Appalachian region. Table 2 illustrates programs offered in the respective ATC’s.
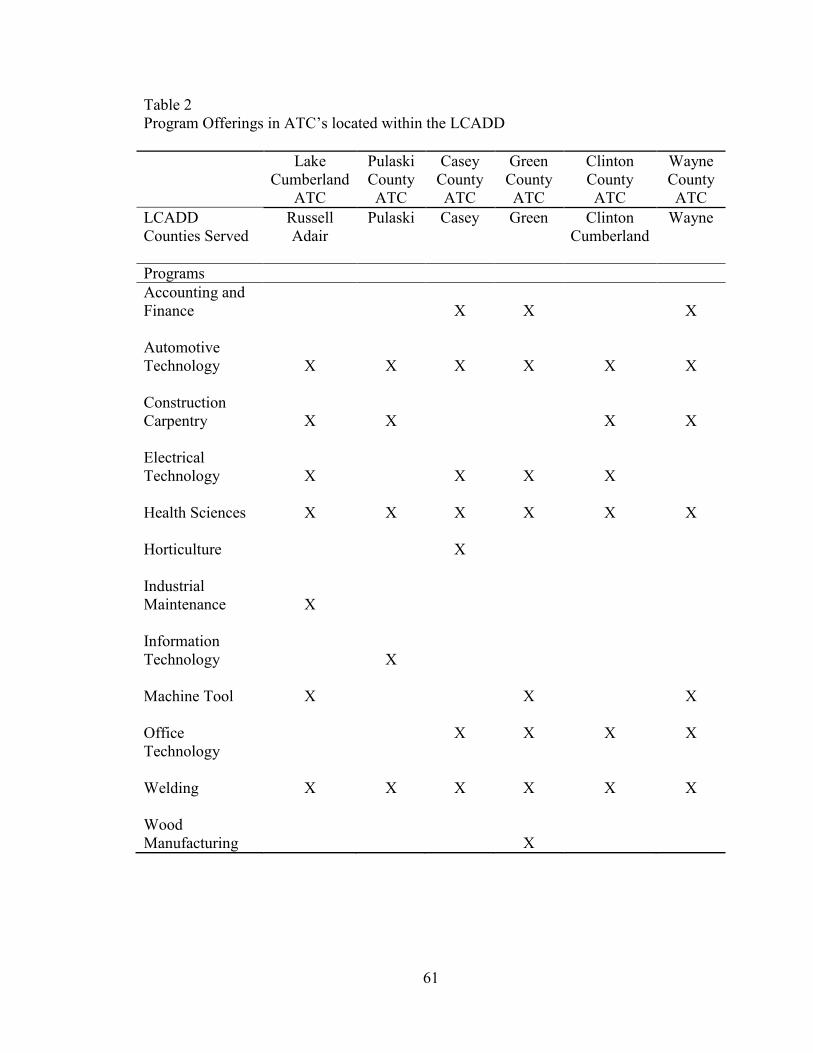
61
Table 2
Program Offerings in ATC’s located within the LCADD
Lake
Cumberland
ATC
Pulaski
County
ATC
Casey
County
ATC
Green
County
ATC
Clinton
County
ATC
Wayne
County
ATC
LCADD
Counties Served
Russell
Adair
Pulaski Casey Green Clinton
Cumberland
Wayne
Programs
Accounting and
Finance
X
X
X
Automotive
Technology
X
X
X
X
X
X
Construction
Carpentry
X
X
X
X
Electrical
Technology
X
X
X
X
Health Sciences
X X X X X X
Horticulture
X
Industrial
Maintenance
X
Information
Technology
X
Machine Tool
X X X
Office
Technology
X X X X
Welding
X X X X X X
Wood
Manufacturing
X
62
Data Collection
The study used existing data sets collected by the LCADD, OCTE, Workforce
Kentucky Database, and TEDS database for Carl D. Perkins reporting. Research
questions one and two utilized data from the LCADD, OCTE, and Workforce Kentucky
Database. Research question three utilized data provided by the TEDS database for Carl
D. Perkins reporting. No human participants were used in this study which qualified the
study for exempt status from Eastern Kentucky University’s Institutional Review Board.
The exempt status was authorized under Protocol Number 11-182.
The Lake Cumberland Area Development District is one of Kentucky’s 15 Area
Development Districts organized by regional communities to help meet the needs of local
business and industry (Kentucky Area Development District, 2009). For this study, the
LCADD website provided a list of counties included in the LCADD and demographics
including Appalachian status.
The Workforce Kentucky Database is a product of Kentucky’s Office of
Employment and Training (OET) and provided labor market information for Kentucky
collated by Kentucky’s Area Development Districts (KOET, 2011). Specifically, the
Workforce Kentucky Database reported current and projected workforces associated with
career clusters offered through Kentucky Tech ATC’s in the LCADD and projected
annual openings for each workforce.
For this study, Kentucky’s Workforce Kentucky Database provided the most
relevant and reliable data for the population area. At the federal level, the Bureau of
Labor Statistics (BLS) offers the most reliable employment and economic data for public
use. The BLS (2010) reports that individual states track and report occupational
63
information within their respective areas working cooperatively with the Bureau of Labor
Statistics which increases data reliability. The BLS acknowledges some states may not
track and report on all occupational areas included in national statistics due to
insignificant labor numbers within the occupations. To streamline reporting, the BLS
explains individual states often group occupations with insignificant employment
numbers under broader and larger industry categories. For these reasons, individual
county information for this study’s population area was not available at either the
national or state level.
The Office of Career and Technical Education is governed by Kentucky’s
Workforce Investment Cabinet (Kentucky Workforce Investment Cabinet, 2011). The
OCTE’s staff includes program consultants who, like instructors are experts in their
respective fields, serve as liaisons between business and industry area technology centers
advising instructors on curriculum and industrial needs (Kentucky Tech, 2011a). For this
study, program consultants provided lists of occupations for area technology center
program offerings. Detailed occupational information provided by OCTE consultants is
included in Appendix B.
Data for research question three was obtained from the TEDS database and the
Office of Career and Technical Education. The Office of Career and Technical
Education website provided lists of Kentucky Occupational Skills Standards, which after
analysis provided a list of widely accepted soft skills in Kentucky. The TEDS database
contains information for Carl D. Perkins accountability standards and provided passage
rates for the Kentucky Occupational Skills Assessment.
64
Research Design and Analysis
This study utilized a quantitative research design which took place in four phases.
The first and second phases of this study consisted of data collection for research
questions one and two. Phase one of the research included a summary of programs
offered by each ATC within the sample along with a supply side compilation of
aggregate enrollment capacities for respective programs. This was accomplished by
organizing enrollment capacities for schools in the population by programs. Data
collected for this phase was provided through the OCTE and TEDS database. This study
assumed students completing programs possess adequate hard skill sets necessary for
technical skill success in respective labor markets. As referenced earlier, program
completers are students who have completed four credits within a given program. It was
also assumed that not all students enrolling in a given program will complete four credits.
It is important to note analysis of program completers compared to enrollment capacities
was outside the scope of this study. As a result, enrollment capacities were used as a
measure to determine program alignment to labor needs while assuming programs were
training students at full capacity.
The second phase of data collection included a demand side compilation of
current and future occupation capacities associated with each program area along with
projected annual openings. Data for this phase was collected from Workforce Kentucky
Database, and the Office of Career and Technical Education. The Workforce Kentucky
Database provided current labor market numbers as well as the projected number of
annual jobs for the years 2008 through 2018 for occupations associated with CTE
programs offered within the LCADD. Occupational data for Kentucky was available
65
through the Workforce Kentucky database. The website offered current and projected
occupational data organized through various modes. Categorical groupings included the
state at large, metropolitan areas, and Kentucky Area Development Districts. For this
study, Workforce Kentucky information was organized and retrieved for the Lake
Cumberland Area Development District and provided current and projected employment
data for the region. As noted previously, the BLS reports individual states do not always
provide specific county information due to lack of significant labor numbers (BLS,
2010). For Kentucky, individual rural county information was not available. Also in this
data collection phase, lists of respective occupations for each program area for which
CTE provides instruction were collected from OCTE program consultants and organized
by career clusters.
Phase three of the study included analysis of data collected during phases one and
two. Supply side data from phase one was organized by program, assuming full
enrollment capacities of programs to arrive at an aggregate enrollment figure for
programs in the LCADD. When compared to current and future labor openings in the
LCADD, data analysis revealed whether programs adequately aligned to labor needs thus
answering the alignment portion of the research questions.
Data was analyzed following Carreira’s study through utilization of job quotients.
This study utilized job quotients as the statistical measure between current and future job
opportunities in the LCADD area in relation to ATC program offerings. As noted in
Carreira’s study, job quotients indicate either an abundance or lack of resources to
program areas through calculation of either too many or too few trained students for the
number of jobs. Sufficient program alignment was determined when a calculated job
66
quotient was one; assuming a job quotient numerator of the number of jobs available
within each program area and a denominator of the number of students available to work
in each program area. As Carreira noted, job quotients are relatively new as a statistical
measure and do not carry ―well established‖ validity and reliability. However, the
measure’s simplicity speaks to its ability to effectively measure what it claims and does
not raise validity issues (Carreira, 2009). The use of job quotients as a measure of
alignment did not provide historical references for data analysis. As a result, this study
did not attempt to determine statistically significant margins indicating alignment with
job quotients above and below one.
While Carreira’s study utilized regression analysis as the primary measure
between current and future labor needs and enrollment capacities, this study diverged
from Carreira and utilized descriptive statistics without research manipulation to
minimize the impact of a potential low sample size. Low sample sizes in research can
pose a problem for reliability in quantitative statistics (Anderson-Cook, 2004). Research
shows larger sample sizes more precisely mirror the research population resulting in
higher confidence levels. However, effective research design does not depend solely on
sample size, but rather what data will provide answers to the research questions
(Anderson-Cook, 2004). The scope of this study was narrowed to involve a relatively
low sample of the CTE population in Kentucky’s Appalachian region. The scope was
limited in order to adequately address concerns in the Appalachian region as outlined in
the program of studies for Eastern Kentucky University’s Educational Doctoral Program.
For this reason, the research design utilizing descriptive statistics with a lower sample
size was appropriate to answer the research questions posed.
67
Phase four of the study included analysis of the level of soft or employability
skills proficiency by CTE preparatory students. As evidenced with the development of
the Kentucky Occupational Skills Standards, employability and soft skills are an integral
part of CTE curriculum. The Kentucky Occupational Skills Standards Assessment offers
a measure of student mastery of Kentucky Occupational Skills Standards and subsequent
21st century soft skills. Taylor (2005) reported the current movement for the inclusion of
soft skills within educational curriculums requires an effective framework for measuring
student attainment. While slight variances in soft skills may exist according to industry
and prevent a consistent national skill set, research demonstrates common skill sets
germane to most all industries.
In an effort to increase the validity and reliability of KOSSA as a measure of 21st
century soft skills, the researcher analyzed soft skills included in the skill standards of
each relative career cluster. The researcher compiled the number of soft skills included
in each career. This analysis was necessary to show readers of the study the importance
of the KOSSA passage rates.
The number of students successfully passing the Kentucky Occupational Skills
Standards Assessment was collected and analyzed beginning with the school year 2006-
2007. The 2006-2007 school year was the first year KOSSA data was collected and
imported into the TEDS system for Perkins Grant accountability. As a result, data before
the 2006-2007 school year was not available for this study. The student passage rate was
charted to reflect either a decrease, increase, or no change in the passage rate indicating
whether the program was moving towards increased proficiency. The data was presented

68
by program areas to determine the level of soft skills mastery by students from individual
program areas.
Summary
This study used existing data sets provided by the Office of Career and Technical
Education, LCADD, and Workforce Kentucky to analyze the study’s research questions.
The study’s methods included data observation without experimental intervention and
were divided into four phases to answer the three research questions. Phases one and two
included data collection of current and projected labor needs in the LCADD as well as
total enrollment capacities of each program. From the collected data, job quotients were
calculated. Phase three entailed analysis of job quotients to determine if CTE programs
were aligned with current and projected labor needs. Alignment was considered when
calculated job quotients are one. Phase four included analysis of Kentucky Occupational
Skills Standards as a measure of 21st century soft skills and analysis of Kentucky
Occupational Skills Standards Assessment passage rates to determine whether CTE
students demonstrated proficiency in 21st Century Soft Skills.
69
CHAPTER IV
FINDINGS
Introduction
The purpose of this study was to determine if CTE programs offered in
Kentucky’s Lake Cumberland Area Development District (LCADD) under the umbrella
of Kentucky Tech were aligned with current and future local labor needs in terms of job
availability and whether program completers demonstrated 21st century soft skills.
Results of this study follow in this chapter.
As outlined in the previous chapter, this study was broken down into four phases
to answer the study’s three research questions. Phases one and two provided data
collection for the first two research questions. Research questions one and two dealt with
Kentucky Tech area technology centers in the LCADD program alignment with jobs in
the area.
Phase one of the research entailed a summary of programs offered by each ATC
within the sample along with a supply side compilation of aggregate enrollment
capacities for respective programs. This was accomplished by organizing enrollment
capacities for each school by programs. Data collected for this phase was provided
through the OCTE and included total available enrollments for programs during the
2010-2011 school year. (See Table 5).
The second phase of data collection consisted of compiling current and future
employment capacities for occupations within each program area. Data for this phase
was collected from the Workforce Kentucky Database and the OCTE. The Workforce
Kentucky Database provided current labor market numbers as well as the projected
70
number of annual jobs for the years 2008 through 2018 for occupations associated with
CTE programs offered within the LCADD. OCTE program consultants provided
information regarding attainable occupations for each program area.
Phase three of the study included compilation and analysis of job quotients for
each program area. Job quotients were calculated using the number of jobs in each
program area as the numerator and the number of aggregate program enrollment
capacities as the denominator. Job quotients demonstrated a lack or abundance of
training potential for program areas. The study recognized a job quotient of one would
indicate alignment of programs in the Lake Cumberland Area Development District to
the respective labor needs as it implies an available trained workforce for business and
industry needs. It was assumed job quotients in excess of one would demonstrate a need
for program completers. Likewise, it was assumed job quotients below one would
demonstrate an overabundance of trained workers which might result in workers leaving
the LCADD to find employment.
Phase four was used to determine whether CTE students were demonstrating
proficiency in 21st century soft skills through compilation and analysis of soft skills and
Kentucky Occupational Skills Standards Assessments. Skills standards documents for
programs offered in the LCADD were compared and a list of categorical soft skills
required by employers was assembled. As previously discussed, a single set of accepted
soft skills does not exist. The list gathered from KOSS for each program demonstrates
KOSSA measures 21st century soft skills. Once this was done, passage rates from the
previous four years of KOSS assessments were organized by overall programs in the
LCADD allowing the researcher to determine whether students were increasing in soft
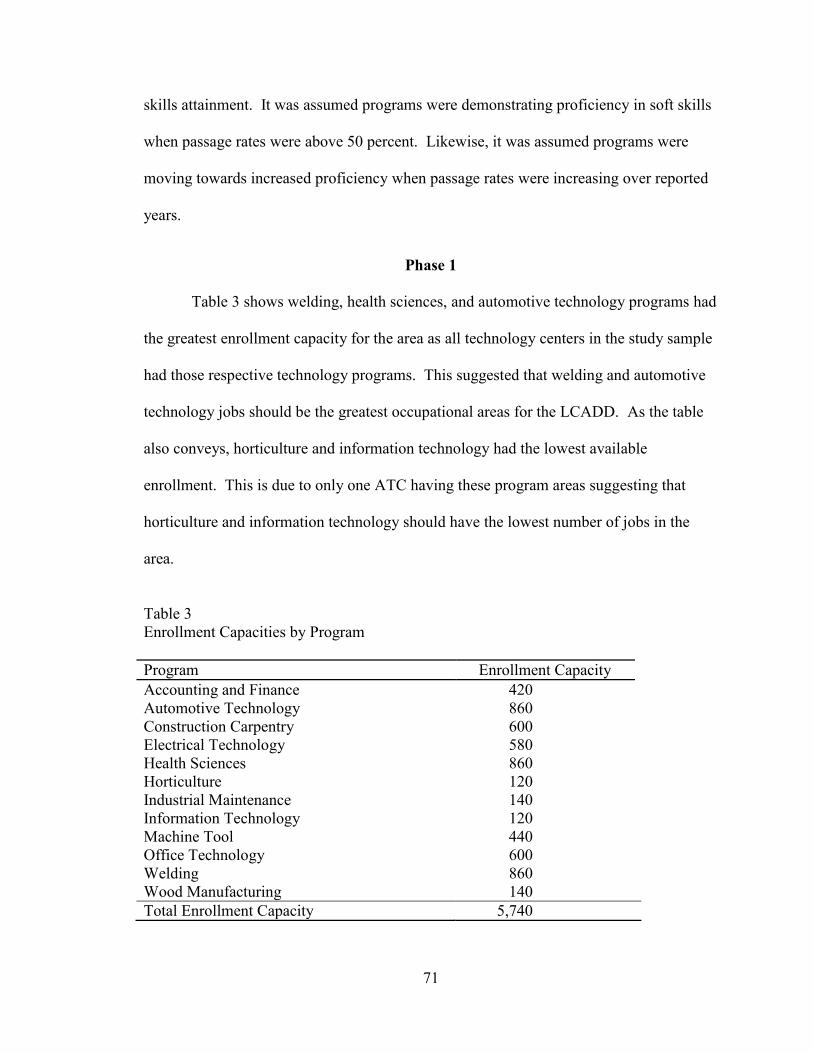
71
skills attainment. It was assumed programs were demonstrating proficiency in soft skills
when passage rates were above 50 percent. Likewise, it was assumed programs were
moving towards increased proficiency when passage rates were increasing over reported
years.
Phase 1
Table 3 shows welding, health sciences, and automotive technology programs had
the greatest enrollment capacity for the area as all technology centers in the study sample
had those respective technology programs. This suggested that welding and automotive
technology jobs should be the greatest occupational areas for the LCADD. As the table
also conveys, horticulture and information technology had the lowest available
enrollment. This is due to only one ATC having these program areas suggesting that
horticulture and information technology should have the lowest number of jobs in the
area.
Table 3
Enrollment Capacities by Program
Program Enrollment Capacity
Accounting and Finance 420
Automotive Technology 860
Construction Carpentry 600
Electrical Technology 580
Health Sciences 860
Horticulture 120
Industrial Maintenance 140
Information Technology 120
Machine Tool 440
Office Technology 600
Welding 860
Wood Manufacturing 140
Total Enrollment Capacity 5,740
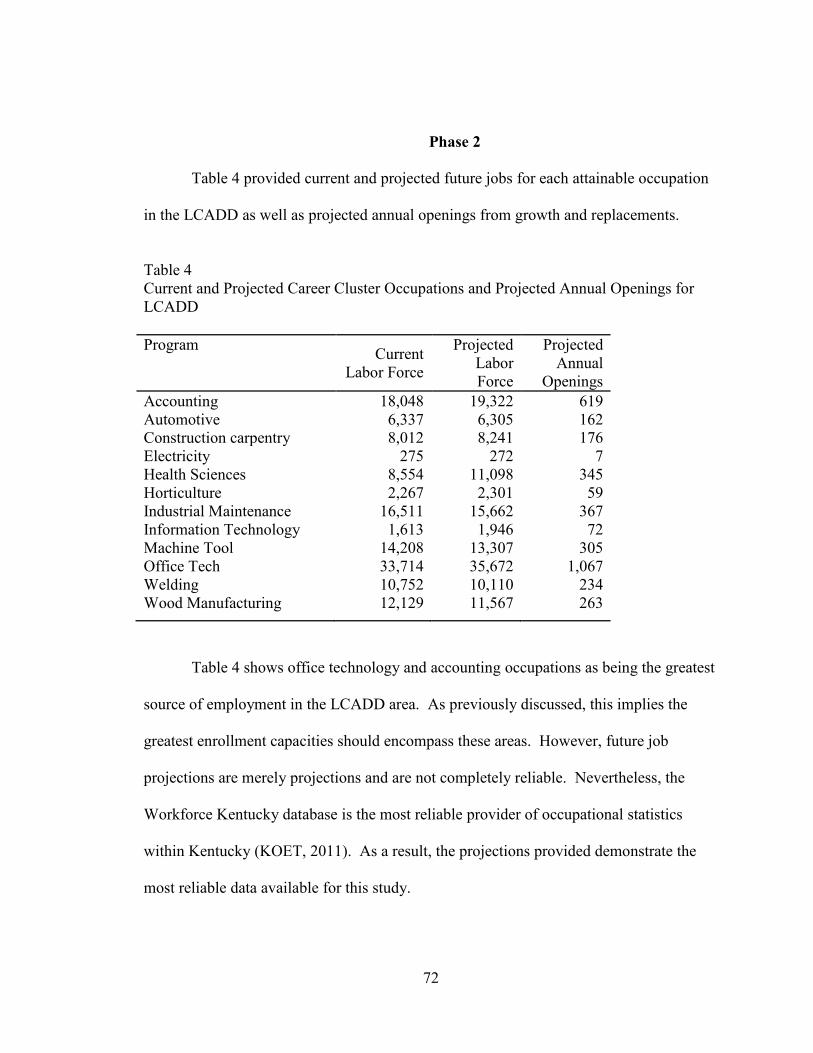
72
Phase 2
Table 4 provided current and projected future jobs for each attainable occupation
in the LCADD as well as projected annual openings from growth and replacements.
Table 4
Current and Projected Career Cluster Occupations and Projected Annual Openings for
LCADD
Program Current
Labor Force
Projected
Labor
Force
Projected
Annual
Openings
Accounting 18,048 19,322 619
Automotive 6,337 6,305 162
Construction carpentry 8,012 8,241 176
Electricity 275 272 7
Health Sciences 8,554 11,098 345
Horticulture 2,267 2,301 59
Industrial Maintenance 16,511 15,662 367
Information Technology 1,613 1,946 72
Machine Tool 14,208 13,307 305
Office Tech 33,714 35,672 1,067
Welding 10,752 10,110 234
Wood Manufacturing 12,129 11,567 263
Electricity 275 272 7
Table 4 shows office technology and accounting occupations as being the greatest
source of employment in the LCADD area. As previously discussed, this implies the
greatest enrollment capacities should encompass these areas. However, future job
projections are merely projections and are not completely reliable. Nevertheless, the
Workforce Kentucky database is the most reliable provider of occupational statistics
within Kentucky (KOET, 2011). As a result, the projections provided demonstrate the
most reliable data available for this study.
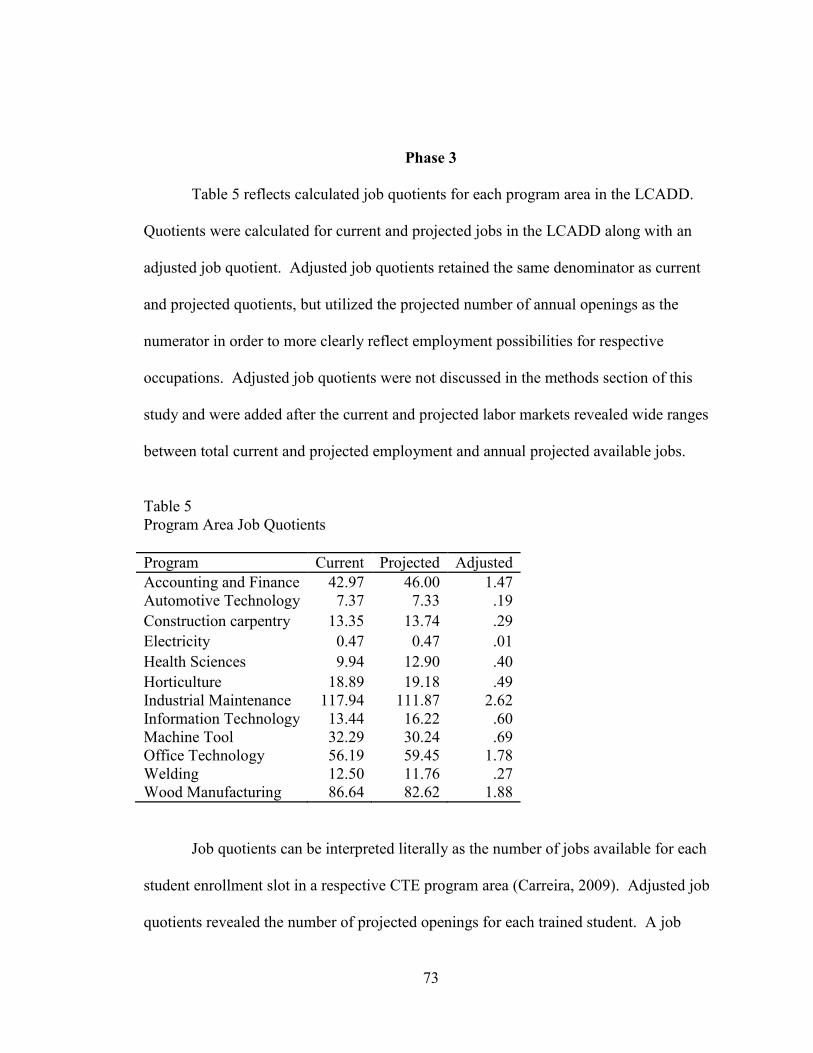
73
Phase 3
Table 5 reflects calculated job quotients for each program area in the LCADD.
Quotients were calculated for current and projected jobs in the LCADD along with an
adjusted job quotient. Adjusted job quotients retained the same denominator as current
and projected quotients, but utilized the projected number of annual openings as the
numerator in order to more clearly reflect employment possibilities for respective
occupations. Adjusted job quotients were not discussed in the methods section of this
study and were added after the current and projected labor markets revealed wide ranges
between total current and projected employment and annual projected available jobs.
Table 5
Program Area Job Quotients
Program Current Projected Adjusted
Accounting and Finance 42.97 46.00 1.47
Automotive Technology 7.37 7.33 .19
Construction carpentry 13.35 13.74 .29
Electricity 0.47 0.47 .01
Health Sciences 9.94 12.90 .40
Horticulture 18.89 19.18 .49
Industrial Maintenance 117.94 111.87 2.62
Information Technology 13.44 16.22 .60
Machine Tool 32.29 30.24 .69
Office Technology 56.19 59.45 1.78
Welding 12.50 11.76 .27
Wood Manufacturing 86.64 82.62 1.88
Job quotients can be interpreted literally as the number of jobs available for each
student enrollment slot in a respective CTE program area (Carreira, 2009). Adjusted job
quotients revealed the number of projected openings for each trained student. A job
74
quotient of one suggested alignment between employment opportunities in a respective
field and the number of available trained students.
Conversely, job quotients in excess of one demonstrated more occupational
positions than students trained for the respective position. For example, current and
projected job quotient of 117.94 and 111.87 for industrial maintenance suggested that
each year, there were an average of 114.90 industrial maintenance positions for every
student trained in that field by Kentucky Tech CTE programs. Again, this suggests a lack
of available training slots for students and a potential need for increased industrial
maintenance programs and subsequent student enrollment.
Job quotients less than one demonstrated more student enrollment and training
than the industry needs. For example, the job quotient of .47 for both current and
projected jobs in electricity suggested only .47 jobs exist for every student trained in
electricity on an annual basis. As a result, students trained in electricity in the LCADD
area may not be able to find adequate employment in the electrical field without leaving
the LCADD area.
Program Job Quotient Results
Accounting and Finance
Aggregate enrollment for the accounting programs in area technology centers
located in the Lake Cumberland Area Development District was 420. The Workforce
Kentucky database revealed 18,048 current jobs in the LCADD falling under the
accounting program technical skill set. Current jobs included filled positions reported for
the 2008 calendar year which was the most current data available in the Workforce
Kentucky Database. For the year 2018, the projected employment in the accounting
75
industry for the LCADD area was 19,322 representing a projected increase of 1,274
positions. The Workforce Kentucky Database projected annual openings in the field of
accounting of 619 for the LCADD area. These projected openings are expected to be the
result of replacements and growth.
The calculated job quotient for current accounting positions was 42.97 indicating
42.97 active accounting positions for each student trained in a CTE accounting program.
The calculated job quotient for projected accounting positions was 46.00 projecting 46.00
accounting jobs in the LCADD area for the year 2018 for every student trained in a CTE
accounting program. Current and projected job quotients for this program area indicated
a greater aggregate enrollment is needed in accounting in the LCADD. The adjusted job
quotient for accounting was 1.47 indicating 1.47 open accounting positions each year for
every student trained in a CTE accounting program. Like the current and projected job
quotients, the adjusted job quotient indicated a greater aggregate enrollment is needed in
accounting in the LCADD and program alignment was not evident.
Automotive Technology
Aggregate enrollment for the automotive technology programs in area technology
centers located in the Lake Cumberland Area Development District was 860. The
Workforce Kentucky database revealed 6,337 current jobs in the LCADD falling under
the automotive technology program technical skill set. Current jobs included filled
positions reported for the 2008 calendar year which was the most current data available in
the Workforce Kentucky Database. For the year 2018, the projected employment in the
automotive technology industry for the LCADD area was 6,305 representing a projected
loss of 32 positions. The Workforce Kentucky Database projected annual openings in the
76
field of automotive technology of 162 for the LCADD area. The projected openings are
expected to be the result of replacements and growth.
The calculated job quotient for current automotive technology positions was 7.37
indicating 7.37 active automotive technology positions for each student trained in a CTE
automotive technology program. The calculated job quotient for projected automotive
technology positions was 7.33 projecting 7.33 automotive technology jobs in the LCADD
area for the year 2018 for every student trained in a CTE automotive technology
program. Current and projected job quotients for this program area indicated a greater
aggregate enrollment was needed in automotive technology in the LCADD. The adjusted
job quotient for automotive technology was .19 indicating .19 open automotive
technology positions each year for every student trained in a CTE automotive technology
program. Unlike the current and projected job quotients, the adjusted job quotient
indicated a smaller aggregate enrollment is needed in automotive in the LCADD. All
calculated job quotients indicated program alignment was not evident.
Construction Carpentry
Aggregate enrollment for construction carpentry programs in area technology
centers located in the Lake Cumberland Area Development District was 120. The
Workforce Kentucky database revealed 8,012 current jobs in the LCADD falling under
the construction carpentry program technical skill set. Current jobs included filled
positions reported for the 2008 calendar year which was the most current data available in
the Workforce Kentucky Database. For the year 2018, the projected employment in the
construction carpentry industry for the LCADD area was 8,241 representing a projected
decrease of 229 positions. The Workforce Kentucky Database projected annual openings

77
in the field of construction carpentry of 176 for the LCADD area. The projected
openings are expected to be the result of replacements and growth.
The calculated job quotient for current construction carpentry positions was 13.35
indicating 13.35 active construction carpentry positions for each student trained in a CTE
construction carpentry program. The calculated job quotient for projected construction
carpentry positions was 13.74 projecting 13.74 construction carpentry jobs in the
LCADD area for the year 2018 for every student trained in a CTE construction carpentry
program. Current and projected job quotients for this program area indicated a greater
aggregate enrollment was needed in construction carpentry in the LCADD. The adjusted
job quotient for construction carpentry was .29 indicating .29 open construction carpentry
positions each year for every student trained in a CTE construction carpentry program.
Unlike the current and projected job quotients, the adjusted job quotient indicated a
smaller aggregate enrollment was needed in construction carpentry in the LCADD. All
calculated job quotients indicated program alignment was not evident.
Electricity
Aggregate enrollment for electricity programs in area technology centers located
in the Lake Cumberland Area Development District was 580. The Workforce Kentucky
database revealed 275 current jobs in the LCADD falling under the electricity program
technical skill set. Current jobs included filled positions reported for the 2008 calendar
year which was the most current data available in the Workforce Kentucky Database.
For the year 2018, the projected employment in the electricity industry for the LCADD
area was 272 representing a projected decrease of 3 positions. The Workforce Kentucky

78
Database projected annual openings in the field of electricity of 7 for the LCADD area.
The projected openings are expected to be the result of replacements and growth.
The calculated job quotient for current electricity positions was .47 indicating .47
active electricity positions for each student trained in a CTE electricity program. The
calculated job quotient for projected electricity positions was .47 projecting .47 electricity
jobs in the LCADD area for the year 2018 for every student trained in a CTE electricity
program. Current and projected job quotients for this program area indicated less
aggregate enrollment was needed in electricity in the LCADD. The adjusted job quotient
for electricity was .01 indicating .01open electricity positions each year for every student
trained in a CTE electricity program. Like the current and projected job quotients, the
adjusted job quotient indicated a smaller aggregate enrollment was needed in electricity
in the LCADD and program alignment was not evident.
Health Sciences
Aggregate enrollment for health sciences programs in area technology centers
located in the Lake Cumberland Area Development District was 860. The Workforce
Kentucky database revealed 8,554 current jobs in the LCADD falling under the health
sciences program technical skill set. Current jobs included filled positions reported for
the 2008 calendar year which was the most current data available in the Workforce
Kentucky Database. For the year 2018, the projected employment in the health sciences
industry for the LCADD area was 11,098 representing a projected increase of 2,544
positions. The Workforce Kentucky Database projected annual openings in the field of
health sciences of 345 for the LCADD area. The projected openings are expected to be
the result of replacements and growth.
79
The calculated job quotient for current health sciences positions was 9.94
indicating 9.94 active health sciences positions for each student trained in a CTE health
sciences program. The calculated job quotient for projected health sciences positions was
12.90 projecting 12.90 health sciences jobs in the LCADD area for the year 2018 for
every student trained in a CTE health sciences program. Current and projected job
quotients for this program area indicated that a greater aggregate enrollment was needed
in health sciences in the LCADD. The adjusted job quotient for health sciences was .40
indicating .40 open health sciences positions each year for every student trained in a CTE
health sciences program. Unlike the current and projected job quotients, the adjusted job
quotient indicated a smaller aggregate enrollment was needed in health sciences in the
LCADD. All calculated job quotients indicated program alignment was not evident.
Horticulture
Aggregate enrollment for the horticulture programs in area technology centers
located in the Lake Cumberland Area Development District was 120. The Workforce
Kentucky database revealed 2,267 current jobs in the LCADD falling under the
horticulture program technical skill set. Current jobs included filled positions reported
for the 2008 calendar year which was the most current data available in the Workforce
Kentucky Database. For the year 2018, the projected employment in the horticulture
industry for the LCADD area was 2,301 representing a projected increase of 34 positions.
The Workforce Kentucky Database projected annual openings in the field of horticulture
of 59 for the LCADD area. The projected openings are expected to be the result of
replacements and growth.
80
The calculated job quotient for current horticulture positions was 18.89 indicating
18.89 active horticulture positions for each student trained in a CTE horticulture program.
The calculated job quotient for projected horticulture positions was 19.18 projecting
19.18 horticulture jobs in the LCADD area for the year 2018 for every student trained in
a CTE horticulture program. Current and projected job quotients for this program area
indicated that a greater aggregate enrollment was needed in horticulture in the LCADD.
The adjusted job quotient for horticulture was .49 indicating .49 open horticulture
positions each year for every student trained in a CTE horticulture program. Unlike the
current and projected weighted job quotients, the adjusted job quotient indicated a
smaller aggregate enrollment was needed in horticulture in the LCADD. All calculated
job quotients indicated program alignment was not evident.
Industrial Maintenance
Aggregate enrollment for industrial maintenance programs in area technology
centers located in the Lake Cumberland Area Development District was 140. The
Workforce Kentucky database revealed 16,511 current jobs in the LCADD falling under
industrial maintenance program technical skill set. Current jobs included filled positions
reported for the 2008 calendar year which was the most current data available in the
Workforce Kentucky Database. For the year 2018, the projected employment in the
industrial maintenance industry for the LCADD area was 15,662 representing a projected
decrease of 849 positions. The Workforce Kentucky Database projected annual openings
in the field of industrial maintenance of 367 for the LCADD area. The projected
openings are expected to be the result of replacements and growth.
81
The calculated job quotient for current industrial maintenance positions was
117.94 indicating 117.94 active industrial maintenance positions for each student trained
in a CTE industrial maintenance program. The calculated job quotient for projected
industrial maintenance positions was 111.87 projecting 111.87 industrial maintenance
jobs in the LCADD area for the year 2018 for every student trained in a CTE industrial
maintenance program. Current and projected job quotients for this program area
indicated that a greater aggregate enrollment was needed in industrial maintenance in the
LCADD. The adjusted job quotient for industrial maintenance was 2.62 indicating 2.62
open industrial maintenance positions each year for every student trained in a CTE
industrial maintenance program. Like the current and projected job quotients, the
adjusted job quotient indicated a greater aggregate enrollment was needed in industrial
maintenance in the LCADD and program alignment was not evident.
Information Technology
Aggregate enrollment for information technology programs in area technology
centers located in the Lake Cumberland Area Development District was 120. The
Workforce Kentucky database revealed 2,267 current jobs in the LCADD falling under
the information technology program technical skill set. Current jobs included filled
positions reported for the 2008 calendar year which was the most current data available in
the Workforce Kentucky Database. For the year 2018, the projected employment in the
information technology industry for the LCADD area was 2,301 representing a projected
increase of 34 positions. The Workforce Kentucky Database projected annual openings
in the field of information technology of 72 for the LCADD area. The projected
openings are expected to be the result of replacements and growth.
82
The calculated job quotient for current information technology positions was
13.44 indicating 13.44 active information technology positions for each student trained in
a CTE information technology program. The calculated job quotient for projected
information technology positions was 16.22 projecting 16.22 information technology jobs
in the LCADD area for the year 2018 for every student trained in a CTE information
technology program. Current and projected job quotients for this program area indicated
that a greater aggregate enrollment was needed in information technology in the LCADD.
The adjusted job quotient for information technology was .60 indicating .60 open
information technology positions each year for every student trained in a CTE
information technology program. Unlike the current and projected job quotients, the
adjusted job quotient indicated a smaller aggregate enrollment was needed in information
technology in the LCADD. All calculated job quotients indicated program alignment
was not evident.
Machine Tool
Aggregate enrollment for machine tool programs in area technology centers
located in the Lake Cumberland Area Development District was 440. The Workforce
Kentucky database revealed 14,208 current jobs in the LCADD falling under the machine
tool program technical skill set. Current jobs include filled positions reported for the
2008 calendar year which was the most current data available in the Workforce Kentucky
Database. For the year 2018, the projected employment in the machine tool industry for
the LCADD area is 13,307 representing a projected decrease of 901 positions. The
Workforce Kentucky Database projects annual openings in the field of machine tool of
83
305 for the LCADD area. The projected openings are expected to be the result of
replacements and growth.
The calculated job quotient for current machine tool positions was 32.29
indicating 32.29 active machine tool positions for each student trained in a CTE machine
tool program. The calculated job quotient for projected machine tool positions was 30.24
projecting 30.24 machine tool jobs in the LCADD area for the year 2018 for every
student trained in a CTE machine tool program. Current and projected job quotients for
this program area indicated that a greater aggregate enrollment was needed in machine
tool in the LCADD. The adjusted job quotient for machine tool was .69 indicating .69
open machine tool positions each year for every student trained in a CTE machine tool
program. Unlike the current and projected job quotients, the adjusted job quotient
indicated a smaller aggregate enrollment was needed in machine tool in the LCADD. All
calculated job quotients indicated program alignment was not evident.
Office Technology
Aggregate enrollment for the office technology programs in area technology
centers located in the Lake Cumberland Area Development District was 600. The
Workforce Kentucky database revealed 33,714 current jobs in the LCADD falling under
the office technology program technical skill set. Current jobs included filled positions
reported for the 2008 calendar year which was the most current data available in the
Workforce Kentucky Database. For the year 2018, the projected employment in the
office technology industry for the LCADD area was 35,672 representing a projected
increase of 1,958 positions. The Workforce Kentucky Database projected annual

84
openings in the field of office technology of 1,067 for the LCADD area. The projected
openings are expected to be the result of replacements and growth.
The calculated job quotient for current office technology positions was 56.19
indicating 56.19 active office technology positions for each student trained in a CTE
office technology program. The calculated job quotient for projected office technology
positions was 59.45 projecting 59.45 office technology jobs in the LCADD area for the
year 2018 for every student trained in a CTE office technology program. Current and
projected job quotients for this program area indicated that a greater aggregate enrollment
was needed in office technology in the LCADD. The adjusted job quotient for office
technology was 1.78 indicating 1.78 open office technology positions each year for every
student trained in a CTE office technology program. Like the current and projected job
quotients, the adjusted job quotient indicated a greater aggregate enrollment was needed
in office technology in the LCADD and program alignment was not evident.
Welding
Aggregate enrollment for the welding programs in area technology centers located
in the Lake Cumberland Area Development District was 860. The Workforce Kentucky
database reveals 10,752 current jobs in the LCADD falling under the welding program
technical skill set. Current jobs included filled positions reported for the 2008 calendar
year which was the most current data available in the Workforce Kentucky Database.
For the year 2018, the projected employment in the welding industry for the LCADD
area was 10,110 representing a projected loss of 642 positions. The Workforce Kentucky
Database projects annual openings in the field of welding of 234 for the LCADD area.
The projected openings are expected to be the result of replacements and growth.
85
The calculated job quotient for current welding positions was 12.50 indicating
12.50 active welding positions for each student trained in a CTE welding program. The
calculated job quotient for projected welding positions was 11.76 projecting 11.76
welding jobs in the LCADD area for the year 2018 for every student trained in a CTE
welding program. Current and projected job quotients for this program area indicated
that a greater aggregate enrollment was needed in welding in the LCADD. The adjusted
job quotient for welding was .27 indicating .27 open welding positions each year for
every student trained in a CTE accounting program. Unlike the current and projected job
quotients, the adjusted job quotient indicated a smaller aggregate enrollment was needed
in welding in the LCADD. All calculated job quotients indicated program alignment was
not evident.
Wood Manufacturing
Aggregate enrollment for wood manufacturing programs in area technology
centers located in the Lake Cumberland Area Development District was 140. The
Workforce Kentucky database revealed 12,129 current jobs in the LCADD falling under
the wood manufacturing program technical skill set. Current jobs included filled
positions reported for the 2008 calendar year which was the most current data available in
the Workforce Kentucky Database. For the year 2018, the projected employment in the
wood manufacturing industry for the LCADD area was 11,567 representing a projected
decrease of 562 positions. The Workforce Kentucky Database projected annual openings
in the field of wood manufacturing of 263 for the LCADD area. The projected openings
are expected to be the result of replacements and growth.
86
The calculated job quotient for current wood manufacturing positions was 86.64
indicating 86.64 active wood manufacturing positions for each student trained in a CTE
wood manufacturing program. The calculated job quotient for projected wood
manufacturing positions was 82.62 projecting 82.62 construction carpentry jobs in the
LCADD area for the year 2018 for every student trained in a CTE wood manufacturing
program. Current and projected job quotients for this program area indicated that a
greater aggregate enrollment was needed in wood manufacturing in the LCADD. The
adjusted job quotient for wood manufacturing was 1.88 indicating 1.88 open wood
manufacturing positions each year for every student trained in a CTE wood
manufacturing program. Like the current and projected job quotients, the adjusted job
quotient indicated a greater aggregate enrollment was needed in wood manufacturing in
the LCADD and program alignment was not evident.
Phase 4
Phase four of the study compiled categorical soft skills gathered from respective
area skills standards documents provided through KDE’s website. Twelve program areas
were included in the study’s sample. However, skills standards were designed by career
cluster resulting in all twelve program areas falling under the heading of 9 career clusters.
The manufacturing career cluster includes welding, machine tool, and industrial
maintenance.
Table 6 reveals the importance of a positive work ethic, effective communication,
and adequate workplace relationships as these characteristics were included in the skills
standards for all program areas in the sample. Likewise, technology and information
management along with critical thinking and lifelong learning skills, also included in

87
multiple clusters, demonstrated their relevance to required soft skills. Workplace
diversity and workplace attire were only listed in two program areas, yet still represented
employability skills in more than a single category which increased their relevance as soft
skills.
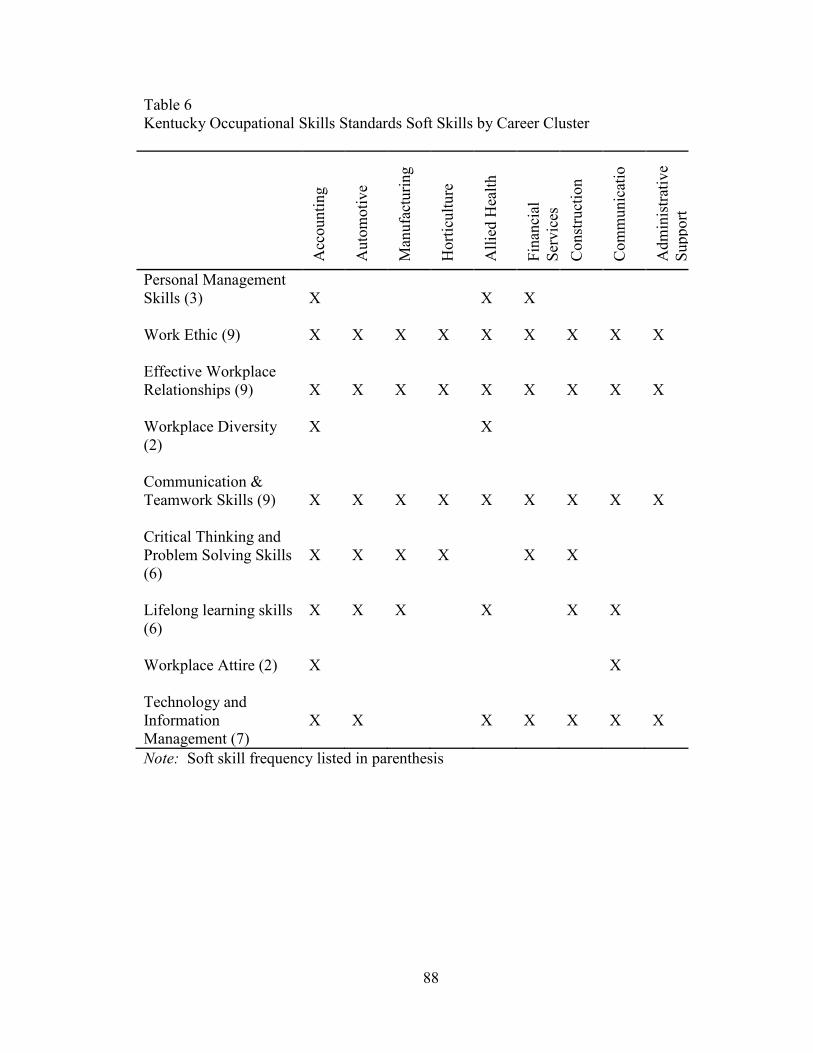
88
Table 6
Kentucky Occupational Skills Standards Soft Skills by Career Cluster
Acc
ounti
ng
Auto
moti
ve
Tec
hnolo
gy
M
anufa
cturi
ng
Hort
icult
ure
All
ied H
ealt
h
Fin
anci
al
Ser
vic
es
Const
ruct
ion
carp
entr
y
Com
munic
atio
ns
Adm
inis
trat
ive
Support
Personal Management
Skills (3)
X
X
X
Work Ethic (9)
X X X X X X X X X
Effective Workplace
Relationships (9)
X
X
X
X
X
X
X
X
X
Workplace Diversity
(2)
X X
Communication &
Teamwork Skills (9)
X
X
X
X
X
X
X
X
X
Critical Thinking and
Problem Solving Skills
(6)
X
X
X
X
X
X
Lifelong learning skills
(6)
X X X X X X
Workplace Attire (2)
X X
Technology and
Information
Management (7)
X
X
X
X
X
X
X
Note: Soft skill frequency listed in parenthesis

89
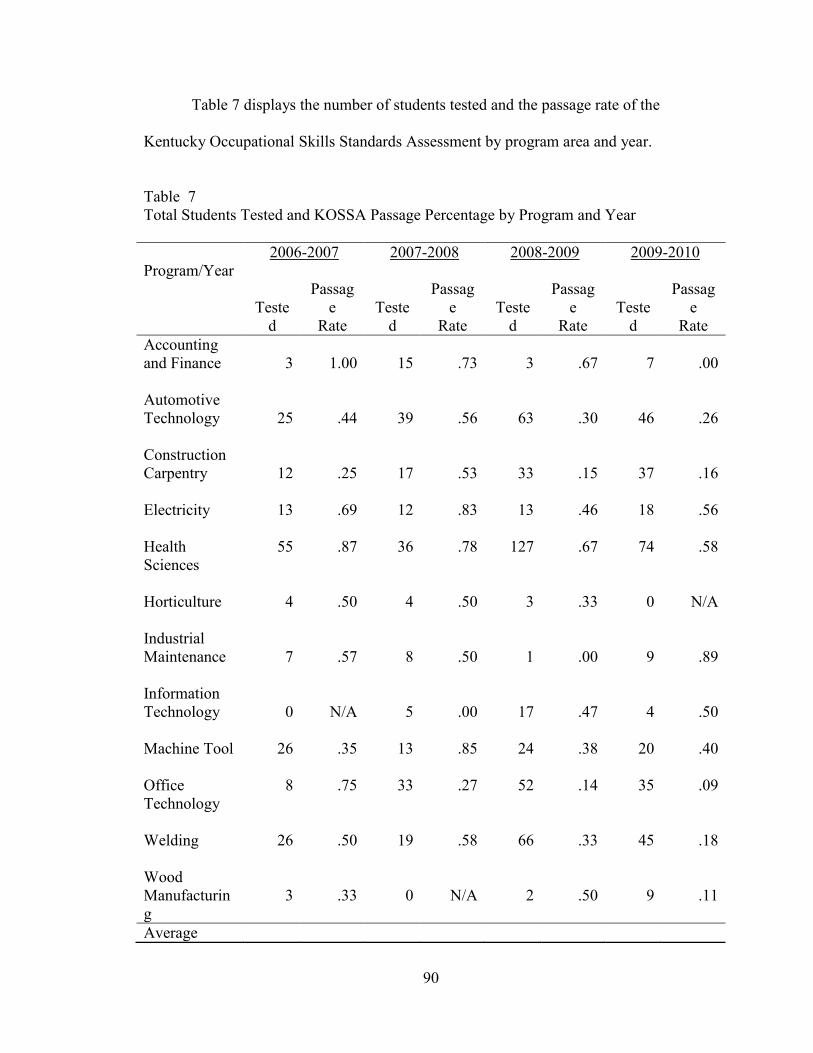
90
Table 7 displays the number of students tested and the passage rate of the
Kentucky Occupational Skills Standards Assessment by program area and year.
Table 7
Total Students Tested and KOSSA Passage Percentage by Program and Year
Program/Year
2006-2007 2007-2008 2008-2009 2009-2010
Teste
d
Passag
e
Rate
Teste
d
Passag
e
Rate
Teste
d
Passag
e
Rate
Teste
d
Passag
e
Rate
Accounting
and Finance
3
1.00
15
.73
3
.67
7
.00
Automotive
Technology
25
.44
39
.56
63
.30
46
.26
Construction
Carpentry
12
.25
17
.53
33
.15
37
.16
Electricity
13 .69 12 .83 13 .46 18 .56
Health
Sciences
55 .87 36 .78 127 .67 74 .58
Horticulture
4 .50 4 .50 3 .33 0 N/A
Industrial
Maintenance
7
.57
8
.50
1
.00
9
.89
Information
Technology
0
N/A
5
.00
17
.47
4
.50
Machine Tool
26 .35 13 .85 24 .38 20 .40
Office
Technology
8 .75 33 .27 52 .14 35 .09
Welding
26 .50 19 .58 66 .33 45 .18
Wood
Manufacturin
g
3
.33
0
N/A
2
.50
9
.11
Average

91
Passage Rate 182 .60 201 .56 404 .37 304 .34
Note: N/A denotes none tested. Slots where students were not tested (N/A) were not
included in overall averages.
Accounting and Finance
The Kentucky Occupational Skills Standards passage rate for accounting and
finance for the four years reported was highest during the 2006-2007 school year with
100 percent of the 3 students tested passing the assessment. The passage rate was lowest
during the 2009-2010 school year with none of the 7 students tested passing the
assessment. Passage rates were above 50 percent for three of the reported years with
rates declining each subsequent year. This indicated accounting and finance students
taking the assessment were demonstrating proficiency in soft skills with a decline in
continued growth towards proficiency.
Automotive Technology
The Kentucky Occupational Skills Standards passage rate for automotive
technology for the four years reported was highest during the 2007-2008 school year with
56 percent of the 39 students tested passing the assessment. The passage rate was lowest
during the 2009-2010 school year with 26 percent of the 46 students tested passing the
assessment. Passage rates were above 50 percent for one year of the reported years and
declined during the two most recent years. This indicated automotive students taking the
assessment were not demonstrating proficiency in soft skills or movement towards
proficiency.
Construction Carpentry
92
The Kentucky Occupational Skills Standards passage rate for construction
carpentry for the four years reported was highest during the 2007-2008 school year with
53 percent of the 17 students tested passing the assessment. The passage rate was lowest
during the 2008-2009 school year with 15 percent of the 33 students tested passing the
assessment. The passage rate declined 66 percent from a pass rate of 53 percent in 2007-
2008 to 15 and 16 percent for the most recent school years. Passage rates were above 50
percent for one year of the reported years. This indicated construction carpentry students
taking the assessment are not demonstrating proficiency in soft skills and no movement
towards continued proficiency.
Electricity
The Kentucky Occupational Skills Standards passage rate for electrical
technology for the four years reported was highest during the 2007-2008 school year with
83 percent of the 12 students tested passing the assessment. The passage rate was lowest
during the 2008-2009 school year with 46 percent of the 13 students tested passing the
assessment. The passage rate declined 37 percent from the 2007-2008 rate of 83 percent
to the 2008-2009 rate of 46 percent and increased to 56 percent for the most recent school
year. Passage rates were above 50 percent for three of the reported years. This indicated
electrical technology students taking the assessment were demonstrating proficiency in
soft skills and continued growth towards proficiency.
Health Sciences
The Kentucky Occupational Skills Standards passage rate for health sciences for
the four years reported was highest during the 2006-2007 school year with 87 percent of
the 55 students tested passing the assessment. The passage rate was lowest during the
93
2009-2010 school year with 58 percent of the 74 students tested passing the assessment.
Passage rates were above 50 percent for all of the reported years. This indicated health
sciences students were demonstrating proficiency in soft skills with a decline in
continued growth towards proficiency.
Horticulture
The Kentucky Occupational Skills Standards passage rate for horticulture for the
four years reported was highest during the 2006-2007 and 2007-2008 school years with
50 percent of the 4 students tested each year passing the assessment. The passage rate
was lowest during the 2008-2009 school year with 33 percent of the 3 students tested
passing the assessment. Horticulture is only offered in one ATC in the LCADD—the
Casey County Area Technology Center. The program did not have any students eligible
to take the assessment during the 2009-2010 school year. Passage rates were 50 percent
for the first two of the reported years and declined in the following year. This indicated
horticulture students taking the assessment did not demonstrate proficiency in soft skills
or continued growth towards proficiency.
Industrial Maintenance
The Kentucky Occupational Skills Standards passage rate for industrial
maintenance for the four years reported was highest during the 2009-2010 school year
with 89 percent of the 9 students tested passing the assessment. The passage rate was
lowest during the 2008-2009 school year with the single student tested not passing the
assessment. Passage rates were at or above 50 percent for three of the reported years.
This indicated industrial maintenance students taking the assessment were demonstrating
proficiency in soft skills and movement towards proficiency.
94
Information Technology
Data for information technology programs was limited to three years.
Information technology was only offered in one ATC in the LCADD—the Pulaski
County Area Technology Center. Likewise, the Pulaski County ATC began operation
with the 2006-2007 school year and did not have students eligible for assessment until
2007-2008. The Kentucky Occupational Skills Standards passage rate for information
technology for the three years reported was highest during the 2009-2010 school year
with 50 percent of the 4 students tested passing the assessment. The passage rate was
lowest during the 2007-2008 school year with none of the 5 students tested passing the
assessment. Passage rates were 50 percent for 1 of the reported years and increased in
the most recent two school years. This indicated information technology students taking
the assessment were not demonstrating proficiency in soft skills and demonstrated only a
slight increase in continued growth towards proficiency.
Machine Tool
The Kentucky Occupational Skills Standards passage rate for machine tool for the
four years reported was highest during the 2007-2008 school year with 85 percent of the
13 students tested passing the assessment. The passage rate was lowest during the 2006-
2007 school year with 35 percent of the 26 students tested passing the assessment.
Passage rates were below 50 percent for three of the reported years and have fluctuated
with increases in the most recent two school years. This indicated machine tool students
taking the assessment were not demonstrating proficiency in soft skills, but showed slight
movement towards proficiency.
Office Technology
95
The Kentucky Occupational Skills Standards passage rate for office technology
for the four years reported was highest during the 2006-2007 school year with 75 percent
of the 8 students tested passing the assessment. The passage rate was lowest during the
2009-2010 school year with 9 percent of the 35 students tested passing the assessment.
Passage rates were 50 percent or above for the first reported year and were below 50
percent and declining for the following three years. This indicated office technology
students taking the assessment were not demonstrating proficiency in soft skills and
showed a decline in continued growth towards proficiency.
Welding
The Kentucky Occupational Skills Standards passage rate for welding for the four
years reported was highest during the 2007-2008 school year with 58 percent of the 19
students tested passing the assessment. The passage rate was lowest during the 2009-
2010 school year with 18 percent of the 45 students tested passing the assessment.
Passage rates were 50 percent or above for two of the reported years and declined in the
most recent two school years. This indicated welding students taking the assessment
were not demonstrating proficiency in soft skills, and showed a decline in continued
growth towards proficiency.
Wood Manufacturing
The Kentucky Occupational Skills Standards passage rate for wood
manufacturing for the four years reported was highest during the 2008-2009 school year
with 50 percent of the 2 students tested passing the assessment. The passage rate was
lowest during the 2009-2010 school year with 11 percent of the 9 students tested passing
the assessment. Wood manufacturing was only offered in one ATC in the LCADD—the
96
Green County Area Technology Center. The program did not have any students eligible
to take the assessment during the 2007-2008 school year. Passage rates were 50 percent
one of the reported years and declined in the most recent reported school year. This
indicated wood manufacturing students taking the assessment were not demonstrating
proficiency in soft skills with a decline in continued growth towards proficiency.
Summary
This study’s findings demonstrated whether or not area technology center
programs located in the Lake Cumberland Area Development District were aligned with
business and industry. As well, findings revealed whether or not CTE students
demonstrated proficiency in 21st century soft skills.
Job quotients were used to determine program alignment. Job quotients
represented the number of jobs available for students trained within a given program area.
This study utilized three different job quotients to provide increased reliability. The first
job quotient utilized the number of jobs within a given industry as the numerator and the
aggregate possible program enrollment as the denominator. The second job quotient
utilized projected jobs within a given industry as the numerator and the aggregate
possible program enrollment as the denominator. The projected jobs were obtained from
the Workforce Kentucky Database and provided labor force projections for the year
2018. The final job quotient utilized projected annual openings as the numerator in place
of the number of filled jobs within the industry and the aggregate possible program
enrollment as the denominator. This quotient provided the most realistic view of
alignment as it was based on job openings that students can obtain rather than the total
employed labor force for which jobs were not available.
97
Findings indicate none of the program offerings in the Kentucky Tech Area
Technology Centers in the Lake Cumberland Area Development District were aligned
with the current or projected needs of the area’s business and industry. Current and
projected job quotients of four programs were in agreement with adjusted job quotients in
that all quotients were above one. Current and projected job quotients from one program
were in agreement with the adjusted job quotient in that all were below one. Overall,
current and projected job quotients from five programs were in agreement with adjusted
job quotients. Current and projected job quotients of seven programs were not consistent
with adjusted quotients.
Findings from the analysis of the passage rate of the Kentucky Occupational
Skills Standards Assessment indicated students in 4 of the 12 programs offered in
Kentucky Tech Area Technology Centers in the LCADD demonstrated proficiency in
21st century soft skills.
98
CHAPTER V
CONCLUSIONS
This study’s primary focus was to determine whether alignment between career
and technical education programs in rural Kentucky were aligned with local business and
industry. In planning the study, it became evident it is critical for CTE students to
demonstrate 21st century soft skills. As a result, a question about students’ soft skills was
included in the study. The purpose of this study is to assist CTE stakeholders in
decisions regarding CTE programs and instruction.
Historical insight relates periods of intense focus on career and technical
education most recently in the modern age with the industrial revolution during the early
20th
century and the developing age of technology during the latter 20th
century. Despite
recent economic downturns, the need for a technically skilled workforce is critical as the
United States strives to remain competitive in a growing global economy.
In 1917, development of Smith-Hughes Act began the federal government’s
involvement in the continuance and funding of CTE. Throughout the course of history, a
multitude of influential people have impacted CTE legislation including the most
prominent individual from Kentucky, Carl D. Perkins. To honor Congressman Perkins’
work in vocational education, the 1963 Vocational Education Act was changed to the
Carl D. Perkins Vocational Education Act upon his death.
In Kentucky, CTE is available to students in CTE programs provided under the
direction of the Kentucky Department of Education and the Office of Career and
Technical Education (OCTE). CTE instruction provided through OCTE is referred to as
99
the Kentucky Tech system and is available through 54 area technology centers
throughout the state. Regardless of other policy initiatives, funding issues are at the
forefront of CTE policy considerations.
The benefits of CTE are far reaching to both employers and employees.
Kentucky employers benefit from the availability of a highly skilled workforce while
students benefit from completing planned CTE programs that develop necessary skills
enabling them to find employment. CTE instruction provides students’ real world and
hands on instruction which often leads to increased educational attainment and post-
secondary endeavors.
This study utilized a modified version of Gary Becker’s Human Capital Theory
which acknowledges the correlation between training and education to human worth.
Becker suggests increased knowledge and skill sets lead to increased wages and industry
productivity. The theory suggests that better education leads to greater wealth of
employees and employers as well as nations.
Embracing Becker’s theory, this study analyzed the career and technical
educational alignment between Kentucky Tech CTE programs and business and industry
labor needs in the Lake Cumberland Area Development District. Alignment results in an
adequate workforce available for employment as well as the ability of the trained
workforce to find employment. When alignment is not present, business and industry
struggle to find competent employees and may result in the loss of jobs in the given
areas. Likewise, when trained workers are unable to find positions in their local
communities, they are forced to seek employment elsewhere often resulting in relocation
and a tax base loss for the home community.
100
This study addressed program alignment in Kentucky’s Lake Cumberland Area
Development District (LCADD) which encompasses several counties within the
Appalachian region which historically struggles to develop and maintain adequate
business and industry opportunities for residents. This study also addressed the ability of
CTE to adequately instill employment skills necessary for success in the current century.
The following research questions were developed to address these issues:
1. Are career and technical programs offered by Kentucky Tech’s area
technology centers in central Kentucky aligned with current labor needs in
counties served by the LCADD?
2. Are career and technical programs offered by Kentucky Tech’s area
technology centers in central Kentucky aligned with future labor needs in
counties served by the LCADD?
3. Are CTE preparatory students demonstrating proficiency in 21st century soft
skills required by employers?
The relevancy of this study addressed the lack of research in overall CTE program
alignment in Kentucky and more so in Appalachia. As noted throughout the study, the
researcher found a similar study similar in nature conducted by Robert Carreira in
Cochise County, Arizona. Carreira’s study focused on alignment between Tech Prep
initiatives and labor needs of business and industry. As previously discussed, Tech Prep
designation for CTE programs requires students to complete two years of CTE at the
secondary level and two additional years at the post-secondary level leading to at least a
two year post-secondary degree (Kentucky Department of Education (KDE), 2009). At
the time of this study, Kentucky did not participate in the Tech Prep initiative. As a
101
result, this study focused on overall program offerings within the Kentucky Tech system
located in the LCADD. Also divergent from Carreira, this study included analysis of 21st
century soft skills due to the emergence of their importance in today’s business and
industry.
Research for this study took place in four stages. Stage one involved a
compilation of programs and enrollment capacities offered under Kentucky Tech Area
Technology Centers located in the LCADD. The second phase consisted of compiling
current and future employment data for respective programs. Data for the second phase
came from state and national sponsored databases. The third phase of research included
calculation of job quotients based on current and projected labor markets. During
calculation, the researcher determined it necessary to include a quotient utilizing the
projected number of annual job openings in relation to the program aggregate enrollment.
This quotient was not included in the original methods section of the study, but was
explained in Chapter IV. This quotient’s relevance is based on the fact that current and
future labor markets represent filled labor positions and do not take into consideration the
ability of students entering the work force to obtain open positions. Job quotients,
introduced in Carreira’s study, were used as a measure of alignment between CTE
programs and labor needs. However, due to the rural nature and potentially small size of
the study’s population, this study utilized job quotients as the sole measure of program
alignment.
The final phase of research included organization and analysis of passage rates
from the Kentucky Occupational Skills Standards Assessment for which data was
102
available through the Technical Education Database System (TEDS) database, to analyze
the student level of proficiency in 21st century soft skills.
Interpretation of Findings
Program Alignment
Job quotients calculated in the study did not reveal a job quotient of one for either
current or projected labor markets. Likewise, job quotients calculated utilizing projected
job openings did not reveal program alignment. The job quotients produced the answer
to research questions one and two:
1. Are career and technical programs offered by Kentucky Tech’s area
technology centers in central Kentucky aligned with current labor needs in
counties served by the LCADD?
2. Are career and technical programs offered by Kentucky Tech’s area
technology centers in central Kentucky aligned with future labor needs in
counties served by the LCADD?
The answer to both questions was career and technical programs offered by Kentucky
Tech’s area technology centers were not aligned with either current or future labor needs
in counties served by the LCADD.
Job quotients for this study revealed dichotomies among programs and the
potential number of jobs available to students. For example, industrial maintenance
quotients were 117.94 and 111.87 for current and projected jobs in the LCADD area for
each student offered access to CTE industrial maintenance. Adjusted job quotients were
calculated using the Workforce Kentucky Databases which projected annual job openings
and a job quotient of 2.62 indicated there would be more annual openings for every
103
student trained in industrial maintenance. Although the adjusted quotient was in
agreement with current and projected quotients in that students with industrial
maintenance skills should have adequate opportunity for employment, the dichotomies
between the quotients raised a question regarding an appropriate number of enrollment
spots.
Job quotients for industrial maintenance were the largest of all computed job
quotients indicating available enrollment for this program should be large in relation to
other program areas. However, industrial maintenance has next to the lowest enrollment
capacity for programs within LCADD programs and is located in one area technology
center within the region.
Conversely, machine tool job quotients showed 32.29 and 30.24 current and
projected machine tool jobs in the LCADD for each student offered access to CTE
machine tool instruction indicating the need for additional students to receive training in
machine tool. However, the adjusted job quotient for machine tool was .69 which
indicated students leaving high school with machine tool skills would have difficulty
obtaining employment in the field of machine tool.
Yet another unique situation was found in electricity where current, projected, and
adjusted job quotients reveal that not a single employment position is or will be available
for students. Current and projected job quotients were both .47 and the adjusted job
quotient was .01. However, electricity programs are included in four of the six sample
area technology centers with an aggregate enrollment capacity of 580.
Understanding of job quotients is critical for this study. Current and projected job
quotients as well as adjusted job quotients for all programs were either above or below
104
one indicating an absence of alignment. Also, 7 of the 12 adjusted job quotients were not
in agreement with current and projected quotients indicating great disparities between
total program work forces and projected available jobs for students reiterating the need
for further study.
Disparities between job quotients may be the result of multiple external variables.
First, the age of the current workforce directly impacts the number of annual openings as
an aged current workforce could result in greater yearly attrition from retirements
creating greater annual openings and a younger current workforce could mean fewer
annual openings. Projected increases and decreases in industries due to growth or decline
of the industry would also impact annual openings. It is important to note there are
difficulties involved in workforce projections. Despite potential inaccuracies of
projections, this study relies on publicly available data generated by the state of
Kentucky. Irregularities should be analyzed by program area and take into consideration
external variables.
The lack of prior research in this area did not provide a basis for establishing
margins of error in alignment determination. As discussed, this study’s definition of
program alignment is based on a job quotient of one. It is understood job quotients of
one would be rare. Further study should include acceptable ranges of job quotients that
would meet both the labor needs of business and industry as well as the need for students
to find employment within their local community.
105
21st Century Soft Skills
Analysis of Kentucky Occupational Skills Standard passage rates for the past four
years did not indicate consistent growth in student proficiency. These findings provided
an answer for research question three:
3. Are CTE preparatory students demonstrating proficiency in 21st century soft
skills required by employers?
As a result of the findings demonstrating an absence of consistent student proficiency,
CTE preparatory students are not demonstrating proficiency in 21st century soft skills
required by employers.
Ever changing workforce dynamics require employees to demonstrate a wide
variety of employability skills above and beyond standard technical skills. Literature
bears out the need for soft skills, but does not disclose a master set of skills accepted for
all jobs. As well, at the time of this study, Kentucky does not officially recognize a
widely accepted measure of soft skills. To answer the research question, a compilation of
common soft skills encompassing Kentucky career clusters associated with the LCADD
region was required. Table 6 represents the assembly and frequency of soft skills found
within the skills standards. Data also demonstrated soft skills are embedded within the
Kentucky Occupational Skills Standards and validated measurement of the Kentucky
Occupational Skills Standards Assessment to answer research question three.
Findings for the 2009-2010 school year showed passage rates for the Kentucky
Occupational Skills Standards Assessment from 4 out of 12 programs were above 50
percent. Also, no programs demonstrated sustained growth from the 2006-2007 school
year which represented the first year data was available from the Perkins data base. In
106
fact, the accounting and finance program displayed a direct opposite trend. This program
had 100 percent passage during the 2006-2007 school year and decreased each of the
following years to a 0 percent passage rate during the 2009-2010 school year. During the
four years analyzed for this study, all programs demonstrated passage rates above 50
percent for at least one year. However, the lack of consistency and low overall increases
reinforce the lack of demonstrated proficiency.
Findings from the analysis demonstrate a lack of reliable measurement due to
assessment fluctuations. During the 2006-2007 and 2007-2008 cycles, students taking
the assessment were selected by teachers. These students most likely were selected based
on their likeliness to pass the exam. This assumption is demonstrated in the overall
passage rates reported in Table 7. Likewise, teacher selection lowered the total number
of students assessed which most likely skewed passage results. The assessment cycle of
2008-2009, the first year teachers were not permitted to select students to be tested, 203
more students were assessed compared to 2007-2008. The same assessment cycles saw
the average overall passage rate decrease from 56 percent to 37 percent respectively.
Limitations of Research
Limitations to this study follow:
This study encompassed the Lake Cumberland Area Development District
spanning rural south central Kentucky. The rural Appalachian setting included a
limited business and industry set impacting job quotient outcomes. In a larger
sample area, job quotients could reveal different outcomes due to a larger labor
force and potential job openings.
107
This study’s sample did not include an analysis of technical programs and
students at the post-secondary level which also impact labor forces within the
LCADD.
This study was conducted assuming full enrollment in the ATC’s and full
program completion by students. However, this assumption also serves as a
limitation to the study as students often enroll in programs for reasons other than
career choice.
The study discusses how misalignment of programs to relative business and
industry results may result in a trained workforce moving to other communities.
However, the scope of this study did not include analysis of the impact of this
scenario on the LCADD.
This study utilized job quotients as the sole measure of program alignment. Job
quotients are a modification of widely accepted location quotients and research
demonstrates increased reliability when used with confidence intervals (Beyene &
Moineddin, 2005). This study did not include confidence intervals as a
comparison was not made between the sample area and potential larger areas.
This study analyzed the LCADD as a whole and did not take into account
individual characteristics of each county located within the district. This study
assumed employment opportunities in one county within the population area was
logistically accessible to all students residing in the LCADD. It should be noted
commute times from edge to edge of the LCADD could infringe upon
employment opportunities forcing students to look for employment in
surrounding counties located in other area development districts.
108
The minimal data found for research question three limited the relevance and
reliability of data analysis. Data for the research was only available for four
school years. Likewise, during the first two years of available data, instructors
selected the best students to sit for the Kentucky Occupational Skills Standards
Assessment which most likely skewed results.
Implications and Future Research
Research demonstrates CTE is a valuable tool in training a highly skilled
workforce and is beneficial to local business and industry by providing highly skilled
laborers. However, findings and analysis from this study reveal programs in the LCADD
are not aligned with the local business and industry. As a result, it is probable graduates
from the LCADD area entering the workforce will be forced to leave the area in order to
find employment
This scenario can be devastating to local communities. Most often, new
industries locate in communities where an adequate workforce is assured and will seek
other locales when labor is not available. As a result, the community loses needed tax
revenue and established businesses in the community do not benefit from a new customer
base. It is a cyclical process that can eventually erode a local community. The
aforementioned implication is directly tied to the Human Capital Theory upon which this
study is based. The HCT suggests individuals seek to maximize their wealth and will
acquire needed education for that end. Likewise, business and industry benefit from an
educated workforce as it provides a workforce possessing required skills for the
respective industry.
109
It is important to note that program misalignment resulting in a job quotient under
one and subsequent overabundance of available employees may be desirable for business
and industry. This scenario increases competition among prospective employees and
provides business and industry greater opportunity to select the best overall employee.
Conversely, misalignment resulting in a job quotient over one and subsequent
overabundance of available positions may be desirable for prospective employees. This
situation ensures available jobs for the locally trained workforce and may work to
increase population of the respective community as available workers from other areas
may relocate in relation to available jobs. Future research should include investigation of
acceptable deviances from a job quotient of one which is satisfactory to both industry and
prospective employees.
As indicated in the findings, adjusted job quotients were compiled utilizing labor
market projected annual openings while current and projected quotients utilized existing
and projected labor markets without consideration of hiring needs. This researcher
believes adjusted job quotients are a better measure of labor needs as they consider
employment opportunities for trained workers rather than the total workers already
employed. Users of this study’s findings should determine which quotient is more
applicable to their needs. As mentioned in the study, accurate projections are difficult.
Labor market evaluation should include demographic analysis of the specific labor
market as well as employment trends which might impact current and future labor needs.
Again, this study focused on a rural Appalachian region in Kentucky. However,
this study’s rationale could be applied nationally. From the bottom up, we are local
communities coming together as states, and individual states coming together as a nation.
110
Our country’s success and ability to compete globally is ultimately contingent upon the
success of our local communities. Community economic success is dependent upon its
ability to sustain and recruit business and industry. In turn, sustainment and recruitment
of industry is dependent upon the community’s ability to offer a workforce skilled in both
technical and soft skills. Future research should be applied at both the state and national
levels.
Likewise, at the local level, future research should include specific counties to
better assist local governments in business recruitment. However, before county research
can be conducted, reliable data sets must be made available. While it is understood
national and state data is not often disaggregated to that level due to low sample size, it
would be beneficial for local governments to conduct research and collect data reportable
at the local level.
The review of literature demonstrated an absence of a widely accepted
measurement for soft skills. As this study emphasized the importance of soft skills for
worker success in the 21st century, future research is warranted to better define soft skills
both categorically and industry specific. Likewise, research should investigate reliable
and relevant soft skill measurement instruments emphasizing the need for data collection
and ensured proficiency.
Despite the fact that program alignment is critical for overall health of the
community and business and industry, the expense of changing programs within an ATC
can be exorbitant. When factoring in equipment and supply costs of any given CTE
program, establishment of a new program could entail hundreds of thousands of dollars.
As mentioned, CTE struggles for adequate funding. This lack of funding complicates
111
any efforts to realign programs through establishment and termination of programs. As a
result, research should be conducted to assist decision makers when program alignment is
not apparent.
The review of literature reveals diverse oversight of career and technical
education in Kentucky as programs may be embedded in traditional secondary
institutions, stated owned centers, or locally owned centers. This study focused on
alignment within state owned area technology centers. However, program alignment
issues apply to all career and technical education programs regardless of fiscal oversight.
Future research should consider fiscal agents of all programs as barriers to program
alignment may be unique to each venue.
It should also be considered that career and technical education programs are
selected by students based on their individual needs and career goals. Considering this, it
is possible that even if program alignment were evident, respective labor forces would
not increase due to student non-enrollment. For this reason, future research should
include analysis of student advisement for careers including but not limited to student
access to career pathway forms as well as career coaches knowledgeable in community
labor needs.
Conclusion
As the 21st century unfolds, it is imperative for education to adequately prepare
students for workplace success. The United States needs skilled workers proficient in not
only technical skills, but critical thinking and problem solving skills that will enable
workers to adjust to ever changing 21st century needs. To prepare for the 21
st century,
career and technical education should be included not only in education’s immediate
112
future, but long-term vision and goals. Despite overwhelming evidence of CTE as an
integral component of the educational process, it is critical for policy and decision makers
to understand the relevance of CTE in promoting and increasing the well being of
respective communities. Embracing the Human Capital Theory, solid CTE programs can
increase the presence of business and industry in communities which increases the ability
of community members to find sustaining work, and finally, an increased quality of life
within the community.
To ensure CTE continues to adequately prepare students for the 21st century, a
concentrated effort must be made to reinforce measureable soft skills. Although
embedded within ATC program curriculum, changes need to be made. First, Kentucky
Occupational Skills Standards should be reevaluated to reflect changes in hard and soft
skill since their inception. Too, a formal system of soft skill measurement should be
adopted. As noted, this is a difficult task in that soft skills are not identical across
industries. Other assessments should be investigated that might better measure student
attainment of soft skills.
Literature attests that lack of funding is an issue for sound career and technical
education programs. In order for CTE to fully achieve its potential in training an
adequate workforce which subsequently benefits the overall local community, it is critical
for legislatures at both the national and state level to guarantee adequate funding. This is
increasingly relevant considering the projected lack of skilled workers for the future.
Funding issues are two sided. First, lack of sufficient operating funds inhibits the
ability of CTE to provide students needed hands-on training and many of the operational
requirements of CTE programs are substantial. Supply costs for CTE programs have
113
increased with some programs experiencing above average increases. As an example, the
price of copper has surged in recent years greatly impacting the supply costs of electrical
programs. Secondly, funding for new program establishment is virtually nonexistent in
this economy. As a result, programs that are not aligned with local business and industry
are likely to remain in place thus preventing CTE from training needed labor outside the
scope of the respective program. This scenario is directly tied to the HCT and is the start
of the downward spiral of local community growth and sustainment. Although, funding
issues were not the focus of this study, it is evident CTE funding plays a major role in the
United States’ ability to remain competitive in a global market and should be prioritized
in a national budget.
The Human Capital Theory is based on the desire to improve one’s situation. As
discussed, arguments exist that not all people are driven by increased wealth and status
(Gilead, 2009; Baptiste, 2001). It is also argued that some people are held captive by
their socio-economic situation and not able to achieve increased education and training
required for socio-economic improvement (Baptiste, 2001). While these disputes may
have credence, this researcher believes in the Human Capital Theory premise that
everyone wants a better life and will take advantage of available and accessible resources
for achievement. This study shows CTE is a venue for a means to the end both at the
secondary and post-secondary levels. To ensure continued resources for citizens and
business and industry and the desired outcomes from the Human Capital Theory,
continued research and support of CTE must remain at the forefront of not only
educators, but legislators and all community members.
114
REFERENCES
Anderson-Cook, C. (2004). Beyond Sample Size. Quality Progress, 37(12), 88-90.
Retrieved from EBSCOhost.
ARC Conference Focuses on Jobs and Skills for the Future. (1983). Appalachia, 16(3-5),
1-25. Retrieved from EBSCOhost.
Appalachian Regional Commission (ARC). (2010). Counties in Appalachia. Retrieved
from http://www.arc.gov/counties
Arnold, W. (1965). Developing a Total, Balanced Program of Vocational and Technical
Education. NASSP Bulletin 1965, 49(142), 142-153. Retrieved from http:// bul.
sagepub.com.libproxy.eku.edu/content/49/301/142.full.pdf+html
Association for Career and Technical Education (ACTE). (2010). Carl D. Perkins Act
Implementation. Background Information. Retrieved from http://www.acteonline.
org/perkins.aspx#background
Association for Career and Technical Education (ACTE). (2011a). Perkins Poll #5:
Secondary Accountability Measures. Retrieved from http://cte.ed.gov/
accountabilitycoreindicators.cfm
Association for Career and Technical Education (ACTE). (2011b). CTE Information.
Retrieved from http://www.acteonline.org/cte_info.aspx
Association for Career and Technical Education (ACTE). (2011c). Kentucky CTE State
Profile. Retrieved from http://www.acteonline.org/content.aspx?id=2266
Babcock, L., Benedict, M., & Engberg, J. (1998). Pittsburgh labor market adjustments in
the 1980s: Who gained and who lost?. Journal of Urban Affairs, 20(1), 53.
Retrieved from Academic Search Premier database.
115
Baker, D. (2009). The educational transformation of work: towards a new synthesis.
Journal of Education & Work, 22(3), 163-191. doi:10.1080/13639080902957822
Baptiste, I. (2001). Educating Lone Wolves: Pedagogical Implications of Human Capital
Theory. Adult Education Quarterly, 51(3), 184. Retrieved from EBSCOhost.
Barton, P. (2008). How Many College Graduates Does the U.S. Labor Force Really
Need?. Change, 40(1), 16-21. Retrieved from Academic Search Premier database.
Baumann, R. (2006). Changes in the Appalachian Wage Gap, 1970 to 2000. Growth &
Change, 37(3), 416-443. doi:10.1111/j.1468-2257.2006.00330.x
Beyene, J., & Moineddin, R. (2005). Methods for confidence interval estimation of a
ratio parameter with application to location quotients. BMC Medical Research
Methodology, 532-537. doi:10.1186/1471-2288-5-32
Bennett, T. M. (2006). Defining the importance of employability skills in career/technical
education. Ed.D. dissertation, Auburn University, United States -- Alabama. from
ProQuest Dissertations & Theses: Full Text database. (Publication No. AAT
3245459).
Becker, G. (1975). Human Capital: A Theoretical and Empirical Analysis, with Special
Reference to Education, 2nd
ed. National Bureau of Economic Research.
Retrieved from http://www.nber.org/books/beck75-1
Becker, G. (1993). "Human Capital." The Concise Encyclopedia of Economics. 1993.
Library of Economics and Liberty. Retrieved from: http://www.econlib.org/
library/Enc1/HumanCapital.html
116
Black, R. W. (2009). English-Language Learners, Fan Communities, and 21st-Century
Skills. Journal of Adolescent & Adult Literacy, 52(8), 688-697. Retrieved from
EBSCOhost.
Bottoms, G. (2006). A Vision Of The 21st Century. Techniques: Connecting Education &
Careers, 81(5), 14-16. Retrieved from EBSCOhost.
Brown, D. (2007). The academic effect of career technical business-marketing education
on students in a north Alabama high school. Ed.D. dissertation, Tennessee State
University, United States -- Tennessee. Retrieved from ProQuest Dissertations &
Theses: Full Text database. (Publication No. AAT 3290731)
CBS News, (n.d.). 1980’s timeline. Retrieved from http://www.cbsnews.com/elements
/2008 /11/12/earlyshow /timeline4596685.shtml
Career Classes Make a Comeback. (2007). Techniques: Connecting Education & Careers,
82(5), 54. Retrieved from EBSCOhost.
Carl D. Perkins Career and Technical Education Improvement Act of 2006 § 250, 20
U.S.C. § 2301 (2006).
Carreira, Robert. (2008). Aligning tech prep programs with current and future labor
market needs. Public Policy and Administration). ProQuest Dissertations and
Theses, Retrieved from http://search.proquest.com/docview/304412796?accountid
=10628
Cassel, R., & Kolstad, R. (1998). Critical job-skill requirements for 21st century: Living
and working with people. Journal of Instructional Psychology, 25(3), 176.
Retrieved from EBSCOhost.
117
Castellano, M., Stringfield, S., & Stone, J. (2003). Secondary Career and Technical
Education and Comprehensive School Reform: Implications for Research and
Practice. Review of Educational Research. 73(2). 231–272. doi:
10.3102/00346543073002231
Castellano, M., Stringfield, S.. & Stone, J. (2005). Earning Industry-Recognized
Credentials in High School: Exploring Research and Policy Issues. Journal of
Career and Technical Education. 21(2). 7-34. Retrieved from http://scholar.lib.
vt.edu/ejournals/JCTE/v21n2/pdf/v21n2.pdf
Cech, S. (2007). Job Skills of the Future in Researchers' Crystal Ball. Education Week,
26(42), 12. Retrieved from Academic Search Premier database.
Challenger, J. (2003). The Coming Labor Shortage. Futurist, 37(5), 24. Retrieved from
Academic Search Premier database.
Challenger, J. (2009). Finding a Job in the 21st Century. Futurist, 43(5), 29-33. Retrieved
from EBSCOhost.
Clark, R., & Allison-Jones, L. (2011). Investing In Human Capital: An Academic-Service
Partnership to Address the Nursing Shortage. Nursing Education Perspectives,
32(1), 18-21. Retrieved from EBSCOhost.
Coats, D. (2006). People Skills Training: Are you getting a return on your investment?,
(www.2020insight.net) retrieved from http://www.2020insight.net
/Docs4/PeopleSkills.pdf
Cogan, B. (2005). "Framing Usefulness:" An Examination of Journalistic Coverage of the
Personal Computer from 1982-1984. Southern Communication Journal, 70(3),
248-265. Retrieved from Academic Search Premier database.
118
Coll, R., & Zegwaard, K. (2006). Perceptions of desirable graduate competencies for
science and technology new graduates. Research in Science & Technological
Education, 24(1), 29-58. doi:10.1080/02635140500485340
Committee on Vocational Education Research and Development (CVERD), Assembly of
Behavioral and Social Sciences. (1976). Assessing Vocational Education
Research and Development. Assembly of Behavioral and Social Sciences
National Research Council National Academy of Sciences. Washington, D.C.:
National Academies Press. Retrieved from http://www.nap.edu/openbook.
php?record_id=9577&page=R1
Conte, C. & Karr, A. & United States. Dept. of State. Bureau of International Information
Programs. (2001) An outline of the U.S. economy [electronic resource] /
Christopher Conte, Albert R. Karr U.S. Dept. of State, International Information
Programs, [Washington, D.C.]. Retrieved from http://beijing.usembassy-
china.org.cn/uploads /images/mzCJqwLfejmLCTTERPxBUA/outline_of_
us_economy.pdf
Damron, D. (1990). The contributions of Carl D. Perkins on higher education legislation,
1948-1984. D.A. dissertation, Middle Tennessee State University, United States --
Tennessee. Retrieved from Dissertations & Theses: Full Text.(Publication No.
AAT 9026931)
Debray, E. (2006). Politics, Ideology & Education: Federal Policy during the Clinton
and Bush Administrations. New York: Teachers College Press. ISBN-13:
9780807746677
119
Drage, K. (2009). Modernizing Career and Technical Education Programs. Techniques
84(5), 32-34. Retrieved from http://vnweb.hwwilsonweb.com.libproxy.eku.
edu/hww/results/external_linkmaincontentframe.jhtml?_DARGS=/hww/results/
results_common.jhtml.4
Dugger, R. (1965). The Vocational Education Act of 1963. NASSP Bulletin 49, 15-23.
doi 10.1177/019263656504930104
Elliot, J., & Deimler, B. (2007). The Premier Educational Delivery System. Techniques:
Connecting Education & Careers, 82(1), 44-46. Retrieved from Academic Search
Premier database.
Garcia, C. C. (2008). The big revival: How improved career training programs generate
new opportunities for high school students. Journalism(Broadcast Journalism)).
ProQuest Dissertations and Theses, Retrieved from http://search.proquest.com
/docview/193487650?accountid=10628
Gilead, T. (2009). Human Capital, Education and the Promotion of Social Cooperation: A
Philosophical Critique. Studies in Philosophy & Education, 28(6), 555-567.
doi:10.1007/s11217-009-9146-2
Guthrie, J. (2008). ―Next Needed Steps in the Evolution of American Education Finance
and Policy: Attenuating Judicially Imposed Policy Distraction, Activating a
Balanced Portfolio of K-12 School Reforms, Advancing Rationality as a Goal in
Pursuing Productivity, Advocating Change in a Responsible and Effective
Manner.‖ Peabody Journal of Education 83(2) 259-284.
Hall, D. J. (2009). The impact of human capital-based education and training programs
on an economically marginalized rural county in appalachia. The Florida State
120
University). ProQuest Dissertations and Theses, Retrieved from http://search.
proquest.com/docview/304879798?accountid=10628
Harnish, D., and Wilke-Schnaufer, J. (1998)"Work-Based Learning in Occupational
Education and Training." Journal of Technology Studies 24(2), 21-30.
Harris, K., & Rogers, G. (2008). Soft Skills in the Technology Education Classroom:
What Do Students Need?. Technology Teacher, 68(3), 19-24. Retrieved from
Academic Search Premier database.
Jackson, S., (2009). Research Methods and Statistics: A Critical Thinking Approach.
Belmont, CA: Wadsworth. ISBN-13: 978-0-495-51001-7.
Johnson, T. G., & Broomhall, D. E. (1992). Education and economic development in
rural appalachia. Retrieved from http://search.proquest.com/docview/62825601
?accountid=10628
Kentucky Council of Area Development Districts (KCADD). (2009a). History of the
Area Development Program. Retrieved from
http://www.kcadd.org/Our_history.html
Kentucky Council of Area Development Districts (KCADD). (2009b). KADD Goals for
Support to the State Government. Retrieved from
http://www.kcadd.org/Support.html
Kentucky Department of Education (KDE). (2011). Career and Technical Education.
Retrieved from http://www.education.ky.gov/KDE/Instructional+Resources/
Career+and+Technical+Education/Technical+Education+Database+System/Reso
urces+for+TEDS+Data.htm
121
Kentucky Office of Employment and Training (KOET). (2011). Workforce Kentucky.
Retrieved from http://www.workforcekentucky.ky.gov/
Kentucky Office of Employment and Training (KOET). (2011). Workforce Kentucky.
Occupational Projections (Future Job Growth). Retrieved from
http://www.workforcekentucky.ky.gov/cgi/dataanalysis/PeriodSelection.asp?menu
choice=occprj
Kentucky Tech. (2011a) Curriculum. Retrieved from http://www.kytechcurriculum.
org/lp_SelectCourse.asp
Kentucky Tech. (2011b) Program Assessment. Retrieved from
http://www.kytech.ky.gov/ programassessment.htm
Kentucky Workforce Investment Cabinet. (2011). About Us. Retrieved from
http://workforce.ky.gov/about_us.htm
Kim, J. (2006). The impact of dual and articulated credit on college readiness and total
credit hours in four selected community colleges. Ph.D. dissertation, University of
Illinois at Urbana-Champaign, United States -- Illinois. Retrieved from ProQuest
Dissertations & Theses: Full Text database. (Publication No. AAT 3223628)
Kleinedler, S. (2005). Webster’s II New College Dictionary (3rd ed.). Boston: Huaghton
Mifflin.
Kliever, D. (1965). Vocational Education Act of 1963, A Case Study In Legislation.
Washington D.C: American Vocational Association Inc. (ERIC Document
Reproduction Service No. ED016788). Retrieved from EBSCOHost ERIC
database.
122
Legislative Research Commission. (2003). A Study of Secondary Career and Technical
Education. Research (Report No. 315). Retrieved from http://www.e-
archives.ky.gov/pubs/LRC/RR315.pdf
Library of Congress. (1995-1996). Bill Summary & Status Search Results Bill Text
104th Congress (1995-1996). Retrieved from http://thomas.loc.gov/cgi-
bin/thomas
Library of Congress. (1997-1998). Bill Summary & Status Search Results Bill Text
105th Congress (1997-1998). Retrieved from http://thomas.loc.gov/cgi-
bin/thomas
Library of Congress. (2003-2004). Bill Summary & Status Search Results Bill Text
108th Congress (2003-2004). Retrieved from http://thomas.loc.gov/cgi-
bin/thomas
Library of Congress. (2005-2006). Bill Summary & Status Search Results Bill Text
109th Congress (2005-2006). Retrieved from http://thomas.loc.gov/cgi-
bin/thomas
Low, G. (2004). A new skills gap: the other 50 per cent. Education Journal, (81), 8.
Retrieved from Academic Search Premier database.
Marks, John M. (2009). Executive Director’s Message. Retrieved from
http://kytech.ky.gov/ executivedirectorsmessage.htm
MartiNez, A. (2001). The Ethics of Democracy: Individuality and Educational Policy.
Educational Policy, 15, 379-403. doi: 10.1177/0895904801015003003
123
Mitchell, G., Skinner, L., & White, B. (2010). Essential soft skills for success in the
twenty-first century workforce as perceived by business educators. Delta Pi
Epsilon Journal 52(1), 43-53. Retrieved from EBSCOhost.
Moe, T. (Ed. 2001). A Primer on America’s Schools. Stanford CA: Hoover Institution
Press. Retrieved from http://www.hoover.org/publications books /3009196.html
Moineddin, R., Beyene, J., & Boyle, E. (2003). On the Location Quotient Confidence
Interval. Geographical Analysis, 35(3), 249. Retrieved from EBSCOhost.
Morgan, J. Q., & Lambe, W. (2009). find a way or make one. Economic Development
Journal, 8(3), 5-13. Retrieved from EBSCOhost.
Morey, K. (2009). Efficacy of workforce training at Western Dakota Technical Institute:
An employers' perspective. Ed.D. dissertation, University of South Dakota,
United States -- South Dakota. Retrieved from Dissertations & Theses: Full
Text.(Publication No. AAT 3382628)
Moye, J. (2011). Real Integration-Where the Rubber Meets the Road. Techniques:
Connecting Education & Careers, 86(3), 48-51. Retrieved from EBSCOhost.
Muraskin, L. D. (1989). The Implementation of the Carl D. Perkins Act. National
Assessment of Vocational Education Final Report. Volume II. NAVE Room
3141, U.S. Department of Education, 400 Maryland Avenue, SW, Washington,
DC 20202.
National Association of State Directors of Career Technical Education Consortium
(NASDCTE). (2009, May 7). Obama Budget Level Funds Career Technical
Education [Press release]. Retrieved from http://www.careertech.org/press
_releases/show/28
124
O'Hara, F. V. (2009). Kentucky's response to the vocational education act of 1963:
Leadership for the development of a unique system of secondary area technology
centers. University of Kentucky). ProQuest Dissertations and Theses, Retrieved
from http://search.proquest.com/docview/885862563?accountid=10628
Olaniyan, D. & Okemakinde. T. (2008). Human Capital Theory: Implications for
Educational Development. European Journal of Scientific Research, 24(2), 157-
162. Retrieved from http://www.eurojournals.com/ejsr_24_2_01.pdf
Owens, J. (2010). MANUFACTURING IN 2010. (Cover story). Industrial Engineer: IE,
42(1), 26-31. Retrieved from EBSCOhost.
Patterson, S. (n.d.) Smith-Hughes Act of 1917 (PL 347). Retrieved from http://jschell
.myweb.uga.edu/history/legis/smithughes.htm
Peckham, S. (2010). technically speaking. Tech Directions, 69(10), 4. Retrieved from
Academic Search Premier database.
Posey, E. R. (2008). Evaluation of career academies and factors that influence
graduation percentages. Nova Southeastern University). ProQuest Dissertations
and Theses, Retrieved from http://search.proquest.com/docview/304830471?
accountid=10628
Ranade, S., Tamara, C., Castiblanco, E., & Serna, A. (2010). Mapping competencies.
Mechanical Engineering, 132(2), 30-34. Retrieved from Academic Search
Premier database.
Reese, D. (2008). The impact of secondary education internship programs on academic
achievement, technical skill development and social growth. Ph.D. dissertation,
Capella University, United States -- Minnesota. Retrieved February 20, 2009,
125
from ProQuest Dissertations & Theses: Full Text database. (Publication No. AAT
3307297)
Reese, S. (2010). Preparing Workers For Successful Careers. Techniques: Connecting
Education & Careers, 85(5), 16-21. Retrieved from Academic Search Premier
database.
Regan, B. (2008). Why We Need to Teach 21st Century Skills--And How to Do It.
MultiMedia & Internet@Schools, 15(4), 10-13. Retrieved from EBSCOhost.
Renski, H. (2009). New Firm Entry, Survival, and Growth in the United States: A
Comparison of Urban, Suburban, and Rural Areas. Journal of the American
Planning Association, 75(1), 60-77. doi:10.1080/01944360802558424
Rotundo, M., & Sackett, P. (2004). Specific versus general skills and abilities: A job level
examination of relationships with wage. Journal of Occupational &
Organizational Psychology, 77(2), 127-148. Retrieved from EBSCOhost.
Sabatier, P. (Ed. 2007). 2nd
Edition. Theories of the Policy Process. Cambridge, MA:
Westview Press. ISBN 0-8133-4359-3
Scott, J. & Sarkees-Wircenski, M. (2008). 4th
Edition. Overview of Career and Technical
Education. Boston, MA: American Technical Publishers. ISBN 978-0-8269-
4017-9
Shaw, T., De Young, A., & Rademacher, E. (2004). Educational Attainment in
Appalachia: Growing with the nation, but challenges remain. Journal of
Appalachian Studies, 10(3), 307-329. Retrieved from Academic Search Premier
database.
126
Shockley, D. A. (1995). Factors which influence Ohio Appalachia secondary vocational
education students to plan to enroll in postsecondary education programs. The
Ohio State University). ProQuest Dissertations and Theses, Retrieved from
http://search.proquest.com/docview/304200972?accountid=10628
Silva, E. (2009). Measuring Skills for 21st-Century Learning. Phi Delta Kappan, 90(9),
630-634. Retrieved from EBSCOhost.
Sloman, K.. (2010). Research Trends in Descriptive Analysis. Behavior Analyst Today,
11(1), 20-35. Retrieved from Academic Search Premier database.
Smith, R. (2010). Statesmen Series Remembers Carl D. Perkins. WUKY reports.
Retrieved from http://www.publicbroadcasting.net/wuky/news.newsmain/article/
1066/0/1660680/WUKY.Reports.../Statesmen.Series.Remembers.Carl.D.Perkins
Smith, N. (1999). A tribute to the visionaries, prime movers and pioneers of vocational
education. Journal of Vocational and Technical Education, 16(1). Retrieved from
http://scholar.lib.vt.edu/ejournals/JTVE/ v16n1/smith.html
Smith-Hughes Act, 88 U.S.C. § 347 (1917).
Stone III, J. (2008). The education people need. Issues in Science & Technology, 25(1),
6-8. Retrieved from EBSCOhost.
Stone III, J. (2009). A Perkins Challenge: Assessing technical Skills in CTE. (Cover
story). Techniques: Connecting Education & Careers, 84(2), 21-23. Retrieved
from Academic Search Premier database.
Stumpf, J. (2007). Meeting the needs: Does technical college education meet the needs of
employers. Ed.D. dissertation, University of Minnesota, United States --
127
Minnesota. Retrieved from ProQuest Dissertations & Theses: Full Text database.
(Publication No. AAT 3256857)
Taylor, A. (2005). What employers look for: the skills debate and the fit with youth
perceptions. Journal of Education & Work, 18(2), 201-218. doi:10.1080/136390
80500085984
Trinidad, O. (2008). Demographics and learning styles of automotive technology
students. M.S. dissertation, Southern Illinois University at Carbondale, United
States -- Illinois. Retrieved from ProQuest Dissertations & Theses: Full Text
database. (Publication No. AAT 1456837)
U.S. Census Bureau. (2010). Data. 2010 Census Data. 2010 Census Results Kentucky.
Retrieved from http://2010.census.gov/2010census/data/
U. S. Department of Education. (1983). National Commission on Excellence in
Education. A nation at risk: the imperative for educational reform: a report to the
Nation and the Secretary of Education, / by the National Commission on
Excellence in Education The Commission : [Supt. of Docs., U.S. G.P.O.
distributor], Washington, D.C. United States
U.S. Department of Education. (n.d.). Office of Vocational and Adult Education, Career
and Technical Education. Retrieved from http://www.ed.gov/about/offices
/list/ovae/pi/cte/factsh/faq-080528.pdf
U.S. Department of Education. (2003). Carl D. Perkins Vocational and Technical
Education Act of 1998. Retrieved from http://www.ed.gov/offices/OVAE/CTE/
legis.html
128
U.S. Department of Education. (2006). Carl D. Perkins Career and Technical Act of
2006 (Perkins IV). Retrieved from http://www.ed.gov/about/offices/list/ovae/pi/
memoperkinsiv.html
U.S. Department of Education (2009). Tech Prep Education. Retrieved from
http://www.2ed.gov/programs/techprep/index.html
U.S. Department of Education. (2010). Overview: The Federal Role in Education.
Retrieved from http://www2.ed.gov/about/overview/fed/role.html?src=ln
U.S. Department of Labor. Bureau of Labor Statistics (BLS). (2010). Occupational
Outlook Handbook, 2010-11 Edition. Retrieved from
http://www.bls.gov/oco/oco2003.htm #industry
U.S. Department of Labor, Bureau of Labor Statistics (BLS). (2011a). Labor Force
Statistics from the Current Population Survey: Databases, Tables & Calculators
by Subject. Retrieved from http://www.tradingeconomics.com/Economics/
Unemployment-Rate.aspx?Symbol=USD
U.S. Department of Labor, Bureau of Labor Statistics. (2011b). Employment Projections:
2008-2018 Summary. Retrieved from http://www.bls.gov/news.release/
ecopro.nr0.htm
Visher, M., Bhandari, R., & Medrich, E. (2004). High School Career Exploration
Programs: Do They Work?. Phi Delta Kappan, 86(2), 135-138. Retrieved from
Academic Search Premier database.
Vocational Education Act, 88 U.S.C. § 210 (1964).
Warfield, B. (1969). The 90th
Congress and vocational Education. NASSP Bulletin 53
(57), 57-66. doi: 10.1177/019263656905333405
129
Western Kentucky University, Helm-Cravens Library. (1996). KERA Resources on the
Kentucky Education Reform Act. Retrieved from http://www.wku.edu/
library/kera /rose.htm
Westray, V. (2008). Job readiness training: A qualitative study of program graduates in
rural South Carolina. Ph.D. dissertation, Capella University, United States --
Minnesota. Retrieved February 24, 2009, from ProQuest Dissertations & Theses:
Full Text database. (Publication No. AAT 3324739)
Wilcox, S. M. (2007). Tech prep and college readiness in Florida. University of North
Florida). ProQuest Dissertations and Theses, Retrieved from http://search.
proquest.com/docview/304700220?accountid=10628
Wilson, L. (2006). How students really learn: Instructional strategies that work. Lanham,
MD: Rowman & Littlefield.
Ziliak, J. (2007). Human Capital and the Challenge of Persistent Poverty in Appalachia.
(Cover story). Economic Commentary, 1-4. Retrieved from Academic Search
Premier database.
Zinn, J., & Haddad, R. (2007). The new essential skills. Industrial Engineer: IE, 39(5),
35-39. Retrieved from EBSCOhost.
130
APPENDIX A:
ATC Program Enrollment Capacities
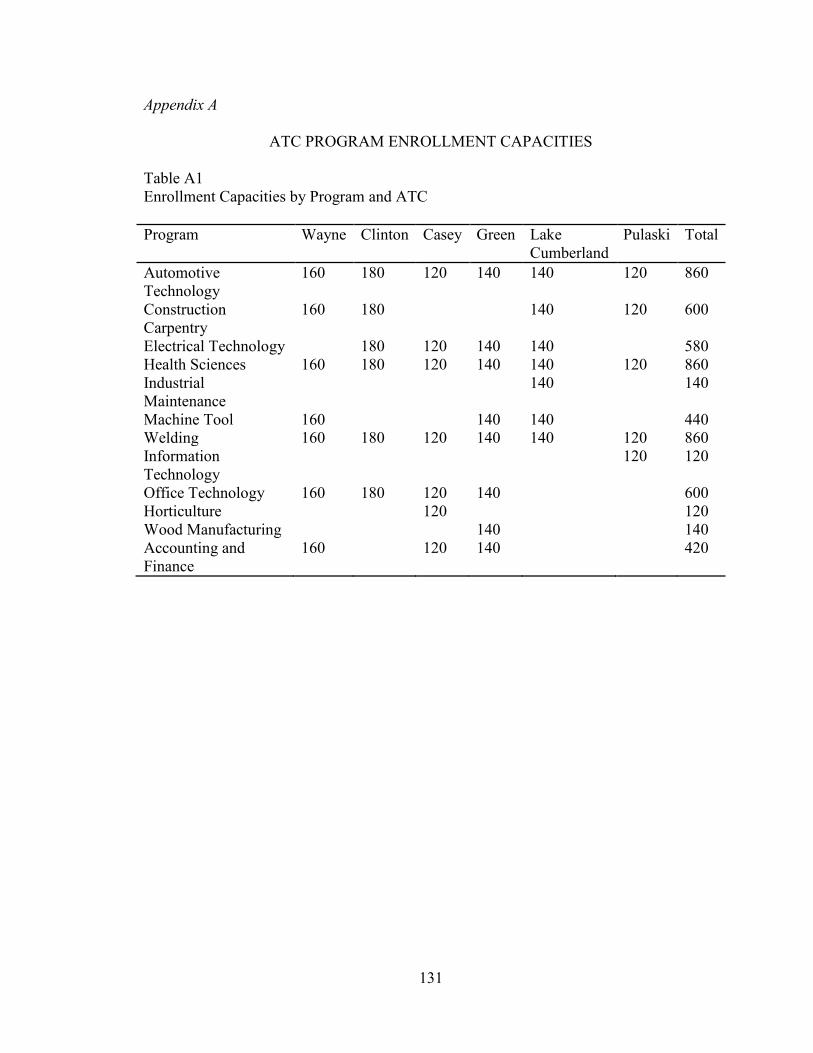
131
Appendix A
ATC PROGRAM ENROLLMENT CAPACITIES
Table A1
Enrollment Capacities by Program and ATC
Program Wayne Clinton Casey Green Lake
Cumberland
Pulaski Total
Automotive
Technology 860
160 180 120 140 140 120 860
Construction
Carpentry
160 180 140 120 600
Electrical Technology 180 120 140 140 580
Health Sciences 160 180 120 140 140 120 860
Industrial
Maintenance
140 140
Machine Tool 160 140 140 440
Welding 160 180 120 140 140 120 860
Information
Technology
120 120
Office Technology 160 180 120 140 600
Horticulture 120 120
Wood Manufacturing 140 140
Accounting and
Finance
160 120 140 420

132
APPENDIX B:
ATC Program Occupational Data
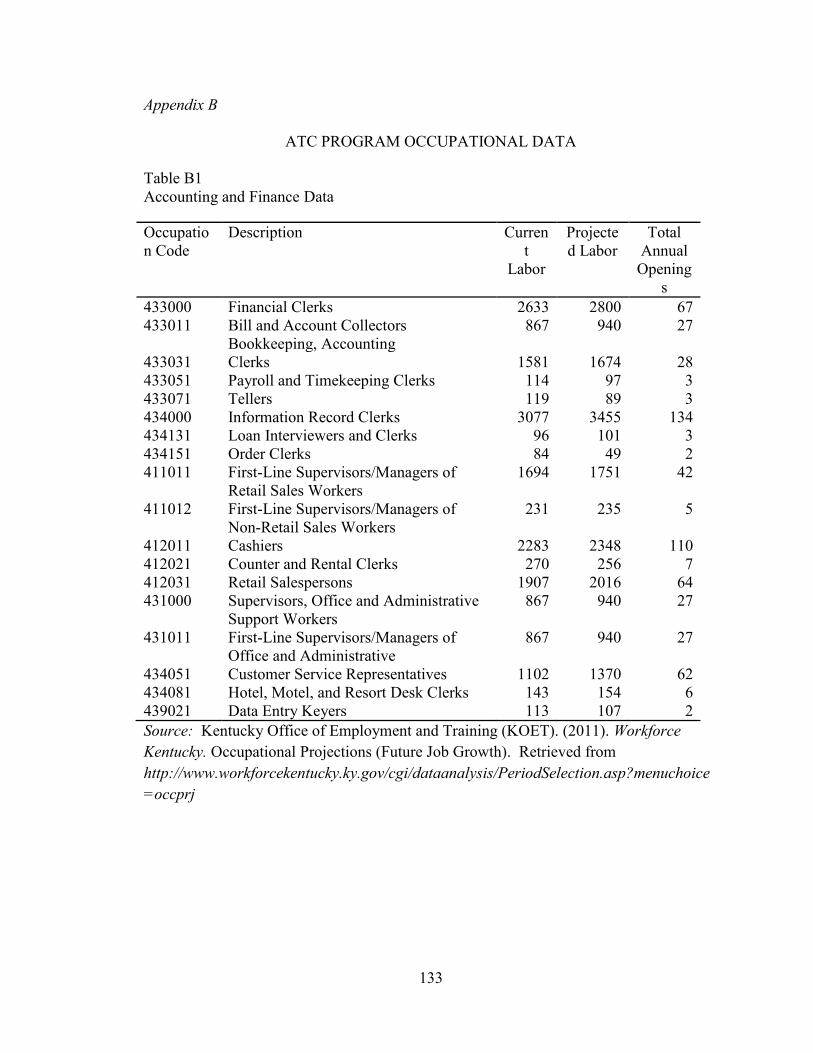
133
Appendix B
ATC PROGRAM OCCUPATIONAL DATA
Table B1
Accounting and Finance Data
Occupatio
n Code
Description Curren
t
Labor
Projecte
d Labor
Total
Annual
Opening
s
433000
Financial Clerks 2633 2800 67
433011 Bill and Account Collectors
Bookkeeping, Accounting
867 940 27
433031 Clerks 1581 1674 28
433051 Payroll and Timekeeping Clerks 114 97 3
433071 Tellers 119 89 3
434000 Information Record Clerks 3077 3455 134
434131 Loan Interviewers and Clerks 96 101 3
434151 Order Clerks 84 49 2
411011 First-Line Supervisors/Managers of
Retail Sales Workers
1694 1751 42
411012 First-Line Supervisors/Managers of
Non-Retail Sales Workers
231 235 5
412011 Cashiers 2283 2348 110
412021 Counter and Rental Clerks 270 256 7
412031 Retail Salespersons 1907 2016 64
431000 Supervisors, Office and Administrative
Support Workers
867 940 27
431011 First-Line Supervisors/Managers of
Office and Administrative
867 940 27
434051 Customer Service Representatives 1102 1370 62
434081 Hotel, Motel, and Resort Desk Clerks 143 154 6
439021 Data Entry Keyers 113 107 2
Source: Kentucky Office of Employment and Training (KOET). (2011). Workforce
Kentucky. Occupational Projections (Future Job Growth). Retrieved from
http://www.workforcekentucky.ky.gov/cgi/dataanalysis/PeriodSelection.asp?menuchoice
=occprj
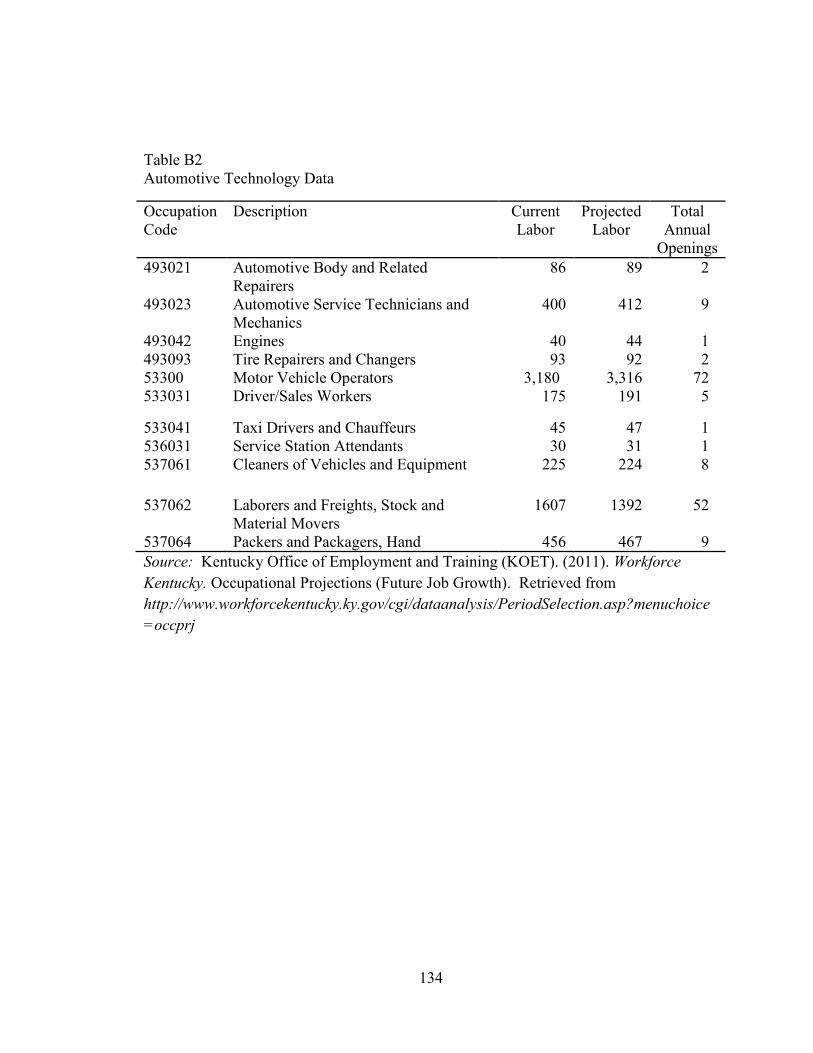
134
Table B2
Automotive Technology Data
Occupation
Code
Description Current
Labor
Projected
Labor
Total
Annual
Openings
493021 Automotive Body and Related
Repairers
86 89 2
493023 Automotive Service Technicians and
Mechanics
400 412 9
493042 Engines 40 44 1
493093 Tire Repairers and Changers 93 92 2
53300 Motor Vehicle Operators 3,180
3,316 72
533031 Driver/Sales Workers 175 191 5
533041 Taxi Drivers and Chauffeurs 45 47 1
536031 Service Station Attendants 30 31 1
537061 Cleaners of Vehicles and Equipment 225 224 8
537062 Laborers and Freights, Stock and
Material Movers
1607 1392 52
537064 Packers and Packagers, Hand 456 467 9
Source: Kentucky Office of Employment and Training (KOET). (2011). Workforce
Kentucky. Occupational Projections (Future Job Growth). Retrieved from
http://www.workforcekentucky.ky.gov/cgi/dataanalysis/PeriodSelection.asp?menuchoice
=occprj
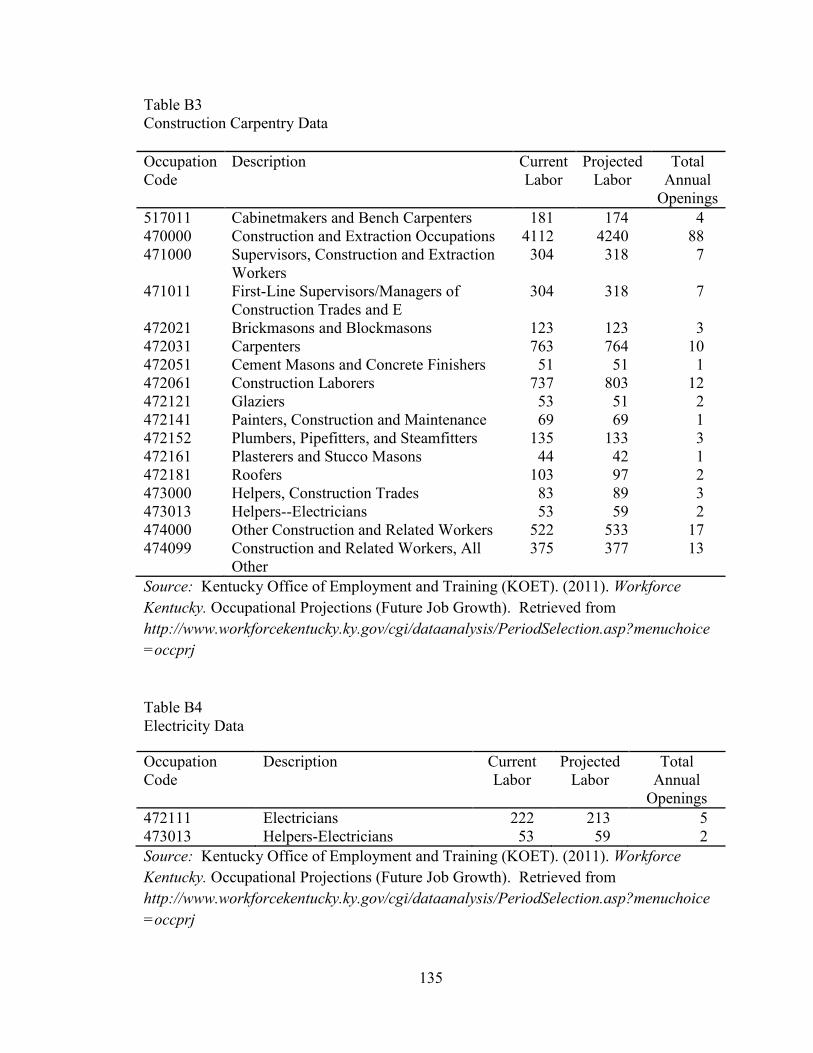
135
Table B3
Construction Carpentry Data
Occupation
Code
Description Current
Labor
Projected
Labor
Total
Annual
Openings
517011 Cabinetmakers and Bench Carpenters 181 174 4
470000 Construction and Extraction Occupations 4112 4240 88
471000 Supervisors, Construction and Extraction
Workers
304 318 7
471011 First-Line Supervisors/Managers of
Construction Trades and E
304 318 7
472021 Brickmasons and Blockmasons 123 123 3
472031 Carpenters 763 764 10
472051 Cement Masons and Concrete Finishers 51 51 1
472061 Construction Laborers 737 803 12
472121 Glaziers 53 51 2
472141 Painters, Construction and Maintenance 69 69 1
472152 Plumbers, Pipefitters, and Steamfitters 135 133 3
472161 Plasterers and Stucco Masons 44 42 1
472181 Roofers 103 97 2
473000 Helpers, Construction Trades 83 89 3
473013 Helpers--Electricians 53 59 2
474000 Other Construction and Related Workers 522 533 17
474099 Construction and Related Workers, All
Other
375 377 13
Source: Kentucky Office of Employment and Training (KOET). (2011). Workforce
Kentucky. Occupational Projections (Future Job Growth). Retrieved from
http://www.workforcekentucky.ky.gov/cgi/dataanalysis/PeriodSelection.asp?menuchoice
=occprj
Table B4
Electricity Data
Occupation
Code
Description Current
Labor
Projected
Labor
Total
Annual
Openings
472111 Electricians 222 213 5
473013 Helpers-Electricians 53 59 2
Source: Kentucky Office of Employment and Training (KOET). (2011). Workforce
Kentucky. Occupational Projections (Future Job Growth). Retrieved from
http://www.workforcekentucky.ky.gov/cgi/dataanalysis/PeriodSelection.asp?menuchoice
=occprj
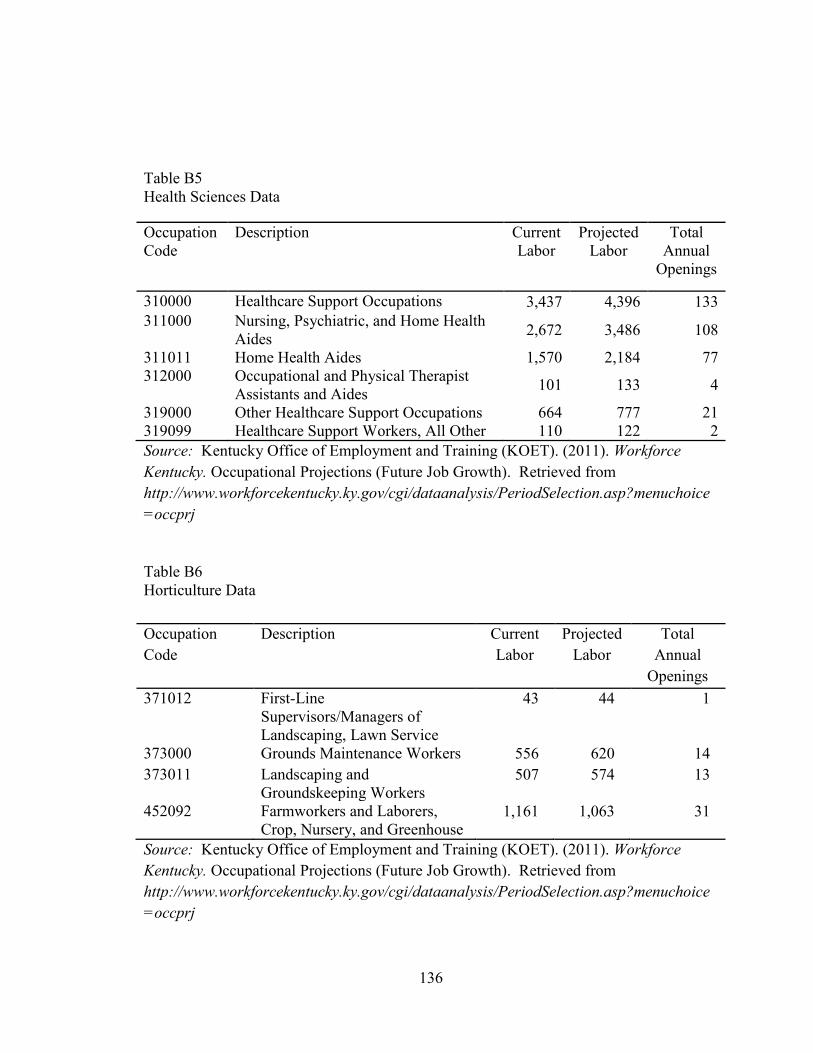
136
Table B5
Health Sciences Data
Occupation
Code
Description Current
Labor
Projected
Labor
Total
Annual
Openings
310000 Healthcare Support Occupations 3,437 4,396 133
311000 Nursing, Psychiatric, and Home Health
Aides 2,672 3,486 108
311011 Home Health Aides 1,570 2,184 77
312000 Occupational and Physical Therapist
Assistants and Aides 101 133 4
319000 Other Healthcare Support Occupations 664 777 21
319099 Healthcare Support Workers, All Other 110 122 2
Source: Kentucky Office of Employment and Training (KOET). (2011). Workforce
Kentucky. Occupational Projections (Future Job Growth). Retrieved from
http://www.workforcekentucky.ky.gov/cgi/dataanalysis/PeriodSelection.asp?menuchoice
=occprj
Table B6
Horticulture Data
Occupation
Code
Description Current
Labor
Projected
Labor
Total
Annual
Openings
371012 First-Line
Supervisors/Managers of
Landscaping, Lawn Service
43 44 1
373000 Grounds Maintenance Workers 556 620 14
373011 Landscaping and
Groundskeeping Workers
507 574 13
452092 Farmworkers and Laborers,
Crop, Nursery, and Greenhouse
1,161 1,063 31
Source: Kentucky Office of Employment and Training (KOET). (2011). Workforce
Kentucky. Occupational Projections (Future Job Growth). Retrieved from
http://www.workforcekentucky.ky.gov/cgi/dataanalysis/PeriodSelection.asp?menuchoice
=occprj
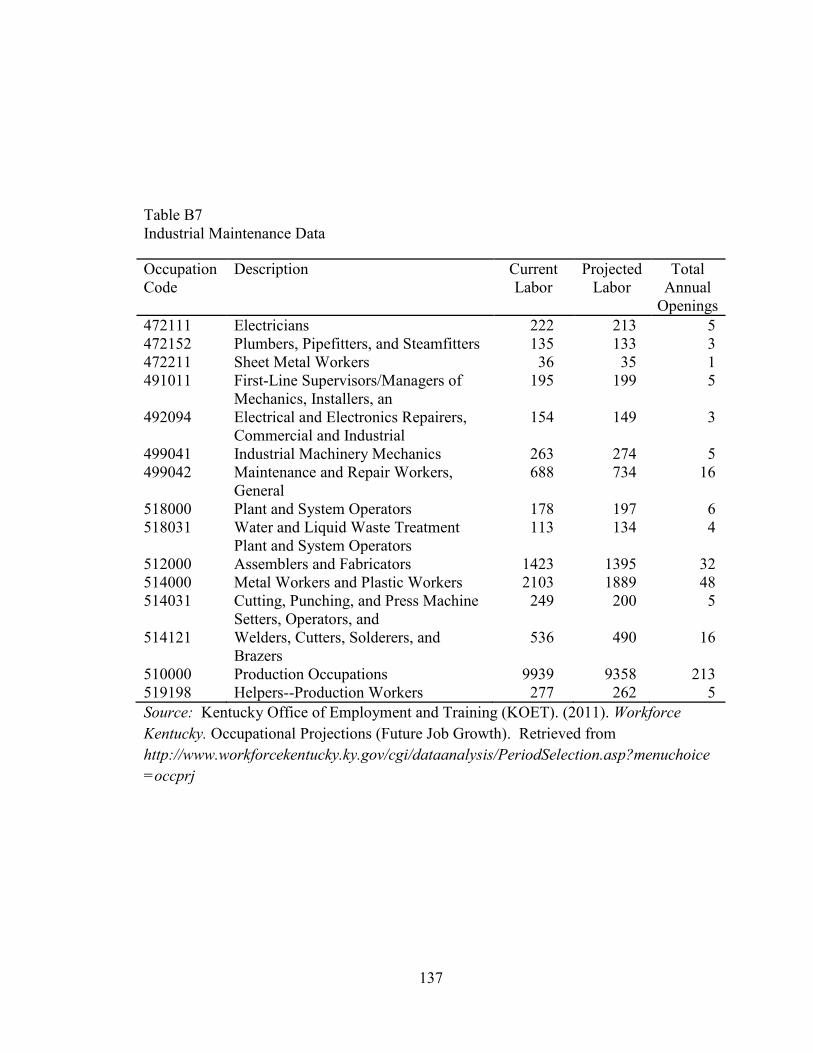
137
Table B7
Industrial Maintenance Data
Occupation
Code
Description Current
Labor
Projected
Labor
Total
Annual
Openings
472111 Electricians 222 213 5
472152 Plumbers, Pipefitters, and Steamfitters 135 133 3
472211 Sheet Metal Workers 36 35 1
491011 First-Line Supervisors/Managers of
Mechanics, Installers, an
195 199 5
492094 Electrical and Electronics Repairers,
Commercial and Industrial
154 149 3
499041 Industrial Machinery Mechanics 263 274 5
499042 Maintenance and Repair Workers,
General
688 734 16
518000 Plant and System Operators 178 197 6
518031 Water and Liquid Waste Treatment
Plant and System Operators
113 134 4
512000 Assemblers and Fabricators 1423 1395 32
514000 Metal Workers and Plastic Workers 2103 1889 48
514031 Cutting, Punching, and Press Machine
Setters, Operators, and
249 200 5
514121 Welders, Cutters, Solderers, and
Brazers
536 490 16
510000 Production Occupations 9939 9358 213
519198 Helpers--Production Workers 277 262 5
Source: Kentucky Office of Employment and Training (KOET). (2011). Workforce
Kentucky. Occupational Projections (Future Job Growth). Retrieved from
http://www.workforcekentucky.ky.gov/cgi/dataanalysis/PeriodSelection.asp?menuchoice
=occprj
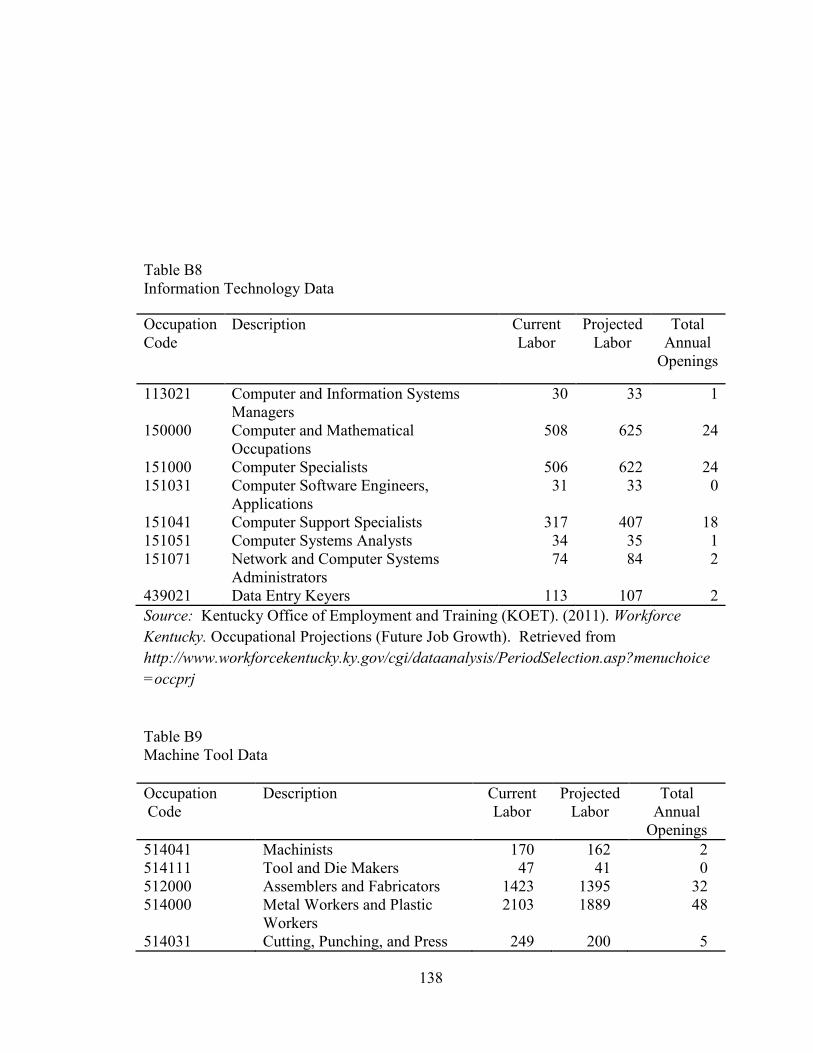
138
Table B8
Information Technology Data
Occupation
Code
Description Current
Labor
Projected
Labor
Total
Annual
Openings
113021 Computer and Information Systems
Managers
30 33 1
150000 Computer and Mathematical
Occupations
508 625 24
151000 Computer Specialists 506 622 24
151031 Computer Software Engineers,
Applications
31 33 0
151041 Computer Support Specialists 317 407 18
151051 Computer Systems Analysts 34 35 1
151071 Network and Computer Systems
Administrators
74 84 2
439021 Data Entry Keyers 113 107 2
Source: Kentucky Office of Employment and Training (KOET). (2011). Workforce
Kentucky. Occupational Projections (Future Job Growth). Retrieved from
http://www.workforcekentucky.ky.gov/cgi/dataanalysis/PeriodSelection.asp?menuchoice
=occprj
Table B9
Machine Tool Data
Occupation
Code
Description Current
Labor
Projected
Labor
Total
Annual
Openings
514041 Machinists 170 162 2
514111 Tool and Die Makers 47 41 0
512000 Assemblers and Fabricators 1423 1395 32
514000 Metal Workers and Plastic
Workers
2103 1889 48
514031 Cutting, Punching, and Press 249 200 5
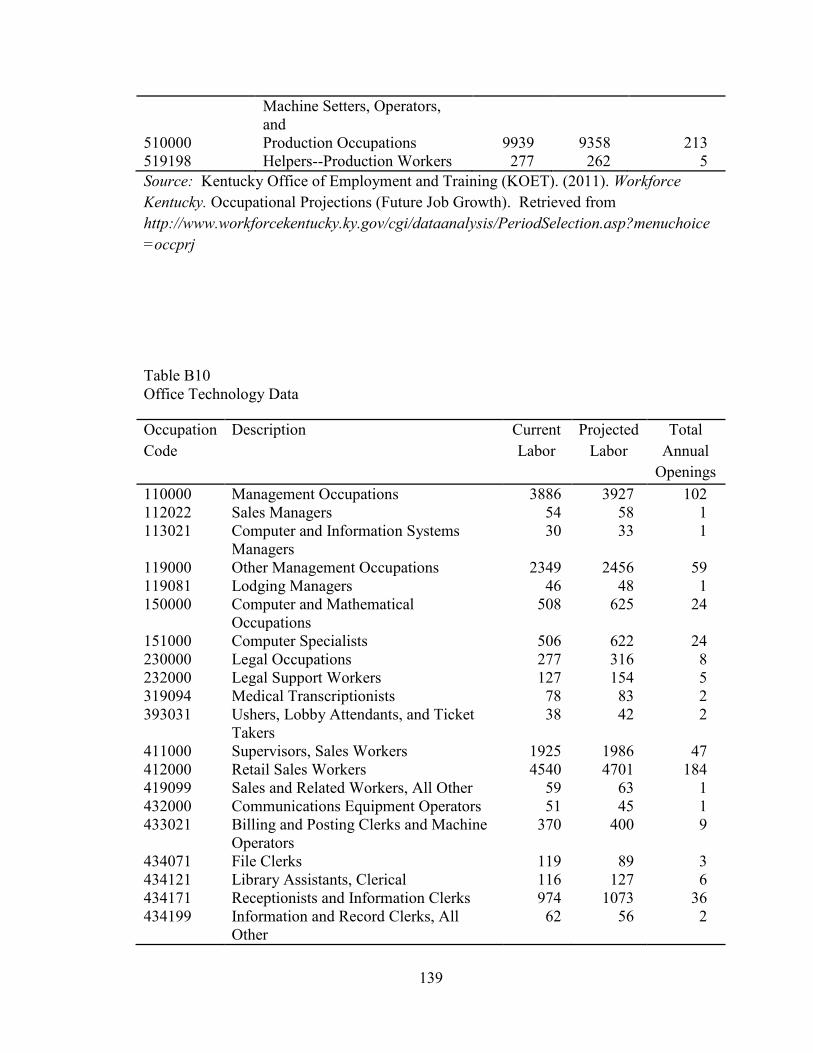
139
Machine Setters, Operators,
and
510000 Production Occupations 9939 9358 213
519198 Helpers--Production Workers 277 262 5
Source: Kentucky Office of Employment and Training (KOET). (2011). Workforce
Kentucky. Occupational Projections (Future Job Growth). Retrieved from
http://www.workforcekentucky.ky.gov/cgi/dataanalysis/PeriodSelection.asp?menuchoice
=occprj
Table B10
Office Technology Data
Occupation
Code
Description Current
Labor
Projected
Labor
Total
Annual
Openings
110000 Management Occupations 3886 3927 102
112022 Sales Managers 54 58 1
113021 Computer and Information Systems
Managers
30 33 1
119000 Other Management Occupations 2349 2456 59
119081 Lodging Managers 46 48 1
150000 Computer and Mathematical
Occupations
508 625 24
151000 Computer Specialists 506 622 24
230000 Legal Occupations 277 316 8
232000 Legal Support Workers 127 154 5
319094 Medical Transcriptionists 78 83 2
393031 Ushers, Lobby Attendants, and Ticket
Takers
38 42 2
411000 Supervisors, Sales Workers 1925 1986 47
412000 Retail Sales Workers 4540 4701 184
419099 Sales and Related Workers, All Other 59 63 1
432000 Communications Equipment Operators 51 45 1
433021 Billing and Posting Clerks and Machine
Operators
370 400 9
434071 File Clerks 119 89 3
434121 Library Assistants, Clerical 116 127 6
434171 Receptionists and Information Clerks 974 1073 36
434199 Information and Record Clerks, All
Other
62 56 2
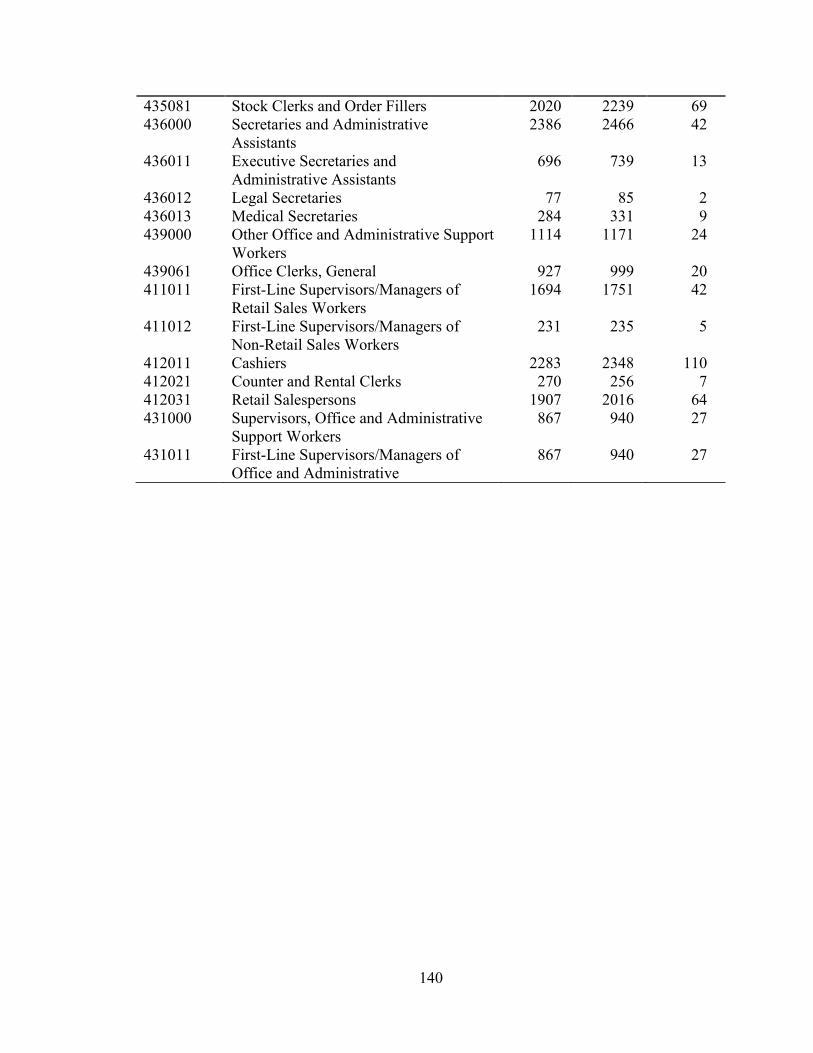
140
435081 Stock Clerks and Order Fillers 2020 2239 69
436000 Secretaries and Administrative
Assistants
2386 2466 42
436011 Executive Secretaries and
Administrative Assistants
696 739 13
436012 Legal Secretaries 77 85 2
436013 Medical Secretaries 284 331 9
439000 Other Office and Administrative Support
Workers
1114 1171 24
439061 Office Clerks, General 927 999 20
411011 First-Line Supervisors/Managers of
Retail Sales Workers
1694 1751 42
411012 First-Line Supervisors/Managers of
Non-Retail Sales Workers
231 235 5
412011 Cashiers 2283 2348 110
412021 Counter and Rental Clerks 270 256 7
412031 Retail Salespersons 1907 2016 64
431000 Supervisors, Office and Administrative
Support Workers
867 940 27
431011 First-Line Supervisors/Managers of
Office and Administrative
867 940 27
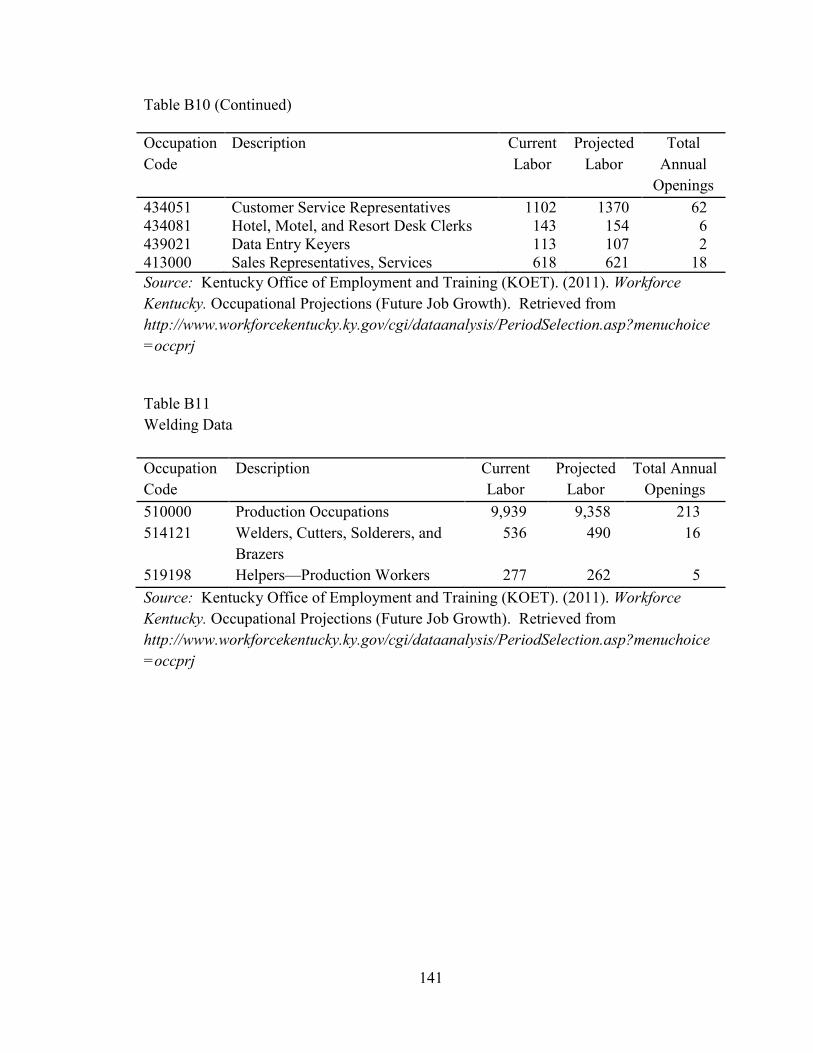
141
Table B10 (Continued)
Occupation
Code
Description Current
Labor
Projected
Labor
Total
Annual
Openings
434051 Customer Service Representatives 1102 1370 62
434081 Hotel, Motel, and Resort Desk Clerks 143 154 6
439021 Data Entry Keyers 113 107 2
413000 Sales Representatives, Services 618 621 18
Source: Kentucky Office of Employment and Training (KOET). (2011). Workforce
Kentucky. Occupational Projections (Future Job Growth). Retrieved from
http://www.workforcekentucky.ky.gov/cgi/dataanalysis/PeriodSelection.asp?menuchoice
=occprj
Table B11
Welding Data
Occupation
Code
Description Current
Labor
Projected
Labor
Total Annual
Openings
510000 Production Occupations 9,939 9,358 213
514121 Welders, Cutters, Solderers, and
Brazers
536 490 16
519198 Helpers—Production Workers 277 262 5
Source: Kentucky Office of Employment and Training (KOET). (2011). Workforce
Kentucky. Occupational Projections (Future Job Growth). Retrieved from
http://www.workforcekentucky.ky.gov/cgi/dataanalysis/PeriodSelection.asp?menuchoice
=occprj
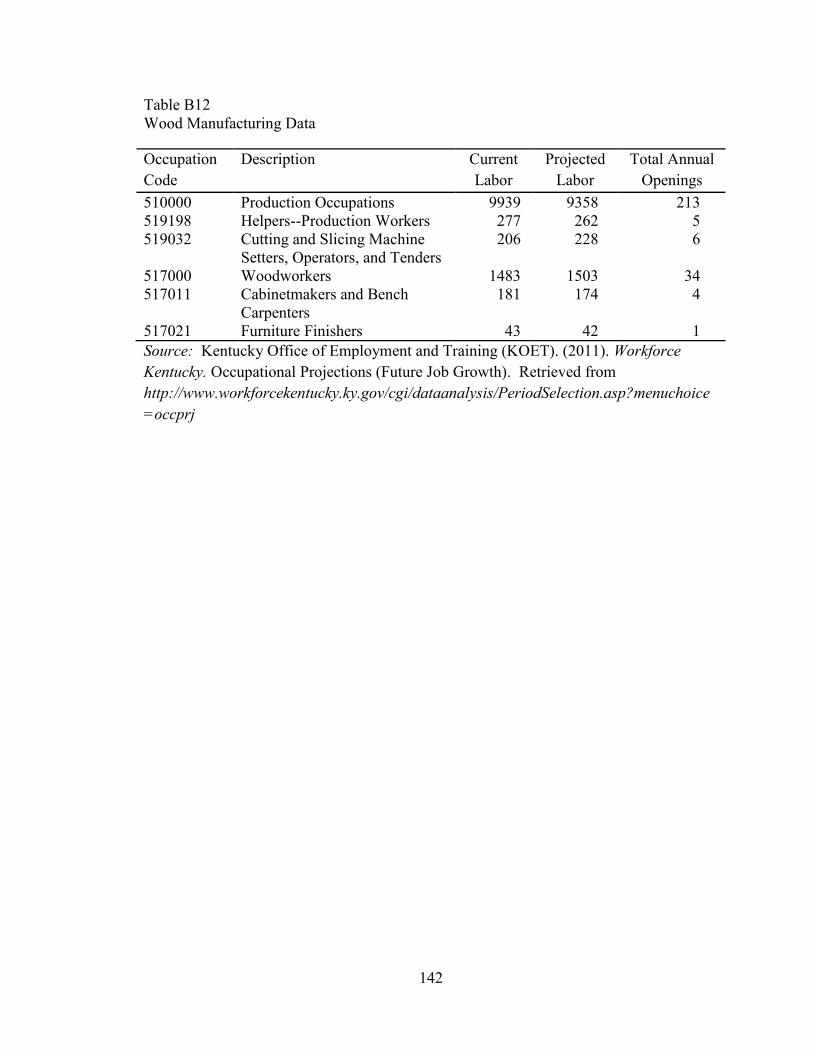
142
Table B12
Wood Manufacturing Data
Occupation
Code
Description Current
Labor
Projected
Labor
Total Annual
Openings
510000 Production Occupations 9939 9358 213
519198 Helpers--Production Workers 277 262 5
519032 Cutting and Slicing Machine
Setters, Operators, and Tenders
206 228 6
517000 Woodworkers 1483 1503 34
517011 Cabinetmakers and Bench
Carpenters
181 174 4
517021 Furniture Finishers 43 42 1
Source: Kentucky Office of Employment and Training (KOET). (2011). Workforce
Kentucky. Occupational Projections (Future Job Growth). Retrieved from
http://www.workforcekentucky.ky.gov/cgi/dataanalysis/PeriodSelection.asp?menuchoice
=occprj
143
APPENDIX C:
Kentucky Occupational Skills Standards Assessment Passage Rates
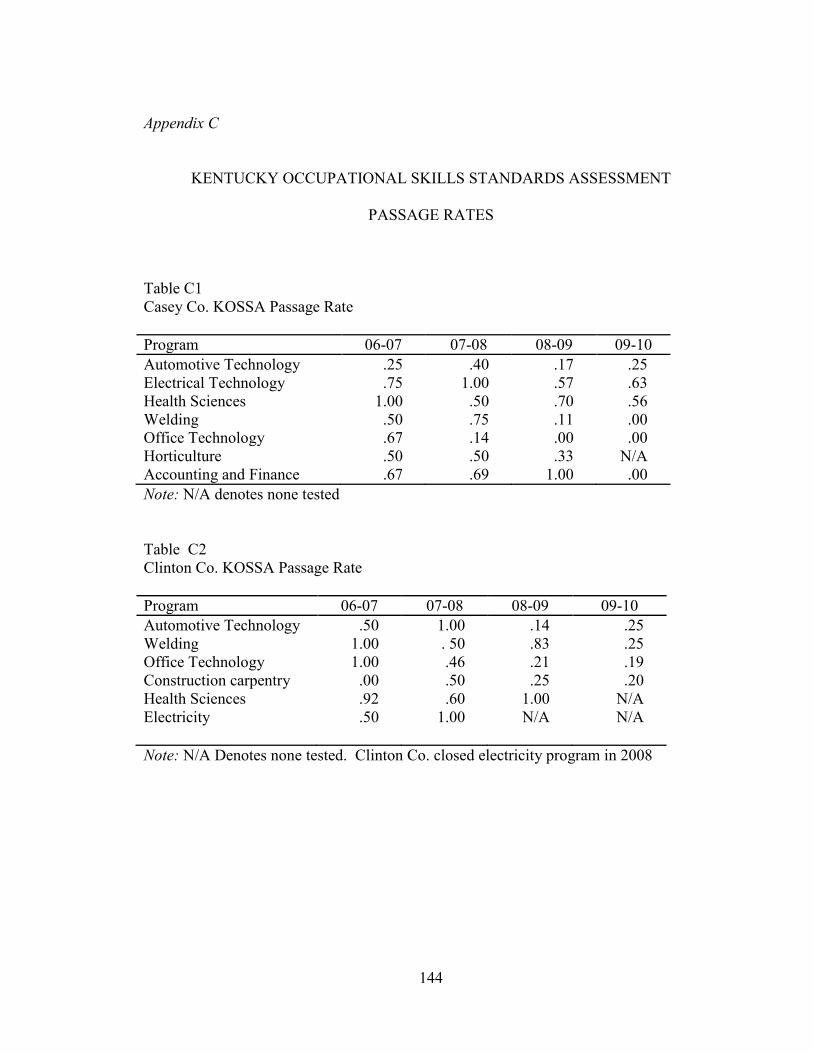
144
Appendix C
KENTUCKY OCCUPATIONAL SKILLS STANDARDS ASSESSMENT
PASSAGE RATES
Table C1
Casey Co. KOSSA Passage Rate
Program 06-07 07-08 08-09 09-10
Automotive Technology .25 .40 .17 .25
Electrical Technology .75 1.00 .57 .63
Health Sciences 1.00 .50 .70 .56
Welding .50 .75 .11 .00
Office Technology .67 .14 .00 .00
Horticulture .50 .50 .33 N/A
Accounting and Finance .67 .69 1.00 .00
Note: N/A denotes none tested
Table C2
Clinton Co. KOSSA Passage Rate
Program 06-07 07-08 08-09 09-10
Automotive Technology .50 1.00 .14 .25
Welding 1.00 . 50 .83 .25
Office Technology 1.00 .46 .21 .19
Construction carpentry .00 .50 .25 .20
Health Sciences .92 .60 1.00 N/A
Electricity .50 1.00 N/A N/A
Note: N/A Denotes none tested. Clinton Co. closed electricity program in 2008
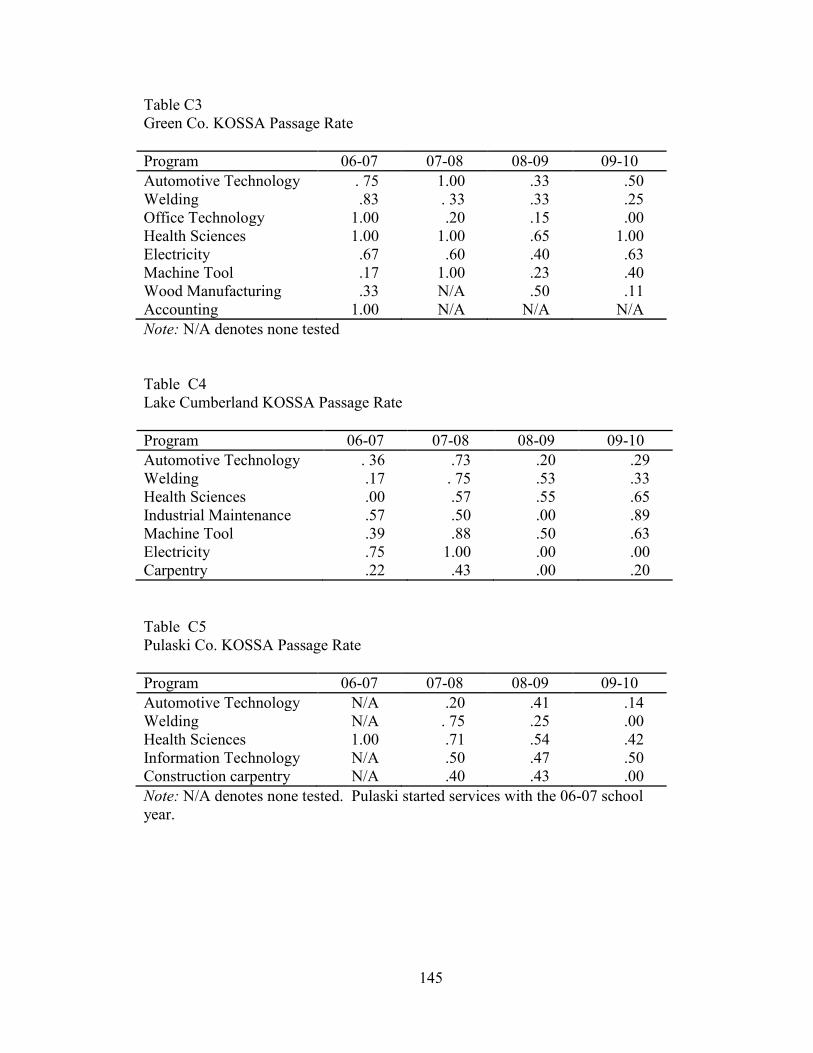
145
Table C3
Green Co. KOSSA Passage Rate
Program 06-07 07-08 08-09 09-10
Automotive Technology . 75 1.00 .33 .50
Welding .83 . 33 .33 .25
Office Technology 1.00 .20 .15 .00
Health Sciences 1.00 1.00 .65 1.00
Electricity .67 .60 .40 .63
Machine Tool .17 1.00 .23 .40
Wood Manufacturing .33 N/A .50 .11
Accounting 1.00 N/A N/A N/A
Note: N/A denotes none tested
Table C4
Lake Cumberland KOSSA Passage Rate
Program 06-07 07-08 08-09 09-10
Automotive Technology . 36 .73 .20 .29
Welding .17 . 75 .53 .33
Health Sciences .00 .57 .55 .65
Industrial Maintenance .57 .50 .00 .89
Machine Tool .39 .88 .50 .63
Electricity .75 1.00 .00 .00
Carpentry .22 .43 .00 .20
Table C5
Pulaski Co. KOSSA Passage Rate
Program 06-07 07-08 08-09 09-10
Automotive Technology N/A .20 .41 .14
Welding N/A . 75 .25 .00
Health Sciences 1.00 .71 .54 .42
Information Technology N/A .50 .47 .50
Construction carpentry N/A .40 .43 .00
Note: N/A denotes none tested. Pulaski started services with the 06-07 school
year.
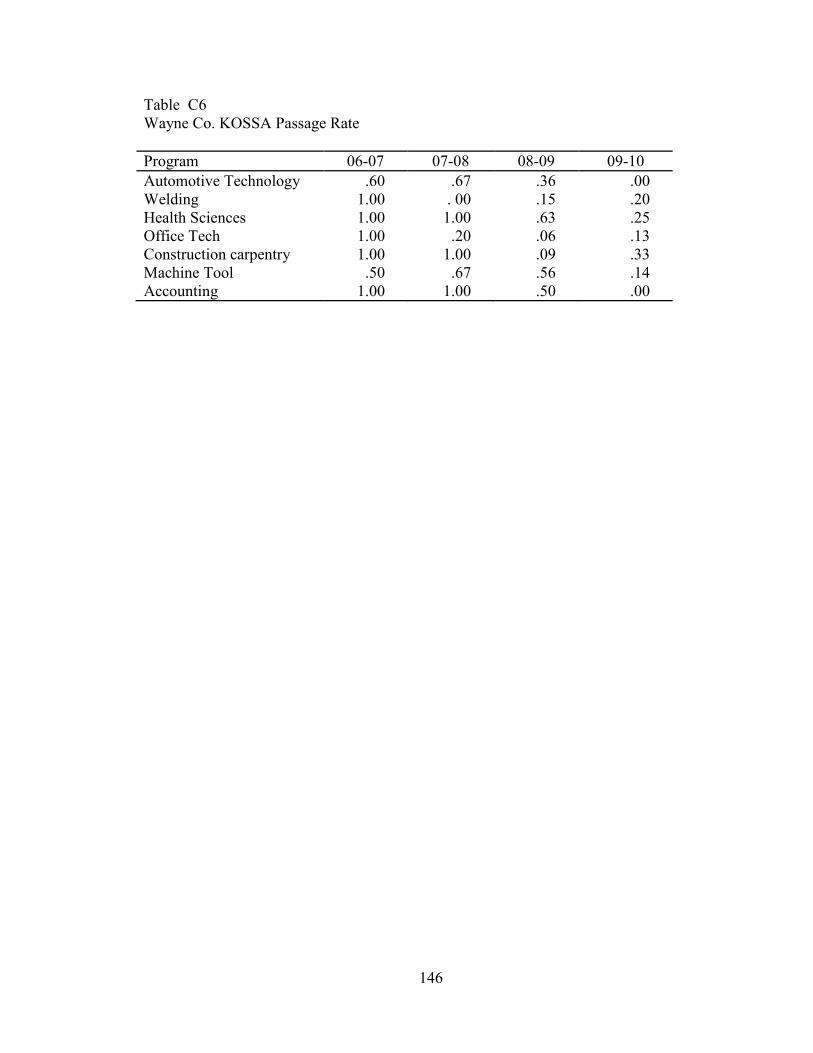
146
Table C6
Wayne Co. KOSSA Passage Rate
Program 06-07 07-08 08-09 09-10
Automotive Technology .60 .67 .36 .00
Welding 1.00 . 00 .15 .20
Health Sciences 1.00 1.00 .63 .25
Office Tech 1.00 .20 .06 .13
Construction carpentry 1.00 1.00 .09 .33
Machine Tool .50 .67 .56 .14
Accounting 1.00 1.00 .50 .00