Embed Size (px)
Citation preview
CAREER AND TECHNICAL EDUCATION INVENTORY
Fiscal Year 2015
Report of the
Career and Technical Education Programs, Participation, and Equipment Inventory
Submitted to the Minnesota Legislature
February 1, 2015
As required by
2014 Session Law, Chapter 312–H.F. No. 3172, Article 16, Section 12
1
This document is made available electronically by the Minnesota Legislative Reference Library as part of an ongoing digital archiving project. http://www.leg.state.mn.us/lrl/lrl.asp

COMMISSIONER:
Brenda Cassellius, Ed. D.
FOR MORE INFORMATION CONTACT:
Paula Palmer, Director, Office of Career and College Success
(651) 582-8737
[email protected] Kari-Ann Ediger, Program Improvement Results Measurement Specialist, Office of Career and College Success (651) 582-8269 [email protected]
2
Cost of Report Preparation
The total cost for the Minnesota Department of Education (MDE) to prepare this report was approximately $100,000. Most of these costs involved staff time designing data collection systems, collection the data, analyzing the survey data, and preparing the written report. Incidental costs include paper, copying, software and other office supplies. The cost of providers submitting survey inventory data for the report are not estimated in this total cost of report preparation.
Estimated costs are provided in accordance with Minnesota Statutes 2011, section 3.197, which requires that at the beginning of a report to the Legislature, the cost of preparing the report must be provided.
3

Table of Contents NA
Cost of Report Preparation 3 Introduction & Charge to the Department of Education 5 Executive Summary 6 Key Findings 7 Background 10 Methodology 13 Response rate 15 Part 1: Course Inventory 17
Percent of non-duplicative courses offered in each program area. 18 Most Common Course Offerings 19 Number and percent of approved and non-approved CTE courses 20 Participation and completion rates within each program area statewide. 22 District Graduation Standards 23 Online CTE course options 24 Local College or Third Party Vendors 25 Relationships with postsecondary institutions 26 Advisory Committees 28 Partnership work within or as a part of approved programming: experiential learning 31
Work-Based learning, Youth Apprenticeship, or Work Experience: Handicap/Transition Disabled 31
Part 2: Equipment Inventory 33 Relationships with industry and postsecondary partners 35 Necessary updates to Building Facilities 36 Student Barriers 37
Appendix A: Memo to Superintendents 39 Appendix B: Memo to Primary Contacts 40 Appendix C: Part 1: Course Inventory: List of Questions 41 Appendix D: Part 1: Course Inventory Definitions Provided to Districts 43 Appendix E: Part 2: Equipment Inventory: List of Questions 45 Appendix F: Equipment Lists 46 Appendix G: Respondents Map and Participant List 50 Appendix H: Additional Data Tables 58 Appendix I: Minnesota Career and Technical Education Clusters, Fields, Pathways 63 Appendix J: MDE Staff Contributors 64
4
Introduction
The 2014 legislature directed the Minnesota Department of Education to conduct a career and technical education program inventory (2014 Session Law, Chapter 312, Article 16, Section 12.)
CAREER AND TECHNICAL EDUCATION PROGRAM INVENTORY.
(a) The commissioner of education must consult with experts knowledgeable about secondary and postsecondary career and technical education programs to determine the content and status of particular career and technical education programs in Minnesota school districts, including cooperating districts under Minnesota Statutes, 123A.33, subdivision 2, integration districts, and postsecondary institutions partnering with school districts or offering courses through PSEO or career and technical programs and the rates of student participation and completion for these various programs, including: agriculture, food, and natural resources; architecture and construction; arts, audiovisual technology, and communications; business management and administration; computer science; family and consumer science; finance; health science; hospitality and tourism; human services; information technology; manufacturing; marketing; science, technology, engineering, and mathematics; and transportation, distribution, and logistics.
(b) To accomplish paragraph (a) and to understand the current role of local school districts and postsecondary institutions in providing career and technical education programs, the commissioner of education, in consultation with experts, also must examine the extent to which secondary and postsecondary education programs offer students a progression of coordinated, nonduplicative courses that adequately prepare students to successfully complete a career and technical education program.
(c) The commissioner of education must submit a report by February 1, 2015, to the education policy and finance committees of the legislature, consistent with this section, and include information about each district's dedicated equipment, resources, and relationships with
postsecondary institutions and the local business community...”
The commissioner of education designated the Office of Career and College Success (OCCS) in MDE as the responsible division for completing this work and designated a lead team to inform and implement data gathering and analysis methodology. The lead team membership consists of MDE executives and directors, CTE supervisors and specialists, OCCS and cross-department administrative support, government relations, data analytics, and information technology staff.
5
Executive Summary
The Minnesota Department of Education (MDE), in completing its charge to conduct an inventory of Minnesota’s career and technical education courses and equipment, determined that a survey approach was the most feasible and timely way to gather the information. The timeline required that a report be presented to the legislature by February 1, 2015. MDE chose a survey approach since there is currently no database or collection system for this type of statewide information.
As the lead team explored tools appropriate for gathering the information, it was determined that a two-pronged mechanism was necessary to obtain both course and equipment information. We anticipated that districts would be challenged by the timeline, the type and quantity of information requested, and the personnel capacity to source and report the information. Therefore, we leveraged MDE staff specialists to pre-populate data wherever possible. For example, for the equipment portion of the inventory, districts were provided with pre-populated lists of typical equipment associated with each Career and Technical Education (CTE) cluster and courses. Additionally, the already state-approved program lists of courses clustered by field categories were provided to districts as a starting point for adding updated approved and/or non-approved CTE courses.
Through multiple and varied communications, districts were encouraged to participate in the CTE Program Inventory in the hopes that their contributions to providing the legislature with information about their CTE programs, and equipment and facilities, would help to inform future decision making and subsequent CTE resources. Given the limitations of time and personnel capacity, and that participation was voluntary, not required, it is noteworthy that there was 60 percent overall statewide participation in Part 1, which collected course and student participation information, and 65 percent overall statewide participation in Part 2, which asked for equipment and building/facilities information. The information provided is self-reported by district superintendents who designated a primary contact for the purposes of data collection. Therefore, all data submitted through the CTE Program Inventory are verified by the local districts.
The background that follows this summary provides information on career and technical education in Minnesota and methodology implemented for the CTE inventory. As the data is outlined in the report, associated common terminology and definitions are established, findings highlighted, and references for more detailed information are provided in the appendices.
6
Key Findings
Participation Although not all districts participated in the CTE Program Inventory, the response rate for establishing statistical reliability was met and exceeded for both parts 1 and 2. For the response rate to indicate reliability and to be able to generalize the enclosed findings statewide, a rate of 47.1 percent was needed. The actual response rate of 60 percent (Part 1: Course Inventory) and 65 percent (Part 2: Equipment Inventory) demonstrates a substantial level of district level engagement in the data collection process.
CTE Courses While not all of Minnesota districts offer all of the available career cluster or program areas, of the 258 districts that responded to the survey, 50 percent or more of the districts offer courses with these program areas or clusters, in order of frequency: Family and Consumer Science; Business Management and Administrative Support; Architecture and Construction; and Agriculture, Food and Natural Resources.
The reported total number of non-duplicative CTE courses reported by respondents offered in the state is 9,019. Within the number reported, the average number of CTE non-duplicative courses taught per district is 35. The most frequently reported non-duplicative courses offered are in the area of Business Management and Administrative Support, followed by Agriculture, Food and Natural Resources, then Architecture and Construction. The most common overall course offerings are in these same areas, including courses in Family and Consumer Science.
CTE courses in Minnesota consist of state-approved courses and non-state-approved courses. Approved courses are submitted through a program approval application process, reviewed by MDE as a course within a program of study and for appropriate teacher licensure requirements. If approved, districts are eligible to apply to receive CTE Revenue and to be supported in part by federal Carl D. Perkins grant funding. Since districts have local control to determine curriculum and course offerings, they may also offer CTE courses that have not been submitted for state approval. The percent of approved and non-approved courses within each program area varies. The total percent of approved (88.1%) and non-approved (11.9%) is a composite of all courses, and the percentages are relative, since some program areas have a larger number of individual courses than others.
Some CTE courses offer some academic credit that meets graduation requirements, as determined by each local district. While the highest percentage of courses offering both CTE elective credit and academic credit towards graduation requirements is in the area of Law Enforcement, the highest number of courses integrated with credits towards graduation requirements are in the areas of Business Management and Administrative Support, followed by Family and Consumer Science, and then Agriculture, Food and Natural Resources.
Of the 9,019 CTE courses offered, the highest percentage of courses within each program area offered fully online is Career Exploration (8.6%), followed by Business and Finance (4.5%) and
7
Information Technology (4.4%.) The program with the greatest number of courses, either partially or fully online, is Business Management and Administrative Support (N=144).
Postsecondary Relationships Articulation credits offered through secondary to postsecondary articulation agreements leading to Certificate, Postsecondary Credential, Concurrent Enrollment or Articulated Credits through CTE courses within each program range from 0 percent to 66.7 percent for each district.
Postsecondary and Business & Industry and Community Organization Advisories The percentage reported by each program area that had either a Business & Industry, Community Organization and/or a Postsecondary faculty partner serving on a CTE Advisory Committee is relative, considering the actual number of districts offering the programs. For example, the program area of Public Affairs/Community Awareness reported that 100 percent of their programs have Advisories, consisting of either postsecondary and/or business, industry or community partners. However, there are only three Public Affairs/Community Awareness Programs reported statewide, in comparison to a statewide 21.1 percent of districts offering (a total of 1,901 courses) in the area of Business Management and Administrative Support, or 44.1 percent reporting partners on Advisory Committees.
Work-Based Learning, Youth Apprenticeship, Handicap, Transition/Disabled Programs Approximately 8 percent of all 9th-12th grade students are enrolled in some form of Work-Based Learning, Youth Apprenticeship, or Transition Disabled program in the state of Minnesota.
Equipment Inventory Career and Tech Ed programs across the state reported having 58,902 pieces of equipment currently in inventory. Districts also reported needing an additional 18,860 equipment items in order to implement CTE programs effectively. Equipment was defined as one or multiple item(s) worth $400 or more, or items considered to be “attractive equipment” (e.g., cameras, computers, iPads, high-tech and/or portable). Multiplying the additional 18,860 equipment items needed by the baseline threshold of $400, it would cost an estimated $7,544,000 as a minimum investment to allow CTE programs to operate effectively. This reflects only the need of the districts that participated in the inventory; the true need is most likely higher. This quantity does not include “other” or additional items listed by respondents in the survey, which were not originally included in the pre-populated list of typical equipment needed for each program area. Therefore, the minimum investment should be viewed as an underestimate of the actual need.
Respondents also reported in kind or donated items used to sustain CTE programs. Districts reported that the percentage of equipment items donated by industry, business, community, or postsecondary partners ranged from 0 percent (Law Enforcement) to 12.3 percent (Hospitality and Culinary Arts) of their overall equipment.
8
Districts reported that 59.2 percent of their existing equipment currently meets industry standards. In addition, the CTE Program Inventory data suggest that programs are operating at 75.7 percent of their actual capacity to serve students based on the equipment they have available. Keep in mind that these percentages do not convey the relative importance or priority of each item. For example, needing a lower cost/lower priority item such as a utility cart as compared with a high cost/high importance item such as a fly-wheel remover, without some automotive repairs would be impossible to complete.
Facilities Status Survey respondents indicated a need for upgraded and added facilities, or any structural or site-related updates needed to meet building and safety codes. Most areas report needing updates. Districts reported that program areas needing updates within the next year range from 0% (Law Enforcement) to 32% (Manufacturing). These percentages and potential resource costs are relative to the overall facility status when considering the number of programs affected, such as Law Enforcement which has 33 actual courses, while 482 Manufacturing courses are reported. Most program areas report that their update cycle needs would occur in the next 2-5 years.
Barriers to Sustaining and Increasing CTE Participation Respondents reported that there are barriers to sustaining and growing CTE programs in their districts. 281 districts responded to a list of potential barriers to student access and sustaining and/or increasing CTE programs. The respondents were asked to enter individual data for each 9th-12th grade school in their district, so there were 348 total responses. In the analysis, these listed items were clustered into themes. The most frequently reported barriers, in order, include:
• • • •
•
•
Lack of school funding, lack of existing teachers with CTE licensure. Lack of teachers pursuing or obtaining CTE licensing. Lack of equipment availability and facilities at the school to expand CTE courses. Lack of flexibility in the student’s school day schedule to meet graduation requirements, and at the same time access CTE courses and/or programs. Lack of flexibility in the student school day schedule and/or choice options at high schools which provide dual credit options granting students both high school academic credit which meet graduation requirements as well as CTE course and/or postsecondary credit. Staff capacity to complete required state and federal documentation and processes for program development.
The CTE Program Inventory data analysis addresses some fundamental questions and should inform a statewide discussion about the status of CTE in Minnesota. Some of the survey data, such as the reported resource needs, student access challenges, and participation and program sustainability and growth barriers, lead to additional questions. We need to further explore the opportunities and challenges that the current status of CTE programming presents to Minnesota students, schools, communities, and the state.
9
Background
In Minnesota, there are academic standards for English language arts, mathematics, science, social studies, and physical education (§120B.021). Standards are also available in the arts, or districts may develop their own. However, there are no state standards for Career and Technical Education (§120B.022). Districts must develop their own standards for career and technical education, health, and world languages. Additionally, some local districts integrate academic standards within career and technical education courses. The National Association of State Directors of Career and Technical Education Consortium, or NASDCTEc, has sought input from 3,500 people in 42 states and the District of Columbia, including those in higher education, K-12, and business, to shape standards, called the Common Career Technical Core for Career and Technical Education. This body of work has informed Minnesota’s division of the career fields into 16 career clusters that represent different industries, and subsets of pathways within each cluster (See Appendix I for a graphic of the career clusters, fields, and pathways).
Minnesota receives the Carl D. Perkins Career Technical Education Grant (these are supplemental and federal funds) to fund career and technical education for schools included in the Perkins state plan of approved programs. The plan is built on a collaborative consortium structure made of up of 26 regional groupings of secondary schools and postsecondary institutions. Funds are coordinated among secondary and postsecondary consortium members and are established to support state goals and performance indicators. Perkins grant funding can be used for leadership activities, program administration and implementation, and professional development. Funding allocations are made on the basis of basic distribution formulas. The secondary basic allocations are based on census data for the population aged 5-17 (30%) and the population aged 5-17 from families of poverty (70%). Postsecondary basic allocations are based on the number of Pell grant recipients in CTE programs. FY14 consortium allocations totaled $14,181,941.45 for Minnesota, and ranged from $134,807 (Hibbing-Chisholm) to $1,427,445 (Hennepin West) depending on the allocation formula. FY14 secondary allocations totaled $5,956,415 and ranged from $35,302 for Hibbing-Chisholm to $556,146 for Minneapolis. Ten percent of the local consortium funds are reserved to meet the needs of high-participation CTE programs and rural areas. The reserve allocations are based on participation in CTE programs and geographical area of member districts.
The purpose of Perkins is to provide individuals with the academic and technical skills needed to succeed in a knowledge- and skills-based economy. Perkins supports career and technical education that prepares its students both for postsecondary education and the careers of their choice.
Local CTE revenue, state educational funds, and Perkins dollars are generally used for the following types of activities:
• • •
Serving as a catalyst for change by driving program improvement. Developing a strong accountability system that ensures quality and results. Strengthening the integration of academic and career and technical education.
10
•
• • • •
•
Ensuring access to career and technical education for special populations, including students with disabilities. Developing and improving curricula. Purchasing equipment to ensure that classrooms have current technology. Providing career guidance and academic counseling services. Providing professional development and technical assistance for teachers, counselors, and administrators. Supporting career and technical education student organizations.
Schools with MDE-approved CTE programs and appropriately licensed CTE teachers are eligible to levy for Career and Technical Education Revenue. The Career and Technical Education Levy is a permissive levy for school districts to give extra support based, in part, on the district’s CTE expenditures, such as CTE teacher salaries (grades 9-12), classroom supplies, teacher travel, and professional development. CTE Levy Revenue provides districts for up to approximately 35 percent of allowable expenditures, and allocated actual was $59,884,035.81 in FY13.
This report outlines the methodology used to gather the information from public and charter schools, districts, departments and individuals who serve students in career and technical education, summarizes the data that was gathered, and provides an analysis of key findings.
Definitions
CTE (Career and Technical Education): Career and technical education courses often utilize a hands-on style of learning that promotes the attainment of technical skills and helps students gain an understanding of how academic concepts are used in the workplace. These programs can help students learn about, explore, and prepare for a career. Many high school career and technical education programs are designed to be the first part of a program of study that continues for up to two years beyond high school at a state technical college or community college.
Postsecondary: Higher learning from grades 13-18 is an optional final stage of formal learning that occurs after secondary education. Carl D. Perkins federal funding supports students in grades 13-14 at the postsecondary level. The postsecondary credential consists of an industry-recognized certificate or certification, a certificate of completion of an apprenticeship, a license recognized by the state or federal government, or an associate or baccalaureate degree.
Secondary: The definition of secondary education varies among school districts but generally includes grades 6, 7, 8, and 9 through 12; grade 5 is sometimes included. In Minnesota, 9th through 12th grade is the most common grade structure for a public, charter, or accredited high school.
Career Cluster/Program Area: The careers and occupations in Minnesota are divided into career clusters that represent different industries, and subsets of pathways within each cluster. For example, Health Sciences is divided into career pathways, or a series of courses that
11

prepare you for an occupational field. An example of an occupational field for Health Sciences is Therapeutic Services, which could lead to a job such as a radiologist or physical therapist.
Approved Programs/Courses: An “approved” CTE program or course indicates that a district has submitted a program approval request, and if it meets established criteria, received an approval from the Minnesota Department of Education. Approved courses and programs and the corresponding CTE teacher licensure requirement are listed in Table C on the MDE website (http://education.state.mn.us/MDE/SchSup/CareerEdAdmin/ProgAppr/).
Non-Approved Programs/Courses: “Non-approved” CTE courses or programs have not been state approved and are not eligible to receive Perkins or CTE Revenue Levy monies if the criteria for approval have not been met.
Non-duplicative Courses: A sequence of courses which are not duplicated (replicated) or counted twice.
12
Methodology
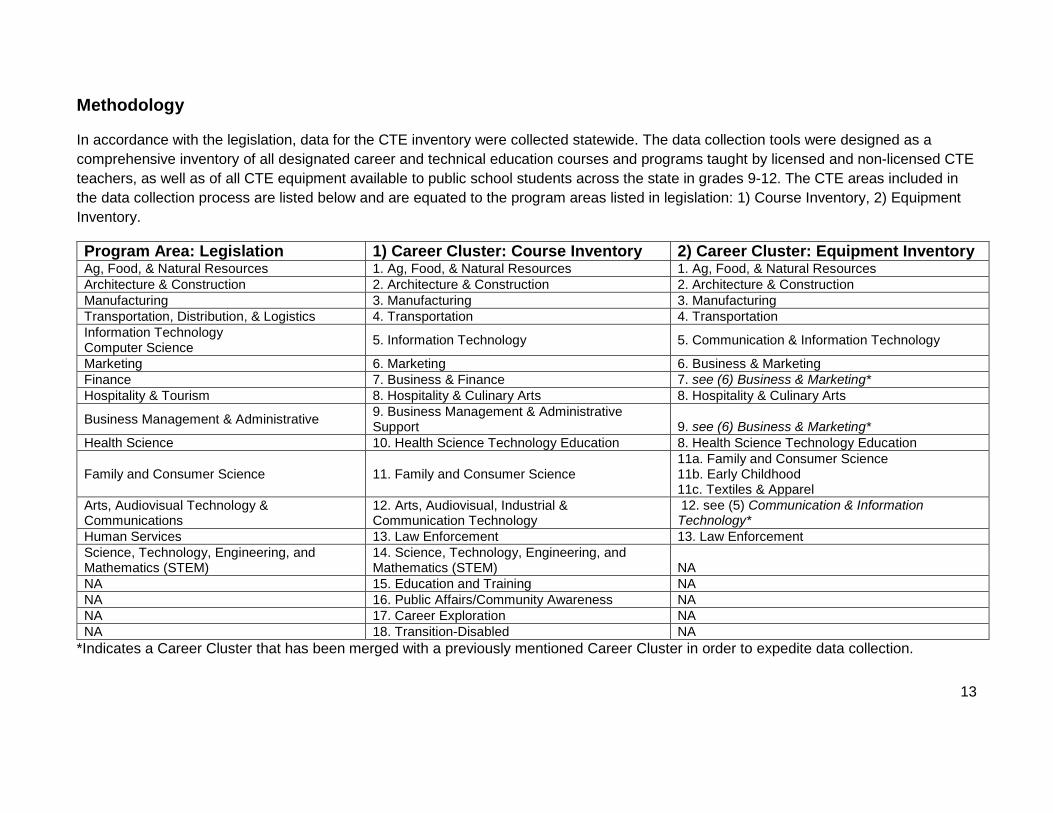
In accordance with the legislation, data for the CTE inventory were collected statewide. The data collection tools were designed as a comprehensive inventory of all designated career and technical education courses and programs taught by licensed and non-licensed CTE teachers, as well as of all CTE equipment available to public school students across the state in grades 9-12. The CTE areas included in the data collection process are listed below and are equated to the program areas listed in legislation: 1) Course Inventory, 2) Equipment Inventory.
Program Area: Legislation 1) Career Cluster: Course Inventory 2) Career Cluster: Equipment Inventory Ag, Food, & Natural Resources 1. Ag, Food, & Natural Resources 1. Ag, Food, & Natural Resources Architecture & Construction 2. Architecture & Construction 2. Architecture & Construction Manufacturing 3. Manufacturing 3. Manufacturing Transportation, Distribution, & Logistics 4. Transportation 4. Transportation Information Technology Computer Science 5. Information Technology 5. Communication & Information Technology
Marketing 6. Marketing 6. Business & Marketing Finance 7. Business & Finance 7. see (6) Business & Marketing* Hospitality & Tourism 8. Hospitality & Culinary Arts 8. Hospitality & Culinary Arts
Business Management & Administrative 9. Business Management & Administrative Support
9. see (6) Business & Marketing*
Health Science 10. Health Science Technology Education 8. Health Science Technology Education
Family and Consumer Science 11. Family and Consumer Science 11a. Family and Consumer Science 11b. Early Childhood 11c. Textiles & Apparel
Arts, Audiovisual Technology & Communications
12. Arts, Audiovisual, Industrial & Communication Technology
12. see (5) Communication & Information Technology*
Human Services 13. Law Enforcement 13. Law Enforcement Science, Technology, Engineering, and Mathematics (STEM)
14. Science, Technology, Engineering, and Mathematics (STEM) NA
NA 15. Education and Training NA NA 16. Public Affairs/Community Awareness NA NA 17. Career Exploration NA NA 18. Transition-Disabled NA
*Indicates a Career Cluster that has been merged with a previously mentioned Career Cluster in order to expedite data collection.
13

All Minnesota independent and special school districts, intermediate, integration, service and vocational cooperatives, as well as charter schools serving grades 9-12 were invited to participate in the CTE Program Inventory data collection process (N=433).
The data collection content, terminology, and instruments were developed and refined through a process that involved career and technical education and evaluation experts at the Minnesota Department of Education (MDE) and community stakeholder groups, monitored by a lead team of MDE administrators, government relations, education specialists, information technology, administrative support, and data analytics staff.
Questions were written in direct alignment with the requirements as outlined in statute. Additional questions regarding business and industry partnerships, experiential learning, academic and graduation standards, facilities, and participation barriers were added due to their relevance and importance to the topic. The draft questions were reviewed by internal experts and external organizations in order to gather feedback. Then, the final questions and data collection system was field tested for cogency and clarity with CTE experts, as well as educators not as familiar with CTE. Adjustments to questions were made based on feedback from these field experts.
The data collection process began by contacting superintendents. Superintendents received an email from the commissioner of education inviting them to participate in the CTE Program Inventory. Superintendents were contacted up to four times by email and phone, with the invitation to designate someone within their district to act as a primary contact for the CTE Program Inventory data collection process. These primary contacts included principals, administrative, clerical, school support or finance staff, CTE teachers, Perkins consortium leaders, and more; although district site teams were often involved with the data collection process, the point of communication with MDE and the collection process occurred via the primary contact as designated by each superintendent.
Considering the volume of data being gathered and the various persons having access to the needed information, the data collection process was implemented in two parts. Part 1: Course Inventory was thought to be most relevant for the district administrative office personnel who are most likely to hold course catalog records. In order to gather these data, secure access through a SharePoint site was established as a means of disseminating all data collection tools, and retrieving the final Part 1: Course Inventory excel file once complete.
Each district received a customized Part 1: Course Inventory data file which was pre-populated with all known course information on record with MDE as part of a district’s CTE Approved Program. Districts were asked to update their Part 1: Course Inventory file according to only those courses they offered during the last full school year (2013-14) so that one full year of CTE courses are represented in the data. Please note that some districts only offer particular course sequences every other school year. However, to establish consistency, only those courses offered during the 2013-14 school year are included in this report. Districts were also asked to list any additional CTE courses that were not currently part of an approved program, for
14
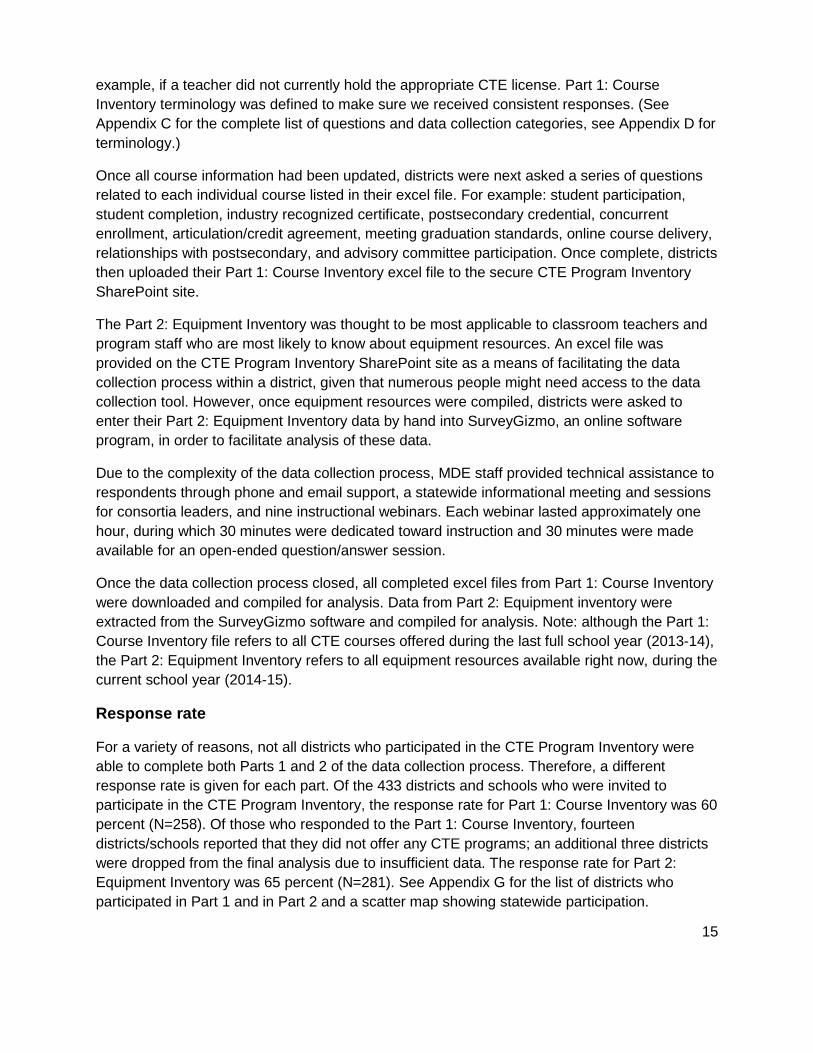
example, if a teacher did not currently hold the appropriate CTE license. Part 1: Course Inventory terminology was defined to make sure we received consistent responses. (See Appendix C for the complete list of questions and data collection categories, see Appendix D for terminology.)
Once all course information had been updated, districts were next asked a series of questions related to each individual course listed in their excel file. For example: student participation, student completion, industry recognized certificate, postsecondary credential, concurrent enrollment, articulation/credit agreement, meeting graduation standards, online course delivery, relationships with postsecondary, and advisory committee participation. Once complete, districts then uploaded their Part 1: Course Inventory excel file to the secure CTE Program Inventory SharePoint site.
The Part 2: Equipment Inventory was thought to be most applicable to classroom teachers and program staff who are most likely to know about equipment resources. An excel file was provided on the CTE Program Inventory SharePoint site as a means of facilitating the data collection process within a district, given that numerous people might need access to the data collection tool. However, once equipment resources were compiled, districts were asked to enter their Part 2: Equipment Inventory data by hand into SurveyGizmo, an online software program, in order to facilitate analysis of these data.
Due to the complexity of the data collection process, MDE staff provided technical assistance to respondents through phone and email support, a statewide informational meeting and sessions for consortia leaders, and nine instructional webinars. Each webinar lasted approximately one hour, during which 30 minutes were dedicated toward instruction and 30 minutes were made available for an open-ended question/answer session.
Once the data collection process closed, all completed excel files from Part 1: Course Inventory were downloaded and compiled for analysis. Data from Part 2: Equipment inventory were extracted from the SurveyGizmo software and compiled for analysis. Note: although the Part 1: Course Inventory file refers to all CTE courses offered during the last full school year (2013-14), the Part 2: Equipment Inventory refers to all equipment resources available right now, during the current school year (2014-15).
Response rate
For a variety of reasons, not all districts who participated in the CTE Program Inventory were able to complete both Parts 1 and 2 of the data collection process. Therefore, a different response rate is given for each part. Of the 433 districts and schools who were invited to participate in the CTE Program Inventory, the response rate for Part 1: Course Inventory was 60 percent (N=258). Of those who responded to the Part 1: Course Inventory, fourteen districts/schools reported that they did not offer any CTE programs; an additional three districts were dropped from the final analysis due to insufficient data. The response rate for Part 2: Equipment Inventory was 65 percent (N=281). See Appendix G for the list of districts who participated in Part 1 and in Part 2 and a scatter map showing statewide participation.
15
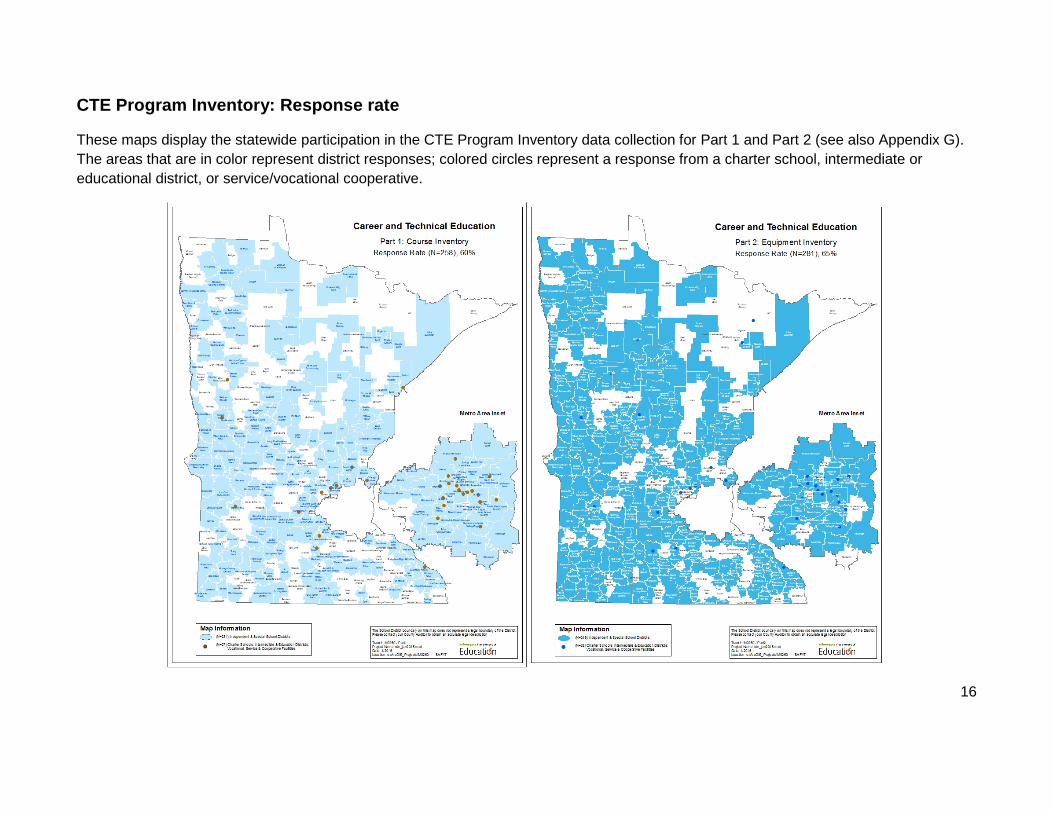
CTE Program Inventory: Response rate
These maps display the statewide participation in the CTE Program Inventory data collection for Part 1 and Part 2 (see also Appendix G). The areas that are in color represent district responses; colored circles represent a response from a charter school, intermediate or educational district, or service/vocational cooperative.
16
Part 1: Course Inventory
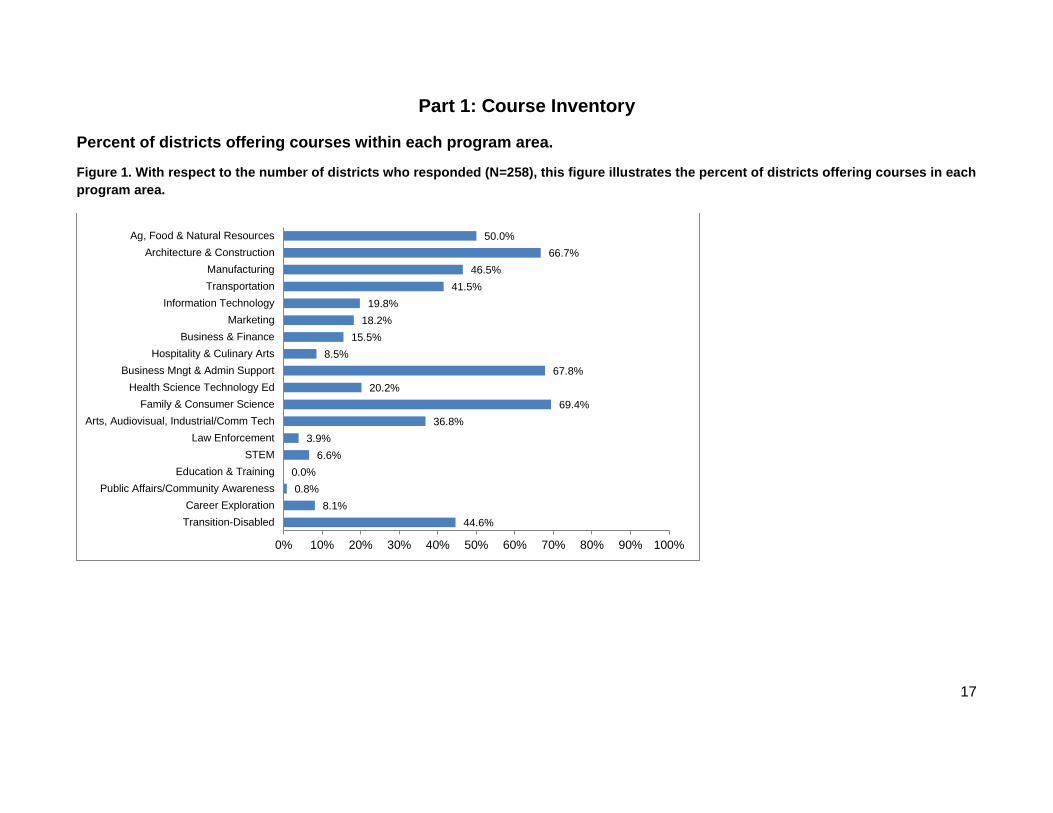
Percent of districts offering courses within each program area.
Figure 1. With respect to the number of districts who responded (N=258), this figure illustrates the percent of districts offering courses in each program area.
44.6%8.1%
0.8%0.0%
6.6%3.9%
36.8%69.4%
20.2%67.8%
8.5%15.5%
18.2%19.8%
41.5%46.5%
66.7%50.0%
0% 10% 20% 30% 40% 50% 60% 70% 80% 90% 100%
Transition-DisabledCareer Exploration
Public Affairs/Community AwarenessEducation & Training
STEMLaw Enforcement
Arts, Audiovisual, Industrial/Comm TechFamily & Consumer Science
Health Science Technology EdBusiness Mngt & Admin Support
Hospitality & Culinary ArtsBusiness & Finance
MarketingInformation Technology
TransportationManufacturing
Architecture & ConstructionAg, Food & Natural Resources
17
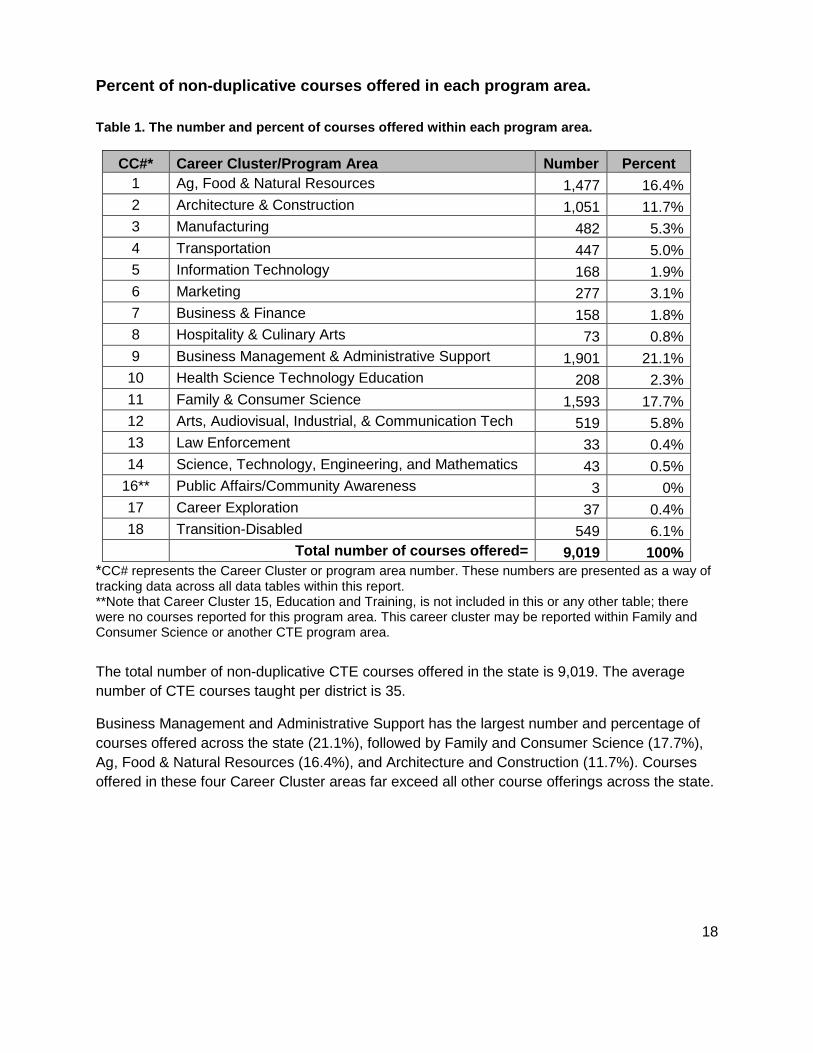
Percent of non-duplicative courses offered in each program area. Table 1. The number and percent of courses offered within each program area.
CC#* Career Cluster/Program Area Number Percent 1 Ag, Food & Natural Resources 1,477 16.4% 2 Architecture & Construction 1,051 11.7% 3 Manufacturing 482 5.3% 4 Transportation 447 5.0% 5 Information Technology 168 1.9% 6 Marketing 277 3.1% 7 Business & Finance 158 1.8% 8 Hospitality & Culinary Arts 73 0.8% 9 Business Management & Administrative Support 1,901 21.1%
10 Health Science Technology Education 208 2.3% 11 Family & Consumer Science 1,593 17.7% 12 Arts, Audiovisual, Industrial, & Communication Tech 519 5.8% 13 Law Enforcement 33 0.4% 14 Science, Technology, Engineering, and Mathematics 43 0.5%
16** Public Affairs/Community Awareness 3 0% 17 Career Exploration 37 0.4% 18 Transition-Disabled 549 6.1% NA Total number of courses offered= 9,019 100%
*CC# represents the Career Cluster or program area number. These numbers are presented as a way of tracking data across all data tables within this report. **Note that Career Cluster 15, Education and Training, is not included in this or any other table; there were no courses reported for this program area. This career cluster may be reported within Family and Consumer Science or another CTE program area.
The total number of non-duplicative CTE courses offered in the state is 9,019. The average number of CTE courses taught per district is 35.
Business Management and Administrative Support has the largest number and percentage of courses offered across the state (21.1%), followed by Family and Consumer Science (17.7%), Ag, Food & Natural Resources (16.4%), and Architecture and Construction (11.7%). Courses offered in these four Career Cluster areas far exceed all other course offerings across the state.
18
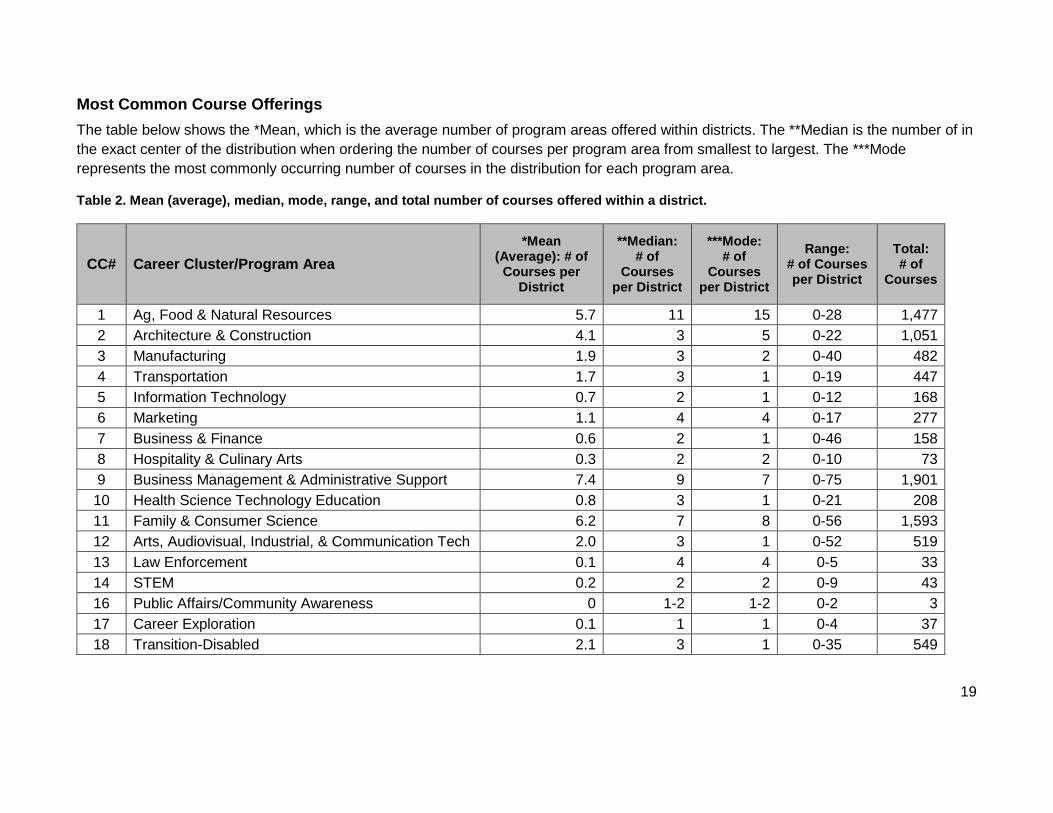
Most Common Course Offerings The table below shows the *Mean, which is the average number of program areas offered within districts. The **Median is the number of in the exact center of the distribution when ordering the number of courses per program area from smallest to largest. The ***Mode represents the most commonly occurring number of courses in the distribution for each program area.
Table 2. Mean (average), median, mode, range, and total number of courses offered within a district.
CC# Career Cluster/Program Area *Mean
(Average): # of Courses per
District
**Median: # of
Courses per District
***Mode: # of
Courses per District
Range: # of Courses per District
Total: # of
Courses
1 Ag, Food & Natural Resources 5.7 11 15 0-28 1,477 2 Architecture & Construction 4.1 3 5 0-22 1,051 3 Manufacturing 1.9 3 2 0-40 482 4 Transportation 1.7 3 1 0-19 447 5 Information Technology 0.7 2 1 0-12 168 6 Marketing 1.1 4 4 0-17 277 7 Business & Finance 0.6 2 1 0-46 158 8 Hospitality & Culinary Arts 0.3 2 2 0-10 73 9 Business Management & Administrative Support 7.4 9 7 0-75 1,901 10 Health Science Technology Education 0.8 3 1 0-21 208 11 Family & Consumer Science 6.2 7 8 0-56 1,593 12 Arts, Audiovisual, Industrial, & Communication Tech 2.0 3 1 0-52 519 13 Law Enforcement 0.1 4 4 0-5 33 14 STEM 0.2 2 2 0-9 43 16 Public Affairs/Community Awareness 0 1-2 1-2 0-2 3 17 Career Exploration 0.1 1 1 0-4 37 18 Transition-Disabled 2.1 3 1 0-35 549
19
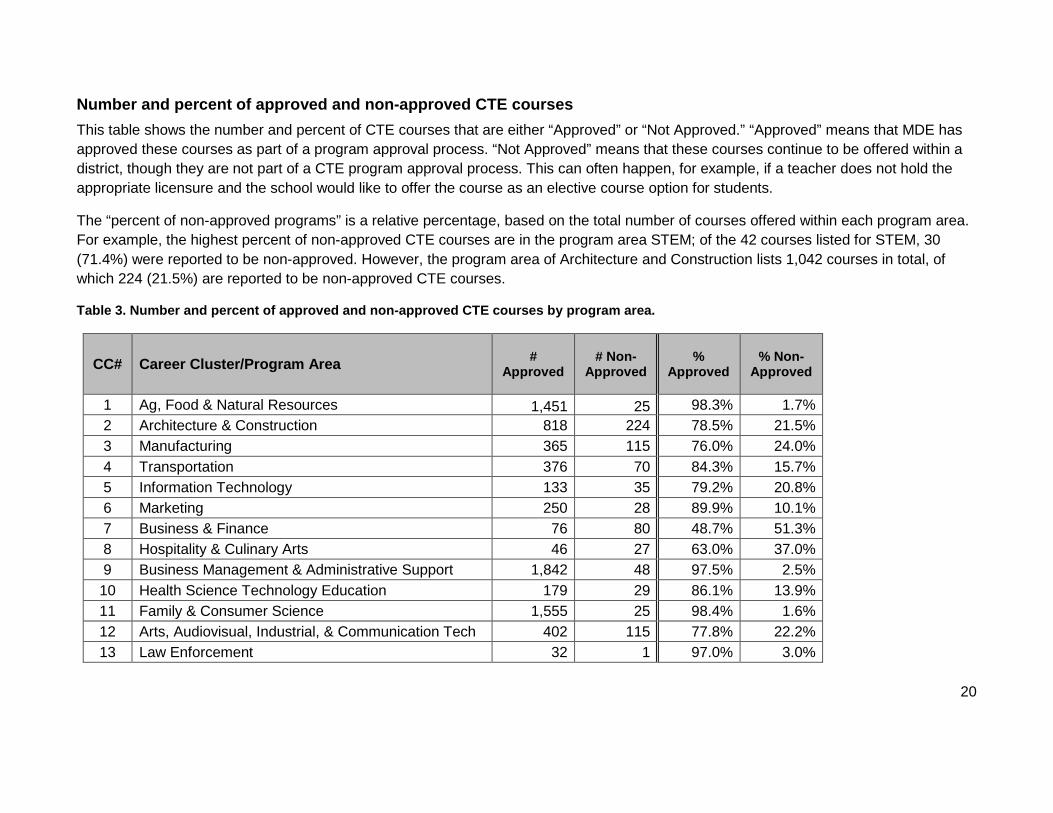
Number and percent of approved and non-approved CTE courses This table shows the number and percent of CTE courses that are either “Approved” or “Not Approved.” “Approved” means that MDE has approved these courses as part of a program approval process. “Not Approved” means that these courses continue to be offered within a district, though they are not part of a CTE program approval process. This can often happen, for example, if a teacher does not hold the appropriate licensure and the school would like to offer the course as an elective course option for students.
The “percent of non-approved programs” is a relative percentage, based on the total number of courses offered within each program area. For example, the highest percent of non-approved CTE courses are in the program area STEM; of the 42 courses listed for STEM, 30 (71.4%) were reported to be non-approved. However, the program area of Architecture and Construction lists 1,042 courses in total, of which 224 (21.5%) are reported to be non-approved CTE courses.
Table 3. Number and percent of approved and non-approved CTE courses by program area.
CC# Career Cluster/Program Area # Approved
# Non- Approved
% Approved
% Non- Approved
1 Ag, Food & Natural Resources 1,451 25 98.3% 1.7% 2 Architecture & Construction 818 224 78.5% 21.5% 3 Manufacturing 365 115 76.0% 24.0% 4 Transportation 376 70 84.3% 15.7% 5 Information Technology 133 35 79.2% 20.8% 6 Marketing 250 28 89.9% 10.1% 7 Business & Finance 76 80 48.7% 51.3% 8 Hospitality & Culinary Arts 46 27 63.0% 37.0% 9 Business Management & Administrative Support 1,842 48 97.5% 2.5% 10 Health Science Technology Education 179 29 86.1% 13.9% 11 Family & Consumer Science 1,555 25 98.4% 1.6% 12 Arts, Audiovisual, Industrial, & Communication Tech 402 115 77.8% 22.2% 13 Law Enforcement 32 1 97.0% 3.0%
20

CC# Career Cluster/Program Area # Approved
# Non- Approved
% Approved
% Non- Approved
14 Science, Technology, Engineering, and Mathematics 12 30 28.6% 71.4% 16 Public Affairs/Community Awareness 2 1 66.7% 33.3% 17 Career Exploration 12 25 32.4% 67.6% 18 Transition-Disabled 532 16 97.1% 2.9% NA Total= 6,632 894 88.6% 11.3%
*Please note that the percent of Approved and Non-Approved totals to 100%. **Not all courses were reported as either Approved or Non-Approved; some course were reported as “Unknown.”
21
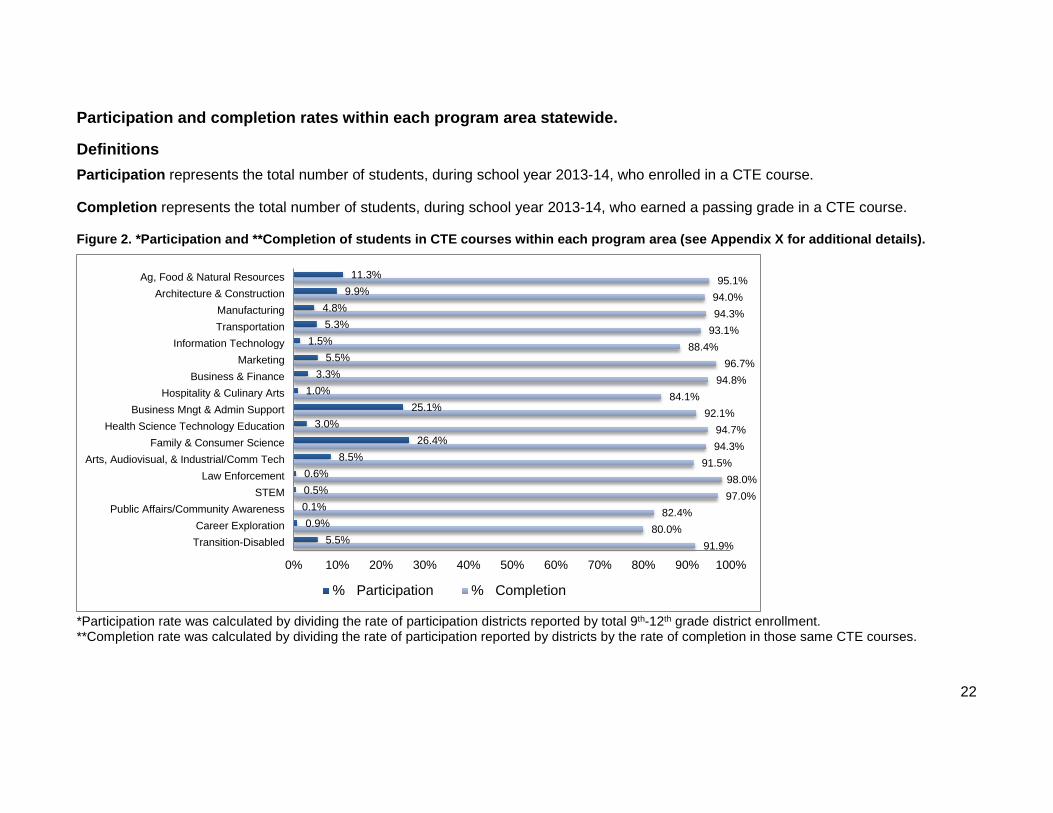
Participation and completion rates within each program area statewide.
Definitions Participation represents the total number of students, during school year 2013-14, who enrolled in a CTE course.
Completion represents the total number of students, during school year 2013-14, who earned a passing grade in a CTE course.
Figure 2. *Participation and **Completion of students in CTE courses within each program area (see Appendix X for additional details).
91.9%80.0%
82.4%97.0%98.0%
91.5%94.3%94.7%
92.1%84.1%
94.8%96.7%
88.4%93.1%94.3%94.0%95.1%
5.5%0.9%
0.1%0.5%0.6%
8.5%26.4%
3.0%25.1%
1.0%3.3%
5.5%1.5%
5.3%4.8%
9.9%11.3%
0% 10% 20% 30% 40% 50% 60% 70% 80% 90% 100%
Transition-DisabledCareer Exploration
Public Affairs/Community AwarenessSTEM
Law EnforcementArts, Audiovisual, & Industrial/Comm Tech
Family & Consumer ScienceHealth Science Technology Education
Business Mngt & Admin SupportHospitality & Culinary Arts
Business & FinanceMarketing
Information TechnologyTransportationManufacturing
Architecture & ConstructionAg, Food & Natural Resources
% Participation % Completion
*Participation rate was calculated by dividing the rate of participation districts reported by total 9th-12th grade district enrollment. **Completion rate was calculated by dividing the rate of participation reported by districts by the rate of completion in those same CTE courses.
22
Interpretation: Of the districts who responded to the CTE Program Inventory data request, 26.4 percent of the district-wide 9-12th grade student population participated in one or more Family and Consumer Science courses. Of the students who participated in one or more Family and Consumer Science course, 94.3 percent successfully completed the course.
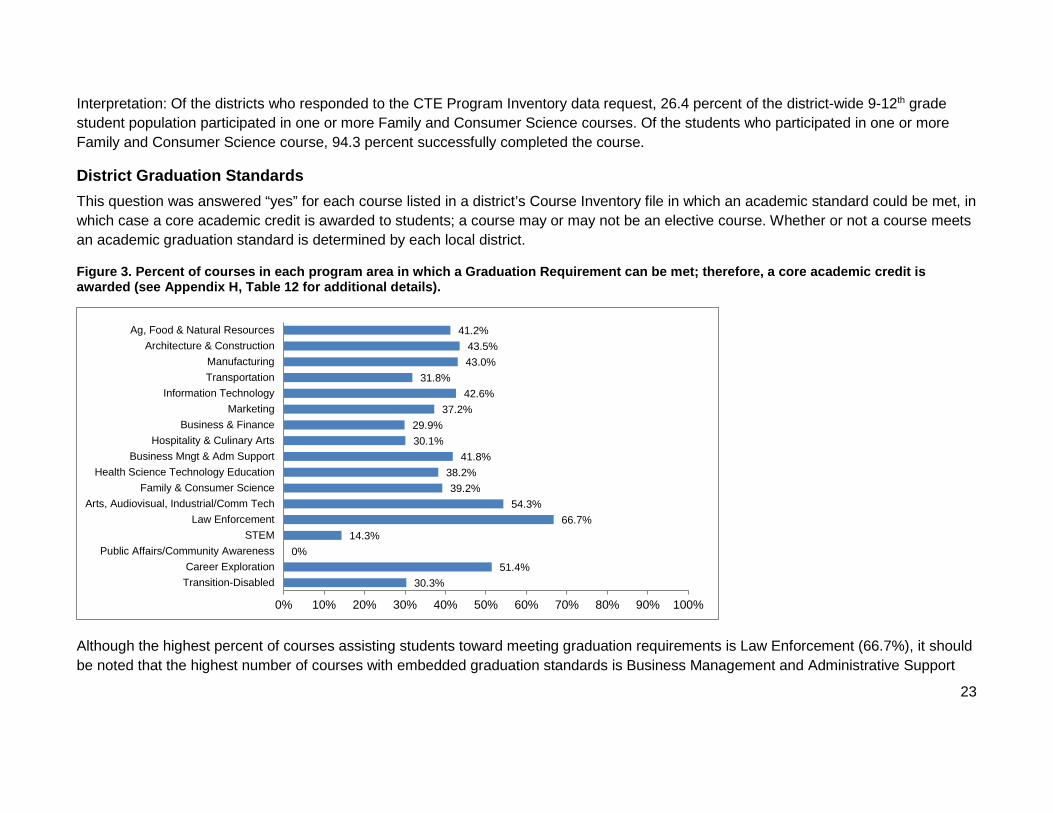
District Graduation Standards This question was answered “yes” for each course listed in a district’s Course Inventory file in which an academic standard could be met, in which case a core academic credit is awarded to students; a course may or may not be an elective course. Whether or not a course meets an academic graduation standard is determined by each local district.
Figure 3. Percent of courses in each program area in which a Graduation Requirement can be met; therefore, a core academic credit is awarded (see Appendix H, Table 12 for additional details).
30.3%51.4%
0%14.3%
66.7%54.3%
39.2%38.2%
41.8%30.1%29.9%
37.2%42.6%
31.8%43.0%43.5%
41.2%
0% 10% 20% 30% 40% 50% 60% 70% 80% 90% 100%
Transition-DisabledCareer Exploration
Public Affairs/Community AwarenessSTEM
Law EnforcementArts, Audiovisual, Industrial/Comm Tech
Family & Consumer ScienceHealth Science Technology Education
Business Mngt & Adm SupportHospitality & Culinary Arts
Business & FinanceMarketing
Information TechnologyTransportationManufacturing
Architecture & ConstructionAg, Food & Natural Resources
Although the highest percent of courses assisting students toward meeting graduation requirements is Law Enforcement (66.7%), it should be noted that the highest number of courses with embedded graduation standards is Business Management and Administrative Support
23
(1,752), followed by Family and Consumer Science (1,441), and Agriculture, Food, and Natural Resources (1,339). (See Appendix H, Table 12 for additional details.)
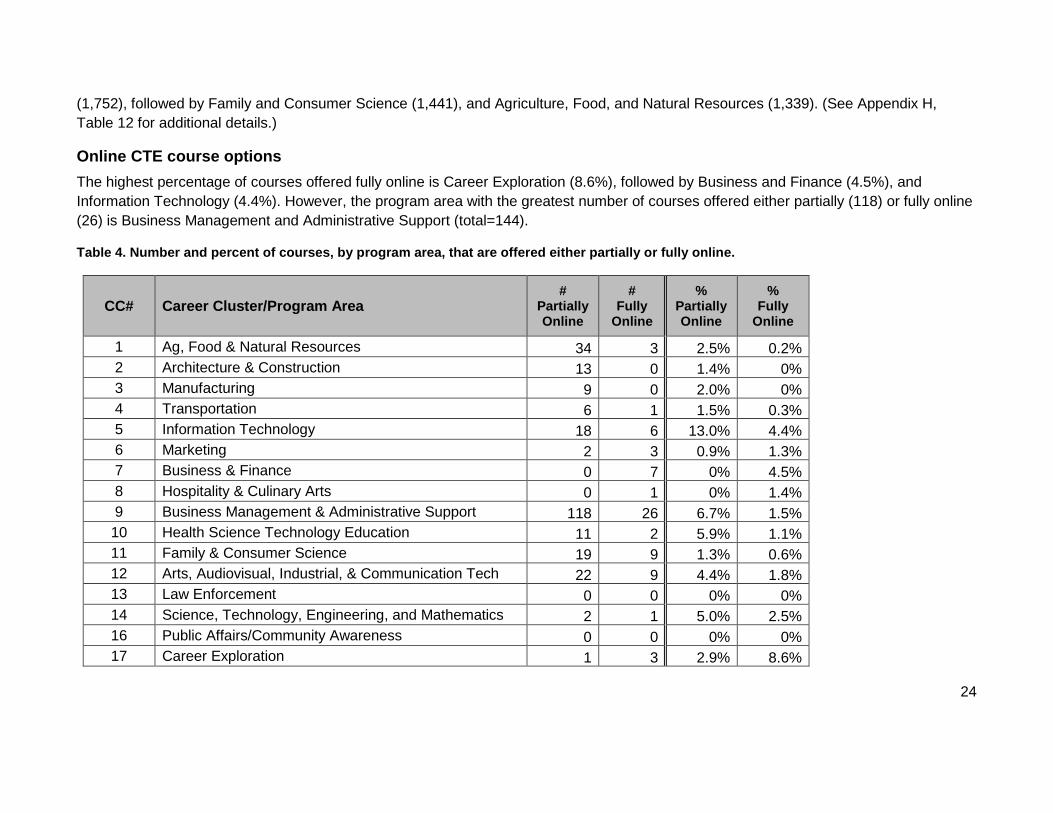
Online CTE course options The highest percentage of courses offered fully online is Career Exploration (8.6%), followed by Business and Finance (4.5%), and Information Technology (4.4%). However, the program area with the greatest number of courses offered either partially (118) or fully online (26) is Business Management and Administrative Support (total=144).
Table 4. Number and percent of courses, by program area, that are offered either partially or fully online.
CC# Career Cluster/Program Area #
Partially Online
# Fully
Online
% Partially Online
% Fully
Online
1 Ag, Food & Natural Resources 34 3 2.5% 0.2% 2 Architecture & Construction 13 0 1.4% 0% 3 Manufacturing 9 0 2.0% 0% 4 Transportation 6 1 1.5% 0.3% 5 Information Technology 18 6 13.0% 4.4% 6 Marketing 2 3 0.9% 1.3% 7 Business & Finance 0 7 0% 4.5% 8 Hospitality & Culinary Arts 0 1 0% 1.4% 9 Business Management & Administrative Support 118 26 6.7% 1.5% 10 Health Science Technology Education 11 2 5.9% 1.1% 11 Family & Consumer Science 19 9 1.3% 0.6% 12 Arts, Audiovisual, Industrial, & Communication Tech 22 9 4.4% 1.8% 13 Law Enforcement 0 0 0% 0% 14 Science, Technology, Engineering, and Mathematics 2 1 5.0% 2.5% 16 Public Affairs/Community Awareness 0 0 0% 0% 17 Career Exploration 1 3 2.9% 8.6%
24
CC# Career Cluster/Program Area #
Partially Online
# Fully
Online
% Partially Online
% Fully
Online
18 Transition-Disabled 0 2 0% 0.4% NA Total= 255 73 3.0% 1.2%
*Note that the numbers in this table do not total previously reported course numbers; many courses for this question were coded as unknown.
Local College or Third Party Vendors
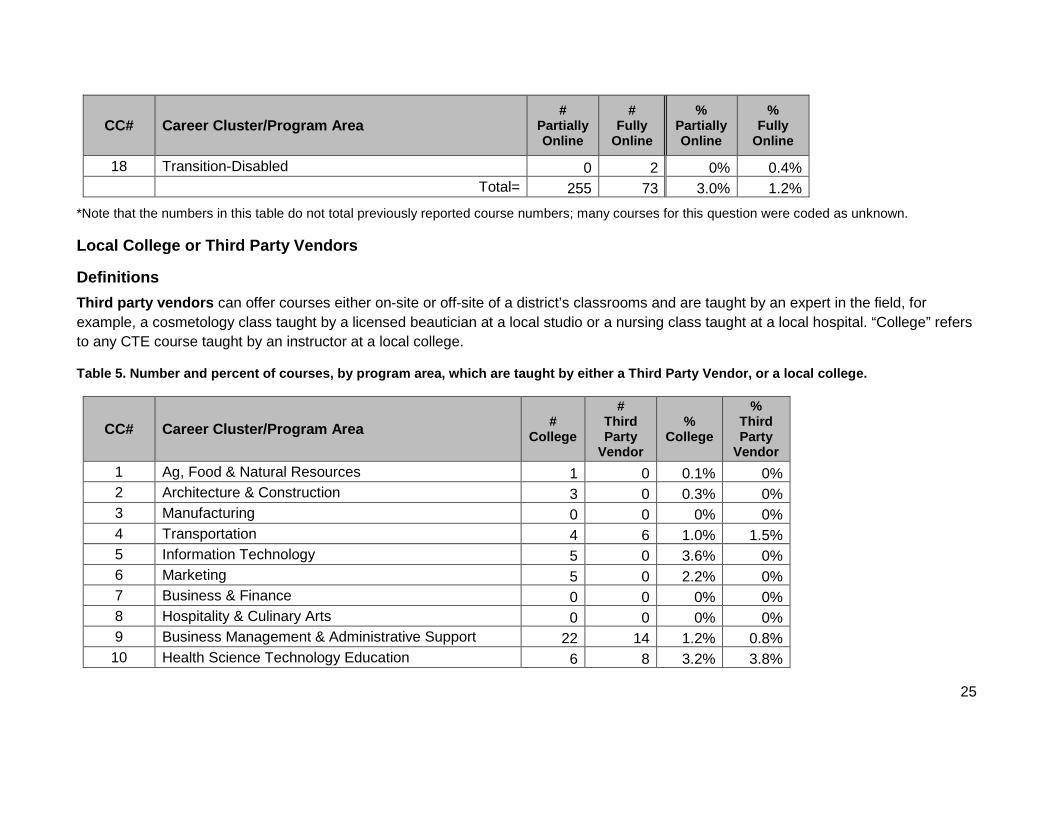
Definitions Third party vendors can offer courses either on-site or off-site of a district’s classrooms and are taught by an expert in the field, for example, a cosmetology class taught by a licensed beautician at a local studio or a nursing class taught at a local hospital. “College” refers to any CTE course taught by an instructor at a local college.
Table 5. Number and percent of courses, by program area, which are taught by either a Third Party Vendor, or a local college.
CC# Career Cluster/Program Area # College
# Third Party
Vendor
% College
% Third Party
Vendor 1 Ag, Food & Natural Resources 1 0 0.1% 0% 2 Architecture & Construction 3 0 0.3% 0% 3 Manufacturing 0 0 0% 0% 4 Transportation 4 6 1.0% 1.5% 5 Information Technology 5 0 3.6% 0% 6 Marketing 5 0 2.2% 0% 7 Business & Finance 0 0 0% 0% 8 Hospitality & Culinary Arts 0 0 0% 0% 9 Business Management & Administrative Support 22 14 1.2% 0.8% 10 Health Science Technology Education 6 8 3.2% 3.8%
25

CC# Career Cluster/Program Area # College
# Third Party
Vendor
% College
% Third Party
Vendor 11 Family & Consumer Science 3 3 0.2% 0.2% 12 Arts, Audiovisual, Industrial, & Communication Tech 0 0 0% 0% 13 Law Enforcement 0 0 0% 0% 14 Science, Technology, Engineering, and Mathematics 0 0 0% 0% 16 Public Affairs/Community Awareness 0 0 0% 0% 17 Career Exploration 0 0 0% 0% 18 Transition-Disabled 0 2 0% 0.4% NA Total= 49 33 0.6% 0.4%
Relationships with postsecondary institutions
Definitions Transcripted College Credits: students taking a course at their local high school will be able to receive transferable college credits once the student enrolls into the specific college with whom the agreement is held.
Articulation/Credit Agreements: Articulated credits are designed to provide students with a non-duplicative progression of courses or achievement between high school and postsecondary school leading to credit for prior learning, sometimes leading to college credit, degrees or certification in a program. Students who take this course are awarded college credit if students and once the student enrolls into the college with whom the agreement is held.
Concurrent Enrollment: Students taking a concurrent course will receive transferable college credits such as PSEO (Postsecondary Enrollment Options), College in the Schools, Concurrent Enrollment, or Dual-Credit.
Certificate or Credential: courses that offer a credential consisting of an industry-recognized certificate or certification, a certificate of completion of an apprenticeship, a license recognized by the state or federal government, or an associate or baccalaureate degree. Industry recognized and/or postsecondary credential or certificate can lead to a recognized skill or job opportunity. For example, a CNA
26

certificate or American Welding Society certificate can lead to meeting the qualifications for employment. The focus is on Business & Industry or employment attainment. It is generally required by the postsecondary institutions that the course be taught by a teacher credentialed according to the postsecondary institution’s credentialing requirements.
Table 6. Percent of courses within each program area leading to a Certificate, Postsecondary Credential, Concurrent Enrollment, or an Articulation credit/agreement (see Appendix H, Table 14 for the number of courses for each of these items).
CC# Career Cluster/Program Area Certificate Postsecondary Credential
Concurrent Enrollment
Articulation Credit
1 Ag, Food & Natural Resources 2.2% 4.4% 4.2% 14.8% 2 Architecture & Construction 4.6% 7.1% 4.0% 16.0% 3 Manufacturing 5.5% 16.0% 6.1% 27.2% 4 Transportation 12.6% 17.1% 6.7% 29.3% 5 Information Technology 22.9% 19.3% 13.6% 31.0% 6 Marketing 6.1% 10.4% 3.8% 35.3% 7 Business & Finance 1.9% 1.3% 3.8% 14.7% 8 Hospitality & Culinary Arts 19.2% 13.6% 0% 21.9% 9 Business Management & Administrative Support 5.7% 13.3% 6.3% 24.3% 10 Health Science Technology Education 45.6% 37.7% 20.6% 42.3% 11 Family & Consumer Science 3.2% 6.7% 1.3% 14.5% 12 Arts, Audiovisual, Industrial, & Communication Tech 9.2% 16.4% 6.0% 28.0% 13 Law Enforcement 0% 28.6% 28.6% 57.1% 14 Science, Technology, Engineering, and Mathematics 4.8% 9.5% 16.7% 16.7% 16 Public Affairs/Community Awareness 66.7% 0% 33.3% 66.7% 17 Career Exploration 5.6% 5.6% 0% 2.8% 18 Transition-Disabled 1.1% 2.9% 0% 1.1% NA Total= 6.0% 10.2% 4.7% 19.9%
27

Advisory Committees
Definitions Advisory Committee: CTE Advisory Committee indicates a group of persons with competence or interests in an occupational field related to the program being served. Individuals selected to participate in Advisory Committees offer advice to teachers or administrators regarding career and technical education. The primary purpose of the CTE program advisory committee is to assist educators in establishing, operating, and evaluating the CTE program which serves the needs of the students, the community, and the business/industry partners; and to provide expertise and insight about current/future industry and technological changes. A prerequisite for program approval in the state of Minnesota is having an actively engaged and functioning Advisory Committee.
Business and Industry Partner: a single person, group of people, company, or group of companies that has a vital interest in promoting and supporting a specific Career and Technical Education program through business and industry by way of monies, grants, mentorship, internship, work experience, or educational opportunities.
Community Organization Partner: Organizational partnerships that are cooperative, collaborative relationships that exist between two or more independent community partners to increase administrative efficiency and/or programmatic impact through shared, transferred or combined services, resources or programs.
Treatment of the data For questions pertaining to Advisory Committees, the data were coded in the following way. Districts were asked to answer either “Yes” or “No” for each program area offered within their district, however, there were 95 cases in which districts answered “Yes” or “No” for each course listed within a program area. In these situations the following rule was applied. If districts answered “Yes” anywhere to any course listed within a program area the final answer was then coded as “Yes.” This means that for these 95 cases, if a district answered “Yes” to a course listed anywhere within the program areas, then they are considered to have a Business or Industry Recognized partner related to the field serving on their Advisory Committee. However, if no course within a given program area was listed as a “Yes” then the response was coded as a “No”, meaning there was no Business or Industry partner related to the field serving on their Advisory Committee.
Findings Although the highest percentage of Business and Community Involvement on an Advisory Committee was reported in the area of Public Affairs/Community Awareness (100%), keep in mind this represents 2 programs. The second highest level of involvement in Advisory
28
Committees was reported in the area of Hospitality and Culinary Arts (57.9%, n=11 programs). Overall, Business and Industry’s participation on CTE program Advisory Committees was found to be higher than that of either Community Organizations, or Postsecondary Faculty across all program areas. The lowest overall level of partnerships was reported in the areas of Career Exploration and STEM programs.
29
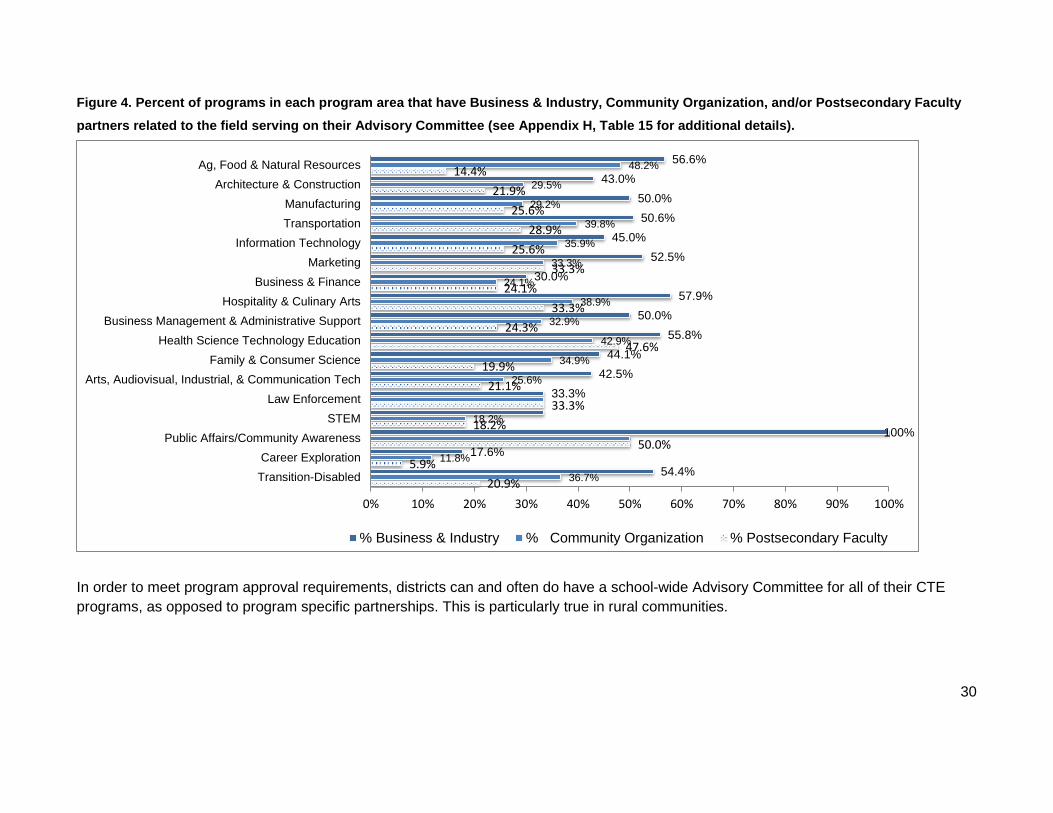
Figure 4. Percent of programs in each program area that have Business & Industry, Community Organization, and/or Postsecondary Faculty partners related to the field serving on their Advisory Committee (see Appendix H, Table 15 for additional details).
20.9%5.9%
50.0%18.2%
33.3%21.1%
19.9%47.6%
24.3%33.3%
24.1%33.3%
25.6%28.9%
25.6%21.9%
14.4%
36.7%
11.8%
18.2%
25.6%
34.9%
42.9%
32.9%
38.9%
24.1%
33.3%
35.9%
39.8%
29.2%
29.5%
48.2%
54.4%17.6%
100%
33.3%42.5%
44.1%55.8%
50.0%57.9%
30.0%52.5%
45.0%50.6%50.0%
43.0%56.6%
0% 10% 20% 30% 40% 50% 60% 70% 80% 90% 100%
Transition-DisabledCareer Exploration
Public Affairs/Community AwarenessSTEM
Law EnforcementArts, Audiovisual, Industrial, & Communication Tech
Family & Consumer ScienceHealth Science Technology Education
Business Management & Administrative SupportHospitality & Culinary Arts
Business & FinanceMarketing
Information TechnologyTransportationManufacturing
Architecture & ConstructionAg, Food & Natural Resources
% Business & Industry % Community Organization % Postsecondary Faculty
In order to meet program approval requirements, districts can and often do have a school-wide Advisory Committee for all of their CTE programs, as opposed to program specific partnerships. This is particularly true in rural communities.
30
Partnership work within or as a part of approved programming: experiential learning
Definitions Experiential Learning: the process of making meaning or learning from direct experiences such as job shadowing, field trips, mentorships, internships, apprenticeships, work-based learning, work-based learning handicapped/transition disabled, or service learning.
Internship: an opportunity offered by an employer to potential employees, often called "interns," to work at a firm for a fixed/limited period of time. Internships may be called "placements," "work placements" or "industrial placements."
Pre-Apprenticeship: a program that teaches basic technical and job-readiness skills for a designated occupation or occupational sector, to prepare participants for Registered Apprenticeship training. PA normally features a classroom and/or lab setting, but may also involve work-site visits, job-shadowing, or other activities outside the program facility, to provide exposure to the work environment for the targeted occupation(s).
Service Learning: a teaching strategy that utilizes learning, which engages all learners in hands-on academic projects in the community. This helps students meet learning objectives and strengthens communities by addressing genuine community needs.
Work-Based learning, Youth Apprenticeship, or Work Experience: Handicap/Transition Disabled Work-Based Learning: learning in the context of a work-related environment. Through work-based learning, students acquire knowledge and skills through performing tasks while placed in a work experience within a CTE career field. Students develop employment-related competencies through their placement experience. Work-based learning is often offered in conjunction with classroom or related learning
Youth Apprenticeship: a learning system that prepares students for work by giving them a combination of classroom instruction and paid on-the-job training. Students might go straight into the job market from an apprenticeship. In this education model, students obtain a set of well-defined occupational standards, skills, and abilities by learning concepts in the classroom and integrating those concepts in a work setting. Youth Apprenticeship requires collaboration between business and industry partnerships and education.
Work Experience Learning Handicapped/Transition Disabled: Work experience opportunities for students who may have a learning disability, handicap, or who may qualify as transition/disabled. This is a qualification-based program.
31
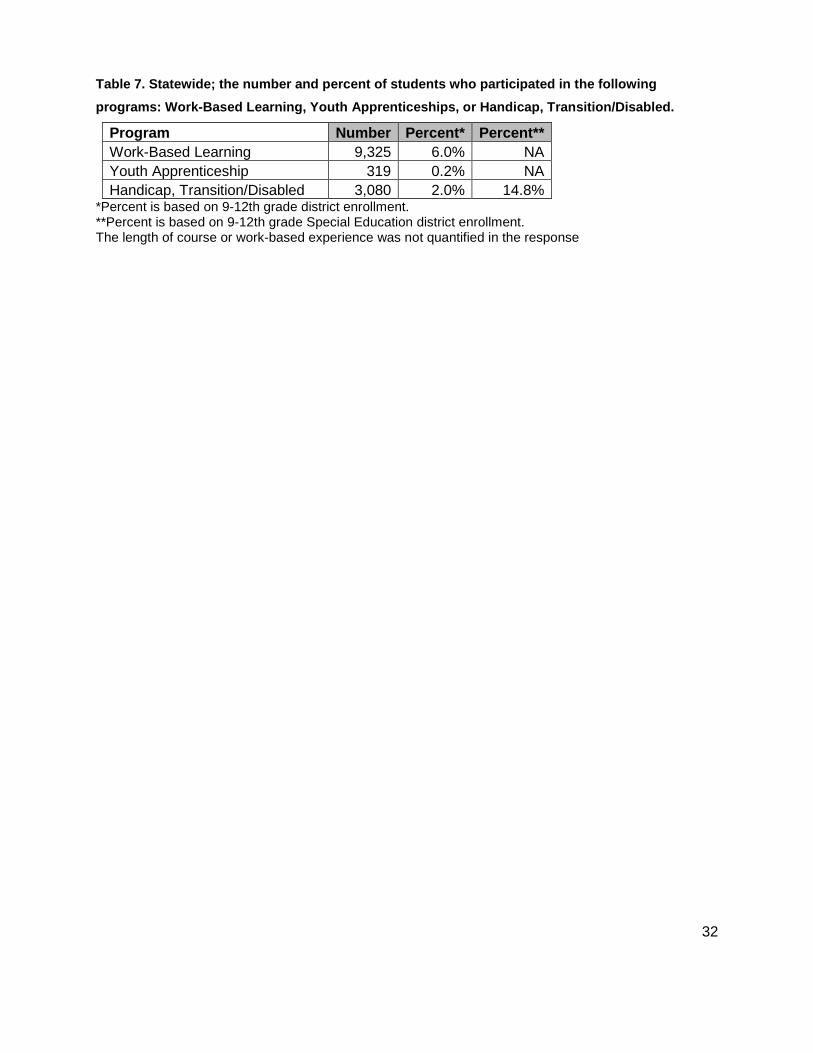
Table 7. Statewide; the number and percent of students who participated in the following programs: Work-Based Learning, Youth Apprenticeships, or Handicap, Transition/Disabled.
Program Number Percent* Percent** Work-Based Learning 9,325 6.0% NA Youth Apprenticeship 319 0.2% NA Handicap, Transition/Disabled 3,080 2.0% 14.8%
*Percent is based on 9-12th grade district enrollment. **Percent is based on 9-12th grade Special Education district enrollment. The length of course or work-based experience was not quantified in the response
32

Part 2: Equipment Inventory
Based on the definition used to complete Equipment Approval requests and for the purposes of this data collection process, “equipment” is defined as: a) one item worth $400 or more, b) multiple items totaling $400 or more, or, c) items considered to be “attractive equipment” (ex. cameras, computers, iPads, high-tech and/or portable). Districts were asked to list the exact number of equipment items currently available during this school year (2014-15) at their building site. Furthermore, districts were advised not to list any duplicate items across programs. For example, if the building had one 3D printer available, they should count that 3D printer once, even if the 3D printer is used for multiple programs.
Please recall that some Career Clusters were merged within the Part 2: Equipment Inventory in order to expedite the data collection process; these combinations are referenced in the Career Cluster number (CC#). Finally, since there are generally no specific industry standards for facilities for the following areas, there were no equipment resources requested for the following career cluster/program areas: STEM, Education and Training, Government Public Affairs/Community Awareness, Career Exploration, and Transition Disabled. See Appendix H, Table 16 for additional information on the age distribution of equipment items reported.
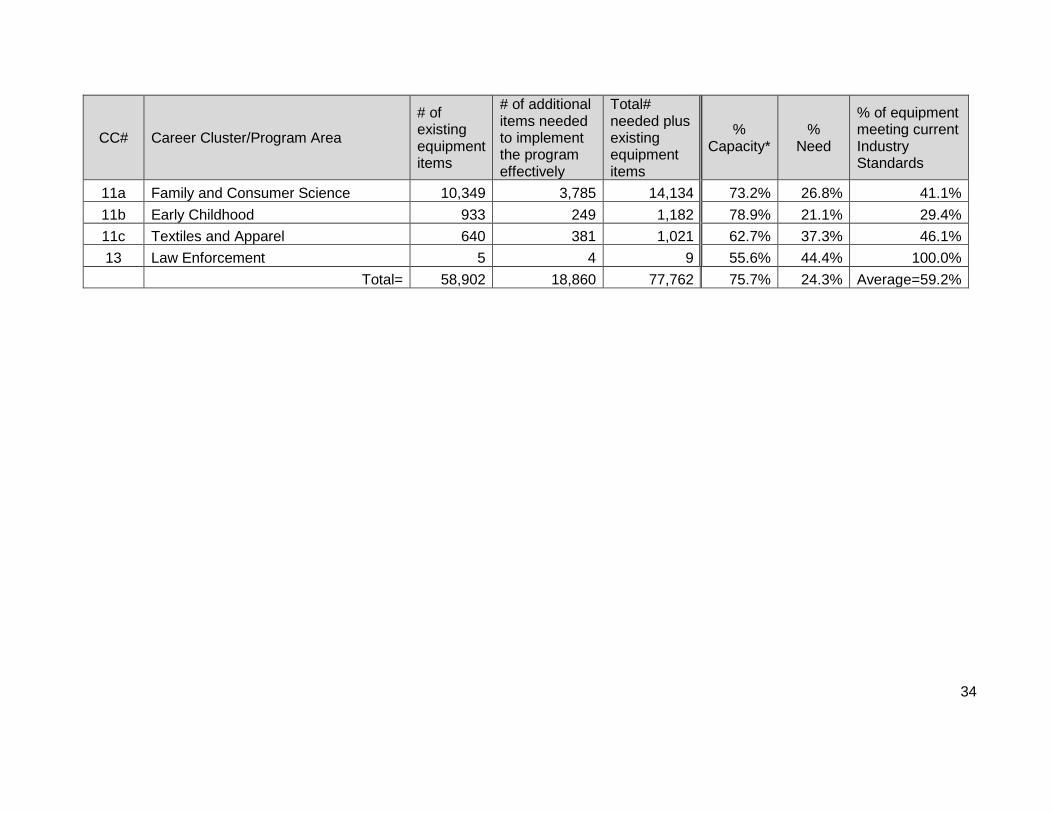
Table 8. Number of equipment items, percent capacity and need, percent of equipment meeting current industry standards according to each program area.
CC# Career Cluster/Program Area
# of existing equipment items
# of additional items needed to implement the program effectively
Total# needed plus existing equipment items
% Capacity*
% Need
% of equipment meeting current Industry Standards
1 Ag, Foods, and Natural Resources 4,510 1,530 6,040 74.7% 25.3% 53.3% 2 Architecture and Construction 8,989 2,482 11,471 78.4% 21.6% 65.4% 3 Manufacturing 5,484 2,100 7,584 72.3% 27.7% 59.1% 4 Transportation 2,481 805 3,286 75.5% 24.5% 54.3%
5, 12 Communications and Information Tech 11,830 3,110 14,940 79.2% 20.8% 63.3% 6, 7, 9 Business and Marketing 9,232 2,845 12,077 76.4% 23.6% 66.7%
8 Hospitality and Culinary Arts 1,124 431 1,555 72.3% 27.7% 59.7% 10 Health Science Technology Ed 3,325 1,138 4,463 74.5% 25.5% 72.2%
33
CC# Career Cluster/Program Area
# of existing equipment items
# of additional items needed to implement the program effectively
Total# needed plus existing equipment items
% Capacity*
% Need
% of equipment meeting current Industry Standards
11a Family and Consumer Science 10,349 3,785 14,134 73.2% 26.8% 41.1% 11b Early Childhood 933 249 1,182 78.9% 21.1% 29.4% 11c Textiles and Apparel 640 381 1,021 62.7% 37.3% 46.1% 13 Law Enforcement 5 4 9 55.6% 44.4% 100.0% NA Total= 58,902 18,860 77,762 75.7% 24.3% Average=59.2%
34
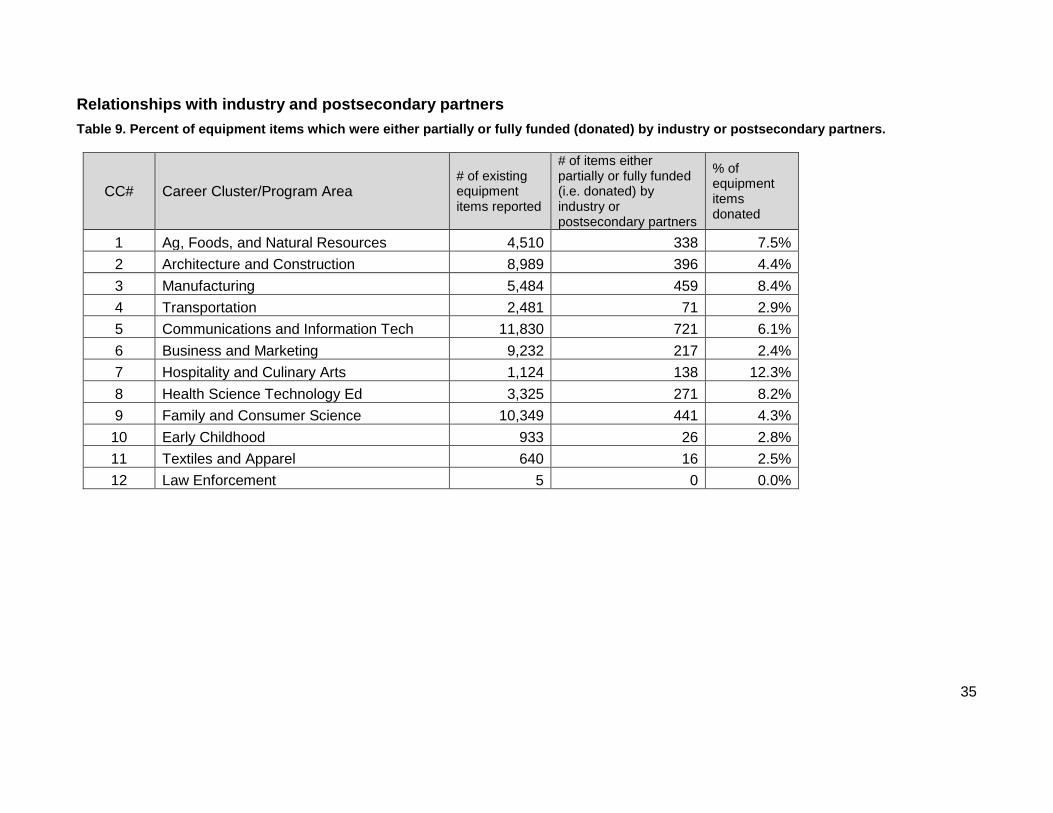
Relationships with industry and postsecondary partners Table 9. Percent of equipment items which were either partially or fully funded (donated) by industry or postsecondary partners.
CC# Career Cluster/Program Area # of existing equipment items reported
# of items either partially or fully funded (i.e. donated) by industry or postsecondary partners
% of equipment items donated
1 Ag, Foods, and Natural Resources 4,510 338 7.5% 2 Architecture and Construction 8,989 396 4.4% 3 Manufacturing 5,484 459 8.4% 4 Transportation 2,481 71 2.9% 5 Communications and Information Tech 11,830 721 6.1% 6 Business and Marketing 9,232 217 2.4% 7 Hospitality and Culinary Arts 1,124 138 12.3% 8 Health Science Technology Ed 3,325 271 8.2% 9 Family and Consumer Science 10,349 441 4.3% 10 Early Childhood 933 26 2.8% 11 Textiles and Apparel 640 16 2.5% 12 Law Enforcement 5 0 0.0%
35

Necessary updates to Building Facilities Facilities: Refers to any structural or site related updates needed to meet building and/or safety codes. An example of a facility update may include a proper and industry standard ventilation system for welding or construction courses.
Table 10. Percent of responses indicating the needed facilities updates for CTE courses and programs. No Data No data Updates needed within:
CC# Career Cluster/Program Area the next year
the next 2-5 years
6 years or more
Does not
apply 1 Ag, Food & Natural Resources (n=142) 27.5% 38.7% 14.1% 19.7% 2 Architecture & Construction (n=208) 31.3% 40.4% 13.5% 14.9% 3 Manufacturing (n=150) 32.0% 40.0% 14.0% 14.0% 4 Transportation (n=94) 29.8% 40.4% 16.0% 13.8% 5 Communications & Information Technology (n=131) 25.2% 26.0% 10.7% 38.2% 6 Business & Marketing (n=190) 24.7% 24.2% 6.8% 44.2% 7 Hospitality & Culinary Arts (n=46) 21.7% 37.0% 8.7% 32.6% 8 Health Science Technology Education (n=50) 22.0% 44.0% 14.0% 20.0% 9 Family & Consumer Science (n=188) 25.5% 34.6% 8.5% 31.4% 10 Early Childhood (n=45) 13.3% 33.3% 2.2% 51.1% 11 Textiles & Apparel (n=55) 21.8% 27.3% 12.7% 38.2% 12 Law Enforcement (n=6) 0% 66.7% 0% 33.3%
36
Student Barriers Districts were asked to consider barriers to student access within their district relative to increasing participation in CTE courses and programs. Districts were provided with a list of potential barriers, and given the option to include additional information if needed. The list in Table 11 below indicates the frequency that each topic was determined to be a factor in increasing participation in CTE courses and programs. Additionally, the “Open-Text Response Breakdown” table indicates the additional information provided by respondents. The table displays the items and the frequency of items identified as barriers in descending order.
281 districts responded to these items. However, because districts were asked to enter individual data for each 9th-12th grade school, there were 348 total responses. The additional cases were left in the analysis because different school sites within a district appeared to exhibit different response patterns. The percent is calculated in the table by dividing the count by the total number of responses (N=348).
There were 38 open response write-in comments. These comments were arranged into themes. In order to obtain a percentage, the number of comments within each theme was then divided by the total number of comments.
37
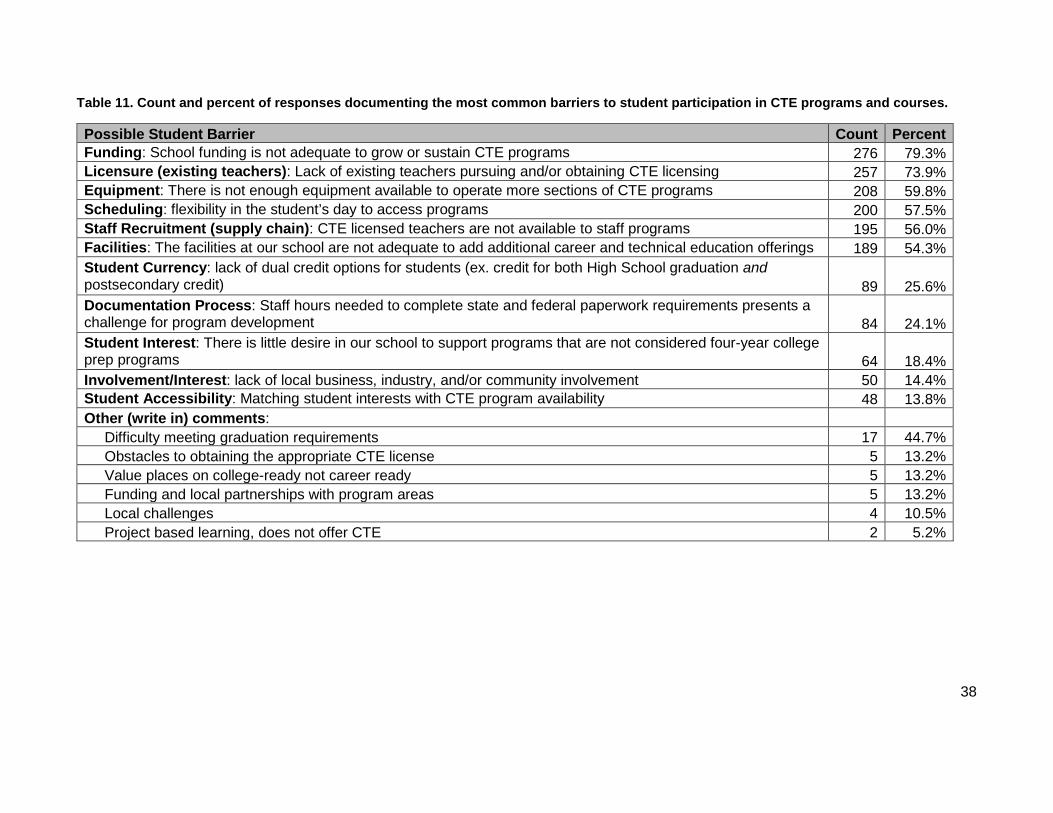
Table 11. Count and percent of responses documenting the most common barriers to student participation in CTE programs and courses.
Possible Student Barrier Count Percent Funding: School funding is not adequate to grow or sustain CTE programs 276 79.3% Licensure (existing teachers): Lack of existing teachers pursuing and/or obtaining CTE licensing 257 73.9% Equipment: There is not enough equipment available to operate more sections of CTE programs 208 59.8% Scheduling: flexibility in the student’s day to access programs 200 57.5% Staff Recruitment (supply chain): CTE licensed teachers are not available to staff programs 195 56.0% Facilities: The facilities at our school are not adequate to add additional career and technical education offerings 189 54.3% Student Currency: lack of dual credit options for students (ex. credit for both High School graduation and postsecondary credit) 89 25.6% Documentation Process: Staff hours needed to complete state and federal paperwork requirements presents a challenge for program development 84 24.1% Student Interest: There is little desire in our school to support programs that are not considered four-year college prep programs 64 18.4% Involvement/Interest: lack of local business, industry, and/or community involvement 50 14.4% Student Accessibility: Matching student interests with CTE program availability 48 13.8% Other (write in) comments: Difficulty meeting graduation requirements 17 44.7% Obstacles to obtaining the appropriate CTE license 5 13.2% Value places on college-ready not career ready 5 13.2% Funding and local partnerships with program areas 5 13.2% Local challenges 4 10.5% Project based learning, does not offer CTE 2 5.2%
38

Appendix A Memo to Superintendents
October 24, 2014 Dear Superintendents and Charter School Directors: We are conducting a program inventory of Career and Technical Education (CTE). Please identify a lead contact in your district to manage the data collection for this inventory. We will be taking stock of:
• •
All CTE approved programs and related courses. All resources and equipment housed within your district or charter school, such as stoves, table saws, etc.
Your participation is very important. The inventory will help us understand what resources you have and what your financial needs are, so that we can better serve your students. Without an accurate view of Minnesota’s CTE programs and equipment, we cannot plan and allocate resources adequately. Please e-mail the following information to [email protected] by November 4, 2014.
• • • • •
District Name District Number Contact Name Contact Phone Number
Contact E-mail Address The ideal contact person is someone who works closely with your CTE program. They will provide a list of:
•
•
•
• •
CTE courses currently offered within your district including any CTE courses offered at an ALC, ALP, and/or cooperative. CTE courses awarding articulation/credit agreements, postsecondary credentials, concurrent enrollment, core academic credit. CTE courses that are delivered fully or partially online and whether the course is taught by a local college or third party vendor. Existing resources, equipment, and equipment needs. The status of special facility needs, such as ventilation systems.
Your contact designee will receive a notification when the data entry system is open. Final data submission is due on December 5, 2014. If you have any questions about the inventory process, e-mail [email protected]. Thank you for your time and participation. Your feedback is very important to us and to the future of CTE in Minnesota. It is only with your help that the inventory can be meaningful and inform future funding and resourcing needs. Best regards,
Dr. Brenda Cassellius Commissioner Minnesota Department of Education
39

Appendix B Memo to Primary Contacts
*Note that additional webinar training times were added during the data collection process.
To: Primary Contact for CTE Inventory Thank you for assisting us in collecting data from your school district for the CTE Program Inventory. We are very excited that your help and expertise will provide us the opportunity to create a comprehensive status report of high school career and technical education and related areas for the Minnesota legislature. There will be two parts, each collected by a different system, to the data collection process. Part 1 is the course inventory. This data will be uploaded to the CTE Legislated Program Inventory Share Point site. Directions are attached to this email. Please follow these directions in order to create an account as soon as possible. The SharePoint Site will be open beginning first thing Monday morning (11/10/14). Part 2 is the Equipment Inventory. This data will be entered into Survey Gizmo. The link to the Survey Gizmo site will be sent directly to your e-mail account. Until you receive the link, a temporary electronic copy has been provided on the CTE Share Point Site. You can use this electronic copy to begin facilitating your data collection process; however, please note that the final data will need to be entered by you into Survey Gizmo. MDE will host training Webinars for your assistance on both Friday, November 14, 2014 and Monday, November 17, 2014. Please see the training dates and times below. Please follow this link to attend the webinar. CTE Inventory Training Webinars Friday November 14, 2014
9:00 a.m. Session number: 802 550 381 Monday November 17, 2014
10:00 a.m. Session number: 809 460 181 2:00 p.m. Session number: 802 711 763
Attendees will have the option to dial-in or receive a call back from the system. Dial-in number: 1-888-742-5095 Conference Code: 7109455454 Please begin your inventory collection process by creating an account to gain access to the CTE Legislated Program Inventory Share Point Site. All data will be due for submission by December 5, 2014. Thank you for your efforts with this unprecedented data collection process. You can be assured that the work you do to support career and technical education opportunities for our Minnesota students is appreciated and will impact CTE across Minnesota for years to come. If you have any questions please feel free to contact us at [email protected] This e-mail account has been set up specifically to provide assistance with anything related to the CTE Program Inventory.
40
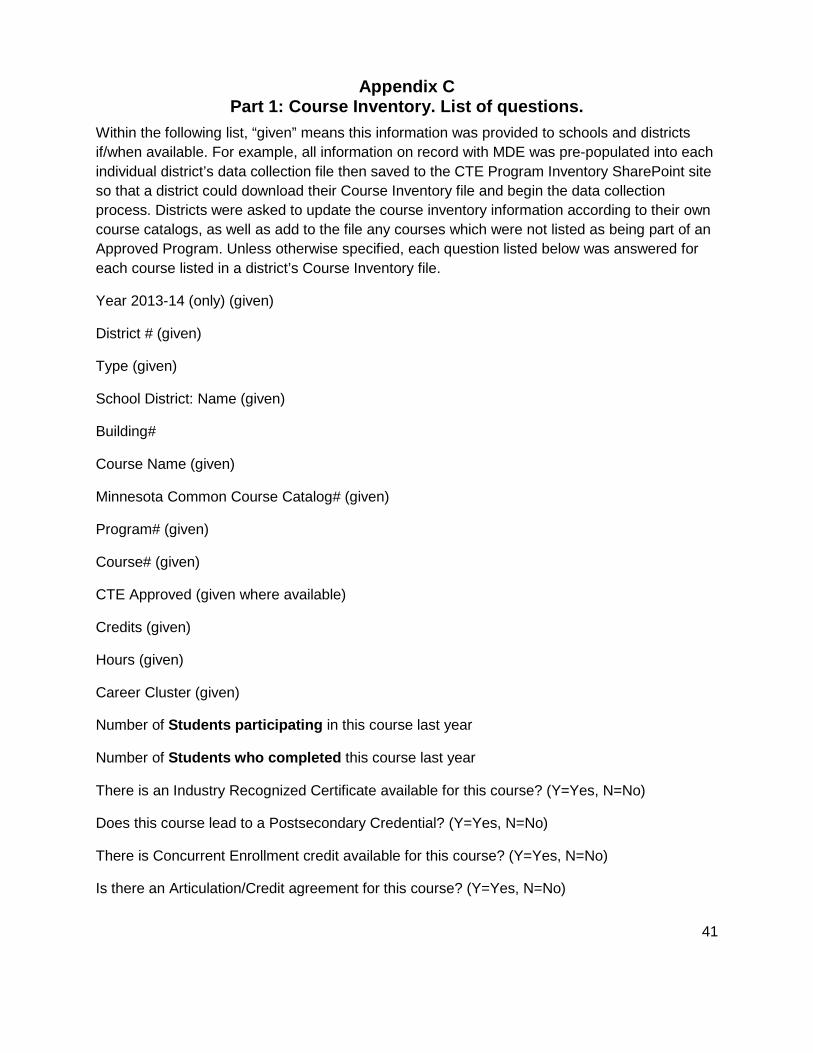
Appendix C Part 1: Course Inventory. List of questions.
Within the following list, “given” means this information was provided to schools and districts if/when available. For example, all information on record with MDE was pre-populated into each individual district’s data collection file then saved to the CTE Program Inventory SharePoint site so that a district could download their Course Inventory file and begin the data collection process. Districts were asked to update the course inventory information according to their own course catalogs, as well as add to the file any courses which were not listed as being part of an Approved Program. Unless otherwise specified, each question listed below was answered for each course listed in a district’s Course Inventory file.
Year 2013-14 (only) (given)
District # (given)
Type (given)
School District: Name (given)
Building#
Course Name (given)
Minnesota Common Course Catalog# (given)
Program# (given)
Course# (given)
CTE Approved (given where available)
Credits (given)
Hours (given)
Career Cluster (given)
Number of Students participating in this course last year
Number of Students who completed this course last year
There is an Industry Recognized Certificate available for this course? (Y=Yes, N=No)
Does this course lead to a Postsecondary Credential? (Y=Yes, N=No)
There is Concurrent Enrollment credit available for this course? (Y=Yes, N=No)
Is there an Articulation/Credit agreement for this course? (Y=Yes, N=No)
41
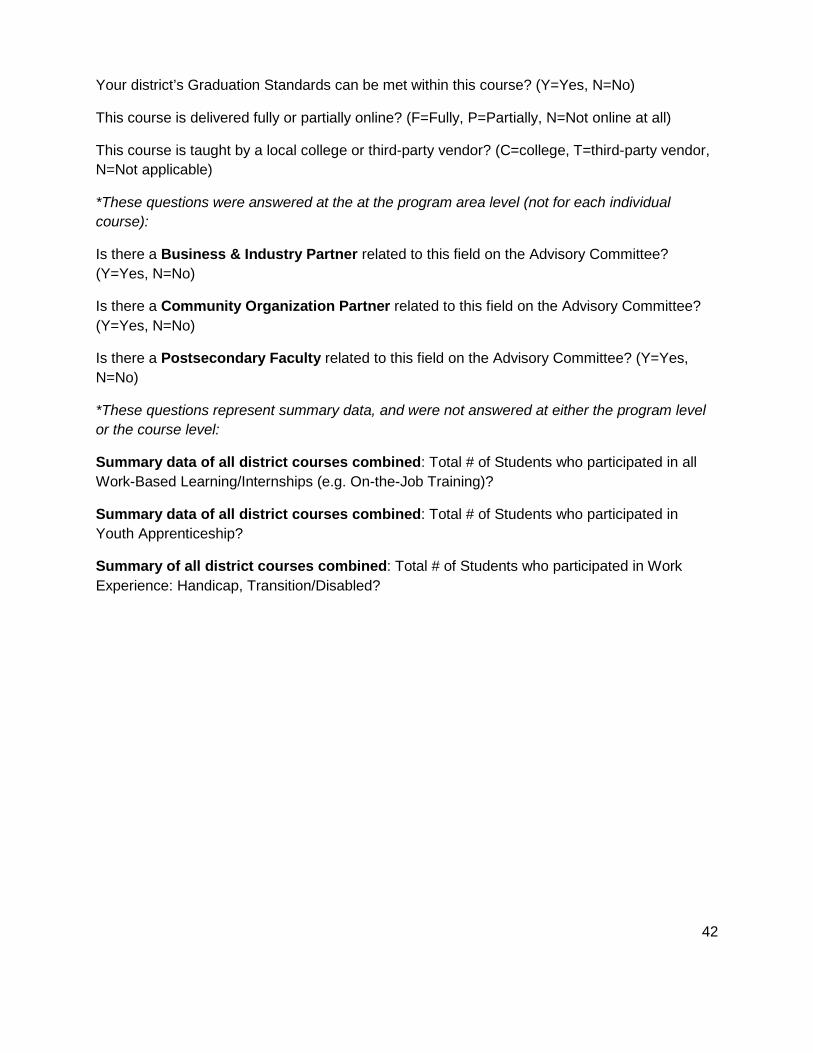
Your district’s Graduation Standards can be met within this course? (Y=Yes, N=No)
This course is delivered fully or partially online? (F=Fully, P=Partially, N=Not online at all)
This course is taught by a local college or third-party vendor? (C=college, T=third-party vendor, N=Not applicable)
*These questions were answered at the at the program area level (not for each individual course):
Is there a Business & Industry Partner related to this field on the Advisory Committee? (Y=Yes, N=No)
Is there a Community Organization Partner related to this field on the Advisory Committee? (Y=Yes, N=No)
Is there a Postsecondary Faculty related to this field on the Advisory Committee? (Y=Yes, N=No)
*These questions represent summary data, and were not answered at either the program level or the course level:
Summary data of all district courses combined: Total # of Students who participated in all Work-Based Learning/Internships (e.g. On-the-Job Training)?
Summary data of all district courses combined: Total # of Students who participated in Youth Apprenticeship?
Summary of all district courses combined: Total # of Students who participated in Work Experience: Handicap, Transition/Disabled?
42
Appendix D Part 1: Course Inventory Definitions provided to districts
Course Name: Enter in the name of the Course as it appears in your District's catalog
MN Common Course Catalog #: Please enter in any and all Common Course Catalog numbers available for the courses you list in this sheet
Program#: This relates to the Carl Perkins 6 digit Program Codes. If the course you are listing is not part of a CTE Approved Program, you do not need to enter in this number. Leave blank.
Course#: This relates to the Carl Perkins 2 digit Course Codes. If the course you are listing is not part of a CTE Approved Program, you do not need to enter in this number. Leave blank.
CTE Approved: Answer "Y" if these courses are on file with MDE as being part of an Approved Program. Otherwise, answer "N" for No.
Credits: Number of credits available for this course.
Hours: Number of course hours available for this course.
Career Cluster: Important! For all CTE courses not currently part of an approved program, you will need to assign a Career Cluster number. Please see the "Career Cluster Guide" for additional directions on how to assign this number to your district's courses (note: these codes were assigned as seen in all data tables).
Students Participating: Total number of students, during school year 2013-14, who enrolled in this course.
Students who Completed: Total number of students, during school year 2013-14, who earned a passing grade in this course.
Industry Recognized Certificate: Answer "Y" if an earned certificate would lead to a recognized skill or job opportunity. For example, a CNA certificate or American Welding Society certificate. Industry Recognized and Postsecondary Credential if needed. The focus is on Business & Industry, not postsecondary only. Can answer Yes to BOTH “Industry Recognized Certificate” and “Postsecondary Credential” if applicable. Answer "N" for No if not applicable.
Postsecondary Credential: Answer "Y" if credential consists of an industry-recognized certificate or certification, a certificate of completion of an apprenticeship, a license recognized by the State involved or Federal Government, or an associate or baccalaureate degree.
Concurrent Enrollment: Answer "Y" if students taking this course will receive transferable college credits (ex. PSEO, College in the Schools, Concurrent Enrollment, Dual-Credit); otherwise answer "N" for No.
43

Articulation/Credit agreement: Answer "Y" if students who take this course will be able to receive transferable college credits, once the student enrolls into the specific college with whom the agreement is held; otherwise answer "N" for No.
Graduation Standards: Answer "Y" if an Academic Standard(s) is met in this course, therefore a core Academic Credit is awarded to students; otherwise answer "N" for No.
Partially or Fully On-Line: Answer "P" if this course is offered Partially on-line. Answer "F" if this course is offered Fully online. Answer "N" if this course is Not taught online at all.
College or Third party vendor: Answer "C" if this course is taught at a local college. Answer "T" if this course is taught by a Third Party vendor (e.g. Cosmetology class taught at a local studio; Nursing class taught at a local Hospital). Answer "N" if this course is Not taught by either.
44
Appendix E Part 2: Equipment Inventory, list of questions.
Blank excel files were provided to districts to use during their data collection process through the CTE Program Inventory SharePoint site. These excel files could be downloaded and shared across the district with all personnel who know about equipment resources. Data were collected individually for each program area. Once Equipment Inventory data were collected, the data were hand-entered into SurveyGizmo by school, in order to facilitate data extraction and analysis. Unless otherwise specified, listed below are the questions asked for each program area. Each question below was answered for each of the applicable program areas and equipment items listed in Appendix F.
Note that districts were able to enter ten additional “Other” equipment items within each program area; however, for the purposes of equality and consistency in reporting, those categories have been left out of this analysis.
Total # of each equipment item:
Based on the Total # of each equipment item, how many of those items are 0-9 years old:
Based on the Total # of each equipment item, how many of those items are 10-19 years old:
Based on the Total # of each equipment item, how many of those items are 20- years or older:
Based on the Total# of each equipment item, how many of those items, could be, but are not currently being used in a program:
Based on the total # of equipment items, how many of those items were either partially or fully funded (i.e. donated) by industry or postsecondary partners:
Based on the Total # of each equipment item, how many of those items meet current industry standards:
If additional equipment items are needed, list the exact number of each item needed in order to implement the program effectively:
*This question was not answered relative to individual equipment items, instead it was asked relative to each program area selected by the respondent. Overall, when thinking about your district’s facilities, If your school were to receive updated equipment, would your facility meet OSHA requirements (?) electrical (?) ventilation (?) and/or other health and safety codes (?) We would need to make classroom and/or building improvements: Answer options: Within the next year. Within the next 2-5 years. Within 6 years or more. Does not apply to the equipment items listed within this Career Field.
45
Appendix F Part 2: Equipment Inventory, list of equipment items
Directions and Definition of Equipment
Directions: The list below includes program-related equipment a) worth $400 or more each, b) totaling $400 for a single item if multiples of this item exist at your school, or c) an item is considered to be “attractive equipment” (e.g. cameras, computers, iPads, high-tech and/or portable, etc.). Please answer each question by indicating the exact number of equipment items available in your district during this current school year. If your district has multiple shops/classrooms, please list the total number of equipment items available at each building site.
Notes Districts were advised “NO duplicate numbers.” Meaning, in cases where an equipment item was present across multiple program lists, yet districts shared this particular equipment item across programs, districts were asked to only document the item once and to list it under whichever program area they discerned to be the most representative.
Districts were advised to document “only those computers which were used in service of CTE programs.” For example, if the computer and computer-related equipment was not purchased as part of a larger district initiative, but instead purchased in support of CTE students and programs exclusively then these items should be counted. The same was true for any computer software programs.
List of Equipment Items (see next three pages).
46
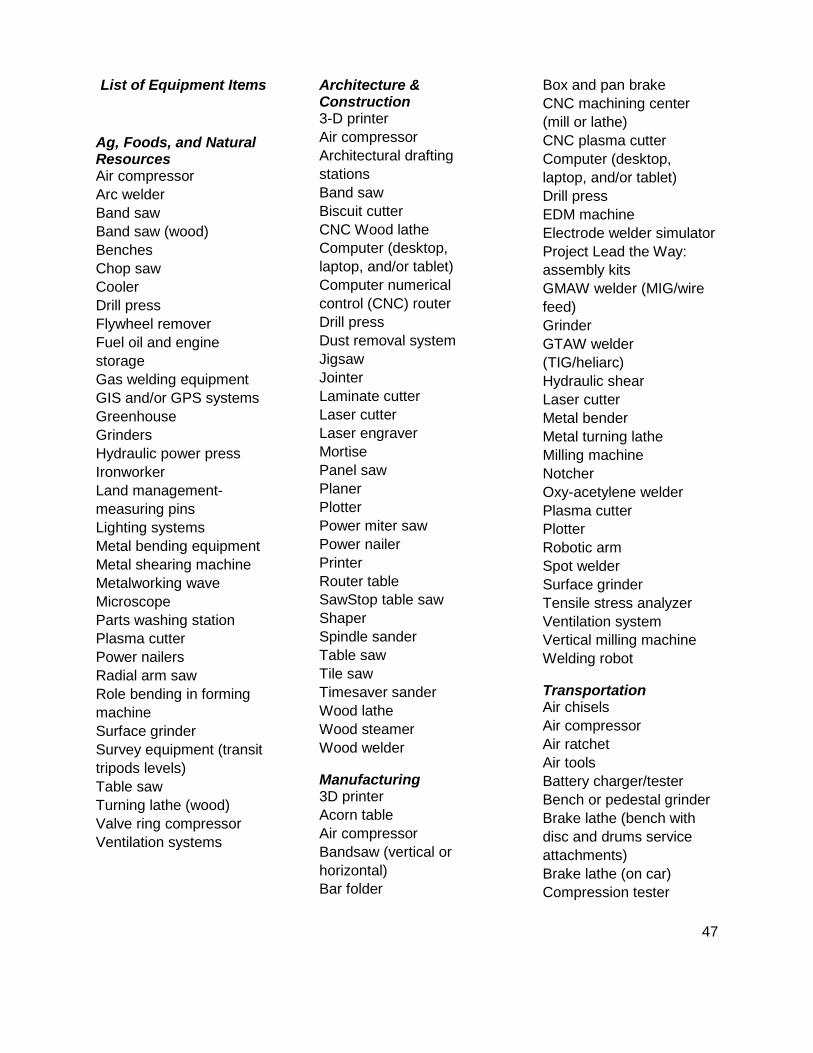
List of Equipment Items
Ag, Foods, and Natural Resources Air compressor Arc welder Band saw Band saw (wood) Benches Chop saw Cooler Drill press Flywheel remover Fuel oil and engine storage Gas welding equipment GIS and/or GPS systems Greenhouse Grinders Hydraulic power press Ironworker Land management-measuring pins Lighting systems Metal bending equipment Metal shearing machine Metalworking wave Microscope Parts washing station Plasma cutter Power nailers Radial arm saw Role bending in forming machine Surface grinder Survey equipment (transit tripods levels) Table saw Turning lathe (wood) Valve ring compressor Ventilation systems
Architecture & Construction 3-D printer Air compressor Architectural drafting stations Band saw Biscuit cutter CNC Wood lathe Computer (desktop, laptop, and/or tablet) Computer numerical control (CNC) router Drill press Dust removal system Jigsaw Jointer Laminate cutter Laser cutter Laser engraver Mortise Panel saw Planer Plotter Power miter saw Power nailer Printer Router table SawStop table saw Shaper Spindle sander Table saw Tile saw Timesaver sander Wood lathe Wood steamer Wood welder
Manufacturing 3D printer Acorn table Air compressor Bandsaw (vertical or horizontal) Bar folder
Box and pan brake CNC machining center (mill or lathe) CNC plasma cutter Computer (desktop, laptop, and/or tablet) Drill press EDM machine Electrode welder simulator Project Lead the Way: assembly kits GMAW welder (MIG/wire feed) Grinder GTAW welder (TIG/heliarc) Hydraulic shear Laser cutter Metal bender Metal turning lathe Milling machine Notcher Oxy-acetylene welder Plasma cutter Plotter Robotic arm Spot welder Surface grinder Tensile stress analyzer Ventilation system Vertical milling machine Welding robot
Transportation Air chisels Air compressor Air ratchet Air tools Battery charger/tester Bench or pedestal grinder Brake lathe (bench with disc and drums service attachments) Brake lathe (on car) Compression tester
47
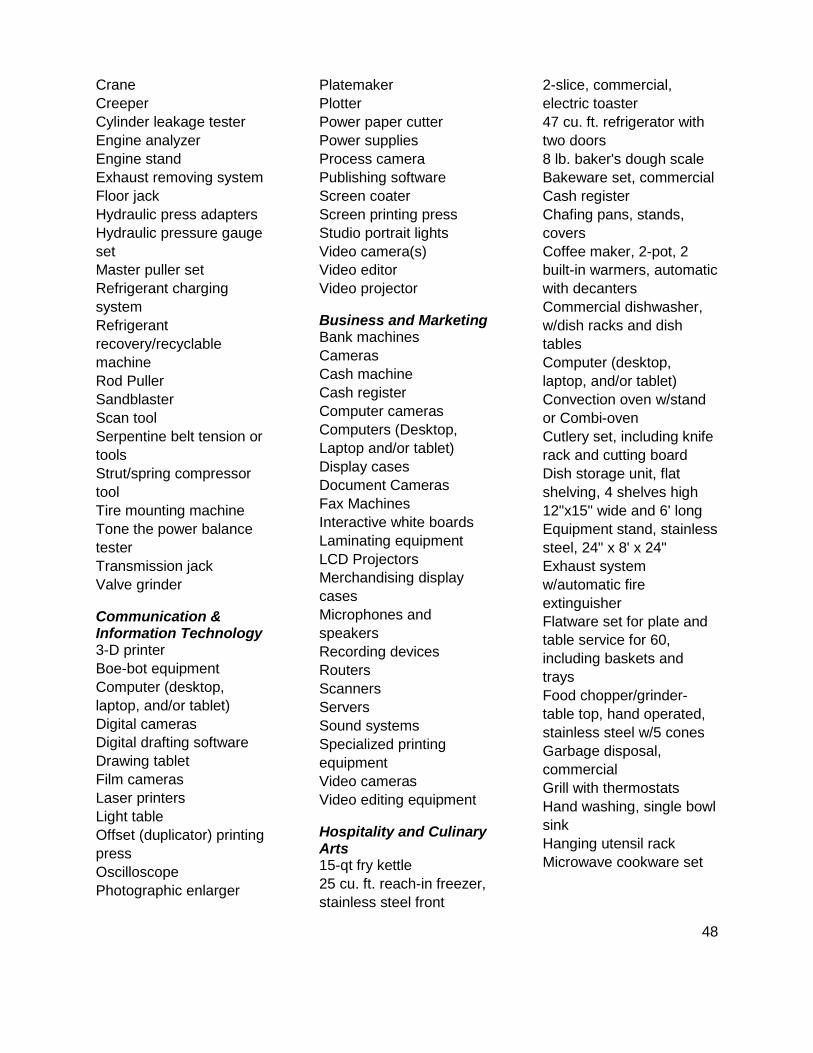
Crane Creeper Cylinder leakage tester Engine analyzer Engine stand Exhaust removing system Floor jack Hydraulic press adapters Hydraulic pressure gauge set Master puller set Refrigerant charging system Refrigerant recovery/recyclable machine Rod Puller Sandblaster Scan tool Serpentine belt tension or tools Strut/spring compressor tool Tire mounting machine Tone the power balance tester Transmission jack Valve grinder
Communication & Information Technology 3-D printer Boe-bot equipment Computer (desktop, laptop, and/or tablet) Digital cameras Digital drafting software Drawing tablet Film cameras Laser printers Light table Offset (duplicator) printing press Oscilloscope Photographic enlarger
Platemaker Plotter Power paper cutter Power supplies Process camera Publishing software Screen coater Screen printing press Studio portrait lights Video camera(s) Video editor Video projector
Business and Marketing Bank machines Cameras Cash machine Cash register Computer cameras Computers (Desktop, Laptop and/or tablet) Display cases Document Cameras Fax Machines Interactive white boards Laminating equipment LCD Projectors Merchandising display cases Microphones and speakers Recording devices Routers Scanners Servers Sound systems Specialized printing equipment Video cameras Video editing equipment
Hospitality and Culinary Arts 15-qt fry kettle 25 cu. ft. reach-in freezer, stainless steel front
2-slice, commercial, electric toaster 47 cu. ft. refrigerator with two doors 8 lb. baker's dough scale Bakeware set, commercial Cash register Chafing pans, stands, covers Coffee maker, 2-pot, 2 built-in warmers, automatic with decanters Commercial dishwasher, w/dish racks and dish tables Computer (desktop, laptop, and/or tablet) Convection oven w/stand or Combi-oven Cutlery set, including knife rack and cutting board Dish storage unit, flat shelving, 4 shelves high 12"x15" wide and 6' long Equipment stand, stainless steel, 24" x 8' x 24" Exhaust system w/automatic fire extinguisher Flatware set for plate and table service for 60, including baskets and trays Food chopper/grinder-table top, hand operated, stainless steel w/5 cones Garbage disposal, commercial Grill with thermostats Hand washing, single bowl sink Hanging utensil rack Microwave cookware set
48

Stainless steel, 3 compartment sink or commercial dishwasher Steamer or Combi-oven Stove/Range with ventilation system Utility carts
Health Science Technology Education Adjustable bed AED trainers Anatomy models Blood pressure cuffs Cervical collars Commode Computer (desktop, laptop, and/or tablet) Digital camera Emergency Blanket Mannequin Microscope Ophthalmoscopes/otoscope Scoop stretcher Stethoscope(s) Stretcher Various replicas of human body parts Walker Wheelchair
Family and Consumer Science Computer (desktop, laptop, and/or tablet) Cooktop Deep fryer Demonstration table Dishwasher Embroidery machine Freezer Griddle Grow lights Knife block Large motor skill toys Laundry dryer
Laundry washer Oven Plotter Printer Real care baby Screen printing press Sewing machine Small motor skill toys Serger Stainless steel table Standing mixer Steam kettle Stove/Range Ventilation hood
Early Childhood Computer (desktop, laptop, and/or tablet) Digital camera Large motor skill toys Laser printer, 1200x1200 dpi, 35 ppm, network capable Shelving for toy storage Small motor skill toys Video recorder
Textiles and Apparel 36"-high cutting table Clothes dryer Clothes iron, commercial Clothes washer Computer (desktop, laptop, and/or tablet) Digital camera Ironing board Ironing press Laser printer Mannequin (male/female) Padded pressing table Pegboard with pegs Pick glasses/linen tester Portable storage cabinet with small drawers Rotary cutter and mat
Law Enforcement Finger print sets Digital Camera(s)
49

Appendix G Response Rate Maps
50

Districts and Schools who participated in Part 1: Course Inventory, “Yes”
Ada-Borup Adrian Albany Alden-Conger Alexandria Annandale Anoka-Hennepin Ashby Austin Belle Plaine Bemidji Benson Bertha-Hewitt Big Lake Bird Island Olivia Lake Lillian Blackduck Bloomington Blue Earth Area Braham Brandon Evansville Breckenridge Brooklyn Center Buffalo Lake Hector Stewart Burnsville-Eagan-Savage Byron Cambridge Isanti Campbell Tintah Canby Cannon Falls Cedar Mountain Centennial Central Chatfield Chisago Lakes Chisholm Chokio Alberta Climax-Shelly Clinton Graceville Beardsley Cloquet Columbia Heights Cromwell Wright Crookston Crosby-Ironton Dassel Cokato Dawson-Boyd Delano Detroit Lakes Duluth Eagle Valley East Central East Grand Forks Eastern Carver County Eden Prairie Eden Valley-Watkins Edgerton Edina Elk River
Esko Eveleth Gilbert Farmington Fergus Falls Floodwood Foley Forest Lake Fosston Fridley G.F.W. Glencoe Silver Lake Goodhue Goodridge Grand Rapids Greenbush Middle River Grygla Hancock Hastings Hawley Henning Herman-Norcross Hermantown Hibbing Hill City Hills-Beaver Creek Hinckley-Finlayson Holdingford Hopkins Houston Howard Lake Waverly Winsted Hutchinson International Falls Inver Grove Heights Isle Jackson County Central Janesville Waldorf Pemberton Jordan Kasson-Mantorville Kelliher Kerkhoven-Murdock-Sunburg Kingsland La Crescent-Hokah Lac Qui Parle Valley Lake City Lake Crystal-Welcome Memorial Lake of the Woods Lake Superior Lakeville Laporte Le Sueur-Henderson Lewiston-Altura Little Falls Littlefork-Big Falls Long Prairie-Grey Eagle Luverne Lyle Mahtomedi
Mankato Maple Lake Maple River Marshall Marshall County Central Martin County West McGregor Medford Melrose Menahga Mesabi East Milaca Minneapolis Minneota Minnetonka Minnewaska Montevideo Monticello Moorhead Moose Lake Mora Morris Area Mounds View Mountain Lake Mt Iron Buhl Murray County Central New London Spicer New Prague Area Norman County East North Branch North St. Paul-Maplewood Northland Community Ogilvie Onamia Orono Ortonville Osakis Osseo Owatonna Parkers Prairie Paynesville Pelican Rapids Pierz Pillager Pine City Pine River-Backus Pipestone Area Plainview-Elgin-Millville Princeton Prior Lake-Savage Proctor Randolph Red Lake County Central Red Lake Falls Red Rock Central Redwood Area Renville County West Richfield Robbinsdale Rockford
51

Rocori Roseau Rosemount-Apple Valley-Eagan Roseville Rushford-Peterson Russell-Tyler-Ruthton Sauk Centre Sebeka Shakopee Sibley East Sleepy Eye South St. Paul South Washington County Spring Grove Spring Lake Park Springfield St. Anthony-New Brighton St. Charles
St. Cloud St. Francis St. James St. Louis Park St. Michael Albertville St. Paul St. Peter Staples Motley Stillwater Area Tracy Area Tri-County Triton Underwood United South Central Upsala Verndale Virginia Wabasha-Kellogg Wabasso
Wadena-Deer Creek Warren-Alvarado-Oslo Waseca Watertown-Mayer Waterville-Elysian-Morristown Waubun-Ogema White Earth Wayzata West Central Area West St. Paul Mendota Hts. Eagan Westbrook-Walnut Grove Westonka Wheaton Area White Bear Lake Willmar Willow River Windom Win-E-Mac Winona Area Worthington
Districts and Schools who did not participate in the Part 1: Course Inventory, “No” A.C.G.C. Aitkin Albert Lea Badger Bagley Barnesville Barnum Battle Lake Becker Belgrade-Brooten-Elrosa Blooming Prairie Brainerd Browerville Browns Valley Buffalo Hanover Montrose Butterfield-Odin Caledonia Carlton Cass Lake-Bena Clearbrook-Gonvick Cleveland Comfrey Cook County Deer River Dilworth-Glyndon-Felton Dover-Eyota Ellsworth Ely Fairmont Area Faribault Fertile-Beltrami Fillmore Central Fisher Franconia
Frazee-Vergas Fulda Glenville-Emmons Granada-Huntley-East Chain Grand Meadow Greenway Hayfield Hendricks Heron Lake-Okabena Ivanhoe Kenyon-Wanamingo Kimball Kittson Central Lake Benton Lake Park-Audubon Lakeview Lancaster Lanesboro Leroy-Ostrander Lester Prairie Litchfield Lynd M.A.C.C.R.A.Y. Mabel-Canton Madelia Mahnomen Milroy N.R.H.E.G. Nashwauk-Keewatin Nett Lake Nevis New Ulm New York Mills Nicollet
Norman County West Northfield Park Rapids Pequot Lakes Perham-Dent Pine Island Pine Point Prinsburg Red Lake Red Wing Rochester Rothsay Round Lake-Brewster Royalton Rush City Sartell-St. Stephen Sauk Rapids-Rice South Koochiching Southland St. Clair St. Louis County Stephen Argyle Central Stewartville Swanville Thief River Falls Tri-City United Truman Ulen-Hitterdal Waconia Walker Hackensack Akeley Warroad Wrenshall Yellow Medicine East Zumbrota-Mazeppa
52

Charter Schools, Intermediate & Education Districts, Vocational, Service & Cooperative Facilities who participated in the Part1: Course Inventory, “Yes”
Avalon School Bluesky Charter Eagle Ridge Academy Great River School Harbor City International ISD 287 ISD 917 Kaleidoscope Charter Lake Agassiz Special Ed. Cooperative Lakes Country Service Coop Lionsgate Academy Math & Science Academy Minnesota Internship Center Minnesota New Country Minnesota Transitions MN River Valley Education District MN Valley Education District NE Metro ISD 916 New Century Northwest Passage High Oak Land Vocational Cooperative Prairie Seeds Academy Riverway Learning Community Spectrum High St. Paul Conservatory Performing Artists SW Metro Educational Coop TRIO Wolf Creek Ubah Medical Academy West Metro Education Program Wright Technical Center
53
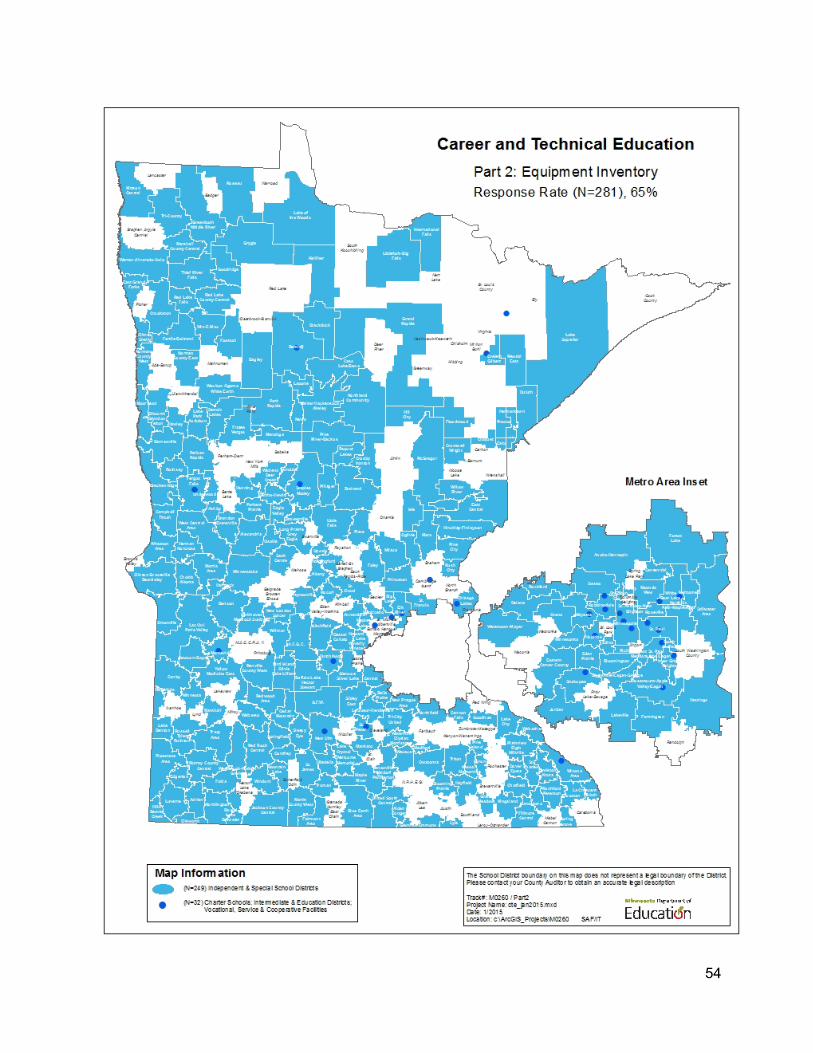
54
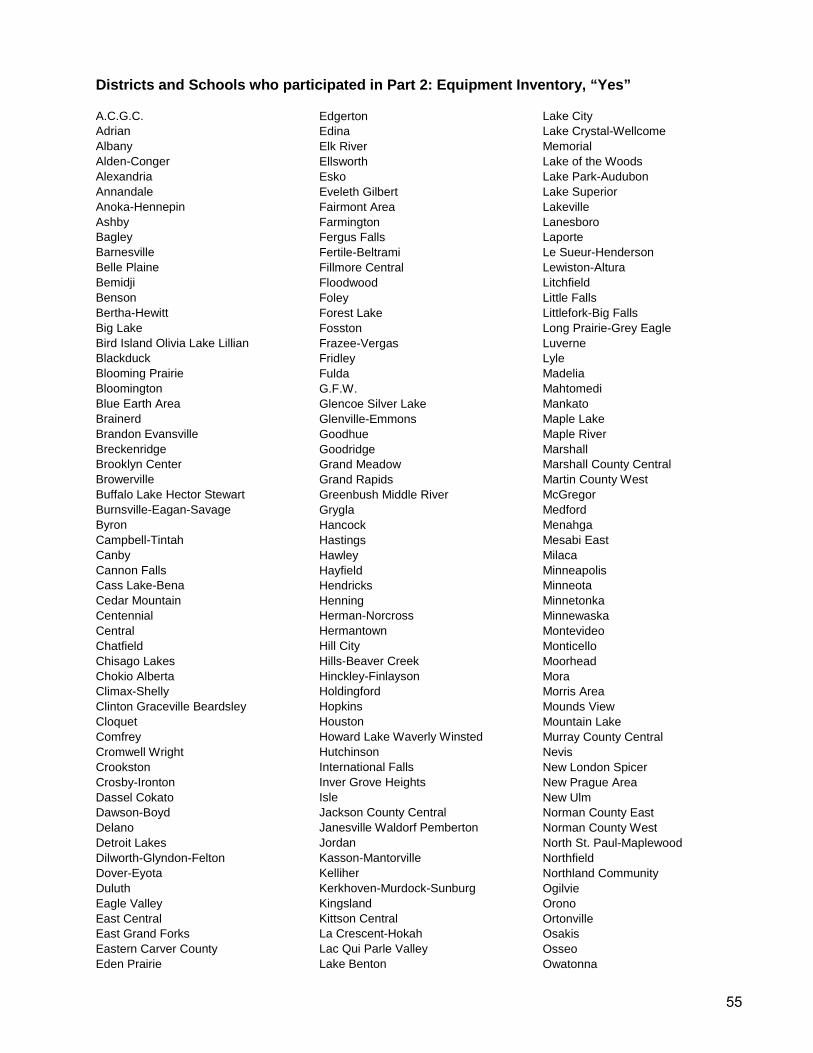
Districts and Schools who participated in Part 2: Equipment Inventory, “Yes”
A.C.G.C. Adrian Albany Alden-Conger Alexandria Annandale Anoka-Hennepin Ashby Bagley Barnesville Belle Plaine Bemidji Benson Bertha-Hewitt Big Lake Bird Island Olivia Lake Lillian Blackduck Blooming Prairie Bloomington Blue Earth Area Brainerd Brandon Evansville Breckenridge Brooklyn Center Browerville Buffalo Lake Hector Stewart Burnsville-Eagan-Savage Byron Campbell-Tintah Canby Cannon Falls Cass Lake-Bena Cedar Mountain Centennial Central Chatfield Chisago Lakes Chokio Alberta Climax-Shelly Clinton Graceville Beardsley Cloquet Comfrey Cromwell Wright Crookston Crosby-Ironton Dassel Cokato Dawson-Boyd Delano Detroit Lakes Dilworth-Glyndon-Felton Dover-Eyota Duluth Eagle Valley East Central East Grand Forks Eastern Carver County Eden Prairie
Edgerton Edina Elk River Ellsworth Esko Eveleth Gilbert Fairmont Area Farmington Fergus Falls Fertile-Beltrami Fillmore Central Floodwood Foley Forest Lake Fosston Frazee-Vergas Fridley Fulda G.F.W. Glencoe Silver Lake Glenville-Emmons Goodhue Goodridge Grand Meadow Grand Rapids Greenbush Middle River Grygla Hancock Hastings Hawley Hayfield Hendricks Henning Herman-Norcross Hermantown Hill City Hills-Beaver Creek Hinckley-Finlayson Holdingford Hopkins Houston Howard Lake Waverly Winsted Hutchinson International Falls Inver Grove Heights Isle Jackson County Central Janesville Waldorf Pemberton Jordan Kasson-Mantorville Kelliher Kerkhoven-Murdock-Sunburg Kingsland Kittson Central La Crescent-Hokah Lac Qui Parle Valley Lake Benton
Lake City Lake Crystal-Wellcome Memorial Lake of the Woods Lake Park-Audubon Lake Superior Lakeville Lanesboro Laporte Le Sueur-Henderson Lewiston-Altura Litchfield Little Falls Littlefork-Big Falls Long Prairie-Grey Eagle Luverne Lyle Madelia Mahtomedi Mankato Maple Lake Maple River Marshall Marshall County Central Martin County West McGregor Medford Menahga Mesabi East Milaca Minneapolis Minneota Minnetonka Minnewaska Montevideo Monticello Moorhead Mora Morris Area Mounds View Mountain Lake Murray County Central Nevis New London Spicer New Prague Area New Ulm Norman County East Norman County West North St. Paul-Maplewood Northfield Northland Community Ogilvie Orono Ortonville Osakis Osseo Owatonna
55
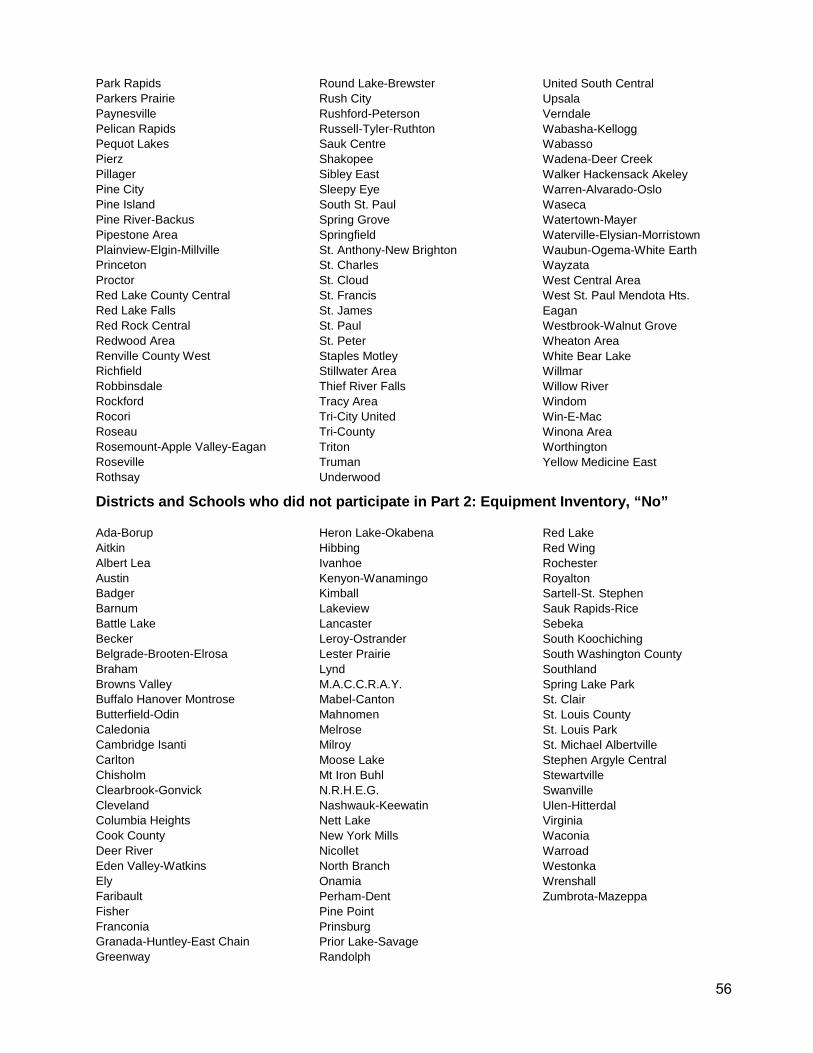
Park Rapids Parkers Prairie Paynesville Pelican Rapids Pequot Lakes Pierz Pillager Pine City Pine Island Pine River-Backus Pipestone Area Plainview-Elgin-Millville Princeton Proctor Red Lake County Central Red Lake Falls Red Rock Central Redwood Area Renville County West Richfield Robbinsdale Rockford Rocori Roseau Rosemount-Apple Valley-Eagan Roseville Rothsay
Round Lake-Brewster Rush City Rushford-Peterson Russell-Tyler-Ruthton Sauk Centre Shakopee Sibley East Sleepy Eye South St. Paul Spring Grove Springfield St. Anthony-New Brighton St. Charles St. Cloud St. Francis St. James St. Paul St. Peter Staples Motley Stillwater Area Thief River Falls Tracy Area Tri-City United Tri-County Triton Truman Underwood
United South Central Upsala Verndale Wabasha-Kellogg Wabasso Wadena-Deer Creek Walker Hackensack Akeley Warren-Alvarado-Oslo Waseca Watertown-Mayer Waterville-Elysian-Morristown Waubun-Ogema-White Earth Wayzata West Central Area West St. Paul Mendota Hts. Eagan Westbrook-Walnut Grove Wheaton Area White Bear Lake Willmar Willow River Windom Win-E-Mac Winona Area Worthington Yellow Medicine East
Districts and Schools who did not participate in Part 2: Equipment Inventory, “No”
Ada-Borup Aitkin Albert Lea Austin Badger Barnum Battle Lake Becker Belgrade-Brooten-Elrosa Braham Browns Valley Buffalo Hanover Montrose Butterfield-Odin Caledonia Cambridge Isanti Carlton Chisholm Clearbrook-Gonvick Cleveland Columbia Heights Cook County Deer River Eden Valley-Watkins Ely Faribault Fisher Franconia Granada-Huntley-East Chain Greenway
Heron Lake-Okabena Hibbing Ivanhoe Kenyon-Wanamingo Kimball Lakeview Lancaster Leroy-Ostrander Lester Prairie Lynd M.A.C.C.R.A.Y. Mabel-Canton Mahnomen Melrose Milroy Moose Lake Mt Iron Buhl N.R.H.E.G. Nashwauk-Keewatin Nett Lake New York Mills Nicollet North Branch Onamia Perham-Dent Pine Point Prinsburg Prior Lake-Savage Randolph
Red Lake Red Wing Rochester Royalton Sartell-St. Stephen Sauk Rapids-Rice Sebeka South Koochiching South Washington County Southland Spring Lake Park St. Clair St. Louis County St. Louis Park St. Michael Albertville Stephen Argyle Central Stewartville Swanville Ulen-Hitterdal Virginia Waconia Warroad Westonka Wrenshall Zumbrota-Mazeppa
56
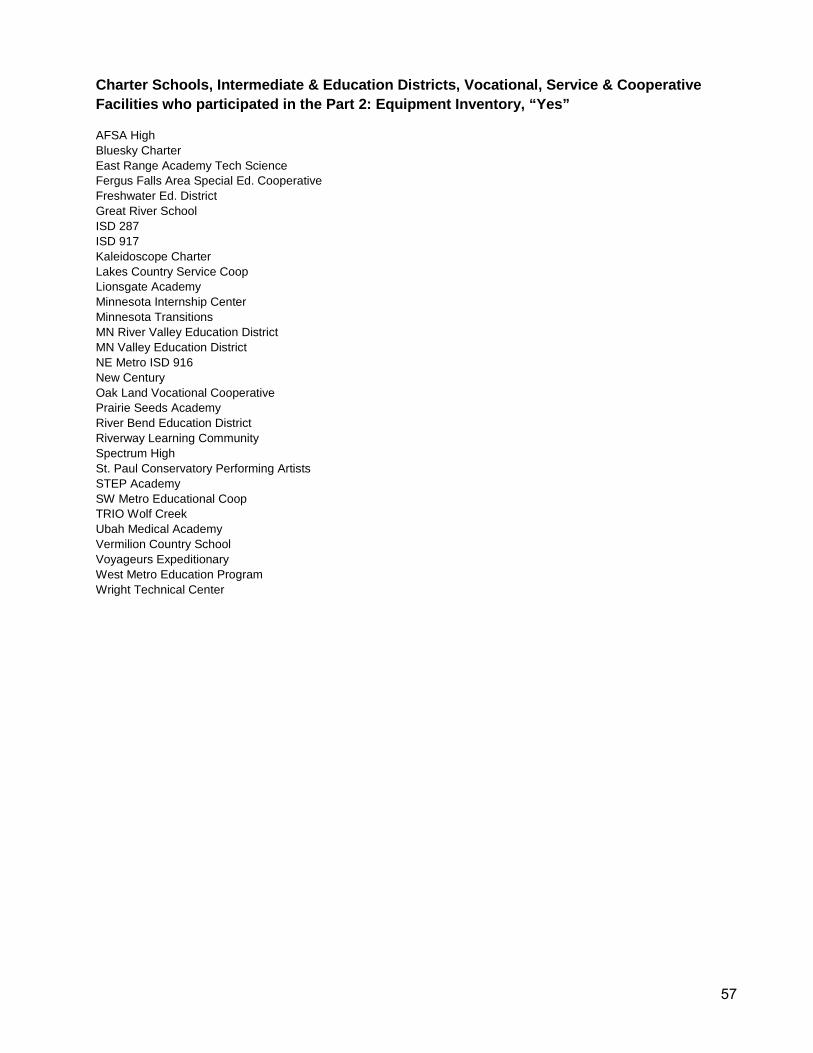
Charter Schools, Intermediate & Education Districts, Vocational, Service & Cooperative Facilities who participated in the Part 2: Equipment Inventory, “Yes”
AFSA High Bluesky Charter East Range Academy Tech Science Fergus Falls Area Special Ed. Cooperative Freshwater Ed. District Great River School ISD 287 ISD 917 Kaleidoscope Charter Lakes Country Service Coop Lionsgate Academy Minnesota Internship Center Minnesota Transitions MN River Valley Education District MN Valley Education District NE Metro ISD 916 New Century Oak Land Vocational Cooperative Prairie Seeds Academy River Bend Education District Riverway Learning Community Spectrum High St. Paul Conservatory Performing Artists STEP Academy SW Metro Educational Coop TRIO Wolf Creek Ubah Medical Academy Vermilion Country School Voyageurs Expeditionary West Metro Education Program Wright Technical Center
57
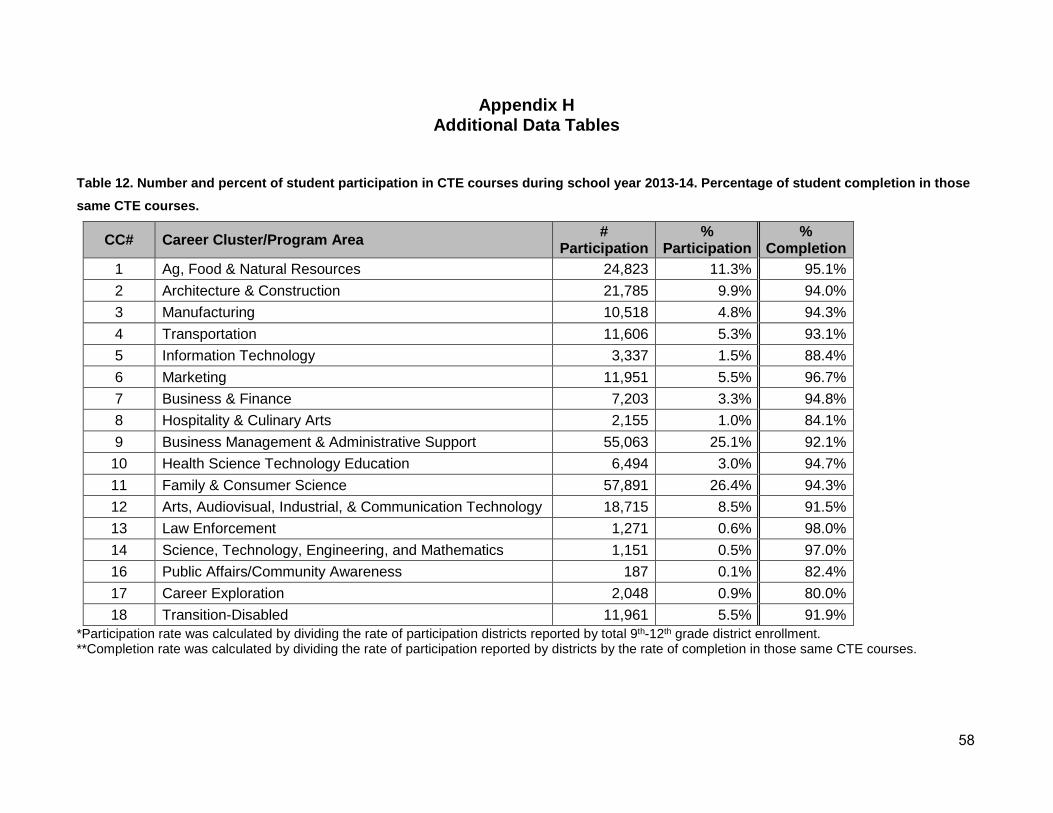
Appendix H Additional Data Tables
Table 12. Number and percent of student participation in CTE courses during school year 2013-14. Percentage of student completion in those same CTE courses.
CC# Career Cluster/Program Area # Participation
% Participation
% Completion
1 Ag, Food & Natural Resources 24,823 11.3% 95.1% 2 Architecture & Construction 21,785 9.9% 94.0% 3 Manufacturing 10,518 4.8% 94.3% 4 Transportation 11,606 5.3% 93.1% 5 Information Technology 3,337 1.5% 88.4% 6 Marketing 11,951 5.5% 96.7% 7 Business & Finance 7,203 3.3% 94.8% 8 Hospitality & Culinary Arts 2,155 1.0% 84.1% 9 Business Management & Administrative Support 55,063 25.1% 92.1% 10 Health Science Technology Education 6,494 3.0% 94.7% 11 Family & Consumer Science 57,891 26.4% 94.3% 12 Arts, Audiovisual, Industrial, & Communication Technology 18,715 8.5% 91.5% 13 Law Enforcement 1,271 0.6% 98.0% 14 Science, Technology, Engineering, and Mathematics 1,151 0.5% 97.0% 16 Public Affairs/Community Awareness 187 0.1% 82.4% 17 Career Exploration 2,048 0.9% 80.0% 18 Transition-Disabled 11,961 5.5% 91.9%
*Participation rate was calculated by dividing the rate of participation districts reported by total 9th-12th grade district enrollment.**Completion rate was calculated by dividing the rate of participation reported by districts by the rate of completion in those same CTE courses.
58
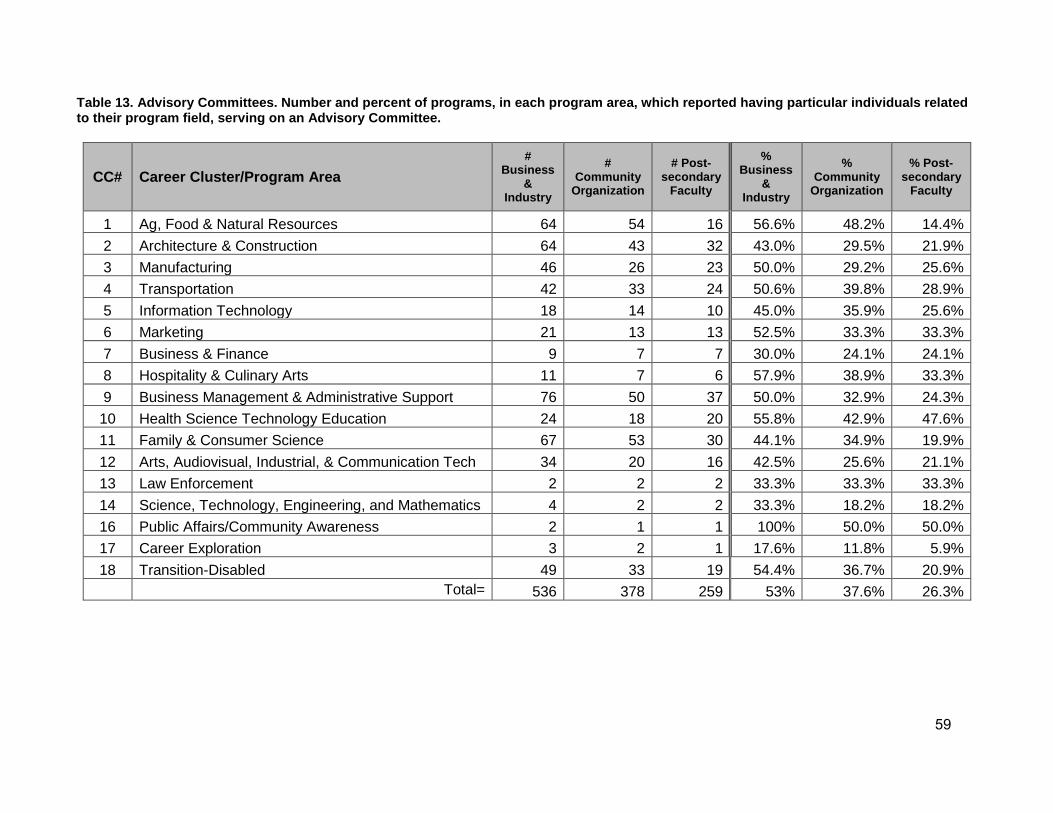
Table 13. Advisory Committees. Number and percent of programs, in each program area, which reported having particular individuals related to their program field, serving on an Advisory Committee.
CC# Career Cluster/Program Area #
Business &
Industry
# Community
Organization
# Post-secondary
Faculty
% Business
& Industry
% Community
Organization
% Post-secondary
Faculty
1 Ag, Food & Natural Resources 64 54 16 56.6% 48.2% 14.4% 2 Architecture & Construction 64 43 32 43.0% 29.5% 21.9% 3 Manufacturing 46 26 23 50.0% 29.2% 25.6% 4 Transportation 42 33 24 50.6% 39.8% 28.9% 5 Information Technology 18 14 10 45.0% 35.9% 25.6% 6 Marketing 21 13 13 52.5% 33.3% 33.3% 7 Business & Finance 9 7 7 30.0% 24.1% 24.1% 8 Hospitality & Culinary Arts 11 7 6 57.9% 38.9% 33.3% 9 Business Management & Administrative Support 76 50 37 50.0% 32.9% 24.3% 10 Health Science Technology Education 24 18 20 55.8% 42.9% 47.6% 11 Family & Consumer Science 67 53 30 44.1% 34.9% 19.9% 12 Arts, Audiovisual, Industrial, & Communication Tech 34 20 16 42.5% 25.6% 21.1% 13 Law Enforcement 2 2 2 33.3% 33.3% 33.3% 14 Science, Technology, Engineering, and Mathematics 4 2 2 33.3% 18.2% 18.2% 16 Public Affairs/Community Awareness 2 1 1 100% 50.0% 50.0% 17 Career Exploration 3 2 1 17.6% 11.8% 5.9% 18 Transition-Disabled 49 33 19 54.4% 36.7% 20.9% NA Total= 536 378 259 53% 37.6% 26.3%
59
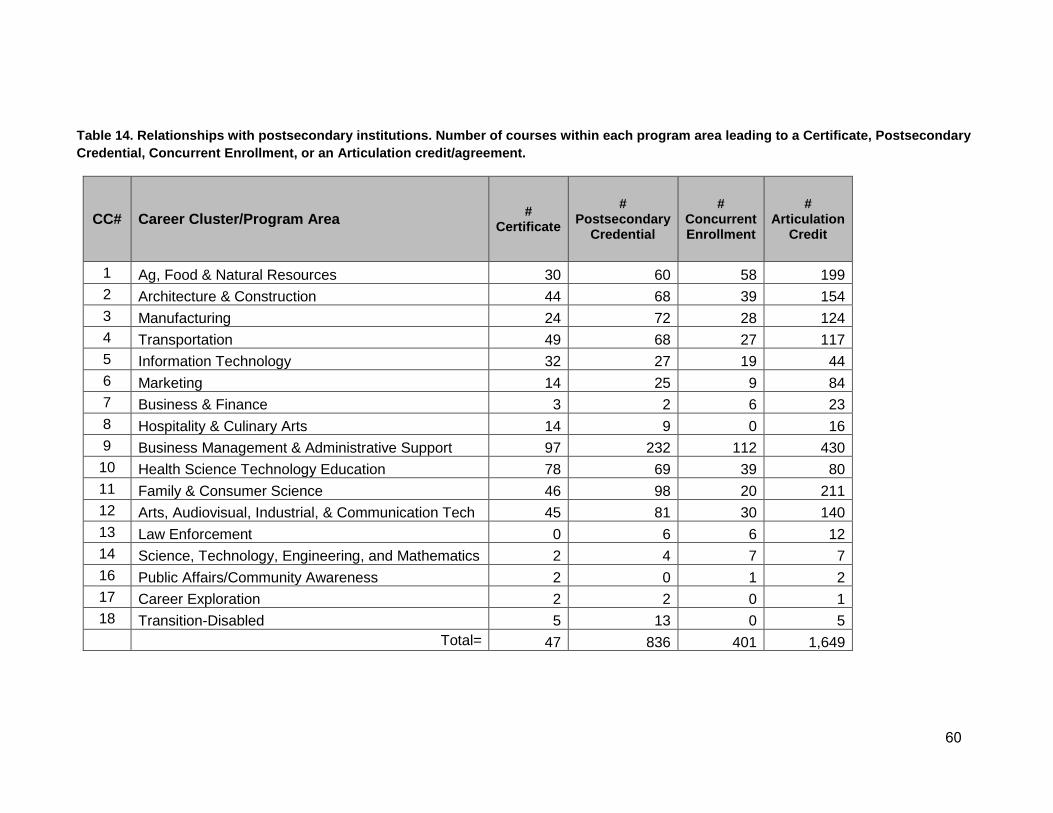
Table 14. Relationships with postsecondary institutions. Number of courses within each program area leading to a Certificate, Postsecondary Credential, Concurrent Enrollment, or an Articulation credit/agreement.
CC# Career Cluster/Program Area # Certificate
# Postsecondary
Credential
# Concurrent Enrollment
# Articulation
Credit
1 Ag, Food & Natural Resources 30 60 58 199 2 Architecture & Construction 44 68 39 154 3 Manufacturing 24 72 28 124 4 Transportation 49 68 27 117 5 Information Technology 32 27 19 44 6 Marketing 14 25 9 84 7 Business & Finance 3 2 6 23 8 Hospitality & Culinary Arts 14 9 0 16 9 Business Management & Administrative Support 97 232 112 430 10 Health Science Technology Education 78 69 39 80 11 Family & Consumer Science 46 98 20 211 12 Arts, Audiovisual, Industrial, & Communication Tech 45 81 30 140 13 Law Enforcement 0 6 6 12 14 Science, Technology, Engineering, and Mathematics 2 4 7 7 16 Public Affairs/Community Awareness 2 0 1 2 17 Career Exploration 2 2 0 1 18 Transition-Disabled 5 13 0 5 NA Total= 47 836 401 1,649
60

Table 15. Advisory Committees. Number and percent of programs, in each program area, which have Business & Industry, Community Organization, and/or Postsecondary Faculty partners related to the field serving on their Advisory Committee(s).
CC# Career Cluster/Program Area #
Business &
Industry
# Community
Organization
# Post-secondary
Faculty
% Business
& Industry
% Community
Organization
% Post-secondary
Faculty
1 Ag, Food & Natural Resources 64 54 16 56.6% 48.2% 14.4% 2 Architecture & Construction 64 43 32 43.0% 29.5% 21.9% 3 Manufacturing 46 26 23 50.0% 29.2% 25.6% 4 Transportation 42 33 24 50.6% 39.8% 28.9% 5 Information Technology 18 14 10 45.0% 35.9% 25.6% 6 Marketing 21 13 13 52.5% 33.3% 33.3% 7 Business & Finance 9 7 7 30.0% 24.1% 24.1% 8 Hospitality & Culinary Arts 11 7 6 57.9% 38.9% 33.3% 9 Business Management & Administrative Support 76 50 37 50.0% 32.9% 24.3% 10 Health Science Technology Education 24 18 20 55.8% 42.9% 47.6% 11 Family & Consumer Science 67 53 30 44.1% 34.9% 19.9% 12 Arts, Audiovisual, Industrial, & Communication Tech 34 20 16 42.5% 25.6% 21.1% 13 Law Enforcement 2 2 2 33.3% 33.3% 33.3% 14 STEM 4 2 2 33.3% 18.2% 18.2% 16 Public Affairs/Community Awareness 2 1 1 100% 50.0% 50.0% 17 Career Exploration 3 2 1 17.6% 11.8% 5.9% 18 Transition-Disabled 49 33 19 54.4% 36.7% 20.9% NA Total= 536 378 259 53% 37.6% 26.3%
61
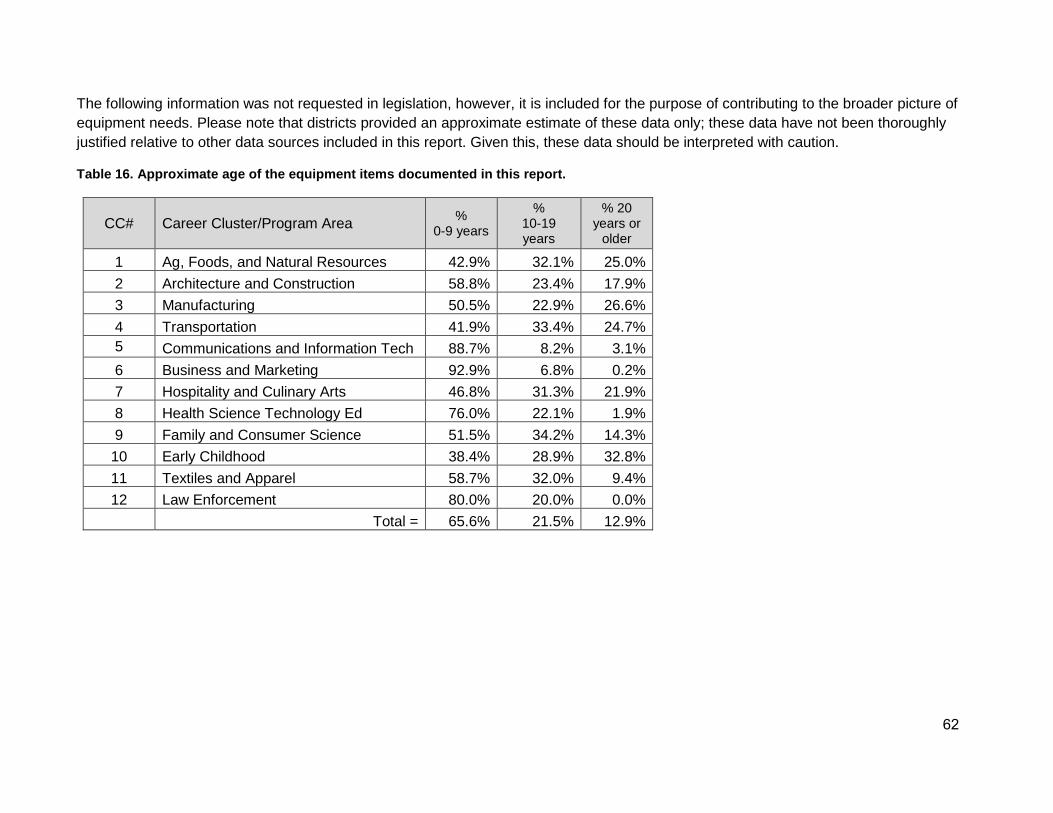
The following information was not requested in legislation, however, it is included for the purpose of contributing to the broader picture of equipment needs. Please note that districts provided an approximate estimate of these data only; these data have not been thoroughly justified relative to other data sources included in this report. Given this, these data should be interpreted with caution.
Table 16. Approximate age of the equipment items documented in this report.
CC# Career Cluster/Program Area % 0-9 years
% 10-19 years
% 20 years or
older
1 Ag, Foods, and Natural Resources 42.9% 32.1% 25.0% 2 Architecture and Construction 58.8% 23.4% 17.9% 3 Manufacturing 50.5% 22.9% 26.6% 4 Transportation 41.9% 33.4% 24.7% 5 Communications and Information Tech 88.7% 8.2% 3.1% 6 Business and Marketing 92.9% 6.8% 0.2% 7 Hospitality and Culinary Arts 46.8% 31.3% 21.9% 8 Health Science Technology Ed 76.0% 22.1% 1.9% 9 Family and Consumer Science 51.5% 34.2% 14.3% 10 Early Childhood 38.4% 28.9% 32.8% 11 Textiles and Apparel 58.7% 32.0% 9.4% 12 Law Enforcement 80.0% 20.0% 0.0%
NA Total = 65.6% 21.5% 12.9%
62

Appendix I
Minnesota Career and Technical Education Clusters, Fields, and Pathways
63
Appendix J List of Contributors
MDE Staff:
Brenda Cassellius, Commissioner of Education Paula Palmer, Director of Office of Career and College Success Kari-Ann Ediger, Program Improvement and Results Measurement Specialist Michelle Kamenov, Interim Supervisor, Career and Technical Education Steve Dibb, Deputy Commissioner of Education Steve Huser, Legislative Coordinator Daron Korte, Assistant Commissioner of Education Stephanie Graff, MMR ESEA Flex Coordinator Adosh Unni, Government Relations Director Rose Hermodson, Assistant Commissioner of Education Kara Arzamendia, Data Analytics Supervisor Debra Blahosky, Administrative Support Anne Danielson, Administrative Support Jacqui McKenzie, Dual Credit Program Administrator Valarie Cochran, Administrative Support Andrea Amos, Turnaround Schools Specialist Scott Freburg, Data Programming, IT Operations Jake Stark, MDE Web Team Kent Filipiak, IT Help Desk Lisa Burton, Results Measurement Specialist Catherine Biringer, Communications Specialist John Rapheal, Trades, Industry and Technology Specialist Michael Mitchell, Health Sciences Specialist Joel Larsen, Agricultural Specialist Jean Kyle, Business and Marketing Specialist
MnSCU Staff: JoAnn Simser, MnSCU State Director of Career and Technical Education
64