Embed Size (px)
Citation preview

©2012 - Journal of Career and Technical Education, Vol. 27, No. 2, Winter, 2012 – Page 20
Career and Technical Education Secondary Female Teachers: Leadership Attributes
Tedra H. White Bettye P. Smith
The University of Georgia
ABSTRACT
The purpose of this study was to determine the leadership attributes, professional characteristics, and personal characteristics of secondary female teachers in career and technical education program areas of agriculture, business, family and consumer sciences, healthcare science, marketing, and technology. This study included 179 female secondary career and technical education teachers. Study findings showed that on the 37 leadership attributes, which are presented according to the five clusters (trust, organization, drive, interpersonal, and tolerance), teachers’ mean scores that ranged from a low of 4.7 to a high of 5.7 on a 6-point scale. Of the five clusters (trust, organization, drive, interpersonal, and tolerance) the Tolerance cluster received the lowest mean scores whereas the Trust cluster received the highest mean scores from teachers. This study found that 35.2% of female secondary career and technical education teachers have a desire to take on leadership roles. These teachers identified 21 leadership positions that they desired to have.
Introduction
The literature on leadership in education indicates that multiple leaders are involved in the leadership of the school, some with and without a formal leadership position (Fullan, 1996; Spillane, 2005). These positions include principals, assistant principals, and teachers. The concept of distributed leadership advocates decentralization of the school leader. This type of leadership suggests that every person in any position can demonstrate leadership in some way (Coleman, 2005). While this view of leadership does not mean that everyone is a leader, it presents the possibility for more fluid and emergent leadership by people at all levels rather than by fixed leadership of the people at the top (Gronn, 2000; Leithwood, Mascall, Strauss, Sacks, Memon, & Yashkina, 2007).
Teacher leadership is rooted in the education reforms of the 1980s and focuses on leaders
who influence others to improve their educational practices (Sabatini, 2002), and is committed to improving professional learning opportunities for self and others (Galland, 2008). In the early 1980s, A Nation at Risk: The Imperative for Educational Reform (1983) ignited national, state, and local school reform efforts after it reported that the educational foundations of society was being eroded by mediocrity and put out the call for the urgent need for immediate improvement. Along with recommendations in the areas of content, standards and expectations, time, and leadership and fiscal support, the report recommended the improvement of teachers with the report specifically focusing on teacher leadership.
Teacher leadership has flourished in situations where it is actively supported or
encouraged by principals (York-Barr & Duke, 2004). The extent to which teachers take on leadership roles depends on the culture of the school, the relationship between teachers and the
©2012 - Journal of Career and Technical Education, Vol. 27, No. 2, Winter, 2012 – Page 21
principal, opportunity, and principal encouragement and support (Leithwood et al., 2007). Principals may lack the experience and knowledge that it takes to effectively support higher levels of teacher leadership. This difficulty lies in the issues that arise due to the complicated task of clarifying the boundaries of teacher leadership, principal leadership, and the areas of common ground (Muijs & Harris, 2003; York-Barr & Duke, 2004).
While teacher leadership is not new, the recognition and expanded roles of teacher
leadership and its contribution to school improvement is a new and significant focus (York-Barr & Duke, 2004). Furthermore, investments have been made on advancing the concept and practice of teacher leadership. When performing in a leadership role, teachers have the ability to help shape schools while maintaining their influence in the classroom (Marks & Printy, 2003). Teacher leadership is exhibited through a variety of formal and informal roles and positions. They include formal positions such as curriculum specialists and department heads (Silva, Gimbert & Nolan, 2000; York-Barr & Duke, 2004) and informal roles such as coaching of peers and working in and leading small groups and teams (York-Barr & Duke, 2004). Teachers who assume informal roles are allowed to lead by their peers because they show high levels of instructional expertise, collaboration, reflection, and empowerment (York-Barr & Duke, 2004). Marks and Printy (2003) deem educational reform and school improvement as more successful when teachers are involved in leadership roles.
Although much research regarding teacher leadership (Ackerman & MacKenzie, 2006;
Barth, 2001; Donaldson, 2007; Harris, 2002; Muijs & Harris, 2003; Phelps, 2008) has been conducted, a paucity of existing research was identified in the literature that addressed teacher leadership in career and technical education (Vail, 1991; Vail & Pedras, 1994; Vail & Reddick, 1993). The National Leadership Institute was created in 2001 with the purpose of developing leadership in career and technical education program educators (Gregson & Allen, 2007). According to Gregson and Allen (2007), members of the institute identified a lack of new leaders to fill future needs as one of the overriding issues facing career and technical education. Therefore, teacher leadership is needed in all areas and levels of education including career and technical education when educational reform and school improvement are major issues.
With the understanding of teacher leadership becoming the goal rather than a trend, it is
likely that more teachers will find themselves with leadership responsibilities. It is likely that more female teachers will find themselves in leadership roles as women represent 73% of teachers at elementary and secondary levels; but, constitute less than 35% of all principalships (Loder & Spillane, 2005). While women make up at least half the population of secondary teachers, they are in the minority in administrative positions comprising only 19% of secondary principals (Wrushen & Sherman, 2008). Although prior research has focused on teacher leadership, this study will focus specifically on female teachers in career and technical education, and the leader’s attributes and professional and personal characteristics.
Review of Related Literature
The latest research targeting career and technical education teachers and teacher leadership was conducted in the early 1990s (Vail, 1991). This research examined the predictors of leadership behaviors and found that career and technical education teachers are more involved
©2012 - Journal of Career and Technical Education, Vol. 27, No. 2, Winter, 2012 – Page 22
in teacher leadership than non-career and technical education teachers (Vail, 1991). Vail and Pedras (1994) added to the research on career and technical education teacher leadership by performing an ex post facto/correlational study of 84 trade and industry teachers. The purpose of the study was to provide information on the extent to which trade and industry teachers performed teacher leadership behaviors and to identify predictors of teacher leadership behaviors. The researchers found that teachers believed that teacher leadership performance was important, they seldom performed teacher leadership. The research also concluded that the importance placed on teacher leadership was the best predictor of teacher leadership performance with marital status following.
The review of related literature revealed several studies dealing with females and leadership. Dunbar and Kinnersley (2011) surveyed 239 female administrators from Tennessee higher education institutions in order to determine the differences in perceptions of the effectiveness of the mentoring relationship among female higher-education administrators who experienced different mentoring approaches. This review will specifically look at the research question posed by the researchers of what the perceptions of female administrators in higher education regarding how mentoring helped to prepare them for leadership. The study found that 64% of respondents had a mentor. The respondents were 88% Caucasian and 90% of them had been in a mentoring relationship with a Caucasian mentor. Ninety percent of mentors were of a higher rank than the mentee and 82% worked at the same institution. The female administrators indicate that their mentoring relationships prepared them for leadership and recommended a mentor as a tool for advancement.
Knopik and Moerer (2010) survey of 27 women from five states, sought to determine how women entrepreneurs and women leaders viewed teamwork, demonstrated personal traits, made team choices, defined vision, and described motivations and priorities of purpose. The researchers found that the entrepreneurs were much more task-oriented and focused on their own actions. The leaders tended to value teamwork, collaboration, relationship building and maintaining those relationships.
In an effort to illuminate differences and commonalities of women leaders from different ethnic backgrounds through their own voices and create a vision of what leadership is like at the secondary level, Wrushen and Sherman (2008) interviewed eight (8) female secondary principals. In terms of gender and leadership, all of the women spoke of leadership using terms such as “emotional” and “compassionate” which they believed allows them to be more effective leaders. Also, the women were aware of perceptions that society had on leaders with two specifying their youth affecting how others perceived them. The women spoke of not being heard as women leaders and had to spend years working to gain respect that was automatically given to their male counterparts. The women spoke of ethnicity and leadership by stating that racial stereotyping stands out over gender. Some of the women of color felt that they were “paving the way” for other females and felt the pressure that it put on them and whether or not their actions would open the door for others. The women, however, looked forward to paying it forward. When asked about power the women did not feel powerful and felt uncomfortable describing themselves as powerful. They are aware that they underutilize their power and influence to advocate on behalf of their teachers and students.
©2012 - Journal of Career and Technical Education, Vol. 27, No. 2, Winter, 2012 – Page 23
Loder and Spillane (2005) compared 16 women administrators (10 principals and 6 assistant principals) who were 1-5 years into their positions. In their study the researchers interviewed the women to find how they viewed the relationship between their current role and their former role as teachers. The study resulted in the women administrators revealing that in their transition from teaching to a managerial position they faced role conflicts. They admitted to a naiveté about how schools operated. Their focus on managerial tasks often hindered their focus on instructional issues. Once they became administrators they were no longer viewed as colleagues or friends by other teachers.
Eagly and Johnson (1990) performed a meta-analysis of organizational studies with 289
participants, laboratory experiments with 25 participants, assessment studies of 56 participants and a questionnaire study of 306 participants. The purpose of the research was to find gender relevant aspects of leadership roles. The researchers concluded that 92% of the included studies showed that women tend to adopt a more participative style and a less directive style than their male counterparts did.
Therefore, it can be concluded that mentoring is important in the leadership development
of females. They also value teamwork, collaboration, relationship building and are advocates for teachers and students. Lastly, females elude a more participatory style of leadership.
Transformational Leadership
According to Moss and Johansen (1991), it is imperative for career and technical education to fill leadership gaps by identifying potential teacher leaders who display transformational leadership attributes, characteristics, and behaviors. Therefore, a leadership theory that combines both the attributes and behaviors of leadership was chosen for this study.
Transformational leadership is the process of changing and transforming individuals,
both leader and follower. It happens when a leader engages with followers in such a way that the connection raises the motivation level and morality of both the leader and the follower. Transformational leadership moves followers to achieve more than what is expected of them and is effective at developing followers to their fullest potential (Bass, 2008).
Transformational leadership consists of characteristics that leaders display. There are
several factors that Bass (2008) used to clarify his model of transformational leadership. These factors include charisma or an idealized influence, inspirational motivation, intellectual stimulation, and individualized consideration. Charisma or idealized influence describes leaders who act as strong role models for followers and provide followers with a vision and mission. Inspirational motivation describes leaders who communicate high expectations to followers. Intellectual stimulation describes leadership that motivates followers to be innovative, creative and challenge their beliefs and values, the leader’s, and the organization’s as well. Individualized consideration describes leaders who act as coaches and advisors who understand the needs of followers while providing a supportive environment (Northouse, 2004).
©2012 - Journal of Career and Technical Education, Vol. 27, No. 2, Winter, 2012 – Page 24
Purpose of study
The purpose of this study was to determine the leadership attributes, professional characteristics, and personal characteristics of secondary female teachers in career and technical education programs. The career and technical education program areas included agriculture education, business education, family and consumer sciences, healthcare science, marketing, and technology education. The research question was: What are the leadership attributes, professional characteristics, and personal characteristics of secondary female career and technical education teachers in Georgia?
Method and Procedure
The entire population of female secondary career and technical education teachers was
used to achieve the sample. A comprehensive list of all 1752 female secondary career and technical education teachers who were employed in public high schools during the 2010-2011 school-year were obtained from the Georgia Department of Education that included schools, addresses, and telephone numbers. These female secondary career and technical education teachers were in the program areas of agriculture, business, engineering and technology education, family and consumer sciences, healthcare education, and marketing. The researchers went through the GADOE list of each teacher to determine the teacher’s school. After determining the name of the school, the researchers visited the high school’s website, if one was available, to get the teacher’s e-mail address. If the teacher’s e-mail address was available to the public, the teacher became part of the accessible population. After this process, there were a total of 1197 valid e-mail addresses found on the respective schools’ websites. Thereby, the accessible population for this study was 1197 female secondary career and technical education teachers with valid e-mail accounts available to the public through their school’s website. Based on Krejcie and Morgan’s (1970), a sample size of 291 was established for this population. According to Gall, Gall, and Borg (2007), it is recommended to use the largest sample possible especially if the expected difference between the groups is small. The sample size for this study was doubled since it is expected that female secondary career and technical education teachers share similarities and the differences are expected to be small. Therefore, the researcher invited 582 possible participants for this study. The sample for this study was selected using a simple random method by assigning each teacher in the accessible population a number and then utilizing an online random number selector (Stattrek, 2011) to determine which teachers to invite to participate in the study. After two individuals opted out and 19 others had e-mails that bounced out of the e-mail queue and were deemed to not be accessible, there were a total of 561 possible participants in this study.
This research was conducted using an online survey platform, Survey. A three-contact
strategy as recommended by Dillman, Smyth, and Christian (2009). The three-contact strategy calls for initial contact to be made via e-mail. The first contact resulted in 70 respondents completing the survey, two individuals opting out of the survey and 19 addresses being bounced out of the e-mail queue and were deemed to not be accessible. The second contact and first follow-up was made eight days later. The second contact was e-mailed to the 561 possible participants and served as both a thank you to the 70 respondents who had completed the survey and as a reminder to those who had not. The second contact resulted in 71 additional
©2012 - Journal of Career and Technical Education, Vol. 27, No. 2, Winter, 2012 – Page 25
respondents completing the survey, for a total of 140 respondents completing the survey thus far. The final contact, also the second follow-up, was sent six days later. It too, served as both a thank you to survey completers and as a reminder to those who had not completed the survey to date. This third and final contact was sent to the 561 possible participants and focused on the short time left to complete the survey and the importance of completing it (Dillman et al., 2009). The final contact resulted in 38 additional respondents completing the survey. The survey closed one week later with 179 total participants completing the survey. Therefore, the survey was open for a total of three weeks. The three-contact strategy for the 582 female secondary career and technical education teachers who was invited to participate in the study resulted in 179 respondents, a 32% response rate. Due to the low response rate, the findings of this study can only be generalized to the respondents rather than the population.
Respondent numbers and percentages were 16 agriculture teachers (8.9% of the sample),
77 business education teachers (43% of the sample), 14 engineering and technology teachers (8% of the sample), 44 family and consumer sciences education teachers (24.6% of the sample), 11 healthcare science education teachers (6.1% of the sample), 12 marketing education teachers (6.7% of the sample), and five teachers who did not provide their program area (2.8% of the sample).
Instrumentation The Leadership Attributes Inventory (LAI) was developed by Moss and Johansen (1991) after an extensive literature review and designed specifically for career and technical education to assess the characteristics, skills, knowledge, and values of an individual that predisposes successful leadership performance. Moss, Lambrect, Jensrud, and Finch (1994) admitted that while it was never intended for the 37 items on the LAI to be grouped into separate measurable subscales, it would be helpful to know how the attributes might be ordered when designing leadership development programs. Therefore, Jensrud (1995), one of the authors of the final version of the LAI, performed a factor analysis on the 37 attributes on the LAI and found that they can be divided into five clusters that accounted for 65% of the variance. The clusters on the LAI are labeled as drive, organization, trust, interpersonal, and tolerance. These five clusters were used in this research study in order to show results with a manageable amount of data which leads to easier understanding by the reader. Each of the 37 attributes on the instrument fall under one of the five aforementioned clusters. Drive is represented by nine attributes on the survey. Those nine attributes are visionary, initiating, enthusiastic, persistent, energetic, courageous, achievement oriented, networking, and insightful. An example of drive is “shows commitment to achieving goals and strive to keep improving performance” (Moss et al., 1994 p. 69). Organization is also represented by nine attributes on the 37-item survey. The attributes representing organization are organizing, planning, time management, information management, intelligent, willing to accept responsibility, decision making, problem solving, and dependable. An example of organization is “establishes effective and efficient procedures for getting work done in an orderly manner” (Moss et al., 1994 p. 70). Trust is characterized by seven attributes. These seven attributes that make up trust are ethical, committed to the common good, sensitivity, ideological beliefs appropriate to the group, accountable, personal integrity, and confident. An example of trust is “holds self-answerable for work and willingly admit mistakes” (Moss, 1994 p. 69). Interpersonal is conveyed by six attributes. The interpersonal items on the survey are
©2012 - Journal of Career and Technical Education, Vol. 27, No. 2, Winter, 2012 – Page 26
delegating, conflict management, team-building, coaching, motivating others, and appropriate use of leadership styles. An example of interpersonal is “creates an environment in which people want to do their best” (Moss, 1994 p. 70). Tolerance is represented by six attributes. Those six attributes are tolerant of frustration, even disposition, adaptable, tolerant of ambiguity and complexity, stress management, and communication. An example of tolerance is “acts calmly and patiently even when things don’t go as planned” (Moss et al., 1994, p. 69).
The instrument asked the respondent to simply mark what “best describes the extent to which the attributes currently describe you” (p. 1). Each attribute was listed along with a description of the attribute. A 6-point Likert scale was used to rate each attribute as follows: 1 = very undescriptive, 2 = undescriptive, 3 = somewhat undescriptive, 4 = somewhat descriptive, 5 = descriptive, and 6 = very descriptive. For this study, the average, or mean, of the ratings from 1 to 1.4 was very undescriptive. A mean of 1.5 to 2.4 was undescriptive, while a mean of 2.5 to 3.4 was somewhat undescriptive. A mean of 3.5 to 4.4 was deemed somewhat descriptive, while a mean of 4.5 to 5.4 was descriptive. Lastly, a mean of 5.5 to 6.0 was rated as very descriptive.
Survey Monkey’s efficiency is exhibited through the company’s management of
participants, initial participant invitation, e-mail follow-ups to non-responders, and the compilation of data. After compilation of data in Survey Monkey, the researcher was able to easily export data into the Statistical Package for the Social Sciences (SPSS) for analysis. The analysis utilized descriptive statistics. The descriptive statistics used included frequencies, percentages, means and standard deviations.
Findings What are the leadership attributes, professional characteristics, and personal characteristics of secondary female career and technical education teachers in Georgia? Overall Frequencies and Percentages for Leadership Attributes Of the 37 leadership attributes, teachers rated 12 (32.4%) of the leadership attributes more frequently as being “very descriptive” of themselves. For those 12 leadership attributes, there were five attributes under the trust cluster, four were under the drive cluster, and three were under organization. On the other hand, 25 or 67.6%, of the leadership attributes were rated more frequently by teachers as “descriptive” of themselves. Of these 25 leadership attributes, the organization, interpersonal, and tolerance clusters each had six attributes rated as “descriptive,” while drive had five attributes, and trust had two attributes.
The two leadership attributes with the lowest ratings of “somewhat undescriptive” to “undescriptive” of respondents were courageous, risk taker, under the cluster drive, with 7.3%. The second leadership attribute was stress management, under the cluster tolerance, with 7.8% of teachers indicating that this attribute was “somewhat undescriptive” to “very undescriptive” of themselves.
©2012 - Journal of Career and Technical Education, Vol. 27, No. 2, Winter, 2012 – Page 27
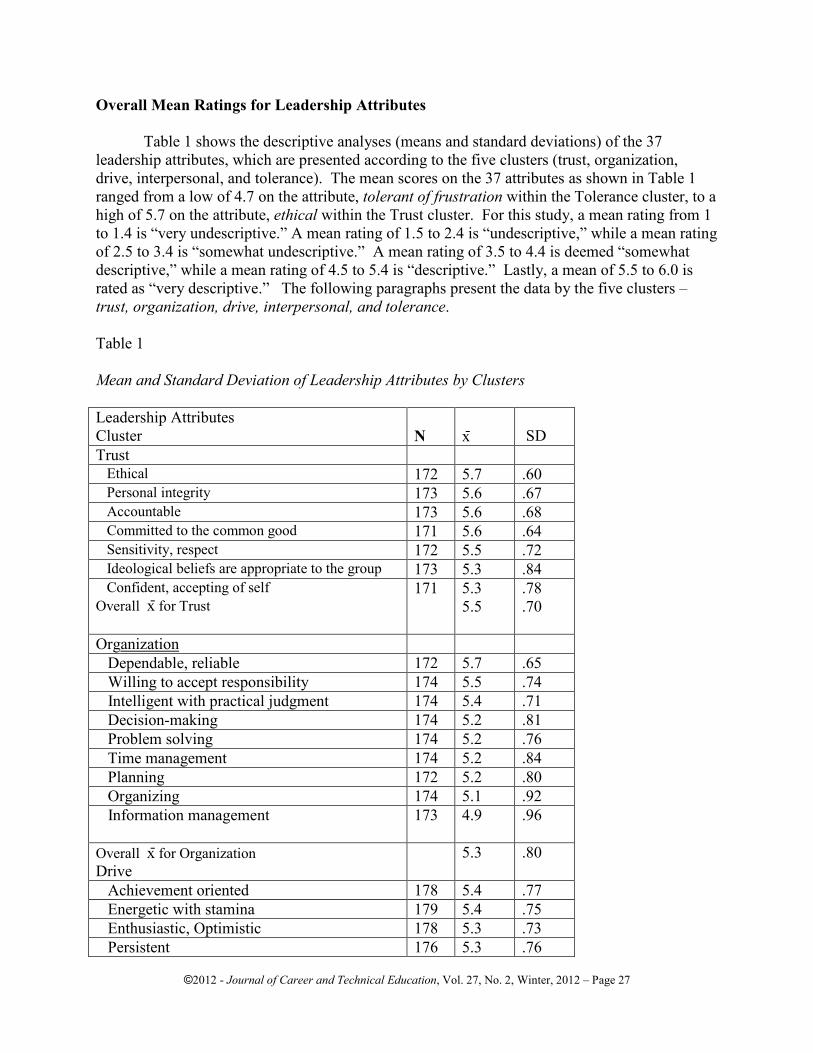
Overall Mean Ratings for Leadership Attributes Table 1 shows the descriptive analyses (means and standard deviations) of the 37 leadership attributes, which are presented according to the five clusters (trust, organization, drive, interpersonal, and tolerance). The mean scores on the 37 attributes as shown in Table 1 ranged from a low of 4.7 on the attribute, tolerant of frustration within the Tolerance cluster, to a high of 5.7 on the attribute, ethical within the Trust cluster. For this study, a mean rating from 1 to 1.4 is “very undescriptive.” A mean rating of 1.5 to 2.4 is “undescriptive,” while a mean rating of 2.5 to 3.4 is “somewhat undescriptive.” A mean rating of 3.5 to 4.4 is deemed “somewhat descriptive,” while a mean rating of 4.5 to 5.4 is “descriptive.” Lastly, a mean of 5.5 to 6.0 is rated as “very descriptive.” The following paragraphs present the data by the five clusters – trust, organization, drive, interpersonal, and tolerance. Table 1 Mean and Standard Deviation of Leadership Attributes by Clusters Leadership Attributes Cluster
N
x̄
SD
Trust Ethical 172 5.7 .60 Personal integrity 173 5.6 .67 Accountable 173 5.6 .68 Committed to the common good 171 5.6 .64 Sensitivity, respect 172 5.5 .72 Ideological beliefs are appropriate to the group 173 5.3 .84 Confident, accepting of self Overall x̄ for Trust
171 5.3 5.5
.78
.70
Organization Dependable, reliable 172 5.7 .65 Willing to accept responsibility 174 5.5 .74 Intelligent with practical judgment 174 5.4 .71 Decision-making 174 5.2 .81 Problem solving 174 5.2 .76 Time management 174 5.2 .84 Planning 172 5.2 .80 Organizing 174 5.1 .92 Information management
173 4.9 .96
Overall x̄ for Organization Drive
5.3 .80
Achievement oriented 178 5.4 .77 Energetic with stamina 179 5.4 .75 Enthusiastic, Optimistic 178 5.3 .73 Persistent 176 5.3 .76
©2012 - Journal of Career and Technical Education, Vol. 27, No. 2, Winter, 2012 – Page 28
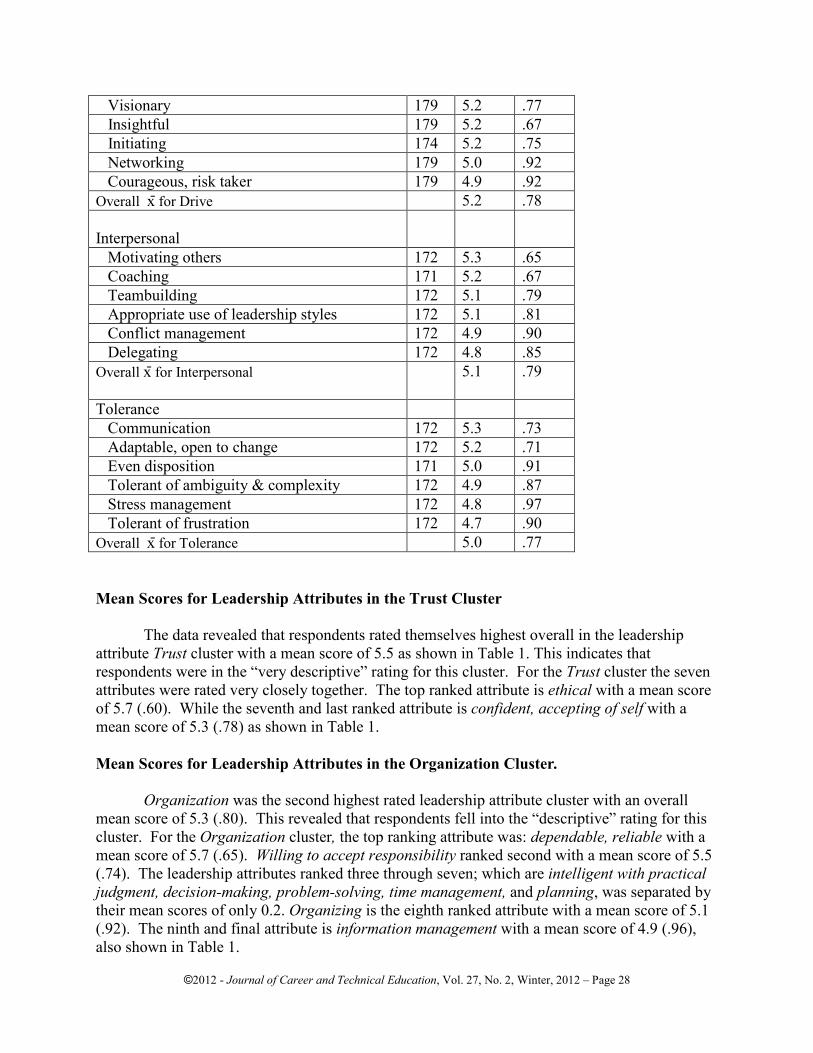
Visionary 179 5.2 .77 Insightful 179 5.2 .67 Initiating 174 5.2 .75 Networking 179 5.0 .92 Courageous, risk taker 179 4.9 .92 Overall x̄ for Drive 5.2 .78 Interpersonal
Motivating others 172 5.3 .65 Coaching 171 5.2 .67 Teambuilding 172 5.1 .79 Appropriate use of leadership styles 172 5.1 .81 Conflict management 172 4.9 .90 Delegating 172 4.8 .85 Overall x̄ for Interpersonal
5.1 .79
Tolerance Communication 172 5.3 .73 Adaptable, open to change 172 5.2 .71 Even disposition 171 5.0 .91 Tolerant of ambiguity & complexity 172 4.9 .87 Stress management 172 4.8 .97 Tolerant of frustration 172 4.7 .90 Overall x̄ for Tolerance 5.0 .77 Mean Scores for Leadership Attributes in the Trust Cluster
The data revealed that respondents rated themselves highest overall in the leadership attribute Trust cluster with a mean score of 5.5 as shown in Table 1. This indicates that respondents were in the “very descriptive” rating for this cluster. For the Trust cluster the seven attributes were rated very closely together. The top ranked attribute is ethical with a mean score of 5.7 (.60). While the seventh and last ranked attribute is confident, accepting of self with a mean score of 5.3 (.78) as shown in Table 1.
Mean Scores for Leadership Attributes in the Organization Cluster.
Organization was the second highest rated leadership attribute cluster with an overall mean score of 5.3 (.80). This revealed that respondents fell into the “descriptive” rating for this cluster. For the Organization cluster, the top ranking attribute was: dependable, reliable with a mean score of 5.7 (.65). Willing to accept responsibility ranked second with a mean score of 5.5 (.74). The leadership attributes ranked three through seven; which are intelligent with practical judgment, decision-making, problem-solving, time management, and planning, was separated by their mean scores of only 0.2. Organizing is the eighth ranked attribute with a mean score of 5.1 (.92). The ninth and final attribute is information management with a mean score of 4.9 (.96), also shown in Table 1.
©2012 - Journal of Career and Technical Education, Vol. 27, No. 2, Winter, 2012 – Page 29
Mean Scores for Leadership Attributes in the Drive Cluster The third ranked leadership attribute Drive cluster had a mean score of 5.2, signifying
that this cluster was “descriptive” of respondents (see Table 1). For Drive, the top rated attribute was achievement oriented with a mean score of 5.4 (.77). The second highest rated attribute was energetic with stamina with a mean score of 5.4 (.75). The third through seventh attributes had mean scores that were separated by 0.1 tenth of a percentage point. Networking ranked eighth with a mean score of 5.0 (.92). The last attribute is courageous, risk taker with a mean score of 4.9 (.92) in Table 1.
Mean Scores for Leadership Attributes in the Interpersonal Cluster
The fourth leadership attribute cluster, interpersonal, had a mean score of 5.1 and was rated “descriptive” of most respondents as shown in Table 1. The Interpersonal cluster had the top rated attribute motivating others with a mean score of 5.3 (.65). The second, third, and fourth rated attributes all maintained mean scores above 5.1. With a mean of 4.9 (.90), conflict management rated fifth and delegating rated sixth with a mean score of 4.8 (.85).
Mean Scores for Leadership Attributes in the Tolerance Cluster
The fifth and lowest rated cluster was tolerance with a total mean score of 5.0 (.85) as shown in Table 1. This indicated that this cluster was “descriptive” of respondents. The Tolerance cluster has the top ranking attribute communication with a mean score of 5.3 (.73). Adaptable, open to change rated second with a mean score of 5.2 (.71). The third rated attribute is even disposition with a mean of 5.0 (.91). The fourth rated attribute, tolerant of ambiguity and complexity, the fifth rated attribute stress management, and tolerant of frustration all revealed mean scores less than 5.0 (Table 1). Professional Characteristics
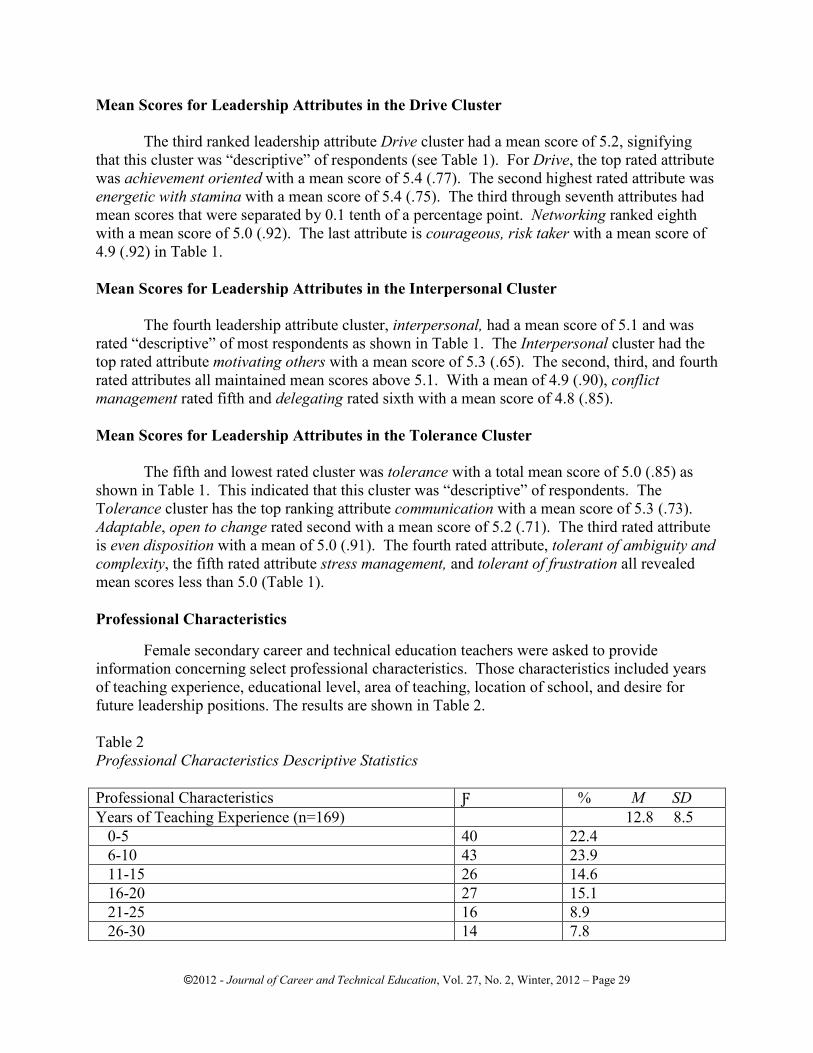
Female secondary career and technical education teachers were asked to provide information concerning select professional characteristics. Those characteristics included years of teaching experience, educational level, area of teaching, location of school, and desire for future leadership positions. The results are shown in Table 2. Table 2 Professional Characteristics Descriptive Statistics Professional Characteristics Ƒ % M SD Years of Teaching Experience (n=169) 12.8 8.5 0-5 40 22.4 6-10 43 23.9 11-15 26 14.6 16-20 27 15.1 21-25 16 8.9 26-30 14 7.8

©2012 - Journal of Career and Technical Education, Vol. 27, No. 2, Winter, 2012 – Page 30
30+ 3 1.7 Missing Data 10 5.6 Educational Level(n=170) Bachelor 33 18.4 M.Ed 65 36.3 MAT 8 4.5 Master – Other 19 10.6 Specialist 36 20.1 Ed.D 7 3.9 Ph.D 2 1.1 Missing Data 9 5 Current Area of Teaching (n=170) Agriculture 16 8.9 Business 76 42.5 Engineering & Technology 13 7.3 Family & Consumer Sciences 43 24 Health Science 12 6.7 Marketing 10 5.6 Missing Data 9 5 Location of School (n=171) Rural 66 36.9 Suburban 75 41.9 Urban 30 16.8 Missing Data 8 4.5 Desire for Future Leadership Role (n=170) Yes 63 35.2 No 107 59.8 Missing Data 9 5 Note. % may not total 100% because of rounding. Years of teaching experience
The data revealed that the teaching experience of the respondents ranged from one to
over 30 years. The average years of teaching experience was 12.8 years; the standard deviation was 8.5. The most frequent range of years of experience was 6 to 10 years and made up almost a fourth, 23.9%, of the total responses (Table 2). However, almost half, 46.3% of the respondents in this study have one to 10 years of teaching experience.
©2012 - Journal of Career and Technical Education, Vol. 27, No. 2, Winter, 2012 – Page 31
Educational level
The data showed that 76.5% of respondents held a degree higher than the Bachelor’s level. Slightly more than one-third, 36.3%, of the respondents held a Master of Education degree (M.Ed). A fifth, 20.1%, of the respondents held a Specialist degree (see Table 2).
Area of teaching
Of the respondents, a majority, 42.5% were business education teachers. Whereas, 24% were family and consumer sciences teachers, 8.9% were agriculture teachers, and 7.3% taught in the area of engineering and technology. All other areas of teaching each fell below 7% (see Table 2). Location of school
A suburban location of the school made up 41.9% of where respondents worked. A rural
location made up 36.9% and an urban location made up 16.8%. There were 4.5% non-responses to this characteristic (Table 2).
Desire for future leadership position
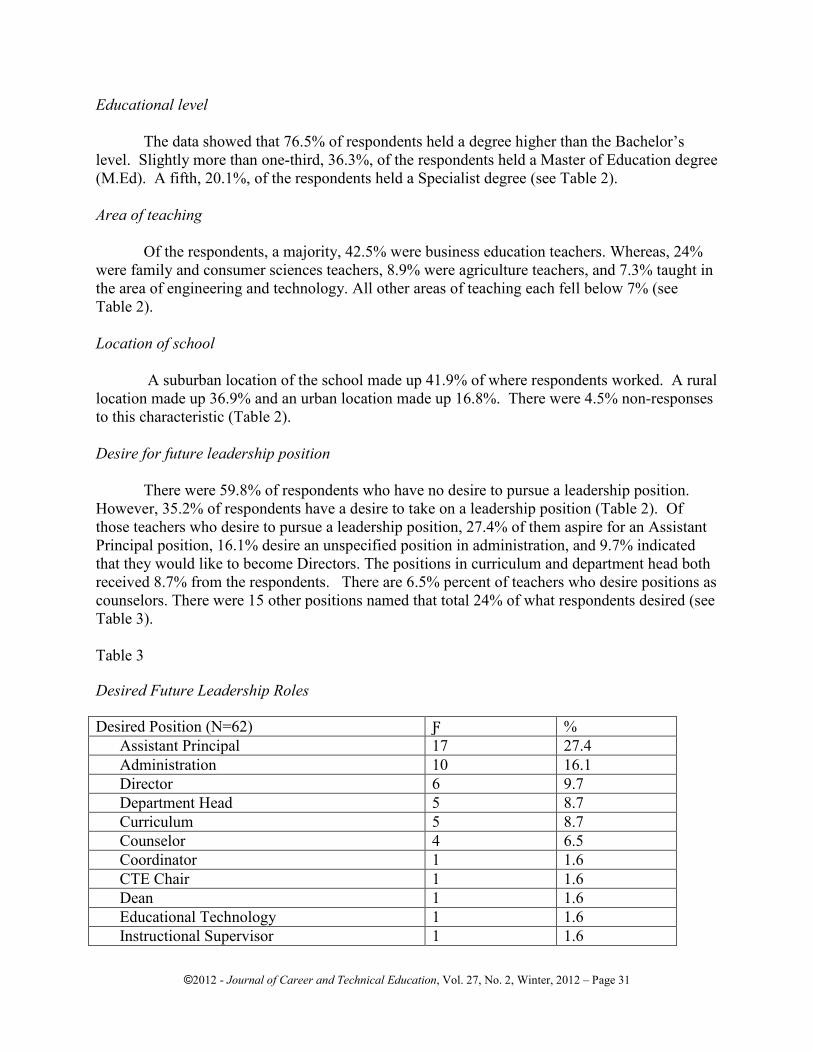
There were 59.8% of respondents who have no desire to pursue a leadership position. However, 35.2% of respondents have a desire to take on a leadership position (Table 2). Of those teachers who desire to pursue a leadership position, 27.4% of them aspire for an Assistant Principal position, 16.1% desire an unspecified position in administration, and 9.7% indicated that they would like to become Directors. The positions in curriculum and department head both received 8.7% from the respondents. There are 6.5% percent of teachers who desire positions as counselors. There were 15 other positions named that total 24% of what respondents desired (see Table 3). Table 3 Desired Future Leadership Roles Desired Position (N=62) Ƒ %
Assistant Principal 17 27.4 Administration 10 16.1 Director 6 9.7 Department Head 5 8.7 Curriculum 5 8.7 Counselor 4 6.5 Coordinator 1 1.6 CTE Chair 1 1.6 Dean 1 1.6 Educational Technology 1 1.6 Instructional Supervisor 1 1.6
©2012 - Journal of Career and Technical Education, Vol. 27, No. 2, Winter, 2012 – Page 32
Note. % may not total 100% because of rounding Personal Characteristics Age and race
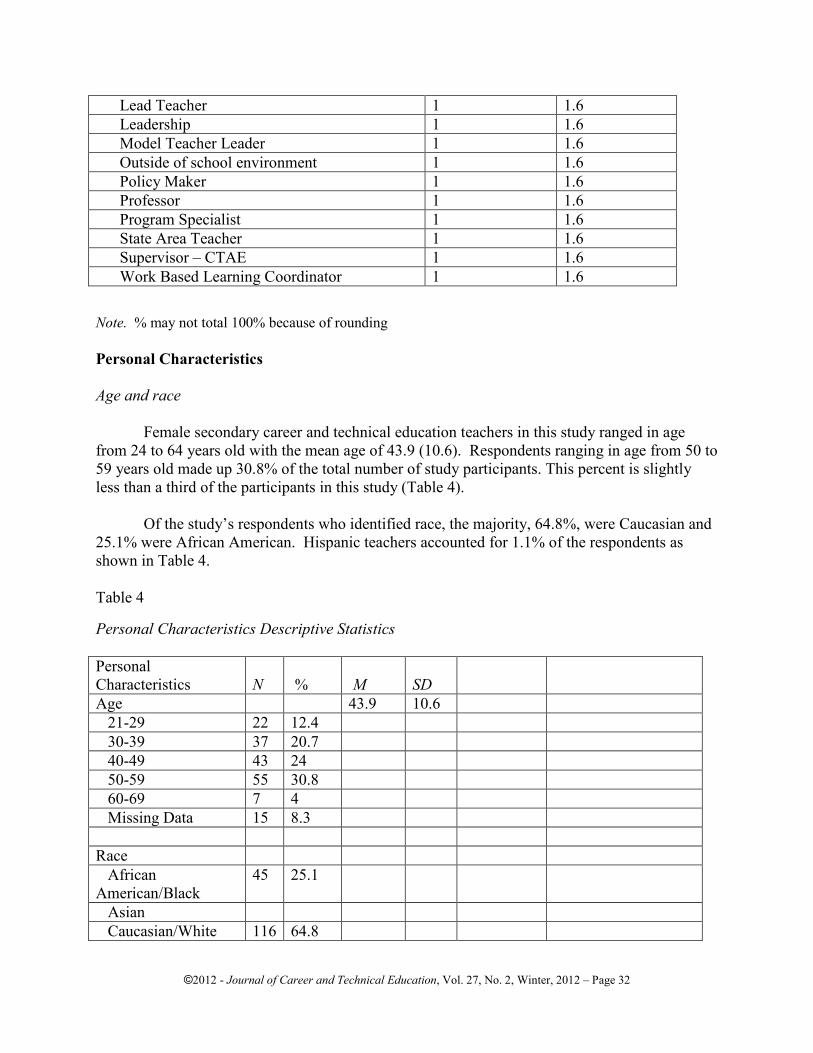
Female secondary career and technical education teachers in this study ranged in age from 24 to 64 years old with the mean age of 43.9 (10.6). Respondents ranging in age from 50 to 59 years old made up 30.8% of the total number of study participants. This percent is slightly less than a third of the participants in this study (Table 4).
Of the study’s respondents who identified race, the majority, 64.8%, were Caucasian and
25.1% were African American. Hispanic teachers accounted for 1.1% of the respondents as shown in Table 4. Table 4
Personal Characteristics Descriptive Statistics Personal Characteristics
N
%
M
SD
Age 43.9 10.6 21-29 22 12.4 30-39 37 20.7 40-49 43 24 50-59 55 30.8 60-69 7 4 Missing Data 15 8.3 Race African American/Black
45 25.1
Asian Caucasian/White 116 64.8
Lead Teacher 1 1.6 Leadership 1 1.6 Model Teacher Leader 1 1.6 Outside of school environment 1 1.6 Policy Maker 1 1.6 Professor 1 1.6 Program Specialist 1 1.6 State Area Teacher 1 1.6 Supervisor – CTAE 1 1.6 Work Based Learning Coordinator 1 1.6
©2012 - Journal of Career and Technical Education, Vol. 27, No. 2, Winter, 2012 – Page 33
Hispanic 2 1.1 Other Missing Data 16 8.9 Note. % may not total 100% because of rounding. Conclusion and Discussion
The research question was designed to provide a description of the leadership attributes, professional characteristics, and personal characteristics of female secondary career and technical education teachers. It was shown that on the 37 leadership attributes, presented according to the five clusters (trust, organization, drive, interpersonal, and tolerance), teachers’ mean scores that ranged from a low of 4.7 to a high of 5.7 on a 6-point scale. Additionally, female secondary career and technical education teachers rated 12, or 32.4%, of the attributes as “very descriptive” of themselves and rated 25, or 67.5%, of the attributes as being “descriptive” to “somewhat descriptive” of them. The data revealed that most of the respondents rated themselves higher in the cluster of trust, with the cluster organization as the second highest rated, the third cluster was drive, the fourth cluster was interpersonal, and the fifth and lowest rated leadership attributes cluster was tolerance. According to Moss and Johansen (1991), it is imperative for career and technical education to fill leadership gaps by identifying potential teacher leaders who display transformational leadership attributes, characteristics, and behaviors. The above findings from this study indeed identified secondary female career and technical education teachers who displayed transformational leadership attributes.
The average years of teaching experience for respondents was 12.8 years with a standard deviation of 8.5. The data revealed that slightly higher than three-fourth, 76.5%, of the respondents held a degree higher than a Bachelor’s (36% of them held a Master of Education degree), and 42.5% were business education teachers. The area of teaching whereby almost half of the teachers in this study were business education is consistent with the composition in the state; there are more business education teachers than other career and technical education areas. A suburban location of the school made up 41.9% of where respondents worked. There were 35.2% of the respondents who have a desire to take on a leadership role. Of those teachers who desire to pursue a higher leadership role, 27.4% of them aspire to the position of Assistant Principal. The teachers range in age from 24 years to 64 years with a mean age of 43.9 years and a standard deviation of 10.6. The majority, 64.8%, of respondents were Caucasian.
Moss and Liang (1990) declared that what career and technical education needs is strong
leadership at all levels and in all professional roles in order to achieve peak efficiency. According to Gregson and Allen (2007), members of the National Leadership Institute identified a lack of new leaders to fill future needs as one of the overriding issues facing career and technical education. Vail and Pedras (1994) ascertained that developing the capacity of leadership among teachers is one way to prepare the career and technical education field to meet the challenge of leadership, because it is impossible to improve performance without promoting leadership in education by teachers. Many teachers continue to believe that teaching and leadership are mutually exclusive. According to Barth (2001), many teachers see themselves exclusively as teachers and believe that leadership is the responsibility of the principal or administration. This study found that slightly more than a third of female secondary career and
©2012 - Journal of Career and Technical Education, Vol. 27, No. 2, Winter, 2012 – Page 34
technical education teachers in Georgia surveyed have a desire to take on leadership roles. Based on the results of this study concerning desire for leadership roles and the fact that females make up at least a half of the population of secondary teachers, it appears that likely pool of potential leaders are available. These potential leaders need to have professional development opportunities available to them that prepare them in the competency areas that are expected for the leadership roles they desire.
REFERENCES
Ackerman, R., & Mackenzie, S. V. (2006). Uncovering teacher leadership. Educational Leadership, 63(8), 66-70.
Barth, R. S. (2001). Teacher leader. Phi Delta Kappan, 82(6), 443-449. Bass, B. M. (2008). The Bass handbook of leadership: Theory, research, & managerial
applications. (4th ed.). New York: Free Press. Burns, G., & Martin, B. N. (2010). Examination of the effectiveness of male and female
educational leaders who made use of the invitational leadership style of leadership. Journal of Invitational Theory and Practice (16), 29-55.
Coleman, M. (2005). Gender and secondary school leadership. Gender Issues in Leadership,
33(2), 3-20. Dillman, D. A., Smyth, J. D., & Christian, L. M. (2009). Internet, mail, and mixed-mode
surveys: The tailored design method. New Jersey: Wiley. Donaldson, G. A. (2007). What do teachers bring to leadership? Educational Leadership,
65(1), 26-29. Dunbar, D. P., & Kinnersley, R. T. (2011). Mentoring female administrators toward leadership
success. The Delta Kappa Gamma Bulletin. 17-24. Eagly, A. H., & Johnson, B. T. (1990). Gender and leadership style: A meta-analysis.
Psychological Bulletin, 108(2), 233-256.
Fullan, M. (1996). Leadership for change. In Leithwood, K.A., Chapman, J., Corson, P., Hallinger, P., Hart, A. (Eds.) pp. 701-722. International Handbook of Educational Leadership and Administration. Netherlands: Kuiwer Adcademic.
Gall, M. D., Gall, J. P., & Borg, W. R. (2007). Educational research: An introduction.
(8th ed.). White Plains, NY: Longman. Galland, C. (2008). Effective teacher leadership: A quantitative study of the relationship
between school structures and effective teacher leaders. (Unpublished doctoral dissertation). University of Missouri, Columbia.
©2012 - Journal of Career and Technical Education, Vol. 27, No. 2, Winter, 2012 – Page 35
Research pathways: Writing professional papers, theses, and dissertations in workforce education (pp. 223-246). Lanham, MD: University Press of America.
Gregson, J. A., & Allen, J. M., (2007). Leadership in career and technical education:
Beginning the 21st century. Journal of Industrial Teacher Education, 44(4). Retrieved on November 3, 2008, from http://scholar.lib.vt.edu/ejournals/JITE/v44n4/gregson.html.
Gronn, P. (2000). Distributed properties: A new architecture for leadership.
Educational Management and Administration, 28(3), 317-338.
Harris, A. (2002). Improving schools through teacher leadership. Education Journal, 59, 22-23.
Jensrud, Q. T. (1995). The effects of rater and leader gender on ratings of leader
attributes and effectiveness. (Unpublished doctoral dissertation). University of Minnesota, Twin Cities, MN.
Knopick, M. S., & Moerer, T. (2010). Women leaders and entrepreneurs: implications for the
classroom. European Journal of Social Sciences 14(3), 394-403. Krejcie, R. V., & Morgan, D. W. (1970). Determining sample size for research activities.
Educational and Psychological Measurement, 30, 607-608. Leithwood, K., Mascall, B., Strauss, T., Sacks, R., Memon, N., & Yashkina, A. (2007).
Distributing leadership to make schools smarter: Taking the ego out of the system. Leadership and Policy in Schools, 6, 37-67.
Loder, T. L., & Spillane, J. P. (2005). Is a principal still a teacher? US women administrators’
accounts of role conflict and role discontinuity. School Leadership and Management, 25(3), 263-279.
Marks, H. M., & Printy, S. M. (2003). Principal leadership and school performance: An
integration of transformational and instructional leadership. Educational Administration Quarterly 39 (3), 370-397.
Moss, J. Jr., & Johansen, B. (1991). Conceptualizing leadership and assessing leader
attributes. Berkley, CA: National Center for Research in Vocational Education. Moss, J., Jr., Lambrect, J., Jensrud, Q., & Finch, C. (1994). Leader attributes inventory
manual. Berkley, CA: National Center for Research in Vocational Education. (ERIC Document Reproduction Service No. ED374337)
Moss, J., Jr., & Liang, T. (1990). Leadership, leadership development, and the National
Center for Research in Vocational Education. Berkley, CA: National Center for Research in Vocational Education.
©2012 - Journal of Career and Technical Education, Vol. 27, No. 2, Winter, 2012 – Page 36
Muijs, D., & Harris, A. (2003). Teacher leadership – improvement through empowerment? Educational Management & Administration, 31(4), 437-448.
National Center for Education Statistics. (2005). Student participation in CTE: 2005. Alexandria,
VA: Author. Retrieved from http://nces.ed.gov/surveys/ctes/tables/index.asp?LEVEL= SECONDARY
National Center for Education Statistics. (2008). Public school teachers of CTE. Alexandria, VA:
Author. Retrieved from http://nces.ed.gov/surveys/ctes/tables/index.asp?LEVEL= SECONDARY
National Commission on Excellence in Education. (1983). A Nation at Risk: The
Imperative for Educational Reform. Washington, D.C.: U.S. Department of Education.
Northouse, P. G. (2004). Leadership: Theory and Practice (3rd Ed.).Thousand Oaks:
Sage Publications. Phelps, P. H. (2008). Helping teachers become leaders. Clearing House: A Journal of
Educational Strategies, Issues and Ideas, 81(3), 119-122. Sabatini, E. M. (2002). Teacher’s perspectives of emergent teacher leadership in an
elementary school. (Unpublished doctoral dissertation). University of Georgia, Georgia. Silva, D. Y., Gimbert, R., & Nolan, J. (2000). Sliding the doors: Locking and unlocking
possibilities for teacher leadership. Teachers College Record, 102(4), 779-804. Spillane, J. P. (2005). Distributed leadership. The Educational Forum. 69(2), 143-150. Stattrek (2011). Statistics, probability, and survey sampling. Retrieved on November 3, 2011
from http://www.stattrek.com/statistics/random-number-generator.aspx Vail, A. (1991). Predictors of leadership behaviors of vocational and non-vocational
teachers. (Unpublished doctoral dissertation). The Ohio State University, Ohio. Vail, A., & Pedras, M. J. (1994). Predictors of teacher leadership for trade
and industry teachers. Paper presented at the American Vocational Association Convention, Dallas, TX.
Vail, A., & Redick, S. (1993). Predictors of teacher leadership performance
of vocational and nonvocational teachers. Journal of Vocational Education Research, 18(1), 51-76.
Wrushen, B. R., & Sherman, W. H. (2008). Women secondary school principals: multicultural
voices from the field. International Journal of Qualitative Studies in Education, 21(5), 457-469.
©2012 - Journal of Career and Technical Education, Vol. 27, No. 2, Winter, 2012 – Page 37
York-Barr, J., & Duke, D. (2004). What do we know about teacher leadership? Finding s from two decades of scholarship. Review of Educational Research, 74(3), 255-316.