Embed Size (px)
Citation preview
IATA Economics www.iata.org/economics 1
CARGO E-CHARTBOOK Q2 2013 OVERVIEW Operating conditions for airline cargo businesses deteriorated over recent months, but the outlook looks a bit
more positive. Over recent months airlines saw air freight volumes stall, load factors weaken and yields
continue the steady decline seen over the past two years. These developments have largely resulted from the
pause in business confidence improvement and continued slowing in world trade growth. Having said that
though, current levels of business confidence continue to indicate a modest pick-up in economic growth this
year, and consumer confidence in Europe and the US has made some progress, both of which should
provide support to air freight demand in the months ahead. Finally, although current conditions are tough,
cargo heads surveyed in April are optimistic, saying they expect both volumes and yields to improve this year.
Economic Situation – global economic growth in 2013 is expected to improve slightly on 2012, but
significant regional variation is resulting in a three-speed economic recovery. Looser monetary policy is
helping emerging economies expand at a much faster pace than advanced economies, and looser bank
lending standards in the US have supported faster growth there than in Europe (page 2)
Traffic Growth – the growth trend in air freight volumes has flattened over recent months in line with the stall
in business confidence, after showing signs of a pick-up at the end of 2012 (page 2)
Demand Environment – has weakened over recent months. World trade growth continues to slow,
hampered by weakness in advanced economies, and the earlier rise in business confidence has now stalled.
On the positive side, however, there is also no sign of an inventory overhang (page 3)
Demand Drivers – have shown some improvement compared to Q1, but remain weak overall. European and
US consumer confidence has improved further over recent months, but this has not been enough to sustain
the pick-up in air freight volumes in late 2012, as indicated by the recent slip in semi-conductor shipments
(page 3)
Capacity – load factors weakened over recent months as the growth trend in air freight markets lost
momentum. Fleet expansion has added to downward pressure on aircraft utilization rates, and that is likely to
continue as delivery of new aircraft with belly hold capacity is set to expand the existing widebody fleet by 6%
this year. Air freight rates remain weak (page 4)
Competition – sea freight rates have plunged over recent months reflecting weakening demand. Container
shipping volumes have declined in several regions, and have even contracted in Latin America and North
Europe (page 4)
Revenue and Yields – air freight yields started to show some improvement toward the end of 2012,
supported by stronger demand and load factors, but have since returned to the mostly flat trend seen over
the past 2 years (page 5)
Costs – jet fuel prices have eased over the past several months, with prices in May about 15% lower than
the most recent peak in February. This has reduced some of the downward pressure on cargo profitability,
as has the decline in nominal wage rates (page 5)
Profitability outlook – remains optimistic, with an increase in volumes expected over the next 12 months
according to heads of cargo surveyed in April. Air freight yields are also expected to improve (page 5)
IATA Economics: www.iata.org/economics 2
Cargo eChartbook – Q2 2013
Economic Outlook & Traffic Growth
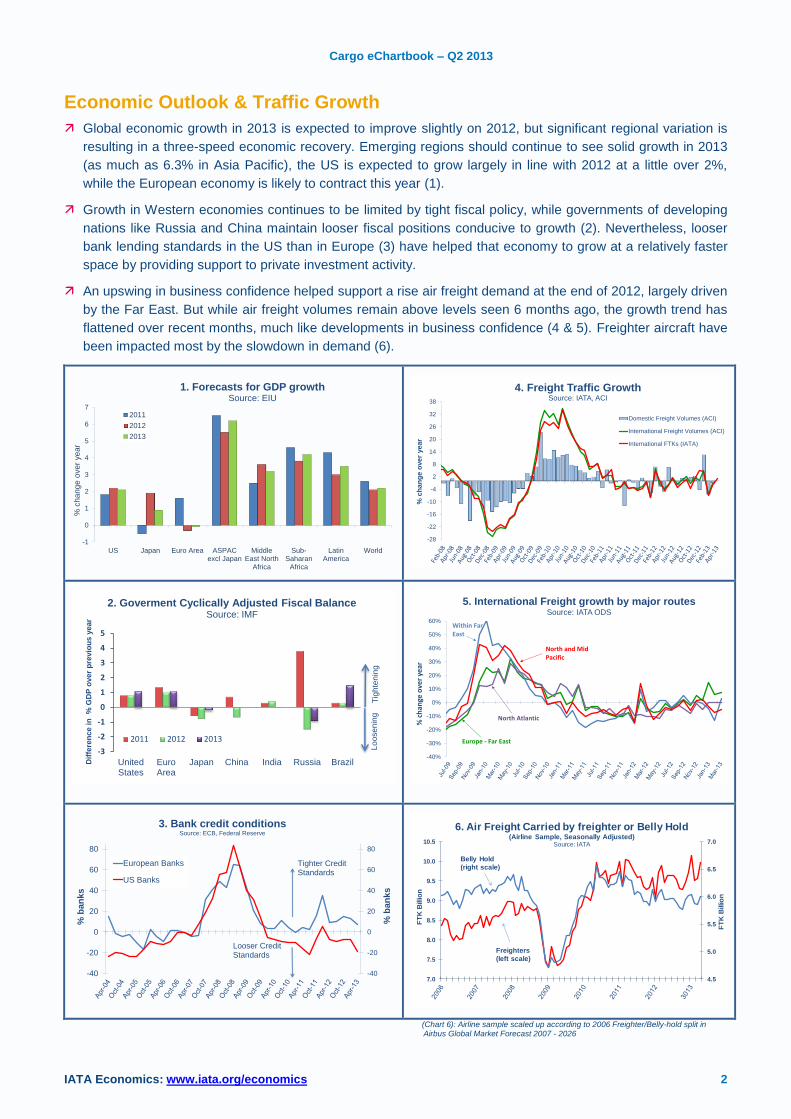
Global economic growth in 2013 is expected to improve slightly on 2012, but significant regional variation is
resulting in a three-speed economic recovery. Emerging regions should continue to see solid growth in 2013
(as much as 6.3% in Asia Pacific), the US is expected to grow largely in line with 2012 at a little over 2%,
while the European economy is likely to contract this year (1).
Growth in Western economies continues to be limited by tight fiscal policy, while governments of developing
nations like Russia and China maintain looser fiscal positions conducive to growth (2). Nevertheless, looser
bank lending standards in the US than in Europe (3) have helped that economy to grow at a relatively faster
space by providing support to private investment activity.
An upswing in business confidence helped support a rise air freight demand at the end of 2012, largely driven
by the Far East. But while air freight volumes remain above levels seen 6 months ago, the growth trend has
flattened over recent months, much like developments in business confidence (4 & 5). Freighter aircraft have
been impacted most by the slowdown in demand (6).
-1
0
1
2
3
4
5
6
7
US Japan Euro Area ASPACexcl Japan
MiddleEast North
Africa
Sub-Saharan
Africa
LatinAmerica
World
% c
hange o
ver
year
1. Forecasts for GDP growth Source: EIU
2011
2012
2013
-28
-22
-16
-10
-4
2
8
14
20
26
32
38
% c
ha
ng
e o
ve
r ye
ar
4. Freight Traffic GrowthSource: IATA, ACI
Domestic Freight Volumes (ACI)
International Freight Volumes (ACI)
International FTKs (IATA)
-3
-2
-1
0
1
2
3
4
5
UnitedStates
EuroArea
Japan China India Russia BrazilDif
fere
nce i
n %
GD
P o
ver
pre
vio
us y
ear
2011 2012 2013
2. Goverment Cyclically Adjusted Fiscal BalanceSource: IMF
Tig
hte
nin
gL
oo
se
nin
g
-40%
-30%
-20%
-10%
0%
10%
20%
30%
40%
50%
60%
% c
han
ge o
ver
year
5. International Freight growth by major routesSource: IATA ODS
Within Far East
Europe - Far East
North Atlantic
North and Mid Pacific
-40
-20
0
20
40
60
80
-40
-20
0
20
40
60
80
% b
an
ks
% b
an
ks
3. Bank credit conditionsSource: ECB, Federal Reserve
European Banks
US Banks
Tighter Credit Standards
Looser Credit Standards
4.5
5.0
5.5
6.0
6.5
7.0
7.0
7.5
8.0
8.5
9.0
9.5
10.0
10.5
FT
K B
illio
n
FT
K B
illio
n
6. Air Freight Carried by freighter or Belly Hold(Airline Sample, Seasonally Adjusted)
Source: IATA
Freighters
(left scale)
Belly Hold
(right scale)
(Chart 6): Airline sample scaled up according to 2006 Freighter/Belly-hold split in Airbus Global Market Forecast 2007 - 2026
IATA Economics: www.iata.org/economics 3
Cargo eChartbook – Q2 2013
Demand Environment & Drivers
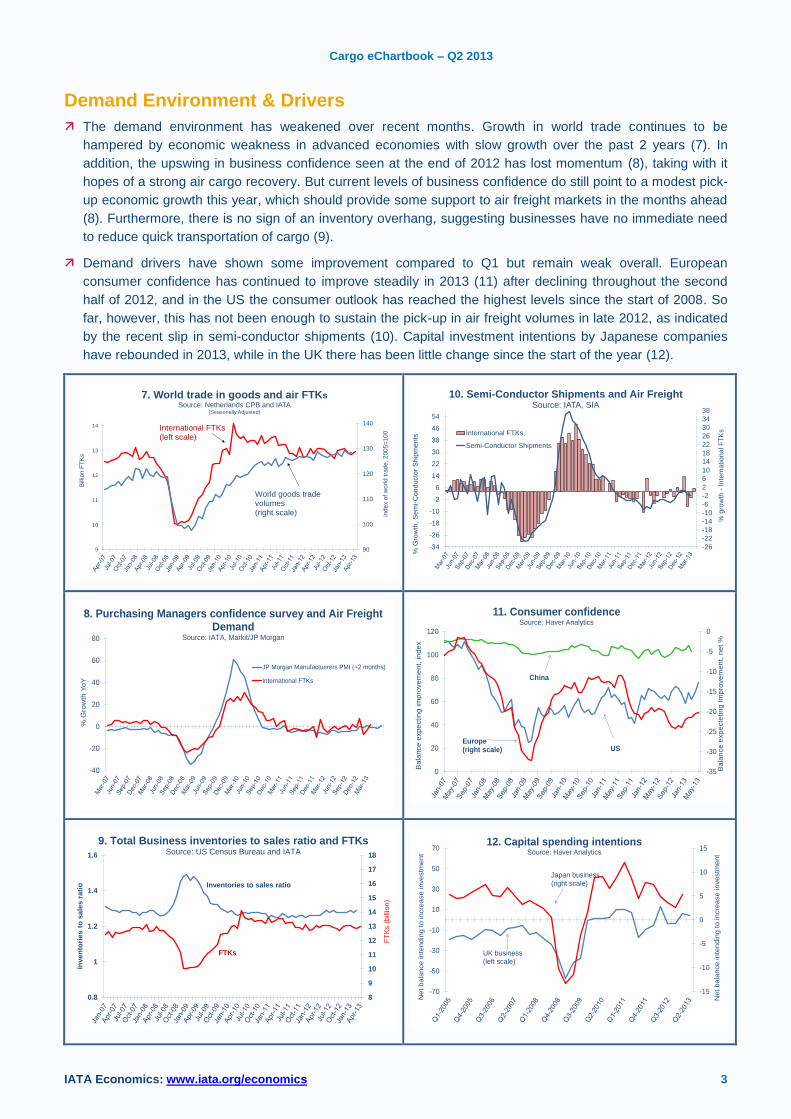
The demand environment has weakened over recent months. Growth in world trade continues to be
hampered by economic weakness in advanced economies with slow growth over the past 2 years (7). In
addition, the upswing in business confidence seen at the end of 2012 has lost momentum (8), taking with it
hopes of a strong air cargo recovery. But current levels of business confidence do still point to a modest pick-
up economic growth this year, which should provide some support to air freight markets in the months ahead
(8). Furthermore, there is no sign of an inventory overhang, suggesting businesses have no immediate need
to reduce quick transportation of cargo (9).
Demand drivers have shown some improvement compared to Q1 but remain weak overall. European
consumer confidence has continued to improve steadily in 2013 (11) after declining throughout the second
half of 2012, and in the US the consumer outlook has reached the highest levels since the start of 2008. So
far, however, this has not been enough to sustain the pick-up in air freight volumes in late 2012, as indicated
by the recent slip in semi-conductor shipments (10). Capital investment intentions by Japanese companies
have rebounded in 2013, while in the UK there has been little change since the start of the year (12).
90
100
110
120
130
140
9
10
11
12
13
14
index o
f w
orld t
rade, 2005=
100
Bill
ion F
TK
s
7. World trade in goods and air FTKsSource: Netherlands CPB and IATA
(Seasonally Adjusted)
International FTKs(left scale)
World goods trade volumes(right scale)
-26
-22
-18
-14
-10
-6
-2
2
6
10
14
18
22
26
30
34
38
-34
-26
-18
-10
-2
6
14
22
30
38
46
54
% g
row
th -
Inte
rna
tio
na
l F
TK
s
% G
row
th,
Se
mi-
Co
nd
ucto
r S
hip
me
nts
10. Semi-Conductor Shipments and Air FreightSource: IATA, SIA
International FTKs
Semi-Conductor Shipments
-40
-20
0
20
40
60
80
% G
row
th Y
oY
JP Morgan Manufactuerers PMI (+2 months)
International FTKs
8. Purchasing Managers confidence survey and Air Freight Demand
Source: IATA, Markit/JP Morgan
-35
-30
-25
-20
-15
-10
-5
0
0
20
40
60
80
100
120
Bala
nce e
xpecte
ting im
pro
vem
ent,
net %
Bala
nce e
xpecting im
pro
vem
ent,
index
11. Consumer confidenceSource: Haver Analytics
China
Europe(right scale) US
8
9
10
11
12
13
14
15
16
17
18
0.8
1
1.2
1.4
1.6
FT
Ks (
bill
ion
)
Inve
nto
rie
s t
o s
ale
s r
ati
o Inventories to sales ratio
FTKs
9. Total Business inventories to sales ratio and FTKsSource: US Census Bureau and IATA
-15
-10
-5
0
5
10
15
-70
-50
-30
-10
10
30
50
70
Net
bala
nce inte
ndin
g to incre
ase investm
ent
Net
bala
nce inte
ndin
g to incre
ase investm
ent
12. Capital spending intentionsSource: Haver Analytics
UK business(left scale)
Japan business(right scale)
IATA Economics: www.iata.org/economics 4
Cargo eChartbook – Q2 2013
Capacity & Competition
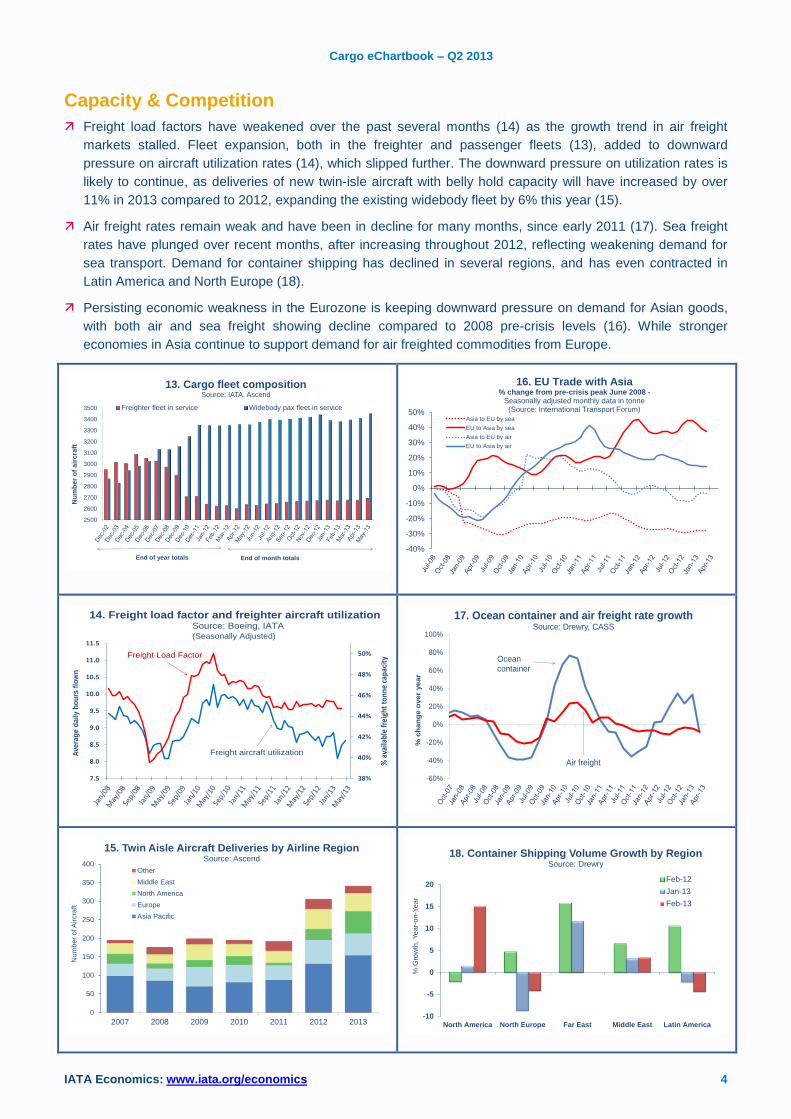
Freight load factors have weakened over the past several months (14) as the growth trend in air freight
markets stalled. Fleet expansion, both in the freighter and passenger fleets (13), added to downward
pressure on aircraft utilization rates (14), which slipped further. The downward pressure on utilization rates is
likely to continue, as deliveries of new twin-isle aircraft with belly hold capacity will have increased by over
11% in 2013 compared to 2012, expanding the existing widebody fleet by 6% this year (15).
Air freight rates remain weak and have been in decline for many months, since early 2011 (17). Sea freight
rates have plunged over recent months, after increasing throughout 2012, reflecting weakening demand for
sea transport. Demand for container shipping has declined in several regions, and has even contracted in
Latin America and North Europe (18).
Persisting economic weakness in the Eurozone is keeping downward pressure on demand for Asian goods,
with both air and sea freight showing decline compared to 2008 pre-crisis levels (16). While stronger
economies in Asia continue to support demand for air freighted commodities from Europe.
2500
2600
2700
2800
2900
3000
3100
3200
3300
3400
3500
Nu
mb
er
of
air
cra
ft
13. Cargo fleet compositionSource: IATA, Ascend
Freighter fleet in service Widebody pax fleet in service
End of month totalsEnd of year totals
-40%
-30%
-20%
-10%
0%
10%
20%
30%
40%
50%Asia to EU by sea
EU to Asia by sea
Asia to EU by air
EU to Asia by air
16. EU Trade with Asia% change from pre-crisis peak June 2008 -
Seasonally adjusted monthly data in tonne(Source: International Transport Forum)
38%
40%
42%
44%
46%
48%
50%
7.5
8.0
8.5
9.0
9.5
10.0
10.5
11.0
11.5
% a
vaila
ble
frei
ght
tonn
e ca
paci
ty
Avera
ge d
aily h
ou
rs f
low
n
Freight Load Factor
Freight aircraft utilization
14. Freight load factor and freighter aircraft utilizationSource: Boeing, IATA (Seasonally Adjusted)
-60%
-40%
-20%
0%
20%
40%
60%
80%
100%
% c
ha
ng
e o
ver
yea
r
17. Ocean container and air freight rate growthSource: Drewry, CASS
Ocean container
Air freight
0
50
100
150
200
250
300
350
400
2007 2008 2009 2010 2011 2012 2013
Num
ber
of A
ircra
ft
15. Twin Aisle Aircraft Deliveries by Airline RegionSource: Ascend
Other
Middle East
North America
Europe
Asia Pacific
-10
-5
0
5
10
15
20
North America North Europe Far East Middle East Latin America
% G
row
th, Y
ear-
on-Y
ear
18. Container Shipping Volume Growth by RegionSource: Drewry
Feb-12
Jan-13
Feb-13
IATA Economics: www.iata.org/economics 5
Cargo eChartbook – Q2 2013
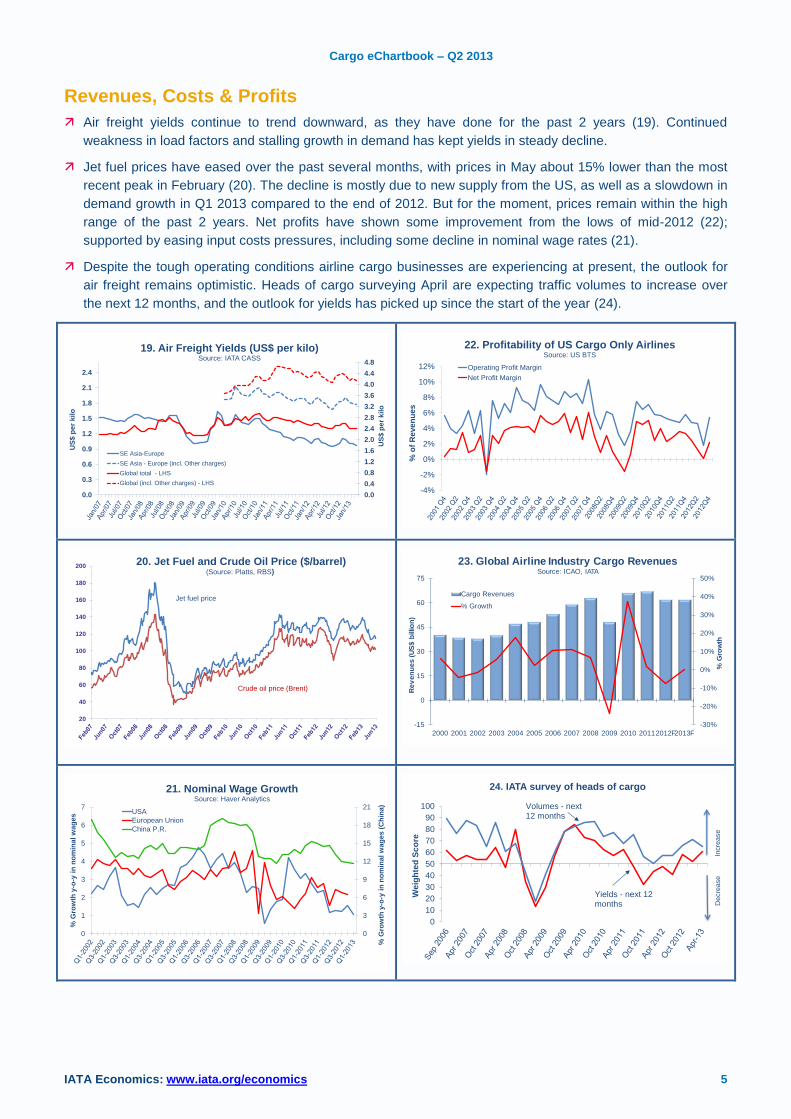
Revenues, Costs & Profits
Air freight yields continue to trend downward, as they have done for the past 2 years (19). Continued
weakness in load factors and stalling growth in demand has kept yields in steady decline.
Jet fuel prices have eased over the past several months, with prices in May about 15% lower than the most
recent peak in February (20). The decline is mostly due to new supply from the US, as well as a slowdown in
demand growth in Q1 2013 compared to the end of 2012. But for the moment, prices remain within the high
range of the past 2 years. Net profits have shown some improvement from the lows of mid-2012 (22);
supported by easing input costs pressures, including some decline in nominal wage rates (21).
Despite the tough operating conditions airline cargo businesses are experiencing at present, the outlook for
air freight remains optimistic. Heads of cargo surveying April are expecting traffic volumes to increase over
the next 12 months, and the outlook for yields has picked up since the start of the year (24).
0.0
0.3
0.6
0.9
1.2
1.5
1.8
2.1
2.4
0.0
0.4
0.8
1.2
1.6
2.0
2.4
2.8
3.2
3.6
4.0
4.4
4.8
US
$ p
er
kil
o
US
$ p
er
kil
o
19. Air Freight Yields (US$ per kilo)Source: IATA CASS
SE Asia-Europe
SE Asia - Europe (incl. Other charges)
Global total - LHS
Global (incl. Other charges) - LHS
-4%
-2%
0%
2%
4%
6%
8%
10%
12%
% o
f R
eve
nu
es
22. Profitability of US Cargo Only AirlinesSource: US BTS
Operating Profit Margin
Net Profit Margin
20
40
60
80
100
120
140
160
180
20020. Jet Fuel and Crude Oil Price ($/barrel)
(Source: Platts, RBS)
Jet fuel price
Crude oil price (Brent)
-30%
-20%
-10%
0%
10%
20%
30%
40%
50%
-15
0
15
30
45
60
75
2000 2001 2002 2003 2004 2005 2006 2007 2008 2009 2010 20112012F2013F
% G
row
th
Re
ve
nu
es
(U
S$
billio
n)
23. Global Airline Industry Cargo RevenuesSource: ICAO, IATA
Cargo Revenues
% Growth
0
3
6
9
12
15
18
21
0
1
2
3
4
5
6
7
% G
row
th y
-o-y
in
no
min
al
wag
es (
Ch
ina)
% G
row
th y
-o-y
in
no
min
al
wag
es
21. Nominal Wage GrowthSource: Haver Analytics
USA
European Union
China P.R.
0
10
20
30
40
50
60
70
80
90
100
We
igh
ted
Sc
ore
24. IATA survey of heads of cargo
Volumes - next 12 months
Yields - next 12 months
Incre
ase
Decre
ase
IATA Economics: www.iata.org/economics 6
Cargo eChartbook – Q2 2013
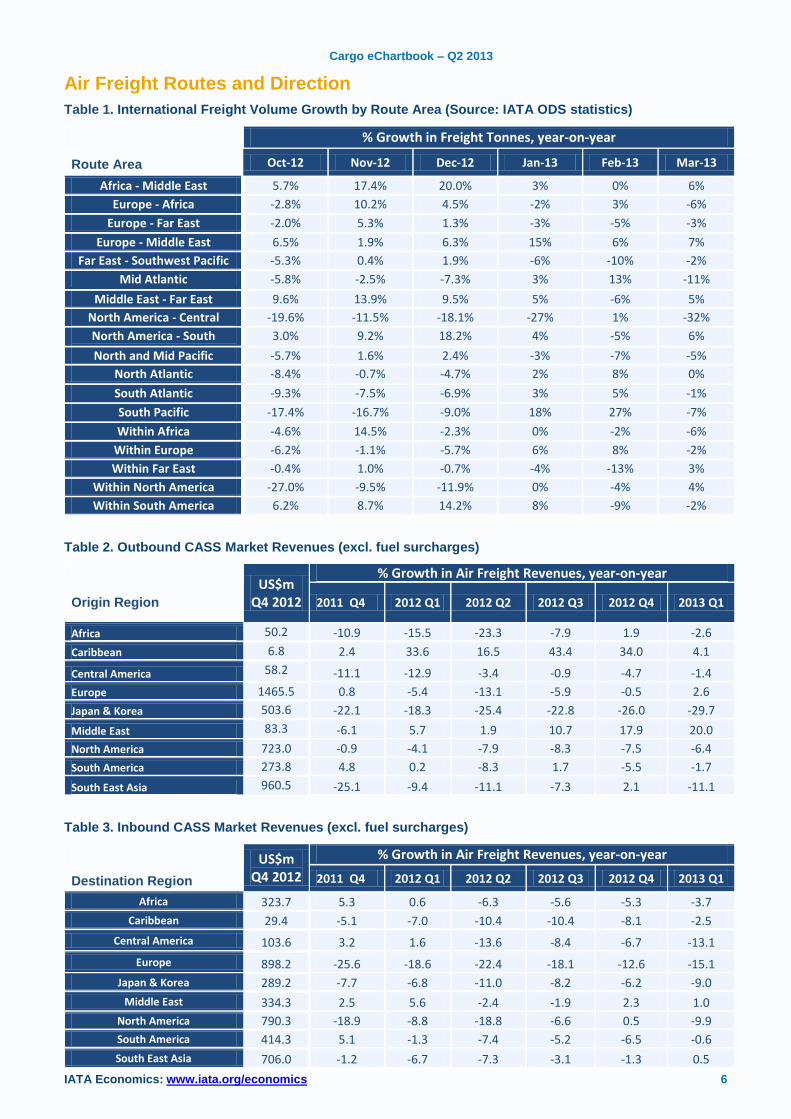
Air Freight Routes and Direction
Table 1. International Freight Volume Growth by Route Area (Source: IATA ODS statistics)
% Growth in Freight Tonnes, year-on-year
Route Area Oct-12 Nov-12 Dec-12 Jan-13 Feb-13 Mar-13
Africa - Middle East 5.7% 17.4% 20.0% 3% 0% 6%
Europe - Africa -2.8% 10.2% 4.5% -2% 3% -6%
Europe - Far East -2.0% 5.3% 1.3% -3% -5% -3%
Europe - Middle East 6.5% 1.9% 6.3% 15% 6% 7%
Far East - Southwest Pacific -5.3% 0.4% 1.9% -6% -10% -2%
Mid Atlantic -5.8% -2.5% -7.3% 3% 13% -11%
Middle East - Far East 9.6% 13.9% 9.5% 5% -6% 5%
North America - Central America
-19.6% -11.5% -18.1% -27% 1% -32%
North America - South America
3.0% 9.2% 18.2% 4% -5% 6%
North and Mid Pacific -5.7% 1.6% 2.4% -3% -7% -5%
North Atlantic -8.4% -0.7% -4.7% 2% 8% 0%
South Atlantic -9.3% -7.5% -6.9% 3% 5% -1%
South Pacific -17.4% -16.7% -9.0% 18% 27% -7%
Within Africa -4.6% 14.5% -2.3% 0% -2% -6%
Within Europe -6.2% -1.1% -5.7% 6% 8% -2%
Within Far East -0.4% 1.0% -0.7% -4% -13% 3%
Within North America -27.0% -9.5% -11.9% 0% -4% 4%
Within South America 6.2% 8.7% 14.2% 8% -9% -2%
Table 2. Outbound CASS Market Revenues (excl. fuel surcharges)
US$m Q4 2012
% Growth in Air Freight Revenues, year-on-year
Origin Region 2011 Q4 2012 Q1 2012 Q2 2012 Q3 2012 Q4 2013 Q1
Africa 50.2 -10.9 -15.5 -23.3 -7.9 1.9 -2.6
Caribbean 6.8 2.4 33.6 16.5 43.4 34.0 4.1
Central America 58.2 -11.1 -12.9 -3.4 -0.9 -4.7 -1.4
Europe 1465.5 0.8 -5.4 -13.1 -5.9 -0.5 2.6
Japan & Korea 503.6 -22.1 -18.3 -25.4 -22.8 -26.0 -29.7
Middle East 83.3 -6.1 5.7 1.9 10.7 17.9 20.0
North America 723.0 -0.9 -4.1 -7.9 -8.3 -7.5 -6.4
South America 273.8 4.8 0.2 -8.3 1.7 -5.5 -1.7
South East Asia 960.5 -25.1 -9.4 -11.1 -7.3 2.1 -11.1
Table 3. Inbound CASS Market Revenues (excl. fuel surcharges)
US$m Q4 2012
% Growth in Air Freight Revenues, year-on-year
Destination Region 2011 Q4 2012 Q1 2012 Q2 2012 Q3 2012 Q4 2013 Q1
Africa 323.7 5.3 0.6 -6.3 -5.6 -5.3 -3.7
Caribbean 29.4 -5.1 -7.0 -10.4 -10.4 -8.1 -2.5
Central America 103.6 3.2 1.6 -13.6 -8.4 -6.7 -13.1
Europe 898.2 -25.6 -18.6 -22.4 -18.1 -12.6 -15.1
Japan & Korea 289.2 -7.7 -6.8 -11.0 -8.2 -6.2 -9.0
Middle East 334.3 2.5 5.6 -2.4 -1.9 2.3 1.0
North America 790.3 -18.9 -8.8 -18.8 -6.6 0.5 -9.9
South America 414.3 5.1 -1.3 -7.4 -5.2 -6.5 -0.6
South East Asia 706.0 -1.2 -6.7 -7.3 -3.1 -1.3 0.5
IATA Economics: www.iata.org/economics 7
Cargo eChartbook – Q2 2013
Glossary
ACI: Airports Council International
AFTK: Available Freight Tonne Kilometers
European CB: European Central Bank
EIU: Economist Intelligence Unit
CASS: Cargo Accounts Settlement System
FT: Financial Times
FTK: Freight Tonne Kilometers
PMI: Purchasing Managers Index
Netherlands CPB: Netherlands Bureau for Economic Policy Analysis
ODS: Origin-Destination Statistics
SIA: Semiconductors Industry Association
US BTS: US Bureau of Transportation Statistics
M-o-m Month over month percentage change
Y-o-y Year over year percentage change
IATA Economics
10th
June 2013