Embed Size (px)
Citation preview

Caribbean Development Bank
Primary Credit Analyst:
Kelli A Bissett-Tom, New York (1) 212-438-7573; [email protected]
Secondary Contact:
John B Chambers, CFA, New York (1) 212-438-7344; [email protected]
Table Of Contents
Rationale
Outlook
Stand-Alone Credit Profile: 'aa-'
Business Profile: Strong
Policy Importance Assessment
Governance And Management Expertise
Financial Profile: Very Strong
Capital Adequacy
Risk Position
Funding and Liquidity
Likelihood of Extraordinary Shareholder Support
Appendix
Related Criteria And Research
WWW.STANDARDANDPOORS.COM/RATINGSDIRECT JUNE 4, 2014 1
1357290 | 301977158

Caribbean Development Bank
Rationale
The ratings on CDB are based on its "strong" business profile and its "very
strong" financial profile, as Standard & Poor's Ratings Services defines these
terms. Together they form CDB's 'aa-' stand-alone credit profile (SACP). Our
Counterparty Credit Rating
Foreign Currency
AA/Stable/A-1+
credit ratings pertain only to the Caribbean Development Bank's Ordinary Capital Resources (OCR), the bank's
primary operations. We incorporate one notch of uplift to CDB's SACP based on our expectation of extraordinary
shareholder support to arrive at our 'AA' long-term issuer credit rating (ICR). This expectation derives from $328
million eligible callable capital, which CDB's higher-rated shareholders provide the bank.
Established in 1969, CDB provides loans and guarantees to governments and companies in the Caribbean. CDB had
$1.5 billion adjusted total assets as of Dec. 31, 2013.
CDB's strong business profile reflects first its role as a prominent lender in the Caribbean and its ability to lend to
sovereigns through the credit cycle. Second, CDB's members demonstrated their support for the bank's mandate by
granting a 38% increase of paid-in capital in 2010, although some members have been late in paying their
subscriptions. The bank's membership is also expanding. Suriname joined CDB during 2013. Third, the bank's
borrowing members have treated CDB's OCR as a preferred creditor in most, but not all, periods of stressed external
liquidity. Significant support from nonregional members, including funding of CDB's Special Funds Resources (SFR;
not rated), which provides grants and concessional loans to lower-income countries, has helped sustain the credit
quality of the OCR. The bank has also strengthened its risk management structures and monitoring over the past 18
months.
Offsetting these factors, CDB has significant embedded credit risk in its portfolio and the majority of voting rights rests
with borrowing-eligible member countries. In addition, the accounting treatment of some of CDB's derivative positions
affects its ability to generate capital internally. Although the bank expects its hedges to be economically effective, the
accounting requirement of marking its derivatives to market while recording its financing at historical cost adds
volatility to CDB's comprehensive earnings.
We assess CDB's financial profile as very strong. Historically, CDB has maintained a high level of capitalization to
offset the correlation risk of borrowing members. This correlation pertains not only to the bank's region of operations,
but also the common characteristics of many of its borrowing members. These include economic structure, monetary
arrangements, fiscal challenges, and reliance on foreign savings. The bank has significant concentration in its top three
sovereign exposures. In addition, CDB carries embedded credit risk in its sovereign loan portfolio, reflected in the
speculative-grade ratings on three of its top five sovereign exposures (Jamaica, Barbados, and Belize) and in the fiscal,
economic, and external positions of two members we don't rate (Saint Vincent and the Grenadines and Saint Lucia)
(see "Sovereign Ratings And Country T&C Assessments," June 3, 2014.).
CDB's risk-adjusted capital (RAC) ratio improved to 23% as of Dec. 31, 2013, from 21% the previous December
WWW.STANDARDANDPOORS.COM/RATINGSDIRECT JUNE 4, 2014 2
1357290 | 301977158

because of less embedded credit risk in the portfolio (as implied by sovereign ratings, with improvements particularly
in Jamaica and Belize), lower loan growth (as many borrowing members undergo fiscal consolidation), and receipts of
paid-in capital.
We expect these factors and CDB's long-dated funding profile will reduce CDB's financing needs over 2014-2015. We
expect CDB will not refinance a $150 million bond maturing in July 2014. Through the first quarter of 2014, CDB
retained sufficient balance sheet liquidity to fund its scheduled obligations for up to one year without capital market
access under an extreme stress scenario, but similar to many other supranational financial institutions, it would have to
defer a portion of its loan disbursements. CDB's funding sources and investor base are less diversified than those of
many peers, which has contributed to the historical unevenness of its debt amortization schedule.
Outlook
The stable outlook reflects our expectation CDB will maintain a high level of capital to offset its sovereign borrower
concentrations and correlation risk. It also reflects our expectation that CDB's sovereign borrowers will treat the bank
as a preferred creditor via continued debt service and in any upcoming sovereign debt restructurings, including that of
Grenada (rated 'SD' [selective default]), which we expect to exit from default to its commercial creditors this year. This
expectation reflects reduced external liquidity vulnerabilities among some of CDB's lowest-rated borrowers and the
fiscal consolidation that many of its sovereign borrowers have begun over the past year, both of which strengthen
borrowers' capacity to service their U.S. dollar-denominated debt to CDB. In our calculations, a potential moderate
credit deterioration of some of CDB's borrowing members would have limited effect on the bank's capital adequacy.
The stable outlook implies that we see less than a one-in-three probability that we will raise or lower the ratings over
the next two years. Over time, we could raise the ratings if CDB's embedded credit risk declined or its nonborrowing
membership markedly increased.
On the other hand, we could lower the ratings if--contrary to our expectations--any of CDB's members were not to
treat the bank's OCR as a preferred creditor, or if either the bank's capital adequacy or liquidity notably deteriorates.
Stand-Alone Credit Profile: 'aa-'
We assess CDB's SACP at 'aa-', reflecting the bank's strong business profile and its very strong financial profile.
Our analysis draws comparisons with several peers (see table 1). We selected this sample of multilateral development
banks for their common mandate--to provide long-term project and other financing, often with concessional terms to
their borrowing member countries; their substantial activity in emerging and frontier markets; the prominence of their
public-sector lending activities; and the regional or subregional scope of most, with the inclusion of IBRD as a global
benchmark. We publish our comparative statistics in this report with a one-year lag to respect the confidentiality of
those institutions whose respective boards have not approved their fiscal year-end 2013 financial statements as of the
date of this report.
WWW.STANDARDANDPOORS.COM/RATINGSDIRECT JUNE 4, 2014 3
1357290 | 301977158
Caribbean Development Bank

Table 1
Selected Comparative Statistics For CDB And Peers
(Fiscal year-end 2012)
Total
adjusted
assets (US$
mil.)
RAC ratio after
adjustments*
(%)
Purpose-related
assets (gross) /
adjusted total assets
(%)
Gross debt /
adjusted
common
equity (x)
Liquid assets
/ adjusted
total assets
(%)
Static
funding
gap at 1
year (x)
Caribbean
Development Bank
(CDB) 1,683 21 59 1.4 29 1.4
International Bank
for Reconstruction
and Development
(IBRD) 324,367 29 40 4.0 12 0.9
African Development
Bank
(AFDB) 32,603 15 54 2.5 35 1.3
Central American
Bank for Economic
Integration
(CABEI) 7,506 10 74 2.2 24 1.3
Eurasian
Development Bank
(EDB) 3,884 17 49 1.2 49 20.3
Black Sea Trade and
Development Bank
(BSTDB) 1,298 39 75 0.6 27 4.0
RAC--Risk adjusted capital ratio. ACE--Adjusted common equity. *Ratings parameters as of Dec. 31, 2013. N/A--Not available.
Business Profile: Strong
CDB has a strong business profile, in our opinion, reflecting the bank's policy importance in addition to its governance
and management expertise.
Policy Importance Assessment
Since its establishment in 1969, CDB has served a prominent role as the cornerstone lender to Caribbean governments
(95% of loans, as of Dec. 31, 2013) and to several private financial institutions and companies (5% of loans) in the
region. CDB provides long-term project financing often accompanied by grace periods and below-market rates of
interest. In addition, CDB provides guarantees, including partial guarantees on rescheduled commercial bonds of St.
Kitts & Nevis as well as Dominica that were effective in increasing commercial creditors' participation. The bank also
provides grants and low-interest loans to its poorest member countries via the SFR.
Table 2
Principal Business Activities
--As of Dec. 31--
2013 2012 2011 2010 2009
Purpose-related assets (gross)/adjusted total assets (%) 66 59 64 76 62
Net loans/adjusted total assets (%) 65 58 64 76 62
Public-sector (including sovereign-guaranteed) loans/total loans (%) 95 95 95 95 95
Private-sector loans/total loans (%) 5 5 5 5 5
Equity investments/adjusted total assets (%) 0 0 0 0 0
WWW.STANDARDANDPOORS.COM/RATINGSDIRECT JUNE 4, 2014 4
1357290 | 301977158
Caribbean Development Bank

Table 2
Principal Business Activities (cont.)
Memo (US$ mil.)
Total guarantees 12 12 12 8 8
Total adjusted assets* 1,493 1,694 1,592 1,308 1,329
N/A--Not available. N.M.--Not meaningful. *Adjustments made to reported shareholders' equity to calculate adjusted common equity (an
institution's cash capital) are carried through to total assets.
A second important characteristic for multilateral development banks is their ability to lend countercyclically in
periods of economic downturn. CDB increased its net loans outstanding by 6% and 21% during 2009 and 2010,
respectively. Sovereign customer demand has slackened over 2012-2014. Many borrowing members are consolidating
their fiscal positions, lowering their official funding needs.
CDB's members demonstrated in 2010 their support for the bank's public policy mandate by granting a 38% increase
of paid-in capital, payable 2011-2016. Some members have been delinquent paying their subscriptions. These totaled
$7.4 million, as of Dec. 31, 2013. Mexico and Italy have experienced parliamentary delays; whereas, budgetary
difficulties of some small Eastern Caribbean members have delayed their subscriptions. Overall, CDB received $37.6
million in installments of the general capital increase (GCI) during 2013.
Shareholders remain highly supportive of the bank. The bank's membership expanded to 27 members, with the
addition of Suriname during 2013. Shareholders enable the bank to retain 100% of earnings in most years, building
capital internally. France was the only member to withdraw from the bank more than a decade ago (in 2000).
The bank's borrowing members have treated CDB's OCR as a preferred creditor in most, but not all, periods of
stressed external liquidity and recent debt reschedulings. The latest exception occurred in 2012 when Grenada
defaulted to CDB's OCR while paying debt service on a global bond, then subsequently cured its arrears with penalty
interest to CDB. Significant support from nonregional members, including funding of CDB's SFR, which provides
grants and concessional loans to lower-income countries, has helped sustain the credit quality of CDB's OCR. On more
than one occasion, CDB has restructured all or part of an OCR using SFR resources. CDB's governors have approved
cases following hurricanes (Dominica and Grenada), volcano eruptions (Montserrat), a member's commercial debt
restructuring (St. Kitts & Nevis). We view this as a weaker form of preferred creditor treatment, but it has been a
valuable tool to the bank for preserving the credit quality of its main balance sheet (and a means to provide their
members fiscal flexibility).
Governance And Management Expertise
CDB bank has strengthened its risk management structures and monitoring over the past two years, supporting our
view of its governance and management expertise. During 2013, CDB established the Office of Risk Management to
monitor and manage the mitigation of all risks that CDB faces including strategic, financial, operational, and
reputational risks.
The bank carries large single-name sovereign loan exposures, particularly to its top three borrowers, on its balance
sheet. CDB sets portfolio exposure limits, but these are more expansive than development banks' with more diversified
WWW.STANDARDANDPOORS.COM/RATINGSDIRECT JUNE 4, 2014 5
1357290 | 301977158
Caribbean Development Bank

exposure. CDB's large sovereign loan portfolio also has significant geographic (Caribbean) and economic
(tourism-intensive and U.S.- and European-market driven) risk embed in it. CDB's exposure limits are less stringent
than other multilateral lending institutions (MLIs). The exposure limit to its single largest borrower (Jamaica) is the
greater of 40% of loans or 50% of the bank's internally calculated available capital. The exposure limit to its three
largest borrowers (Jamaica, Barbados, and St. Vincent and the Grenadines) is the greater of 60% of loans or 90% of
available capital. To offset this credit risk, CDB's shareholders have enabled management to maintain a high level of
capitalization over the years. In turn, this high level of capitalization continues to anchor the bank's creditworthiness
and is a governance strength.
CDB's culture of consensus-based voting on major issues has in practice mitigated the agency risk posed by
borrowing-eligible members' majority control (58%) of voting shares.
Table 3
Shareholder Concentrations
(%)
Share of votes controlled by
eligible borrower member
countries
Share of votes controlled by
nonborrowing eligible member
countries
Share of votes controlled by
private-sector shareholders (if any)
Votes of
shareholders
58 42 0
As of Dec. 31, 2013.
CDB does not pay dividends. In practice, shareholders have also minimized transfers from retained earnings to the
bank's soft loan window and grant facility, the SFR. Shareholders have largely funded the SFR separately over periodic
replenishment cycles. This stands in contrast with some other banks, such as Inter-American Development Bank
(IADB) and International Bank for Reconstruction and Development (IBRD), that regularly transfer a large portion of
earnings to their concessional financing facilities (Special Fund for Operations [SFO] and International Development
Association [IDA], respectively). CDB's high earnings retention rate has enabled it to build capital internally.
In 2013, CDB adopted a new capital adequacy framework that risk weights its loan exposures. The bank must sustain
available capital (as CDB defines it) of at minimum 150% of baseline economic capital. CDB's available capital was
192% of its economic capital and therefore was compliant with its internal policy, as of Dec. 31, 2013. We expect this
new framework will better enable the bank to monitor possible changes in its RAC ratio.
CDB has traditionally used leverage conservatively, with 1.2x average debt-to-adjusted common equity (ACE) over the
past decade. CDB's policy limits borrowing and guarantees of the OCR to 100% of the callable capital of its
investment-grade nonborrowing members plus the paid-in capital and retained earnings net of receivables from
members. The bank's ratio of total outstanding borrowings and undrawn commitments to the borrowing limit was
65.2%, as of the end of 2013.
CDB's liquidity policy contributes to the maintenance of cash and high-grade securities investments to provide it
sufficient balance sheet liquidity. The bank's policy is to maintain a net three years' funding requirement or 40% of
undisbursed commitments, whichever is greater. CDB was compliant with its internal liquidity policy throughout 2013.
Ernst & Young (Barbados), independent external auditors for the bank, issued a clean opinion of CDB's annual
WWW.STANDARDANDPOORS.COM/RATINGSDIRECT JUNE 4, 2014 6
1357290 | 301977158
Caribbean Development Bank
financial statements prepared in accordance with International Financial Reporting Standards (IFRS) for the periods
ending Dec. 31, 2013 and 2012. The CBD restated its financial position for both years because of the application of IAS
19 (see Earnings below).
Financial Profile: Very Strong
CDB's financial profile is very strong, in our view, reflecting the strengths of its very strong capital adequacy and
sufficient balance sheet liquidity, as well as the limited diversity of its funding and investor base.
Capital Adequacy
CDB's RAC adequacy improved over 2013, reflecting the shareholder payment of GCI installments, lower borrower
demand, and upgrades on Jamaica and Belize because of lower risk to their external liquidity.
The quality of CDB's cash capital, what we call its ACE, is strong. It is composed primarily of paid-in capital and
retained earnings. However, the large swings in shareholders' equity that result from the unhedged portion of the
bank's yen borrowings (and that are passed through other comprehensive income to shareholders' equity) raises the
volatility of the bank's earnings and lowers the quality of its internal capital generation (see table 12).
During 2013, CDB adopted IAS 19, which removed the corridor approach that enabled employers to delay recognition
of actuarial variances of the funding status of their defined-benefit employee benefit plans. This revaluation caused an
unrecognized net actuarial loss of $7.7 million as of Jan. 1, 2012. The bank recorded $5.2 million unrecognized net
actuarial loss in other comprehensive income for 2012. Improved performance of the plans' equity investments
contributed an $8.9 million net actuarial gain during 2013, which lowered CDB's net actuarial liability to $9.6 million as
of Dec. 31, 2013, from $16.8 million as restated for Dec. 31, 2012.
Similar to other MLIs founded in the same era, CDB enabled members to post their capital contributions in cash or
promissory notes ("non-negotiable demand notes," in the bank's parlance). Likewise, members were able to pay their
cash capital subscriptions in U.S. dollars or their national currency (most often an inactively traded Caribbean or
"restricted" currency). Over the years and through the depreciation of several members' currencies, the major
development banks determined that their financial stability was best sustained by converting their capital to U.S.
dollars (or another hard currency) and the discounting of promissory notes from capital. We deduct these legacy
instruments (and the maintenance of value payment receivable resulting from the remaining capital denominated in
restricted currencies) from CDB's shareholders' equity to calculate ACE (see table 11). Neither does CDB count these
instruments for purposes of its core capital metrics.
Earnings
Akin to other MLIs, CDB's public policy mandate imparts a lower rate of profitability than a commercial bank would
sustain. In return for providing the bank nearly 100% earnings retention, borrowing members receive concessional
loans, often at below-market interest rates.
CDB's earnings have declined steadily since 2009. The bank's $17 million net income from operations (from which we
WWW.STANDARDANDPOORS.COM/RATINGSDIRECT JUNE 4, 2014 7
1357290 | 301977158
Caribbean Development Bank

exclude unrealized gains and losses on securities and derivatives) declined to 1.1% average adjusted assets in 2013
versus 5.9% in 2009. CDB's net interest income relative to average net loans fell to 2.2% in 2013 (from 5.1% in 2009)
while the bank's interest expense has risen to 2.7% of average borrowings in 2013 (from 1.8% in 2009). The latter
reflects the hedging of the bank's borrowings. In August 2013, CDB entered an interest rate swap to hedge half its $300
million 4.375% bond due 2027. CDB's efficiency ratio, administrative expense per average ACE, remained low and
stronger than many peers' at 1.5% in 2013.
The bank's loan income is highly sensitive to the performance of its top three borrowers. Almost 50% of the bank's
loan related-income was derived from these borrowers in 2013, and 24% was from Jamaica.
Despite lower internal capital generation, shareholders' payment of GCI installments has supported 7.5% average
annual growth of ACE over the past three years (2011-2013).
Table 4
Profitability
(%) 2013 2012 2011 2010 2009
Net income/average adjusted assets 1.1 1.3 1.6 2.2 2.4
Net income/average adjusted common equity 2.6 3.5 3.9 5.3 5.9
Comprehensive income/average adjusted assets 0.7 0.6 2.8 3.1 1.6
Comprehensive income/average adjusted common equity 1.8 1.6 6.9 7.6 4.1
Net interest income/average net loans 2.2 3.0 3.6 4.2 5.1
Interest expense/average borrowings 2.7 1.5 1.0 1.2 1.8
Administrative expense/average adjusted common equity 1.5 1.7 1.7 1.9 1.8
Memo:
Net income (US$ mil.) 17 22 23 29 30
Net increase (decrease) in cash and cash equivalents during the year (US$ mil.) (29) 17 70 (89) 2
Treasury risk
CDB takes on more treasury-related risk than its (sub)regional peers. The bank uses two different accounting methods
to report its derivatives relative to the yen-denominated borrowings they cover. This contributes significant volatility
to the bank's comprehensive income, although the bank expects its hedges are economically effective over time.
Credit risk. CDB assumes counterparty risk via its cash and securities investments as well as its derivative
counterparties. The bank manages this risk prudently, in our view. At the close of the first quarter of 2014, the bank
had invested the bulk of its liquidity investments--19% of adjusted total assets--in unencumbered securities rated 'AA-'
or above by Standard & Poor's (or the equivalent by another agency).
The remaining liquidity investments were cash and deposits--totaling 6% of adjusted total assets--in investment-grade
banks. Bank accounts that CDB does not require for operational purposes in the Caribbean are held with well-reputed
global banks.
The counterparties for CDB's derivative transactions are global banks. CDB was in a net positive position relative to its
commercial bank counterparts, as of March 31, 2014.
WWW.STANDARDANDPOORS.COM/RATINGSDIRECT JUNE 4, 2014 8
1357290 | 301977158
Caribbean Development Bank
Interest rate risk. CDB manages its interest rate risk fundamentally by using moderate leverage historically. Its use of
shareholders' equity funding (totaling about half of adjusted total assets over the past five years) acts as a natural hedge
against market interest rate changes.
The bank also manages its interest rate risk by providing floating-rate loans, to which it attempts to match the
structure its borrowings. Interest and principal is payable quarterly, and CDB may reset the interest rate semiannually.
The bank issues floating-rate debt (32% of debt as of the end of 2013) when possible, or it swaps fixed-rate issues
effectively to floating-rate obligations when this is cost effective.
CDB manages its risk of asset-liability maturity mismatch by maintaining sufficient balance sheet liquidity. By our
simple static funding gap analysis, CDB has a surplus of assets over liabilities at the one-, two-, and five-year horizons,
as of March 31, 2014. In practice, it also matches the long-dated loans with borrowings of similar maturity. The bank's
average loan maturity was 6.9 years versus 9.4 years for its borrowings. It does not use short-term financing, such as
issuing certificates of deposit or commercial paper.
Exchange rate risk. CDB denominates all its loan assets and debt service receivable in U.S. dollars and reports its
financial position in the same. Its most recent GCI installments are also payable in dollars. Seventy-six percent of
CDB's debt is denominated in its currency of operation. The remainder--$160 million equivalent of yen-denominated
bonds (27% of borrowings, as of Dec. 31, 2013)--CDB partially hedges by swapping a portion of the underlying
exposure into floating-rate U.S. dollars cash flows using currency-currency interest rate swaps. Interest on the notes is
payable in U.S. dollars, while the final principal is payable in yen.
Although the bank expects its hedges to be economically effective, CDB's use of two different accounting treatments
adds significant volatility to CDB's comprehensive earnings. The bank marks its derivatives (cross-currency interest
rate swaps) to market while recording its related yen-denominated bonds at historical cost.
Risk Position
The bank's RAC ratio rose to 23% after adjustments as of Dec. 31, 2013, from 21% as of Dec. 31, 2012 (both reflecting
rating parameters as of May 5, 2014). This change reflects lower customer demand due to continuing fiscal budgetary
constraints and the high debt burdens of many (potential) borrower governments, lower near-term external liquidity
risks for several borrowers that contributed to upgrades of Belize and Jamaica during 2013, and receipts of paid-in
capital. At 23%, CDB's post-adjustment RAC ratio is borderline between extremely strong and very strong.
We expect the limited fiscal flexibility of many Caribbean sovereigns will continue to slacken customer demand for
sovereign loans during 2014. Tourism receipts are picking up on improving U.S. and European economic growth
prospects, which will likely stimulate investment in economies where governments have greater fiscal space. We
expect that CDB's relative exposures will not alter much in 2014. Because most loans carry long-dated maturities, the
composition of CDB's loan book evolves slowly.
WWW.STANDARDANDPOORS.COM/RATINGSDIRECT JUNE 4, 2014 9
1357290 | 301977158
Caribbean Development Bank

Table 5
CDB's Risk-Adjusted Capital Adequacy As Of Dec. 31, 2013
--Ratings as of May 8, 2014--
Exposure (US$ mil.) Standard & Poor's RWA (US$ mil.)
Average Standard & Poor's RW
(%)
Credit risk
Government and central banks 1,309 1,490 114
Institutions 226 85 38
Corporate 0 0 --
Securitization 0 0 --
Other assets 24 26 108
Total credit risk 1,560 1,600 103
Market risk
Equity in the banking book 0 0 --
Trading book market risk -- 0 --
Total market risk -- 0 --
Operational risk
Total operational risk -- 102 --
RWA before MLI adjustments 1,702 100
MLI adjustments
Industry and geographic diversification (104) (6)
Preferred creditor treatment (332) (22)
Single-name concentration 1,732 116
High-risk exposure cap 0 0
Total MLI adjustments 1,296 76
RWA after MLI adjustments 2,999 176
Adjusted Common Equity (US$
mil.) Standard & Poor's RAC ratio (%)
Capital ratio before adjustments 703 41
Capital ratio after adjustments 23
RAC ratio--Risk-adjusted capital ratio, defined as adjusted common equity (ACE) divided by risk-weighted assets (RWA). RW--Risk weighting.
MLI--Multilateral lending institution. Ratings parameters as of May 8, 2014.
In comparison with peers, CDB is well-capitalized for its risk position. As of the end of fiscal year-end 2012, CDB
maintained higher relative capital adequacy than Central American Bank for Economic Integration (CABEI), African
Development Bank (AFDB), and Eurasian Development Bank (EDB)--which are also (sub)regional multilateral
development banks with sizable public-sector portfolios of similar loan products. IBRD, a large global bank, and Black
Sea Trade and Development Bank (BSTDB), a newer and growing subregional bank, had higher levels of capitalization
as of their respective 2012 fiscal year-ends. Similar to CDB, AFDB and IBRD have soft loan windows that have helped
them channel concessional financing to their lowest-income member countries while safeguarding the credit quality of
the respective banks' primary balance sheets.
WWW.STANDARDANDPOORS.COM/RATINGSDIRECT JUNE 4, 2014 10
1357290 | 301977158
Caribbean Development Bank
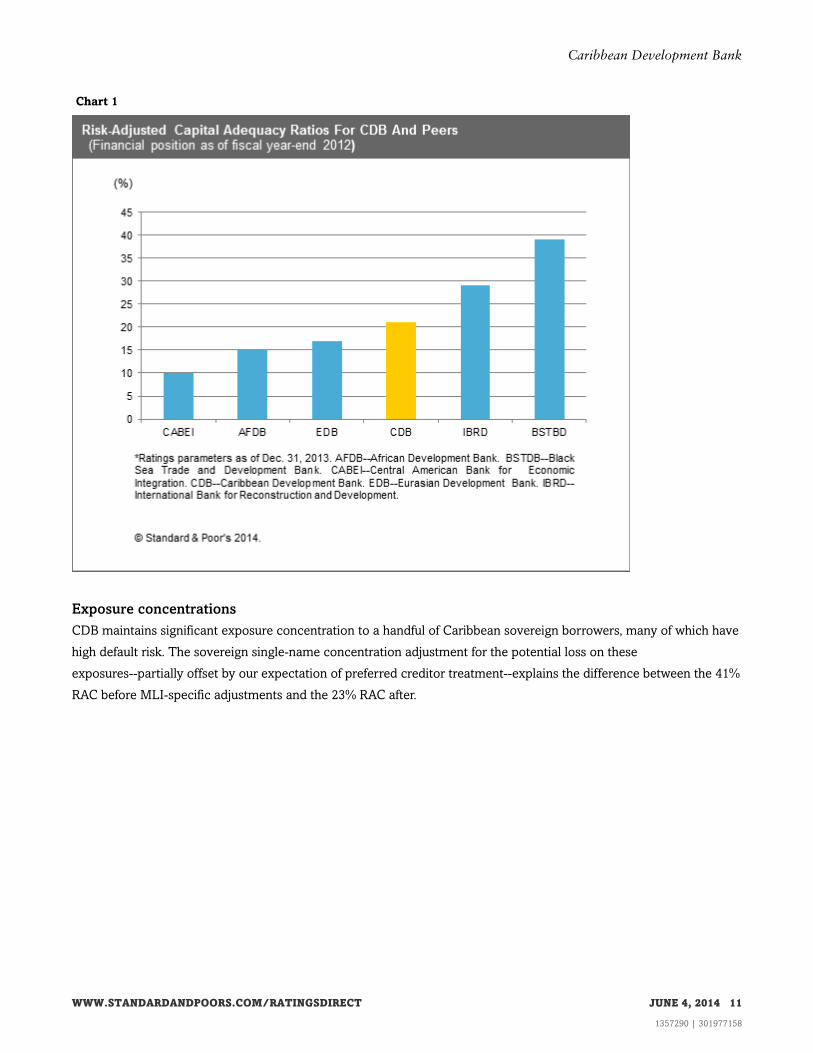
Chart 1
Exposure concentrations
CDB maintains significant exposure concentration to a handful of Caribbean sovereign borrowers, many of which have
high default risk. The sovereign single-name concentration adjustment for the potential loss on these
exposures--partially offset by our expectation of preferred creditor treatment--explains the difference between the 41%
RAC before MLI-specific adjustments and the 23% RAC after.
WWW.STANDARDANDPOORS.COM/RATINGSDIRECT JUNE 4, 2014 11
1357290 | 301977158
Caribbean Development Bank

Chart 2
The bank's top three loan exposures represented 49% of loans and 67% of ACE (before risk-weighting) at the end of
2013. The largest, Jamaica, represented 25% of loans, followed by Barbados (14%), and St. Vincent and the
Grenadines (11%). The capital charge for the potential loss on CDB's largest exposures is calibrated to an 8% minimum
capital ratio. The large sovereign concentration adjustment reflects both the lower relative creditworthiness of some of
CDB's borrowers and the top five sovereigns' large share of CDB's exposure at default (EAD, which includes assets,
half of committed undisbursed loans and equity investments, plus the full amount of guarantees and letters of credit).
Table 6
Country Data And Projections For CDB's Top 10 Borrowing Members
--Real GDP growth (%
change)--GDP per
capita (US$)
Net general government
debt (% GDP)
General government interest
expense/revenues (%)
2014f 2015f 2013 2013 2013
Anguilla* N/A N/A N/A N/A N/A
Antigua and Barbuda* 2 2 13,838 92 N/A
Barbados 1 2 15,373 70 14
Belize 3 3 4,602 73 9
Grenada 1 2 7,697 95 12
Guyana* 4 4 3,729 55 N/A
WWW.STANDARDANDPOORS.COM/RATINGSDIRECT JUNE 4, 2014 12
1357290 | 301977158
Caribbean Development Bank
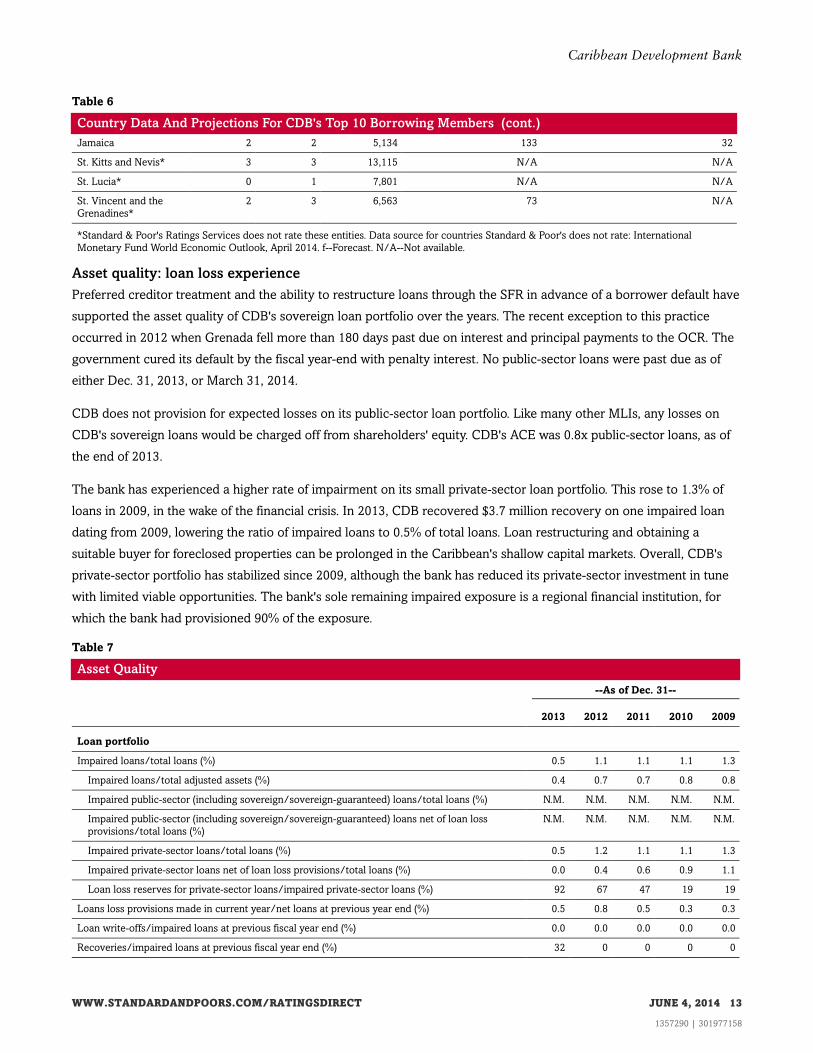
Table 6
Country Data And Projections For CDB's Top 10 Borrowing Members (cont.)
Jamaica 2 2 5,134 133 32
St. Kitts and Nevis* 3 3 13,115 N/A N/A
St. Lucia* 0 1 7,801 N/A N/A
St. Vincent and the
Grenadines*
2 3 6,563 73 N/A
*Standard & Poor's Ratings Services does not rate these entities. Data source for countries Standard & Poor's does not rate: International
Monetary Fund World Economic Outlook, April 2014. f--Forecast. N/A--Not available.
Asset quality: loan loss experience
Preferred creditor treatment and the ability to restructure loans through the SFR in advance of a borrower default have
supported the asset quality of CDB's sovereign loan portfolio over the years. The recent exception to this practice
occurred in 2012 when Grenada fell more than 180 days past due on interest and principal payments to the OCR. The
government cured its default by the fiscal year-end with penalty interest. No public-sector loans were past due as of
either Dec. 31, 2013, or March 31, 2014.
CDB does not provision for expected losses on its public-sector loan portfolio. Like many other MLIs, any losses on
CDB's sovereign loans would be charged off from shareholders' equity. CDB's ACE was 0.8x public-sector loans, as of
the end of 2013.
The bank has experienced a higher rate of impairment on its small private-sector loan portfolio. This rose to 1.3% of
loans in 2009, in the wake of the financial crisis. In 2013, CDB recovered $3.7 million recovery on one impaired loan
dating from 2009, lowering the ratio of impaired loans to 0.5% of total loans. Loan restructuring and obtaining a
suitable buyer for foreclosed properties can be prolonged in the Caribbean's shallow capital markets. Overall, CDB's
private-sector portfolio has stabilized since 2009, although the bank has reduced its private-sector investment in tune
with limited viable opportunities. The bank's sole remaining impaired exposure is a regional financial institution, for
which the bank had provisioned 90% of the exposure.
Table 7
Asset Quality
--As of Dec. 31--
2013 2012 2011 2010 2009
Loan portfolio
Impaired loans/total loans (%) 0.5 1.1 1.1 1.1 1.3
Impaired loans/total adjusted assets (%) 0.4 0.7 0.7 0.8 0.8
Impaired public-sector (including sovereign/sovereign-guaranteed) loans/total loans (%) N.M. N.M. N.M. N.M. N.M.
Impaired public-sector (including sovereign/sovereign-guaranteed) loans net of loan loss
provisions/total loans (%)
N.M. N.M. N.M. N.M. N.M.
Impaired private-sector loans/total loans (%) 0.5 1.2 1.1 1.1 1.3
Impaired private-sector loans net of loan loss provisions/total loans (%) 0.0 0.4 0.6 0.9 1.1
Loan loss reserves for private-sector loans/impaired private-sector loans (%) 92 67 47 19 19
Loans loss provisions made in current year/net loans at previous year end (%) 0.5 0.8 0.5 0.3 0.3
Loan write-offs/impaired loans at previous fiscal year end (%) 0.0 0.0 0.0 0.0 0.0
Recoveries/impaired loans at previous fiscal year end (%) 32 0 0 0 0
WWW.STANDARDANDPOORS.COM/RATINGSDIRECT JUNE 4, 2014 13
1357290 | 301977158
Caribbean Development Bank

Table 7
Asset Quality (cont.)
ACE/impaired loans (x) 135 57 57 53 48
Guarantees
Guarantees called by third parties during the current year/guarantees outstanding at the end of the
previous fiscal year (%)
0.0 0.0 49.4 0.0 0.0
ACE--Adjusted common equity. N.M.--Not meaningful.
Guarantees
CDB has one outstanding guarantee, a $12 million partial guarantee for rescheduled bonds issued by the government
of St. Kitts and Nevis in 2011. As of March 31, 2013, the guarantee had not been called.
Funding and Liquidity
Funding
CDB has a less developed funding profile and less diversified global investor base than several peers, such as CABEI,
AFDB, and (a benchmark issuer) IBRD. This, coupled with the institution's small size relative to larger regional and
global banks, has contributed to the historical unevenness of its debt amortization profile. To reduce its rollover risk, in
2012 CDB incorporated a feature--which amortizes the principal over the last five years to maturity--into its last $300
million, 15-year bond issue. More than 90% of CDB's borrowings are bonds, which are long-dated. After this year,
CDB's next bullet maturity is 2021. The remainder of the bank's borrowings is loans sourced from EIB and IADB.
In line with its conservative funding strategy, CDB does not use short-term financing vehicles. It does not issue
certificates of deposit or commercial paper.
We expect that CDB would be able to fund its operations and meet its debt service obligations for up to one year
without capital market access. It would have to defer a portion of its loan disbursements, not uncommon among the
MLIs. CDB's static funding gap at one year (without consideration of loan disbursements) rose to 1.7x by March 31,
2014, from 1.3x as of Dec. 31, 2013. The bank incremented its cash reserves early in 2014, planning to pay a $150
million bond maturing in July in cash to reduce its cost of carry.
CDB has been reducing its leverage. The bank's gross debt-to-ACE declined to 1.0x in 2013 from 1.4x in 2012, and we
expect it to recede further this year. The bank continues to receive GCI capital installments and is limiting the
cost-of-carry on its liquid assets (cash, due from banks, and securities totaling 23% of adjusted total assets at the end of
2013) on the back of slowing demand from their government borrowers (many of whom are undergoing fiscal
consolidation).
Table 8
Funding Ratios
--As of Dec. 31--
2013 2012 2011 2010 2009
Static funding gap§ without loan disbursements at 1 year (x) 1.3 1.4 1.0 N/A N/A
Static funding gap§ with half of scheduled loan disbursements at 1 year (x) 0.7 1.0 0.7 N/A N/A
Short-term debt (by remaining maturity)/adjusted total assets (%) 10 12 15 1 9
WWW.STANDARDANDPOORS.COM/RATINGSDIRECT JUNE 4, 2014 14
1357290 | 301977158
Caribbean Development Bank

Table 8
Funding Ratios (cont.)
Gross debt/adjusted total assets (%) 45 54 54 50 54
Gross debt net of liquid assets/adjusted total assets (%) 22 25 34 41 28
Short-term liabilities (by remaining maturity)/total liabilities (%) 21 22 27 2 16
Total liabilities/adjusted total assets (%) 47 56 55 51 54
Gross debt/adjusted common equity (x) 1.0 1.4 1.4 1.2 1.4
Short-term debt (by remaining maturity)/gross debt (%) 22 23 27 2 17
Short-term debt by remaining maturity includes short-term debt (maturing in less than 12 months) and long-term debt maturing in the next 12
months. §The static funding gap is maturing assets divided by maturing liabilities. It is cumulative and based on scheduled receipts and
payments. N/A--Not available.
Chart 3
Liquidity
CDB retains appropriate balance sheet liquidity of sufficient quality to fund its operations, debt service, and at least half
of committed loan disbursements for up to one year without capital market access under a severe stress scenario. The
bank met this threshold at year-end 2013, and its greater cash reserve raised its liquidity ratios at the end of the first
quarter. This assumes that CDB will disburse $90 million loans this year and that the bank receives debt service from
borrowers on time and in full.
WWW.STANDARDANDPOORS.COM/RATINGSDIRECT JUNE 4, 2014 15
1357290 | 301977158
Caribbean Development Bank
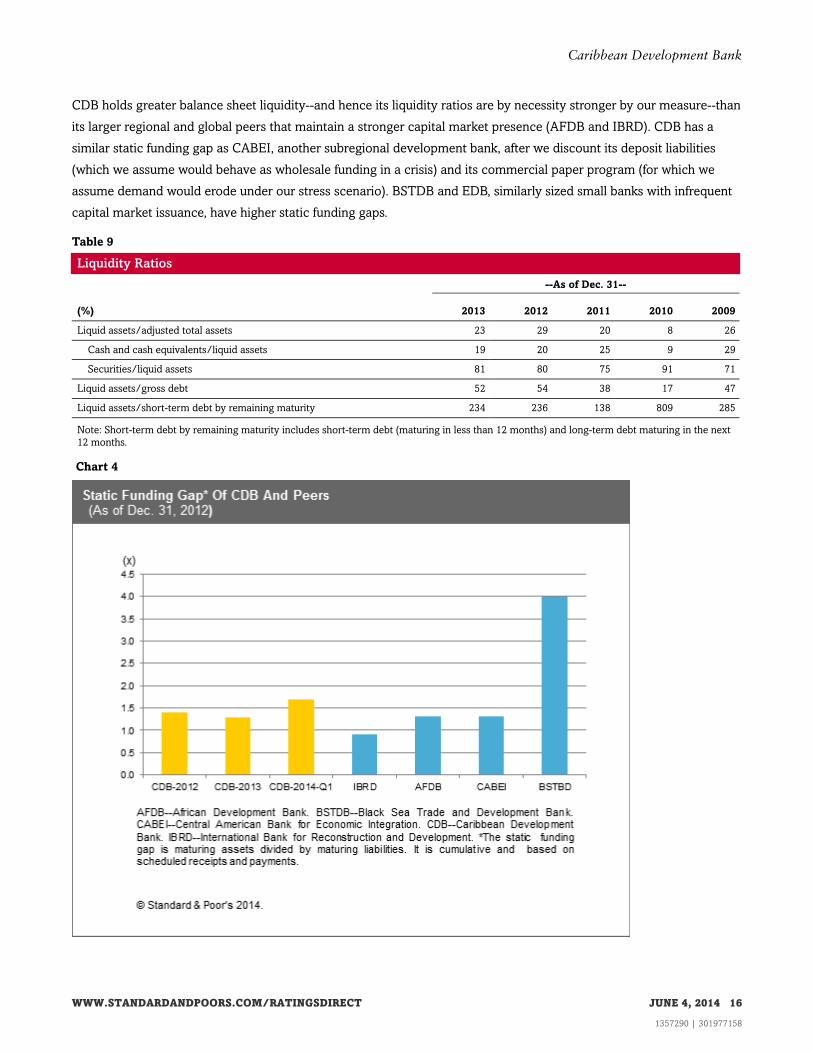
CDB holds greater balance sheet liquidity--and hence its liquidity ratios are by necessity stronger by our measure--than
its larger regional and global peers that maintain a stronger capital market presence (AFDB and IBRD). CDB has a
similar static funding gap as CABEI, another subregional development bank, after we discount its deposit liabilities
(which we assume would behave as wholesale funding in a crisis) and its commercial paper program (for which we
assume demand would erode under our stress scenario). BSTDB and EDB, similarly sized small banks with infrequent
capital market issuance, have higher static funding gaps.
Table 9
Liquidity Ratios
--As of Dec. 31--
(%) 2013 2012 2011 2010 2009
Liquid assets/adjusted total assets 23 29 20 8 26
Cash and cash equivalents/liquid assets 19 20 25 9 29
Securities/liquid assets 81 80 75 91 71
Liquid assets/gross debt 52 54 38 17 47
Liquid assets/short-term debt by remaining maturity 234 236 138 809 285
Note: Short-term debt by remaining maturity includes short-term debt (maturing in less than 12 months) and long-term debt maturing in the next
12 months.
Chart 4
WWW.STANDARDANDPOORS.COM/RATINGSDIRECT JUNE 4, 2014 16
1357290 | 301977158
Caribbean Development Bank

Likelihood of Extraordinary Shareholder Support
The 'AA' long-term foreign-currency ICR on CDB incorporates one notch of uplift to CDB's 'aa-' SACP based on our
expectation of extraordinary shareholder support. CDB's higher-rated shareholders (Canada, Germany, and the U.K.)
provide the bank $328 million eligible callable capital. In the event of a capital call, we expect these shareholders
would provide the bank this extraordinary support. The amount of this callable capital is sufficient to raise CDB's RAC
with callable capital firmly into the highest, "extremely strong" capital adequacy bracket.
Appendix
Table 10
Summary Balance Sheet
--As of Dec. 31--
(US$ mil.) 2013 2012 2011 2010 2009
Assets
Cash and money market instruments 68 96 79 9 99
Securities 283 394 242 101 240
Liquid assets 351 491 322 111 339
Net loans 968 981 1,013 994 818
Equity investments 0 0 0 0 0
Purpose-related assets (gross) 979 994 1,019 998 820
Purpose-related assets (net) 975 987 1,014 996 818
Derivative assets 54 95 120 97 56
Accrued receivables 11 2 10 11 18
Total assets 1,452 1,641 1,535 1,269 1,285
Total adjustments to shareholders' equity (41) (54) (56) (39) (44)
Total adjusted assets* 1,493 1,694 1,592 1,308 1,329
Liabilities
Total deposits 52 81 59 7 81
Other borrowings (gross debt) 674 917 857 652 717
Other liabilities 35 29 12 12 6
Memo: Derivative liabilities 7 ** ** ** **
Total liabilities 709 947 869 664 722
Shareholders' equity
Paid-in capital and surplus 256 219 186 157 157
Retained earnings 487 488 488 447 406
Shareholders' equity 744 694 666 605 563
Memo:
Dividends (not yet distributed) 0 0 0 0 0
Eligible callable capital 328 328 328 210 137
Total guarantees 12 12 12 8 8
WWW.STANDARDANDPOORS.COM/RATINGSDIRECT JUNE 4, 2014 17
1357290 | 301977158
Caribbean Development Bank

Table 10
Summary Balance Sheet (cont.)
Undisbursed loans 290 285 132 150 199
*Adjustments made to reported shareholders' equity to calculate adjusted common equity (an institution's cash capital) are carried through to
total assets. **Previously the bank consolidated its derivative liablities (cross currency interest rate swaps) in the presentation of its debt
liabilities.
Table 11
Adjusted Common Equity
--As of Dec. 31--
(US$ mil.) 2013 2012 2011 2010 2009
Shareholders' equity (reported) 744 694 666 605 563
Plus (+):
Capital subscription payments received in advance 13 4 5 6 N/A
Less (-):
Capital payments committed (subscribed) but not yet due N/A N/A N/A N/A N/A
Capital payments due but not yet received 7 11 16 N/A N/A
Promissory notes receivable* 44 44 44 44 43
Maintenance of value receivables on currency holdings§ 3 3 1 1 1
Capital subscriptions in restricted currencies N/A N/A N/A N/A N/A
Unrecognized employee pension or other postretirement benefit liability N/A N/A N/A N/A N/A
Total adjustments to shareholders' equity (41) (54) (56) (39) (44)
Adjusted common equity 702.6 640.5 610.2 565.3 519.1
*Promissory notes are notes from shareholders, which a multilateral financial institution may have accepted from shareholders in lieu of cash
capital and which are carried on the balance sheet as shareholders' equity. Promissory notes exclude callable capital, which most institutions do
not count as balance sheet capital. §Currency fluctuations between an institution's operating currency and capital valued in restricted currency
generate maintenance of value (MOV) assets and liabilities for some multilateral financial institutions. Standard & Poor's deducts MOV assets
from shareholders' equity. N/A--Not available.
Table 12
Summary Statement of Income
(US$ mil.) 2013 2012 2011 2010 2009
Interest income 43 43 43 46 52
Interest expense 21 13 8 8 12
Net interest income 22 30 36 38 40
Operating noninterest income 8 6 0 1 0
Other noninterest income 2 1 0 0 0
Operating revenues 51 49 43 47 52
Noninterest expenses 11 11 10 10 9
Credit loss provisions (net new) 1 3 3 - 1
Operating income after loss provisions 17 22 23 29 30
Net income 17 22 23 29 30
Other comprehensive income (6) (11) 18 13 (9)
Comprehensive income 12 10 41 41 21
Memo:
Net increase (decrease) in cash and cash equivalents during the year (29) 17 70 (89) 2
WWW.STANDARDANDPOORS.COM/RATINGSDIRECT JUNE 4, 2014 18
1357290 | 301977158
Caribbean Development Bank

Table 13
Membership, Capital And Voting Shares
--As of Dec. 31, 2013--
Subscribed capital (mil. US$) % voting shares
Total shareholders
Total shareholders 1,566 100
Borrowing eligible members 914 58
Non-borrowing-eligible members 652 42
Borrowing-Eligible Members
Jamaica 292 18
Trinidad & Tobago 292 18
Bahamas 86 5
Guyana 63 4
Barbados 55 4
Suriname 25 2
Belize 13 1
Dominica 13 1
Grenada 11 1
St. Lucia 13 1
St. Vincent and the Grenadines 13 1
Antigua and Barbuda 13 1
St. Kitts and Nevis 5 0
Haiti 5 0
Anguilla*¶ 3 *
Montserrat* 3 *
British Virgin Islands* 3 *
Cayman Islands* 3 *
Turks and Caicos Islands* 3 *
Subtotal 914 58
Non-Borrowing-Eligible Members
Venezuela 47 3
Colombia 47 3
Mexico 19 1
Canada 157 10
U.K. 157 10
Italy 38 2
Germany 94 6
People's Republic of China 94 6
Subtotal 652 42
*These territories collectively share one governor and have 1.01% of shares and 1.04% of votes. ¶Anguilla was formerly part of St.
Kitts-Nevis-Anguilla but became an independent entity in 1980; it now shares a governor with the four other territories. Source: Caribbean
Development Bank Financial Statements 2013 of the Ordinary Capital Reserves.
WWW.STANDARDANDPOORS.COM/RATINGSDIRECT JUNE 4, 2014 19
1357290 | 301977158
Caribbean Development Bank

Related Criteria And Research
Related Criteria
• Multilateral Lending Institutions And Other Supranational Institutions Ratings Methodology, Nov. 26, 2012
• Methodology: Short-Term/Long-Term Ratings Linkage Criteria For Corporate And Sovereign Issuers, May 15, 2012
• Bank Capital Methodology And Assumptions, Dec. 6, 2010
• Principles Of Credit Ratings, Feb. 16, 2011
Related Research
• Supranationals: Special Edition 2013: Comparative Data For Multilateral Lending Institutions, March 11, 2014
• Research Update: Grenada Foreign And Local Currency Ratings Remain 'SD', Jan. 31, 2014
• Research Update: Belize 'B-/B' Ratings Affirmed; Outlook Remains Stable, Nov. 27, 2013
• Research Update: Barbados Long-Term Rating Lowered To 'BB-' From 'BB+'; Outlook Negative, Nov. 20, 2013
• Research Update: Jamaica Ratings Raised To 'B-/B' On Improving External Funding; Outlook Stable, Sept. 24, 2013
• How An Erosion Of Preferred Creditor Treatment Could Lead To Lower Ratings On Multilateral Lending
Institutions, Aug. 26, 2013
• For Development Banks, Callable Capital Is No Substitute For Paid-In Capital, Dec. 31, 2009
Ratings Detail (As Of June 4, 2014)
Caribbean Development Bank
Counterparty Credit Rating
Foreign Currency AA/Stable/A-1+
Senior Unsecured AA
Counterparty Credit Ratings History
16-May-2014 Foreign Currency AA/Stable/A-1+
12-Dec-2012 AA/Negative/A-1+
12-Jun-2012 AA+/Stable/A-1+
*Unless otherwise noted, all ratings in this report are global scale ratings. Standard & Poor's credit ratings on the global scale are comparable
across countries. Standard & Poor's credit ratings on a national scale are relative to obligors or obligations within that specific country.
WWW.STANDARDANDPOORS.COM/RATINGSDIRECT JUNE 4, 2014 20
1357290 | 301977158
Caribbean Development Bank

S&P may receive compensation for its ratings and certain analyses, normally from issuers or underwriters of securities or from obligors. S&P
reserves the right to disseminate its opinions and analyses. S&P's public ratings and analyses are made available on its Web sites,
www.standardandpoors.com (free of charge), and www.ratingsdirect.com and www.globalcreditportal.com (subscription) and www.spcapitaliq.com
(subscription) and may be distributed through other means, including via S&P publications and third-party redistributors. Additional information
about our ratings fees is available at www.standardandpoors.com/usratingsfees.
S&P keeps certain activities of its business units separate from each other in order to preserve the independence and objectivity of their respective
activities. As a result, certain business units of S&P may have information that is not available to other S&P business units. S&P has established
policies and procedures to maintain the confidentiality of certain nonpublic information received in connection with each analytical process.
To the extent that regulatory authorities allow a rating agency to acknowledge in one jurisdiction a rating issued in another jurisdiction for certain
regulatory purposes, S&P reserves the right to assign, withdraw, or suspend such acknowledgement at any time and in its sole discretion. S&P
Parties disclaim any duty whatsoever arising out of the assignment, withdrawal, or suspension of an acknowledgment as well as any liability for any
damage alleged to have been suffered on account thereof.
Credit-related and other analyses, including ratings, and statements in the Content are statements of opinion as of the date they are expressed and
not statements of fact. S&P's opinions, analyses, and rating acknowledgment decisions (described below) are not recommendations to purchase,
hold, or sell any securities or to make any investment decisions, and do not address the suitability of any security. S&P assumes no obligation to
update the Content following publication in any form or format. The Content should not be relied on and is not a substitute for the skill, judgment
and experience of the user, its management, employees, advisors and/or clients when making investment and other business decisions. S&P does
not act as a fiduciary or an investment advisor except where registered as such. While S&P has obtained information from sources it believes to be
reliable, S&P does not perform an audit and undertakes no duty of due diligence or independent verification of any information it receives.
No content (including ratings, credit-related analyses and data, valuations, model, software or other application or output therefrom) or any part
thereof (Content) may be modified, reverse engineered, reproduced or distributed in any form by any means, or stored in a database or retrieval
system, without the prior written permission of Standard & Poor's Financial Services LLC or its affiliates (collectively, S&P). The Content shall not be
used for any unlawful or unauthorized purposes. S&P and any third-party providers, as well as their directors, officers, shareholders, employees or
agents (collectively S&P Parties) do not guarantee the accuracy, completeness, timeliness or availability of the Content. S&P Parties are not
responsible for any errors or omissions (negligent or otherwise), regardless of the cause, for the results obtained from the use of the Content, or for
the security or maintenance of any data input by the user. The Content is provided on an "as is" basis. S&P PARTIES DISCLAIM ANY AND ALL
EXPRESS OR IMPLIED WARRANTIES, INCLUDING, BUT NOT LIMITED TO, ANY WARRANTIES OF MERCHANTABILITY OR FITNESS FOR
A PARTICULAR PURPOSE OR USE, FREEDOM FROM BUGS, SOFTWARE ERRORS OR DEFECTS, THAT THE CONTENT'S FUNCTIONING
WILL BE UNINTERRUPTED, OR THAT THE CONTENT WILL OPERATE WITH ANY SOFTWARE OR HARDWARE CONFIGURATION. In no
event shall S&P Parties be liable to any party for any direct, indirect, incidental, exemplary, compensatory, punitive, special or consequential
damages, costs, expenses, legal fees, or losses (including, without limitation, lost income or lost profits and opportunity costs or losses caused by
negligence) in connection with any use of the Content even if advised of the possibility of such damages.
Copyright © 2015 Standard & Poor's Financial Services LLC, a part of McGraw Hill Financial. All rights reserved.
WWW.STANDARDANDPOORS.COM/RATINGSDIRECT JUNE 4, 2014 21
1357290 | 301977158