Embed Size (px)
Citation preview

CARING FOR PATIENTS WITH DIABETES
IN SAFETY NET HOSPITALS AND HEALTH SYSTEMS
Marsha Regenstein, Jennifer Huang, Linda Cummings,
Daniel Lessler, Brendan Reilly, and Dean Schillinger
June 2005 ABSTRACT: Safety net hospital systems provide health care to a high volume of underserved patients, including uninsured and low-income patients, racial/ethnic minorities, and those with chronic conditions. To assess the effects of programs designed to improve care for the undeserved, the National Public Health and Hospital Institute interviewed administrators about available programs and services and collected information on patient demographics, health care utilization, and clinical outcomes related to diabetes management. Services range from availability of special diabetes clinics to American Diabetes Association–certified classes. Compared with other health care providers, safety net hospital systems provide comparably high quality of care to patients with diabetes, despite serving higher volumes of underserved patients. However, even with programs and services designed to improve access to care for the underserved, disparities in quality of care and patient outcomes persist as a result of demographic risk factors, most notably, lack of insurance. Support for this research was provided by The Commonwealth Fund. The views
presented here are those of the authors and not necessarily those of The Commonwealth
Fund or its directors, officers, or staff.
Additional copies of this and other Commonwealth Fund publications are available online
at www.cmwf.org. To learn about new Fund publications when they appear, visit the
Fund’s Web site and register to receive e-mail alerts.
Commonwealth Fund pub. no. 826.


iii
CONTENTS
List of Figures and Tables................................................................................................ iv
About the Authors ........................................................................................................... v
Acknowledgments .......................................................................................................... vi
Executive Summary....................................................................................................... vii
Introduction ....................................................................................................................1
Data Collection Methods .................................................................................................4
Findings: Key Components of Diabetes Care Delivery.....................................................5
Findings from Hospital Data ............................................................................................9
Analysis of Factors Affecting HbA1c Levels .................................................................... 19
Conclusions and Recommendations .............................................................................. 23
Appendix. Logistic Regression Model............................................................................ 27
Notes............................................................................................................................. 28

iv
LIST OF FIGURES AND TABLES
Table 1 Patient and Visit Volumes at Consortium Hospital Systems, 2002 .....................4
Table 2 Characteristics of Diabetes Care at Consortium Hospital Systems ......................7
Table 3 Race/Ethnicity of Consortium Hospital Systems’ Patients with Diabetes......... 10
Table 4 Languages of Diabetes Patients at Consortium Hospital Systems ...................... 11
Figure 1 Insurance Coverage of Diabetes Patients at Consortium Hospitals ................... 12
Table 5 Average Number of Visits, by Insurance Coverage and
Race/Ethnicity, January 2000–December 2002 ........................................... 14
Table 6 Key Outcomes for Selected Populations with Diabetes.................................... 16
Table 7 Mean Values of Clinical Tests by Race/Ethnicity and
Insurance Coverage, January 2000–December 2002..................................... 19
Table 8 HbA1c by Race, Health Insurance, Outpatient Utilization,
and Hospital Characteristics ......................................................................... 20
v
ABOUT THE AUTHORS
Marsha Regenstein, Ph.D., is director of the National Public Health and Hospital
Institute (NPHHI) and vice president for research of the National Association of Public
Hospitals and Health Systems. She is also an associate research professor in the Department
of Health Policy at the School of Public Health and Health Services, George Washington
University Medical Center. Dr. Regenstein’s work focuses on vulnerable populations and
the providers who serve them. She has a Ph.D. in health policy from George Washington
University.
Jennifer Huang, M.S., is a senior research analyst with NPHHI. Prior to joining
NPHHI in 2001, she worked with a state health department on programs for adults and
adolescents with disabilities and special health needs. Ms. Huang has also worked on
research projects for children with chronic conditions and their families. She has a master’s
degree from the Harvard School of Public Health in maternal and child health.
Linda Cummings, Ph.D., is director of research for NPHHI. For five years, Dr.
Cummings headed a department in the Massachusetts Office of Economic Affairs that was
responsible for business relations and training for low-income communities. She worked
for 10 years as a health policy and communications consultant in the Washington, D.C.,
area on issues such as adolescent health, family planning, and Medicaid managed care.
During that period, she was a consultant with Radiant Communications as part of a team
that trained more than 300 community-based Robert Wood Johnson Foundation grantees
across the country. Dr. Cummings received her Ph.D. in political science from the
Massachusetts Institute of Technology.
Daniel Lessler, M.D., M.H.A., is the associate medical director of ambulatory care
services at Harborview Medical Center and an associate professor of medicine at the
University of Washington in Seattle. Dr. Lessler’s medical and research career includes
significant experience and publications in the areas of health care quality, costs, and
utilization; participation in numerous hospital committees; and a Robert Wood Johnson
Foundation grant to work on the development and implementation of a curriculum in the
management of chronic illness. Dr. Lessler received his M.D. from Stanford University
School of Medicine and M.H.A. from University of Washington.
Brendan Reilly, M.D., is chair of the Department of Medicine at Cook County
Hospital and the C. Andersen Hedberg Professor of Medicine at Rush Medical College in

vi
Chicago. His current research interests include ambulatory care, end-of-life care,
anticoagulation, evidence-based medicine, decision rules, and care for patients with acute
cardiac ischemia. Dr. Reilly received his M.D. from Cornell University Medical College.
Dean Schillinger, M.D., is associate professor of medicine at San Francisco General
Hospital (SFGH), University of California at San Francisco, where he is a primary care
physician. In his administrative capacities, he has directed the Adult Medical Center at
SFGH and has served as director of clinical operations for the SFGH Department of
Medicine. Since the mid-1990s, Dr. Schillinger has worked to improve chronic disease
management in the facilities where he has served and spearheaded systemic changes to
promote primary care coordination and improve self-management support for public
hospital patients. He is the recipient of numerous awards including the 2003 Institute for
Health Care Advancement Research Award for his work on health communication and
diabetes care. Dr. Schillinger is a member of the Center for Health and Community and
the Center for Medical Effectiveness among Diverse Populations, both at the University of
California at San Francisco. Dr. Schillinger received his M.D. from the University of
Pennsylvania School of Medicine.
ACKNOWLEDGMENTS
The authors would like to thank The Commonwealth Fund and in particular, Anne Beal,
M.D., M.P.H., senior program officer for the Fund’s Program on Quality of Care for
Underserved Populations, for her continued support and guidance throughout the project.
Co-principal investigators at each of the consortium hospital systems provided ongoing
support for this project. Their guidance and assistance were critical to the success of the
endeavor and the authors thank them for their participation as well as the participation of
many others at their institutions. We also would like to thank Arsenio DeGuzman for his
assistance and hard work on the project. Karen Jones provided advice and technical
assistance with statistical analyses and Lu Matrascia provided technical and clinical expertise
in developing the technical specifications for the project.

vii
EXECUTIVE SUMMARY
The nation’s health care safety net plays a critical role in providing care to millions
of Americans who have few options for accessing important health care services. Public
hospitals are in a unique position within the health care safety net because they often
operate systems of care, including inpatient care, primary and specialty outpatient care, and
emergency departments. They therefore can offer patients with chronic conditions
coordinated care throughout their life cycles.
In an effort to improve care for patients with chronic conditions, seven large and
diverse public hospitals joined with the National Public Health and Hospital Institute
(NPHHI) to form the Consortium for Quality Improvement in Safety Net Hospitals and
Health Systems. Choosing diabetes as their initial focus because of its prevalence among
their patients, the consortium members aimed to learn about the quality of diabetes care
in public hospitals, describe mechanisms for delivering diabetes management services, and
identify lessons that might apply to other chronic conditions. When the study began,
41.4 percent of the patients with diabetes at these hospitals were uninsured and an
additional 15.5 percent were covered by Medicaid.
Consortium hospital systems provided information on laboratory tests commonly
given to patients with diabetes to monitor their care over time. These tests record
HbA1C values and lipid levels (low-density lipoprotein, or LDL, and total cholesterol).
Project staff then compared these values to those found in four other studies of diabetes
patients: one study of patients who received care through the Department of Veterans
Affairs (VA); another of patients enrolled in commercial managed care plans; and two
nationally representative government surveys that provide averages for adults with
diabetes in the United States.
Despite the vulnerability of public hospital patients—as evidenced by the high
number of uninsured and publicly insured individuals—outcomes for consortium patients
are comparable to or, in some cases, better than national averages on standard measures of
diabetes management, although they fall short of diabetes-related outcomes for VA
patients. At consortium hospitals and managed care plans, 65 and 67 percent of patients,
respectively, had HbA1c values below 8.5 percent, indicating moderate control of
diabetes. A higher percentage of VA patients had controlled diabetes. At consortium
hospital systems, in national surveys, and in managed care populations, about one-fifth
(21%, 18%, and 20%, respectively) of patients had HbA1C values of 9.5 percent or above,

viii
indicating very poor glycemic control. This figure was much lower for VA patients: only
8 percent of patients with diabetes in the VA study showed very poor glycemic control.
In addition, consortium patients had similar or better cholesterol levels than
patients in the national samples.
These findings may help dispel the perception that patients at public hospital
systems receive only episodic care that does not effectively manage long-term chronic
conditions. The consortium outcomes are equal to and, in some cases, better than
privately covered managed care plan enrollees and the general population. Clearly, public
hospitals are doing something right for patients with diabetes. Nevertheless, outcomes in
public hospitals, managed care plans, and the general population are far below outcomes
for VA patients on key measures of quality. The VA is a large public system with rigorous
protocols for quality improvement. Its success in managing patients with diabetes should
be studied and, whenever possible, models should be spread to public hospitals and
other providers.
Outcomes by Race/Ethnicity and Coverage
There are important differences in health outcomes across subgroups of the NPHHI
consortium hospital systems. After controlling for insurance, gender, age, number of
outpatient visits, and hospital characteristics, we found significant variation across patient
groups by race. For example, compared with white patients, black patients at consortium
hospitals were significantly less likely to have well-controlled diabetes (OR=.46).
Insurance coverage also was a significant factor in glycemic control, independent
of race, age, gender, hospital characteristics, and outpatient utilization. Medicare enrollees
were more likely than Medicaid enrollees to have better diabetes control (OR=1.18), and
uninsured patients were significantly less likely than those with any type of insurance
coverage to have well-controlled diabetes (OR=.85). Even at safety net hospitals, with
services designed to provide access to high-quality care for low-income and other
vulnerable patients, insurance and race continue to influence health care utilization and
ultimately health outcomes for patients with diabetes.
Conclusions
The consortium project provides important lessons for safety net hospitals and other
providers of diabetes services.
ix
• Continuity of care and a range of services are essential. The consortium hospital
systems employ various strategies such as education classes, special diabetes clinics,
and language services to improve care for at least a subset of their diabetes patients.
• Information management systems are central to providing comprehensive diabetes
care. Six of the consortium participants were able to provide substantial
race/ethnicity data on their diabetic patients and half were able to provide detailed
data on patients’ preferred languages. Such data enable safety net hospitals to
compare chronic care utilization and outcomes by racial and ethnic groups—an
essential first step in addressing disparities.
• Insurance coverage influences patient outcomes even when there are programs to
mitigate financial barriers to care. At consortium sites, uninsured individuals
receive less care, including critically important outpatient care, than patients
covered by Medicaid or Medicare.

1
CARING FOR PATIENTS WITH DIABETES
IN SAFETY NET HOSPITALS AND HEALTH SYSTEMS
INTRODUCTION
The nation’s health care safety net plays a critical role in providing care to millions of
Americans who have few other options for accessing important health care services. Public
hospitals, federally funded health centers, public health departments, and many private
physicians and clinics share a common mission: to deliver health services to individuals in
need of care, regardless of their ability to pay.
Patients who seek care from the health care safety net are among the nation’s most
vulnerable residents. Many are poor and most belong to racial and ethnic minorities.1 In
addition to providing free or discounted services, most safety net providers offer special
programs to improve patients’ access to and quality of care. These include interpreter
services for patients with limited English proficiency, transportation to and from
appointments, case management, patient education, and linkages with social services.
Public hospitals are in a unique position within the health care safety net because
they offer uninsured, low-income, or otherwise vulnerable patients a comprehensive set of
health services. While federally funded health centers focus on primary care and public
health department clinics tend to focus on preventive services, public hospitals commonly
offer inpatient care, primary and specialty outpatient care, and emergency departments. In
essence, public hospitals operate systems of care, offering patients the full complement of
services for many health conditions throughout the life cycle.
This structure can provide significant benefits to patients with chronic conditions,
who require complex and coordinated care. Public hospitals are well positioned to offer
coordinated care management, monitor quality over time, and adjust resources to meet
their patients’ evolving needs.
A substantial portion of public hospital patients suffer from chronic conditions such
as diabetes, asthma, cardiovascular disease, HIV/AIDS, and lung disease. Despite the
prevalence of these conditions at safety net hospitals, little is known about the types of
services patients receive and the overall quality of their care. To address this question, a
group of public hospitals created the Consortium for Quality Improvement in Safety Net
Hospitals and Health Systems and chose to begin work by focusing on diabetes. The goals
of the consortium were to learn about overall quality of diabetes care, describe

2
mechanisms for delivering services to public hospital patients, and identify lessons that
were potentially transferable to patient care for other chronic conditions.
Diabetes was chosen as the first condition of study for several reasons:
• Diabetes is extremely prevalent in public hospitals, providing a large study
population and ensuring that the findings would be of widespread interest among
safety net providers. For example, the Cook County Bureau of Health Services, a
public hospital system that includes three acute care hospital systems, primary and
specialty outpatient clinics, and a network of more than 30 community-based
ambulatory care sites, provides care to about 30,000 diabetes patients. The volume
of patients presents an immense challenge to these providers, made greater by the
large proportion of patients with limited English proficiency, few economic
resources, housing instability, or low literacy.
• Diabetes is a national public health concern. An estimated 18 million Americans
have diabetes, and the number is expected to rise to 29 million by 2050.2 Findings
related to quality of care in safety net hospitals will have implications for large
segments of the population.
• Blacks, Latinos, Native Americans, and Asian and Pacific Islander patients all have
a higher prevalence of diabetes than white Americans.3 In addition, diabetes is the
country’s leading cause of end-state renal disease, a condition that is much more
prevalent among blacks than whites.
• There is substantial consensus about what constitutes high-quality diabetes
treatment, making common measures possible across sites. The most frequent
marker of high-quality diabetes care, glycemic control, is a laboratory value that is
available in many public hospital electronic data systems.
Consortium for Quality Improvement in Safety Net Hospitals and
Health Systems
In 2002, with support from The Commonwealth Fund, the National Public Health and
Hospital Institute (NPHHI) created a consortium of safety net hospital systems to work
together to address common concerns regarding the care of patients with diabetes. As do
many public hospitals, the seven hospitals that participated in the Consortium for Quality
Improvement in Safety Net Hospitals and Health Systems include comprehensive diabetes

3
care as a major clinical focus. Recognizing the complexity of diabetes care, each hospital
employs a variety of tools to help patients manage their chronic health conditions.
This was the first effort in the safety-net community to conduct cross-institutional
research, share data and analysis, and collaborate across complex systems of care.
Therefore, the project also can provide information about the ability to extract clinical
and demographic data on a subset of patients across health systems, the willingness of
participants to provide such data, and their interest in participating in a shared learning
network.
An additional goal of the project was to develop a robust database on a diverse
patient population, including patient characteristics, access measures, and clinical
outcomes, to enable analysis across racial and ethnic groups.
Consortium Hospital Systems
Potential consortium participants were selected to provide geographic, racial, ethnic, and
linguistic diversity and to include a mix of inpatient and outpatient capacity. We
developed profiles of a group of hospital systems using survey data from the American
Hospital Association and the National Association of Public Hospitals and Health Systems
(NAPH). NPHHI invited 12 safety net hospital systems to participate and 11 expressed
interest. Of these 11, seven completed the consortium’s project requirements by providing
a uniform dataset on patients with diabetes. Table 1 provides information on the seven
consortium hospital systems and illustrates their variability in terms of service volumes.
They are:
• Cambridge Health Alliance, Cambridge, MA (CHA);
• Community Health Network of San Francisco (CHNSF)/San Francisco
General Hospital;4
• Cook County Bureau of Health Services, Chicago, IL (CCBHS);
• Grady Health System, Atlanta, GA (GHS);
• Harborview Medical Center, Seattle, WA (HMC);
• LSU/Medical Center of Louisiana, New Orleans (LSU); and
• Memorial Healthcare System, Hollywood, FL (MHS).

4
These hospitals are all public entities with large patient populations and busy
outpatient clinics and emergency departments. MHS has the largest number of annual
discharges (55,000), while three other hospital systems have more than 25,000 discharges
annually. On the outpatient side, CCBHS and GHS have the highest volumes, with more
than 750,000 and almost 650,000 outpatient visits in 2002, respectively. These numbers
include visits made to hospital campuses, outpatient departments, and off-site community
clinics.
Table 1. Patient and Visit Volumes at Consortium Hospital Systems, 2002 (volumes rounded to nearest hundred)
CHA CHNSF CCBHS GHS HMC LSU MHS
Discharges 15,700 16,500 33,800 29,700 16,800 25,000 55,600Emergency Dept. visits
80,500 47,000 214,300 155,700 81,600 172,500 182,000
Outpatient visits 527,800 656,400 750,200 647,100 260,000 354,600 468,300Number of adult diabetic patients in the system**
4,700 6,800 30,000* 21,000* 4,000 5,700 4,800
* Estimated from interviews with consortium contacts, 2003. ** These patients have a minimum of two outpatient visits at consortium hospital systems recorded during the three-year study period of January 1, 2000, to December 31, 2002. Source: I. Singer, L. Davison, J. Tolbert et al., America’s Safety Net Hospitals and Health Systems, 2002. Results of the 2002 Annual NAPH Member Survey (Washington, D.C.: National Association of Public Hospitals and Health Systems, 2004).
DATA COLLECTION METHODS
The study used two methods of data collection to gather information about patients with
diabetes in the participating hospitals and profile their treatment.5
1. NPHHI staff conducted interviews with key clinical and administrative staff to
identify innovative practices or programs to manage patients with diabetes, paying
special attention to those targeting patients with low literacy or limited English
proficiency and those designed to improve the cultural competence of providers.
2. Consortium hospital systems provided demographic, utilization, and clinical data
on patients with diabetes. Consistent with other diabetes studies, patients were
included in the dataset if they were 18 years or older and had two or more
outpatient visits during the period between January 1, 2000, and December 31,
2002.6,7 Hospital systems also provided inpatient and emergency department visit
data for these patients. To avoid capturing patients whose diabetes was managed
5
elsewhere in the community but who may have been seen in the consortium
hospital system’s emergency department or as an inpatient, we excluded patients
with fewer than two outpatient visits over the three-year period. Patients were
determined to have diabetes if they had a primary or secondary diabetes-related
ICD-9 diagnosis code, excluding gestational diabetes. The data were weighted to
provide equal numbers of patients from each of the participating hospital systems.8
(For more information on the regression analysis of factors influencing HbA1c
levels, see the Appendix.)
Six of the seven hospital systems provided information on patients’ race or
ethnicity.9 These six provided race/ethnicity information on at least 98 percent of patients
in the datasets and generally classified patients according to five categories: white, black,
Latino, Asian/Pacific Islander, or Native American/Alaskan.10 Consortium hospitals
provided information on patients’ insurance coverage for nearly all of the patients in the
study. The findings on race/ethnicity, language, and coverage are consistent with other
studies on patients who receive care at these hospital systems, although attempts to validate
the data were beyond the scope of this project.
FINDINGS: KEY COMPONENTS OF DIABETES CARE DELIVERY
The Chronic Care Model, developed by Wagner and colleagues at the W. A. MacColl
Institute for Healthcare Innovation, was used as a framework to identify ways that
diabetes-related care was delivered and managed at the participating hospitals.11 The
Chronic Care Model provides a multidimensional roadmap to address complex health
conditions and is built around several important health care delivery components. For
diabetes management, these include:
1. A clear definition of optimal diabetes care;
2. A supportive health care organization;
3. Delivery system design;
4. Decision support;
5. Clinical information systems;
6. Self-management support;
7. Community resources; and
8. An effective improvement strategy

6
We identified characteristics of consortium hospital systems that were consistent
with this model and were likely to have an impact on the quality of diabetes-related care.
While each hospital system has unique features and practices, there are many similarities in
their approach to caring for diverse patient populations in urban settings:
• They provide care to all, regardless of their coverage or ability to pay. They
operate under varying eligibility and payment criteria, which require patients to
qualify for free or reduced cost services. In practice, patients who may not be able
to cover copayments for visits or pharmaceuticals continue to receive important
health services.
• All have on-campus pharmacies that diabetes patients can use on an outpatient
basis to fill their prescriptions, often for free or at significant discounts. Most of
these pharmacies also provide diabetes supplies. These pharmacies tend to be
large and busy; the pharmacy at Fantus, CCBHS’s outpatient clinic, fills well over
2 million prescriptions a year.
• Consistent with national practices, consortium hospitals provide most diabetes care
in outpatient primary care settings. All of the systems have outpatient primary care
and family practice clinics on the hospital campus.
• Each utilizes a team approach to diabetes-related care. Generally, teams meet
regularly and have clearly defined responsibilities including patient self-
management education, proactive follow-up, and resource coordination.
Continuity of care is a high priority. For example, at CHA, diabetes care for the
entire system is led by the Diabetes Leadership Team. At MHS, clinical care
managers coordinate and provide follow-up for a system of care made up of
clinical services, behavioral health care providers, and supportive services. MHS
targets diabetes through a disease management program and uses a team approach
to deliver coordinated care to prevent complications.
• All of the systems offer group classes for diabetes education. Diabetes patients at
HMC can participate in “Living a Healthy Life” workshops, which are case
management support groups for patients with chronic illnesses. CHNSF provides
billable group medical visits to diabetes patients at the hospital campus and several
community health centers for patients with poor glycemic control.

7
• Consortium hospital systems have supplemented their clinical care with non-
clinical services that address patients’ financial, cultural, language, and educational
barriers to care. Consortium hospital systems provide written information about
diabetes care, often in multiple languages and designed for patients with low
literacy levels. For example, HMC developed EthnoMed, a Web-based clinical
tool that helps providers convey information to patients from different cultures and
provides them with access to translated patient education materials. LSU developed
an “African American Sundays” program to train representatives from church
health ministries to provide diabetes education to their congregations. At CHNSF,
administrators emphasize staff hiring that serves the patient population, such as
Spanish-speaking pharmacists.
Table 2 outlines the specific characteristics of diabetes care at the consortium hospital
systems.
Table 2. Characteristics of Diabetes Care at Consortium Hospital Systems*
CHA CHNSF CCBHS GHS HMC LSU MHS
Special diabetes clinic
International medicine clinic
Diabetes registry available
Registry integrated w/other electronic information systems
Registry able to alert providers to needed diabetes care services
Registry used for monitoring and planning diabetes care
Registry incorporates clinical decision-making
Individual class available
Education classes in language(s) other than English
ADA certified program
Satellite clinic pharmacy available
90% or more of patients have record of HbA1c information
Patients have record of information of eye examinations
* A check indicates that the hospital system offers the service to at least a subset of its patients. Source: Consortium for Quality Improvement in Safety Net Hospitals and Health Systems, 2005.

8
Special Diabetes Clinics
Some consortium hospital systems operate clinics that provide specialized care exclusively
to patients with diabetes. Often, these clinics are staffed with providers with advanced
knowledge and skills, including diabetologists and certified diabetes educators. GHS
operates a diabetes clinic for about 5,000 of its patients. While patients can self-refer to the
clinic, the majority are referred by primary care providers. The diabetes clinic is located at
the main GHS campus and serves as a resource to other GHS clinics that treat patients
whose diabetes is difficult to manage.
International Medicine Clinics
To facilitate care for a culturally diverse patient population, several systems operate
international medicine clinics, where patients and providers commonly speak languages in
addition to English. At HMC, for example, the International Medicine Clinic is a primary
care practice for patients with limited English proficiency. The clinic provides diabetes
education in multiple languages, particularly Spanish and Amharic, and for patients with
low health literacy.
Diabetes Registries
A patient registry allows health systems to track the care of individuals and groups,
organize treatment data such as laboratory results and clinical visits, and provides a
resource for the care team. All of the consortium hospital systems use their registries to
some extent for monitoring and planning diabetes care, but their systems have varying
capabilities. The most comprehensive registries incorporate clinical decision support and
are integrated into other electronic information systems used by the health systems.
At CHNSF, a multidisciplinary care team uses the registry to identify patients in
poor control and provide self-management support. This support includes automated
telephone diabetes management sessions in English, Spanish, or Cantonese and review by
a nurse case manager or group medical visits.
Education Classes
Consortium hospital systems use a variety of resources to supplement traditional diabetes
education programs and tailor their methods to the needs of their patients. Many of the
hospital systems employ certified diabetes educators (CDEs) as part of the diabetes care
team and provide targeted support for special needs. For example, at MHS, CDEs lead
adult support groups in discussions of nutrition, medical developments in diabetes care,
and related topics.
9
Several of the hospitals have education programs that have been certified by the
American Diabetes Association (ADA), which sets national standards for diabetes self-
management education.12 These standards include organizational support for diabetes self-
management education programs, involvement of multifaceted instructional teams, a
designated coordinator for educational programs, and use of a continuous quality
improvement process to evaluate their effectiveness.
Pharmacy Services at Satellite Clinics
Diabetes care requires coordination of medications and supplies. In addition to having
outpatient pharmacies on the hospital campuses, several sites also provide pharmacy
services at satellite clinics in their communities. Because of the growing costs of
pharmaceuticals and their critical importance to care management, consortium hospital
systems employ multiple strategies to provide pharmaceuticals for their patients. These
strategies include patient assistance programs, discount cards, and participation in the
federal 340b program, which allows public hospital pharmacies to purchase drugs at the
lowest possible prices.13
Availability of Clinical Information
We asked participating hospitals to provide information used in their routine care for
patients with diabetes. Because of the importance of managing HbA1c levels and the
usefulness of the indicator, we looked at the extent to which patient records included at
least one HbA1c value during the study period. Three hospital systems reported at least
one HbA1c value for 90 percent or more of their patients. In addition, four systems were
able to track whether patients had received eye examinations during the study period.14
FINDINGS FROM HOSPITAL DATA
Patient Demographics
Among all seven participating hospitals, 56.4 percent of patients were female and 43.6
percent were male. Only 16.4 percent were under age 45 and more than half (51.9 %)
were between the ages of 45 and 64. An additional 20 percent were 65 to 74 and nearly
12 percent were 75 or older.
Six of the seven hospital systems provided information on the race/ethnicity of
their diabetes patients. Among these six, race/ethnicity information was available for more
than 99 percent of patients. This data shows that most of the patients treated at the
participating hospitals are members of racial or ethnic minority groups. As Table 3

10
illustrates, nearly half (45.7 %) were black, 11.2 percent were Latino, and 7.3 percent were
Asian or Pacific Islander. About one-third were classified as non-Latino white.
The racial and ethnic make-up of patients varies considerably across the hospital
systems. While the CHA has the lowest percentage of patients from racial or ethnic
minorities, there may be significant diversity within CHA’s racial/ethnic categories. For
example, many of CHA’s patients who classify themselves as white were Brazilian and
speak Portuguese.
At two systems, blacks composed the majority of diabetes patients.15 San
Francisco’s CHNSF was the most diverse, with significant representation from each of the
four major racial and ethnic categories.
Table 3. Race/Ethnicity of Consortium Hospital Systems’ Patients with Diabetes
%
White %
Black %
Latino
% Asian/ Pacific Islander
% Native
American/ Alaskan*
% Other
% Missing
Consortium Average** 30.8 45.7 11.2 7.3 0.5 2.8 1.7 Cambridge Health Alliance 61.4 18.6 9.2 1.2 — 7.2 2.4 Community Health Network of San Francisco
16.9 23.5 27.9 27.7 0.3 2.9 0.8
Grady Health System 4.7 89.8 2.2 0.4 0.6 2.3 — Harborview Medical Center
42.8 31.5 6.9 13.3 1.7 — 3.7
LSU/Medical Center of Louisiana at New Orleans
10.9 85.4 2.4 0.8 0.1 0.5 —
Memorial Healthcare System
48.1 25.3 18.6 0.7 0.1 4.1 3.0
Notes: Cook County Bureau of Health Services did not provide race/ethnicity information about diabetes patients, and is not included in Table 3. A 2000 survey of ambulatory care practices at NAPH hospitals indicated that approximately 65 percent of CCBHS’s total patient population was black and 25 percent was Latino. The remaining 10 percent was white, Asian, or other races. See M. Regenstein and J. Shearer, NAPH Ambulatory Care Sourcebook: Findings from the 2001 NAPH Ambulatory Care Survey (Washington, D.C.: National Association of Public Hospitals and Health Systems, October 2001). * A total of 127 Native American/Alaskan patients are included in the analysis. ** The consortium average is weighted: 3,000 patients from each hospital were randomly sampled in order to account for different sampling strategies from consortium systems. Patients with fewer than two outpatient visits were excluded. Weights were applied such that each hospital contributes 3,000 patients (for overall averages only). Source: Consortium for Quality Improvement in Safety Net Hospitals and Health Systems, 2005.

11
Languages
One of the most striking characteristics of the patient populations is that a high proportion
speaks a language other than English. Safety net providers face great challenges in
developing programs to provide culturally and linguistically appropriate care to their
patients.
Table 4 shows the percent of patients at each hospital system estimated to speak a
language other than English as their primary language and lists the various languages
spoken by patients at each system. While only 5 percent of patients primarily spoke a
language other than English at GHS, 66 percent did so at MHS. At each of the systems,
English was the most commonly spoken language, since many patients who spoke another
language also spoke English. Spanish was the second most common language.
Table 4. Languages of Diabetes Patients at Consortium Hospital Systems CHA CHNSF CCBHS GHS HMC LSU MHS
% patients who speak language other than English as primary language
36% 40% 40% 5% 23% 5% 66%
Top Languages (in order)
English Portuguese Haitian Creole Spanish Hindi
English Spanish Cantonese
English Spanish Polish Hindi
EnglishSpanish
English Vietnamese Cambodian Somali Amharic Tigrinyan
English Spanish Vietnamese Chinese French
EnglishSpanishHaitian Creole
Notes: Figures represent an initial random sample of 3,000 patients from each consortium hospital. Patients with fewer than two outpatient visits were excluded from the sample. As a result, two hospitals include fewer than 3,000 patients in the final sample. Source: Interviews with Consortium Hospital Systems, 2003.
Health Insurance Coverage
The hospital systems care for disproportionately high numbers of uninsured patients
(Figure 1). Two-fifths (41.4%) of patients with diabetes were uninsured, approximately
one of seven (13.7%) were privately insured, and more than one-quarter (27.9%) were
covered by Medicare. Only 15.7 percent were covered by Medicaid.
Medicaid coverage among patients with diabetes at the consortium hospital systems
was substantially lower than overall Medicaid coverage at these and other safety net
hospital systems. For example, about 42 percent of inpatient discharges and 24 percent of
outpatient visits at NAPH member hospitals were covered by Medicaid.16 This finding

12
may be due to the limitations of Medicaid coverage for certain groups of adults. While
Medicaid eligibility varies significantly across states, middle-aged men and women with
diabetes or other chronic diseases are less likely to be covered by Medicaid, regardless of
their state of residence, since they do not fall into Medicaid-eligible groups and are not
automatically eligible by virtue of having diabetes.
Not surprisingly, coverage of patients with diabetes varies greatly across hospital
systems. At CCBHB, more than 76 percent of patients with diabetes were uninsured,
while only 7.6 percent of patients were covered by Medicaid. By comparison, 38.2 percent
of diabetes patients at CHNSF were covered by MediCal, California’s Medicaid program,
because of California’s more generous enrollment policies for low-income patients.
Figure 1. Insurance Coverage ofDiabetes Patients at Consortium Hospitals
13.7 15.5
27.9
41.4
1.50
10
20
30
40
50
Private Medicaid Medicare Uninsured Other/Missing
Source: Consortium for Quality Improvement in Safety Net Hospitals and Health Systems, 2005.
Percent
Utilization of Health Services
The consortium hospital systems provided data on their diabetes patients’ use of
ambulatory care, emergency department services, and inpatient stays.
Use of Ambulatory Care
We analyzed use of services for all eligible patients who had two or more ambulatory care
visits during the three-year study period.17 About one-third (34.3%) of all patients had
relatively few outpatient visits (two to four). The remaining two-thirds had five or more

13
outpatient visits: 26.3 percent had between five and 10 visits and 39.4 percent had 11 or
more visits.
Asian/Pacific Islander patients were most likely to have multiple outpatient visits.
Nearly nine of 10 (88.3%) Asian/Pacific Islander patients had five or more outpatient
visits, compared with 78.8 percent of Native American/Alaskans, 72.5 percent of Latinos,
68.7 percent of blacks, and 61.5 percent of whites.
Medicaid and Medicare patients were most likely to have five or more outpatient
visits during the study period (78.0% and 73.4%, respectively), compared with 47.2
percent of privately insured patients. Uninsured patients also had lower rates of outpatient
care compared with Medicaid and Medicare patients. Less than one-third (30.5%) of
uninsured patients had 11 or more outpatient visits during the study period, compared
with 54.1 percent of Medicaid patients and 51.2 percent of Medicare patients.
Use of Emergency Departments
More than half (57.9%) of the patients did not visit the emergency department (ED) at all
during the three-year study period. A small proportion (9.3%) of patients used the ED
frequently, visiting five or more times. Privately insured and uninsured patients were most
likely to have no ED visits. Medicaid patients were twice as likely as other patients to have
five or more ED visits (19.5% versus 9.3%).
ED use was particularly high among certain groups of patients. Nearly one-third
(31.8%) of Native American/Alaskan patients used the ED five or more times over the
study period—a rate more than twice as high as black patients (14.2%) and six times as
high as Asian/Pacific Islander patients (5.4%).
Use of Inpatient Services
Nearly one-third (30.8%) of patients were hospitalized at some point during the study
period, evidence of the high burden of illness and costs associated with diabetes. Most of
these patients had one or two admissions during the three-year period. However, as with
ED use, a small percentage of patients (3.2%) had five or more inpatient admissions.
Medicaid patients were more than six times as likely as uninsured patients to have five
or more admissions.
Latino and Asian/Pacific Islander patients were less likely than other patients to use
inpatient services, with 74.9 percent and 68.9 percent, respectively, having no admissions

14
during the study period. More than one of 10 Native American/Alaskan patients had five
or more inpatient admissions during the study period—a rate more than three times as
high as black and white patients and more than five times as high as Latino and
Asian/Pacific Islander patients.
Summary of Utilization
Table 5 provides information on the average number of ambulatory, emergency
department, and inpatient visits by patients’ coverage and race/ethnicity. Overall, privately
insured and uninsured patients had lower rates of service utilization than patients covered
by Medicaid or Medicare.
It is not surprising to find that uninsured patients use fewer ambulatory services.
Even in safety net institutions that offer care to all in need, uninsured patients may face
copayments or other financial barriers to services. Medicaid enrollees with diabetes are
likely to have co-morbid conditions or suffer from complications—factors that may enable
them to become eligible for Medicaid. This helps to explain why Medicaid enrollees had
greater use of services.
Table 5. Average Number of Visits, by Insurance Coverage and Race/Ethnicity
January 2000–December 2002
Ambulatory
Visits
Emergency Department
Visits Inpatient
Admissions Insurance Coverage Medicaid 20.2 3.0 1.3 Medicare 18.9 1.7 .9 Private 9.5 .7 .4 Uninsured/Self Pay 10.5 1.1 .4
Race/Ethnicity White 14.7 1.3 .8 Black 13.6 2.2 .7 Latino 18.3 1.2 .5 Asian/Pacific Islander 23.6 1.1 .7 Native American 16.9 5.5 1.8
Notes: Cook County Bureau of Health Services did not provide race/ethnicity information about diabetes patients and is therefore not included in race/ethnicity values. Insurance coverage values include all consortium hospital systems. Source: Consortium for Quality Improvement in Safety Net Hospitals and Health Systems, 2005.
15
The lower rates of service use among privately insured patients was a more
surprising finding, and especially noteworthy because the rates were lower than those for
uninsured patients. There are several possible explanations. Privately insured patients may
receive care from a variety of providers, thereby resulting in lower utilization rates at the
consortium hospitals. What’s more, all public hospital patients tend to be low-income,
regardless of their coverage. Privately insured patients may be underinsured and face
significant out-of-pocket costs, thus discouraging them from seeking services. Their use
patterns may result from a combination of factors and are worthy of further study.
Asian/Pacific Islanders had high rates of outpatient utilization combined with low
ED and inpatient utilization, a pattern of care that may indicate effective diabetes
management. Native Americans, on the other hand, had disproportionately high rates of
ED use and inpatient care, signaling a need for more targeted strategies to effectively
manage their care for diabetes and other health services.18
Health Outcomes as Reported by Clinical Test Values and Comparisons
with National Averages, the Department of Veterans Affairs, and Managed
Care Populations
Consortium hospital systems provided information on certain laboratory tests commonly
given to patients with diabetes to monitor their care over time. These laboratory tests
recorded HbA1C values and lipid levels (low-density lipoprotein, or LDL, and total
cholesterol).
Table 6 compares outcomes of consortium patients with outcomes reported in
four other studies of large groups of patients with diabetes. These studies include patients
who received care through the Department of Veterans Affairs (VA), commercial
managed care plans, and two nationally representative surveys that provide a measure of
diabetes control among the general population. Despite the vulnerability of public hospital
patients—as evidenced by the high numbers of uninsured and publicly insured
individuals—outcomes for consortium patients are comparable to or, in some cases, better
than national averages on standard measures of diabetes management.19 Quality measures
for patients at consortium hospitals, however, fall short of those for patients who receive
care through the VA.

16
Table 6. Key Outcomes for Selected Populations with Diabetes
Characteristics
NPHHI Consortium Participants (n=19,406)
VA Participants(n=1,285)
Commercial Managed Care Participants (n=6,616)
NHANES III and BRFSS (n=4,086)
Age (mean) 58 65 61 NA Men (%) 44 98 46 45 Race/Ethnicity (%) White 32 67 51 70 Black 45 11 20 16 Hispanic 12 13 19 10 Asian or Pacific Islander 8 1 4 NA Other 3 8 6 4
Quality of Care Measures (%)
HbA1c value < 8.5% 67 83 65 NA HbA1c value > 9.5% 21 8 20 18 LDL cholesterol level
< 130 mg/dL 72 86 72 42
LDL cholesterol level < 100 mg/dL
40 52 36 11
Notes: Figures represent an initial random sample of 3,000 patients from each consortium hospital. Patients with fewer than two outpatient visits were excluded from the sample. As a result, two hospitals include fewer than 3,000 patients in the final sample. Sources: Consortium for Quality Improvement in Safety Net Hospitals and Health Systems, 2005; E. A. Kerr, R. B. Gerzoff, S. L. Krein et al. “Diabetes Care Quality in the Veterans Affairs Health Care System and Commercial Managed Care: The TRIAD Study,” Annals of Internal Medicine 141 (August 17, 2004): 272–81; J. B. Saaddine, M. M. Engelgau, G. L. Beckles et al., “A Diabetes Report Card for the United States: Quality of Care in the 1990s,” Annals of Internal Medicine 136 (April 16, 2002): 565–74.
Patients with diabetes at consortium hospital systems are younger than patients
with diabetes in the VA and in managed care studies. They are also much more likely
to be members of racial and ethnic minorities. Sixty-eight percent of patients in the
consortium hospitals were non-white, compared with 33 percent of VA patients, 49
percent of the managed care diabetic population, and 30 percent of two nationally
representative surveys combined: the Third National Health and Nutrition Examination
Survey (NHANES III) and the Behavioral Risk Factor Surveillance System (BRFSS).
All of the studies gauge glycemic control by measuring percent of patients with
HbA1c values greater than or equal to 9.5 percent, and three of the studies also measure
the percent of patients with HbA1c above or below 8.5 percent.20 At consortium hospital
systems and in the managed care study, 65 and 67 percent of patients, respectively, had
HbA1c values below 8.5 percent, indicating moderate control of diabetes. VA patients

17
were more likely to have controlled diabetes. At consortium hospital systems and in
national surveys, about one-fifth of patients had HbA1C values greater than or equal to
9.5 percent indicating very poor glycemic control.21 This figure was much lower for VA
patients—only 8 percent exhibited very poor glycemic control.
Consortium patients had similar or better cholesterol levels than patients in the
national surveys. The National Cholesterol Education Program Expert Panel on
Detection, Evaluation, and Treatment of High Blood Cholesterol in Adults recommends
that LDL levels for high-risk patients should be <100 mg/dL and for moderately high-risk
patients should be <130 mg/dL.22 Seventy-two percent of consortium patients had LDL
levels below 130 mg/dL, the same rates as managed care enrollees.23 Patients in the VA
survey had higher rates: 86 percent, or more than twice the rate seen among the general
population with diabetes, had LDL levels below 130 mg/dL. Consortium patients were
more likely than managed care enrollees and much more likely than the general
population to have LDL levels below 100 mg/dL. Again, the VA’s rates were the best of
the group.
The outcomes seen among consortium hospital patients are noteworthy for several
reasons. First, the findings may help dispel the perception that patients at public hospitals
receive only episodic care that does not effectively manage long-term chronic conditions.
Even though the patients in the study group are disproportionately low income and
uninsured, they had diabetes outcomes equal to or better than privately covered managed
care enrollees and the general population. This is even more remarkable since public
hospitals provide care to a diverse group of patients who require varying strategies to
enhance self-management and ensure adequate access to health services. Clearly, public
hospitals are doing something right for patients with diabetes.
Nevertheless, outcomes within public hospitals, managed care plans, and the
general population are far below outcomes for patients at the VA on key measures of
quality. The VA is a large public system that has developed rigorous protocols for quality
improvement. Its success in managing patients with diabetes should be studied and,
whenever possible, models should be spread to public hospitals and other providers.
Outcomes by Race/Ethnicity and Coverage
Overall, diabetes patient outcomes in the consortium hospitals were similar to those from
other studies. However, the study uncovered important differences across subgroups of
consortium patients. Uninsured patients had poorer HbA1c levels than Medicare and

18
privately insured patients and black, Latino, and Native American/Alaskan patients had
worse glycemic control than white and Asian/Pacific Islander patients. These disparities
are similar to those found in national surveys, and yet they present particular challenges for
safety net hospitals because these institutions serve so many uninsured and racial/ethnic
minority patients.24
Glycemic Control
Overall, 38.3 percent of consortium hospital patients had HbA1c levels below 7 percent—
the level identified by the American Diabetes Association as well-controlled diabetes—and
another 35.3 percent had levels between 7 and 8.9 percent.25 One-quarter of consortium
patients (26.4%) had levels above 9 percent.
Medicare patients appear to have the best glycemic control among the consortium
patients. Nearly half (47.4%) of these patients had HbA1C levels below 7 percent and only
about one of seven (17.1%) had values over 9 percent. Uninsured patients had the worst
glycemic control; one-third (33.3%) of uninsured patients had HbA1C levels above 9
percent—twice the rate of patients with Medicare coverage.
White patients were most likely to have HbA1c values less than 7 percent, with
45.6 percent in this range. By comparison, 41.5 percent of Asian/Pacific Islander, 37.5
percent of black, 33.9 percent of Latino, and 30.6 percent of Native American/Alaskan
patients had values of less than 7 percent. Compared with black, Latino, and Native
American patients, Asian/Pacific Islander and white patients were significantly less likely to
have HbA1c levels over 9 percent.
Lipid Values: LDL, Total Cholesterol
More than one-third (39.9%) of diabetes patients in consortium hospital systems had LDL
levels below 100 mg/dL and an additional one-third (32.0%) had LDL levels between 100
and 129 mg/dL. Two-thirds (64.1%) also had total cholesterol levels below 200 mg/dL.
Cholesterol levels under 200 mg/dL represent desirable levels of total cholesterol.26
Uninsured patients were least likely to have optimal LDL levels (<100 mg/dL) and were
most likely to have very high LDL levels (160 mg/dL or higher).
While there were differences in the lipid values across racial/ethnic groups, no
clear pattern emerged. Native Americans had the best values for LDL and total cholesterol.
As with glycemic control, blacks were more likely than all other patients to have very high
LDL levels (160 mg/dL or higher).
19
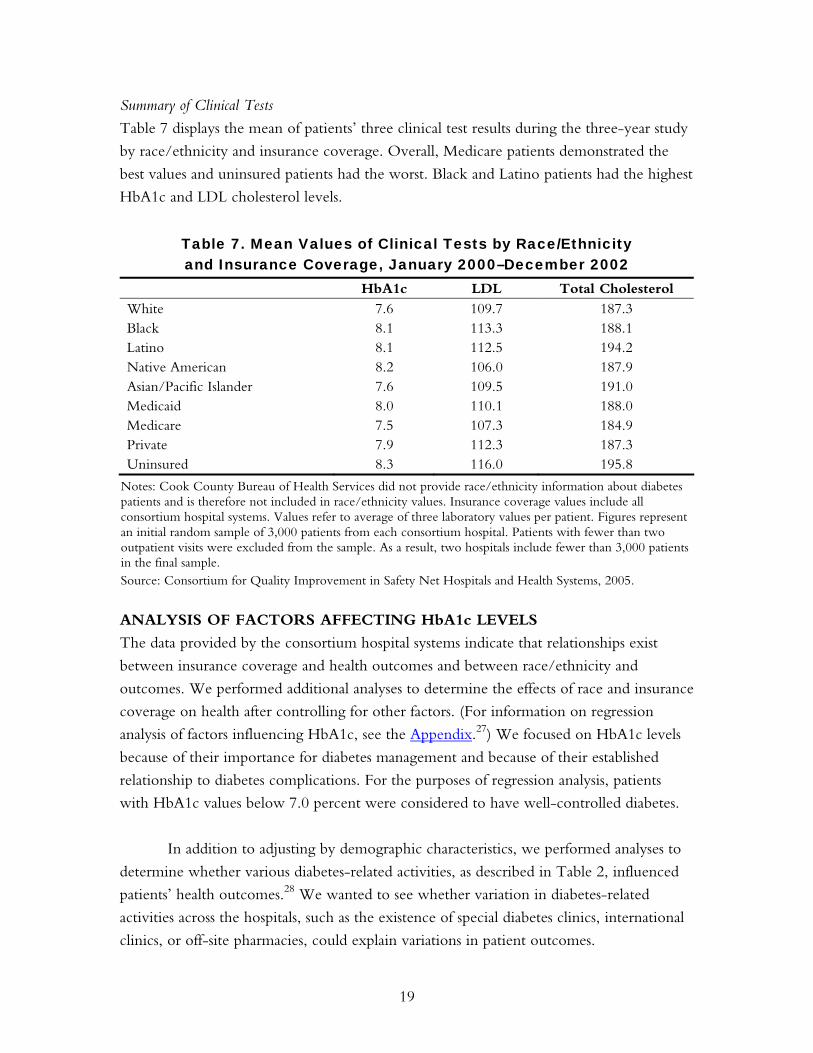
Summary of Clinical Tests
Table 7 displays the mean of patients’ three clinical test results during the three-year study
by race/ethnicity and insurance coverage. Overall, Medicare patients demonstrated the
best values and uninsured patients had the worst. Black and Latino patients had the highest
HbA1c and LDL cholesterol levels.
Table 7. Mean Values of Clinical Tests by Race/Ethnicity and Insurance Coverage, January 2000–December 2002
HbA1c LDL Total Cholesterol White 7.6 109.7 187.3 Black 8.1 113.3 188.1 Latino 8.1 112.5 194.2 Native American 8.2 106.0 187.9 Asian/Pacific Islander 7.6 109.5 191.0 Medicaid 8.0 110.1 188.0 Medicare 7.5 107.3 184.9 Private 7.9 112.3 187.3 Uninsured 8.3 116.0 195.8
Notes: Cook County Bureau of Health Services did not provide race/ethnicity information about diabetes patients and is therefore not included in race/ethnicity values. Insurance coverage values include all consortium hospital systems. Values refer to average of three laboratory values per patient. Figures represent an initial random sample of 3,000 patients from each consortium hospital. Patients with fewer than two outpatient visits were excluded from the sample. As a result, two hospitals include fewer than 3,000 patients in the final sample. Source: Consortium for Quality Improvement in Safety Net Hospitals and Health Systems, 2005. ANALYSIS OF FACTORS AFFECTING HbA1c LEVELS
The data provided by the consortium hospital systems indicate that relationships exist
between insurance coverage and health outcomes and between race/ethnicity and
outcomes. We performed additional analyses to determine the effects of race and insurance
coverage on health after controlling for other factors. (For information on regression
analysis of factors influencing HbA1c, see the Appendix.27) We focused on HbA1c levels
because of their importance for diabetes management and because of their established
relationship to diabetes complications. For the purposes of regression analysis, patients
with HbA1c values below 7.0 percent were considered to have well-controlled diabetes.
In addition to adjusting by demographic characteristics, we performed analyses to
determine whether various diabetes-related activities, as described in Table 2, influenced
patients’ health outcomes.28 We wanted to see whether variation in diabetes-related
activities across the hospitals, such as the existence of special diabetes clinics, international
clinics, or off-site pharmacies, could explain variations in patient outcomes.

20
We also conducted analyses to determine whether outpatient utilization influenced
clinical outcomes. We hypothesized that greater numbers of outpatient visits signaled
improved continuity of care and thereby influenced patients’ clinical outcomes.
Significant Demographic and Hospital Program Characteristics
After controlling for insurance, gender, age, the number of outpatient visits, and hospital
characteristics, there was significant variation in HBA1c levels across patient groups by
race (Table 8). Compared with white patients, black patients at consortium hospital
systems were significantly less likely to have well-controlled diabetes (OR=.46).
Table 8. HbA1c by Race, Health Insurance, Outpatient Utilization, and Hospital Characteristics
HbA1c < 7.0% Characteristic OR 95% CI Race White Reference Black .464* .313 .689 Hispanic 1.413 .796 2.508 Native American/
Alaskan Native .092 .004 2.143
Asian/Pacific Islander 1.408 .678 2.925 Other Race 1.254 .461 3.412
Insurance Medicaid Reference Medicare 1.182* 1.058 1.321 Private/Commercial 1.023 .889 1.177 Uninsured .854* .770 .948
Outpatient Utilization 2–4 visits Reference 5–10 visits 1.715* 1.109 2.651 11 or more visits 2.531* 1.676 3.823 Pharmacy services
available in satellite clinics
1.487* 1.313 1.684
ADA-certified education program
1.350* 1.187 1.536
* p < .05 Note: OR > 1 indicates a greater probability of HbA1c level < 7.0% compared with the reference group. Source: Consortium for Quality Improvement in Safety Net Hospitals and Health Systems, 2005.
21
We also found that, after controlling for race, age, gender, hospital characteristics,
and outpatient utilization, insurance coverage was a significant factor in HbA1C levels.
Medicare patients were more likely than Medicaid patients to have better diabetes control
(OR=1.18) and uninsured patients were significantly less likely than patients overall to
have well-controlled HbA1c (OR=.85).
These findings highlight the persistent barriers to care for uninsured patients as well
as health disparities among minority patients, in this case black patients. Even at safety net
hospitals, with services designed to provide access to care for low-income and other
vulnerable populations, insurance and race continue to influence health care utilization
and ultimately outcomes for diabetes patients.
The number of outpatient visits during the study period was also a significant
factor in patients’ health outcomes. After controlling for race, insurance coverage, age,
gender, and hospital characteristics, patients with 11 or more outpatient visits were more
than twice as likely (OR=2.53) to have lower HbA1c values than patients with fewer than
five visits. Continuity of care appears to be strongly associated with successful diabetes
management. This finding has important implications for uninsured patients, who have
lower utilization of outpatient services than patients covered by Medicaid.
We also examined the extent to which various hospital characteristics influence
HbA1C values.29 Two hospital characteristics, ADA-certified diabetes education programs
and pharmacy services in satellite clinics, were significantly associated with better
outcomes.30 After controlling for insurance, gender, race/ethnicity, age, and the number
of outpatient visits, patients who received care at consortium hospital systems with ADA-
certified education programs were 35 percent more likely to have lower mean HbA1c
levels than patients at sites without such programs (OR=1.35). Also, patients receiving
care at consortium hospital systems with pharmacy services available at satellite clinics were
1.49 times more likely than patients at sites without such services to have well-controlled
diabetes.
In sum, the analyses demonstrate that HbA1c levels were significantly associated
with race, insurance coverage, age, continuity of care, the availability of ADA-certified
diabetes education programs, and the availability of pharmacy services at satellite clinics.
Yet, though statistically significant, all of these factors explain only a small amount of the
variation in HbA1c values observed among consortium hospital system patients.31 This is

22
consistent with Wagner’s Chronic Care Model and reflects the multiple determinants of
diabetes care.32
These findings suggest that, although demographic, hospital, and utilization
characteristics are significantly associated with HbA1c levels, other factors also are
important. Each of the consortium hospital systems is a public entity with a clear and well-
articulated mission; each has a commitment to caring for the underserved; and each has
developed systems to care for their patient populations, including those with low incomes
and those who face cultural or linguistic barriers to care. These factors are not easily
measured. To clarify whether these common characteristics are associated with better
disease management, further research would be needed to compare health outcomes in
safety net health systems with outcomes in health systems that have different governance,
financing, and patient populations.
Limitations
Consortium hospital systems were able to provide a substantial amount of data about their
diabetes patients, including data on race/ethnicity; preferred or spoken language; inpatient,
outpatient, and emergency department utilization; and clinical results. Even so, this
analysis has several limitations.
The study was designed to enable comparisons across similar organizations, not to
compare outcomes between safety net and other types of health systems. With only seven
study sites, analyses of program characteristics, such as availability of special diabetes clinics,
pharmacy services, or an international medicine clinic, are limited. In addition, the
analyses did not allow us to determine the extent to which these characteristics are
independent of each other, or the extent to which having multiple program characteristics
has an effect on patient outcomes.
With regard to clinical outcomes, there was limited data on whether patients
received eye or foot examinations, largely because of limitations in participating hospitals’
systems of capturing and reporting this information. In addition, not all quality indicators,
such as blood pressure and aspirin use, were included and patients’ use of services outside
of the consortium hospital systems was not taken into account. Finally, the study does not
examine the possible reasons for health disparities (e.g., intensity of treatment, duration of
diabetes, self-management behavior, communication/trust in providers, processes of care,
unmeasured socioeconomic variables, neighborhood-level characteristics, and biological
differences).

23
CONCLUSIONS AND RECOMMENDATIONS
This was the first project in which a group of safety net hospital systems came together to
examine quality of care for patients with a chronic condition. It demonstrated that safety
net hospital systems can equal or outperform national standards on indicators of high-
quality diabetes management, even with resource constraints and vulnerable patient
populations. The project also identified areas for further study and opportunities for
advocacy and quality improvement efforts to reduce health disparities. It is notable that
patients in the VA—many of whom share the same risk factors as patients in safety net
health systems—on average appear to fare better than consortium patients with regard to
diabetes outcomes.33 There may be important lessons to learn from the VA’s recent
national integration of chronic disease management, approach to drug coverage, and
investment in information technology.34
The work of the consortium underscores the critical role of safety net hospital
systems in delivering high-quality diabetes care to a patient population that is primarily
low income, ethnically and racially diverse, and has high rates of low health literacy.35
The study reveals that while a patient’s race, insurance coverage, and age may influence
diabetes-related health outcomes (in the form of HbA1C values), these characteristics
explain only a small part of the variation in outcomes across patient populations and
institutions. In addition, while specific diabetes-related interventions can influence
outcomes, the findings indicate that their influence in consortium hospital systems
is modest.
Yet, the study also found that health disparities by race/ethnicity and insurance
coverage exist. Such disparities appear to be affected by the continuity of patients’ care
and the commitment of health systems to chronic disease management as evidenced by
the services they provide. These results suggest that safety net hospitals have room for
improvement in providing medical homes and continuous sources of care for patients
with chronic diseases, particularly the uninsured and black and Latino populations.
The finding that lack of insurance serves as a barrier to adequate care for diabetes
management is particularly important. Even though safety net hospitals offer programs to
ameliorate financial and non-financial barriers to care, their uninsured diabetes patients
fare worse than diabetes patients with public or private insurance.
Although the study findings indicate that care in the consortium hospital systems is
on par with national samples, outcomes in the hospital systems and in national studies fall

24
well below recommended levels. In addition, patient outcomes in consortium hospital
systems appear to vary by sociodemographic characteristics. For example, nearly one-fifth
of consortium patients had HbA1C levels at 9.5 percent or above and more than one-third
had fewer than five outpatient visits over the three-year study period. At some of the
hospital systems, laboratory tests to monitor diabetes appear not to have taken place for
substantial numbers of patients.
In spite of some weaknesses in information management, the consortium hospital
systems were able to provide a substantial amount of data about their diabetes patients.
The race and ethnicity data were surprisingly robust given that collection of these data had
been untested across this group of institutions. Six hospital systems provided race/ethnicity
data for nearly all of their diabetes patients. Three provided detailed data on their patients’
preferred languages.
Given their ability to report clinical information by race and ethnicity, safety net
hospitals have an opportunity to monitor care for many different chronic conditions and
to compare outcomes and utilization by racial and ethnic subgroups. To date, however,
few hospital systems have taken advantage of this opportunity, instead monitoring and
tracking their progress across all patient groups.
Overall, the study found that race/ethnicity, insurance coverage, continuity of
care, and chronic disease management programs at the system level, influence patient
outcomes, and that health disparities exist within and across these institutions. In
particular, uninsured individuals received less care—including critically important
outpatient services—than patients covered by Medicaid or Medicare. Even though safety
net systems offer programs to mitigate financial barriers to care, uninsured patients may
have worse outcomes because of barriers to accessing a comprehensive and stable set of
services over time, as demonstrated in recent studies.36
Privately insured patients also received less care at the study sites, although their
health outcomes were not worse. Medicare patients had better test values than their
younger counterparts with Medicaid. This may be due to some Medicaid patients having
more complex, disabling diabetes combined with other chronic conditions, or more
difficulties managing their health conditions.
The results suggest that, even in safety net settings, uninsured patients with
diabetes have difficulty accessing care, worse glycemic control, and are likely to be at

25
greater risk of developing long-term complications. This illuminates a paradox in our
health care system. Eligibility for public insurance is determined, in part, by the extent of
disability. Because they face barriers to care, the uninsured are likely to develop diabetes
complications—thus becoming eligible for coverage only after their condition has
worsened.
Black and Latino patients appear to fare worse than white and Asian/Pacific
Islander patients, although for the most part they use similar amounts and types of
services. Detailed examinations of hospital records and patient interviews would be
needed to explain these differences.37 Studies might take into account differences in
intensity of treatment, duration of diabetes, self-management behavior,
communication/trust in providers, processes of care, unmeasured variables related to
socioeconomic status, neighborhood-level characteristics, and possible biological
differences.38
The consortium project provides important lessons for safety net hospitals and
other providers who serve patients with diabetes:
• Continuity of care and a range of services are essential. Even though the
consortium hospital systems did not offer identical diabetes-related services, they all
employed multidimensional strategies and programs for at least a subset of their
patients with diabetes. They all had, for example, supportive payment policies to
assist patients with little or no ability to pay and onsite outpatient pharmacies that
offer free or deeply discounted medications. All reported using a team approach to
diabetes care with an emphasis on education and patient self-management. Most
used patient registries to track their diabetes patients and supplemented routine
clinical care with language assistance, social supports, and other services to improve
access to care, increase patient satisfaction, and improve quality.
• Information management systems are central to providing comprehensive diabetes
care. Six of the consortium participants were able to provide a substantial amount
of race/ethnicity data on their diabetic patients and half were able to provide
detailed data on their patients’ preferred languages. Robust race and ethnicity data
enable safety net hospitals to compare chronic care utilization and outcomes by
racial and ethnic groups—the essential first step in addressing disparities. Most
hospital systems do not monitor and track progress by racial and ethnic groups and
are thus missing critical opportunities.

26
• Insurance coverage influences patient outcomes, even at safety net hospitals with
programs to mitigate financial barriers to care. At consortium sites, uninsured
individuals received less care, including critically important outpatient care, than
patients covered by Medicaid or Medicare. Uninsured patients also had poorer
diabetes management compared with Medicaid patients. Uninsured patients with
chronic conditions such as diabetes may have worse outcomes because of barriers
to accessing a comprehensive and stable set of services over time, even in safety net
systems. Policy and advocacy efforts should focus on the benefits of health
insurance in providing continuous care and managing chronic conditions.
• Collaboration among multiple sites offering care to patients with similar needs
enables exchange of best practices and helps participants identify areas of further
research. Such collaboration can lead to multi-site interventions that eventually
could produce efficiencies and improve outcomes.
27
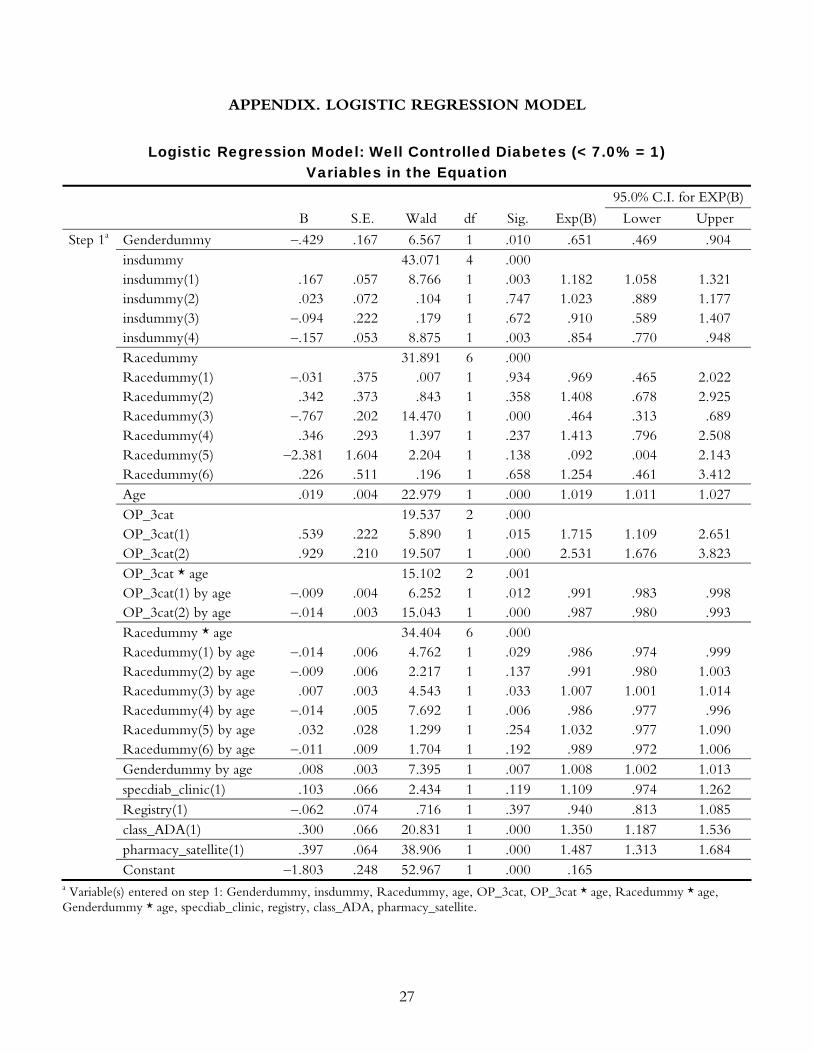
APPENDIX. LOGISTIC REGRESSION MODEL
Logistic Regression Model: Well Controlled Diabetes (< 7.0% = 1) Variables in the Equation
95.0% C.I. for EXP(B)
B S.E. Wald df Sig. Exp(B) Lower Upper
Step 1a Genderdummy –.429 .167 6.567 1 .010 .651 .469 .904 insdummy 43.071 4 .000 insdummy(1) .167 .057 8.766 1 .003 1.182 1.058 1.321 insdummy(2) .023 .072 .104 1 .747 1.023 .889 1.177 insdummy(3) –.094 .222 .179 1 .672 .910 .589 1.407 insdummy(4) –.157 .053 8.875 1 .003 .854 .770 .948 Racedummy 31.891 6 .000 Racedummy(1) –.031 .375 .007 1 .934 .969 .465 2.022 Racedummy(2) .342 .373 .843 1 .358 1.408 .678 2.925 Racedummy(3) –.767 .202 14.470 1 .000 .464 .313 .689 Racedummy(4) .346 .293 1.397 1 .237 1.413 .796 2.508 Racedummy(5) –2.381 1.604 2.204 1 .138 .092 .004 2.143 Racedummy(6) .226 .511 .196 1 .658 1.254 .461 3.412 Age .019 .004 22.979 1 .000 1.019 1.011 1.027 OP_3cat 19.537 2 .000 OP_3cat(1) .539 .222 5.890 1 .015 1.715 1.109 2.651 OP_3cat(2) .929 .210 19.507 1 .000 2.531 1.676 3.823 OP_3cat * age 15.102 2 .001 OP_3cat(1) by age –.009 .004 6.252 1 .012 .991 .983 .998 OP_3cat(2) by age –.014 .003 15.043 1 .000 .987 .980 .993 Racedummy * age 34.404 6 .000 Racedummy(1) by age –.014 .006 4.762 1 .029 .986 .974 .999 Racedummy(2) by age –.009 .006 2.217 1 .137 .991 .980 1.003 Racedummy(3) by age .007 .003 4.543 1 .033 1.007 1.001 1.014 Racedummy(4) by age –.014 .005 7.692 1 .006 .986 .977 .996 Racedummy(5) by age .032 .028 1.299 1 .254 1.032 .977 1.090 Racedummy(6) by age –.011 .009 1.704 1 .192 .989 .972 1.006 Genderdummy by age .008 .003 7.395 1 .007 1.008 1.002 1.013 specdiab_clinic(1) .103 .066 2.434 1 .119 1.109 .974 1.262 Registry(1) –.062 .074 .716 1 .397 .940 .813 1.085 class_ADA(1) .300 .066 20.831 1 .000 1.350 1.187 1.536 pharmacy_satellite(1) .397 .064 38.906 1 .000 1.487 1.313 1.684 Constant –1.803 .248 52.967 1 .000 .165
a Variable(s) entered on step 1: Genderdummy, insdummy, Racedummy, age, OP_3cat, OP_3cat * age, Racedummy * age, Genderdummy * age, specdiab_clinic, registry, class_ADA, pharmacy_satellite.

28
NOTES
1 M. Regenstein and J. Shearer, NAPH Ambulatory Care Sourcebook: Findings from the 2001
NAPH Ambulatory Care Survey (Washington, D.C.: National Association of Public Hospitals and Health Systems, October 2001).
2 National Institute of Diabetes and Digestive and Kidney Diseases, National Diabetes Information Clearinghouse, National Diabetes Statistics, NIH Publication No. 04-3892, April 2004; J. P. Boyle, A. A. Honeycutt, K. M. Narayan et al., “Projection of Diabetes Burden Through 2050: Impact of Changing Demography and Disease Prevalence in the U.S.,” Diabetes Care 24 (November 2001): 1936–40.
3 J. W. Lucas, J. S. Schiller, and V. Benson, “Summary Health Statistics for U.S. Adults: National Health Interview Survey, 2001,” Vital and Health Statistics 10 (January 2004): 1–134, Tables 7, 8.
4 San Francisco General Hospital (SFGH) is part of the Community Health Network of San Francisco.
5 Four consortium hospitals systems participated in a telephone survey of a stratified random sample of patients to determine patient perceptions related to quality, access, and satisfaction with diabetes care. These findings are reported in a separate report.
6 E. A. Kerr, R. B. Gerzoff, S. L. Krein et al. “Diabetes Care Quality in the Veterans Affairs Health Care System and Commercial Managed Care: The TRIAD Study,” Annals of Internal Medicine 141 (August 17, 2004): 272–81.
7 We excluded patients with fewer than two outpatient visits during the three-year study period, regardless of their use of other services.
8 The size of the patient populations with diabetes varied considerably across the consortium hospitals, from a low of about 3,000 to more than 30,000 patients. We adjusted the hospital data so that all participants would contribute the same weight to the aggregate data. The weighting did not alter the demographic representation of the hospital’s patient population. Without the weighting, the aggregate findings would be skewed by the size of the particular hospital’s diabetes population.
9 The Cook County Bureau of Health Services did not provide data on the race/ethnicity of their patients.
10 Three consortium hospital systems also identified the patient’s primary language for 98 percent or more of their patients. Because only three of the seven systems were able to provide this information, the analyses do not address utilization of services or outcomes by the primary language of the patient.
11 E. H. Wagner, “The Changing Face of Chronic Disease Care,” Curing the System: Stories of Change in Chronic Illness Care (Washington, D.C.: National Coalition on Health Care and the Institute for Healthcare Improvement, 2002).
12 C. Mensing, J. Boucher, M. Cypress et al., “National Standards for Diabetes Self-Management Education. Task Force to Review and Revise the National Standards for Diabetes Self-Management Education Programs,” Diabetes Care 23 (May 2000): 682–89.
13 In 1990, Congress created the Medicaid rebate program to lower the cost of pharmaceuticals reimbursed by state Medicaid agencies. For each brand name outpatient drug covered under the Medicaid plan, the manufacturer of the drug must pay a rebate to Medicaid based on the manufacturer’s “best price” for that drug. When manufacturers began raising their prices, the Medicaid savings achieved through the rebate program were offset by increased government spending on drugs purchased by other federal- and state-supported providers. To correct this

29
situation, Congress enacted Section 340B of the Public Health Service Act in 1992, requiring pharmaceutical manufacturers participating in the Medicaid program to provide discounts on covered outpatient drugs purchased by specified government-supported facilities, called “covered entities,” which serve the nation’s most vulnerable patient populations.
14 Our data did not allow us to draw any conclusions about whether patients at the three hospital systems that were unable to provide this information received these services or to distinguish whether lack of electronic data regarding laboratory results or eye exams was due to patients a) not receiving laboratory or consultative services, b) receiving these services outside of the health system, or c) receiving these services within the health system, but these services not getting entered into the electronic datasets.
15 This is also most likely the case at the Cook County Bureau of Health Services, where approximately 68 percent of outpatient visits are estimated to be made by patients who are black. See Regenstein and Shearer, 2001.
16 I. Singer, L. Davison, J. Tolbert et al., America’s Safety Net Hospitals and Health Systems, 2002. Results of the 2002 Annual NAPH Member Survey (Washington, D.C.: National Association of Public Hospitals and Health Systems, 2004).
17 Patients with fewer than two outpatient visits are likely to be either receiving care from providers in the community other than consortium hospital systems or forgoing care altogether. Because the focus of the study was on the quality of diabetes care within safety net hospitals, we excluded non-users of a threshold level of outpatient care.
18 Native Americans composed less than 1 percent of the sample of patients with diabetes seen at consortium hospital systems. Still, because of the large sample size across the hospitals, information on more than 100 Native Americans was included in the data. Even though these numbers are small, we describe them separately in our findings because there is very limited information on Native Americans in national studies.
19 Kerr et al., “Diabetes Care Quality,” 2004; A. J. Karter, A. Ferrara, J. Y. Liu et al., “Ethnic Disparities in Diabetic Complications in an Insured Population,” Journal of the American Medical Association 287 (May 15, 2002): 2519–27, erratum in Journal of the American Medical Association 288 (July 3, 2002): 46.
20 National survey numbers are reported for patients with HbA1c levels > 9.5, while NPHHI Consortium data, the VA, and managed care population data are reported for patients with HbA1c levels > 9.5.
21 J. B. Saaddine, M. M. Engelgau, G. L. Beckles et al., “A Diabetes Report Card for the United States: Quality of Care in the 1990s,” Annals of Internal Medicine 136 (April 16, 2002): 565–74.
22 Third Report of the National Cholesterol Education Program (NCEP) Expert Panel on: Detection, Evaluation, and Treatment of High Blood Cholesterol in Adults (Adult Treatment Panel III), Executive Summary, NIH Publication No. 01-3670, May 2001; S. M. Grundy, J. I. Cleeman, C. N. Bairey Merz et al., “Implications of Recent Clinical Trials for the National Cholesterol Education Program Adult Treatment Panel III Guidelines,” Circulation 110 (July 13, 2004): 227–39, erratum in Circulation 110 (August 10, 2004): 763.
23 Kerr et al., “Diabetes Care Quality,” 2004. 24 Saaddine et al., “Diabetes Report Card,” 2002; A. F. Brown, R. B. Gerzoff, A. J. Karter et al.,
“Health Behaviors and Quality of Care Among Latinos with Diabetes in Managed Care,” American Journal of Public Health 93 (October 2003): 1694–98; Karter et al., “Ethnic Disparities in Diabetic Complications,” 2002.

30
25 American Diabetes Association, “Standards of Medical Care for Patients with Diabetes
Mellitus,” Diabetes Care 25 (January 2002): 213–29. 26 American Heart Association. “What Are Healthy Levels of Cholesterol?” Downloaded May
17, 2005, from http://www.americanheart.org/presenter.jhtml?identifier=183. 27 Binary Logistic Regression was run in SPSS 13.0. For the purposes of regression analyses,
HbA1c < 7.0% = 1. 28 Limitations of the dataset do not allow for regression models that test all significant hospital
program characteristics in one model. 29 All significant characteristics could not be analyzed simultaneously in the regression model
because of the small number of sites and because the hospital characteristic variables were created based on whether a consortium hospital system offers the program or service. As a result, hospital characteristics are frequently very similar to each other and are confounding.
30 Presence of a special diabetes clinic and use of a diabetes registry were significant predictors of well-controlled diabetes when entered into the model individually. However, in the final model, including all significant characteristics, the effect of special diabetes clinics and use of diabetes registry is not significant.
31 Nagelkerke R-squared < .06 for these factors combined. 32 Wagner, “Changing Face,” 2002. 33 Kerr et al., “Diabetes Care Quality,” 2004. 34 J. D. Piette, T. H. Wagner, M. B. Potter et al., “Health Insurance Status, Cost-Related
Medication Underuse, and Outcomes Among Diabetes Patients in Three Systems of Care,” Medical Care 42 (February 2004): 102–9; A. K. Jha, J. B. Perlin, K. W. Kizer et al., “Effect of the Transformation of the Veterans Affairs Health Care System on the Quality of Care,” New England Journal of Medicine 348 (May 29, 2003): 2218–27.
35 D. Schillinger, K. Grumbach, J. D. Piette et al., “Association of Health Literacy with Diabetes Outcomes,” Journal of the American Medical Association 288 (July 24–31, 2002): 475–82; M. V. Williams, D. W. Baker, R. M. Parker et al., “Relationship of Functional Health Literacy to Patients’ Knowledge of Their Chronic Disease. A Study of Patients with Hypertension and Diabetes,” Archives of Internal Medicine 158 (January 26, 1998): 166–72; Institute of Medicine, Health Literacy: A Prescription to End Confusion (Washington, D.C.: National Academies Press, 2004).
36 S. J. Weiner, M. Laporte, R. I. Abrams et al., “Rationing Access to Care to the Medically Uninsured: The Role of Bureaucratic Front-Line Discretion at Large Healthcare Institutions,” Medical Care 42 (April 2004): 306–12; Piette et al., “Health Insurance Status,” 2004; T. P. O’Toole, J. J. Arbelaez, R. S. Lawrence, and the Baltimore Community Health Consortium, “Medical Debt and Aggressive Debt Restitution Practices: Predatory Billing Among the Urban Poor,” Journal of General Internal Medicine 19 (July 2004): 772–78; M. Heisler, K. M. Langa, E. L. Eby et al., “The Health Effects of Restricting Prescription Medication Use Because of Cost,” Medical Care 42 (July 2004): 626–34.
37 M. Heisler, D. M. Smith, R. A. Hayward et al., “Racial Disparities in Diabetes Care Processes, Outcomes, and Treatment Intensity,” Medical Care 41 (November 2003): 1221–32.
38 A. F. Brown, S. L. Ettner, J. Piette et al., “Socioeconomic Position and Health Among Persons with Diabetes Mellitus: A Conceptual Framework and Review of the Literature,” Epidemiologic Reviews 26 (2004): 63–77; A. J. Karter, “Race and Ethnicity: Vital Constructs for Diabetes Research,” Diabetes Care 26 (July 2003): 2189–93.

31
RELATED PUBLICATIONS
Publications listed below can be found on The Commonwealth Fund’s Web site at
www.cmwf.org.
#810 Providing Language Services in Small Health Care Provider Settings: Examples from the Field (April 2005). Mara Youdelman and Jane Perkins, National Health Law Program. Community health centers and small physician practices can have a particularly difficult time effectively serving patients with limited English proficiency. The authors show how a number of solo practitioners, small group practices, and clinics around the country have found creative methods for meeting the needs of these patients. #821 Cultural Competence and Health Care Disparities: Key Perspectives and Trends (March/April 2005). Joseph R. Betancourt, Alexander R. Green, J. Emilio Carrillo, and Elyse R. Park. Health Affairs, vol. 24, no. 2 (In the Literature summary). The authors report that culturally competent health care—broadly defined as services that are respectful of and responsive to the cultural and linguistic needs of patients—is gaining attention not only as a strategy to reduce racial and ethnic disparities, but as a means of improving health care quality. Cultural competence initiatives may even help control costs by making care more efficient and effective. #818 Creating a State Minority Health Policy Report Card (March/April 2005). Amal Trivedi et al. Health Affairs, vol. 24, no. 2 (In the Literature summary). In the first “report card” to evaluate all 50 states on their progress in addressing disparities in minority health care, the authors found region of the country to be a significant predictor of performance, with high- and low-performing states tending to cluster geographically. #817 Quality Report Cards, Selection of Cardiac Surgeons, and Racial Disparities: A Study of the Publication of the New York State Cardiac Surgery Reports (Winter 2004–05). Dana Mukamel et al. Inquiry, vol. 41, no. 4 (In the Literature summary). According to the authors, quality report cards can work to level the playing field for minorities by improving their ability to see high-quality health providers, in addition to helping consumers make informed health care choices. #709 Addressing Unequal Treatment: Disparities in Health Care (November 2004). Gillian K. SteelFisher. Prepared for the 2004 Commonwealth Fund/John F. Kennedy School of Government Bipartisan Congressional Health Policy Conference, this issue brief reports that health care services in the U.S. have been improving for decades, but in many instances, racial and ethnic minorities receive fewer health care services, lower quality services, and services later in the progression of illness. #779 Policies to Reduce Racial and Ethnic Disparities in Child Health and Health Care (September/ October 2004). Anne C. Beal. Health Affairs, vol. 23, no. 5 (In the Literature summary). The author argues that while a variety of public and private sector programs are taking on the issue of disparities in health care, better coordination and monitoring at the federal level is needed to maximize their effectiveness. #780 R-E-S-P-E-C-T: Patient Reports of Disrespect in the Health Care Setting and Its Impact on Care (September 2004). Janice Blanchard and Nicole Lurie. Journal of Family Practice, vol. 53, no. 9 (In the Literature summary). The authors find that minorities are significantly more likely than whites to report being treated with disrespect or being looked down upon in patient–provider relationships.

32
#756 A Review of the Quality of Health Care for American Indians and Alaska Natives (September 2004). Yvette Roubideaux. The author documents health care disparities for American Indians and Alaska Natives (AIANs) and reports on progress made in the last five years to reduce or eliminate gaps in care. In examining the demographics of this group, she notes in particular a substantial urban AIAN population that is both understudied and which may be underserved by the traditional AIAN health care infrastructure. #755 Child Health Disparities: Framing a Research Agenda (July/August 2004). Ivor B. Horn and Anne C. Beal. Ambulatory Pediatrics, vol. 4, no. 4 (In the Literature summary). In this article, the authors set forth a research framework for identifying racial disparities in children’s health, determining their root causes, and developing effective interventions. They emphasize preventive care, culture, and language, and the social determinants of health, including housing, nutrition, and stress factors prevalent in low-income communities. #770 Explaining Disparities in Access to High Quality Cardiac Surgeons (July 2004). Barbara M. Rothenberg, Thomas Pearson, Jack Zwanziger, and Dana Mukamel. Annals of Thoracic Surgery, vol. 78 (In the Literature summary). This study of cardiac patients in New York State finds that African Americans and Asian/Pacific Islanders who underwent coronary artery bypass graft surgery were treated by lower-quality surgeons than whites. According to the authors, physician referral patterns may be important determinants of where minorities received treatment. #761 Hospital Quality: Ingredients for Success—Overview and Lessons Learned (July 2004). Jack A. Meyer, Sharon Silow-Carroll, Todd Kutyla, Larry S. Stepnick, and Lise S. Rybowski. This research study identifies and describes the key factors that contributed to the success of four high-performing hospitals across the country. Essential elements of a successful strategy, according to the authors, include developing the right culture, attracting and retaining the right people, devising and updating the right in-house processes, and giving staff the right tools to do the job. #753 Disparities in Patient Experiences, Health Care Processes, and Outcomes: The Role of Patient–Provider Racial, Ethnic, and Language Concordance (July 2004). Lisa A. Cooper and Neil R. Powe. According to the authors, patients treated by doctors of the same racial or ethnic background generally experience greater satisfaction with their care and, in many cases, better outcomes, a new report concludes. The findings highlight the need for greater minority representation within the health care workforce. #746 A State Policy Agenda to Eliminate Racial and Ethnic Health Disparities (June 2004). John E. McDonough, Brian K. Gibbs, Janet L. Scott-Harris, Karl Kronebusch, Amanda M. Navarro, and Kimá Taylor. The authors of this report detail a wide range of state initiatives to reduce racial and ethnic disparities in health and health care, along with practical strategies for improving insurance coverage, access to care, and medical outcomes for minority Americans. #726 Who, When, and How: The Current State of Race, Ethnicity, and Primary Language Data Collection in Hospitals (May 2004). Romana Hasnain-Wynia, Debra Pierce, and Mary A. Pittman. The authors of this study find that, although the majority of hospitals are now collecting information on patients’ race, ethnicity, and primary language, many say there are drawbacks, including problems with accuracy and confidentiality. The authors recommend standardizing the data collection process—relying on patients to provide information and giving them a uniform rationale for doing so.