Embed Size (px)
Citation preview
Everglades Division, SFWMD
EvergladesEvergladesLandscapeLandscape
ModelModel
Status of theEverglades Landscape Model
Carl FitzNaiming WangJason Godin
Fred Sklar & othersin the
Everglades Division
Aug 7, 2002
http://www.sfwmd.gov/org/wrp/elm
Everglades Division, SFWMD http://www.sfwmd.gov/org/wrp/elm
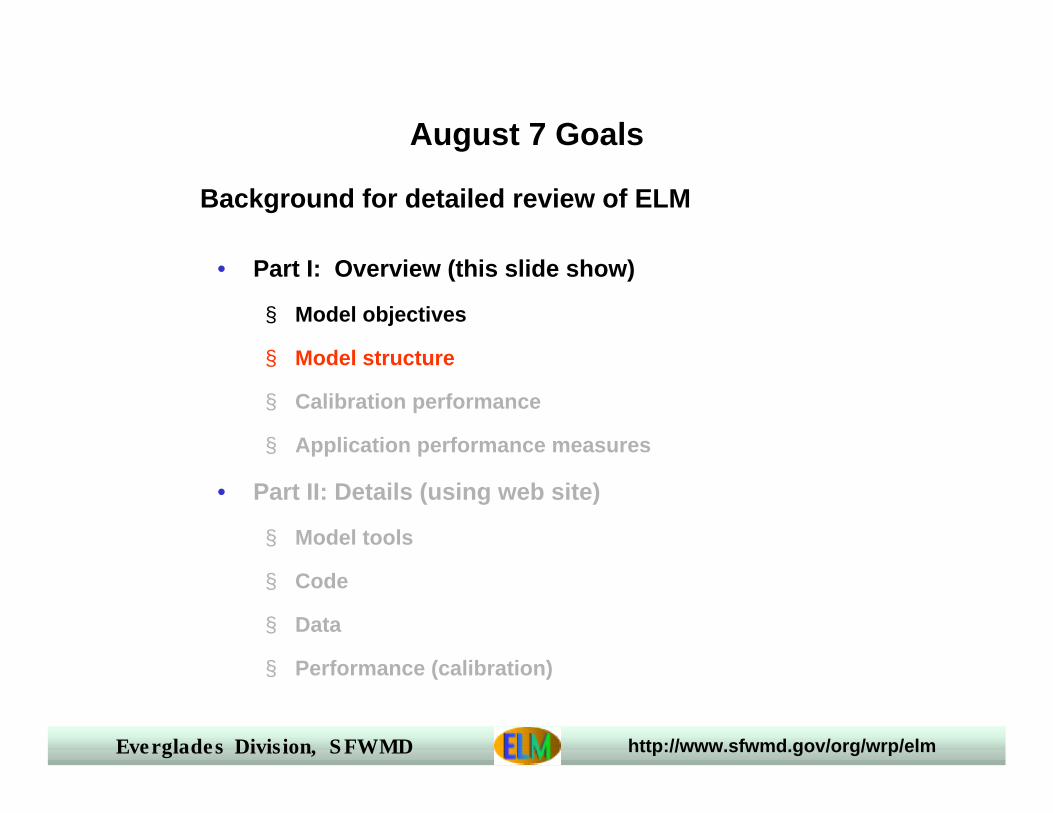
August 7 Goals
• Part I: Overview (this slide show)
§ Model objectives
§ Model structure
§ Calibration performance
§ Application performance measures
• Part II: Details (using web site)
§ Model tools
§ Code
§ Data
§ Performance (calibration)
Background for detailed review of ELM
• Part I: Overview (this slide show)
§ Model objectives
§ Model structure
§ Calibration performance
§ Application performance measures
• Part II: Details (using web site)
§ Model tools
§ Code
§ Data
§ Performance (calibration)
Everglades Division, SFWMD http://www.sfwmd.gov/org/wrp/elm
Everglades Landscape Model(ELM) Objectives
• Understand ecosystem dynamics at regional scale
• Develop predictions of landscape response to altered water &
nutrient management
• One tool to aid in Everglades restoration
Integrate hydrology, biology and nutrient cycling in spatially
explicit simulation
Everglades Division, SFWMD http://www.sfwmd.gov/org/wrp/elm
August 7 Goals
• Part I: Overview (this slide show)
§ Model objectives
§ Model structure
§ Calibration performance
§ Application performance measures
• Part II: Details (using web site)
§ Model tools
§ Code
§ Data
§ Performance (calibration)
Background for detailed review of ELM
Everglades Division, SFWMD http://www.sfwmd.gov/org/wrp/elm
Everglades"response"
Hydrology
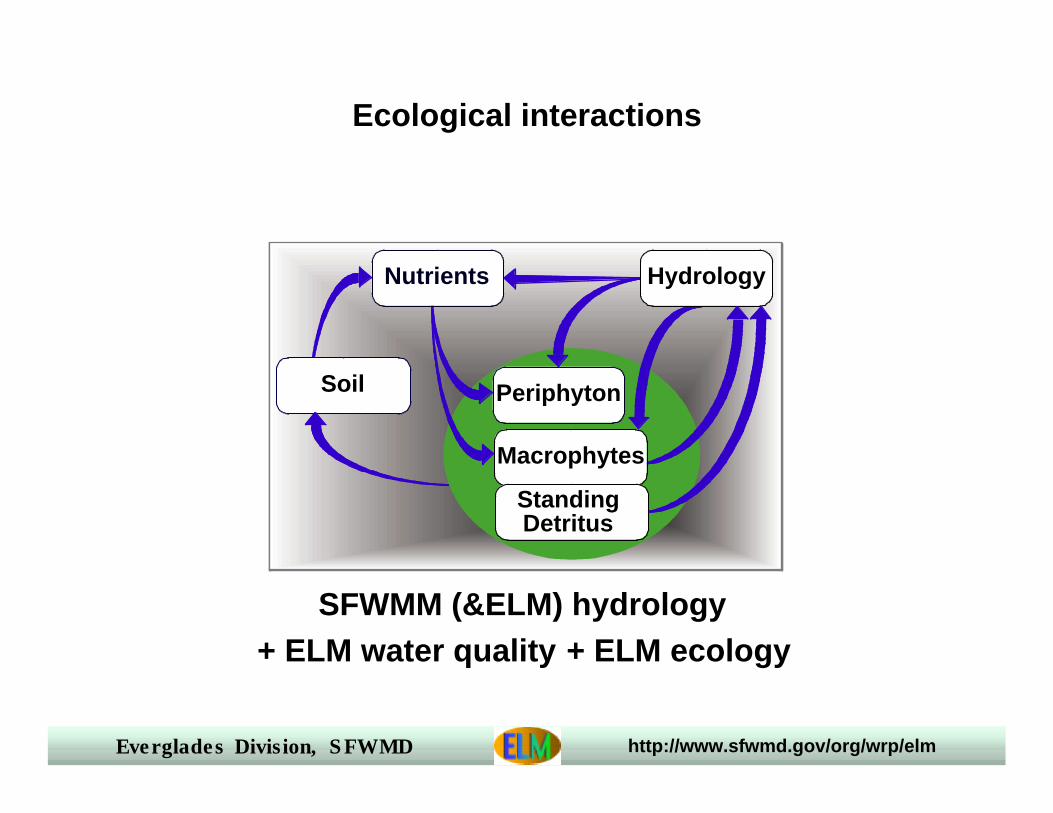
Ecological interactions
SFWMM (&ELM) hydrology
Everglades"response"
HydrologyNutrients
+ ELM water quality
Periphyton
Macrophytes
Nutrients Hydrology
Soil
StandingDetritus
+ ELM ecology
Everglades Division, SFWMD http://www.sfwmd.gov/org/wrp/elm
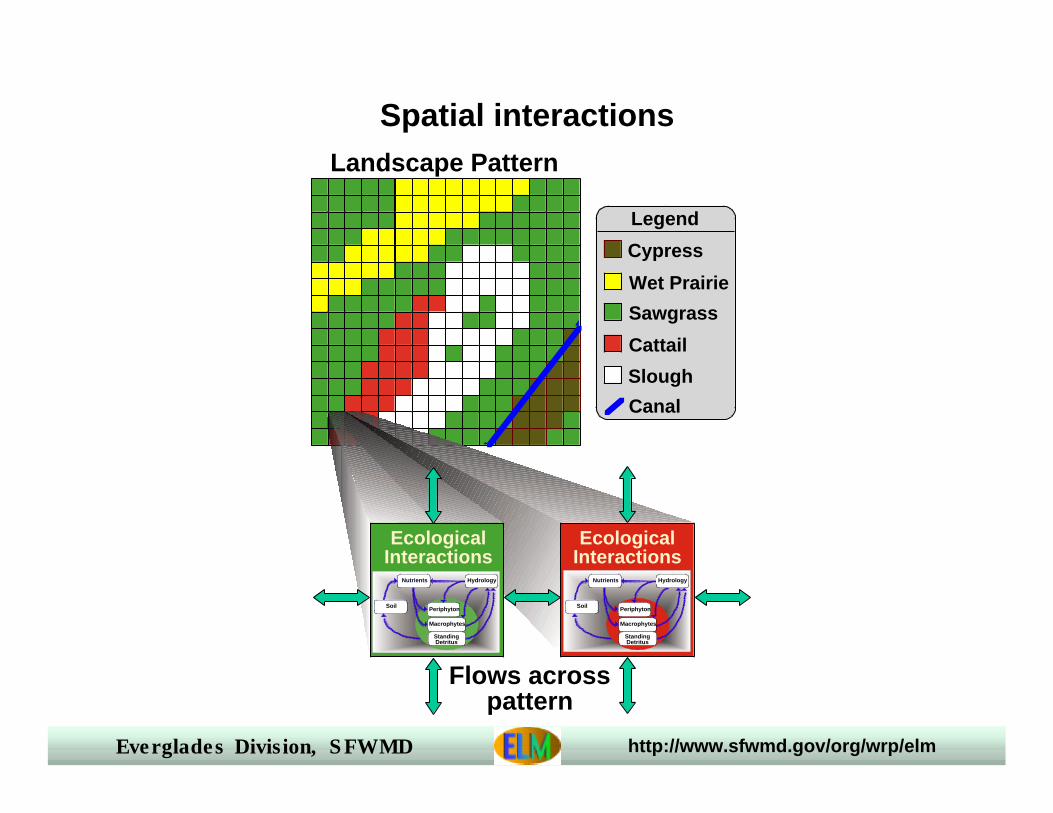
Landscape Pattern
EcologicalInteractions
Flows acrosspattern
Cypress
Wet Prairie
Sawgrass
Cattail
Slough
Canal
Legend
EcologicalInteractions
Periphyton
Macrophytes
Nutrients Hydrology
Soil
StandingDetritus
Periphyton
Macrophytes
Nutrients Hydrology
Soil
StandingDetritus
Spatial interactions
Everglades Division, SFWMD http://www.sfwmd.gov/org/wrp/elm
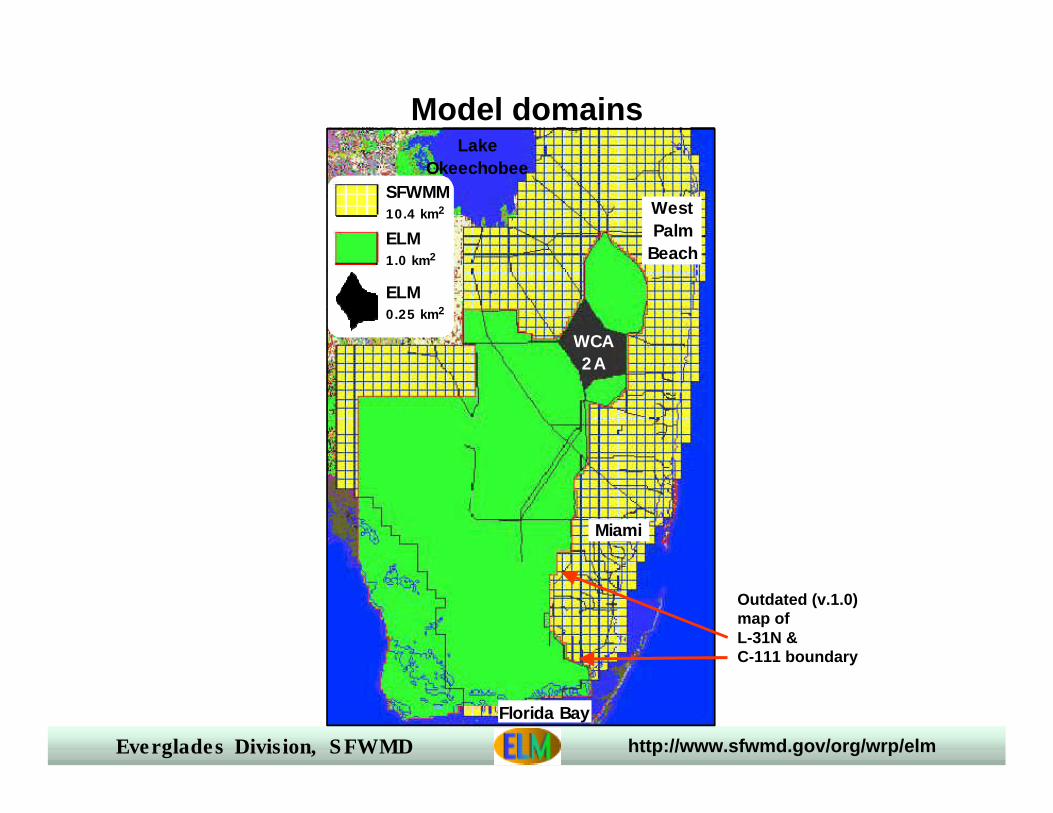
WestPalmBeach
Miami
SFWMM10.4 km2
ELM1.0 km2
ELM0.25 km2
Florida Bay
LakeOkeechobee
WCA2A
Model domains
Outdated (v.1.0)map ofL-31N &C-111 boundary
Everglades Division, SFWMD http://www.sfwmd.gov/org/wrp/elm
Model Structure
• Flows:
§ Spatial: similar in general algorithmic structure to SFWMM
§ Incorporate explicit feedbacks and altered canal network/scales
• Ecology
§ 13 physical, chemical, biological modules; selectable at runtime
• Utilities
§ Water, phosphorus budgets
§ Summary stats
Integrated spatial and non-spatial modules of hydrology,
biology and nutrient cycling
Everglades Division, SFWMD http://www.sfwmd.gov/org/wrp/elm
Hydrologic data
• Data shared with SFWMM§ Elevation: filtered from 10 to 1 km2 resolution§ Hydraulic conductivity: filtered to 1 km,§ Rainfall: direct application of 2x2 mi daily data§ Other meteorological: dynamic interpolation of cloud, dew pt,
etc
• Canal/levee vectors managed in GIS using precisecoordinates
• Water control structure attributes managed in relationaldatabase
Everglades Division, SFWMD http://www.sfwmd.gov/org/wrp/elm
Hydrologic modules
• Vertical solutions (1 day time step)§ ET from evap model, solar rad model, daily data on temp,
dewPt, cloud, wind; variable LAI§ Rainfall directly from daily spatial time series from SFWMM§ 3 layers: infiltration, percolation, upflow
Everglades Division, SFWMD http://www.sfwmd.gov/org/wrp/elm
Hydrologic modules (con’t)
• Horizontal solutions (explicit, 2 hr. step)§ Overland: finite difference, Manning’s equation, ADE§ Groundwater: finite difference, simple Darcy’s, ADE§ Surface-groundwater interaction: every time step, solve for
available storages
Everglades Division, SFWMD http://www.sfwmd.gov/org/wrp/elm
Hydrologic modules (more)
• Water management network ( 2 hr step)§ Canal reaches: mass balance, iterative solution as in SFWMM§ Water control structs: daily flows for all structures, from
observations or SFWMM
Everglades Division, SFWMD http://www.sfwmd.gov/org/wrp/elm
Hydrologic modules (con’t)
• Mass balance and budget§ Basin & domain-wide budgets & error-checks
• Post-processing§ Consistency checks with SFWMM (maps and budgets, stage
hydrographs)
Everglades Division, SFWMD http://www.sfwmd.gov/org/wrp/elm
Phosphorus modules
• Overland, groundwater, and canal transport flows• Choice 1: Strict net settling rate module (poor performance,
unused)• Choice 2: Ecological dynamics
§ P uptake, mineralization, particulate settling§ Periphyton, macrophytes, soil dynamics§ Surface water - soil interactions
Everglades Division, SFWMD http://www.sfwmd.gov/org/wrp/elm
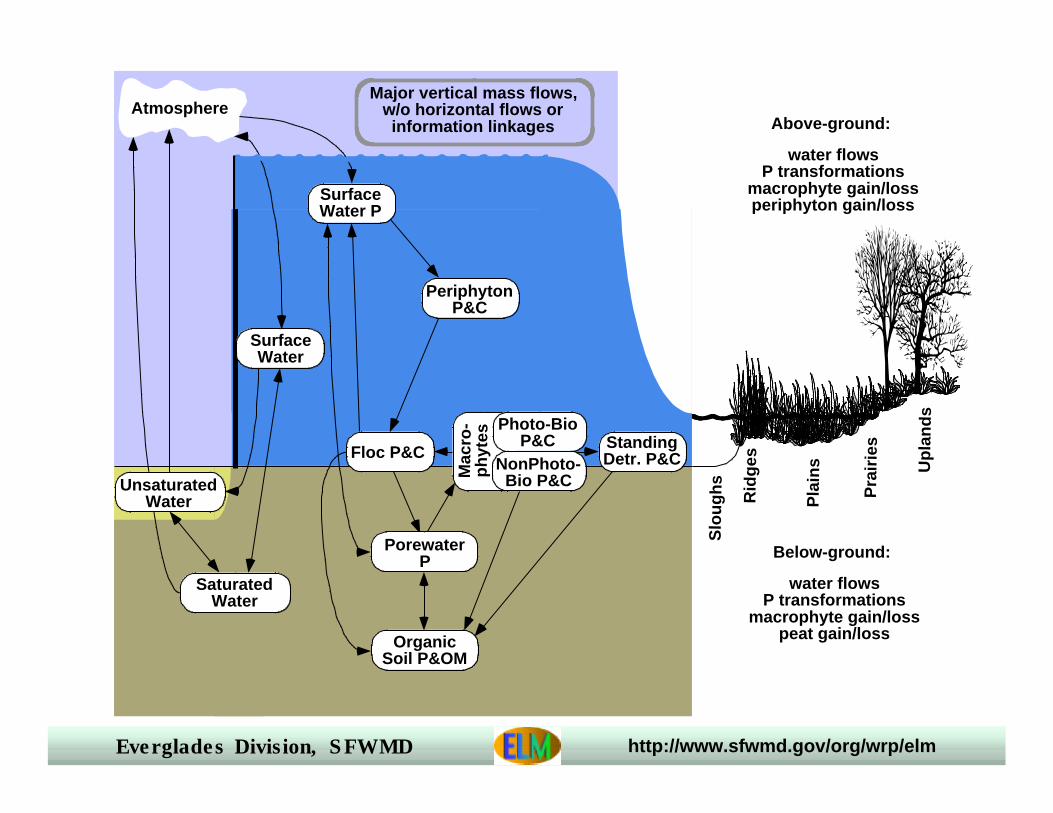
Slo
ug
hs
Rid
ges
Pra
irie
s
Up
lan
ds
Pla
ins
Below-ground:
water flowsP transformations
macrophyte gain/losspeat gain/loss
Above-ground:
water flowsP transformations
macrophyte gain/lossperiphyton gain/loss
Major vertical mass flows,w/o horizontal flows orinformation linkages
Atmosphere
SaturatedWater
OrganicSoil P&OM
PorewaterP
Floc P&C
UnsaturatedWater
SurfaceWater
Mac
ro-
ph
ytes
NonPhoto-Bio P&C
Photo-BioP&C Standing
Detr. P&C
PeriphytonP&C
SurfaceWater P
Everglades Division, SFWMD http://www.sfwmd.gov/org/wrp/elm
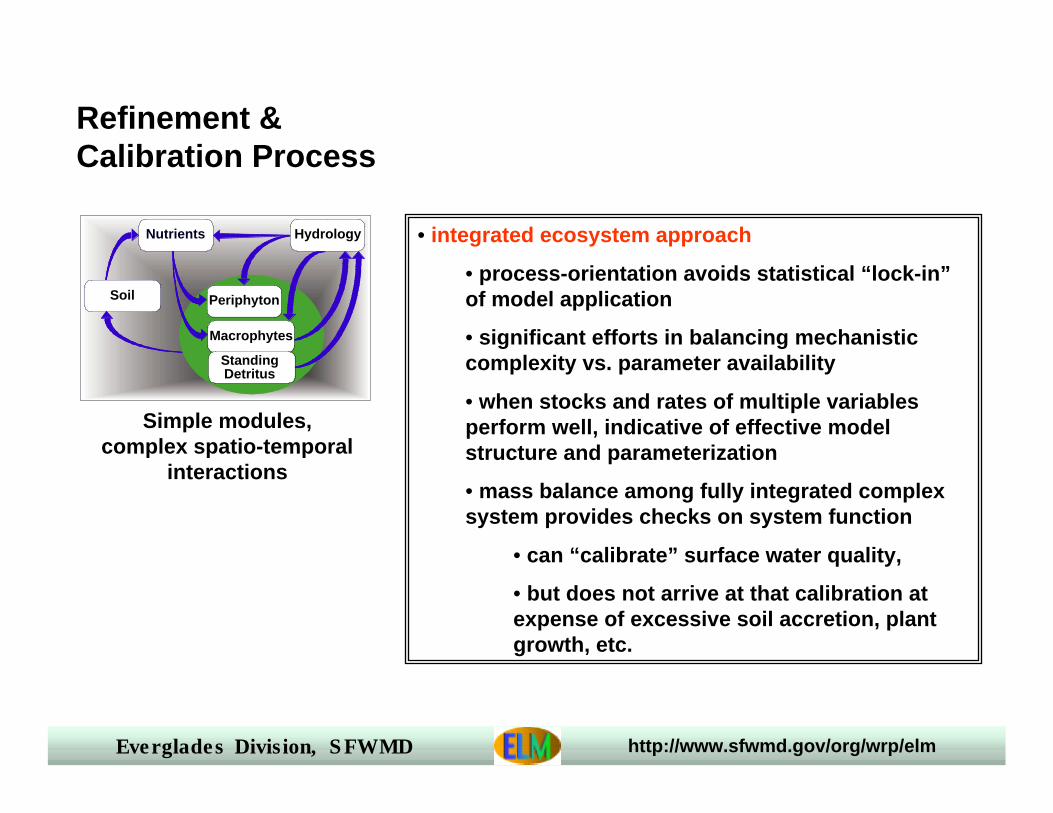
Periphyton
Macrophytes
Nutrients Hydrology
Soil
StandingDetritus
• integrated ecosystem approach
• process-orientation avoids statistical “lock-in”of model application
• significant efforts in balancing mechanisticcomplexity vs. parameter availability
• when stocks and rates of multiple variablesperform well, indicative of effective modelstructure and parameterization
• mass balance among fully integrated complexsystem provides checks on system function
• can “calibrate” surface water quality,
• but does not arrive at that calibration atexpense of excessive soil accretion, plantgrowth, etc.
Refinement &Calibration Process
Simple modules,complex spatio-temporal
interactions
Everglades Division, SFWMD http://www.sfwmd.gov/org/wrp/elm
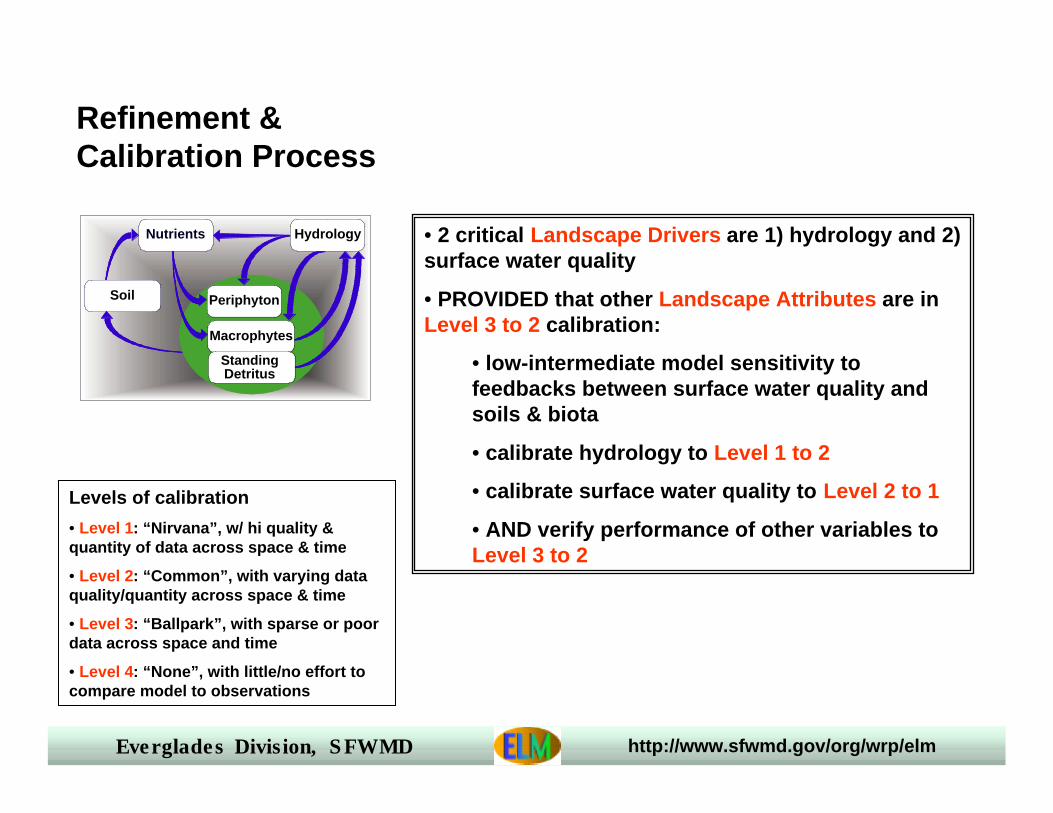
Periphyton
Macrophytes
Nutrients Hydrology
Soil
StandingDetritus
• 2 critical Landscape Drivers are 1) hydrology and 2)surface water quality
• PROVIDED that other Landscape Attributes are inLevel 3 to 2 calibration:
• low-intermediate model sensitivity tofeedbacks between surface water quality andsoils & biota
• calibrate hydrology to Level 1 to 2
• calibrate surface water quality to Level 2 to 1
• AND verify performance of other variables toLevel 3 to 2
Refinement &Calibration Process
Levels of calibration
• Level 1: “Nirvana”, w/ hi quality &quantity of data across space & time
• Level 2: “Common”, with varying dataquality/quantity across space & time
• Level 3: “Ballpark”, with sparse or poordata across space and time
• Level 4: “None”, with little/no effort tocompare model to observations
Everglades Division, SFWMD http://www.sfwmd.gov/org/wrp/elm
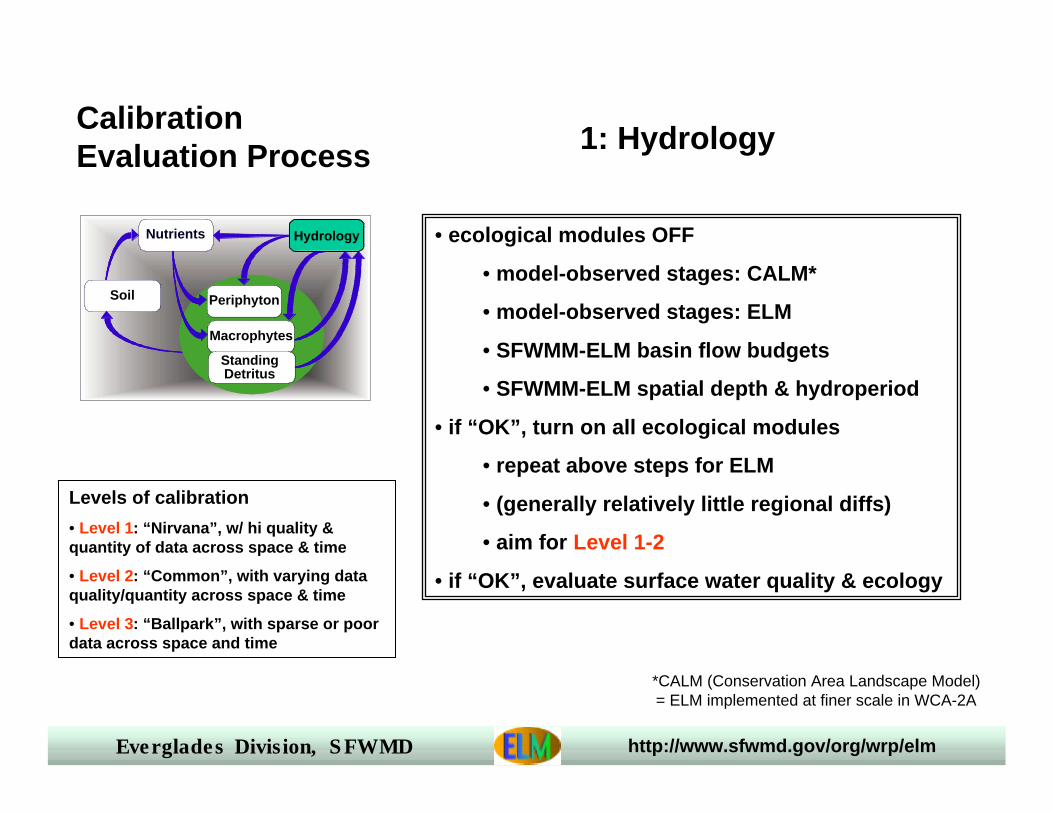
Periphyton
Macrophytes
Nutrients Hydrology
Soil
StandingDetritus
• ecological modules OFF
• model-observed stages: CALM*
• model-observed stages: ELM
• SFWMM-ELM basin flow budgets
• SFWMM-ELM spatial depth & hydroperiod
• if “OK”, turn on all ecological modules
• repeat above steps for ELM
• (generally relatively little regional diffs)
• aim for Level 1-2
• if “OK”, evaluate surface water quality & ecology
CalibrationEvaluation Process
Hydrology
1: Hydrology
*CALM (Conservation Area Landscape Model)= ELM implemented at finer scale in WCA-2A
Levels of calibration
• Level 1: “Nirvana”, w/ hi quality &quantity of data across space & time
• Level 2: “Common”, with varying dataquality/quantity across space & time
• Level 3: “Ballpark”, with sparse or poordata across space and time
Everglades Division, SFWMD http://www.sfwmd.gov/org/wrp/elm
Periphyton
Macrophytes
Nutrients Hydrology
Soil
StandingDetritus
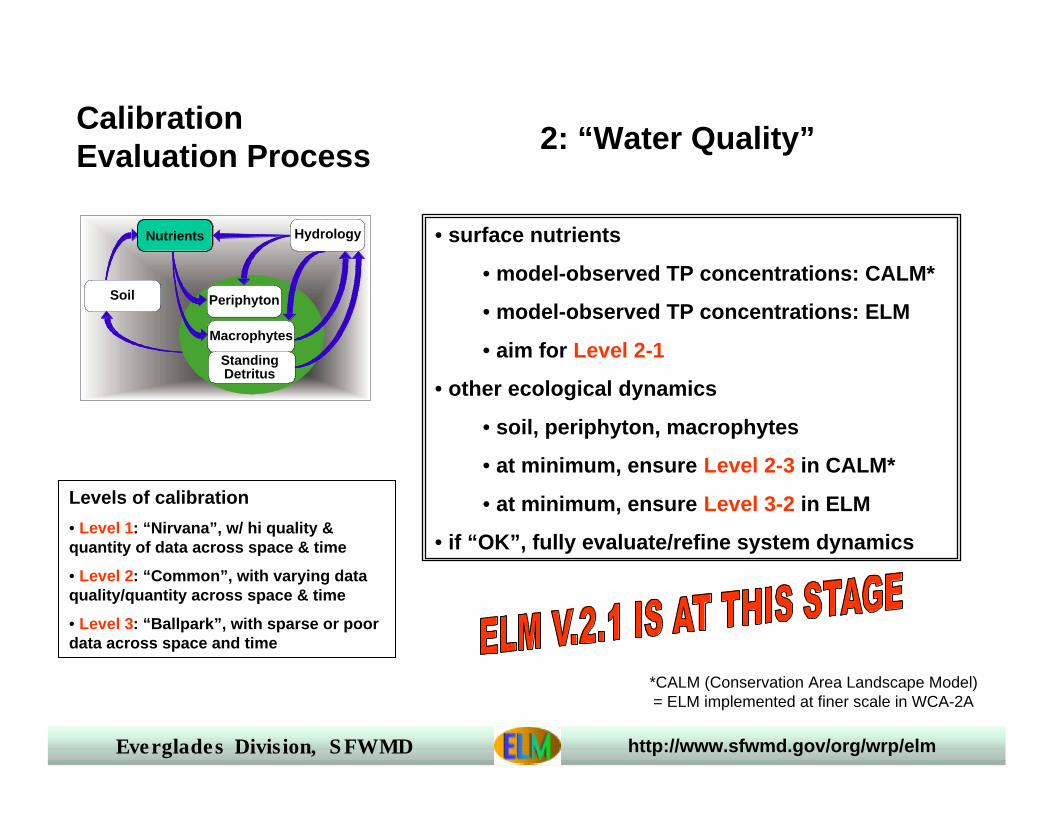
• surface nutrients
• model-observed TP concentrations: CALM*
• model-observed TP concentrations: ELM
• aim for Level 2-1
• other ecological dynamics
• soil, periphyton, macrophytes
• at minimum, ensure Level 2-3 in CALM*
• at minimum, ensure Level 3-2 in ELM
• if “OK”, fully evaluate/refine system dynamics
CalibrationEvaluation Process 2: “Water Quality”
*CALM (Conservation Area Landscape Model)= ELM implemented at finer scale in WCA-2A
Levels of calibration
• Level 1: “Nirvana”, w/ hi quality &quantity of data across space & time
• Level 2: “Common”, with varying dataquality/quantity across space & time
• Level 3: “Ballpark”, with sparse or poordata across space and time
Nutrients
Everglades Division, SFWMD http://www.sfwmd.gov/org/wrp/elm
August 7 Goals
• Part I: Overview (this slide show)
§ Model objectives
§ Model structure
§ Calibration performance
§ Application performance measures
• Part II: Details (using web site)
§ Model tools
§ Code
§ Data
§ Performance (calibration)
Background for detailed review of ELM
Everglades Division, SFWMD http://www.sfwmd.gov/org/wrp/elm
Start out “small”...
ELM is scalable in spatial grain and extent
Everglades Division, SFWMD http://www.sfwmd.gov/org/wrp/elm
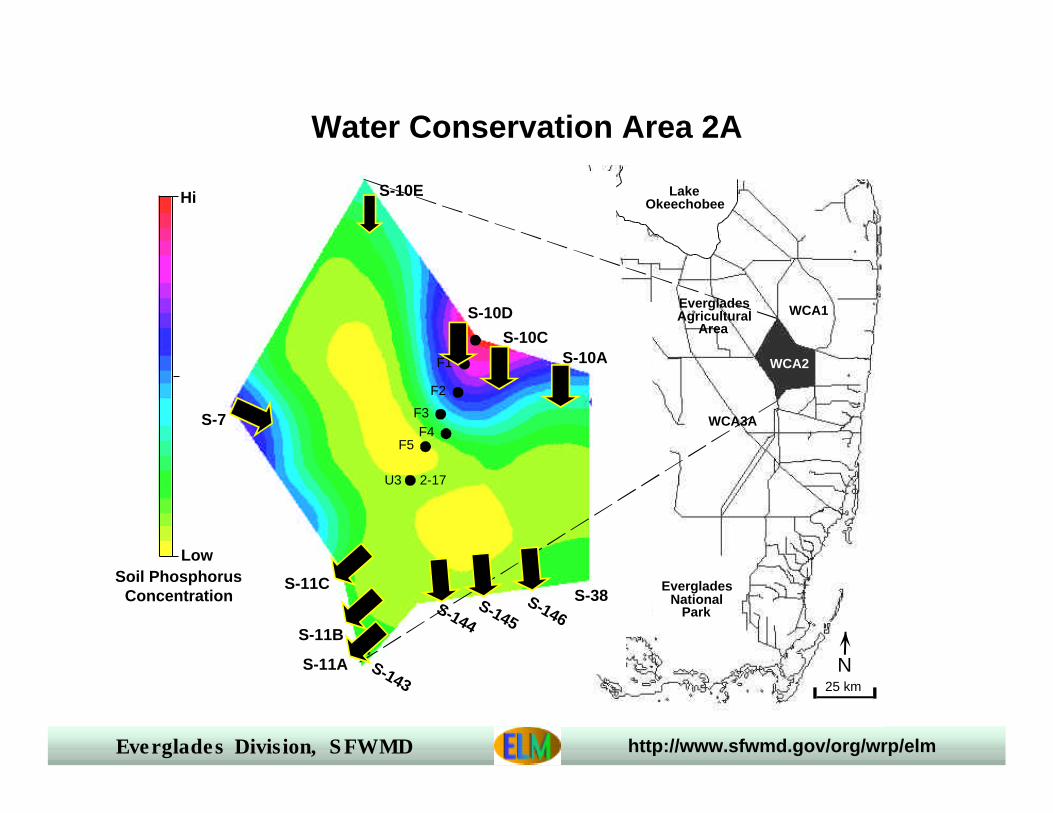
WCA1
WCA2
WCA3A
EvergladesAgricultural
Area
EvergladesNational
Park
Hi
25 km
LakeOkeechobee
N
S-10D
S-10CS-10A
S-7
S-10E
F0
U3
F1
F4F5
2-17
F3
F2
Water Conservation Area 2A
S-146S-145
S-144
S-38S-11C
S-11B
S-11A S-143
LowSoil Phosphorus
Concentration
Everglades Division, SFWMD http://www.sfwmd.gov/org/wrp/elm
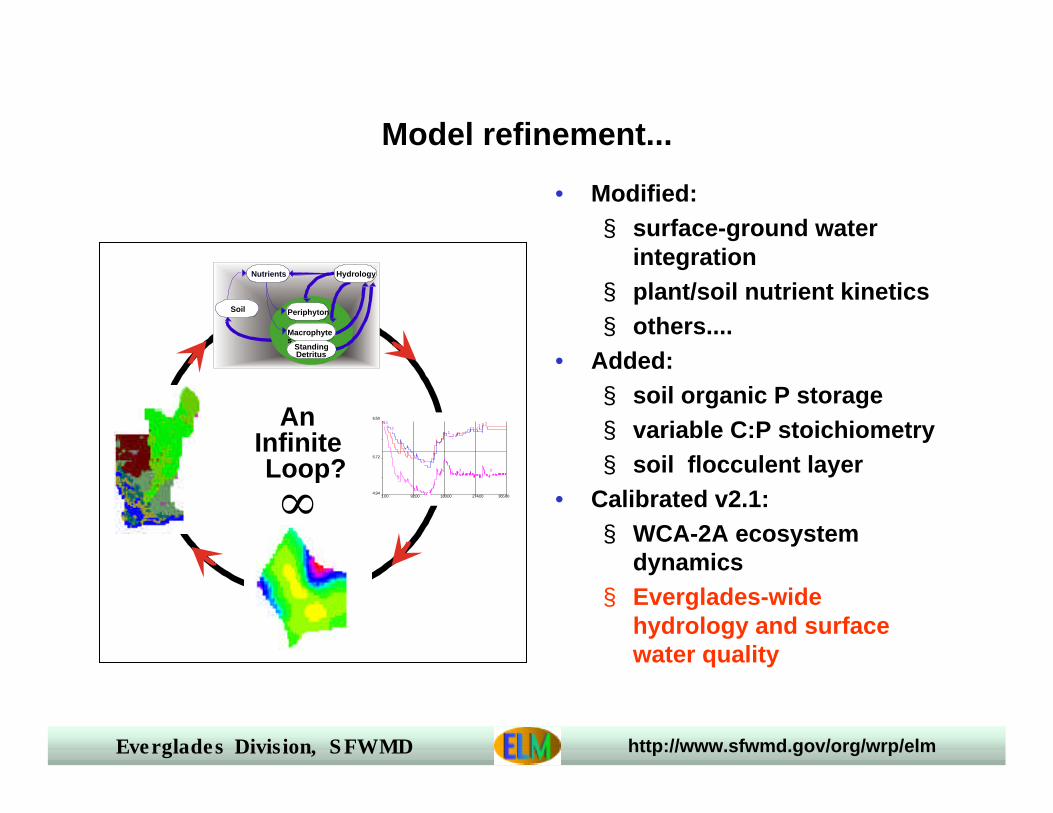
Model refinement...
1.00 92.00 183.00 274.00 365.004.94
5.72
6.501
1
1
12
2
2
2
3
3
3 3
Periphyton
Macrophytes
Nutrients Hydrology
Soil
StandingDetritus
AnInfiniteLoop?
• Modified:§ surface-ground water
integration§ plant/soil nutrient kinetics§ others....
• Added:§ soil organic P storage§ variable C:P stoichiometry§ soil flocculent layer
• Calibrated v2.1:§ WCA-2A ecosystem
dynamics§ Everglades-wide
hydrology and surfacewater quality
Everglades Division, SFWMD http://www.sfwmd.gov/org/wrp/elm
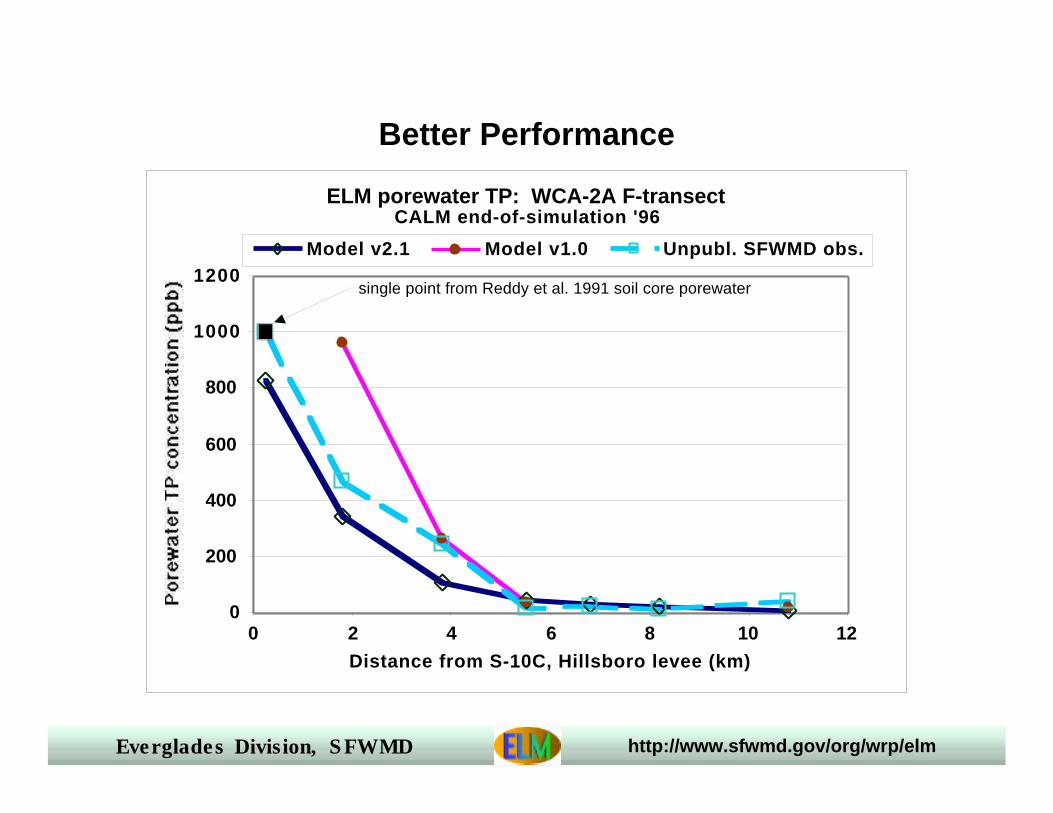
Better Performance
ELM porewater TP: WCA-2A F-transectCALM end-of-simulation '96
0
200
400
600
800
1000
1200
0 2 4 6 8 10 12
Distance from S-10C, Hillsboro levee (km)
Model v2.1 Model v1.0 Unpubl. SFWMD obs.
single point from Reddy et al. 1991 soil core porewater
Everglades Division, SFWMD http://www.sfwmd.gov/org/wrp/elm
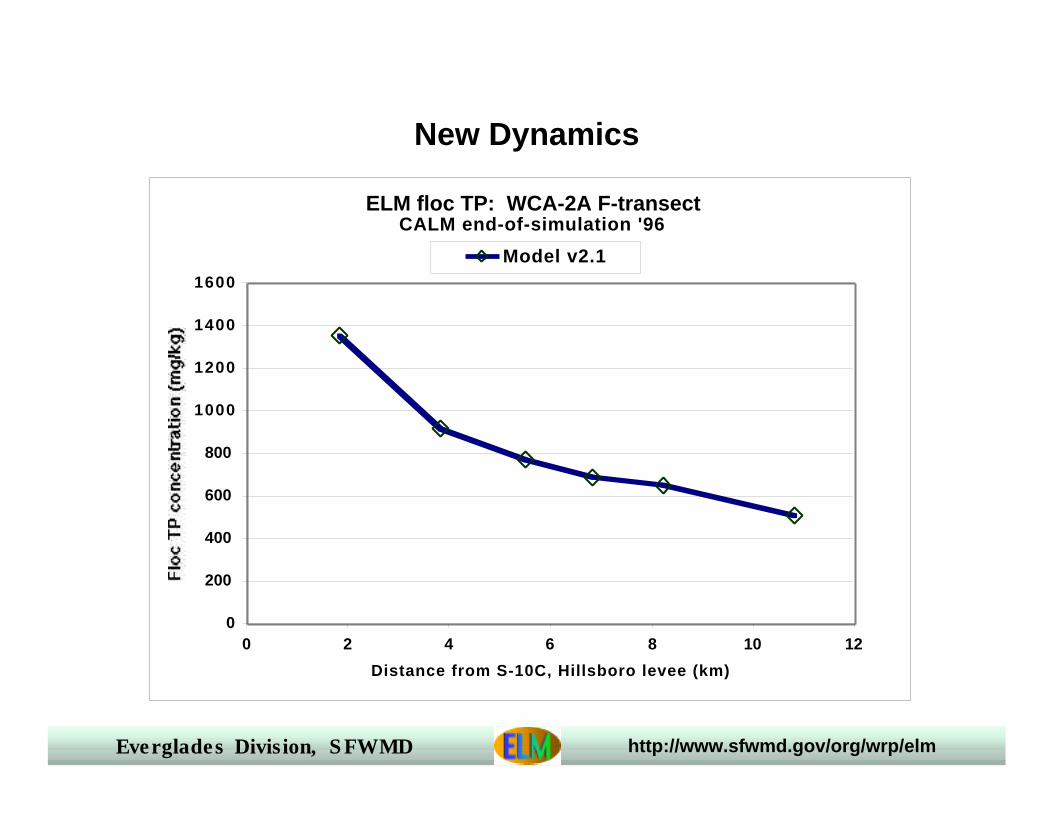
New Dynamics
ELM floc TP: WCA-2A F-transectCALM end-of-simulation '96
0
200
400
600
800
1000
1200
1400
1600
0 2 4 6 8 10 12
Distance from S-10C, Hillsboro levee (km)
Model v2.1
Everglades Division, SFWMD http://www.sfwmd.gov/org/wrp/elm
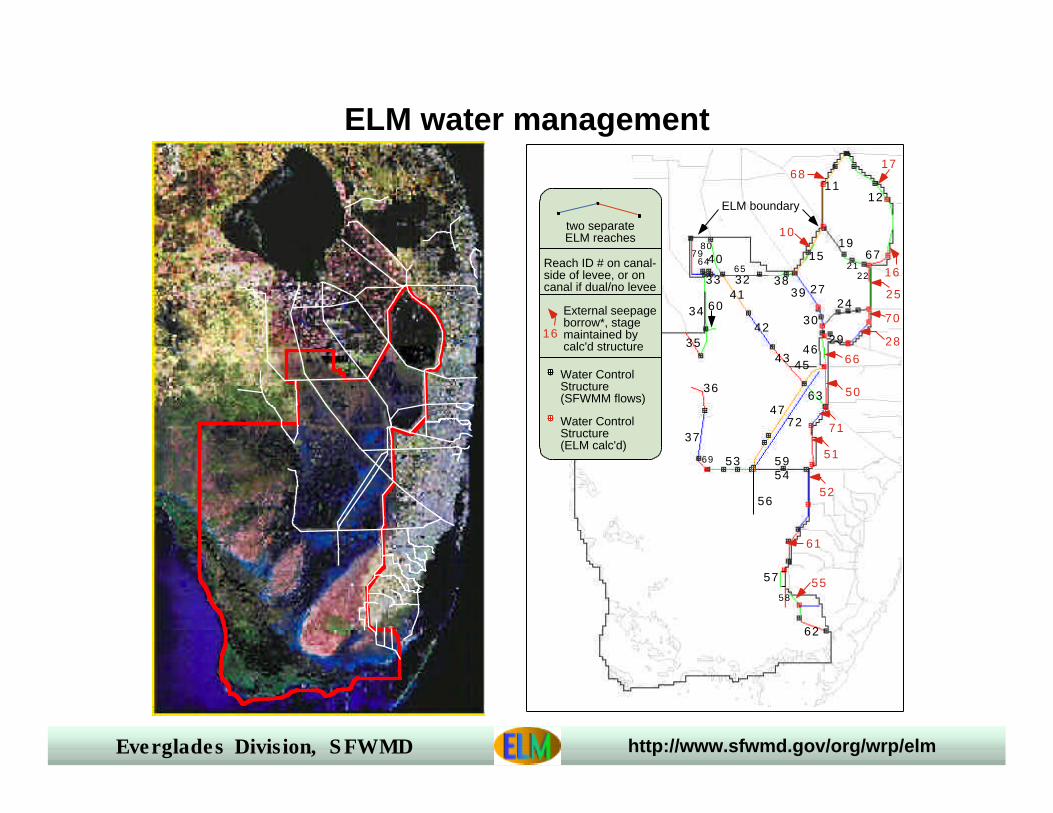
ELM water management
40
41
42
43 45
4772
63
4666
29 28
70
2221
1915
10
25
16
1768
1112
67
2724
50
71
51
52
5369
37
36
35
34
33
646532 38
39
30
5954
60
Reach ID # on canal-side of levee, or oncanal if dual/no levee
ELM boundary
57
5855
61
62
8079
two separateELM reaches
External seepageborrow*, stagemaintained bycalc'd structure
16
Water ControlStructure(SFWMM flows)
Water ControlStructure(ELM calc'd)
56
Everglades Division, SFWMD http://www.sfwmd.gov/org/wrp/elm
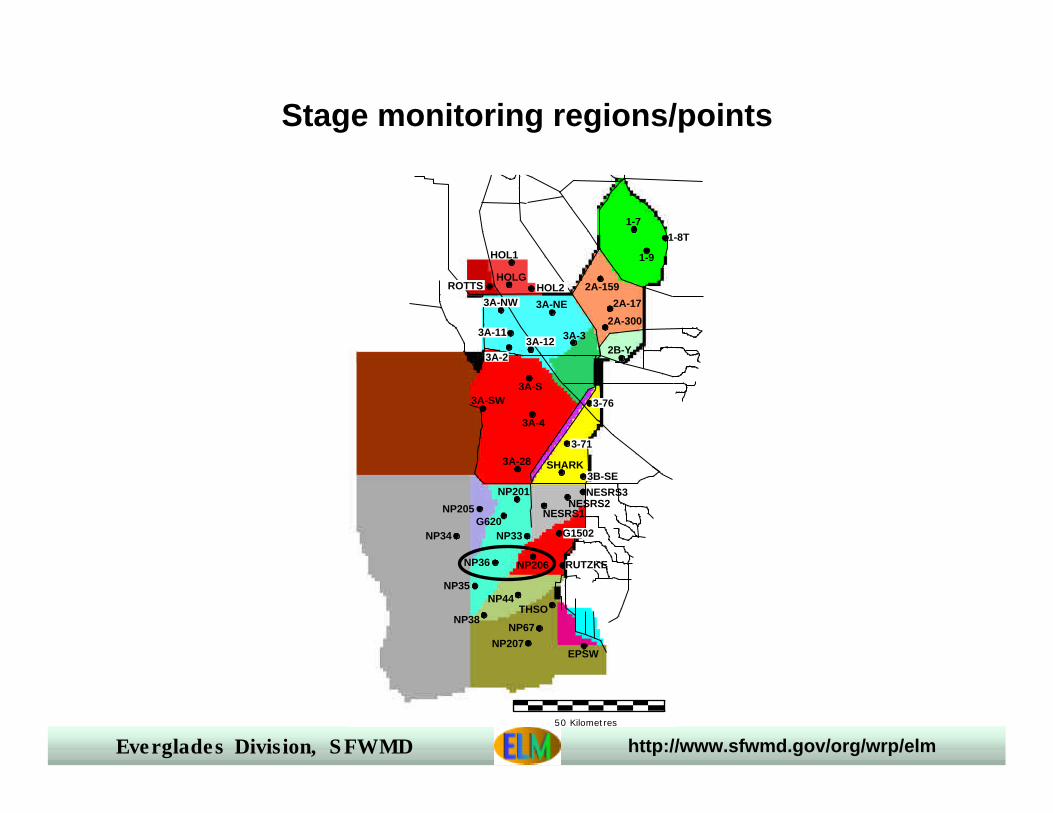
Stage monitoring regions/points
50 Kilometres
NESRS3NESRS2
NESRS1
G1502
RUTZKE
EPSWNP207
NP67
THSO
NP201
G620NP205
NP34 NP33
NP206NP36
NP35NP44
NP38
3A-28
3A-4
3B-SE
3-71
3-763A-SW3A-S
3A-NE
3A-11
3A-2
3A-12 3A-3
3A-NW
1-7
1-9
1-8T
2A-159
2A-17
2A-300
2B-Y
ROTTSHOLG
HOL1
HOL2
SHARK
Everglades Division, SFWMD http://www.sfwmd.gov/org/wrp/elm
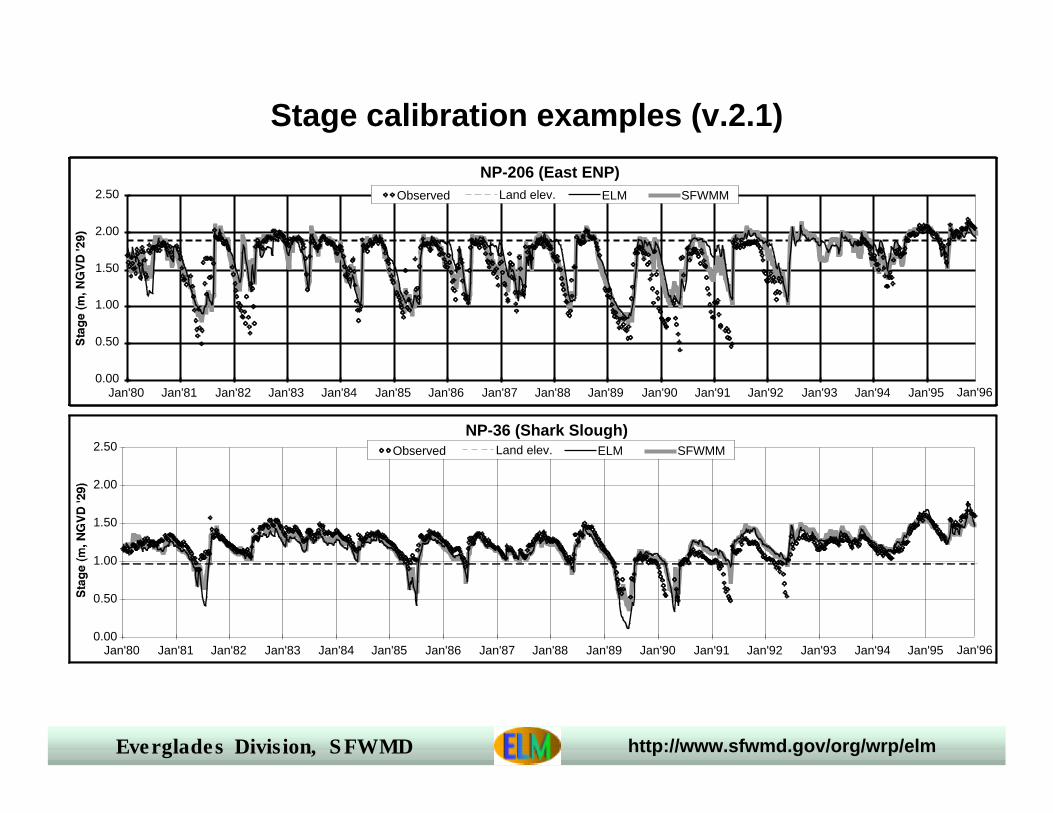
Stage calibration examples (v.2.1)
NP-206 (East ENP)
0.00
0.50
1.00
1.50
2.00
2.50
Jan'80 Jan'81 Jan'82 Jan'83 Jan'84 Jan'85 Jan'86 Jan'87 Jan'88 Jan'89 Jan'90 Jan'91 Jan'92 Jan'93 Jan'94 Jan'95
Observed Land elev. ELM SFWMM
NP-36 (Shark Slough)
0.00
0.50
1.00
1.50
2.00
2.50
Jan'80 Jan'81 Jan'82 Jan'83 Jan'84 Jan'85 Jan'86 Jan'87 Jan'88 Jan'89 Jan'90 Jan'91 Jan'92 Jan'93 Jan'94 Jan'95
Jan'96
Jan'96
Observed Land elev. ELM SFWMM
Everglades Division, SFWMD http://www.sfwmd.gov/org/wrp/elm
NESRS1
EPP37
TSB
NP34 NP33
NP36
NP35
S31
3
S12-A-DS333
CA315
S9
S151
CA311L28I
CA38
C123SR84
CA34
CA36
S140 S144-6
CA32
S11A-C
G204-6
G155CA35
CA33
S10A-D
S5
L7L40
5
9 87 6
14
111312
15 16
S6
4
10
S332
S18C
S8 S150
LOX3-16
COOPER.
50 Kilometres
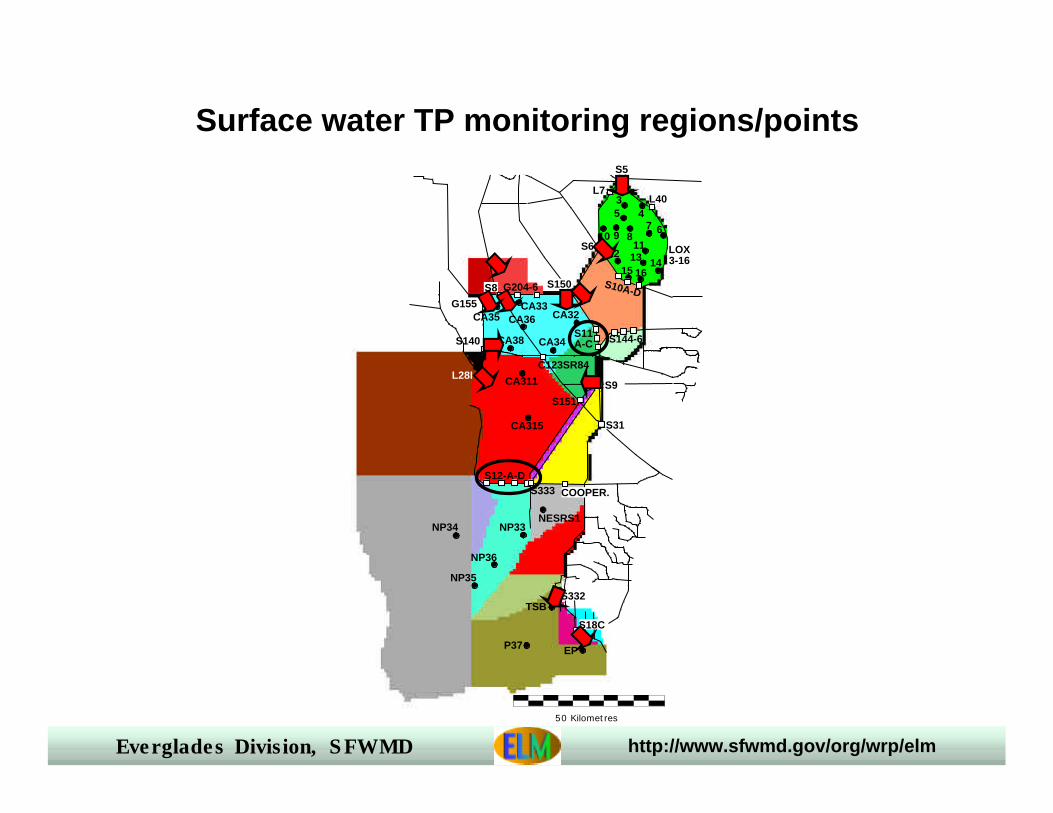
Surface water TP monitoring regions/points
S7
Everglades Division, SFWMD http://www.sfwmd.gov/org/wrp/elm
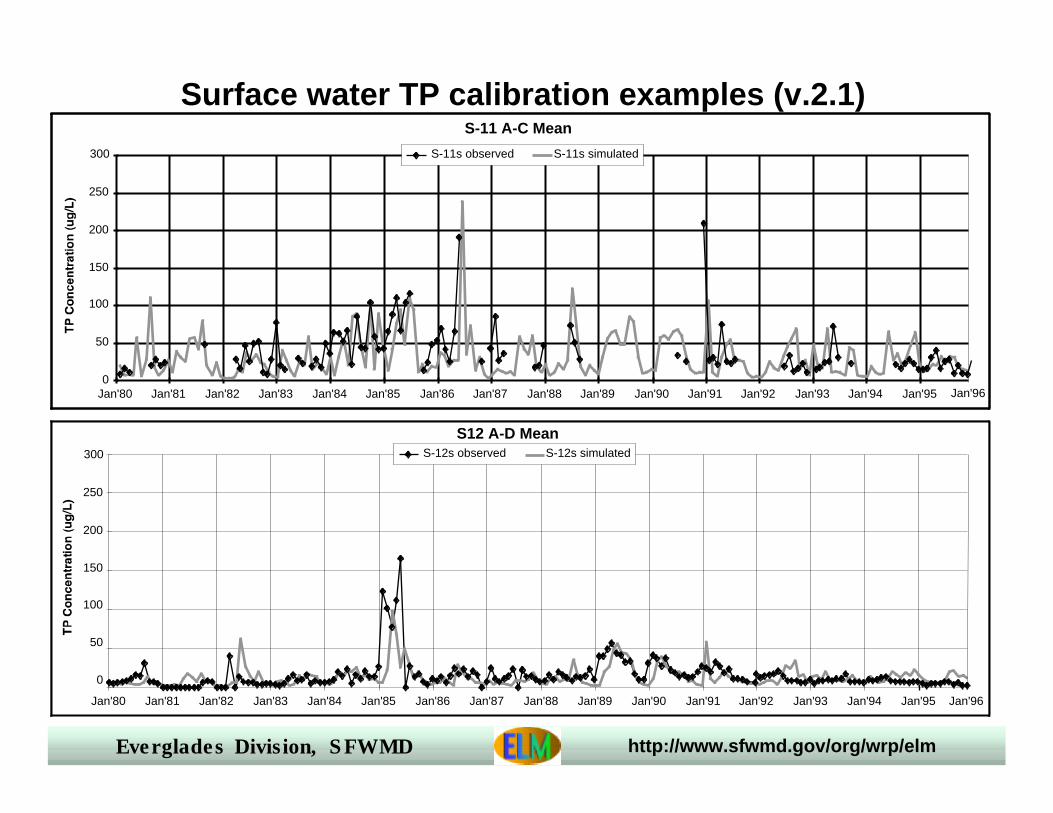
Surface water TP calibration examples (v.2.1)S-11 A-C Mean
0
50
100
150
200
250
300
Jan'80 Jan'81 Jan'82 Jan'83 Jan'84 Jan'85 Jan'86 Jan'87 Jan'88 Jan'89 Jan'90 Jan'91 Jan'92 Jan'93 Jan'94 Jan'95
S-11s observed S-11s simulated
Jan'96
S12 A-D Mean
Jan'80 Jan'81 Jan'82 Jan'83 Jan'84 Jan'85 Jan'86 Jan'87 Jan'88 Jan'89 Jan'90 Jan'91 Jan'92 Jan'93 Jan'94 Jan'95 Jan'96
S-12s observed S-12s simulated
0
50
100
150
200
250
300
Everglades Division, SFWMD http://www.sfwmd.gov/org/wrp/elm
Periphyton
Macrophytes
Nutrients Hydrology
Soil
StandingDetritus
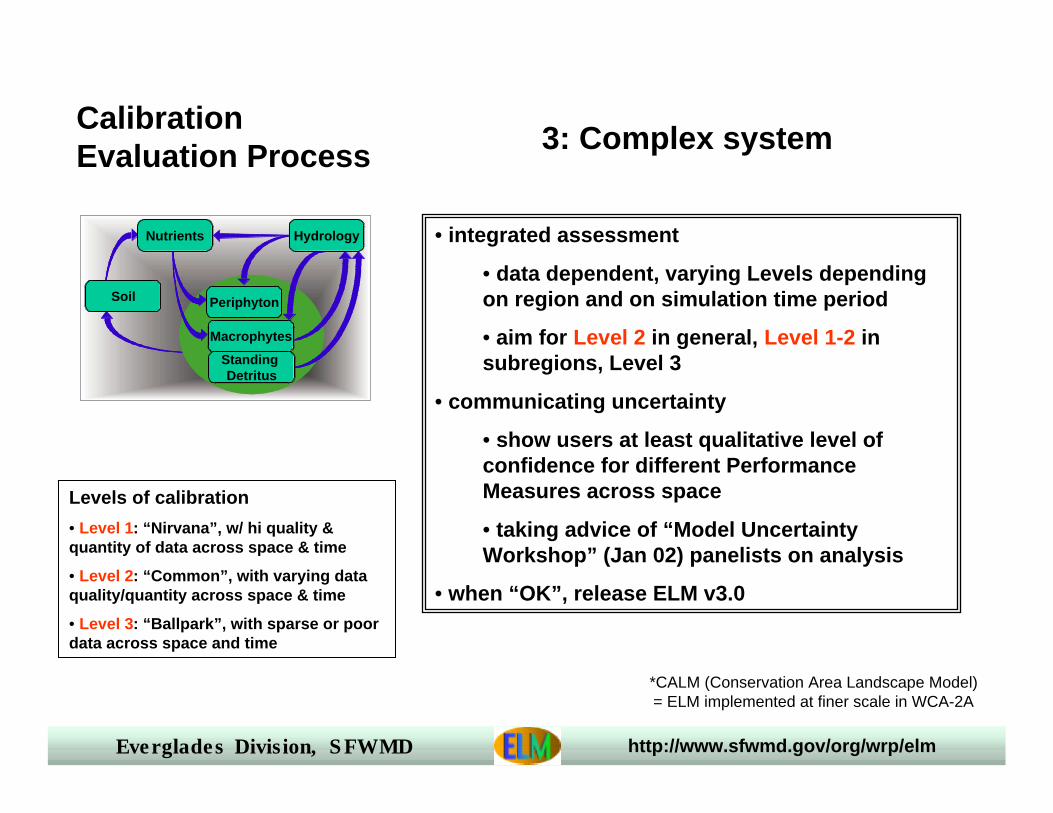
• integrated assessment
• data dependent, varying Levels dependingon region and on simulation time period
• aim for Level 2 in general, Level 1-2 insubregions, Level 3
• communicating uncertainty
• show users at least qualitative level ofconfidence for different PerformanceMeasures across space
• taking advice of “Model UncertaintyWorkshop” (Jan 02) panelists on analysis
• when “OK”, release ELM v3.0
CalibrationEvaluation Process 3: Complex system
*CALM (Conservation Area Landscape Model)= ELM implemented at finer scale in WCA-2A
Levels of calibration
• Level 1: “Nirvana”, w/ hi quality &quantity of data across space & time
• Level 2: “Common”, with varying dataquality/quantity across space & time
• Level 3: “Ballpark”, with sparse or poordata across space and time
Nutrients Hydrology
Periphyton
Macrophytes
Standing Detritus
Soil
Everglades Division, SFWMD http://www.sfwmd.gov/org/wrp/elm
Hierarchical Sensitivity Analysis
• Large number of parameters
• 1) Evaluate many- parameter response at local (non-spatial) scale
of “unit” model
• 2) Evaluate subset of parameters in simple (WCA-2A) spatial basin
• 3) Evaluate subset of parameters in entire Everglades domain
Everglades Division, SFWMD http://www.sfwmd.gov/org/wrp/elm
Summary: Model Performance
• Evaluate ecological process/mechanisms in subregions with highdata (spatial & temporal) quality
• Calibrate both targets (e.g., stage, TP conc.) and rates (e.g., ET, TPuptake)
• To extent possible, extend subregional understanding to otherregions with comparable antecedent conditions & dynamics
Everglades Division, SFWMD http://www.sfwmd.gov/org/wrp/elm
August 7 Goals
• Part I: Overview (this slide show)
§ Model objectives
§ Model structure
§ Calibration performance
§ Application performance measures
• Part II: Details (using web site)
§ Model tools
§ Code
§ Data
§ Performance (calibration)
Background for detailed review of ELM
Everglades Division, SFWMD http://www.sfwmd.gov/org/wrp/elm
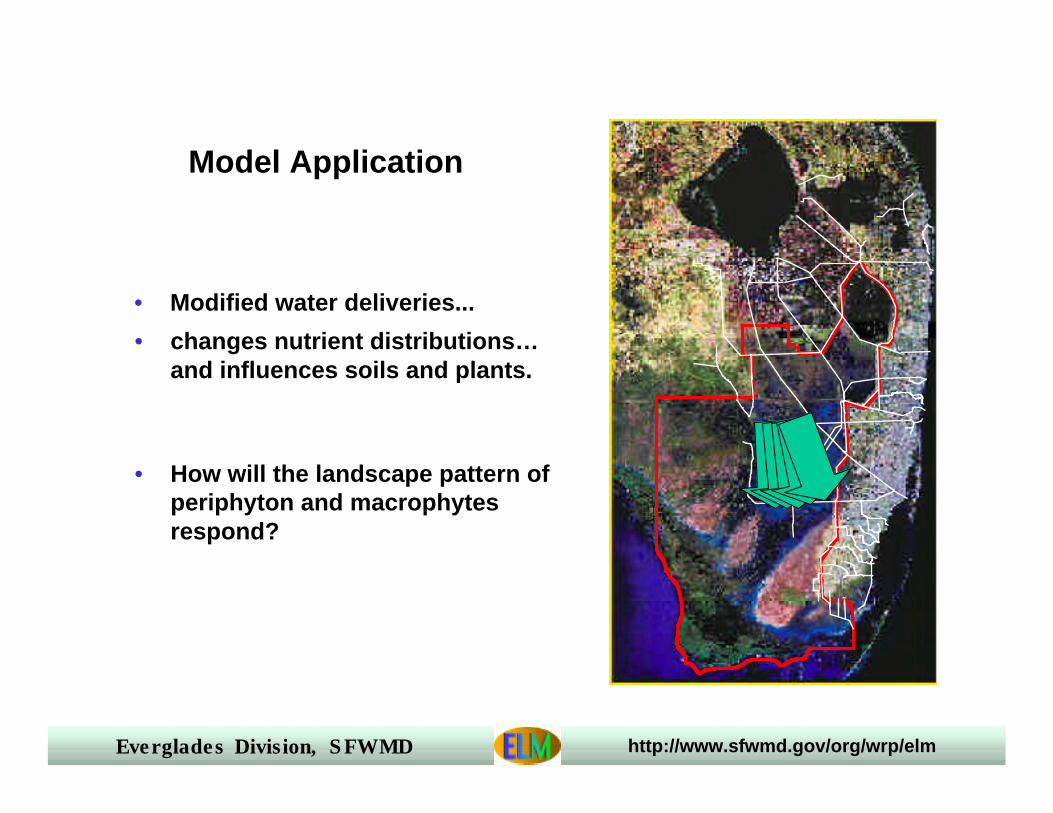
• Modified water deliveries...
• changes nutrient distributions…and influences soils and plants.
• How will the landscape pattern ofperiphyton and macrophytesrespond?
Model Application
Everglades Division, SFWMD http://www.sfwmd.gov/org/wrp/elm
Project Alternative Evaluation:Hydrologic Considerations
• For each Alternative, SFWMM provides (via scripted procedures)
§ daily input data on managed flows through water control structures
§ daily stages at boundary cells (ELM code not final for this)
• ELM hydrology (overland, groundwater, canal flows, etc)
otherwise independent of SFWMM
• ELM uses SFWMM data on rainfall, topography, others
• Verify that ELM hydrology is consistent with SFWMM (stage,
hydroperiod, budgets)
Everglades Division, SFWMD http://www.sfwmd.gov/org/wrp/elm
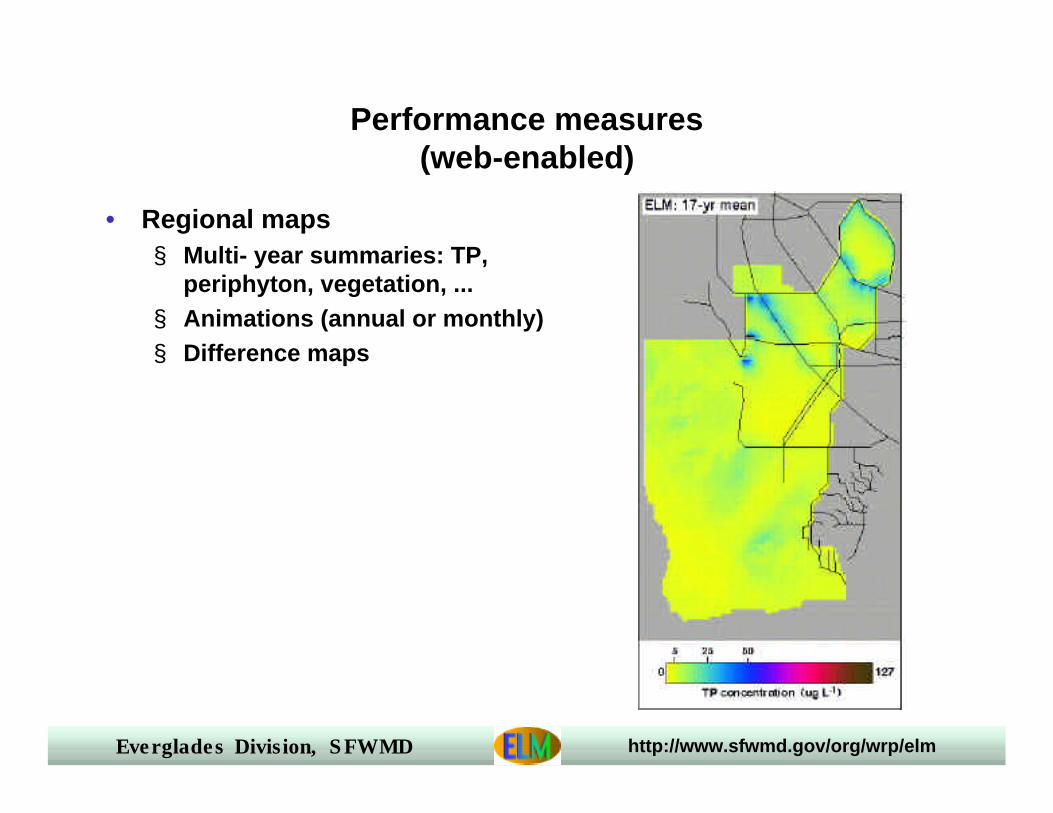
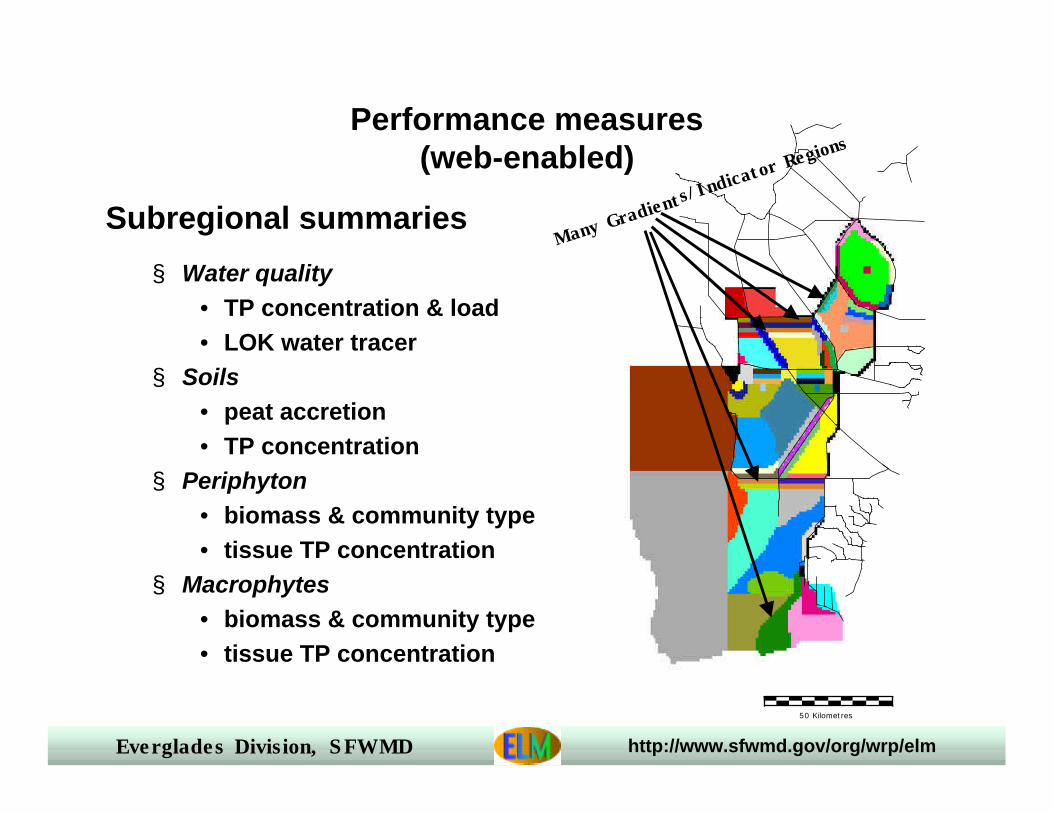
Performance measures(web-enabled)
• Regional maps§ Multi- year summaries: TP,
periphyton, vegetation, ...§ Animations (annual or monthly)§ Difference maps
Everglades Division, SFWMD http://www.sfwmd.gov/org/wrp/elm
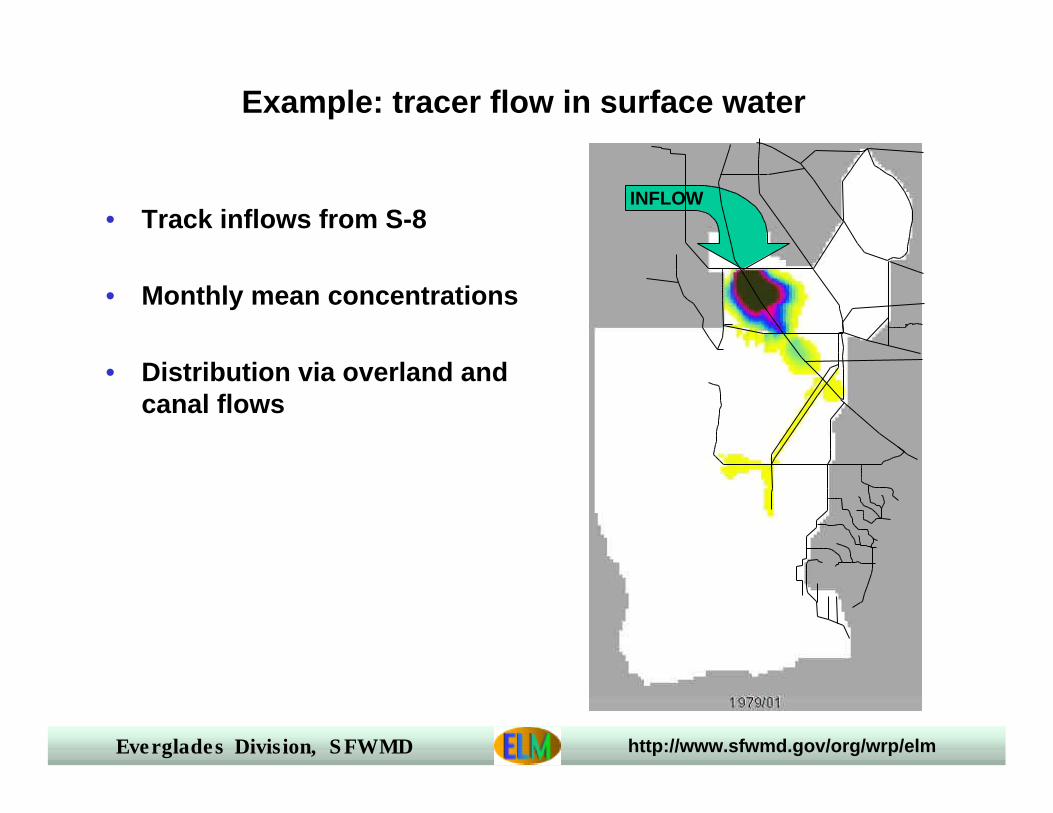
• Track inflows from S-8
• Monthly mean concentrations
• Distribution via overland andcanal flows
Example: tracer flow in surface water
INFLOW
Everglades Division, SFWMD http://www.sfwmd.gov/org/wrp/elm
§ Water quality
• TP concentration & load• LOK water tracer
§ Soils
• peat accretion• TP concentration
§ Periphyton
• biomass & community type• tissue TP concentration
§ Macrophytes
• biomass & community type• tissue TP concentration
Performance measures(web-enabled)
50 Kilometres
Many Gradie
nts/Indic
ator Regio
ns
Subregional summaries
Everglades Division, SFWMD http://www.sfwmd.gov/org/wrp/elm
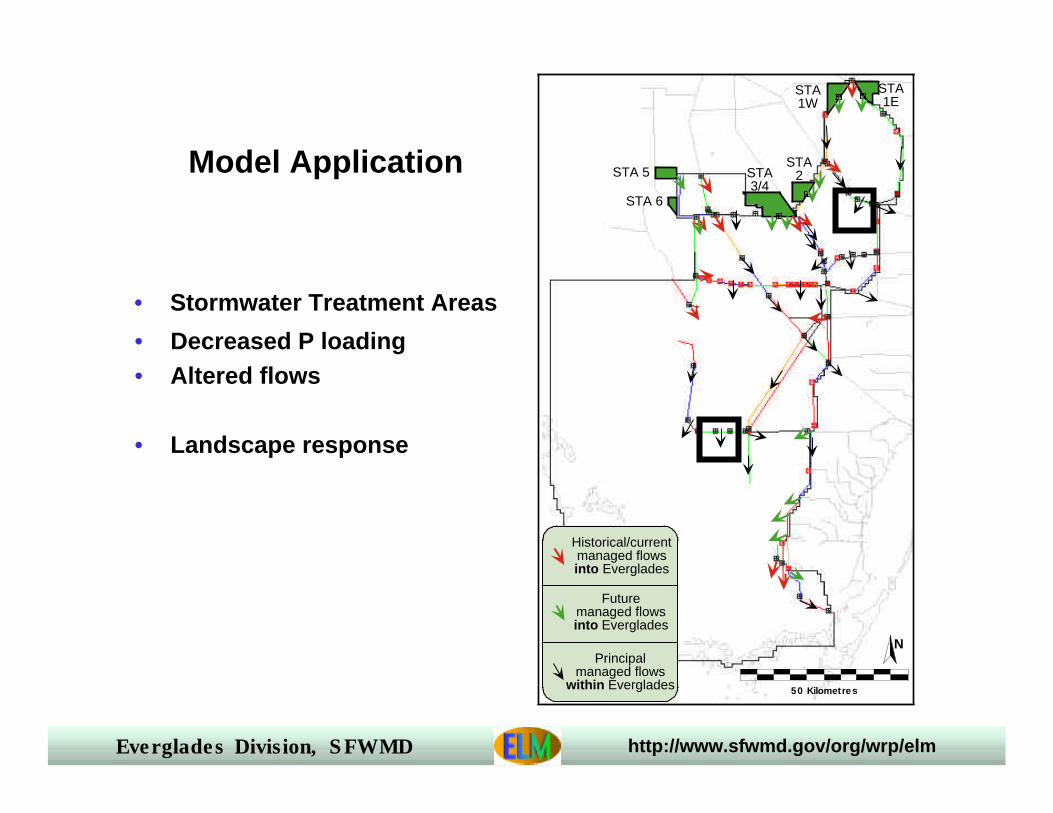
• Stormwater Treatment Areas
• Decreased P loading• Altered flows
• Landscape response
Model Application
Historical/currentmanaged flowsinto Everglades
Futuremanaged flowsinto Everglades
Principalmanaged flows
within Everglades 50 Kilometres
N
STA 5
STA 6
STA3/4
STA2
STA1W
STA1E
Everglades Division, SFWMD http://www.sfwmd.gov/org/wrp/elm
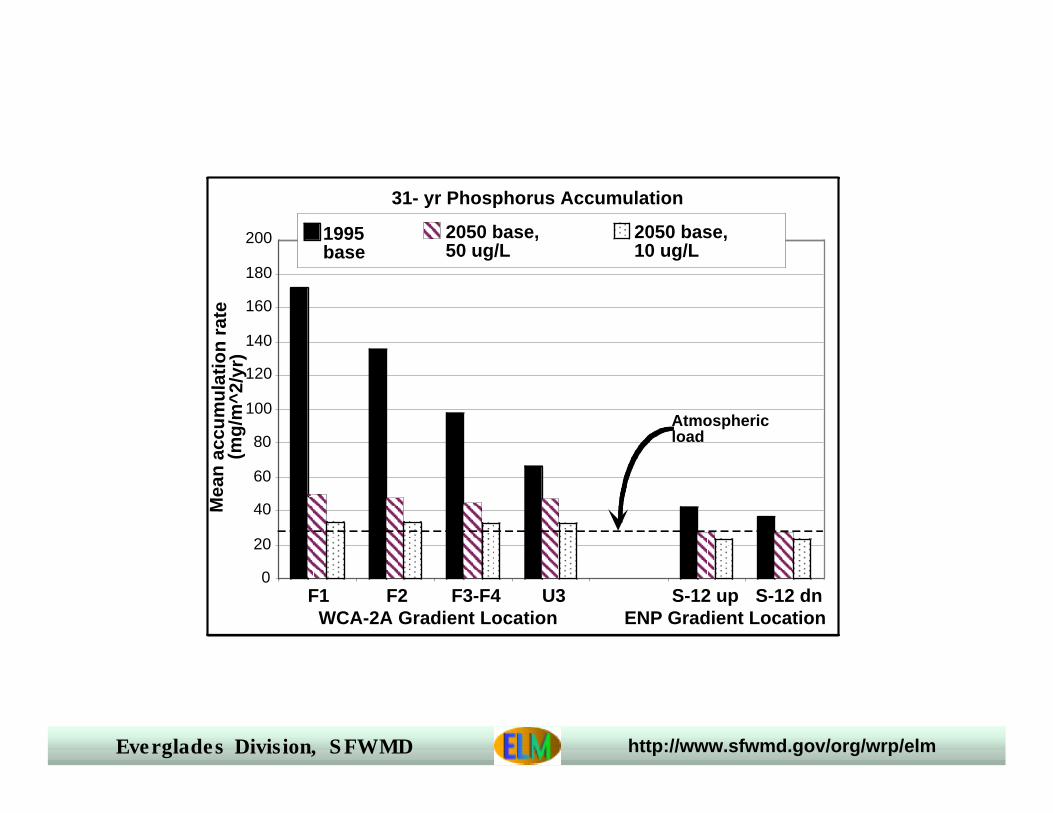
31- yr Phosphorus Accumulation
0
20
40
60
80
100
120
140
160
180
200
F1 F2 F3-F4 U3 S-12 up S-12 dnWCA-2A Gradient Location ENP Gradient Location
Mea
n a
ccu
mu
lati
on
rat
e(m
g/m
^2/y
r)
Atmosphericload
1995base
2050 base,50 ug/L
2050 base,10 ug/L
Everglades Division, SFWMD http://www.sfwmd.gov/org/wrp/elm
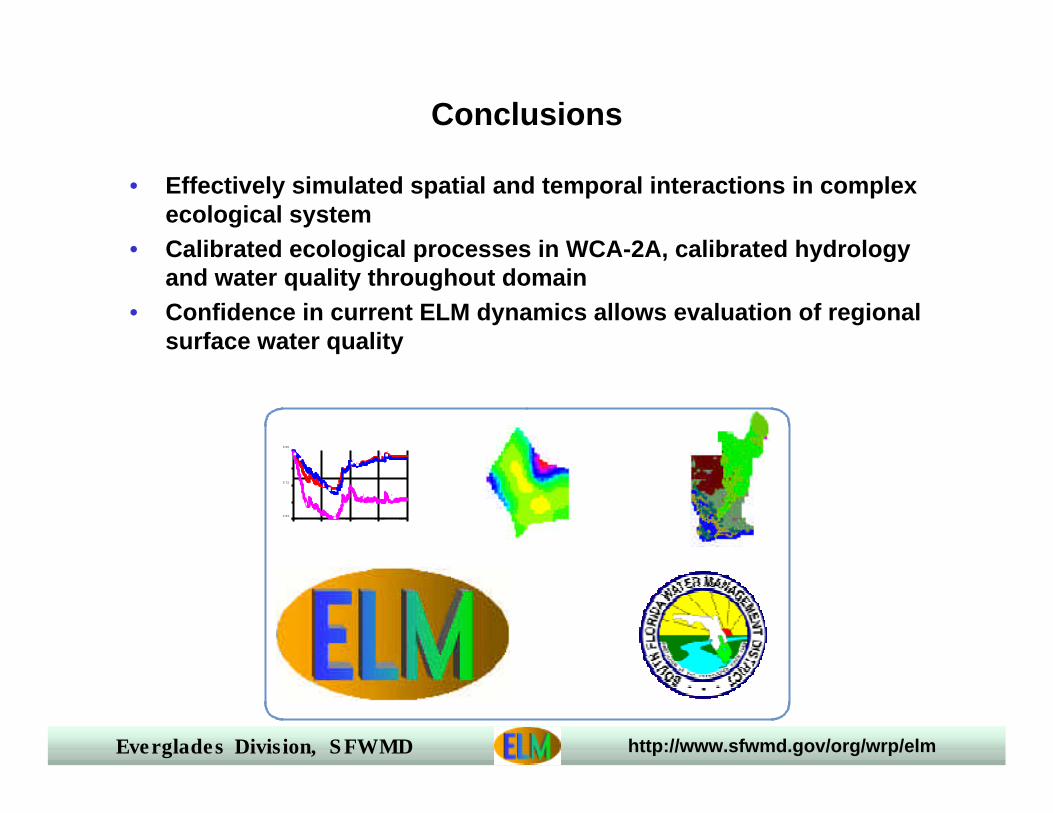
Conclusions
• Effectively simulated spatial and temporal interactions in complexecological system
• Calibrated ecological processes in WCA-2A, calibrated hydrologyand water quality throughout domain
• Confidence in current ELM dynamics allows evaluation of regionalsurface water quality
1.00 92.00 183.00 274.00 365.004.94
5.72
6.501
1
1
12
2
2
2
3
3
3 3
Everglades Division, SFWMD http://www.sfwmd.gov/org/wrp/elm
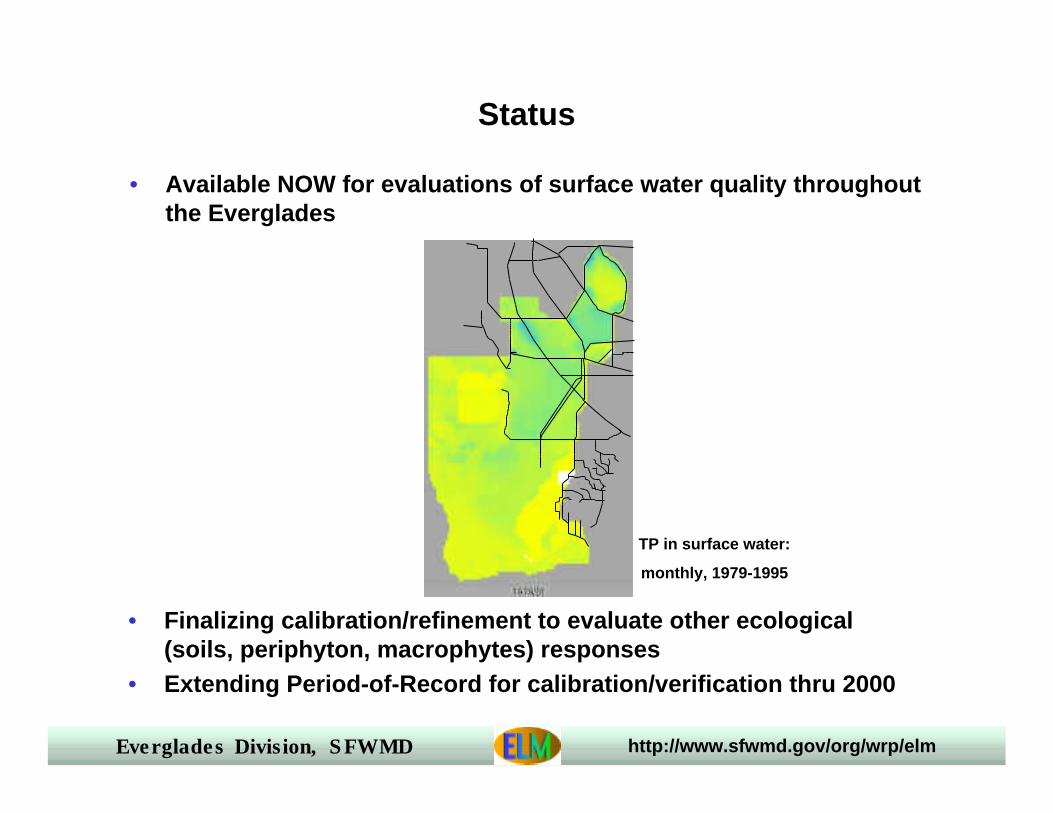
Status
• Available NOW for evaluations of surface water quality throughoutthe Everglades
TP in surface water:
monthly, 1979-1995
• Finalizing calibration/refinement to evaluate other ecological(soils, periphyton, macrophytes) responses
• Extending Period-of-Record for calibration/verification thru 2000
Everglades Division, SFWMD http://www.sfwmd.gov/org/wrp/elm
Documentation & Review
• Web site§ Data used in model development and model application
• Descriptions of data on web site• All data on ftp link at web site
§ Model structure• Documented in manuscripts and conceptual diagrams at web site• Detailed code descriptions on web site• All source code on ftp link at web site
§ Model results• Post-processed performance measures• Raw output data (to be) on ftp link at web site
• Peer Review§ May 9: USGS Model Informational Workshops, including ELM§ Aug 7: Inter-agency review, organized by CERP-RECOVER Model
Development and Refinement Team§ Soon?: SCT/RECOVER sponsoring independent peer review
Everglades Division, SFWMD http://www.sfwmd.gov/org/wrp/elm
August 7 Goals
• Part I: Overview (this slide show)
§ Model objectives
§ Model structure
§ Calibration performance
§ Application performance measures
• Part II: Details (using web site)
§ Model tools
§ Code
§ Data
§ Performance (calibration)
Background for detailed review of ELM
Everglades Division, SFWMD http://www.sfwmd.gov/org/wrp/elm
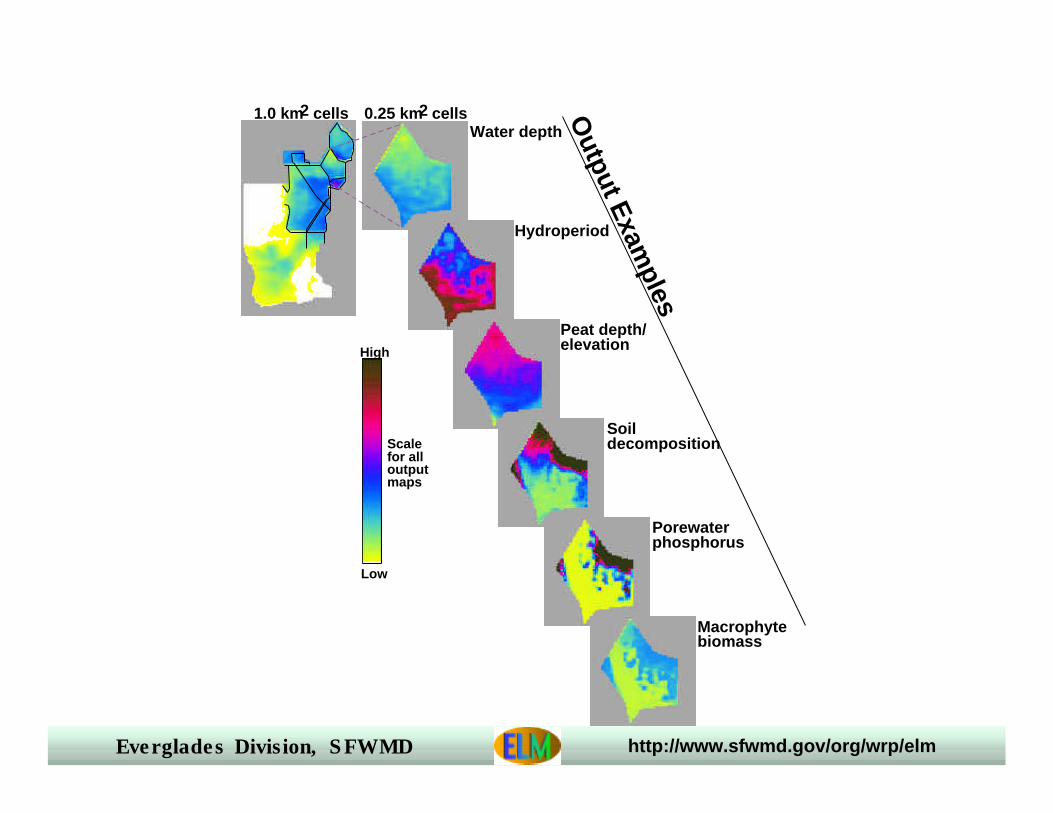
Scalefor alloutputmaps
High
Low
Water depth
Hydroperiod
0.25 km2 cells1.0 km2 cells
Peat depth/elevation
Output E
xamples
Soildecomposition
Porewaterphosphorus
Macrophytebiomass
Everglades Division, SFWMD http://www.sfwmd.gov/org/wrp/elm
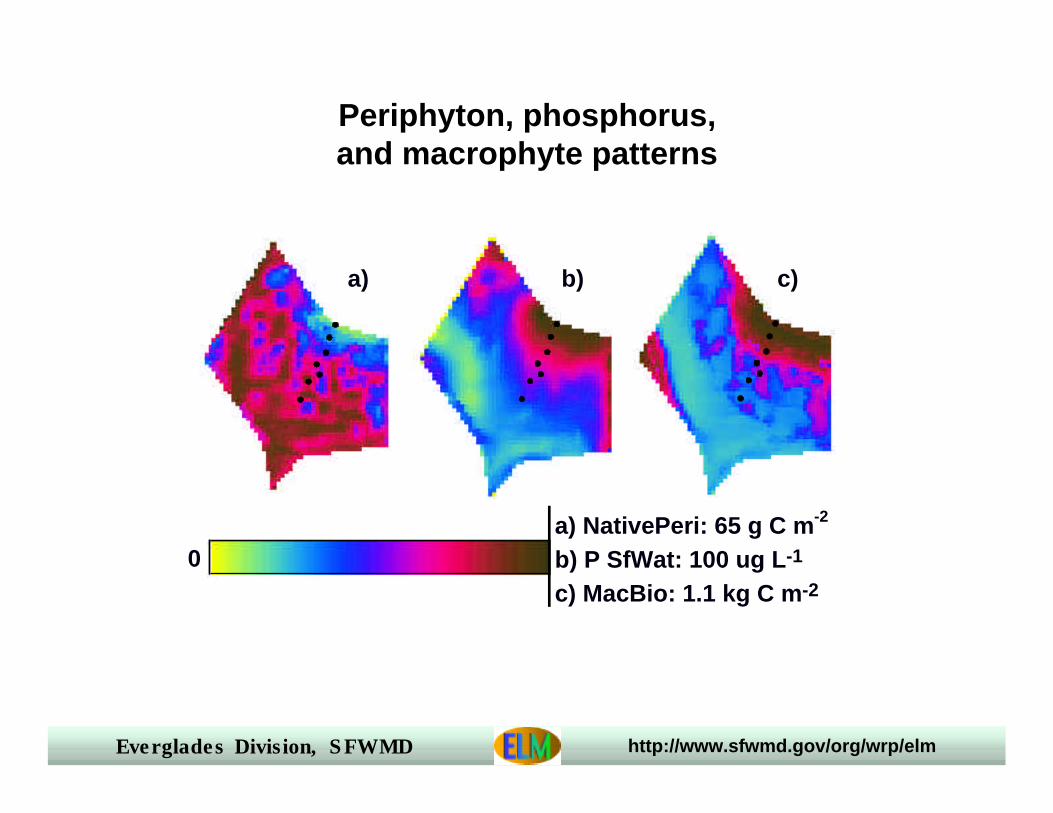
a) NativePeri: 65 g C m-2
0c) MacBio: 1.1 kg C m-2
b) P SfWat: 100 ug L-1
a) b) c)
Periphyton, phosphorus,and macrophyte patterns
Everglades Division, SFWMD http://www.sfwmd.gov/org/wrp/elm
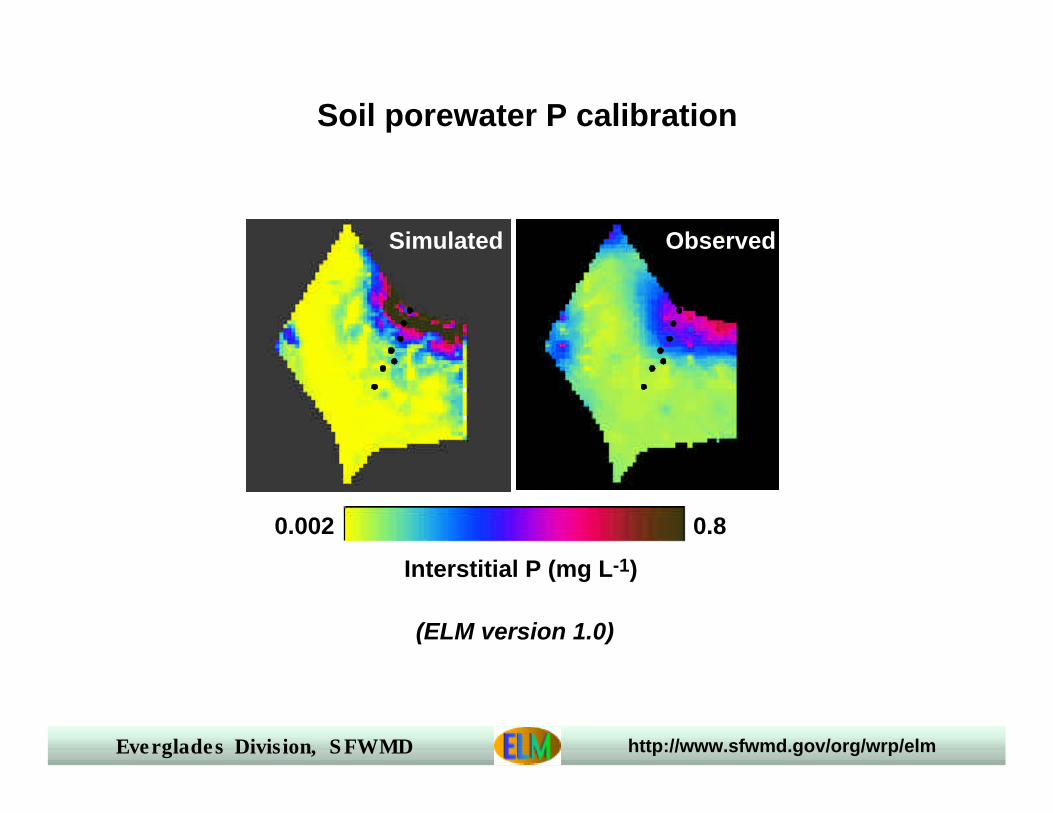
Observed
0.002
Simulated
0.8
Interstitial P (mg L-1)
(ELM version 1.0)
Soil porewater P calibration
Everglades Division, SFWMD http://www.sfwmd.gov/org/wrp/elm
●●
●
❑
❑
❑
❍
❍ ❍
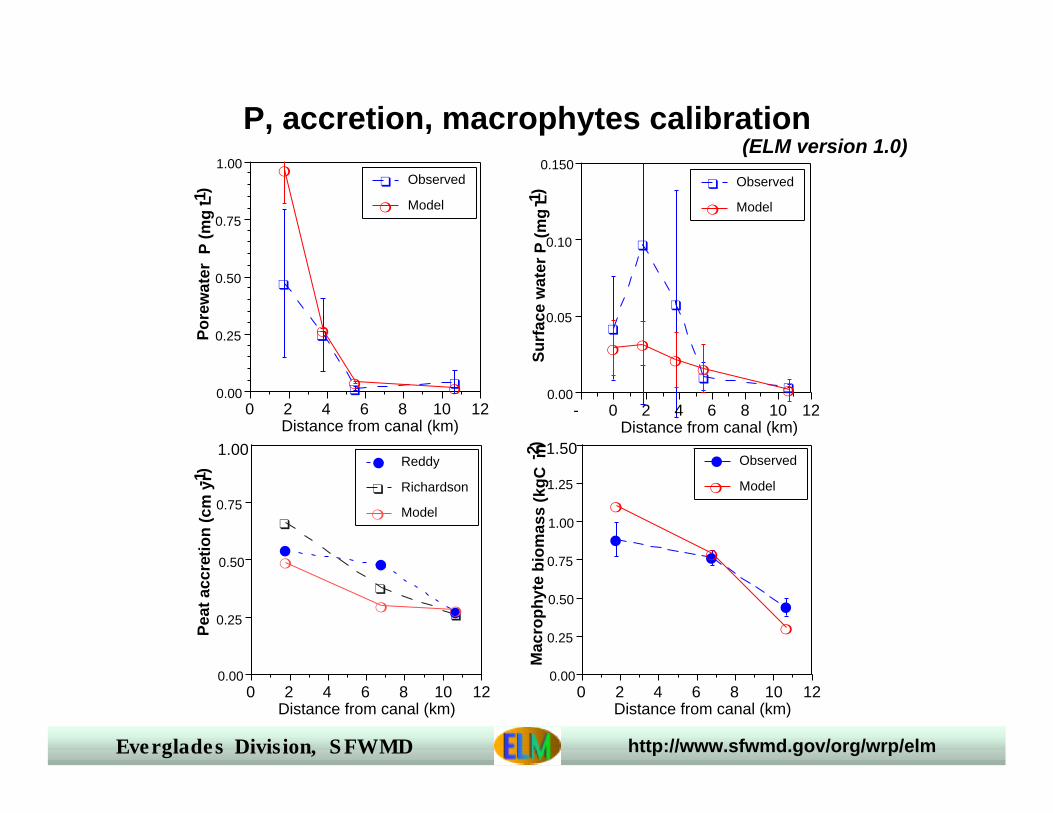
0.00
0.25
0.50
0.75
1.00
0 2 4 6 8 10 12
Pea
t ac
cret
ion
(cm
yr-1)
Distance from canal (km)
● Reddy
❑ Richardson
❍ Model
❑
❑
❑
❑❑
❍ ❍❍
❍
❍0.00
0.05
0.10
0.150
- 0 2 4 6 8 10 12Distance from canal (km)
❑ Observed
❍ Model
Su
rfac
e w
ater
P (
mg
L-1)
❑
❑
❑ ❑
❍
❍
❍ ❍0.00
0.25
0.50
0.75
1.00
0 2 4 6 8 10 12
Po
rew
ater
P (
mg
L-1)
Distance from canal (km)
❑ Observed
❍ Model
●
●
●
❍
❍
❍
0.00
0.25
0.50
0.75
1.00
1.25
1.50
0 2 4 6 8 10 12
Mac
rop
hyt
e b
iom
ass
(kg
C m-2
)
Distance from canal (km)
● Observed
❍ Model
(ELM version 1.0)P, accretion, macrophytes calibration
Everglades Division, SFWMD http://www.sfwmd.gov/org/wrp/elm
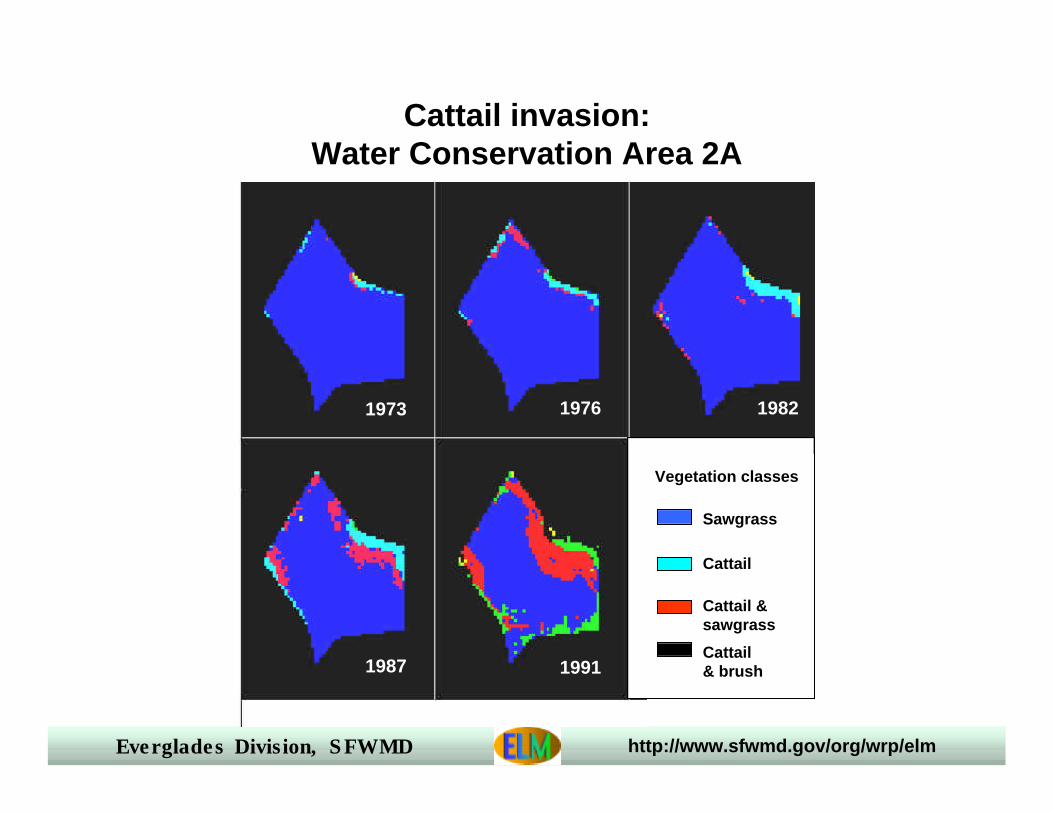
1973 1976 1982
1987 1991
Vegetation classes
Cattail &sawgrass
Cattail
Sawgrass
Cattail & brush
Cattail invasion:Water Conservation Area 2A
Everglades Division, SFWMD http://www.sfwmd.gov/org/wrp/elm
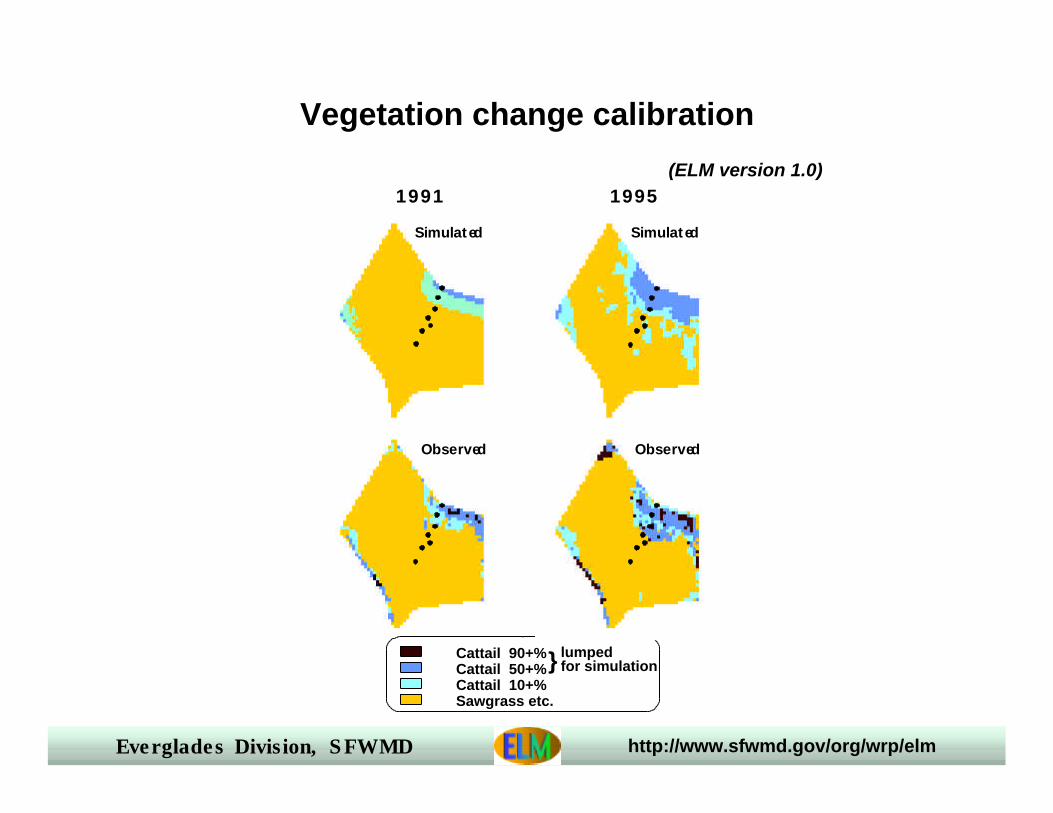
Vegetation change calibration
Observed
Cattail 90+%Cattail 50+%Cattail 10+%Sawgrass etc.
} lumpedfor simulation
Simulated
1991
Observed
Simulated
1995(ELM version 1.0)
Everglades Division, SFWMD http://www.sfwmd.gov/org/wrp/elm
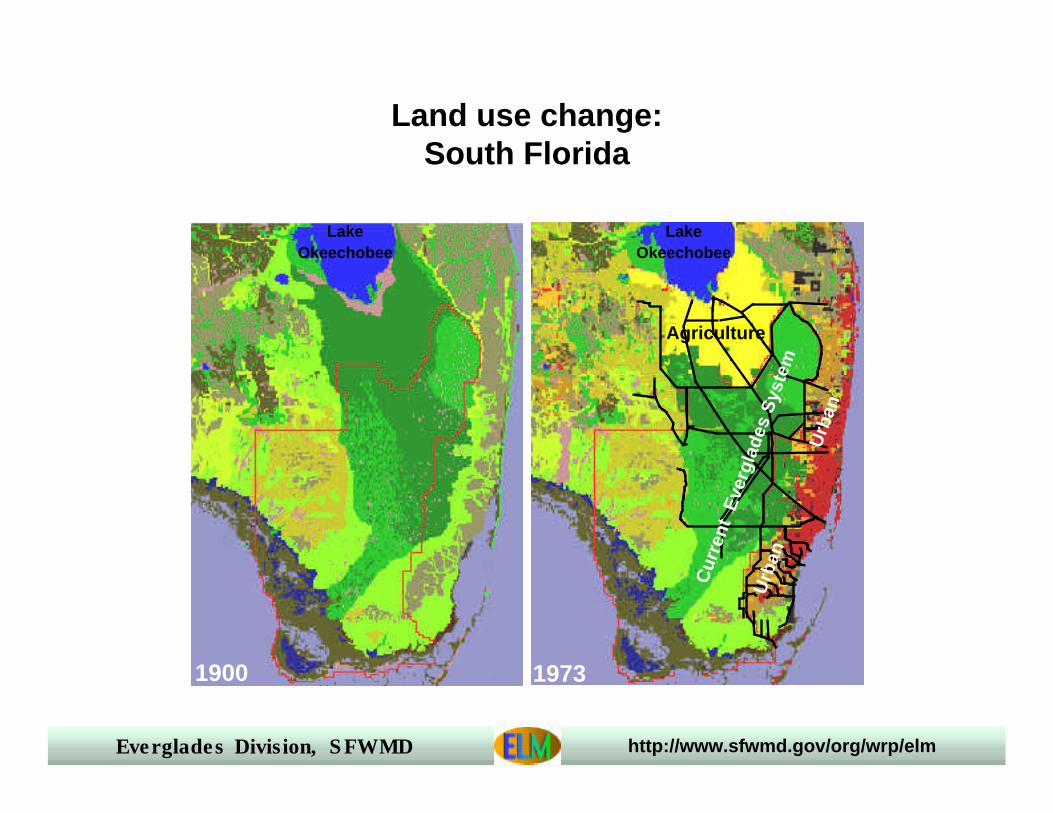
Land use change:South Florida
1900
LakeOkeechobee
1973
LakeOkeechobee
Agriculture
Cur
rent
Eve
rgla
des
Sys
tem
Urb
an
U
rban
Everglades Division, SFWMD http://www.sfwmd.gov/org/wrp/elm
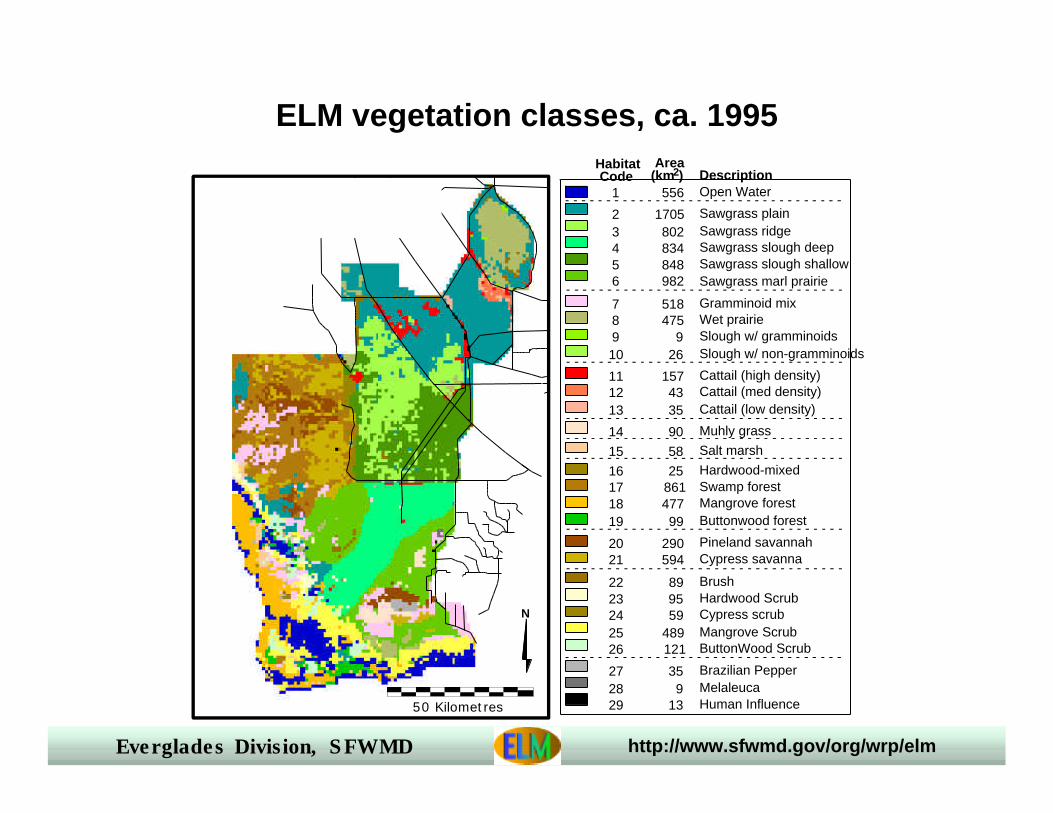
N
50 Kilometres
1 556 Open Water
2 1705 Sawgrass plain3 802 Sawgrass ridge4 834 Sawgrass slough deep5 848 Sawgrass slough shallow6 982 Sawgrass marl prairie
7 518 Gramminoid mix 8 475 Wet prairie9 9 Slough w/ gramminoids10 26 Slough w/ non-gramminoids
11 157 Cattail (high density)12 43 Cattail (med density)13 35 Cattail (low density)
14 90 Muhly grass
15 58 Salt marsh
16 25 Hardwood-mixed17 861 Swamp forest18 477 Mangrove forest19 99 Buttonwood forest
20 290 Pineland savannah21 594 Cypress savanna
22 89 Brush23 95 Hardwood Scrub 24 59 Cypress scrub 25 489 Mangrove Scrub 26 121 ButtonWood Scrub
27 35 Brazilian Pepper 28 9 Melaleuca 29 13 Human Influence
HabitatCode
Area(km2) Description
ELM vegetation classes, ca. 1995
Everglades Division, SFWMD http://www.sfwmd.gov/org/wrp/elm
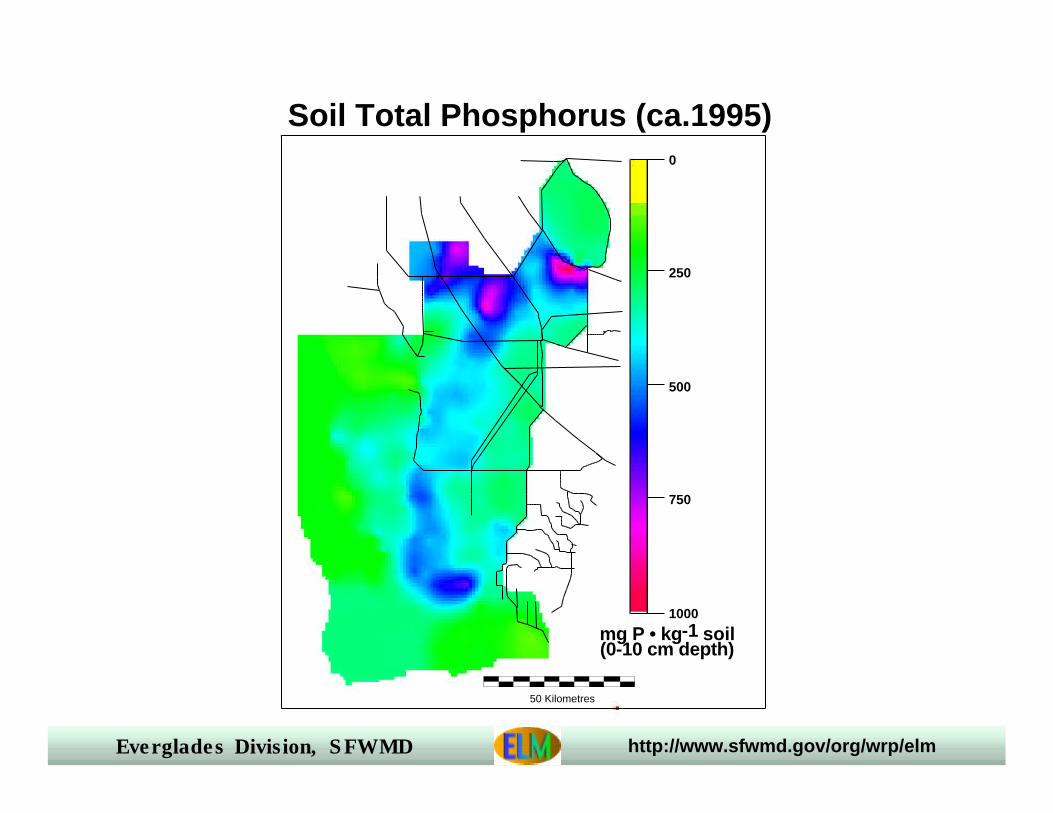
0
250
500
750
1000
50 Kilometres
mg P • kg-1 soil(0-10 cm depth)
Soil Total Phosphorus (ca.1995)
Everglades Division, SFWMD http://www.sfwmd.gov/org/wrp/elm
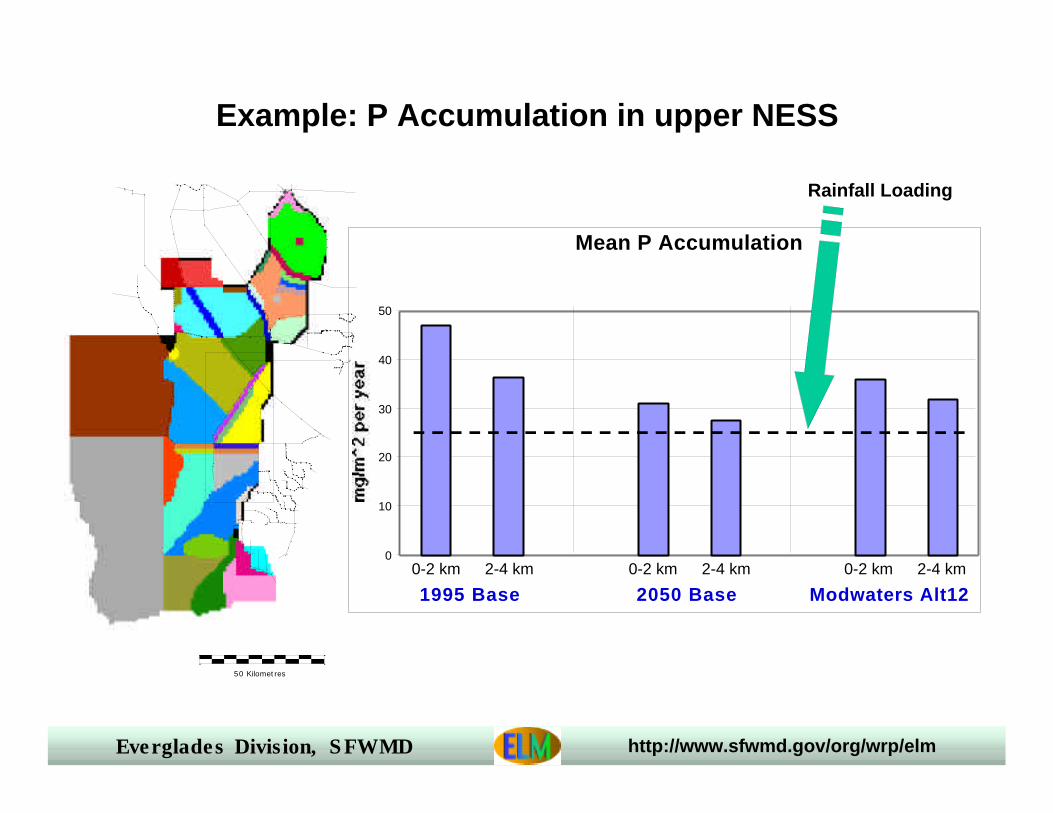
0-2 km2-4 km
TamiamiTrail
Mean P Accumulation
0
10
20
30
40
50
mg
/m^
2 p
er
ye
ar
1995 Base 2050 Base Modwaters Alt120-2 km 2-4 km 0-2 km 2-4 km 0-2 km 2-4 km
Rainfall Loading
50 Kilometres
Example: P Accumulation in upper NESS


![Scientology Sklar Case 2009 SupremeCt Writ S.Ct.08-9180-Sklar-Cert_Petition[1]](https://img.pdfslide.net/doc/110x75/577dabcd1a28ab223f8cfa99/scientology-sklar-case-2009-supremect-writ-sct08-9180-sklar-certpetition1.jpg)