Embed Size (px)
Citation preview

'w Carleton University Ottawa, Canada K 1 S 5J7
Thesis contains black and white and/or coloured graphs/tables/photographs which when microfilmad may lose their signif icance . The hardcopy of the thesis is available upon request from Carleton University Library.
---
The University Library

Effects of Stacking Sequence on the Impact Damage Resistance of Composite Laminates
by
Edgar Fuoss
B. A. Sc. (Eng inee~g Physics)
A thesis submitted to
the Faculty of Graduate Studies and Research
in partial filfilment of the requirernents
for the degree of Master of Engineering
in Mechanical Engineering
Department of Mechanical and Aerospace Engineering
The Ottawa-Carleton Institute for Mechanical and Aerospace Engineering
Carleton University
Ottawa, Ontario, Canada
December 1996
Copyright O 1996, Edgar Fuoss

National Library 1*1 of Canada Bibliothèque nationale du Canada
Acquisitions and Acquisitions et Bibliographie Services services bibliographiques
395 Wellington Street 395, nie Wellington Ottawa ON KIA ON4 Ottawa ON KI A ON4 Canada Canada
The author has granted a non- exclusive licence allowing the National Lfirary of Canada to reproduce, loan, distribute or sell copies of this thesis in microfom~, paper or electronic formats.
The author retains ownership of the copyright in this thesis. Neither the thesis nor substantial extracts fiom it may be printed or otherwise reproduced without the author's permission.
Your iYe Votre réHmCd
Our Ne None r B f é r t ~ ~ 8
L'auteur a accordé une licence non exclusive permettant a la Bibliothèque nationale du Canada de reproduire, prêter, distribuer ou vendre des copies de cette thèse sous la forme de microfiche/nlm, de reproduction sur papier ou sur format électronique.
L'auteur conserve la propriété du droit d'auteur qui protège cette thèse. Ni la thèse ni des extraits substantiels de celle-ci ne doivent être imprimés ou autrement reproduits sans son autorisation.

Abstract
The stacking sequence of a composite laminate is an important design parameter which
affects the strength, stifTness, and impact darnage resistance of the materiai. Changes in
stacking sequence may be classified by three separate parameters: ply grouping, the
interface angle between stacked plies, and the ply orientation relative to the b o u n d q
supports of the matenal. Each pararneter will affect the darnage resistance differently, in
a manner which is difficult to predict. The effect of each parameter on damage resistance
is studied using a static finite element analysis. From the fmdings of this analysis.
guidelines are proposed to improve the damage resistance. A laminate ranking method.
based on the bending stiflhess of a laminate, is also proposed to evaluate the darnage
resistance of different stacking sequences. The proposed laminate ranking rnethod
combined with the darnage resistance guidelines should provide designers with a valuable
tool suitable for preliminary design analysis.

Acknowledgements
This thesis wodd not be possible without the assistance of severai individuals. 1 would
like to gratefully acknowledge the following people:
My Master's supervisor Professor P. V. Straznicky for his continual support, guidance.
and assistance throughout the duration of this thesis.
The National Research Council Canada for their interest and support for this research
thesis. In particular, 1 would like to recognise Dr. C. Poon. project supervisor. for his
assistance and input. 1 would also like to thank the many individuals who have
assisted in this thesis, including J. Heath, R. GouId. N. Bellinger. and T. Benak.
Mr. H. Vietinghoff and Mr. O. Majeed, whose work in the area of composite materials
has forrned the fondation for the research performed for this thesis.
The many people who have also assisted in the research for the thesis, including Prof.
M. Worswick and Mr. T. Hanison.
1 would like to dedicate this thesis to my parents Otto and Fe Fuoss.

Table of Contents Abstract
Acknowledgements
List of Tables
List of Figures
Nomenclature
1. Introduction
viii
. . . X l l l
1
2. Review of Impact Damage Resistance in Composite Materials 5
2.1 Introduction
2.2 Defuiitions and Conventions
2.2.1 Basic Definitions
2.2.2 Coordinate Systems
2.2.3 Description of Stress State
2.3 Damage Charactensation
2.3.1 Characterisation Methods
2.3 -2 Characteristic Darnage State
2.4 Parameters af5ecting Impact Damage
2.4.1 Materid
2.4.2 Loading Rate
2.4.3 Stacking Sequence
2.4.4 Structural Response
2.5 Failure Theones
2.5.1 Stress-based Failure Criteria
2.5.2 Other Failure Criteria
2.6 Damage Prediction
2.6.1 Empirical Methods
2.6.2 Analytical Methods
2.6.3 Numerical methods
2.7 Summary
3. Model Development 41
3.1 Introduction 41
3 .2 Experimental Test Procedure 42
3.2.1 Coupon Specimens 42
3.2.2 Test Apparatus 43
3.3 Mode1 Methodology 46
3.3.1 Mode1 Formulation 47
3.3.2 Damage Predic tion 52
3.4 Mode1 Verification 57
3.4.1 Quasi-S tatic Approximation 57
3 .4.2 Element Performance 60
3.4.3 Geometnc Modelling 65
3.4.4 Convergence 69
4. Results 80
4.1 Introduction 80
4.2 Initiai Survey of Numencal Results 82
4.3 Cornparison of Numerical and Experirnental Results 93
4.4 Effects of Layup Parameters 1 O0
4.4.1 Interface Angle 1 O0

4.4.1.1 Layups containing a constant interface angIe 1 O0
4.4.1.2 Layups containing multiple interface angles
4.4.2 Ply Orientation
4.4.3 Ply Grouping
4.5 Darnage Resistance of General Layups
4.5.1 Quasi-Isotropie Layups
4.5.2 Orthotropic Layups
4.6 Summary
5. Laminate Ranking Method for Damage Resistance
5.1 Introduction
5.2 Lamination Theory
5.3 Proposal of a Darnage Resistance Parameter
5.3.1 Bending strain parameter cb
5 -3.2 Displacement parameter w
5.3.3 Critical strain parameter E,
5.4 Evaluation of the Laminate Ranking Method
5.5 Discussion
5.6 Summary
6. Conclusions
6.1 Conclusions
6.2 Future Research
6.3 Summary of Contributions
References
vii

List of Tables
Table 2-1 :
Table 3- 1 :
Table 3-2:
TabIe 3-3:
Table 3-4:
Table 3-5:
Table 4- 1 :
Table 4-2:
Table 4-3 :
Table 4-4:
Table 4-5:
Table 4-6:
Table 5- 1 :
TabIe 5-2:
Table 5-3:
Table 5-4:
Stress-Based Failure Criteria
In-Plane Material Properties (Gaudert et al., 1993; Poon et al., 199 1).
Material and Geometry Data for Rectangdar Plate Test Problem
Analytical and Numencal Stress Solutions for Plate Bending Problem
Material and Geometry Data for Beam Bending Test Problem
Test Program for Convergence Study
Layups Analysed for Interface Mismatch Angle Study
Layups Anaiysed for Interface Angle Study
Layups Containing Mdtipk Izterface Angles
Layups Analysed for Geomeûic Orientation Study
Layups Analysed for Ply Grouping Study
Stacking Sequences Analysed for Orthotropic Layup Study
Parameters Used in the Calculations of the
Darnage Resistance Parameter
Expenmental Data Used to Evaluate the Damage Resistance P
Specimen Data used to Compare Rankings Using the
Damage Resistance Parameter DR and Predicted FEM Darnage
Cornparison of Damage Prediction Methods
viii

List of Figures
Figure 2-1: Global and local coordinate systems for a laminated plate
Figure 2-2: Global and local stress state
Figure 2-3 : Typical matrix cracking and delamination damage in a composite
laminate 14
Figure 2-4: Typical darnage exhibited on the faces of a coupon specimen 14
Figure 2-5: Typical delamination damage at an interface within a composite laminate 17
Figure 2-6: Plan view of delamination damage through the last 12 plies
of a [-45/0/45/90]3s laminate (Gosse and Mon, 1988)
Figure 3- 1 : Experimental apparatus 45
Figure 3-2: Element discretization of coupon specimen 50
Figure 3-3: Simply-supported boundary conditions for numencal mode1 50
Figure 3-4: In-plane stresses a, and 4, . - at point (1 5 8 mm, 1.58 mmo z)
for [-453/03/453/903]S, load 7.5 kN 54
Figure 3-5: Transverse normal stress a, and in-plane shear stress o, at point
(1.58 mm, 1.58 mm, z) for [-45,/03/453/90,]s, load 7.5 kN 55
Figure 3-6: Transverse shear stresses o, and o, at point (1.58 mm, 1.58 mm, z)
for [-453/0,/45,/903]s, load 7.5 kN 56
Figure 3-7: Vibration modes of a 24-ply quasi-isotropie coupon specimen 59
Figure 3-8: Plate notation 62
Figure 3-9: In-plane stress distribution of plate 63

Figure 3- 10: Transverse shear stress distribution of plate
Figure 3- 1 1 : In-plane shear stress distribution of plate
Figure 3 - 12: Beam notation
Figure 3-1 3 : Transverse shear stress distribution of beam
Figure 3-14: In-plane stress distribution of beam
Figure 3-1 5: Element discretization of convergence midy models
Figure 3- 16: Longitudinal stresses a, and relative errors IAoJ through thickness z
sampled at point (3.1 8 mm, O mm)
Figure 3-1 7: Longitudinal stresses a, and relative errors IAcryyl through-thichess z
sampled at point (O mm, 3.18 mm)
Figure 3-1 8: Longitudinal stresses o, and relative errors IAoJ between models
CS4-LA and CSS-LA through-thickness z at point (1.59 mm. 1.59 mm) 74
Figure 3-19: Longitudinal stresses a, and relative errors IAoel between models
CS4-LA and CSS-LA through-thickness z at point (1 -59 mm. 1.59 mm) 75
Figure 3-20: Predicted delamination areas at selected interfaces 78
Figure 3-2 1 : Cornparison of delamination areas at selected interfaces 79
Figure 4-1 : Predicted delamination damage at the first 12 interfaces for
quasi-isotropie layups listed in Table 4-1, load 7.5 kN 85
Figure 4-2: Contributions of delaminations at the fvst 4 interfaces to the total
topographical area for layup LA 88
Figure 4-3: Contour plot of stress oz at interfaces 1 and 4, [-45/0/45/90]3s,
load 8.5 kN 90
Figure 4-4: Contour plots of stress c4 at interfaces 1 and 4, [-45/0/45/90]3s,
load 8.5 kN 9 1

Figure 4-5:
Figure 4-6:
Figure 4-7:
Figure 4-8:
Figure 4-9:
Contour plots of stress o, at interfaces 1 and 4, [-45/0/45/90],S,
load 8.5 kN 92
Comparison of finite element predictions against experimental results 95
Comparison of predicted delaminations at interfaces 1 and 4 against
C-Scan of experimental damage 97
Delamination area at interface 1 vs. interface angle, Ioad 4.5 kN 1 04
Delamination length and width vs. interface angle, load 4.5 kN 1 04
Figure 4- 10: Cornparison of delarnination areas between layups LA and MB,
test case 1, load 7.5 kiV 1 08
Figure 4-1 1 : Comparison of delamination areas between layups LE and ME,
test case 2, load 7.5 kN 1 08
Figure 4- 12: Comparison of topographical damage areas for geometric
orientation study, load 7.5 kN 1 1 1
Figure 4- 1 3 : Predicted transverse displacement distribution for layup LA,
load 7.5 kN 113
Figure 4-14: Predicted delamination darnage at interface 1 for layups containhg an
interface angle of 45" 113
Figure 4-1 5: Comparison of topographical delamination areas for ply grouping study.
load 7.5 kN 117
Figure 4-1 6: Predicted delamination area vs. interface angle for quasi-isotropic layups
listed in Table 4-1 120
Figure 4-1 7: Cornparison of predicted delamination areas for various
orthotropic layups 124
Figure 5- 1 : Laminate ranking using peak contact force
(data from Vietinghoff, 1994)

Figure 5-2: Laminate nomenclature
Figure 5-3 : Definition of coordinate systems and plate nomenclature
Figure 5-4: Polar plot of parameter a(a) for selected layups
Figure 5-5: Darnage resistance parameter versus measured topographical
damage area, impact energy 1 5- 19J 153
Figure 5-6: Predicted FEM daniage area versus measured damage area,
impact energy 15-195 153
Figure 5-7: Laminate rankhg of specirnens impacted at various energies using the
damage resistance parameter 156
Figure 5-8: Laminate ranking of specirnens impacted at various energies
using predicted FEM damage 156
Figure 5-9: Comparison of damage resistance parameter against predicted
FEM darnage for layups listed in Table 5-3 159
Figure 5- 10: Comparison of darnage resistance parameter against predicted
FEM damage for layups listed in Table 4-1 159
xii

Nomenclature
Extensional stifhess matrix
Coupling rnaîrix between the strains and curvatures
Bending stifkess ma&
Rotated elastic modulus matrix at ply k
Scaling factor for ChoiKhang critenon (Equation 2-5)
Bending stiffhess coefficients for the bottom and top Iaminae groups compnsing an intedace (Equation 2-8)
Coefficients of the bending stiffness matrix (m=l, 2, ..., 6; n=l, 2, .... 6)
Damage resistance parameter
Longitudinal modulus
Transverse modulus
In-plane shear modulus
Out-O f-plane shear modulus
Mode 1, II, III fracture toughnesses
Mode 1: II, III cntical strain energy release rates
Bending moment
Elastic modulus coefficients at ply k (m= 1,2, ...' 6; n= l ,2 , ...? 6)
Rotated elastic modulus coeficients at ply k (m=1, 2, .... 6; n=l . 2. .... 6)
Transverse shear strength in directions 4 and 5 respectively (see Figure 2-2)
In-plane shear stren-gh

Fibre tensile and compression strength, respectively
In-plane matrix t ende and compression strength, respectively
Out-of-plane ma& tensile and compression strength, respectively
Crack growth rate
Damage radius parameter
Constants (Equation 2-8); Plate dimensions (Chapter 5)
Distance through-thickness fiom the neutral axis to the bottom face
Ply nurnber (Table 2-1)
Load function (Equation 5- 1 7)
Radius
Normal displacernent (see Figure 3-3)
Transverse displacement (see Figure 3-3)
Parameter proportional to the out-of-plane transverse displacement of the composite laminate
Coordinates in the bending coordinate system
Coordinates in the principal coordinate system
Distance through-thickness measured fiom the neutral axis
Offset in-plane angle of bending coordinate system to principal coordinate system
Maximum bending strain of equivalent bearn section at angle a
Critical ply strain
Poisson's Ratio
Global in-plane longitudinal stress
xiv

Global in-plane transverse stress
Global out-of-plane transverse stress
GlobaI in-plane shear stress
Global transverse shear stresses
Local in-plane longitudinal stress
Local in-plane transverse stress
Local out-of-plane transverse stress
Local out-of-plane transverse shear stresses
Local in-plane shear stress
Ply angle with respect to a fixed coordinate axis
Chapter 1
Introduction
Advanced fibre reinforced composite materials have played an important role in
the development of a wide range of light-weight structures. Today, composite materials
can be found in everything fkom the latest commercial aircrafi such as the Boeing 777 to
common sporting equipment such as bicycle h e s and tennis racquets. The wide
acceptance of composites is due to a number of desirable properties which these materials
have over traditional engineering materials such as steel and duminum. Composites have
excellent stifiess and strength properties with respect to weight. The stiffness and
strength properties may be tailored to create more efficient structures for specific
applications. During the manufactunng process, the matenal may be formed into a
variety of complex shapes including tubes, angled stiffeners? and c w e d panels.
In spite of these advantages, composites do have significant limitations. The
limitations include material degradation due to environmental factors such as temperature
and humidity. Manufacnuing and material costs are higher than conventionai materials.
In addition. composites are very susceptible to impact darnage. Impact from foreign
objects may produce intemal darnage which extends far beyond the localised surface

7 - damage created at the point of impact. The interna1 damage is often barely visible. yet
can senously degrade the load-canying capability of the material. Avery and Grande
(1990) have reported that impact damage could result in up to a 50% reduction in the
compressive strength.
Considerable research bas been performed to address the Limitations of impact
damage (Abrate, 1991). The research areas include understanding the damage
propagation modes, improving inspection methods to detect impact damage, detemiining
the strength degradation due to impact darnage, and predicting the amount of impact
damage for a given load. The research areas may be classified into two categories:
dumage resistance and damage tolerunce (Lagace et al., 1993). Darnage resistance is the
ability of a material to resist darnage resulting fiom an impact from another body.
Darnage resistance is assessed by quantiQing the amount of damage for a fixed set of
impact conditions. Damage tolerance is a measure of the structural performance of the
rnaterial in the presence of darnage. Damage tolerance is used as a design requirement
for structures containing composite materids. Design requirements specified by the
Federal Aviation Regulations (FAR 25.57 1 - 1, 1 99 1 ) state that materials containing barel y
visible impact damage (BVID) must be able to withstand ultimate flight loads under
extreme environmental conditions.
The ability to predict the impact darnage resistance would be of great benefit to
engineers and others using composite materials. Such a method would allow more
3
efficient structures to be desiped. However' the prediction of damage resistance has
proved to be a challenging task due to the complexity of damage which rnay occur, both
intemally and extemally. Damage may propagate through several mechanisms. including
fibre breakage, micro-buckling of laminates, delamination between adjacent laminae, and
cracking of the bonding matrix. The propagation of damage is a progressive event. Once
darnage occun, the mess state in the immediate vicinity of the damage regions is altered.
af5ecting the propagation of subsequent damage. Cornparisons of darnage resistance have
also proved to be difficult due to a number of parameters which affect the damage state.
These parameters include supporting boundary conditions, method of loading. strength
and stiffness of the matenal, and stacking sequence of plies within the larninate. By
using standardised impact testing procedures. cornparisons can be made to assess specific
parameters such as material performance or stacking sequence by eliminating the effects
of boundary supports or !oad conditions.
The objective of this thesis is to analyse the effects of larninate stacking sequence
on the darnage resistance in carbon fibre reinforced composite laminates. The stacking
sequence represents an important design parameter, affecting both the strength properties
and the darnage resistance of the material. To meet the objective, the following tasks
were carried out:

4
Development a finite element model suitable for calculating the intemal stress
state of a laminate subjected to a transverse point load.
Performance of a parametric study of various stacking sequence configurations by
comparing the internal stress properties and the predicted darnage area.
Proposal of design guidelines based on the trends observed in the parametric
study .
Determination of a method of ranking the damage resistance capabilities for
different stacking sequence configurations.
This thesis contains the results of the analysis performed for this study. The
stmcture of the thesis is as follows. Chapter 2 contains a literature review of research
performed to date in the area of composite materials. Chapter 3 contains a description of
the fuiite element model used for stress calculations. The results of the finite element
analysis are presented in Chapter 4. A description of a proposed laminate ranking
method for damage resistance is given in Chapter 5. Conclusions and recornmendations
for future research are given in Chapter 6.

Chapter 2
Review of Impact Damage Resistance in Composite Materials
2.1 Introduction
This chapter gives an introduction to the study of impact darnage resistance in
composite matenals. Defdtions and conventions which are used in thk thesis are
presented first followed by a review of research performed to date in this field. The study
of impact darnage resistance may be classified into three areas: darnage charactensation.
parametric studies, and prediction techniques. A comprehensive review of each of the
three areas is given in this chapter. Impacts studied for this thesis involved low-
velocityhigh mass impacts on coupon specimens; therefore, research reviewed in this
chapter will focus on this type of impact.
2.2 Definitions and Conventions
2.2.1 Basic Definitions
Throughout diis thesis, the followuig definitions are used. A plane of
unidirectional fibres within a bonding matrix is referred to as a lamina, layer, or p l , . A

6
laminute is two or more unidirectional laminae stacked together at various orientations.
Lamina or ply orientation refers to the orientation of the fibres within the lamina. The
laminae may be stacked at various orientations depending on the properties required.
Layup refers to the composition of the laminate including material, number and relative
orientation of each lamina. The exact orientation of each lamina within the laminate is
defmed by the stacking sequence. Several common stacking sequences exist. Cross-ply
larninates contain laminae stacked at 90° with respect to each other. Angle-ply laminates
contain lamùiae which are oriented at +0 and -0 to each other. Quasi-isoiropic laminates
are a special class of laminates in which the in-plane stiffnesses are identical in al1
directions, but the coupling and bending stiffnesses are not. Examples of such larninates
include [0/60/-601, and [0/45/90/-451,.
Several definitions are used to descnbe the properties of a composite laminate.
The impact face is the outside surface of the laminate which makes contact with an
impacting body. The back face is the outside surface opposite the impact face. Ply grotrp
refers to a group of adjacent plies within the laminate onented in the same fibre
orientation. Lamina interface is defmed as the plane between rwo adjacent plies or ply
groups which contain a change in ply orientation. The interface angle is defined as the
angle between the ply orientations of the two plies or ply groups which comprise an
interface.

2.2.2 Coordinate Systems
Two coordinate systems are
composite material: global and local.
used for this thesis to reference a laminated
Both coordinate systems used are illustrated in
Figure 2-1. The global coordinate system references the specimen as a whole, using three
orthogonal axes labelled x, y, and z. The origin is placed at the specimen centre at the
back face, with the z-axis pointing normal to the specimen plane. The local coordinate
system is used to reference an individual lamina. This system, designated by axes 1. 2,
and 3, is oriented such that axis 3 points in the same direction as the z-direction, but axes
1 and 2 are rotated in the specimen plane by angle 0 to correspond with the lamina fibre
orientation. Axis 1 is parallel to the fibre direction, while axis 2 is normal to fibre
direction, as shown in Figure 2-1. The impact load was oriented to cause displacement of
the specimen in the negative z-direction.
The lamina numbenng convention starts with the lamina at the back face and
sequentially increases towards the impact face. Likewise, the lamina interface numbering
convention starts with the interface furthest fiom the impact face and increases
sequentially towards the interface closest to the impact face.
2.2.3 Description of Stress State
A laminated composite matenal under load develops a complicated three-
dimensional stress state. The stress aate at an arbitrary point within the Iaminate ma? be

8
described using the two coordinate systems defined in Section 2.2.2, as illustrated in
Figure 2-2. The stresses in the global coordinate system are defined as follows:
o,, a, are the in-plane normal stresses
oz is the transverse nomal stress
nq is the in-plane shear stress
n,, a,,, are the transverse shear stresses
The local stresses are defined as follows:
q is the in-plane longitudinal fibre stress
n2 is the in-plane transverse stress
c3 is the out-of-plane transverse stress
q, are the out-of-plane transverse shear stresses
o, is the in-plane shear stress
The global stresses may be transfomed into the local stresses by the standard rotation
matrix (Ochoa and Reddy, 1992):
where m = cos 8 and n = sin 0

Figure 2-1 : Global and local coordinate sysrems for a larninated plate
(a) Global Stresses (b) Local Stresses
Figure 2-2: Global and local stress state

2.3 Damage Characterisation
2.3.1 Characterisation Methods
An assessrnent of impact damage resistance begins with a selection of an
appropriate experimental impact test. A nurnber of tests have been developed to examine
various aspects of impact damage. The tests can be classified into two categones based
on the rate of loading: low-velocity and hi&-velocity (Cantwell and Morton, 1991). A
low-velocity impact represents an impact by a large mass object ( > 4 kg) at velocities
below 10 d s , such as a dropped tool. A high-velocity impact represents an impact by a
low mass (cc 4 kg) object at speeds above 10 d s , such as runway debns. The
distinction between low and high velocity impact is not fixed and is classified based on
the structural response of the materiai. Al1 impacts performed for this study are classified
as low-velocity. A number of tests exist to simulate low-velocity impact loading
including Charpy and Izod pendulurns, drop weight impact towers, and hydraulic
machines. Of these, the drop weight tower test is the most cornmon. This test is capable
of closely modelling actual impact conditions and testing a variety of geometric
configurations. However, cornparisons of darnage characteristics resulting from drop
weight impact tests are hampered due to a lack of accepted testing standards.
The size and geometric configuration of the test specimen may Vary based on the
parameters that are to be studied. Large scale structures such as stiffened panels are used
when the global impact response of the component is to be measured. These types of

11
tests are costly and tirne-consuming to perfom. For cornparisons of material response.
smail coupon specimens are used. Coupons are easy to standardise and dlow a basis for
cornparison. To relate data obtained fiom coupon specimens to large scale structures,
scaling laws are employed (Abrate, 1991). The impactor shape may also Vary to include
configurations such as sharp points and blunt cylinders. Generally, a spherical or hemi-
spherical head is used (Cantwell and Morton, 1991).
A wide range of techniques, both destructive and non-destructive, are available to
characterise the damage state (Vietinghoff, 1994). Non-destructive techniques such as X-
radiography and through-transmission ultrasonics provide a topographical s w e y of the
intemal darnage region. More detailed information of the through-thickness damage is
provided by a pulse-echo time-of-flight ultrasonic scan. This type of scan will allow
identification of the topographical geometry and the depth-wise location of intemal
delarninations. However, this type of scan is lirnited since the ultrasonic signal is not able
to penetrate beyond the first layer of darnage. For a true picture of the intemal damage,
destructive techniques are required. Dye-penetrant enhanced fiactography reveais the
through-thickness distribution of the darnage at a given cross-section within the material.
For a full andysis of the intemal damage, more costly de-ply techniques are utilised.
2.3.2 Characteristic Darnage State
The impact damage state for a variety of laminates has been extensively
characterised to defme what is termed the Characteristic Damage State (CDS) (Gosse and
Mori, 1988). When a laminate is subjected to a transverse impact, damage will propagate
by three different mechanisms: matrix cracking, delamination, and fibre breakage
(Agarwal and Broutman, 1990). Idealised representations of the three damage mecha-
nisms are found in Figures 2-3 and 2-4. The damage modes generally occur in the order
as listed with increasing impact energy. (Choi et al.. 199 1 ; Joshi and Sun, 1987). For low
velocityhigh mass impacts, damage tends to initiate intemally at the bottom interface and
propagate towards the impact face (Abrate, 1991). Delaminations between interfaces are
htercomected by rnatrix cracks. The larges delamination darnage generally occurs at
the back face and progressively becomes smaller toward the impact face.
When the impact load is sufficient to create stresses which exceed the fibre
strength of the material, fibre breakage will occur both on the impact face and most
notably on the back face of the specimen. Vietinghoff (1994) has extensively observed
and docurnented fibre breakage phenomena. At the impact face, fibre breakage results
fiom the micro-buckling of the top ply under in-plane compressive forces due to plate
bending and the transverse compressive forces resulting fiom the impactor. Tende
forces due to bending will create fibre breakage at the back face with noticeable outward
deformation. The outward deformation is created from intemal plies being crushed and

13
deformed underneath the impact point. This process will continue with increasing energy
until complete penetration of the specimen occurs.
These damage mechanisms will create visible darnage on both the impact face and
back face of the larninate, as shown in Figure 2-4. At the impact face, plastic deforma-
tion at the impact point occurs in the form of a semi-spherical indent (Cantwell and
Morton, 1989). Fibre breakage occurs in the form of a single crack extending fiom both
sides the indented region. At the back face, fibre breakage appean together with visible
matrix cracks. The matrix cracks are aligned with the fibre orientation of the bottom ply.
The formation of matrut cracking and delamination has been observed by Choi
and Chang (1992) to be related in the following manner. Darnage initiates when the
energy from an impact exceeds a threshold value. Below this threshold, no damage was
observed to occur. Darnage initiates in the form of matnx cracking. The location of the
initial matrix cracks is dependent on the stacking sequence of the larninate. The cracks
are oriented in directions parallel to the fibre direction of a damaged ply. As the load is
increased, delamination will occur at the locations of the initial matrix cracks. The
formation of delarnination 4 1 , in turn, initiate new micro-cracks. Due to the coupling
between matrix cracking and delamination, the location of the initial matrix cracks
strongly influences the propagation of delamination. Choi and Chang classified two
types of maaix cracks: shear cracks within the laminate and bending cracks at the back
face of the larninate.

Impact Point
w/
- 4
/ y k , Delamination
--- ,/ Y & \ 1
Matrix Cracks
Figure 2-3 : Typical matrix cracking and delamination damage in a composite laminate
Fibre Microbuckling 7
Fibre Breakage
Plastic l ndentation
\ Matrix Cracking
Impact Face Back Face
Figure 2-4: Typical damage exhibited on the faces of a coupon specirnen

The delamination at an interface has been reported in literature to occur in a wide
variety of shapes, depending on the stacking sequence. The cornmon characteristics of a
delamination are illustrated in Figure 2-5. The delamination appears as an elongated
ellipse with a section which narrows at the impact point. The elongated portion of the
delamination is oriented in a direction which is closely aligned with the fibre direction of
the bottom ply comprising the interface. For this thesis, two rneasurements are used to
characterise the delamination shape. The delamination length is defmed as the size of the
delamination along the fibre direction of the bottorn ply. The delamination width is
defined as the size of the delamination along a direction normal to the fibre direction.
Gosse and Mon (1 988) and Vieùnghoff (1 994) have observed that the elongated
section of the delaminations were shaped as two circula wedges for quasi-isotropic
laminates. The size of the wedges depended on the angular difference of fibre
orientations between the two adjacent plies comprising the interface. The apex of each
elongated section was slightly offset fkom the fibre direction of the bottom ply. Lesser
and Filippov (1991) and Liu (1988) reported that delamination area for cross-ply layups
resernbled the shape of a peanut. Hitchen and Kemp (1 995) analysed several orthotropic
layups and found in addition to the shapes described above, the delaminations appeared
as cigar-shaped having a large elongated section with a narrow width, circular-shaped.
and elliptical-shaped.

16
As previously descnbed, delaminations between pIies are comected by rnatrix
cracks. For quasi-isotropic layups, Gosse and M o i (1988) and Vietinghoff (1994) have
observed that the damage pattern through-thickness resembles a circular staircase. The
pattern is illustrated in Figure 2-6 for the quasi-isotropic layup [-45/0/45/90]3s. The ply
numbering scheme used in Figure 2-6 is consistent with the convention used for this
thesis, as descnbed in Section 2.2.2. The circular staircase pattern may be repeated
several times through-thickness based on the stacking sequence. When viewing the
damage using ultrasonic C-Scan methods, the total damage region appeared as circular or
elliptical. Gosse and Mori, and Vietinghoff have determined fiom both fiactography and
ultrasonic C-Scanning, that the delamination darnage was greatest at the back face. and
progressively decreased toward the impact face. Therefore, the delamination damage
through-thickness is contained within a three-dimensional conical volume.

,, Delamination Width
Fibre Orientation of Bottom Ply
",' / < Delamination Length
Figure 2-5: Typical delamination damage at an interface within a composite laminate
Figure 2-6: Plan view of delamination damage through the last 12 plies of a [-45/0/45/90],, laminate (Gosse and Mon, 1988). Impact occurs at ply 24.

2.4 Parameters affecting Impact Damage
Damage within a laminate is affected by several structural, material, and impact
parameters. Each parameter will have a different effect on the damage resistaïlce. To
isolate and compare the performance of a specific parameter, fixed impact test conditions
are used. This will allow the effect of specimen geometxy and supporting boundary
conditions on darnage resistance to be neglected. The most significant parameters are
matenal, loading rateo stacking sequence, and structural response. Each parameter is
discussed in detail beIow.
2.4.1 Material
Initiation and extension of darnage is dependent on the material propenies of the
laminate. Matrix properties affect matrix cracking and delamination while fibre
properties affect fibre breakage (Abrate, 1991). Altering the properties of the matris or
fibres will change the damage resistance of the composite material. Vietinghoff (1991)
found that the toughened rnatrix of Toray T800H/3900-2 will have a far greater damage
resistance capability as compared with the brittle resin of Hercules AS413501-6.
Srhivasan et al. (1991) also found that darnage resistance is a strong fùnction of the
matris system.

19
Researchers have attempted to correlate the initiation and extension of damage for
different materials through two different approaches: stress analysis and fracture
mechanics. Stress-based andysis uses the tende, compressive, and shear strength of the
matenal to determine the existence of failure. Similarly, analysis based on fracture
rnechanics uses the fracture strength of the material to determine the existence of failure.
Choi and Chang (1992) have used stress-based analysis to predict reasonably the
initiation of matrix cracking and delamination. However, other researchers including
Wang and Vu-Khanh (1 994) and Qian et al. (1 990), have found that stress-based analysis
is inadequate to predict the growth of delarninations. Instead, delamination growth was
proposed to be govemed by the fracture toughness of the material. Liu and Chang (1 994)
found that darnage size within T800H/3900-2 laminates was significantly smaller than for
T300/976 laminates under common impact conditions. Both matenals have similar
strength and stiffhess properties, but the T800W3900-2 system has vastly superior
fracture toughness properties.
Fracture modes of a material are classified into three types: mode 1 - opening,
mode II - in-plane shear, and mode III - anti-plane shear (Gibson, 1994). The growth rate
in each of the modes is govemed by a fracture toughness pararneter G. Based on
experiments, Liu and Chang (1994) determined that delamination initiation is govemed
by GI, while damage growth is govemed by GII and GIII. Many tests have been developed
to measure each parameter individually or several parameters at once (Jones el al.. 1988).
However, dificulties exist in isohting and measuring a single fracture mode pararneter.

20
Even greater dificulties exist in determining the fkacture properties of redistic composite
structures using analytical or numencal means. These areas are still the subject of active
research.
Changes in material properties affect damage in a manner which is complex and
dificult to predict. A thorough andysis would use a combined approach, ushg the
strength of materials to predict darnage initiation and fracture mechanics to predict
damage growth. However, prediction of damage in realistic structures using a fiachue
mechanics approach is not yet possible. This is due to the difficulty in determining
individual fiacture parameters and complexity of the analytical calculations. Future
research in the area of fracture rnechanics will hopefully address this limitation. In the
interim, researchers have used the strength of matenal approach to predict boùi the
initiation and propagation of damage.
2.4.2 Loading Rate
The structural response of the specimen and the resulting darnage state depend on
the loading rate. The response may be classified into two categories, as described
previously in Section 2 -3.1 : low-velocity and high-velocity. Cantwell and Morton ( 1 989)
described the differences in structural response between the categories. Low-velocity
impacts produce a global response in the specirnen, where the energy is absorbed by the
entire structure. In contrast. high-velocity impacts produce a response which is localised
around the impact region. Morita et al. (1995) studied damage fiom both types of
loadings and that each loading produced similar mechanisms piven
impact energy. However, the resulting damage area was significantly higher for high-
velocity impacts.
At sufliciently low rates of loading, the resulting structural response approaches a
static response. Swanson (1992) compared the contact force, nomial strains behind the
impact point, and peak interlaminar shear stress fiom dynamic and static loading.
S w s n n found that dynamic effects become important when the period of impact is less
than 3 times the fundamental vibration period of the structure. Assessing the vibrational
response of low-velocity impacts, Kwon and Sankar (1991) and Olsson (1992) have
found that the impact period is much larger than the fundamental vibration penod of the
plate, producing a response which may be treated as quasi-static. Treating the low-
velocity impact event as quasi-static allows the use of simpler static analysis to determine
the properties of the system.
Comparative studies between static indentation and Iow-velocity impact loading
have been performed. Kwon and Sankar (1991) have assessed the damage in both quasi-
isotropic and cross-ply Hercules AS4/3 50 1-6 laminates due to both types of loading.
Each type of load created similar damage, with static loading creating a slightly larger
damage area. However, a clear trend is difficult to establish due to the scatter in the
measured data. Sjoblom, Hartness, and Corde11 (1988) compared the static and dynarnic
load-deflection responses of [0/45/-45/90Ins Hercules AS4/3502 specimens, where

n = 2, 4. Good agreement was found, with the dynarnic response containing large
oscillations due to vibration. An examination of the damaged specimens revealed that
static and impact loading produced vimially the sarne darnage mechanisms, including
similar patterns of matrix cracking and delamination. Based on the observed similarities
of the damage state between static and dynamic loading, Kaczmarek and Maison (1994).
and Lagace et al. (1993) proposed that static indentation testing could be used to
characterise impact damage resistance. Static testing has several advantages over impact
testing. For exarnple, it has a lower cost, is easier to conduct. and is easier to standardise.
Despite the similarities, differences do exist between static and low-velocity
impact loading. Lagace er al. (1993) found that for the same peak contact force, the
topographical darnage area is more extensive under impact loading. A contradicto~
result was found by Lee and Zahuta (1 991). Comparing contact force. energy absorption.
and damage area, Lee and Zahuta observed that, while the response is similar. static
loading gave slightly greater damage areas with respect to peak contact force and
absorbed energy. The disagreement of the above researchers on the effects of loading
rate is possibly linked to the fiacture properties of the material tested. Sohn and Hu
(1 995) compared the fracture properties under static and dynarnic loading for Toray T300
and Hercules MI 1 5 1 0 carbon fibre composites. Noticeable differences existed between
the two materials in the response of fracture strengdi G, and G,, with respect to crack
growth Aa. Examining the fiacture surfaces of MI 15 10 in detail using scanning electron
microscopy, Sohn and Hu found that interfacial bond was stronger under dynarnic
33
loading conditions, which would lead to a improved damage resistance under impact
loading.
The differences between static and dynamic loading has not been adequately
examhed in literature published to date. Further research is required to establish the
strain rate sensitivity which exists for different material systems. Therefore, caution must
be exercised when modelling low-velocity impacts using static analysis.
Stacking Sequence
The manner in which stacking sequence is linked to the damage resistance of a
laminate is still not clearly understood. This is due, in part. to the dificulties of
determining the damage propagation mechanisms which exist for a particular layup. In
atternpts to determine a law governing the effects of stacking sequence on darnage
resistance, researchers have focused on specific aspects of stacking sequence. These
areas include studying the effects of ply grouping and the difference in fibre orientation
between adjacent ply groups on damage resistance.
Liu (1988) examined changes in the relative angle of fibre orientations between
adjacent plies for [0,/8,/05] laminates for various ply angles 0. Liu found that the dela-
mination area will increase significantly with increasing 8. Strait et al. (1 992) compared
the energy of impact at different stages of the impact event and the peak contact force for
various woven, cross-ply and quasi-isotropie layups. Strait found that quasi-isotropic

24
layups contained the highest darnage resistance capability. However, a clear trend of
performance was difficult to establish due to the vast differences in layups tested.
Hitchen and Kemp (1995) perforrned a more systematic study of stacking
sequence involving plies oriented at O", 4 5 O , -&O, and 90°. These ply orientations are
comrnonly used in industry when constmcting laminated composites (Vosteen and
Hadcock, 1994). The effects of ply grouping and ply orientation placement were studied
by comparing the damage initiation energy of impacted specimens. Hitchen and Kemp
found that the damage initiation energy increased by placing the M5O plies in the surface
layers and by increasing the nurnber of interfaces within the laminate. Fim, He, and
Springer (1 993) studied the above effects as well as the effect of increasing the number of
plies in the back ply group. Laminates with [On/90(8-n)]r layups were irnpacted for various
values of n. Fim et al. found that increasing the back face ply group also increased the
delamination size. Ply grouping increased the stresses which were aligned in the fibre
direction, promoting delarnination growth.
While several researchers have investigated various aspects of stacking sequence.
not one has developed a simple method of predicting the damage resistance for an
arbitrary layup. Changes in stacking sequence produce changes in the intemal stress state
which are complex and difficult to model. Therefore, the effects of stacking sequence are
difficult to establish without extensive experimental testing or detailed numerical
modelling.

2.4.4 Structural Response
A number of parameten are available fkom a drop weight impact test which
measures the global response of the system. These include structural response parameters
such as peak contact force, impact kinetic energy, maximum absorbed energy, and impact
velocity; and visual damage parameters such as indentation depth and visual surface
damage area. Considerable efforts have been made by researchers to determine if any of
these parameters are directly linked to the damage state of the laminate. Such a
parameter, if found, would be very usehl for prediction purposes.
The use of visual darnage parameters is attractive since they are compatible uith
inspection procedures currently used in the aerospace industry. New non-destructive
technologies are emerging to allow easier identification of damaged areas. Unfomuiateiy.
damage within composite materials also occurs intemally. The intemal damage is ofien
much larger than the externally visible damage. A simple visual inspection is insufficient
to gage the me damage state of the material. An additional complication is that the
indent depth of the damage region has been observed to reduce with time. As a result. the
usefulness of a visual parameter bas been very limited.
Peak contact force has been identified by Lagace et al. (1993) and Sjoblom.
Hartness, and Corde11 (1988) as the most suitable structural parameter for assessing
darnage resistance. A strong correlation was found between peak contact force and
topographical damage area for fixed impact and material conditions. With peak contact

26
force, cornparisons of damage resistance capabilities may be made between different
materials and layups. However, peak contact force may not be used to predict damage
within an arbitrary composite specimen. For fixed initial impact conditions, Straznicky et
al. (1995) have detemiined that peak contact force will vary based on material, loading
rate, and stacking sequence in a marner such that no noticeable trends are apparent. A
combined parameter which accounts for structural geometry, layup, and material would
be required for prediction of damage resistance.
2.5 Failure Theories
A number of theories has been proposed to predict the initiation of failure and its
progression. The formulation of these theories was based on a particular parameter such
as stress, total strain energy, or fracture toughness. Stress forms the basis for the majority
of the theories. The theories may be categorised into two stages of the impact event:
initiation and post-failure. initiation theories, as the name implies, determine the
locations of the onset of darnage within the laminate. Once darnage has occurred, the
laminate may still be capable of carrying load, with the damaged regions exhibiting a
reduction in stifkess and strength. Thus, post-failure theories are used in progressive
damage rnodelling to determine the arnount of strength reduction at each modelled time
increment during dynamic loading.
Various initiation failure theories exist to predict the intralaminar and interlaminar
damage. Intmlaminar darnage includes fibre fracture and matrix cracking. Interlaminar

27
damage refen to the damage between laminae, namely delamination. The theories are
applied in the forrn of a failure criteria. Parameters such as stress are checked against
pre-determined allowed values. If these values are exceeded, failure is assumed to occur.
The most cornmon darnage initiation failure criteria are described beIow.
2.5.1 Stress-based Failure Criteria
Stress-based failure critena may be classified into two categories: independent
and interactive. Failure modes for an independent failure criterion are separate and
distinct with no interaction between the modes. On the other hand, failure modes in an
interactive failure criterion are combined with each other to form a failure parameter. A
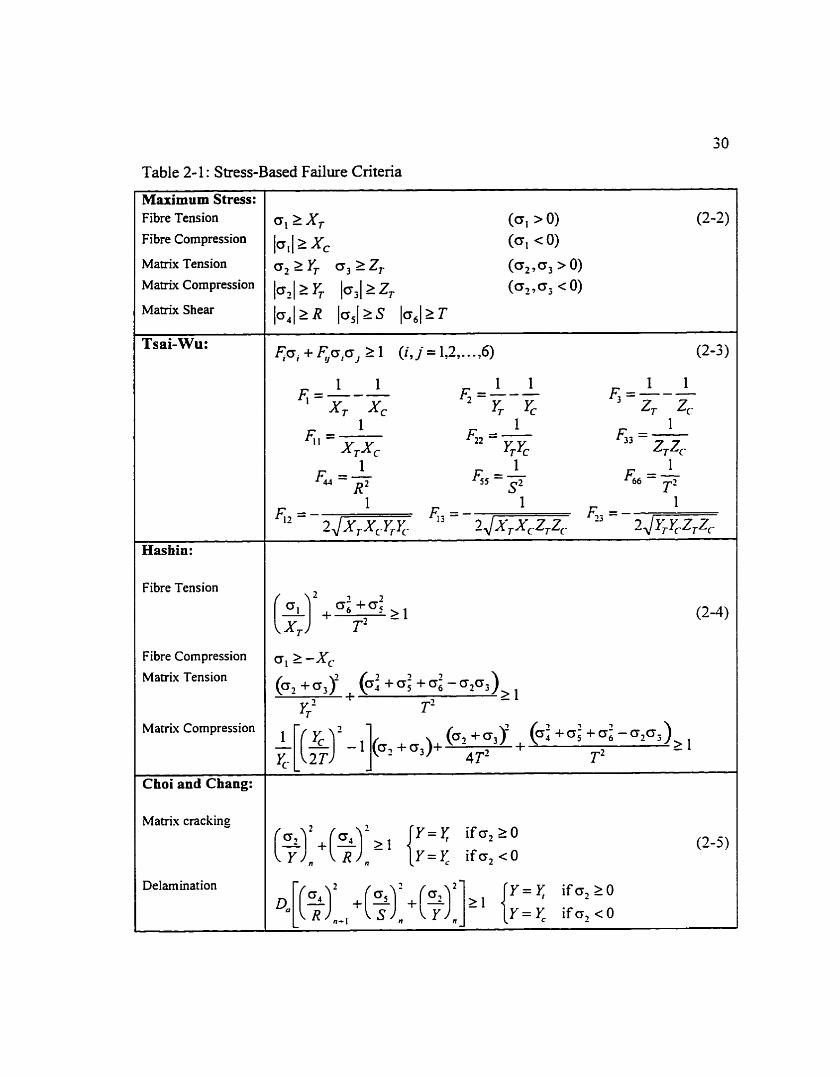
survey of both types of failure cnteria is listed in Table 2-1. The following nomenclature
is used in Table 2-1 : (XT, YT, ZT) are the tensile strengths in the (L2.3) directions. (R. S.
T) are the shear strengths in the (4' 5, 6 ) directions, (&, Yc. 2,) are the compressive
strengths in the (1,2, 3) directions, respectively.
In the maximum stress criterion (Ochoa and Reddy, 1992), failure is assumed to
occur if any of the six stress components exceed the maximum tensile or compressive
strengths. A similar criterion exists for strains. This cnterion is simple and allows for
imrnediate identification of the failure mode. Good agreement with experimental results
is obtained when uniaxial loading is applied (Gibson, 1994). However, since failure is
often the result of a combination of stress components, the maximum stress cntenon
tends to give conservative predictions of damage.

28
For loading applied dong multiple axes, interactive based criteria such as the
Tsai-Wu criterion (Ochoa and Reddy, 1992) are more appropriate. These criteria for
composite materials have evolved from failure theones for isotropic materials such as von
Mises cntenon. The terms in Tsai-Wu critenon, given in tensor notation in Table 2-1,
combine to form an elliptical failure surface. Unlike the maximum stress critena, the
Tsai-Wu criterion is more complex and identification of the darnage modes is dificult.
The Hashin (1980) cnteria are similar to the Tsai-Wu criterion' but allow for the
identification of the damage modes. Hashin identified some of the limitations of using
the Tsai-Wu criterion: and proposed a separate failure criterion for four types of failure
modes: fibre tension, fibre compression. matrix tension, and matrix compression. Each
criterion is based on a summation of terms containing a squared ratio of stresses to
strengths. The Hashin critena apply to darnage modes based on unidirectional laminates.
not multi-directional damage modes such as matrix cracking between layers and
delamination.
Choi and Chang (1992) proposed a set of interactive failure criteria to predict
matrix cracking and delamination in mulü-directional laminates. The criteria are similar
in f o m to the Hashin criteria and to other previously proposed interactive failure criteria.
including that of Brewer and Lagace (1988). Matrix cracking is initiated by the in-plane
matrix stress q and the transverse shear stress a,. The matrix cracking cnterion is
applied at each layer n, where stresses q and 0, are the averaged stresses within the

29
layer. Delamination is initiated by the @ansverse shear stress o4 in the top layer n + l and
by the in-plane maûix stress q and transverse shear stress 0, in the bottom layer n of the
ndi interface. The delamination criterion is applied at each interface, where the stresses
0 ~ , cr4, and os are given as the averaged stresses in the respective layes. A scaling factor
Da is used to correlate predictions with experimental results. Choi and Chang applied
their criteria to predict damage in severai experimentally impacted laminates and found
good agreement.
2.5.2 Other Failure Criteria
Alternative failure criteria have been developed, ofien in response to limitations of
stress-based failure criteria. Finn and Springer (1993) developed a failure criterion to
predict the size and shape of delaminations based on strain energy. The strain energy
density was calculated fiom stresses determined by Finn and Springer to promote
delamination. Failure occurred when the strain energy density exceeded the energy r
required to delaminate a surface of unit area. Detemiining the delamination energy r is
difficult, and is ofien assumed to be the mode 1 fracture strength G,,.
30
Table 2- 1 : Stress-Based Failure Criteria
Maximum Stress: Fibre Tension
Fibre Compression
Mauix Tension
Matrix Compression
Matrix Shear
Tsai-Wu:
Hashin:
Fibre Tension
Fibre Compression
Matrix Tension
Matrix Compression
Choi and Chang:
Matrix cracking
Delamination
Ta, + E;;,o,o, 2 1 (i, j = l , 2 ,..., 6)

It has been suggested that the extension of delamination is governed by the
fracture properties of the materid rather than the stress state, as previously descnbed in
Section 2.4.1. One approach, applied by Wang and Vu-Khanh (1994), uses the saah
energy release rate of the matenal. Prediction of final extent of delamination requires the
knowledge of a delamination arrest toughness, which Wang and Vu-Khanh determined
through f ~ t e element modelling and experiments to be close to the mode II fracture
Gik-
For predicting darnage fiom mixed-mode fiactures, an interactive failure criterion
is ofien used (Jones et al., 1 988). ï h e criterion is expressed as:
where Gk and GIIc are critical strain energy release rates, and a and b are constants. This
criterion has been used by Liu and Chang (1994) to determine the matrix cracking effect
on delamination growth. The strains rates are determined numerically using a crack
closure technique (Rybicki and Konninen, 1977). The variables a and b were determined
to give a best fit to experimental data.

2.6 Damage Prediction
Under static or impact loading, a complicated three-dimensional stress state which
may lead to rnatrix or fibre darnage develops within a larninated composite. The intemal
stress distribution is dependent on many factors as descnbed above, including stacking
sequence and ply thickness. Once damage occurs, the intemal stress state will be altered.
affecthg future damage as the load is increased. This complicated stress state and the
progressive nature of damage propagation are factors which need to be addressed when
attempting to predict impact damage.
2.6.1 Empirical Methods
Several researchers have attempted to apply simple empirical methods to predict
darnage. These approaches attempt to model the key characteristics of the final damage
state without calculating the internai stress state or progressive damage propagation.
Clark (1989) proposed an empirical delamination model based on a two-ply
c ~ ~ g u r a t i o n . Under load, the curvatures of each individual ply within the larninate will
create regions of tensile forces promoting delamination and compressive forces
suppressing delamination. Clark predicted that the major axis of the characteristic
"peanut-shaped" delamination will be oriented dong the fibre direction of the lower ply
widiui an interface. This model makes no attempt to determine the size or exact shape of
the delaminated region, thus is only useful for visualisation purposes.

33
Liu (1988) also studied the delamination damage present within two-ply
specimens. Liu proposed that shape of the delamination is dependant on the bending
stifiess mismatch between the two plies, represented by the coefficient M:
where Dl 1(0) is the bending stifiess coefficient at angle 8, Ob and 0, are the fibre angles
of the bottom and top lamina respectively. The mismatch coefficient M was used to
predict the size and shape of [0,/e4] graphite/epoxy specimens at various ply angles 8.
While this approach could $ive generai predictions of delamination damage for two-ply
specirnens, extending this hypothesis to predict damage in multi-ply specimens was
found to be inadequate for several reasons, as reported by Fuoss, Straaiicky, and Poon
(1 994). For multi-ply laminates, computation of the top and bottom stiffhess coefficients
DI, at a given interface would now involve summing the stiffness of each lamina above
and below the delamination respectively. Since the interface is no longer limited to the
midplane of the laminate, the difference of bending coefficients may be skewed to $ive
erroneous results when caiculating coefficient M.
An alternative approach was attempted by Fuoss et al. by first assuming die top
and bottom plies comprising the interface form a two-ply larninate, for which M could be
calculated using Equation (2-7). Then, the coefficient M was scaled at each interface i
using :

where Db, Di are the stiffhess coeficients for the boaom and top laminae groups
respectively, and a, b are constants. This approach would avoid the skewing effects
associated with a direct extension of the mismatch method as described earlier. A similar
stifkess ratio was used by Wu and Springer (1988) to give reasonable predictions of
delamination size. On cornparison to impact damage within 24-ply quasi-isotropic
specimens. Fuoss et al. found that coefficient M, given by Equation (2-8), did not
accurately predict the delamination size through-thickness. Based on the above analysis.
bending stiffkess was found to be insufficient to predict impact darnage. A combination
of several parameters may be required to accurately mode1 damage within a laminated
plate.
Monta et al. (1995) also addressed another limitation of Liu's mismatch coefficient
M. For the case of unidirectional laminates, the difference in in-plane stiffness equals
zero. However, the calculated value of M for unidirectional laminates does not equal
zero in al1 cases. This situation arises fiom the fact that M is calculated solely on the
difierence of bending stiffnesses between plies. Monta el al. identified this limitation
and proposed a new parameter P which accounts for the differences of in-plane and
bending stiffhess:

35
where AQ, 1(8) is the difference in the in-plane stifiess between the adjacent laminae in
direction 0, T(8) is distance îhrough-thickness fiom the neutrai s d a c e to the interface.
and D,, is the bending s t iaess coefficient of the entire laminate. Parameter P is a
measure of the maximum bending stress discontinuity, given as an integrated quantity
with respect to 8. Morita el al. cornpared parameter P to the topographical impact
damage area of APC-2/AS4 specimens with various stacking sequences and found
reasonable linear correlation. Further testing is required to verify this rnethod, as only a
few specimens were tested for this study.
Analytical Methods
While empirical methods are useful for visualising the characteristics of impact
damage. they fa11 short of being a useful tool for darnage prediction. Therefore, attempts
have been made to formulate analytical mathematical models which determine the
response and intemal stress state in the material. These stresses can then ultimately be
used to predict damage.
Several researchers have developed analytical models to predict the dynamic
response of the specimen. Dobyns (1 98 1) used plate equations fiom Whitney and Pagano
(1970) to determine the deflection and interlaminar stresses within simply-supported
orthotropic plates. Christoforou and Swanson (1991) used a Fourier series expansion
with Laplace transform techniques to determine the impact load history for simply-

36
supported plates. More complicated methods were used by Matsuhashi et al. (1993) to
account for the non-linear effects of membrane stiffenùig.
Bogdanovich and Friedrich (1994) developed a rigorous mathematical model to
determine the displacement history of the structure. The maximum stress and a second-
order tensor-interactive failure critena were applied to determine the initiation of damage.
A ply-by-ply progressive failure algorithm proposed by Bogdanovich et al. was then
applied to determine the final damage state. However, the calculations are complex and
the analysis was limited to simple conQurations such as unidirectional or cross-ply
Iayups.
2.6.3 Numerical methods
The majority of the curent research is focused on using numerical methods. such
as the fmite element method, to determine the stress or energy state of the material under
load. This approach has the advantage of being able to handle a variety of stacking
sequences and loading types. Choi and Chang (1992) employed the use of a dynamic
finite element model with an appropriate contact law to determine the stress state. A
damage model was developed based on experimental observations to predict darnage
based on the calculated stress state. This model is semi-empirical as it does not account
for the progressive nature of the damage propagation or the interaction of delaminations
between plies. In spite of these limitations, reasonable agreement was found between
experimental and numencal calculated darnage within quasi-isotropic specimens.
37
More detailed modelling of the impact problem was perfonned by Majeed (1995).
A dynarnic finite element model with contact analysis and a progressive failure criterion
was utilised to simulate the impact of a quasi-isotropic coupon specimen. The specimen
was discretized with four-noded Belytschko-Tsay quacirilateral shell elements. The use
of quadrilateral elements allows large reductions in computational ùme. However, these
shell elements do not ailow the calculation of through-thickness normal stresses and
poorly model the transverse shear stresses. As a result, interna1 delaminations were not
modelled. Solid hexagonal elernents were used to discretize the supporting base and
impact apparatus. Majeed applied the Chang-Chang failure cnteria (1987) with a
modified post-failure stress degradation based on Humphreys (1 98 1) to account for the
progressive growth of damage due to matnx cracking, crushing, and fibre breakage.
With this comprehensive composite damage model, Majeed was able to
accurately simulate low energy impacts resulting in an elastic response with no damage.
The calculated impact force, energy, and strain histones were d l in good agreement with
experimental values. Simulations of high energy impacts, sufficient to create back-face
fibre damage, were not as prornising. With the simulation of damage, the model became
very computationally intensive and suffered fiom mesh dependency. The calculated
impact response was found to be sensitive to both the failure threshold and the fibre post-
failure behaviour. With modifications to the post-failure criteria, Majeed was able to
reasonably predict back-face fibre breakage, but greatly overpredicted the extent of
matrix cracking by 1 19%.

Other researchers have attempted damage modelling using dynamic f ~ t e elernent
analysis with varying degrees of success. Finn and Springer (1993) analysed and
identified the stresses which prornoted delamination and matrix cracking. A failure
criterion based on the total strain energy of the system was then used to predict damage.
The model employs the use of 3D finite elements. However, to reduce computational
effort, several plies through-thickness were rnodelled within a single element. This
created a smearing eEect on the calculation of stresses of individual plies within the
element.
Given the computing power available, designs of new composite structures are not
yet feasible using the dynamic fuiite element models as presented above. Thus. other
approaches have been attempted. Hong, Choi, and Kim (1994) took advantage of quasi-
static characteristics of the low-velocity impact response by using a static FE model to
calculate the desired stresses. The peak contact force was fnst deterrnined from a new
analytical model of the contact force history (Choi and Hong, 1994). Then, the peak
force was applied as a static point load in the FE model. Nine-noded 2D shell elements
with a higher-order shear deformation formulation were used to model the laminated
plate. Failure was determined using a modified Choi and Chang (1992) failure criterion.
Hong et al. used this mode1 to reasonably predict damage in cross-ply laminates:
therefore, this model provides a promising approach to determine damage in specimens
with general layups.
2.7 Summary
Impact damage in composite materials is a complex event which involves several
damage mechanisms including matrix cracking, delamination, and fibre breakage. The
damage may occur both intemally and extemally. For quasi-isotropie layups, the damage
state hm been extensively charactensed and occurs in a manner defined as the
Characteristic Damage State. Exact prediction of impact damage is difficult due to the
large number of parameters which may affect the damage state. Such parameters include
changes in material, layup, and boundary conditions. To study the effect of a single
parameter, fixed test conditions are used.
Two approaches have been used to predict damage: strength of materials and
fracture mechanics. Strength of materials is suitable to predict the darnage initiation, but
was found to be limited in predicting damage growth. Fracture mechanics is a more
suitable approach for damage growth prediction. However, it is more complex and has so
far been able to predict damage only in simple layup confi~gurations such as cross-ply. As
a result, the strength of materials approach, despite its limitations, is used to predict both
damage initiation and growth.
Several methods have been used to predict damage based on the strength of
materials approach. The most comrnon method found in literature is the application of
the finite element (FE) method combined with a failure criterion. The FE method is used

40
to calculate the intemal stress state of the material under load. The stresses are checked
using a failure criterion to detennine the existence of damage. The impact load has been
modelled using either static or dynamic analysis. Due to the large computational expense
of the FE method, efforts have been made to develop a simple parameter which govems
the amount of impact damage.
Future research is currently directed in several areas. New methods are being
examined to improve the speed and accuracy of the FE calculations, including the
development of more efficient element formulations. Research is continuing to allow
fracture mechanics based analysis to predict damage in more comrnon layup
configurations. Also, the patterns and trends of impact darnage are being closely
examined with hopes to detemine a sirnplified prediction method.

Chapter 3
Mode1 Development
3.1 Introduction
As reported in Chapter 2, altering the stacking sequence of a laminate will have a
significant effect on the damage resistance. The effects of stacking sequence on darnage
resistance were analysed in this thesis by modelling the intemal stress state associated
with a given stacking sequence. The analysis was performed in the following manner. A
standardised test procedure was adopted to isolate the effects of stacking sequence from
other parameters such as boundary supports and load conditions. A detailed finite
element (FE) model was developed to simulate the stress state within a transversely
loaded laminate. Results from the FE mode1 were compared with experimental data to
establish trends associated with changes in stacking sequence.
This chapter presents the details of the FE model in three parts. First. a
description of the experimental test procedure adopted for this thesis is given. Next. an
overview of the FE mode1 is presented. Finally, details of the verification checks
performed to establish the accuracy of the results are given. The results from the
numencal model, including cornparisons to expenmental data, are presented in Chapter 4.

3.2 Experimental Test Procedure
The numerical mode1 used for this study simulates a drop-weight impact test
outlined in Boeing Specification BSS 7260 (Boeing, 1988). The Boeing specification is a
standard used for impact and subsequent compression testing of composite laminates.
The specification was adopted for this study to allow cornparisons with other
experirnental data available in literanire. Unless othenvise noted, experimental data
published in this thesis were previously obtained by Vietinghoff (1994). A brief
description of the test specimens and expenmental procedure is given in this section. A
full description of the experimental procedures may be found in the work published by
Vietinghoff.
3 2.1 Coupon Specimens
The esperimental coupon specimens are flat panels with plana dimensions of
152.4 mm x 101.6 mm (6.0 in x 4.0 in). The coupon specimens are constnicted from a
fibre/matrix prepreg roll. The prepregs are cut into layers which form the individual plies
of the laminate. The plies are oriented and stacked by hand. with the aid of templates. to
give the desired layup. The prepreg panel was cured in an autoclave' in accordance xith
the manufacturer's specifications. The cured panel was then sectioned into six specimens.
with each specimen machined to the correct dimensions. Each coupon specimen was
checked using ultrasonic C-scanning to insure no manufacturing f l a w were present.

43
Two different material systems were tested by Vietinghofi Toray TSOOW3900-2
and Hercules AS4/350 1-6. The Toray T800W3900-2 is newer composite material with
increased toughness to give improved mode I and mode II fracture strengths. Hercules
AS4/350 1-6 is an older matenal system with a brittle matrix, which has a poorer damage
resistance capability as compared with T800W3900-2. The in-plane material properties
of both material systems are found in Table 3- 1 (Gaudert et al., 1993; Poon et al., 199 1 ).
3.2.2 Test Apparatus
Impact tests were performed using the Dynatup 8200 instrurnented drop weight
impact system. The system was configured to comply with Boeing BSS 7260
specification for class 1 impacts. nie test apparatus. illustrated in Figure 3-1. consisted
of three main components: impactor. supporting base. and data acquisition system (not
show). The impactor tup was comprised of a 15.9 mm ( 9 8 in) hemispherical head
made of hardened steel with an attached load cell to measure the impact load. The total
mass of the tup assembly was 5.44 kg. The tup was mounted on a drop tower assembly
which restricted the motion of the tup to directions normal to the plane of the specimen.
The drop tower was located to allow the tup to make contact at the specimen's centre. A
Iatching mechanism was mounted on the drop tower to prevent repeated impacts.
The aluminurn/plywood supporting base with a rectangular cut-out supports the
specimen at its outer boundaries. The specimen was positioned over the rectangular cut-
out by three locating pins. Four rubber-tipped clampso providing light clamping pressure.

Table 3- 1 : Ln-Plane Matenal Properties (Gaudert er al., 1993; Poon et al., 1 99 1).
. W .
~ r a k v e r s e Modulus, E2 (GP~). 8.07 8.2 Shear Modulus. G,, GPa) 4.14 6.2 - .& .
1 Poisson's Ratio. v,, I
1 0.35 1 0.30
Longitudinal Tensile Strength, XT (MPa) Longitudinal Compressive Strength, Xc (MPa) Transverse Tensile Strength. YT (MPa) Transverse Compressive Strength, Yc (MPa) Shear Strenath. R (MPa)
were used to support the specimen during impact to prevent rebounding. This
configuration approximates simply-supported boundary conditions (Avery et al., 1990).
Plv Thickness, h, (mm)
Data rneasurements were obtained using a persona1 cornputer equipped with a
GRC 730-1 instrumentation package. The system monitors the load during the impact
event at a sampling rate of 1024 data points within a time interval of 10 ms. The initial
impact velocity at the point of contact was measured using an i&ared detector. The
detector also triggers the start of load sampling. The data were stored on hard disk for
friture analysis. The system software is capable of determining the energy history,
displacement history, and total energy absorbed during impact fiom the load history. The
software can also determine the peak contact load, absorbed energy, and maximum
impactor displacement.
2772 1480 79.3 231 .O 132.8
2144.3 824.6 46 -2 172.4 110.3
0.19 0.14

Hemispherical lndenter
Rubber-Tipped Clamps (4)
Coupon Specimen
A. Supporting Base / ' ',-, '. /'-
,
Al1 Dimensions in mm
Figure 3 - 1 : Experimental apparatus

3.3 Mode1 Methodology
A cornprehensive model was developed to deterrnine the intemal stress state of a
composite specimen and the subsequent damage which occun under transverse impact
loading. To accurately account for the complexity of the impact event, as previously
described in Chapter 1, the finite element (FE) method was employed. The FE method
allows the modelling of realistic geometric configurations including lamination stacking
sequence and boundary conditions. A failure criterion was applied using the FE data to
determine the extent of the predicted damage.
Numencal modelling was performed by the NISA II finite element software
progrm (EMRC 1994a.b). The NISA II program includes the DISPLAY III pre- and
post-processor. an interactive graphical interface for model development and subsequent
data analysis. The NISA II code is capable of calculating a variety of parameters
including stress, strain, and displacement. AI1 computations were performed using a
Silicon Graphics IRIX Challenge LI2 workstation. at the Institute for Aerospace
Research. National Research Council Canada.
A static load model was used to determine the interna1 stresses. The use of a
static mode1 to analyse a dynamic impact problem is appropriate for the low-velocity.
high-mas impact loading used for this study, as previously discussed in Section 2.42.
For this class of impacts. the contact duration of the impactor is much larger than the
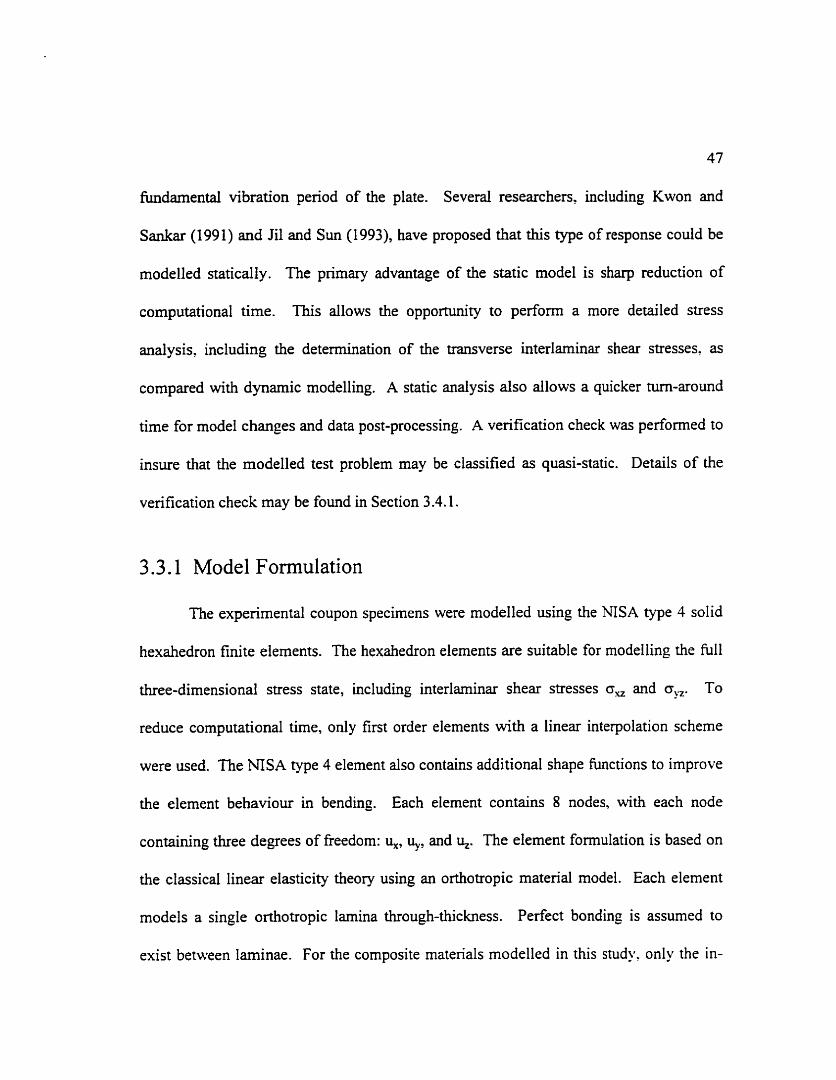
47
fundamental vibration period of the plate. Several researchers, including Kwon and
Sankar (1 99 1) and Ji1 and Sun (1 993), have proposed that diis type of response could be
modelled statically. The primary advantage of the static model is sharp reduction of
computational time. This allows the oppomuiity to perform a more detailed stress
analysis, including the determination of the transverse interlaminar shear stresses. as
compared with dynamic modelling. A static anaiysis also allows a quicker tum-around
tirne for model changes and data post-processing. A verification check was performed to
insure that the modelled test problem may be classified as quasi-static. Details of the
verification check may be found in Section 3.4.1.
3.3.1 Mode1 Formulation
The experimental coupon specimens were modelled using the NISA type 4 solid
hexahedron finite elements. The hexahedron elements are suitable for modelling the full
three-dimensional stress state, including interlaminar shear stresses o, and o,. To
reduce computational tirne, only first order elements with a linear interpolation scheme
were used. The NISA type 4 element also contains additional shape bc t ions to improve
the element behaviour in bending. Each element contains 8 nodes, with each node
containing three degrees of freedom: u,, uy, and 4. The element formulation is based on
the classical linear elasticity theory using an orthotropic material model. Each element
models a single orthotropic lamina through-thickness. Perfect bonding is assumed to
exist between laminae. For the composite materials modelled in this study. only the in-

48
plane properties were available. The out-of-plane properties were obtained by assuming
the composite is transvenely isotropie in the 2-3 plane. This assumption is reasonable
since the material behaviour transverse to the fibre direction is similar for both the in-
plane direction ? and out-of-plane direction 3 (Agarwal and Broutman, 1990). As a
result, the following relationships were assumed:
The out-of-plane shear strengths were also assurned to be equal to the in-plane shear
R = S = T (3-2)
where R, S, and, T are the shear strengths in the 4- 5 , and 6 directions. The in-plane
properties listed in Table 3-1 together with the out-of-plane properties given by Equations
(3-1) and (3-2) fom the complete set of material properties used by the numencal model.
The in-plane element discretization of the FE model is illustrated in Figure 3-2.
The entire specimen was modelled, as symrnetry did not exist for the majority of layups
examined for this study. The model contained four levels of mesh refinement towards the
specimen's centre, giving a total of 300 in-plane elements. The mesh-refined areas
improve the computational accuracy since regions with changing stress gradients esist
near the point of loading. The in-plme aspect ratio of the elements was unity for al1
elements except for elements used to transition fiom coarse to fine meshed regions. This
minimised the interpolation errors due to elernent distortion. Each lamina within the

49
coupon specimen was modelled using a minimum of three elements through-thickness.
For a 24-ply laminate, a total of 21600 elements were used to model the plate. Tile size
of this FE model was the maximum size which the Silicon Graphics IRIX Challenge L/2
workstation, used for calculations, was capable of handling in ternis of hard disk space.
The boundary supports of the experimentai test jig were idealised as simply-
supported at each of the specimen edges, as shown in Figure 3-3. The simply-supported
conditions were Unposed by constraining, to zero, displacements the normal to the edge,
q,, and transverse displacements, p, at the midplane nodes of each edge. A reduced
specimen size of 127 mm x 76.2 mm (5 in x 3 in) was modelled to correspond with the
dimensions of the rectangular cut-out present within the supporting base. These idealised
support conditions allow a large reduction of computational time by allouing fewer
elements to be used when modelling the specimen. This simplification will increase the
error in the stresses calculated near the plate boundaries, due to the differences between
the modelled and actual bending of the plate. However, around the point of impact away
fiom the plate boundaries- the modelled support conditions have a minimal effect on
calculated stresses. These support conditions are consistent with the works of other
researchers, including Finn and Spnnger (1 993), and Ochoa and Reddy (1 992).

Figure 3-2: Element discretization of coupon specimen
midplane U, = Un = O
Figure 3-3: Sirnplp-supported boundary conditions for numencal mode1

The impact load is idealised as a point force at the top centre node of the model.
The static load corresponds with the peak contact force of the impact event. For
cornparisons purposes, a force of 7.5 kN was applied. This load was chosen to create
damage at each interface, while keeping the extent of the damage within the mesh refined
regions as much as possible for Toray T800W3900-2 specimens. This improves the
accuracy of the computed stresses within the projected damage regions. The 7.5 kN
applied load corresponds approxirnately to an 12 J impact. Experhental data used in this
chapter were fiom specimens subjected to a 15 J impact, with a peak contact force of 8.5
m.
A set of constitutive equations which govem the material response are formulated
by NISA II using the principle of minimum potential energy to satis. the applied load
and boundary conditions. The displacement and subsequent stress solutions were found
by solving the set of constitutive equations using a wavefiont technique. A typical
solution nui required approximately 700 MB of storage space and 75 minutes of
processing time. The output of a run includes the displacement, stress, and strain energy
at each node. Al1 quantities from a NISA II run are referenced to the global coordinate
axis of the laminate (see Figure 2- 1).

3.3.2 Darnage Prediction
Prediction of darnage Mthin the specirnen was made by applying the Choi and
Chang (1 992) failure cnterion, given by Equation (2-5) (see Section 2.5.1). The cnterion
uses the stress state as determined by the FE model to predict the initiation of matrix
cracking and delamination. Back-face fibre breakage and indentation damage underneath
the impactor are not considered in this cnterion. The criterion also does not account for
material degradation or the interaction of delaminations and matrix cracking between
plies during damage propagation. In spite of these limitations. the ChoiKhang cnterion
gave good predictions of the damage state within impacted specimens. Therefore. while C
the criterion does not model al1 the mechanisms involved in darnage propagation, the
stress state before darnage initiation has been found to indicate the trends of the final
darnage state.
The cntenon is applied at each interface using stresses which are averaged within
the ply or ply group adjacent to the interface. To determine an appropriate stress
averaging scheme. the dirough-thickness stresses at a selected point were exarnined for a
Toray T800W3900-2 specimen wvith a quasi-isotropic layup of [-6,/0,/4j3/90,],. A 7.5
kN point load was modelled at the specimen centre. The stresses fiom this specimen
were considered typical for the Iayups exarnined in this study. A survey of stresses with
respect to thickness z are found in Figures 3-4 through 3-6. The interface locations are
indicated by the vertical lines. The point z = O corresponds with the back face of the

53
laminate. Stresses a,, o,, and o, were found to be discontinuous at each interface. For
these stresses, the values calculated exactly at an interface indicate the average stress
between the two adjacent laminae. Including this value when averaging stresses within a
ply group will skew the result. Therefore, stress values calculated exactly at the
interfaces were ignored for stress averaging. Stresses c,, o,, and o, were found to be
continuous across each interface. Thus al1 points including the stress values at the
interfaces were used when stress averaging within a ply group.
Before the failure criterion was applied the global stresses were transformeci into
the local lamina coordinate system using the standard rotation matrix given in Equation
( 2 ) A custom-made program was created in FORTRAN to read the global stress
results from MSA II, transfomi global stresses into local stresses, apply a failure
cnterion, and finally output the data in a DISPLAY III readable results file. The
remaining post-processing was performed in DISPLAY III to sample data and plot
results. The FORTRAN program is available from the Department of Mechanical and
Aerospace Engineering, Carleton University, upon request.

Figure 3-4: In-plane stresses o, and o, at point (1 -58 mm, 1.58 mm, z) for [-453/03/453/903]59 load 7.5 kN

Figure 3-5: Transverse normal stress O, and in-plane shear stress O,, at point (1.58 mm, 1 S 8 mm, z) for [453/03/453/903]5, load 7.5 kN

Figure 3-6: Transverse shear stresses a, and at point (1.58 mm, 1.58 mm, z) for [-M3/03/4S3/903 J5, load 7.5 1ùu

3.4 Mode1 Verification
Several venfication tests were performed to determine the quality of numerical
results. The tests are designed to evaluate the performance of the elements used for
modelling and the errors associated with modelling the geometry of the coupon specimen.
3.4.1 Quasi-Static Approximation
The quasi-static modelling of the impact response is a fundamental approximation
which is used for this study. A calculation check was performed to insure that the
dynamic effects of the system could be neglected. From a cornparison of stresses under
both dynarnic and static loading, Swanson (1992) reported that the quasi-static
approximation is valid when the fiequency of the impact ai is less than 1/3 of the natural
fiequency on of the structure. n i e impact fiequency oi was determined experimentally
fiom the measured force history during the impact event:
where Ti is the contact period. For this verification check, ai was determined for a Toray
T800W3900-2 quasi-isotropie specimen with stacking sequence [-45/0/45/90],,. This
specimen is typical of specimens exarnined in this study. n i e measured period T, for this
specimen is 4.44 ms, and the resulting fiequency ai was calculated to be:

58
The natural fiequency a, was calculated using the NISA II eigenvalue solver.
The coupon specimen was shulated as a 127 mm by 76.2 mm (5 in by 3 in) plate with
simply-supported boundary conditions. The reduced specimen size was used to give
bener correlation with the actual experimental support conditions. The plate was
modelled using 20 x 12 NISA type 32 composite shell elements. The mathematical
formulation of the shell elements include effects due to membrane stretching, bending,
and transverse shear (EMRC 1994b). The density was adjusted to simulate the actual
mass of the specimen using the reduced modelled volume. In-plane translations and
rotations about the normal to the plate were constrained at every node. Transverse
displacements were constrained at the edges.
The first four calculated vibrations modes of the coupon specimen are illustrated
in Figure 3-7. The natural fiequency on was determined to be 2234 Hz; a fiequency
which is almost 20 times greater Sian the actual impact fiequency. This satisfies the
quasi-static cnterion, allowing dynamic vibrational effects to be neglected for diis study.

1 Mode 1 a = 2234 Hz 1
1 Mode 3 0=6619 Hz 1
Mode 2 a = 4063 Hz
Mode 4 61 = 6927 Hz
Figure 3-7: Vibration modes of a 24-ply quasi-isotropie coupon specimen

3 A.2 Element Performance
The performance of the NISA type 4 finite elements was tested by solving a test
problem with a known analytical solution. The MSA type 4 elements are 8-node solid
elements using linear interpolation. The numerical accuracy was then assessed b y
comparing the numerical solution against the analytical solution. The test problem
modelled the transverse loading of a cross-ply simply-supported rectangular plate. This
problem was previously solved by Pagano (1970a). Material and geornetry data for the
problem are given in Table 3-2. The notation used to reference the plate is given in Figure
3-8. The applied Ioad q, at the top surface of the plate was specified as:
where constant o = -1. The imposed boundary conditions were taken as:
A 3-ply laminate was modelled with a stacking sequence of [0/90/0]. Each lamina has a
thickness of 1 in.
A sampling of the numerically-generated stress state is found in Figures 3-9
through 3-1 1. The following normalisation constants were used when reporting results:

6 1
On cornparison with stress plots published by Pagano, the agreement is excellent.
A cornparison of stresses sampled at selected points for both andytical and numerical
solutions are found in Table 3-3. The largest errors occurred at the edges of the plate.
This is due to the reduced number of points available for stress averaging. The deviation
between the exact and FE solution appears greater in Figure 3-1 1. This is due to the
smaller scale used for (I, . The error of approximately k0.02 for stress E_ is consistent
with the calculation errors for the other stresses. Stresses sampled within the laminate.
namely a,, agree very well with the andytical solution. The results ven& the FE mode1
formulation and solution generated by the NISA II code.

Table 3-2: Material and Geometry Data for Rectangular Plate Test Problem
Longitudinal Modulus, El (psi) Transverse Modulus, E, (psi)
1 Poisson's Ratio. vq3 1 0.25 1
25 x 10" 1.0 x l ob
Shear Modulus, G,, = GIJ (psi) Shear Modulus, G,, (psi)
0.5 x 1 Ou 0.2 x 1 ob
. . . 1 Thickness. h (in) 1 3 1
Length. a (in) VVidth, b (in)
Figure 3-8: Plate notation
12 12
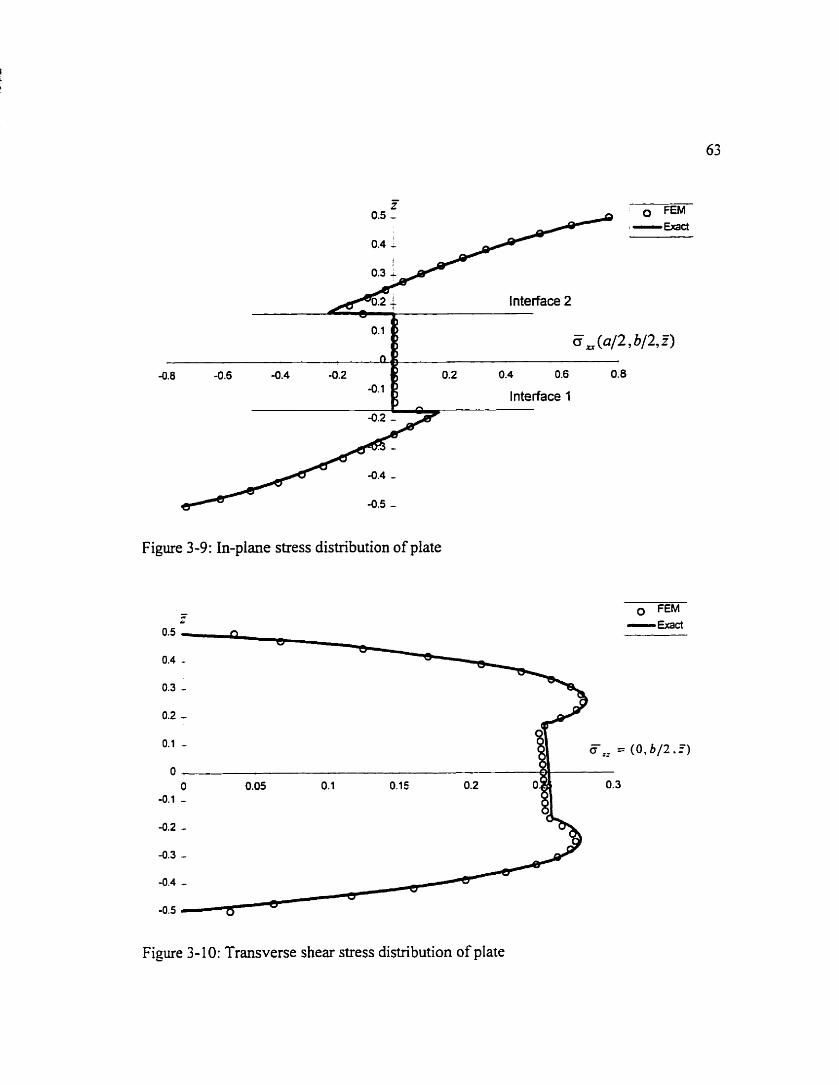
Figure 3-9: In-plane stress distribution of plate
O FEM E x a c t
(O, b / 2 . i)
Figure 3-1 0: Transverse shear stress distribution of plate

O FEM
k 0 . 2 - interface 2
0.02 0.04 O. 06
h Interface 1
Figure 3-1 1 : In-plane shear stress distribution of plate
Table 3-3: Analytical and Numencal Stress Solutions for Plate Bending Problem

Geometric Modelling
Specimens modelled in this study have in-plane dimensions which are rnuch
Iarger than the thickness. As a result, elements used to mode1 this geometry will have
poor length-to-thickness aspect ratios. Nomal guidelines suggest using finite elements
with aspect ratios of 3 or less for stress solutions (EMRC 1994b). Exceeding this ratio
rnay result in an ill-conditioned stifiess matrix, which in hun produces high round-off
errors in the solution. Ill-conditioning is a particular problem in regions which contain a
transition f?om a coarse to fuie mesh. For this study, elements used to mode1 regions of
high stress contain length-to-thickness aspect ratios as high as 50. The high aspect ratio
is an obvious cause for concem when modelling the structural response of the specimen.
A parametric study of a test problem with a known exact solution was performed
to determine the effect of using high aspect ratio elements. The test problern chosen for
this study is the cylindrical bending of a composite beam under a sinusoidal load. This
problem was solved previously by Pagano (1970b). The beam contains two laminae of
equal thickness with a layup of [W-151. This type of layup will also test the accuracy of
the NISA II software code to calculate shear coupling effects which exist between the
layers. Material and geometry data for the problem is given in Table 3-4. The beam
notation is illustrated in Figure 3-12. Translations normal to the plate are constrained at
two opposing edges of the bearn, while the remaining edges are fiee. A sinusoidal load is
placed the top face of the beam. equivalent to:
A relaûvely coarse mesh of 8 x 4 elements was used to mode1 the in-plane dimensions.
Several nuis were performed, with each run increasing the nurnber of elements through
the thickness while holding the number of in-plane elements fixed. Stresses were
sampled dong the midpoint of the width of the beam to avoid stress concentrations which
are present at the edges.
The transverse shear stress 5, at point x = O and the direct in-plane stress iF, at
point x = 5 were calculated and compared for each run. as s h o w in Figure 3-13 and
Figure 3-14 respectively. The reported quantities were normalised using Equation (3-7).
The nurnber of elements used through-thickness is indicated in the legend of each figure.
Al1 stresses are reported in the global coordinate system. Both plots show convergence of
the solution at 32 elements and greater, through-thickness, and give excellent agreement
when compared with the exact solution as reported by Pagano (1970b). The highest
aspect ratio modelled is 640, using 512 elements through-thickness. Even at this aspect
ratio, the solution shows no signs of ill-conditioning. From these results. accurate
solutions of the intemal stress state may still be obtained when using a high element
aspect ratio through-thickness for this problem.

Table 3-4: Material and Geomew Data for Beam Bending Test Problem
1 Longitudinal Modulus, E, (psi) 1 25 x ' IO0 1 - . - 7 -
1 Transverse Modulus, E, @si) 1 1.0 x lob
1 Poisson's Ratio, v,, 1 0.25
Shear Modulus, Gl2 = G13 (psi) Shear Modulus, GP1 (psi)
0.5 x 1 O0 0.2 x lob
Figure 3 - 1 2: Beam notation
Width, b (in) Thickness. h (in)
I O 1

' 2-
i 0 32 elements ' - - - 1 2 8 e l m t ç
: - - - - - 256 element~ - 512 efements
i - Exad Sdution
-0.6 -
Figure 3-1 3: Transverse shear stress distribution of beam
2 e l m t s O 32 eîements
- - - 128 elements - - - - - 256 elements - 51 2 elements E x a c t Solutim
-0.6 -
Figure 3-14: In-plane stress distribution of beam

3.4.4 Convergence
The solutions obtained fkom a fullte element analysis are dependent on the mesh
size of the model. By continually increasing the number of elements within the mesh, the
stress solution normally converges to a particular value. The convergence of the
numerical model used in this study was performed through an iterative process of mesh
refmement. The mesh was refmed at the centre of the specirnen. Stresses calculated at
the specirnen's centre will have the largest enors, due to the rapidly changing stress
gradients which are present in this region. For this study, a Toray T800W3900-2
specimen with layup [-45/0/45/90],, was modelled using three different element
discretizations. illustrated in Figure 3-1 5. The mesh of model CSS-LA is the sarne mesh
used for simulation models of this study. Each successive model contains the sarne nodes
of the previous model, but doubles the number of in-plane elernents at the specimen's
centre. Keeping the nodes of previous models in the refined model allows direct
cornparisons of the stress solution to be made fiom model-to-model. The number of
elements through-thickness remained unchanged and is the same for al1 three models.
Mode1 CSS-LA, which contains the most refined mesh, represents the largest model size
which the computer system was capable of solving due to limitations in hard disk storage
space.
The test program, given in Table 3-5, details the stress sampled. location. and
rnodels used for stress calculation. Stresses were sampled through-thickness at the given

70
in-plane locations and are reported in the global coordinate system. Simulations 1 and 2
are sampled at point cornmon to al1 three models, while simulations 3 and 4 are sarnpled
at a point which is common ody to models CS4-LA and CS5-LA. To evaluate the effect
of mesh refinement, the relative error between an unrefined mode1 n and the refined
mode1 n+l was calculated as:
AG = I Q n + l - ~ n l (3 -9)
The stresses and relative errors between levels of mesh refinement for each simulation are
given in Figures 3-16 through 3-19. A point load of 7.5 kN was applied in d l cases.
In al1 cases, successive mesh refmements gave relatively similar stress values
below the midplane (2 < 2.29 mm). Above the midplane, greater differences existed
between the various mesh refinement models, with no clear indications of a converging
trend. The different responses above and below the midplane is a result of sampling
stresses relatively close to the point of loading. The high gradient stress field due to
loading created wide variations in the stresses calculated above the midplane, in tum
increasing the solution error. However, the region of greatest interest is below the
midplane, as this region contains the largest damage within the entire specimen.
Therefore, the focus of this convergence çnidy was twofold: 1) to derermine the level of
convergence below the midplane, 2) to insure that the large calculation errors near the
point of loading do not significantly influence the results at other points within the
specimen.

Table 3-5: Test Program for Convergence Study
- 1 A L 1 \ I
4 1 O~ 1 (1,59,1.59) 1 CS4-LA, CSS-LA 1
Model CS4-LA
Model CS5-LA
Figure 3- 15: Element discretization of convergence study models

Difference between cs3-la and cs4-la
500 - Difference between cs4-la and cs5la
Figure 3-16: Longitudinal stresses cxx and relative errors 1Ao.J through thickness z sampled at point (3.1 8 mm, O mm)

600 O
O Difference between csMa and cs4-la
500 - Difference betweeri cs4-la and cs5-la
Figure 3-17: Longitudinal stresses o, and relative enors IAo,l through-thickness z sampled at point (O mm, 3.18 mm)

Figure 3-1 8: Longitudinal stresses and relative errors IAoJ between models CS4-LA and CSS-LA through-thickness z at point (1.59 mm, 1.59 mm)

Figure 3-1 9: Longitudinal stresses q, and relative errors IAo,,l between models CSCLA and CSS-LA dirough-thickness z at point (1 -59 mm, 1.59 mm)
For the first level of mesh refinement between models CS3-LA and CS4-LA, the
difference in solution is primarily below +6O MPa for stresses cm and O,,,, located below
the midplane, with the exception of a few points containhg erron around +IO0 MPa.
The difference is significantly reduced with the second level of mesh refinement between
models CS4-LA and CSS-LA. For each simulation case, the difference is below k10
MPa except for a few points which are below S 0 MPa. The stress difference between
models CS4-LA and CSS-LA represent the bound of calculation error for simulation
models used in the study. Additional errors will exist between the actual and calculated
stresses due to approximations made in the formulation of the FE model. The
approximations include the assumption of perfect bonding between layers and simply-
supported boundary conditions.
To better visualise the cffect of mesh refinement, delamination darnage kvas
determined using the ChoiIChang failure criterion at interfaces 1, 5: and 11 below the
midplane. A cornparison of results for the three test models is found in Figure 3-20. For
interfaces 5 and 11, increasing the number of elements at the specimen centre will
increase the predicted delamination area, but does not appreciably increase the
defamination length as defined in Figure 2-5. In contrat, increasing the nurnber of
elements at interface 1 reduced the overall size of the predicted delarninations. Regions
which did not undergo a mesh refinement had no change in rhe predicted delamination
shape.

77
The areas of the predicted delaminations shapes were detemiined fiom
Figure 3-20, and are compared in Figure 3-21. A larger change occurred with the fust
level of mesh refmement. The area change for a given mesh refmement varies fiom
interface-to-interface since the mesh spacing was not cornmon for dl projected
delamination shapes. A fair comparison of changes may be made for interface 11, since
the delamination area for each mode1 is contained a h 0 3 fully within the meshed refmed
region. The hrst mesh refinement produced a 228% increase in damage area, while the
second mesh retinernent gave a 28%. Therefore, a rapid convergence trend is indicated
with each level of mesh refinement.
Based on the limited runs performed for this study, a trend of convergence was
observed for stresses below the midplane. However, convergence was not reached due to
the limitations of the cornputer system. The rnost refined mesh produced a clear and
well-defuied shape of the predicted delamination area. This is sufficient to allow
comparative studies to be made using this mesh. The numerical accuracy of this refined
mesh was determined by comparing the numerical solutions to expenmental results, and
is reported in Chapter 4.

f Interface l?
Figure 3-20: Predicted delamination areas at selected interfaces

Interface 1 Interface 5 Interface 1 1
Figure 3-2 1 : Cornparison of delamination areas at selected interfaces

Chapter 4
Results
4.1 Introduction
The effects of stacking sequence on the damage resistance were andysed in this
thesis through a parametric study of three parameters: interface mismatch angle. ply
orientation relative to the boundary supports, and ply grouping. Each parameter will have
a different and unique effect on the darnage resistance. Using the finite element (FE)
model, as previously described in Chapter 3, calculations were perfomed to detennine
the intemal stress state and to predict damage for several stacking sequences under
cornrnon loading conditions. By systematically altering each parameter, the changes in
predicted darnage area were compared to give assessrnent of how the damage resistance
was affected. This chapter presents the results of the FE calculations and the findings of
the parametnc study. Section 4.2 gives an overview of the results of the FE mode1 for
selected layups on a ply-by-ply basis. Cornparisons between experirnental and analpical
results are found in Section 4.3. A complete description of the parametric study and the
fuidings are given in Section 4.4. The FE mode1 was also used to assess the darnage
resistance of quasi-isotropic layups as well as typical layups used in industry. The results

8 1
of this study is found in Section 4.5. Lady, recommendations to improve the damage
resistance of a composite laminate are proposed in Section 4.6.
The layups analysed in this chapter contain 24 plies and are stacked in a manner
which is symmetric about the midplane. Al1 plies are constmcted using the Toray
T800W3900-2 matenai system, except where noted. Various layups were modelled.
including common layups used in industry and special layups used specificdly for the
parametric study. Where possible, the layups contain plies which are oriented at angles
0°, 4 5 O , - 4 5 O and 90' to maintain consistency with ply orientations which are cornmonly
used in industry. Each laminate was subjected to a point load of 7.5 kN, unless noted
othenvise. This load was chosen to give delamination darnage at each interface within a
laminate, but to keep the extent of the damage within the finely meshed region at the
centre of the mode!. This load represents an impact of approximately 12 J. Expenmental
tests referenced in this chapter represent impacts ranging fiom 15 J to 20 J.
The damage resistance of a layup was assessed by determining the delamination
damage at specific interfaces below the midplane and the topographical delamination area
using the ChoifChang delamination criterion (see Section 3 -3 -2). The topographical
delamination area is the overall projected area of al1 delaminations within a laminate fiom
a plan view. It has been used by Vietinghoff (1994) and Don et al. (1 991) to compare
performances of various experimentally impacted specimens. When more detailed

83
cornparisons are required, the delamination damage will be assessed at individual
interfaces.
The numerical data presented in this chapter is presented in the plan view of each
specimen, showing the impact face. The coordinate system used for ply orientation is
shown in Figure 2-1.
Initial Survey of Numerical Results
Delamination damage is a complex mechanism which rnay occur at multiple
interfaces within a laminate. The delaminations at each interface will vary based on
location within the laminate and the fibre orientation of plies for a fixed impact
conditions. Based on experimental data of delamination damage, as discussed previously
in Section 2.3.2, the following general trends are expected:
The delaminations rnay vary in shape fiom elliptical to "peanut-shaped".
The elongated section of the delamination is oriented in fibre direction of the
bottom layer cornprishg the interface, with the apex of the delamination slightly
offset fkom the fibre direction.
The delaminations decrease in size the closer the interface is located to the impact
face.
83
To determine if the FE mode1 is simulating these effects correctly, the delarnination
damage at individual interfaces was calculated for a senes of quasi-isotropic layups listed
in Table 4-1. For each layup, a constant angular difference between the fibre orientations
at adjacent layers was maintained throughout the laminate. The angular difference is
specified by the interface angle given in Table 4-1.
A plot of the predicted delamination areas at the fust 12 interfaces is given in
Figue 4-1. Al1 delarnination regions, indicated by the black outlines, are drawn to a
common scale as indicated. The delaminations are tabulated starting at the interface
closest to the back face, designated as interface 1. Exarnining the delamination contours
in Figure 4-1 reveals that al1 three observations listed above were modelled. The largest
damage occurs at interface 1, and successively becomes smaller the M e r the interface
is Iocated fiom the back face. Delaminations above the 6th interface are relatively the
same size for each layup. The major axis of each delamination is aligned with the fibre
direction of the bottom ply comprising the interface, as expected. The shapes of the
delaminations range fiom ellipticd to "peanut-shapedl', dl consistent with shapes
observed experimentally by Vietinghoff (1 994).
Significant differences in delarnination damage existed between the various
layups rnodelled in Figure 4-1. This is due to the combined effects of varying the angular
difference in fibre orientation between layers and varying the orientation of plies relative

to the boundaries of the test specimens modelled. The effects of each parameter will be
discussed later in this chapter.
As discussed above, the topographical delamination area was chosen to assess the
damage resistance of a laminate. To determine how the predicted delaminations at each
interface contributed to the topographical area, the delaminations at the first four
interfaces of layup LA were superimposed over each other, as shown in Figure 4-2. The
outside boundary of d l delamination contours represents the predicted topographical
darnage area. Due to the rapid decrease in delamination size away fiom the back face.
only delaminations at the first 3 or 4 interfaces contribute to the predicted topographical
delamination area. Delaminations at the remaining intedaces were srnaller than the
delaminations at the first 4 interfaces, and therefore did not contribute to the total
combined area. This will still give a reasonable representation of the damage
charactenstics within a composite, as the delarninations at the back face are the most
critical, and will fail first when the specimen is loaded in compression.
Table 4- 1 : Layups Analysed for Interface Mismatch Angle Study

- - - - - - - -
lnterface Angle = 15" Lavup LF
1 I 1
Interface Angle = 30" Layup LE
Layup LA
/-\,
-1 d'
Lavup LG
Figure 4- 1 : Predicted delamination damage at the first 12 interfaces for quasi-isotropic layups listed in Table 4-1, load 7.5 kN
Interface Angle = 60" . .
,!-',
\/'
Interface Angle = 75" Layup LH - *.'--./
r-. -~ V --
ri L'
Interface Angle = 90" Layup LI
-.
.<,--
'u
,r .x
'L/--J'
,'--.
-- Scale -
O 10mm 20mm

Interface Angle = 15" Layup LF
Figure 4- 1 continued
Interface Angle = 30" Layup LE
c '-, 4
-,
2 " n Lj
A L
Interface Angle = 45" Layup LA
Interface Angle = 60" Layup LG
O - .-/
- / - - d
d
T - --r
u
lnterface Angle = 75" Layup LH
lnterface Angle = 90" Layup LI
Scale i
/--
2
d

Interface Angle = 45"
87
Interface Angle = 15" Layup LF
Layup LA
0 i(J
lnterface Angle = 60" Layup LG
I
Interface Angle = 75" Layup LH
/--Y
L 7
/ -
Interface Angle = 90" Layup LI
7
V
A
d
Scale r O 10mm 20mm
Figure 4- 1 continued
,-
; ) Li
c L\ -,, \Y
Interface Angle = 30" Layup LE
T -*+. .
-3-
..? d ,P;
'J
/- f-\
w u C .?, L
V

Interface 3
Interface 2
Figure 4-2: Contributions of delaminations at the first 4 interfaces to the total topographical area for layup LA

A survey of the stresses for layup LA used in the ChoiKhang delamination
cntenon (az, q, and os) are given in Figures 4-3 through 4-5. Each figure gives stress
contour plots for interfaces 1 and 4, with al1 values reported in MPa. The stresses were
cdculated using an applied load of 8.53 kN, representing an impact energy of 15 J. The
black regions in the centre indicate stresses which have exceeded the strength of the
material. Intemal stresses for other layups follow a similar trend as the ones shown in
Figures 4-3 through 4-5.
At interface 1, the interface ciosest to the back face: the primary stress which
contributes to predicted delamination failure is oz. The interlaminar shear stresses a, and
o, show minimal contribution. This is expected since the in-plane transverse stress o2
results fiom plate bending, and is greatest at the two face surfaces. The shear stresses o,
and cr, are expected to be close to zero at the face surfaces and greatest at the midplane.
This trend is seen at interface 4, where a sharp drop occurs in the tensile stress a, and an
increase in the shear stresses q and cr, are observed. The predicted darnage at interface 4
is due to the combined interaction of these interlaminar stresses. The contour shape of
the shear stresses o, and a5 at interface 4 appears as two elliptical shaped regions. which
closely resemble the damage veas which have been observed fiorn experimental
specirnens.

Figure
D I S P U Y I I I - GEOnETR7 ClODELING SYSTEM (5.2,OI PRWPQST MORILE
2 -k
interface I
DIS PU'^ I I I - GEûHEfRY MODELiNG SYSTEH (5.2.0) PRE/POST MODULE
tnterface 4
4-3: Contour plot of stress 02 at interfaces 1 and 4, [-45/0/45/!
VIEW : -12.18084 W G E : 286.9187

D:SPUY I I I - XûHETRY r(O0ELING SYSTfn 15.2.0) PRVaûST m30ULE
VIEJ : --W.0427; RaGE: 49.04272
Interface I
D:SPLAY III - 3EOflETRY .10DELING 5Y5TEM i5.2.0) PRE/'OST MODULE
sfl 1rter:aminar stresses l n naterrai c w d r n a t e sys- -- Fi! ,- - -b
Interface 4
Figure 4-4: Contour plots of stress o~ at interfaces 1 and 4, [-45/0/45/90]3s, load 8.5 kN
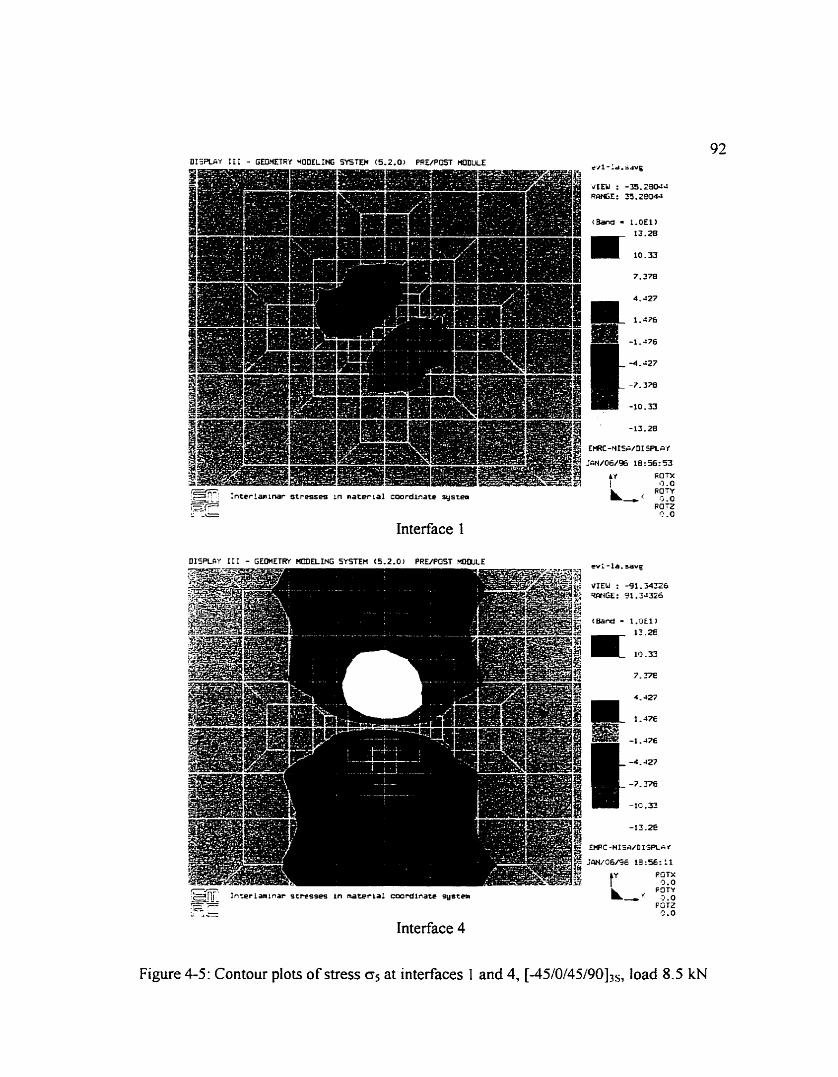
OISPLAY If1 - GEGHETRY H û ü R I H G SYSTEU (5 .2 .0 ) PRYPOST Piû(ULE . .
-- .z[r Interlamlnar stresses in material mardinate %stem P?TV
y-- - L-i .1.0 7 ;me _ FGTZ
" c.0
Interface 4
Figure 4-5: Contour plots of stress 05 at interfaces 1 and 4, [-45/0/45/90]3s, load 8.5 kN

4.3 Cornparison of Numerical and Experimental Results
The accuracy of the FE model was assessed by comparing the predicted results
from the FE model to the total topographical damage areas of experimentally irnpacted
specimens. The applied load in the FE model was set to correspond with the peak contact
force measured during the impact event. The test layups varied in materid, stacking
sequence, and peak contact Ioad. A cornparison of results is presented in Figure 4-6. The
black region represents the topographical damage area of the experimental specimen as
determined by ultrasonic C-scanning. The grey outline represents the predicted darnage
area using the ChoiKhang delamination criterion.
The shape of experimental damage area for each test layup is approximately
circular, with the exception of test layups 5 and 6 . Test layups 5 and 6 each contain a
central circular core region sirnilar to the other layups, but with two elongated regions
which extend out fiom the core. The elongated regions are oriented in the direction of the
first ply, and represent darnage at the first interface, as determined fiom C-Scan images
published by Vietinghoff (1994). The elongation region for test layup 5 was found to
give a srna11 increase to the core region, whereas the elongation region for test layup 6
gave a noticeable increase in the total topographicai area.

94
From a cornparison of numerical and experimental results, the length of the
predicted darnage areas was found to correspond closely with the achial core damage
areas for each layup. However, the width of the predicted darnage areas was found to
correlate poorly with the experimental results for al1 test cases. Predictions for test layups
5 and 6 are noticeably different than the other test layups. Ln both cases, the elongated
damage which extends from the core region was significantly under predicted.
The difference between experimental and numencal results for test layups 5 and 6
are most likely attributed to the fiacnire mechanisms which cause delamination growth.
The fiacture mechanisms for test layups 5 and 6 promoted large delamination growth.
primarily along the fibre direction of the bottom ply of the interface. This is due to unique
stress concentrations which existed in the bottom plies as a result of either ply grouping
or small changes in the ply orientation between layers. The other layups conrained a
more distributed stress concentration, causing fiacture growth along both the length and
width of the delamination. Since hcnire growth is not rnodelled using a strength of
material approach, hue delamination darnage within layups containing ply grouping or
small changes in ply orientation between layers is not predicted.

Test Layup 1: [-4 5/0/45/9 03% Matenal: T800H/3900-2 Load 8.67 kN, lmpact Energy 15.5J Specimen #: 663-1
Test Layup 3: [-45/o/45/90]3s Material: AS4135014 Load 3.51 kN, Impact Energy 5.4 J Specimen #: 656b-1
Test Layup 5: [-75f-601-451-301-75/0/1 S/30/4S/6Off 5/9OIs Material: T800H/3900-2 Load 8.31 kN, lmpact Energy 15.6 J Specimen #: 693-1
Test Layup 2: [-601-30/0/30/60190 JZs Mate rial: T8OO HI390O-2 Load 8.53 kN, lmpact Energy 15.6 J Specimen #k 689-1
Test Layup 4-: [-45/0/30/45/90/-60]2S Matenal: T800Hl3900-2 Load 9.34 kN, lmpact Energy 19.2 J Specimen #: 888-1
Test Layup 6: PWOJ453/9031s Material: T800Hl3900-2 Load 7.76 kN, lmpact Energy 15.6 J Specimen #: 685-1
SCALE f-I 1 O 25 mm 50 mm
primental tests for this layup performed by author
Figure 4-6: Cornparison of nnite element predictions against experimentai resdts

In al1 cases, a closer examination of the delaminations areas at individual plies
reveals the discrepancies between experimentai and numerical results. The accuracy of
damage prediction at an interface was found to decrease the closer the interface was
located to the impact face. As an illustration, the predicted delarnination areas at
interfaces 1 and 4 of test layup 1 were superimposed over a topographicai C-Scan of an
experimental specimen with impact damage, as shown in Figure 4-7. The C-Scan
projects damage at the back face, with colour contours indicating the depth of the
delaminations. The light blue region indicates delamination at interface 4.
Delaminations at interfaces 1 through 3 were not detected by the C-Scan, but have been
shown to exist fiom a fiactograph indicating the through-thickness damage and a picture
of the back face darnage, as published by Vietinghoff (1994). The delamination length at
interface 1 is expected to be similar in length to the largest delamination shown in Figure
4-7. The predicted delamination length at interface 1 slightly under predicts the diameter
of the damaged region. Predicted damage at interface 4 indicates the general shape and
orientation of the delaminated area. However, the delamination length is significantly
underestimated by the FE model. This under prediction of delamination at interfaces
away fiom the bonom interface would cause the discrepancies which are seen in Figure
4-6.

Dimensions in inches
i Range i Inch i Uidth 1.250 j k i g h t 1.249 i bist. B.ûû0 ; X Pas. 0.e60 1 Y Pas. 8.880
& - ..- -. - . -. . - -- [ Ibde:Eng.(in)
Test Layup 1 : [-45/0/45/90]3S, Specimen #: 663-1, Impact Energy: 15.5 J, Peak Load: 8.67 kN
Figure 4-7: Cornparison of predicted delaminations at interfaces t and 4 against C-Scan of expetimental damage (actual delamination of interface I is not shown)

The under prediction of the interiaminar shear stresses is due to a number of
factors: progressive damage, inaccurate interlaminar shear strengths used in calculations,
and the use of static analysis for stress calculations. Progressive damage, cited as the
primary cause for the under prediction, refee to the changes to the stress state within a
specimen after darnage has occurred. The altered stress state will affect the formation of
future damage as the load is increased. The FE mode1 used for this study does not
account for progressive damage formation during loading. The formation of damage
such as matrix cracking or delamination will also affect the fiacture modes within the
specimen. As reported in Section 2.3.2, coupling exists between matrix cracking and
delamination. A large matrix crack in a ply may lead to a delamination in similar length
in an adjacent ply. This type of damage propagation is not modelled using a stress-based
approach and is better predicted by using a fracture mechanics approach.
The interlaminar shear strengths of the laminate used in the ChoQChang criterion
were unknown, and were assumed to be the in-plane shear strength of a unidirectional
composite. Measurement of the interlaminar shear strength presents great difficulties.
Existing expenmental methods are not able to distinctly isolate the shear strength
component fiom other in-plane tensile strengths. In addition, the shear strength depends
on the thickness and stacking sequence of the laminate (Chang and Chen, 1987).
Therefore, the strength value used in the failure critenon is possibiy inaccurate.

99
The interlaminar shear stresses may also be sensitive to dynamic loading, an
effect which is not modelled by static analysis. From line-loading experiments, Choi'
Wu, and Chang (1991) found that the interlaminar shear stresses were larger near the
loading point under dynarnic loading as compared with static loading. A similar result
could be expected for point loading. The material properties of the rnatnx resin could
also be sensitive to the loading rate. However, as shown in Section 3.4.1, the impacts
studied for this thesis may be classified as quasi-static such that dynamic effects do not
contribute significantly to the specimen response. Therefore, this factor is not expected
to be a major cause of the under prediction of the damage area.
The FE model has been shown to give reasonable predictions of the shape and
orientation of delamination damage at each interface for various materials and stacking
sequences. The model is in good agreement with experimental results when predicting
delamination size at the first interface, but under predicts delaminations at interfaces
away from the back face. As a result, the FE model is not capable of accurately
predicting the actual delamination damage. However, it is capable of indicating the
relative performance of various stacking sequences and materials provided the relative
damage mechanisrns for each modelled specimen does not change during failure
progression. Therefore, the FE model is considered suitable for a study of parameters
affecting stacking sequence, as discussed in Section 4.4.

4.4 Effects of Layup Parameters
4.4.1 Interface Angle
The interface angle is defined as the angular difference in fibre orientation
between two layers which comprise an interface. Each layer may contain one or more
plies oriented in a cornmon direction. Several researchers including Liu (1 988), Finn. He.
and Springer (1993), and Stramicky et al. (1995), have previously observed that the
interface angle significantly afTected the delamination damage widÿn a laminate. For this
thesis, a systematic study of the effects of interface angle on delamination damage was
performed on two types of stacking sequences. The first type maintains a constant
interface angle at each interface. The second type uses two or more interface angles
between layers to stack the plies. Altenng the interface angle for each stacking sequence
type will have a different effect on darnage resistance, as discussed below.
4.4.1.1 Layups containhg a constant interface angle
Six layups of stacking sequence [0,/0,/0,], were andysed, with angle 0 varying in 15"
increments, as listed in Table 4-2. The stacking sequence was designed to orient the
length of the delamination dong 0" direction. Each l a p p was subjected to a reduced
point load of 4.5 kN, to keep the extent of the predicted delamination within the finely
meshed regions of the model, where possible.

Table 4-2: Layups Analysed for Interface Angle Study
A cornparison of darnage areas at interface 1 for dl layups are found in
Figure 4-8. The results clearly indicate that ùicreasing the interface angle will decrease
the predicted delamination area. This is in marked contrast with the bending stiffness
mismatch theory proposed by Liu (1988) which related delamination size to the
difference in bending stiffiess between adjacent plies comprising an interface. Using
Liu's mismatch coefficient M given by Equation (2-7) (Section 2.6.1). the largest
delamination size is predicted for layup SF containing an interface angle of 90"; the
smallest delamination size is predicted for layup SA containing an interface angle of 15".
This is completely opposite to the FE results given in Figure 4-8. However, the FE
results are consistent with the results published by Vietinghoff (1 994). Vietinghoff tested
several quasi-isotropic specimens using three different interface angles. The
topographical delamination area was found to increase as the interface angle kvas
decreased. The results are also consistent with a similar experimental and numerical
study performed by Finn He. and Spnnger (1993).

102
To detemiine how the predicted delaminations change between each layup, the
delamination length and width, as defmed in Figure 2-5, were measured for each layup
and are plotted in Figure 4-9. Both the delarnination length and width are found to
decrease as the interface angle is increased. The length expenences a fax- greater change
as cornpared to the width between interface angles 1 5 O and 90". The length changed 26
mm while the width changed 8 mm.
The change in delarnination area may be attributed to the change in bending
stiffness that occurs between different stacking sequences. From classical bending
theory, the bending stress is inversely proportional to the bending stiffness of the
structure. Therefore, an increase in the stifiess will decrease the bending stresses for a
given applied moment. The stiffhess within a ply is maximum when the ply onentation is
perpendicular to the plane of bending. Conversely, the stifiess is a minimum when the
ply onentation is parallel to plane of bending. Stacking plies in a common direction will
act to increase the stiffness in the fibre direction while decreasing the stiflhess in a
direction transverse to the fibres. This will create regions of high and low bending stress
concentrations within the laminate plane. The optimum stacking sequence is one which
contains a uniform bending stifhess ui al1 directions. For such a layup, the bending
stresses are also approximately uniform in al1 regions.
Examining the layups in Table 4-2, the optimum configuration is layup SF, with
an interface angle of 90". For this layup, the bending stiffness is more uniformly

1 O3
distnbuted as compared with the other layups, since the amount of ply grouping in a
single direction is minirnised. The worst configuration is layup SA, with an interface
angle of 15". For this layup, the plies are stacked in relatively similar orientations. This
will produce high bending stresses transverse to the fibre direction of the bottom ply
group, creating a larger darnage area.

O ! 1
15 30 45 60 75 90
Intertace Mlsmatch Angle (0)
Figure 4-8: Delamination area at interface 1 vs. interface angle, load 4.5 kN
4 Delamination Width
I
15 30 45 60 75 90
Interface Mlsmatch Angle (0)
Figure 4-9: Delamination length and width vs. interface angle, load 4.5 kN

4.4.1.2 Layups containing multiple interface angles
The effect of using multiple interface angles to stack plies was examined through
cornparisons of two sets of layups, as listed in Table 4-3. Test case 1 examuied the effect
of using three different interface angles to stack plies. Test case 2 examined the effect of
switching Iayers 4 and 5 in layup LE to give two different interface angles throughout the
layup. Each test case compared the layup containing multiple interface angles to a
similar iayup rnaintaining a single interface angle between each Iayer. The applied load
for al1 layups was 7.5 kN.
Table 4-3: Layups Containing Multiple Interface Angles
L
For test case 1, the topographical delamination area as well as delamination areas
at first 4 interfaces were assessed for both layups LA and MB. A cornparison of results is
found in Figure 4-10. Stacking plies at multiple interface angles in layup MB was found
to increase the delamination size at each of the 4 interfaces over layup LA. A different
trend in the delamination sizes from interface-to-interface is also seen. For layup LA. the
- - -
45": Ali interfaces 45": Interfaces 1,4 , 7, I O , 13, 16, 19,22
LA MB
30": Interfaces 2, 5, 8, 11, 12, 15, 18,21 15": Interfaces 3.6, 9, 14, 17, 20
[45/0/45190]3s [45/0/30/45/90/-60],,
Test Case 2 30°:AIlinterfaces 30": Interfaces 1, 2, 4, 6, 7, 8, 10, 13, 15,
LE ME
[-60/-30/0/30160/90]2S 1-601-30/0/60/30/90hs

1 O6
delamination size decreases at each higher interface. For layup MB, the delarnination
size initidly inrreases at interface 2, then successively decreases at interfaces 3 and 4.
From the results aven in Section 4.4.1.1, decreasing the interface angle at an interface is
expected to increase the delamination area. This occurs with interfaces 2 and 3.
However, the delamination area at interfaces 1 and 4, which contains no change in the
interface angle, also increases. Therefore using multiple interface angles to stack plies
will affect delamination damage at every interface. For this test case, the overall effect of
using multiple interface angles reduces the damage resistance of the layup, as seen in a
comparison of topographical delamination area in Figure 4-10. This effect can also be
seen in Figure 4-6 for the experirnental test layups 1 and 4. Test layups 1 and 4 have the
same stacking sequences as layups L.4 and MB, respectively, and both test layups were
impacted at relatively the same impact energy. The damage area for the multi-interface
angle specimen (test layup 4) was found to be greater.
A similar comparison of delamination areas was made for test case 2.
Delamination damage was examined at interfaces 3,4, and 5, for both layups LE and ME.
Interfaces 3 and 5 of layup ME are stacked with an interface angle of 60°, while interface
4 is stacked at 30'. Layup LE maintains a constant interface angle of 30" at each
interface. A comparison of delarnination areas including the topographical area is found
in Figure 4-1 1. Two very different damage trends exist between the two layups. For
layup LE, the delamination size decreased at each higher interface. in a similar fashion to

107
layup LA. For layup ME, the delamination size dramatically decreased at interface 4, and
increased again at interface 5. This trend indicated that delaminations were greater at
interfaces which are stacked at an angle of 60" as compared with interfaces stacked at
3 0". This is contrary to expectations based on fuidings fiom Section 4.4.1.1. Larger
interface angles should contain smaller delaminations. The to pographical areas for both
layups were found to be the same, as the changes in the delamination area occurred at
interfaces away fiom the back face.
Comparkg interfaces 3 and 5, which contain a change in interface angle. also
reveals some interesting results. Interface 3 showed a slight reduction of 3 mm' in
delarnination area when changing the interface angle from 30' to 60". However, the trend
is reversed for interface 5, where changing the interface angle fiom 30" to 60" resulted in
an increase of 9 mm2. Again, this is contrary to findings in Section 4.4.1.1. -4n increase
in interface angle should decrease delamination area.
The results fiom the two test cases revealed that the extent of delamination
damage depended on the particular stacking sequence being used. Using multiple
interface angles to stack plies afTected the delamination size at each interface differently.
The delarnination size was found not to be directly associated with its corresponding
interface angle, as different trends in damage were observed for a given angle. For the
MO cases analysed, using multiple interface angles to stack plies was found to increase
the damage area as compared to stacking plies with a constant interface angle.

Interface 1 If~Wrace 2 Interface 3 Interface4 Topgraphical Ama
Figure 4-10: Comparison of delamination areas between layups LA and MB, test case 1 , load 7.5 EcN
Interface 3 Interface 4 Interface 5 Topographieal A m
Figure 4-1 1: Comparison of delamination areas between layups LE and ME, test case 2, Ioad 7.5 kN
4.4.2 Ply Orientation
The orientation of a ply relative to the boundaries of a coupon specimen will alter
the bending properties of the specirnen. This wiIl affect both the intemal stresses and
predicted delaminations. The effects of ply orientation were examined for this study
using the layups listed in Table 4-4. Layups LA, GB-GF are al1 quasi-isotropie layups
with a constant interface angle of 45" maintained throughout each layup. Layup LA is
the base layup used for comparisons. Layups GB through GD, are each similar to layup
LA except that the entire stacking sequence is successively rotated by 45'. Layups GE
and GF use a reverse stacking sequence as compared to layup LA, stacking plies
clockwise instead of counter-clockwiçe. Three cross-ply layups, GG, GH, and LI, were
also considered in this study. Each of the three cross-ply Iayups start the stacking
sequence with a different ply orientation.
Aitering the orientation of the plies with respect to the plate boundaries was found
to result in a large variation of topographical delamination areas, as shown in Figure 4- 12.
The best performance for the quasi-isotropie layups is given by layup GD at 58 mm'.
Layup GD starts the stacking sequence with a 90° degree ply, aligning the delamination
at the first interface dong the shortest in-plane dimension of the plate. In contrast. the
worst performance for the quasi-isotropic layups occurs with layup GB at 90 mm2. In
this case. the first ply is oriented at 0°, aligning the delamination with the largest in-plane

110
dimension of the plate. For the cross-ply layups, Layup GG, with plies onented at -45"
and 4S0, performed signif~cantly better than the layup LI, with plies oriented at 0' and
90".
Quasi-isotropie layups LA, GC, GE, and GF, with the f i s t ply oriented at either
4 j 0 or - 4 5 O , resulted in delamination areas which are between layups GD and GB.
Layups with the second ply oriented at 90°, namely GC and GE, performed better than
layups LA and GF with the second ply oriented at OO. Layups GE and GF, using a
clockwise stacking sequence, were found to give to the same damap areas as compared
with the counter-clockwise stacking sequences GC and LA, respectively. This is
expected since clockwise and counter-clockwise stacking sequences have identical
bending sti&esses. The only difference in the two stacking methods is the orientation of
the delamination shape.

Table 4-4: Layups Analysed for Geometric Orientation S ~ d y
Figure 4-1 2: Cornparison of toljographical damage areas for geometric orientation study. load 7.5 kN

The cause of the variations obsemed above may be explained by examining the
transverse displacements of the plate. A typical distribution of the predicted transverse
displacement is illustra~ed in Figure 4-13 for the first ply of a [45/0/45/90]3s layup. The
displacements are indicated as negative quantities. The greatest displacement will occur
at the centre of plate due to th; applied load. Away fkom the centre, the transverse
displacement will decrease. The greatest reduction will occur along the shonest
dimension of the plate, in this case the width. Along the length of the plate, the
transverse displacements decrease more gradually with respect to distance away fiom the
centre. The amount of transverse displacement at any given location will be largely
affected by the dimensions of the plate.
The interna1 stress distribution will resemble the distribution of transverse
displacements which are exhibited in Figure 4-13, since the stresses which create
delaminations are a function of transverse displacement. The high mess gradient which
exists along the width will act to constrain the size of the delamination. Therefore.
delaminations which are oriented along the width of the plate will be smaller as cornpared
to delaminations which are oriented dong the lengdi. The trend may be seen in a plot of
delaminations areas at interface for layups GBI GC, and GD, given in Figure 4-1 4. As
the orientation of the delamination is rotated fkom the length to the width (from O" to
90°), the area decreases.

Figure 4-13: Predicted transverse displacement distribution for layup LA, load 7.5 kN (dimensions are in mm)
Layup GB, O0 orientation Layup GC, 45" orieyation Layup GD, 90" orieyation Area = 89 mm2 Area = 57 mm Area = 48 mm
SCALE - O 5 10mm
Figure 4-14: Predicted delamination damage at interface 1 for layups containing an interface angle of 45O
The performance of the cross-ply layups is also explained in a similar fashion.
For layup LI, an equal number of plies are oriented in the 0" direction as the 90"
direction. As a result, interfaces with the bottom ply oriented at O" will exhibit large
delaminations, while interfaces with bottom ply oriented at 90° will exhibit small
delaminations. For layup GG, each interface will exhibit relatively the same
delamination size due to common geometric orientation of the plies relative to the
boundaries. This will reduce the size of the topographical area Layup GH, with a
starting ply orientation of 90°, wilf have a relatively small delamination at interface 1, but
will have a much larger delarnination at interface 2, since the second ply is oriented in the
O0 direction. As the delarnination at interface 2 is larger than the delaminations for layup
GG, the topographical area for layup GH also will be larger than GG, but still
significantly less thm layup LI.
The results of this study indicated that the ply orientation relative to the
boundaries of the impacted specimen will affect delamination damage. The manner in
which the delamination is affected will depend on the geometry of the specimen. This is
an important point to consider when applying results fiom one configuration to another.
such as applying results obtained fiom coupon tests to full scale structures. For the
specimen geometry used in this thesis, placing the first ply at 90' for layups with an
interface angle of 4 5 O was found to give lowest darnage area. For cross ply layups. the
optimum configuration was f4S0.

4.4.3 Ply Grouping
The effect of grouping plies togeâher was examined for the layups listed in
Table 4-5. Each Iayup contains an equal number of plies oriented in each of the
following fibre orientations: O", 45", -4S0, and 90". A constant interface angle of 45' was
maintained throughout each layup. Layup LA, a quasi-isotropic layup with no ply
groupings, was used as the base layup for comparisons. Layups PB, PC, and PD have ply
groupings of 1 and 2 plies manged in different combinations. Layup PE contains equal
ply groupings of 3 plies thick.
A cornparison of the predicted topographical damage areas. given in Figure 4-1 5.
revealed that ply grouping reduces the damage resistance in a laminate. The base layup
LA with no ply grouping contained the lowen damage at 78 mm'. As the arnount of ply
grouping increased, the damage area increased dramatically. The damage area for layup
PE was double the area of Layup LA at 158 mm2. The location of the ply grouping also
has an effect on the damage resistance. A larger damage area will result when the ply
grouping occurs near the impact and back faces of the laminate, as shown for Layup PB.
An improvement of 8 mm2 is made when the ply grouping occurs at the rnidplane. The
optimum configuration is achieved by un i fody dispersing the ply grouping through the
laminate, as done for Layup PD. Layup PD contained the least damage at 83 mm2 of the
three layups contain 2 ply thickness groupings.

I l6
Stacking plies of the sarne fibre orientation together will increase the stress
concentration at the adjacent interfaces, due to the increased bending stifniess within that
ply group. This increase in stress concentration wi& in tum, create larger delarninations.
Ply grouping will also reduce the number of interfaces available for delamination, since
delaminations can occur only at interfaces which contain 2 difference in fibre orientation
between the adjoining plies. Since delamination acts to absorb energy kom an impact,
reducing the number of locations available for delamination will increase delamination
size at the remaining interfaces.

Table 4-5: Layups Analysed for Ply Grouping Study
Figure 4-15: Cornparison of topographical delamination areas for ply groupmg study. load 7.5 kN
4.5 Damage Resistance of General Layups
In the previous section, the effects of three different stacking sequence parameters
were studied. Each parameter was studied individually by analysing test layups which
isolated the effects of the single parameter on the damage resistance. In this section, the
damage resistance performance is assessed for layups ranging from quasi-isotro pic to
general orthotropic. For these layups, all three parameters are altered at once, allowing
the study of their combined effects on the darnage resistance. Several layups examined in
this study are based on layups which are used in industry or layups previously examined
by other researchers.
4.5.1 Quasi-Isotropic Layups
The performance of various quasi-isotropic layups was assessed for damage
resistance capability. The layups examined for this study are listed in Table 4-1. The
predicted topographical damage area was determined for each layup and plotted against
interface angle in Figure 4- 16. Layups with interface angles of 45" and 60" gave the best
performance with an area around 75 mm2. Layups with interface angles of 15" and 90"
gave the wost performance with areas 12 1 mm2 and 1 15 mm2 respectively .
The effect of the various layups on delamination sizes at individual interfaces is
seen in Figure 4-1. Layup LF, with an interface angle of 15", had the largest

119
delaminations at the first four interfaces. As the interface angle was increased, the
delarnination length tended to decrease while the width increased. ï h e overall effect
reduced the delamination size. The optimum interface angle was between 4 5 O and 60°,
where large reductions in delamination size were seen when compared to layup LF. The
stresses within layups LA and LG were more evenly distributed around the plate,
resulting in smaller delarninations. As the interface angle was increased past 60°, both
the width and length of the delaminations increased. For layup LI, a significant increase
in delamination area was seen, particularly in interfaces 1 and 3.
The observed results may be explained using the findings obtained fiom the
parametric study performed in Section 4.4.1. For layups with a small interface angle. the
damage at each interface was larger due to increased bending stiffhess of the laminate.
The increase in stifiess resulted fiom plies being stacked at sirnilar orientations. The
optimum configuration was attained by using an interface angle of 45' or 60'. For these
layups, the plies were stacked in a manner that gave similar stifiess properties in d l
directions. For layups with an interface angle above 60°, the ply directions for every
second layer were again stacked in similar orientations. This increased the stifbess dong
particular fibre directions, while reducing the sti&ess in other directions. The increase
in stiffhess also increased the darnage area as compared to Layup LA. However. the
increase in damage area was still smaller than the damage area predicted for layups with
small interface angles.

45 60
Interface Angle 8
Figure 4-16: Predicted delamination area vs. interface angle for quasi-isotropie layups listed in Table 4-1

4.5.2 Orthotropic Layups
in this section, other orthotropic layups were examined which did not contain in-
plane isotropie charactenstics. These types of layups often contain a disproportionate
number of plies onented in a given direction or contain several interface angles at
dif5erent interfaces throughout the laminate. In practice, orthotropic layups are used to
tailor the strength and stiffness properties of a laminate for a desired application. When
designing for in-plane strength, several permutations exist to stack plies to give the
desired strength properties, but each pexmutation will have different impact damage
resistance capabilities. To examine the effect of different stackuig sequences on darnage
resistance, several layups were studied as listed in Table 4-6. The orientation of the plies
within each layup is restricted to directions O*, 45": -4S0? and 90". Results from the
quasi-isouopic layup LA are repeated here for comparison purposes. Each layup contains
the same number of plies in each of the four possible orientations, with the exception of
layup MC. A comparison of topographical damage areas for each layup is found in
Figure 4-1 7.
Layup MC was designed to study both the effects of placing +45 plies at the
surface layers and ply grouping. The use of M5 plies is designed to improve impact
damage resistance at surface layers, while ply grouping the remaining laminae is
designed to reduce fabrication costs. The stacking sequence is similar to comrnon

123
laminates used in aircraft structures, previously studied by Ambur et al. (1995). This
particular layup results in a noticeably smaller damage area of 57 mm2 as compared with
the base layup LA at 78 mm2. Ply grouping the 0" and 90" laminae did not appreciably
increase the damage area since the ply grouping was located away fiom the surface
Iayers.
Layup MD is a laminate which was exarnined previously by Dost et al. (1991).
The stacking sequence was designed to resist impact darnage using a strength of matenal
approach at individual matrix cracks which connect delaminations between layers. The
layup showed an irnprovement over the base layup LA with a damage area of 66 mm'.
However, the darnage area was higher than layup MC. This is due to the large number of
plies at 90° and -45" orientations stacked near the surface layers. This acts to increase the
bending stiffhess, and subsequently the stresses? in these orientations.
Another variation of a stacking sequence using k45 plies at the surface layers is
layup MF. This layup is very sirnilar to the base layup LA with a set of 4 plies which are
repeated through the laminate. Two interface angles, 90° and 4 5 O , are used in the
stacking sequence. The darnage area which is predicted by the FE model for layup MF is
vimially identical to layup MC. Changing the interface angle when stacking the surface
plies will create a slightly higher damage area for layup MF. Otherwise, both layups c m
be seen to have comparable damage resistance capabilities.

123
Layup MG maintains a constant interface angle of 41' throÿghout the kj-üp, büî
stacks the 90" plies closer to the outer surfaces and the O0 plies closer to the midplane.
This orients the delamination dong the width of the plate at the surface plies in attempt to
reduce delamination size. From the results given in Figure 4-17, this layup was not
effective in improving darnage resistance. The damage area for layup MG at 81 mm2 is
slightly higher than the base layup LA. Again this is due to stacking plies at the same
orientation close together. For layup MG, the 90' plies are stacking in close proximity to
each other at the back face, increasing both the stifiess and stress at this orientation.

Table 4-6: Stacking Sequences Analysed for Orthotropic Layup Study
LA MC
MF
Figure 4-1 7: Cornparison of predicted delamination areas for various orthotropic layups
[-45/0145/90]3s [k452/90dk45-JO&
MG
Base Layup Placing k45 plies at the surface layers, multiple interface angles, ply grouping
MD 1 [45/(90/-45)J(0145)~O]s
[k45/90/0]3s
Placing 90" plies near the surface layers, ply grouping sets of laminae Placing 245 plies at the surface layers,
[90/45/901-45/90/45/0145/0145/0/-45]s multiple interface angles Placing 90" plies near the surface layers

4.6 Summary
The damage resistance capabilities of various types of layups were examined
using the FE model. Damage resistance of a layup was assessed by comparing its
topographical delamination damage area to the base layup [-45/0/45/90],,. From a
comparative analysis of topographicd damage within laminates generated both
nurnerically and experimentally, the FE mode1 was found to be suitable for performing
comparative studies of darnage resistance. The FE model gave reasonable predictions of
delamination damage at interfaces near the back face, but under predicted the
delaminations for the remaining interfaces. n i e discrepancy between the FE predictions
and the experimental results is primarily due to the lack of progressive damage
modelling. As a result, the FE model was not capable of predicting the actual darnage
area.
Three parameters affecting stacking sequence were studied: interface angle.
geometric orientation of plies, and ply grouping. Each parameter significantly affected
the damage resistance. In general, stacking plies to give uniform stifkess properties in
al1 in-plane directions improved damage resistance. Ply grouping or stacking plies in
similar orientations increased both the stiffness and damage in the stacked orientation.
thus reducing damage resistance. With careful attention to the geornetry and boundary

126
supports of the specimen, the plies may be stacked in a manner to increase the damage
resistance.
From the analysis perfonned in this chapter, the following guidelines are
proposed to improve the impact damage resistance of composite plates:
Avoid ply grouping larninae or stacking laminae in sirnilar orientations.
Avoid stacking laminae at interface angles below 4j0.
Give attention to the orientation of laminae relative to the plate boundaries.
For rectangular plates, the following guidelines are suggested:
- For stacking sequences maintainhg an interface angle of 45O, start the
stacking sequence with the first lamina oriented dong width (the shortest
dimension) of the plate.
- For stacking sequences maintainhg an interface angle of 90°, start the
stacking sequence with the first lamina onented at 45' or -4j0 to the width
of the plate.

Chapter 5
Laminate Ranking Method for Damage Resistance
5.1 Introduction
The ability to predict the damage resistance of composite materials would greatly
assist designers in developing structures capable of withstanding impacts fiom foreign
objects. As reported in Chapter 2, this has proved to be a challenging task. due to the
many factors which may affect the damage state. To predict impact damage, the finite
element method is often used due to its ability of modelling the dynamic response of the
specimen and the progressive damage propagation. However. this type of prediction
method has found only limited usage in the preliminary design stage due to the mode1
complexity and the time required for analysis.
A simpler approach would be to use a parameter which is directly related to the
darnage state. With this parameter, laminates could be ranked for darnage resistance.
Predictions of the damage area could then be made by correlating the ranking parameter
to baseline expenmental data. The assessrnent of this parameter would be faster as
compared to the required computational time when using detailed analpical or numerical

128
modelling. Therefore, using a pararneter to predict damage would be suitable for
preliminary design analysis. Ideally, this darnage resistance pararneter should include the
effects of matenal, stacking sequence, and thickness on the damage *te.
Previous attempts to find a damage resistance pararneter have met with only
limited success. The most successful attempt was made by Lagace et al. (1993): who
linked the damage state to the peak contact force of the impact event; a fmding which has
been echoed by Stranicky et al. (1995). The use of peak contact force as a damage
resistance parameter is illustrated in Figure 5-1, where peak contact force is ploned
against the topographical darnage area for four different stacking sequences. Al1 data
plotted in Figure 5-1 was obtained from Vietinghoff (1994). For each layup. a near linear
relationship existed between peak contact force and damage area mtil a threshold point
was reached. Specimens impacted at energies above the threshold point showed a M e r
increase in the measured damage area, but no m e r increase in the peak contact force.
The threshold point is described in greater detail in Section 5.4. The correlation between
peak contact force and damage area was unique for each stackng sequence, material. and
thickness. Therefore, peak contact force may be used to rank only laminates with a
common stacking sequence. material, and thickness, irnpacted at an energy below the
threshold point.
The three stacking sequence parameters examined in Chapter 4. ply grouping. ply
orientation. and interface angle, were each found to significantly aMect the darnage

129
resistance. Nevertheless, the results of this parametric study did not reveal any
identifiable trends which directly link damage resistance to any of these parameters.
This chapter examines the use of a damage resistance parameter based on the
bending strain to rank laminates for damage resistance. Bending strain provides a
convenient method of ranking laminates with respect to dBerences in material, thickness,
and stacking sequence, as it is a function of d l three variables. For this thesis, laminate
rankings are made with respect to changes in stacking sequence ody. However, methods
of ranking laminates with respect to changes with matenal and thickness are also briefly
discussed. A review of the appropriate lamination theory is presented fust in Section 5.2
The derivation and proposai of the damage resistance parameter are then presenred in
Section 5.3. An evaluation of the proposed damage resistance parameter is given in
Section 5.4, followed by a discussion of the results in Section 5.5.

Material: T800H13900-2 a
Threshold point for each layup is indicated by shaded circles :/ m
Layup LD ~-WOdW903Is
Layup LF [-751-601-451-301-15IOl 1 5/30/45160/75/90]s
/ Layup LE r h [-601-3 O/O/
, Layup LA 8
(-45/o/45/90]3s I a Cn
Q I, -
3 5 7 9 11 13 15
Peak Contact Force (kN)
Figure 5-1 : Laminate ranking using peak contact force (data fiom Vietinghoff, 1994)

5.2 Lamination Theory
From classical lamination theory (Gibson, 1994), the strains {E) and curvatures
{K} in the laminate are related to the applied forces {N} and moments {MI by:
where [A] is the extensional stifkess matrix, [Dl is the bending stiffness rnatrix, and [BI
is the coupling rnatrix between the strains and curvatures. The classical laminate theory
assumes that each ply is in a state of plane stress. Perfect bonding is assumed to exist
between plies with no slippage, and small deflections are assurned to occur such that lines
drawn nomal to each p1y rernain normal after bending.
Matrices [A], pl, and ID] are defrned as foIIows:
where k is the ply number? N is the total number of plies, and zk is the distance fiom the
larninate mid-plane to ply k. Variables k, N. and z are illustrated in Figure 5-3.

Matrix pf is the rotated elastic rnoddus matrir at p1y k, relating the stresses and
strains by:
Matrix Q was transformed from local laminate coordinate system to the direction of rl the calculated stresses and strains by the standard rotation rnatrix, given in equation (2-1).
Each stifiess ma& given in equation (5-1) is symmetric and has a dimension of
3 by 3. For matrix [Dl, the terms are defuied as:
1 (5 -6)
The stifhess component dong and transverse to the fibre direction are pnm&ly
govemed by coefficients D,, and D2?. The stiffness due to in-plane shear is given by
coefficients D,,. Coupling between stiffhesses dong and transverse to the fibre direction
is given by coefticient D12. Coupling between tensile and shear stiffnesses is given by
coefficients DI, and DZ6. Coefficients for the other stifhess matrices [A] and [BI follow
in a similar fashion. For layups syrnmetric about the mid-plane' the coupling rnatrix [BI
is zero as are coeficients Dl, and DZ6 for the bending stifhess matrix [D] and
coefficients A,, and fb6 for the extensional s t i a e s s matrix [A].

impact face
PLY N-1
+ l o t neutral axis
PLY 2
back face
Figure 5-2: Laminate nomenclature

5.3 Proposa1 of a Damage Resistance Parameter
A number of methods have been proposed in literature to predict impact darnage
using an empirical approach, as descnbed in Section 2.6.1. While each method predicted
some of the key characteristics of impact damage, none were able to predict damage for a
variety of stacking sequences. The bending mismatch parameter proposed by Liu (1 988).
as given in equation (2-7), gave reasonable predictions for two ply specimens, but was
found to give inaccurate predictions for multi-ply laminates. Morita et al. (1995)
proposed a modified version of the bending mismatch parameter, as given by equation (2-
9), correcting for some of the limitations experienced when using equation (2-7). The
form of this modified parameter P closely resembles the bending stress of a larninated
beam, which is integated with respect to angle 0. Parameter B mainly measures the
maximum in-plane longitudinal stresses o, of each layer, since the greatest beam bending
stresses occur in the fibre direction. However, Choi and Chang (1992) have found that
delamination is caused by the transverse in-plane stresses oz, not the a, stresses which
parameter p measures. As a result, the proposed pararneter P will lead to erroneous
predictions of damage.
A new damage resistance parameter is proposed for this thesis? addressing the
limitations experienced by previously proposed parameters. The darnage resistance
parameter is based on the bending strain in the laminate. The bending strain gives an
indirect measure of the damage susceptibility of a laminate. as regions with high strain

135
will contain greater amomts of damage. To assist in the derivation of the damage
resiçtance parameter, two coordinate systems are introduced. A principal coordinafe
system is defked with axes xp, y,, and 5, aligned in the same directions as the global
coordinate system defined in Section 2.2.2, except with the ongin placed at (0,O7t/7) in
global system coordinates, where t is the thickness of the laminate. The bending
coordinate system is defined using three axes x,, y,, and q,, having an ongin located also
at (0,07t/2) in global system coordinates, with the z, axis aligned in the same direction as
axis z, of the principal coordinate system. Axes xb and y, are rotated about the zb axis by
an angle a to axes x, and y, of the principal coordinate system respectively. The plane of
bending is defined to be a plane defined by the yb and z,, axes of the bending coordinate
system at x, = O. A moment vector is defined with a base at the origin and tip at point (O,-
1,O) in the bending coordinate system. Al1 moments M used in the calculations are
referenced with respect to this moment vector. The orientation of each ply always
remains fixed with respect to the principal axis. However, the orientation of each ply
with respect to bending coordinate system may change based on a change in angle a.
The two coordinate systems and plane of bending are defined in Figure 5-3.

Figure 5-3: Defuiition of coordinate systems and plate nomenclature

A damage resistance parameter of the following f o m is proposed:
Parameter a(a) is a measure of the topographical damage radius measured fkom the plate
centre at angle a. A measure of the total damage area is then obtained by integrating
parameter a(a) with respect to a and angle a to give the damage resistance parameter DR.
Parameter DR is not intended to directly predict damage, but rather to give a value that is
related to the total topographical damage. A larninate with a high DR value indicates a
high susceptibility to impact damage. Therefore to improve damage resistance.
parameter DR is to be minimised.
Bending strain was used as a measure of the damage radius a@) . Computing the
bending strain using a full analytical treatment of the plate bending problem is formidable
for even the most basic stacking sequence configurations. nierefore, an approximate
method was used instead by examining an equivalent one-dimensional beam bending
problem. At any desired in-plane direction a. the plate was treated as a beam of unit
width with a constant applied moment, containing the same ply orientations as the
original plate with respect to the desired calculation direction x,. Stated in different
terms, the cross-sections of both the plate and the bearn formed by the plane of bending.
as illustrated in Figure 5-3, will have the same Iayup distribution. The strains were then
calculated by classical beam bending theory for the equivalent bearn cross-section of unit

138
width. The in-plane mains may be calculated at different orientations of a in a similar
manner to give a two-dimensional profile of the in-plane strains.
Approximating the plate problem as a beam introduces a few errors. The first
error is that the beam strain calculations do not account for the geomeûical shape of the
specirnen. The geometrical shape greatly influences the value of the calculated strains;
thus, ignoring this effect may lead to large errors. This was compensated by including an
out-of-plane displacement parameter in the calculation of parameter a(a). The beam
calculations used a constant moment of unity at al1 angles of a. However, the actual
applied bending moments would not be constant with respect to angle a, due to the
twisting moments that are also present within the plate. Ignoring the twisting moments
will lead to errors of approximately 10% to 20% in the strain calculations. The error is
largely dependent on the stacking sequence and geometry of the laminate. Using a
stacking sequence containing uniform in-plane stiffhess properties with respect to angle a
will ~ e a t l y reduce the error. since the applied moments at any given point are relatively
the same for al1 angles of a. No compensation for this error was made in the formulation
of parameter a(a), as the arnount of error was not considered to be critical.
Based on the above approach, a damage radius parameter a(a) is proposed as:

where:
cl>: Maximum bending saain of equivalent beam section at angle a
w: Parameter proportional to the out-of-plane transverse displacement
E,: Cntical ply strain
Parameter ~b is the primary measure of the damage radius, accounting for effects of
stacking sequence. The displacement parameter w, specified in terms of radius r and
angle a, accounts for the effects of the plate geometry and support conditions on the
damage area. Radius r, as illustrated in Figure 5-3. is chosen to give best profile of the
displacement. The value of r is arbitrary, but should be located away fiom both the plate
boundmies and the point of loading. A value of r = O.lb is suggested for this thesis.
where b is the smallest dimension of the specimen. The radius r must remain constant for
al1 angles of a. The critical ply strain E, is included in parameter a(a) as a method of
accounting for different matenal strengths when ranking laminates. Here, the cntical ply
strain is defined as the maximum permissible strain which the specimen is allowed to
sustain. This could be the limit strain or ultimate strain of the material depending on the
requirements of the structure. Parameters sb, W, and are descnbed fully in Sections
5.3.1 through 5.3 -3, respectively.

140
The proposed damage resistance parameter is valid for moderately thick laminates
whose response to transverse loading is primarily bending. Thin laminates which
respond to transverse loading primarily by in-plane membrane forces are not covered by
this parameter. The darnage resistance parameter is related to intemal damage only:
delaminations and matrix cracking. Back face damage such as ply blow-out, fibre
breakage, and matrix cracking are not predicted. Equations denved in this thesis are valid
for mid-plane symmetrical laminates which conform to the Boeing Specification BSS
7260 (Boeing, 1988), as discussed in Section 3.2.2. Equations for other specimen and
test configurations may be denved by following the methodology presented in Sections
5.3.1 and 5.3.2.
5.3.1 Bending strain parameter cb
Bending strain was chosen as the ba i s to assess the extent of impact darnage.
allowing for easier identification of the critical areas within the laminate as compared
with using bending stress. Using a strain-based approach, a ply is assumed to fail when a
critical arnount of strain is reached, regardless of the ply orientation. Therefore. the
maximum bending strain can be used to identiQ the critical locations of the laminate.
Using a stress-based approach, identification of critical locations is more diEcult as the
failure stress depends on the ply orientation. Since the stress distribution through-
thickness is not continuous, a stress-based failure critenon must be applied for each ply to
determine failure.

141
From classical beam bending theory, the bending strain in the xb direction for a
bearn of unit width is defmed as:
EXb = - m x (5-9)
where K, is the beam curvature and z is the distance through-thickness measured frorn the
neutral aùs. Using equation (5-l), K, rnay be expressed in terms of an applied moment
M
Equation (5-10) is valid only for mid-plane symmetrical laminates such that p ]=0 and
D ,6D2,=0. Placing equation (5- 10) into (5-9) gives:
As previously noted in Section 4.2, the primary stresses/strains which create
delaminations at interfaces located near the back face are the in-plane transverse stresses
oz and strains c2. The o, stresses and the E, strains have been observed to f o m a
delamination damage area, with the major axis closely aligned with the fibre direction of
the lower ply of the interface, as illustrated in Figure 2-5. Relating these observations to
equation (5-1 l), the strains promoting delamination damage along the major axis are
onented along the y, axis for plies whose fibres are aligned in the xb direction. To insure
142
the major axis of the predicted delamination is aligned with the fibre direction, the
bending strain parameter is proposed as:
C &)=-
D22 (a)
where c is the distance through-thickness from the neutral axis to the bottom face.
Equation (5-12) represents the maximum bending strain per unit width in the y,
direction for a unit moment. n i e applied moment is assumed to be constant with respect
to angle a, and therefore is not included in darnage area parameter. For a given value of
a, parameter E~ will be greatest for plies whose fibres are oriented along the x, direction.
When polar-plotting parameter q, versus a for a given laminate. the resulting contour will
resemble a topographical damage contour for the laminate.
It is usehl to note that the usage of either DI, or in equation (5-1 2) will give
the same results when calculating the damage resistance parameter DR, given in equation
(5-7). This fact is due to the close relationship between both bending coefficients:
D1,(a)=D22(a +go0) (5- 13)
The bending stifhess coefficient DD in equation (5-12) is defined by equation
(5-4), where coefficient &t7 -- is defined as a function of ply orientation 0 with respect to
a i s xb:

Q: are the reduced in-plane elastic rnodulus coefficients at ply k
Angle 0 can be redefmed in terms of angle a using the following relationship:
0 =$-a (5- 1 6)
where angie 4 is defined to be the ply orientation with respect to the principal coordinate
axis x,. Angle + is constant for each ply regardless of angle a.
5.3.2 Displacement parameter w
The displacement parameter w is included in the calculation of the damage radius
parameter a(a) to account for the effects of specirnen geometry and support conditions on
the damage shape. A different analytical or numencd expression for displacement w will
exist for each unique geometric and support configuration. For this thesis, a rectangular
specimen was modelled with simply supported edges, as descnbed in Section 3.2. For
these conditions, the displacement was approximated using classical plate theory (Ashton
and Whitney, 1970). Using a Nawier series solution, the displacement is given as:

m m nny sin- sin -
where q,, is the load h c t i o n , a and b are the Iength and width of the plate. A unit point
load was assumed at the plate centre (a/2,b/2), giving an expression for q,, as:
q,, = -sin -sin- ab 2 2
Equation (5- 17) was denved for a mid-plane symmetrical laminate which satisfies
the conditions [B]=O and D16=&=0. Hygrothermal effects and effects of transverse
shear deformation were neglected, and static loading was assurned. Analytical
displacement equations for other geometry and support conditions may be derived as
outlined by Ashton and Whitney (1 970).
5.3.3 Critical strain parameter E,,
Composite materials Vary in both stiffhess and strength. Therefore when ranking
laminates of different materials, both the effects of stifiess and strength must be taken
into account. The stifiess changes are accounted for by the bending strain parameter cb.
given by equation (5-12). An extra parameter must be included in equation (5-8) to
account for the differences in strength. The critical strain parameter E, is proposed to be
used as a nomalising parameter for material strength. The critical strain represents the
maximum permissible bending strain which the specimen is allowed to sustain. For the

145
materials examùied in this thesis, in-plane strauis transverse to the fibre direction are
considered to be the most critical strains in promoting darnage. The critical strain was
deked to be:
where YT is the transverse tensile strength and E2 is the transverse modulus.
A limit strain or ultirnate strain of the material may be used to define the critical
strain parameter E, depending on the requirements of the structure. However. the
defuution of the criticai strain must remain consistent for al1 materials examined. The
inclusion of the parameter E, in the definition of damage radius parameter a(a) is a first
attempt to correlate the damage resistance of specimens composed of different materials.
Other matenal related properties, such as fracture toughness, were not considered in the
formdation of the darnage resistance parameter.

5.4 Evaluation of the Laminate Ranking Method
An evaluation was made of the proposed damage resistance parameter to rank
laminates for damage resistance. The method was evaluated by comparing the ranked
laminate results to experimental data published by Vietinghoff (1994) and Dost et al.
(1991). Also, laminate rankings made using the darnage resistance parameter were
compared against predicted FE mode1 results to determine the differences between each
method. Al1 specirnens examined in this chapter conform with Boeing Specification BSS
7260. The reduced specimen size of 127 mm by 76.2 mm (5 in by 3 in), comesponding
to the locations of the hinged supports, was used in the calculations of the damage
resistance parameter. Variables used in the damage resistance pararneter calculations are
given in Table 5-1. The critical strains given in Table 5-1 were calculated using equation
(5-19). A FORTRAN program was created to calculate the damage resistance parameter
DR. The program is available fiom the Department of Mechanical and Aerospace
Engineering. Carleton University upon request.
To illustrate the calculation procedure of the damage resistance pararneter. the
parameter n(a), given by equation (54, was ploned against angle a for a few selecred
layups, as shown in Figure 5-4. A unique contour was observed for each layup, varying
in both size and shape. Angles which contain the largest values of a(a) are expected to
receive the greatest damage. The damage resistance parameter D R which represents the
total area outlined by a(a), is then expected to be related to the total topographical

147
darnage area. The calculated DR values are indicated for each layup in Figure 5-4. For
layups LA and LD, the maximum value of a(a) occus around a = - 2 5 O , an angle which
lies in between the fist two ply orientations of -45" and O". For layup LF, the maximum
value of a(a) occurs around a = - 4 5 O . Comparing the DR contours to the results fiom the
FE rnodel reveals a nurnber of similarities. The DR contoun have a similar shape and
orientation as those predicted FEM damage areas, as shown in Figure 4-6 for test layups
1, 6, and 5 corresponding to layups LA, LD, and LF, respectively. The predicted DR
values also indicate a similar trend as the FE model; both kiyups LD and LF have
significantly larger DR values than LA. This trend is seen for the FE model in Figure 4-
6, where the damage areas of test layups 5 and 6 are larger than test layup 1. Also. the
DR contours reveal a similar limitation as the FE model; the interlamina stresses are not
accounted for in the proposed DR parameter, causing an underprediction of the damage at
ply orientations away fiom the back face.

Table 5- 1 : Parameters Used in the Calculations of the Damage Resistance Parameter
1 General Properties
1 for displacement calculation. n 1 1
Length of plate, a (mm) Width of plate, b (mm) Radius for displacement calculation, r (mm) Number of ternis in fourier series
Material Properties
127 76.2 7.62 30
1 lM718551-7 (Dow and Smith. 1988) 1
T800H13900-2 (Gaudert et al., 1993; Poon et al.. 1991) ' Longitudinal Modulus, E, (GPa) Transverse Modulus, E2 (GPa) Shear Modulus, GI2 (GPa) Poisson's Ratio, v,, Critical Strain, E,,
152 8.07 4.14 0.35
0.0098
Longitudinal Modulus, E, (GPa) Transverse Modulus, E, (GPa) Shear Modulus, G,, (GPa) Poisson's Ratio, v,, Critical Strain. E,,
139 9.38 4.50 0.33
0.0079

Materiai: TSOOW3900-2 Layup LA: [45/0/45/90],, DR = 2.20% 1 0-l4
O" O'
\ ," i . &;1 -
90' Layup LF: [-75/-601451-301 Layup LD: [-453/03/453/90,], -1 51011 5130145160~75~90]s DR = 6.1 5x10-l4 DR = 5.06~10*'~
Figure 5-4: Polar plot of parameter a(a) for selected layups
The correlation of the damage resistance parameter DR to experirnental data was
determined for the specimens Iisted in Table 5-2. Each specimen was impacted at
approximately the same energy, ranging fiom 15.5 to 19.2 J. Although the range of
impact energies is small, the differences in the impact energy will have an effect on the
damage size. To account for this effect, the measured damage area was norrndised by the
impact energy when plotted against parameter DR. For each specimen, the damage
resistance parameter DR was calculated, and then normalised by the calculated DR value
for layup LA. A plot of the damage resistance parameter DR against the measured
damage area is s h o w in Figure 5-5. A best-fit line was drawn for each materiai and the
R~ value, a measure of linear correlation, is indicated beside each line. A R* value of 1
indicates a linear correlation. while a R~ coefficient of O indicates no linear correlation.
A strong Iinear correlation was observed for both materials. The correlation was
higher for the Toray T800W3900-2 specimens, due in part to a more accurate assessrnent
of the topographical damage area. The damage areas measured by Dost et al. (1991)
were reponed as a damage diameter, giving an approximation of the acnial damage.
whereas the damage areas reported by Vietinghoff (1994) were a measurement of the
actual damage. Onfy two specimens, BA and BF, were observed to deviate fiom the
linear trend. The measured damage area for specimen BA was observed to be unusually
low as compared with the rneasured damage areas of the other specimens. and therefore is
considered to be an outlier point. Specimen BF, however, indicates a limitation of the

151
darnage resistance parameter. The stacking sequences for both BE and BF are similar
except for the switch of the -30" and -60" plies, as listed in Table 5-2. The effect of
switching the -30" and -60" plies produces only a minimal stiffness change, as s h o w by
the sirnilar DR values in Figure 5-5. The large increase in darnage is hypothesised to be
caused by the change in interlamina. stresses at the afTected interfaces; an effect which is
not niodelled by the darnage resistance parameter. Also, switching the -30" and -60"
plies varies the constant stacking angle of 30°, apparently reducing the damage resistance.
This observation was also seen with specimens LA and MB.
As a cornparison of the Iaminate ranking using the FE mode1 and the damage
resistance parameter, the FE damage predictions were correlated with the Vietinghoff
specimens in Table 5-2, and are plotted in Figure 5-6. The FE data were normalised uith
respect to predicted damage area of specimen LA, and the measured darnage areas were
normalised with respect to impact energy. Like the darnage resistance parameter- the
correlation between the FE results and the measured darnage area was linear. The FE
results gave a slightly better correlation of the experirnental data with a R' value of 0.997
compared to 0.991 for the pararnetric results.

Table 5-2: Experimental Data Used to Evaluate the Damage Resistance Parameter
I I Data from Vietinghoff (1 994)
LA
I LD LE LF
1 M B**
I
Data from Dost et al. (1 991) (Data reported originally as a damage diameter)
** Test perfomed by author I I
BA BB BC BD BE BF
247 1020 275
727 1 332
[-451645/90]~~ . [-453/031453/903]S [-60/-30/0130160/90]2s [-751-601-451-301-151 011 5130/45160/7 5/90 JS [-45/0/30/45/901-6O],S
15.5 15.7 15.6 15.6
19.2
[45/901-4510 J3s
[45/(901-45)3/(O145)2/O]s [451(0145),/(90145)2/0~s [4531903/-453/03]s [30160/90/-60/-3010]2s [30160190/-30/-60/0]2s
16.3 16.3 16.3 16.3 17.6 19.0
115 585 638 1320 423 638

Nonnalised Damage Resistance Parameter
Figure 5-5: Damage resistance parameter versus measured topographical damage are% Impact energy 1 5- 19J
Normalised Predicted FEM Damage Ama
Figure 5-6: Predicted FEM damage area versus measured damage area, impact energy 15- 19J

The ranking of specimens impacted at different energies was also evaluated for
layups LA, LD, LE, and LF. As previously mentioned in Section 5.1, peak contact force
provided a convenient method of correlating impact damage for specimens with a
cornmon stacking sequence, material, and thickness. To correlate specirnens with
different stacking sequences, the peak contact force was multiplied by the damage
resistance parameter to provide a ranking pararneter. Using the experirnental data
previously plotted in Figure 5-1, the peak contact force multiplied by the damage
resistance pararneter was plotted against the measured darnage area, as s h o w in Figure
5-7. As in previous plots, the damage resistance pararneter DR was normalised with
respect to the calculated DR parameter for layup LA.
Figure 5-7 indicated nvo trends for each layup. Specimens impacted at low
energies below a threshoid point have a linear correlation between the ranking parameter
and damage area. Specimens impacted at energies above the threshold point diverged
away fiom the linear trend, showing a further increase in the measured damage area. but
only a minimal increase in the ranking parameter. The threshold point for each l a p p is
indicated in Figure 5-7 by the intersection of the main trend line with the vertical
threshold line. The threshold energy represented the transition of the damage propagation
mechanisrns, based on observations made by Vietinghoff (1994). For specimens
impacted at energies below the threshold point, the damage propagated primado bu
intemal damage, delamination and rnatrix cracking. with a minimal amount of back face

155
damage. For specimens impacted at energies above the threshold point, the darnage
propagated through back face damage, ply blow-out, matnx cracking of the bottom ph ,
and fibre breakage, with a minimal increase to the intemal damage. The threshold point
was unique for each layup plotted in Figure 5-7.
A linear correlation of data for dl four layups was seen for specimens impacted
below the threshold points. The data contains some degree of scatter resulting fiom
expenmental error in measurement and variability in manufacturing. However, a best-fit
line for data below the threshold points contained a R~ value of 0.953, indicating a high
degree of linearity. Darnage measured fiom specimens impacted at energies above the
threshold energy are not accounted for by the darnage resistance pararneter.
To compare the performance of the FE mode1 to the damage resistance pararneter.
the experimental data of Figure 5-1 were also ranked using FEM darnage predictions.
Predictions of damage area were made for each layup subjected to a point load of 7.5 W.
The predicted areas were fust normalised by the predicted damage for layup LA, then
multiplied by peak contact force to give a ranking pararneter. The peak contact force *
predicted FEM damage was plotted agauist the rneasured damage area, as shown in
Figure 5-8. As in Figure 5-7, a linear trend was seen for al1 layups for specimens
subjected impacts at energies below the threshold points. Larninate ranking using the
FEM predicted damage gave a slightly beaer correlation to the expenmental data, with a
R~ value of 0.970 as compared to 0.953 when using the damage resistance parameter.

B
Matenal: T800H13900-2 Layup LD LD [45dOd45d903Is
B
B 1 5/30/45/60/75/90]s i Layup LE [-601-3010130160190]2s LE
O 5 1 O 15 20 25 30 35
Nonnalised Damage Resistance Parameter ' Peak Contact Force (kN)
Figure 5-7: Laminate ranking of specimens impacted at various energies using the damage resistance parameter (threshold point indicated by intersection of the main trend line with vertical threshold line for each Layup)
Material: T800Hl3900-2 Layup LD LD I'453JO&W9031s I
Layup LF [-7 51-601-451-301- 1 5101 1 5130145160/75190]s
Layup LE [SOI-30/0130/6 0/90]-+ LA
Layup LA [-4510/45/90];5
1
5 IO 15 20 25
Normalised FEM Damage Area ' Peak Contact Force (kN)
Figure 5-8: Laminate ranking of specimens impacted at various energies using predicted FEkl damage (threshold point indicated by intersection of the main trend line with vertical threshoId line for each layup)

To evaluate the differences between the damage resistance parameter and the FE
model, the two methods were correlated against each other for a series of stacking
sequences listed in Table 5-3. Al1 stacking sequences in Table 5-3 contain plies oriented
at 0°, 45O, -45*, and 90°. The D-series layups contain plies stacked randomly to test the
parametric ranking method. The L-series layups are quasi-isotropic layups. The M-series
layups are general orthotropic layups used in industry, previously examined in Section
4.5.2. The P-senes layups test the ply grouping effect. previously examined in Section
4.4.3. A plot of the damage resistance parameter, normalised with respect to layup LA.
against the predicted FEM damage is f o n d in Figure 5-9. A good linear trend was found
between the damage resistance parameter and the predicted FEM damage, as indicated by
the R' value of 0.923. However, a fair amount of scatter was observed between the two
parameters. This would indicate that although the damage resistance parameter predicts
similar trends as the FE model, the two predictions methods are not equivalent.
The differences between the two methods were more pronounced when
comparing the quasi-isotropie layups listed in Table 4-1, as shown in Figure 5- 10. Each
ranked specirnen was stacked with a constant interface angle, as noted in Figure 5-10.
For layups with an interface angle less than or equal to 60°, the DR parameter correlated
well with the predicted FEM damage area. For these layups, an increase in the DR
parameter corresponded with an increase in the predicted FEM damage in relatively the
same proportions. As the interface angle increased, however, the calculated DR value

158
deviated greatly from the predicted FEM damage, as noted with layups LH and LI. An
increase in the predicted damage did not correspond with an appropriate increase in the
calculated DR value for these layups. The cause of deviation between the two methods is
examined in Section 5.5.
Table 5-3: Specirnen Data used to Compare Rankings Using the Damage Resistance Parameter DR and Predicted FEM Damage
1 - Damage resistance parameters were nonalised with respect to calculated DR value for (

Mate rial: T800HJ3900-2
i meD' Layups '
, a 'C Layups
, 'M' Layups
0 'P' Layups
Norrnalised Damage Resisbnce Parameter
Figure 5-9: Comparison of damage resistance parameter against predicted FEM damage for layups listed in Table 5-3
Material: T800H/3900-2
Nonnalised Damage Resistance Parameter
Figure 5-1 0: Comparison of damage resistance parameter against predicted FEM damage for layups listed in Table 4- 1

5.5 Discussion
As noted in Section 5.4, the damage resistance parameter was capable of ranking
laminates with respect to damage resistance. The rankings comelated reasonably well
when compared to the available experimental data, providing a linear correlation between
the damage resistance parameter DR and measured damage area as demonstrated in
Figures 5-5 and 5-7. These results show great promise for the use of the damage
resistance pararneter as a means of impact damage prediction. By correlating the darnage
resistance pararneter to baseline experimental data, predictions of impact darnage may be
made without the need of sophisticated and tirne-consuming fuiite element analysis.
Table 5-4 shows clearly the advantage of using a darnage resistance parameter by
comparing the computational time of various prediction rnethods. The most sophisticated
model, created by Majeed (1995), required one week of computationd time to analyse a
single layup. The damage resistance parameter showed a tremendous improvement in
performance over both the Majeed mode1 and the FE model presented in this thesis.
requiring a mere 3.4 seconds.
Table 5-4: Cornparison of Darnage Prediction Methods
Dynamic FE Model with contact analysis and progressive failure modelling (Majeed, 1995) Static FE Model with volume elements
1 week
2 hours Damage resistance parameter 1 3.4 seconds Computational time was measured for the analysis of a single layup configuration. All times were measured using a Silicon Graphics Challenge U2 Workstation. Times do not include pre- and 1 post- processing of data. I

161
The damage resistance parameter, with such an enormous speed advantage, is
clearly suited for preliminary design analysis. When initially designing a composite
structure, the damage resistance parameter can provide quick estimates of the impact
damage resistance for various stacking sequences being considered. By creating an
optimising routine, it is conceivable that a program could be developed to find an
optimised stacking sequence for damage resiçtance based on the required number of plies
at the various orientations. M e r fmding an "optimised" stacking sequence, a more
accurate assessrnent of the impact darnage resistance may be made by either experirnental
or numencal means. The results of the method could also be used as an input for darnage
tolerance studies, such as compression-afier-impact analysis (Vietinghoff. 1994).
Damage tolerance studies require the amount of damage present within the laminate to
determine the strength degradation. Using this approach in the preliminary design stage
will undoubtedly Iower both the costs and time of development.
W l e the results of using the darnage resistance parameter were generally
positive, it is by no means a verification of the method. Further experimental testing
would be required to determine the limitations and strengths of the method. The
evaluation perfomed in Section 5.4 has indicated some weaknesses in the damage
resistance parameter. Anaiysing a wide variety of stacking sequences has revealed a
noticeable degree of scatter between the predicted FEM darnage and the darnage
resistance parameter as shown in Figure 5-9. With the absence of actual experimental
data for these specimens. it is difficult to estimate the error of prediction when using the

162
darnage resistance parameter. A particular weakness was found with layups containing
stacked plies with interface angles greater than 60". The damage resistance parameter
significantly underestimated the damage for these types of specimens.
The cause of the scatter is due to a number of reasons. The damage resistance
parameter, like the FE model, was shown to underpredict darnage which is created fiom
intemal interlaminar stresses. Stacking sequence changes which cause a change to the
interlaminar stresses but not to the overall bending stifiess of the Iaminate lead to
significant mors when ranked by the damage resistance parameter. However, the largest
problem with the damage resistance parameter is widi the rnethod of assessing damage.
The FE model predicts damage by first calculating the transverse in-plane stresses q and
the interlaminar stresses o, and a5 at each interface, and then applying a failure cntenon.
In contrast, the damage resistance parameter does not calculate the equivalent strain
distribution at each individual interface, but rather the maximum E, strain of an entire
larninate cross-section. The main contribution to the darnage resistance parameter will be
the transverse in-plane strains E? of the ply or plies oriented closest to angle of calculation
a. Since the s2 strain is a principal strain which causes delarnination damage, the damage
resistance parameter will be related to the impact damage in most cases. When several
plies are closely oriented with the angle of calculation a , the damage resistance parameter
will primarily be a measure of the E, strains at these a-oriented plies. When the plies are
not closely aligned with angle a, the damage resistance parameter will be a measure of
both the E, and EZ strains. For layups with a smatl interface angle. one or more plies will

163
be always oriented at a similar angle as the angle a, giving a better measure of the s2
strains which create damage. For layups with a large interface angle, the plies are not as
likely to be oriented with the angle a, causing the damage resistance parameter to be a
combined measure of E, and E, strains at any layer. This will lead to emneous
predictions of the damage area.
The damage resistance parameter was primarily evaluated to rank laminates with
respect to changes in stacking sequence. A brief examination of ranking laminates with
different materials, as shown in Figure 5-5, was shown not be correlated by the damage
resistance parameter. Although the damage resistance parameter accounts for the
structural stifhess of the matenal. the final darnage is largely a function of the matenal's
fracture toughness properties; an effect not predicted by a stren=gh of materials approach.
A ranking parameter would need to account for the fracture toughness properties. in order
to rank laminates on the basis of material.
The proposed damage resistance parameter, in its current form as given by
equation (5-7), does not account for changes in thickness. A change in thickness will
create an associated change in the bending strain. However by integrating the calculated
beam strain, as is done in equation (5-7), the changes in strain are effectively squared.
biasing the results when making cornparisons to larninates with a different thickness.
Therefore to include thickness as a basis for ranking laminates. the damage resistance
parameter must be modified in a way as not to bias thickness changes when integrating

164
the calculated beam strain. Also more experimental data are required to detemine the
effect of altering thickness on the impact damage.
The proposed damage resistance parameter is a fust attempt of correlating impact
darnage with respect to changes in stacking sequence. As noted above, several
modifications are required to improve the accuracy and robustness of the method. These
modifications, when irnplemented, will undoubtedly alter the original proposed form as
given in equation (5-7). However, the concept of using a damage resistance parameter to
predict impact damage has proved to be feasible, in spite of the simpliQing assurnptions
made, including the use of static analysis and the lack of progressive damage modelling.
With M e r research, the damage resistance parameter could provide impact damage
predictions for a wide range of layups at a fraction of the time and cost of damage
prediction methods used in industry today.

5.6 Summary
A parameter based on the bending st if iess of a laminate was proposed in this
thesis as a rnethod of ranking the damage resistance of laminates with respect to changes
in stackhg sequence. The method was evduated by comparing the ranked laminate
results to existing experirnental data of impacted specimens. The results were generally
positive, as the calculated darnaae resistance parameter was found to have a high linear
correlation with the measured darnage areas. When the parameter is combined wiîh the
peak contact force of the impact event, rankings can also be made for specimens irnpacted
at different energies. In addition? the damage resistance parameter was s h o w to have
superior performance in computing t h e over the finite element rnethod, making the
damage resistance parameter a suitable candidate for use in the prelirninary design stage.
Several limitations were noted with the method, including the inaccurate ranking of
laminates containing interface angles greater than 60". As a result, future research is
required to address these limitations and extend the method to allow darnage resistance
ranking with respect to material and thickness changes. With these modifications, the
damage resistance parameter should provide a viable alternative to the sophisticated and
time-consuming fmite elernent method when making impact damage predictions.

Chapter 6
Conclusions
6.1 Conclusions
This thesis analysed the effects of stacking sequence on the damage resistance in
carbon fibre reinforced composite laminates. Based on the research performed for this
thesis, the following conclusions are drawn:
1. Damage within composite laminates due to transverse loading is a cornples
phenornenon involving multiple damage mechanisms and progressive damage
propagation.
2. The use of a static f ~ t e element model using a strength of material formulation LW
found to give reasonable predictions of delamination damage for the low-velocity
impacts considered. The main limitation of the model was the lack of progressive
damage modelling. This caused an underprediction of the interlaminar shear stresses.
3. Changes to the stacking sequence of a laminate will cause significant changes in the
darnage resistance capability.

167
4. Three stacking sequence parameters were identified to affect darnage resistance: ply
grouping, interface angle between laminae, and laminae orientation. Each pararneter
will have a different effect on the damage resistance.
5. The bending s t ieess of the laminate is a parameter that is strongly linked to the
damage resistance of the laminate. Regions of the laminate containing a high bending
stiffhess were found to have a greater amount of impact damage.
6. A damage resistance pararneter based on the bending stifniess of the laminate and the
peak contact force of the impact event was fomulated and was found to givr good
predictions of darnage resistance for layups containing interface angles of 60° and
below.
7. Bending stifhess is not exclusively related to damage, as other parameters such as
fracture toughness and thickness will also affect the damage state. Therefore. the use
of bending stifiess alone will not give estimates on the damage resistance of a
particular stacking sequence.
6.2 Future Research
n i e following is proposed for future research in the field of impact damage
resistance in composite materials:

168
1. Improve the accuracy of the f ~ t e element model. This will include the development
of more efficient elements which will reduce computational effort and allow more
detailed stress modelling.
2. Develop an improved larninate failure theory which accounts for fiacture growth of
delamination damage.
3. Perform more experimentai tests to evaluate the accuracy of the proposed laminate
ranking method. Layups examined in the parametric study presented in this thesis are
s-gested as the basis for an experimental test program.
4. Improve the proposed laminate ranking method to account for damage created by
interlaminar stresses and to account for stacking sequences containing interface angles
of 60" or greater.
5. Expand the proposed laminate ranking method by modelling the esects of fracture
growth to account for the changes in material properties and by modelling changes in
the structural response due to changes in laminate thickness.
6 . Further investigate the effects of changes in specimen geometry and boundary
supports on the damage resistance in the material.

6.3 Summary of Contributions
This thesis has made the following contributions to the generai knowledge in the
field of impact damage resistance in composite materials:
1. Three parameters af5ecting stacking sequence were identified: ply grouping, interface
angle b e ~ e e n lamïnae, and Iaminae orientation. The effect of each parameter on
damage resistance was extensively analysed using the finite element method.
2. A set of guidelines was proposed to improve the impact damage in composite plates.
based on trends observed fiom f ~ t e element modelling and the experirnentai findings
of other researchers.
3. A laminate ranking method was proposed to evaluate the impact darnage resistance of
different stacking sequences.

References
Abrate, S. (1 991). "Impact on Laminated Composite Matends." Applied Mechanics
Review 44 (4), 155-190.
Aganval, B., Broutman, L. (1990). Analysis and Performance of Fiber Composites.
Second Edition. Toronto: John Wiley & Sons, Inc.
Arnbur, D., Starnes, J. H., Prasad, C. (1995). "Low-Speed Impact Damage-Initiation
Characteristics of Selected Laminated Composite Plates." A U Journal 33 ( 1 O ) , 1 9 19-
1925.
Ashton, J. E.. Whitney, J. M. (1970). Theory of Laminated Plates. Stamford, Corn..
U.S.A.: T echnomic Publishing Co.
Avery, W., Grande, D. (1990). "Influence of Materials and Layup Parameters on
Impact Damage Mechanisms." 22th International SAMPE Technical Conference
(November), 470-482.
Boeing Company. (1988). Advanced Compression Tests. Boeing Specification Support
Standard BSS 7260, Revision C, Seattle, WA, USA.
Bogdanovich, A., Friedrich K. (1994). "Initial and progressive failure analysis of
laminated composite structures under dynamic loading." Composite Structures 27,439-
456.
Brewer, J., Lagace, P. (1988) "Quadratic Stress Criterion for Initiation of
Delamination." J. of Composite Materials 22, 1 141 -1 155.

Cantwell, W. J., Morton, J. (1989). "Geometricd Effects in the Low-Velocity Impact
Response of CFRP." Composite Structures 12,39-59.
Cantwel:, W. J., Morton, J. (1991). "The Impact Resistance of Composite Materials - A
Review. " Composires 22,347-362.
Chang, F. K., Chang, K. Y. (1987). "A Progressive Darnage Model for Laminated
Composites Containkg Stress Concentrations." J of Composite Materials 21, 834-835.
Chang, F., Chen. M. (1987). "The In-Situ Ply Shear Strength Distributions in
GraphitefEpoxy Laminated Composites. " J. of Composire Materials 21,708-733.
Choi, H. Y.. Chang, F. K. (1992). "A Model for Predicting Damage in GraphitrEpoxy
Laminated Composites Resulting from Low-Velocity Point Impact." J. of Composite
Materials 26.2 134-2 169.
Choi, H. Y., Wu, H., Chang, F. (1991). "A New Approach towards Understanding
Damage Mechanisms and Mechanics of Laminated Composites Due to Low-Velocity
Impact: Part II-Analysis. " J. of Composite Materials 25, 10 12- 1 O3 8.
Choi, 1. H., Hong, C. S. (1994). ';New Approach for Simple Prediction of Impact Force
History on Composite Laminates." A M Journal 32 ( 1 O), 2067-2072.
Christoforou, A. P., Swanson. S. R. (1991). "Andysis of Impact Response in
Composite Plates." Int. J. Solids Structures 27 (3, 16 1 - 1 70.
Clark, G. (1 989). "Modelling Impact Darnage in Composite Laminates." Composites
20.209-21 5.
Dobyns, A. (1 98 1). "Analysis of Simply-Supported Orthotropic Plates Subject to Static
and Dynarnic Loads." AIAA Journal 19 (j), 642-650.

Dost, E., Ilcewicz, L., Avery, W., Coxon, B. (1991). "Effects of Stacking Sequence on
Impact Damage Resistance and Residual Strength for Quasi-Isotropie Laminates."
Composite Mmerials: Fafigue and Fracture F i r d Volume), ASTM STP 11 10.
American Society for Testing and Materials, Philadelphia, 476-500.
Dow, M., Smith, D. (1988). "Properties of Two Composite Materials Made of
Toughened Epoxy Resin and High-Straïn Graphite Fiber." NASA Technical Paper TP-
2826.
Engineering Mechanics Research Corporation (EMRC). (1994a). DISPLAY 1.1 User's
Manual Version 5.2. (December). Troy, Michigan, U.S.A.
Engineering Mechanics Research Corporation (EMRC). (1 994b). NISA II User 's
Manual Version 94.0. (December). Troy, Michigan, U.S.A.
Federal Aviation Regulations (FAR). (1 99 1). Subchapter C- Aircraft, Parts 23 and 25.
25.571-1. 14 CFR Chapter 1. US Department of Transportation, Federal Aviation
Administration, Washington, DC.
Fim, S. R., He, Y., Springer, G. S. (1993). "Delaminations in composite plates under
transverse impact loads - Experimental results." Composite Structzrres 23, 1 9 1 -204.
Finn, S. R., Springer. G. S. (1993). "Delaminations in composite plates under
transverse static or impact loads - A model." Composite Structures 23, 1 77- 1 90.
Fuoss, E., Stramicky. P. V., Poon, C. (1994). "Prediction of Impact-Induced
Delamination in Composite Plates." Advanced Composite Letters 3 (6), 193- 196.
Gaudert, P.C., Lee, S., Poon, C., Gould, R (1 993, January). Mechanical Test Results
for Torczy Epoxy-Preimpregnated Curbon Fibre Laminates. National Research Council
Canada. LTR-ST- 19 1 0, Ottawa, Canada.

Gibson, R. F. (1994). Principles of composite material mechanics. Toronto: McGraw-
Hill.
Gosse, J. H., Mon, P. B. Y. (1988, September). "Impact Damage Characterization of
Graphite/Epoxy Laminates." Proc. Americun Sociew for Composites, 3rd Technical
Conference on Composite Materials, 344-353.
Hashin, Z. (1 980). "Failure Critena for Unidirectional Fiber Composites." J. of Applied
iMechanics 47,329-334.
Hitchen, S., Kemp. S. (1995). "The effect of stacking sequence on impact damage in a
carbon fibre/epoxy composite." Composites 26, 207-2 14.
Hong, C. S., Choi, 1. H., Kim, C. G. (1994). "Estimation of Damage Area Due to Low-
Velocity impact in Composite Laminates." Proc. Am. Soc. for Composites 9th
Technical Confirence, 473 -48 1.
Hurnphreys, E. (1 98 1, July). "Development of an Engineering Analysis of Progressive
Damage in Composites During Low Velocity Impact." NASA Contract Report 16.5778.
Jih, C. J., Sun C. T. (1993). "Prediction of Delamination in Composite Laminates
Subjected to Low Velocity Impact." J. of Composite Marerials 27 (7), 684-701.
Jones, R., Paul. J.. Tay, T., Williams, 1. (1988). "Assessrnent of the Effect of Impact
Darnage in Composites: Some Problems and Answers." Composite Strzicrures 10. 5 1-
73.
Joshi. S. P., Sun, C. T. (1987). "Impact-Induced Fracture in a Quasi-isotropie
Larninate." J. Of Composite Technologv and Reseurch 9, 684-70 1 .
Kaczmarek. H., Maison, S. (1994). "Comparative Ultrasonic Analysis of Damage in
C F W under Static Indentation and Low-Velocity Impact." Composites Science and
Technology 51, 1 1-26.
Kwon, Y. S., Sankar, B. V. (1991, October). "Indentation Damage in GraphitelEpoxy
Laminates." Proc. American Society for Composires, 6rd Technical Conference on
Composite Materiak. 483-492.
Lagace. P., Williamson, James, E., Tsang, P. K., Wolf. E.. Thomas. S. (1993). "A
Preliminary Proposition for a Test Method to Measure (Impact) Darnage Resistance." 1
of Composite Materials 12, 584-601.
Lee. S.. Zahuta. P. (1991). "Instrumented Impact and Static Indentation of
Composites. " J. of Composite Materials 25, 204-277.
Lesser. A. J.. Filippov, A. G. (1991, April). "Kinetics of Damage Mechanisms in
Laminated Composites." 36rh Internarional SAMPE Symposiiim. 886-8 99.
Liu. D. ( 1 988)."Impact-Induced Delamination - A View of Bending Stiffness
Mismatching." J. of Composite Materials 22.674-692.
Liu. S.. Chang F.K. (1994). "Matrix Cracking Effect on Delamination Growth in
Composite Laminates Induced by a Spherical Indenter." J. of Curnposire .\.larerials 28
(1 O ) , 940-977.
blajeed. O. (1 993). "Numerical rnodelling of transverse impact on composite coupons."
Thesis (M.Eng.) - Carleton University, Ottawa. Canada.

Matsuhashi, H., Graves, M., Dugundji, L, Lagace, P. (1993). "Effect of Membrane
Stiffening in Transient Impact Andysis of Composite Laminated Plates." Proceedings
of the 34th ALeVASME/ASCUAHS/ASC Structures, Stmcturul Dynamics and
Materials Confrence. LaJolla, California, 2668-2678.
Monta, H., Hamamoto, A., Adachi, T., Nishimori, K., Matsumoto, H. (1995).
"Influence of Impact Velocity and Lay-up Parameter on Impact Damage Resistance of
C FR E E K Larninates." The 36th AWASMHASCWAHS'ASC Structures, Sfrucr ural
Dynamics, and Materials Conference, AIAA-95-1284-CP, 1093-1 100.
Ochoa, O., Reddy, J. N. (1 992). Finite element analysis of composite laminates.
Norwell MA: Kluwer Acadernic Publishers.
Olsson, R. (1 992). "Impact Response of Orthotropic Composite Plates Predicted frorn a
One-Parameter Differential Equation." A M Journal 30, 1 5 87- 1 596.
Pagano. N. J. (1 970a). "Exact Solutions for Rectangular Bidirectional Composites and
Sandwich PIates." J. of Composite Materiais 4 ( 1 ) , 20-34.
Pagano. N. J. (1970b). "Influence of Shear Coupling in Cylindncal Bending of
Anisotropic Laminates." J. of Composite Molerials 4 , 3 30-243.
Pagano. N. J., Pipes R. B. (1971). "The Influence of Stacking Sequence on Larninate
Strength." J. of Composite Materials 5, 50-57.
Poon. C.' Komorowski, J. P., Gould, R., Chapman. C. E. (1991). Quantitative
Assessrnent of Impact Damuge in Composites. National Research Council Canada.
IAR. LTR-ST-1829. Ottawa. Canada.

Qian, Y., Swanson, S. R., Nuisrner, R., Bucinell, R. (1990). "An Expenmental Study of
Scaling Rules for Impact Darnage in Fiber Composites." J. of Composire Materials 24.
559-570.
Rybicki, E., Konninen, M. (1977). "A Finite Element Calculatian of Stress Intensity
Factors by a Modified Crack Closure Integral." Engineering Fraclure Mechanics 9.
93 1-938.
Sjoblom, P., Hamess. J., Cordell, T. (1988). "On Low-Velocity Impact Testing of
Composite Materiais. " J. of Composite Materials 22, 3 0-57.
Sohn. M., Hu, X. (1995). "Comparative study of dynamic and static delamination
behaviour of carbon fibre/epoxy composite laminates." Composites 26. 849-858.
Srinivasan. K., Jackson. W. C., and Hinkley, I. A. (1991. J a n u q ) . "Response of
Composite Materials to Low Velocity Impact. " NASA Technicd .Llemorrrn~lzrm 102 7.55.
Strait, L.. Karasek, M., Amateau, M. (1992). "Effects of Stacking Sequence on the
Impact Resistance of Carbon Fiber Reinforced Thermopiastic Toughened Epoxy
Laminates." J. of Composite Materials 26 ( 1 2)- 1 725- 1 740.
Straznicky. P.V., Poon, C., Worswick, M. J.. Fuoss. E.. Majeed. O.. Vietinçhoff. H.
(1995. August). "Damage Resistance in Composite Materials." Proceedings of the
Tenth International Conference on Composite Marerials. Volume V : Structures. 607-
614.
Swanson. S. R. (1992). "Limits of quasi-static solu~ions in impact of composite
structures." Composire Engineering 2 (4), 26 1 -267.
Vietingho ff, H. (1 994). Compression-afrer-impact srrengrh of curhon fibre rein forced
plusr ic laminates. Thesis (M-Eng .) - Carleton University. Ottawa. Canada.

Vosteen, L., Hadcock, R. (1994, November). "Composite Chronicles: A Study of the
Lessons Learned in the Development, Production, and Service of Composite
Structures." NASA Contractor Report CR-1620.
Wang, H., Vu-Khanh, T. (1994). "Damage Extension in Carbon FibedPEEK Crossply
Laminates under Low Velocity Impact" J. of Composite Materials 28,684-707.
Whitney, J., Pagano, N. (1970). "Shear Deformation in Heterogeneous Anisotropic
Plates." J. of Applied Mechanics 37, 1 O3 1 - 1036.
Wu, H. T., Springer, G. S. (1988). "Impact Induced Stresses, Strains, and
Delaminations in Composite Plates." J. of Composite MuteriaZs 22. 5 3 3-560.