Embed Size (px)
Citation preview

Carlsbad Seawater Desalination Project
Richard Heede Climate Mitigation Services 1626 Gateway Road, Snowmass, [email protected] www.climatemitigation.com Colorado, 81654, USA 970-927-9511
Chairman Patrick Kruer and Honorable Commissioners California Coastal Commission 45 Fremont Street, Suite 2000
San Francisco, CA 94105-2219
Re: Carlsbad Seawater Desalination Project
5 August 2008
Honorable Commissioners Kruer, Blank, Potter, Reilly, Shallenberger, and Wan: This letter summarizes an analysis of greenhouse gas emissions from the operation of the Carlsbad Seawater Desalination Project (CSDP) published by Poseidon Resources, the project applicant, in the company’s Energy Minimization and Greenhouse Gas Reduction Plan.
Climate Mitigation Services (CMS) was commissioned by San Diego Coastkeeper to review the plan, assess its veracity, discuss its weaknesses, and re-estimate emissions as necessary. CMS is pleased to share the results with the Coastal Commission.
Carlsbad Seawater Desalination Project and its GHG emissions and mitigation plan The CMS analysis identifies and quantifies all significant sources of greenhouse gas emissions inherently linked to the construction and operation of the proposed 50 MGD seawater desalination plant. CMS has reviewed the estimates summarized by Poseidon in its Energy Minimization and Greenhouse Gas Reduction Plan submitted to the California Coastal Commission, 3Jul08. CMS has estimated two emission sources ignored by Poseidon: 1). emissions from the construction phase of the oil tank removal, building and facilities construction, earthmoving, and pipeline construction, and 2). annual emissions from operations (e.g., transportation of treatment chemicals, materiel, equipment trucking, waste disposal, and employee commuting).
The chief difference between Poseidon’s and CMS’s estimates regard the matter of quantifying avoided emissions from displaced water: the CMS estimate follows the argument to its logical conclusion: if emissions are avoided elsewhere in the water provision system serving the San Diego region with 579,000 AF in 2006, then those avoided emissions must account for the source of the water (State Water Project and Colorado River Aqueduct), the differing electric intensities of each system, and the varying carbon intensities of the electricity used. Only in this way is a fair accounting of avoided emissions calculated.
Others argue that the Carlsbad plant will supply new water, and that taking emission credit for reduced water imports should not be permitted in a greenhouse gas reduction plan. This is a matter for the Commission to decide. In the meantime, CMS simply offers a better way to calculate the relevant carbon offsets, should be Commission accept Poseidon’s position. Poseidon is also likely to argue that the company has an agreement with the Metropolitan Water District to first reduce imports from the State Water Project. This has to be legally validated before the emission accounting protocol and result is approved by the Coastal Commission.

Carlsbad Seawater Desalination Project
Richard Heede Climate Mitigation Services 1626 Gateway Road, Snowmass, [email protected] www.climatemitigation.com Colorado, 81654, USA 970-927-9511 2
Electricity emission factor Poseidon uses the emission factor for San Diego Gas & Electric (SDGE) published on the California Climate Action Registry website, which states its emissions, per CCAR protocol, in lb CO2 per MWh of electricity delivered.1 CMS checked the calculations using the data provided on the filed form, and concludes that the calculation does not follow the CCAR protocol in that the result shows 780.79 lb CO2 per MWh generated rather than per MWh delivered.2 CMS may have misunderstood SDGE’s calculation, or CCAR’s protocol, but it warrants clarification. CMS estimates that re-calculating the emission factor to account for transmission and distribution losses at a conservative 6 percent results in a factor of 830.6 lb CO2/MWh delivered, and would increase Poseidon’s baseline by 6,200 tCO2. Furthermore, SDGE does not estimate emissions of methane, nitrous oxide, and fluorinated compounds, and its total emissions may be conservative. CMS, however, adopts the use of SDGE’s emission factor in its calculations.
Baseline emissions Poseidon estimates baseline consumption of 274 million kWh of electricity — sufficient for ~45,000 SDGE households3 — and emissions of 97,156 metric tonnes carbon dioxide (tonnes CO2). CMS reviewed the methodology, and although the provided engineering and plant design data is sparse, found no reason to either increase or decrease Poseidon’s estimated baseline consumption of electricity or CO2 emissions. Two factors should be brought to attention:
1. Motor efficiencies listed in the Plan’s Table 2 are unreasonably low. That is, large-motor efficiencies of the cited 65 to 82 percent range (the baseline case), which are modestly improved for only two large motors (from 70 to 80 percent), make no engineering or financial sense to this writer. Standard-performance motors are routinely in the 88 to 92 percent range, and high-efficiency motors (especially large motors) often exceed 94 percent.4 Partial loads for motors in these categories and constant high loads also makes little sense, except in unusual operating conditions. Poseidon may have an explanation for listing such very low motor efficiencies, but experts consulted by CMS were puzzled.5 CMS ran some calculations based on much higher motor efficiencies and thus reduced electricity consumption, but this reduced electric intensity of the desalination plant far below Poseidon’s stated baseline of ~4,400 kWh/acre-foot (kWh/AF).
2. The uncertainty of whether Poseidon (and, by extension, the CCC and CSLC) is using SDGE electricity emission factor that does not account for the grid losses between electricity generation and distribution to ultimate customers must be conclusively answered.
High efficiency design: premium-efficiency motors and pressure exchanger recovery As mentioned above, premium-efficiency motors often exceed 94 percent efficiency, and Poseidon’s listing of 65- to 82-percent efficiencies needs clarification. There appears to be room for improvement, with large reductions in electricity consumption, demand charges, motor size (and cost), and emissions. Annual electricity cost of a continuous-duty 2,100 HP motor (such as 1 CCAR (2008) General Reporting Protocol, v3.0, is unclear on the matter, and only suggests estimating emissions based on emissions per MWh delivered. The WRI GHG Protocol does not include T&D losses (which are instead attributed to generators or distributors of electricity. The confusion arises from the language in the CCAR Annual Entity Emission form itself, that is: under “emissions efficiency metrics” the entity is to report emissions in “lb CO2/MWh delivered.” CCAR may have meant emissions per MWh generated and/or purchased; CMS calculates but does not apply the higher factor; CMS uses 780.79 lb CO2/MWh. See www.climateregistry.org for details. 2 Dividing total SDGE emissions by the utility’s total own generation + purchased power, or 6.77 million tonnes CO2 / 19.11 TWh = 780.79 lb CO2/MWh. See Table 4 in the attached suite of worksheets for details. 3 Brown & Koomey (2002) 6,000 kWh/household-yr in SDGE territory; average T&D loss of 6.9% (9.3% at peak). 4 E SOURCE (1999) State of the Art: Drivepower. 5 E.g., Dan Greenberg, E source, personal communication, 31Jul08.

Carlsbad Seawater Desalination Project
Richard Heede Climate Mitigation Services 1626 Gateway Road, Snowmass, [email protected] www.climatemitigation.com Colorado, 81654, USA 970-927-9511 3
the plant’s seawater intake pumps) is roughly $1.6 million, whereas the value of reducing the motor size to 1,838 HP and saving 1.7 million kWh per year is roughly $195,000 annually, or a 3.6 year simple payback on its proposed $0.7 million expense for the motor upgrade.6 Lacking the engineering data to assess the adequacy of Poseidon’s motor efficiency, or to modify it with higher motor efficiencies (in all applicable motors, not merely the two motors highlighted in Poseidon’s plan), CMS adopts Poseidon’s estimate of baseline emissions, and the modest efficiency improvement in the “high-efficiency” scenario. CMS also adopts Poseidon’s consumption and savings calculations for the pressure exchanger energy recovery system replacing the typical Pelton Wheel. CMS is not convinced that Poseidon has aggressively pursued all technical and operational efficiency opportunities available to save operating costs, electricity, and emissions, and has not demonstrated that its design “incorporates state-of-the-art features minimizing plant energy consumption.”7
Poseidon does not propose to upgrade to high-efficiency motors for any but its two largest motors; dozens of other smaller and medium motors are unexamined for electricity and emission savings. Which, to CMS, fails the purposes of an emission reduction plan. The entire mitigation plan must be far more transparent and complete for the Coastal Commission to make a reasoned decision on the plan’s adequacy. Poseidon’s estimated savings from baseline: 10,045 tonnes CO2/yr. CMS calculated savings from proposed HP reduction of 4,242 HP (3.163 MW), assumes continuous operation, uses the SDGE emission factor of 780.79 lb CO2/MWh, which yields a reduction of 9,814 tonnes CO2/yr.
Green building design CMS calculates that the Carlsbad plant will use 5 million kWh for lighting, HVAC, controls and automation, air compressors, and other miscellaneous power uses in its two service facilities (the desalination plant and its pretreatment area. These two facilities total ~87,000 square feet of floor area, emit a total of 1,758 tonnes CO2, and thus have an aggregate electric intensity of 57 kWh/sf-yr and emits 45 lb CO2/sf-yr.8 Poseidon has indicated that the company will design the facilities in line with LEED design standards to maximize energy and water efficiency, use green building materials, and improve indoor air quality. Poseidon is non-committal, stating that “If use of green building design features result in 6 % of energy savings, the total annual power use reduction is … 298 MWh/yr.” Poseidon suggests that green design can realize between 6 and 10 percent power savings, worth 105 to 176 tonnes CO2 at the emissions meter, which CMS averages to 141 tonnes CO2.. Although plant engineering designs are not available, and the emissions mitigation plan gives scant data on energy use within each of the two facilities, the resulting electric intensity provides some clue. For example, CMS calculates from Poseidon data 6 CMS estimates that a 2,100 HP motor emits 4,858 tonnes CO2/yr and costs ~$1.56 million in electricity cost (SDGE had an industrial sector cost of $0.114/kWh in 2003; CMS does not have information on the electricity tariff or demand charges Poseidon may have negotiated with SDGE; Poseidon may also increase water production at night to reduce electricity demand (and, presumably, tariffs) during peak hours. See CCC (2008) W4a, page 107. Neither Poseidon nor CMS has quantified how such a demand shift may affect time-of-use emission factors. 7 Poseidon (2008) Plan, p. 7. 8 Poseidon EIR “Project description” page 3-20: “The desalination facility will consist of an enclosed building approximately 44,552 square feet in size that would house the reverse osmosis process area, water treatment chemicals storage and pumps, product water pumps, administrative offices and other appurtenant facilities to support the plant. The building would be located on the eastern portion of the approximately 4-acre desalination project site. To the west of the building would be a 42,632 square foot pretreatment area.” CMS uses these data to calculate electric and emissions intensity (57 kWh/sf-yr, and 45 lb CO2/sf-yr for combined facilities, 112 kWh/sf-yr, and 87 lb CO2/sf-yr if all electricity consumption is averaged over the desal facility only).
Carlsbad Seawater Desalination Project
Richard Heede Climate Mitigation Services 1626 Gateway Road, Snowmass, [email protected] www.climatemitigation.com Colorado, 81654, USA 970-927-9511 4
that electricity used for lighting averages 9 kWh/sf-yr and 19 kWh/sf-yr for HVAC. CMS simply does not have access to enough data to analyze this electric intensity, or the energy demands in either facility, but CMS considers it likely that Poseidon can, with aggressive whole-systems design, capture far greater efficiencies than the company’s six to ten percent savings. CMS, for the sake of raising the bar in line with the efficiency gains in good LEED-certified buildings, suggests that a target of 20 to 40 percent savings are achievable, which CMS averages to 30 percent savings worth $170,000 per year in lower electricity cost and 527 tonnes CO2 of avoided emissions.9
On-site solar (PV) generation Poseidon has indicated that it will install photovoltaic panels on 50,000 sf of roof area if the economics are favorable. Poseidon’s Appendix H to the mitigation plan was not available, and CMS cannot evaluate the details of its proposal. However, CMS calculations suggest that Poseidon’s estimate of solar generation of ~777 MWh per year is reasonable. CMS estimates the amount of power generated at 757 MWh, and avoided emissions totaling 268 tonnes CO2.10 On-site solar generation is not a good indicator of an applicant’s “green credentials” unless the facility is designed to aggressively realize internal load reductions first. While the direct cost is high — ~$3.5 million at $7,000/kW(AC) for the proposed 500 kW system11 — the cost of foregoing other more cost-effective energy-saving and emissions-reducing initiatives are higher. SDGE or the State of California offer rebates that lower the cost faced by Poseidon, but such incentives may only obscure opportunities to cut demand and lower emissions more effectively.
Use of sequestered CO2 for water treatment Poseidon states that it will use 2,080 long tons (2,076 tonnes) of carbon dioxide for post-treatment that will remain sequestered in its product water, and that it intends to procure CO2 from certified CO2 recovery sources. John Rosenblum’s analysis indicates that half the gas will re-gasify. CMS adopts this assessment, and further adds Mr. Rosenblum’s estimated energy and emissions from compressing the CO2 for transport to the Carlsbad facility; transportation energy and emissions are not calculated, however, although CMS generically estimates emissions from annual operations, including transportation of treatment chemicals, trucking waste solids, and so forth. See table 13 in the attached worksheets. Poseidon estimates sequestration of 2,076 tonnes CO2, whereas CMS estimates sequestration of 800 tonnes CO2, minus 150 tonnes for CO2 compression, for a net sequestration of 650 tonnes CO2.
Reducing energy needs for water reclamation Poseidon argues that by providing low-salinity water to the Carlsbad Municipal Water District’s consumers, Poseidon’s operations will reduce the need and energy requirements for CMWD to micro-filter and use reverse osmosis treatment at its water plant, saving 1.95 GWh per year worth 691 tonnes CO2. CMS has not independently verified this result. Nonetheless, CMS adopts 9 See Tables 3b and 6 in the attached worksheets for details. 10 Since Poseidon provides scant data, CMS calculates from the ground up: 50,000 sf of panels, 500 kW at 100 sf/kW, 5 hrs per day (1,825 hrs/yr), 17 percent conversion loss, equals 757 MWh/yr. The emissions associated with manufacturing, transporting, and installing the system has not been included. 11 Estimated installed system cost before financial incentives or buy-down, at $7,000 per kW (AC, measured after the meter). Paul Gipe, (2007) Solar PV Current Installed Prices per kW in California & Elsewhere, www.wind-works.org/Solar/SolarPVCurrentInstalledPricesperkWinCaliforniaElsewhere.html
Carlsbad Seawater Desalination Project
Richard Heede Climate Mitigation Services 1626 Gateway Road, Snowmass, [email protected] www.climatemitigation.com Colorado, 81654, USA 970-927-9511 5
Poseidon’s estimate, even though, as Joe Geever of the Surfrider Foundation points out, it is “backwards” to award credits to Poseidon for replacing a much lower-intensity process with Poseidon’s own energy-intensive process. This matter warrants the Commission’s scrutiny.
Avoided emissions through displaced imported water In CMS’s view, the Poseidon desalination plant will produce new water and cannot therefore receive credit for reduced water imports and the avoided emissions thereof. Insofar as the CCC may be inclined to accept Poseidon’s position on the matter, CMS offers another perspective, namely that of a more complete calculation of the appropriate credit if the Coast Commission grants Poseidon’s contention.
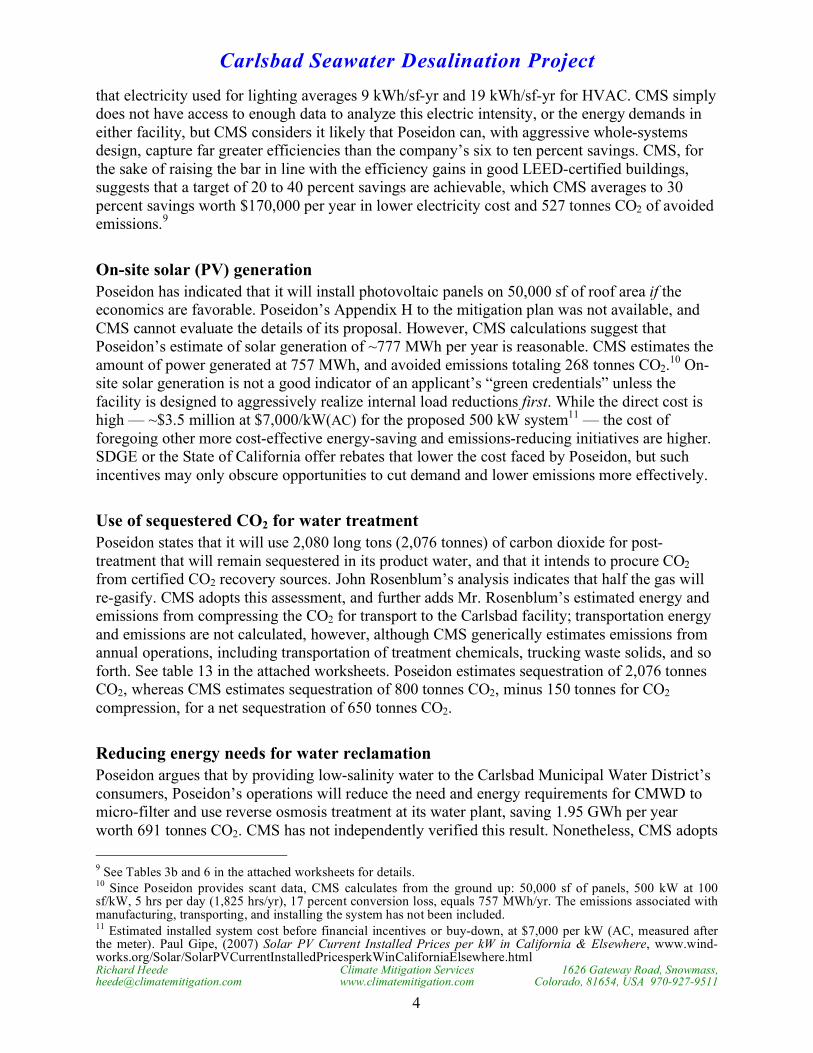
CMS completes the calculation of Poseidon’s rationale: the company argues that if the Desalination plant reduces imported water, then Poseidon should get credit for the emissions from not importing 56,000 acre-feet per year. Poseidon uses the State Water Project’s electric intensity of 3,416 kWh/AF and applies SDGE’s carbon intensity of 780 lb CO2/MWh. There are two problems with Poseidon’s calculation: (a) it assumes all displaced imported water is from SWP, and (b) it applies SDGE’s carbon factor. CMS suggests carrying this calculation to its logical conclusion: (a) account for Colorado River Aqueduct water (CRA), which accounts for 60 percent of the relevant water utility’s share of imported water,12 (b) account for both SWP’s and CRA’s electric intensities (3,416 and 1,916 kWh/AF, respectively), and (c) account for both SWP’s and CRA’s carbon intensities (700 and 305 lb CO2/MWh, respectively).13
Figure 1. Water via the Colorado River Aquifer (delete one)
Water from the Colorado River is delivered into MWD's service area via the Colorado River Aqueduct (CRA),
diverting water from Lake Havasu. www.mwdh2o.com/mwdh2o/pages/yourwater/supply/colorado/colorado04.html
Clearly, if Poseidon wants to claim credit for emissions reduced elsewhere — not an unreasonable argument per se — it must accurately estimate the quantity of those saved emissions. Poseidon has failed in this regard. Poseidon estimates emission reductions of 67,750 12 San Diego County Water Authority. See the utility’s annual report (2007) Fluid Thinking, Solid Results, 2006 Annual Report, www.sdcwa.org. See CMS calculations on imported water in the attached worksheet, Table 10b. 13 CMS has not been able to verify either the SWP’s or the CRA’s emission factor, and urges the CCC and/or the Department of Water Resources to investigate the issue. Considering the paucity of reliable estimates specific to SWP and CRA, CMS used the State of California’s average emission factor for SWP (from EPA eGRID data) and used Wilkinson (2000) data for CRA using 75 percent hydro and 25 percent market power. As a conservatism, CMS assumed that CRA’s market power originated from Arizona’s coal-intensive grid, which has a state average emission factor of 1,219 lb CO2/MWh (EPA eGRID, 2006), yielding an emission factor of 304.7 lb CO2/MWh. Note: Powers (2007a) uses a factor of 915 lb CO2/MWh for both CRA and SWP.

Carlsbad Seawater Desalination Project
Richard Heede Climate Mitigation Services 1626 Gateway Road, Snowmass, [email protected] www.climatemitigation.com Colorado, 81654, USA 970-927-9511 6
tonnes CO2, whereas CMS estimates emission reductions amounting 33,208 tonnes CO2 — if the Commission accepts Poseidon’s argument for being credited the displaced imported water.14
Wetlands carbon sequestration Poseidon claims credit for restoring 37 acres of marine wetlands on land currently the site of oil storage tanks after the area has been decommissioned and restored. Poseidon uses carbon uptake rates ranging from 0.033 to 0.343 kg C/m2-yr, which converts to 18 to 188 tonnes CO2 per year. Poseidon does not present any cost estimates for this carbon sequestration project, and, in fact, there is a possibility that the wetlands project is already required under an existing agreement, and might therefore constitute double-counting the credits. In view of the paucity of details, CMS adopts Poseidon’s estimates, which CMS averages to 103 tonnes CO2.
San Diego County reforestation carbon sequestration Poseidon proposes and commits to invest $1 million (at $200k per year) to re-plant areas affected by the San Diego fires in 2007. This replanting program is estimated by Poseidon to sequester 245 tonnes CO2 per year, based on planting 1,000 trees (with a survival rate of 90 percent) maintained and watered by residents, and an average annual carbon-fixing rate equivalent to 60 lb of CO2 per tree.15 CMS adopts Poseidon’s estimates.
Annual operations: trucking and crew commuting Poseidon does not estimate emissions from annual operations such as trucking materials, transporting thousands of tonnes of treatment chemicals, trucking of waste solids and residuals, or employee commuting and travel. As noted below, CMS uses Poseidon’s Environmental Impact Report and the trips per day estimated for the Traffic chapter as the basis of this very preliminary scoping calculation of annual transportation emissions. Lacking information of geographic sourcing of treatment chemicals, for example, CMS assumes a round-trip distance of 400 miles for chemicals (4 trips per day), 50 miles for equipment and parts (1 trip per day), 18 miles for waste solids disposal (1 trip per day), 18 miles for solids residual disposal (6 trips per day), and 10 miles for each of Poseidon’s estimated 108 employees. CMS uses standard fuel economy data from DOE/ORNL’s Transportation Energy Data Book.
The result: 121,900 gallons of combined diesel and gasoline, and 1,211 tonnes CO2, which CMS adds to the baseline emission estimate made by Poseidon and adopted by CMS. Poseidon makes no comparable estimate, citing de minimus.
Desalination facility and pipeline construction As the Coastal Commission points out, Poseidon does not estimate emissions from construction of the facility.16 CMS has endeavored to fill the void with an estimate of fuel and emissions from 14 See CMS calculations on avoided emissions from imported water in the attached worksheet, Table 10. The weighted average electric intensity, according to CMS, is 2,516 kWh/AF and the weighted emission factor is 520 lb CO2/MWh. Compare Poseidon’s values of 3,416 kWh/AF and 781 lb CO2/MWh. 15 Has not verified the CO2 sequestration rate, but cautions that 60 lb CO2 per year may be high, especially for young trees planted in San Diego’s dry climate. In any case, 9,000 trees times 60 lb CO2/tree-yr equals 245 tonnes CO2/yr. Poseidon has committed to a truing-up process, through which far lower carbon sequestration rates during the trees’ early growth period will be reflected, as well as monitoring of actual survival rates. 16 CCC (2008) Revised Findings, Staff Memorandum W4a, 17Jul08, page 104.
Carlsbad Seawater Desalination Project
Richard Heede Climate Mitigation Services 1626 Gateway Road, Snowmass, [email protected] www.climatemitigation.com Colorado, 81654, USA 970-927-9511 7
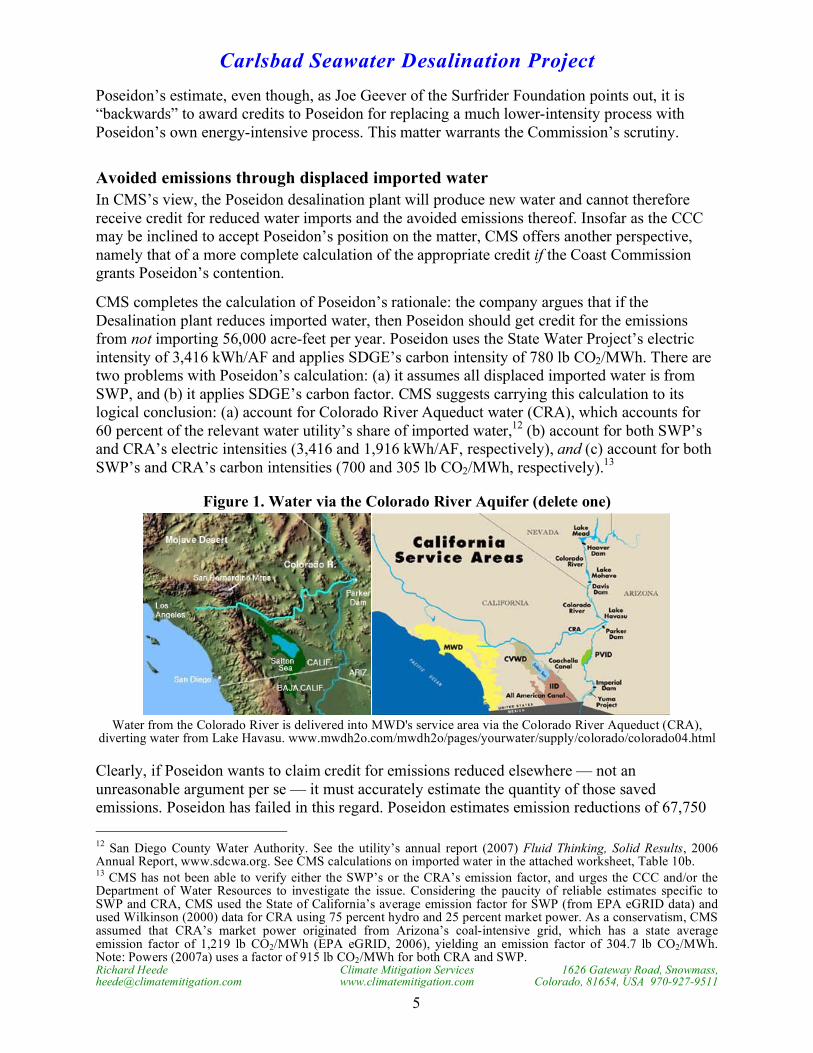
building construction, earth moving (at least 0.65 million cubic yards of material has to be excavated, moved, graded, and/or trucked and dumped for the building construction, oil tank demolition, and pipeline construction), road building, pipe-laying, wetlands restoration, site preparation, crew transportation, construction of facilities, pump stations, paving, and remediation. While Poseidon has supplied little relevant data on which to base an accurate account of fuel, electricity, and emissions, CMS has reviewed Poseidon’s Environmental Impact Report and its chapters on Air Quality and Traffic and Transportation.
CMS bases its preliminary emission estimate on total round-trips made for transportation, trucking, and crew commuting, as well as construction equipment operating hours for its dozens of graders, excavators, cranes, dump trucks, backhoes, welders, rollers, pavers, pumps, and related construction equipment. The EIR estimated total crew and equipment months on the job for each major construction phase. CMS reviewed typical fuel consumption for construction equipment by type and engine size, assumed 75 percent duty per day (120 hrs/month), and used an average of 8 gallons of diesel fuel per hour or operation.17 Finally, CMS used crew-months for each construction phase, assumed single-occupancy crew commuting to and from work in vehicles averaging 18.6 miles per gallon (which may be high for construction crew vehicles). CMS estimates trucking fuel use of 212,700 gallons and emissions totaling 2,160 tonnes CO2, construction equipment fuel use of 514,600 gallons and 5,224 tonnes CO2, and crew commuting fuel use of 14,000 gallons and 125 tonnes CO2, for a total of 7,509 tonnes CO2. Poseidon is in a position to make a far better informed and accurate estimate than this preliminary best-guess. CMS odes not add construction emissions for the baseline.
Figure 2. Carlsbad Seawater Desalination Project: Construction emissions
Summary Since CMS adopts Poseidon’s baseline estimate — even with misgivings about high building energy use and unreasonably low motor efficiency ratings, as noted above — the principal differences between the estimates arise from: 17 Equipment horsepower, average duty cycle per day, idling time, and partial loads all vary. CMS used Table 2.5, p. 28 from: Gransberg, Douglas, Calin M. Popescu, & Richard Ryan (2006) Construction Equipment Management for Engineers, Estimators, and Owners, CRC, 568 pp. for Average Fuel Consumption Factors (gallons/hr/HP), typically ranging from “favorable” trucks on-hwy 0.014-0.029 gal/hr/HP, wheel loader 0.020-0.024 gal/hr/HP, twin engine scraper 0.026-0.027 gal/hr/HP. CMS adopts an average value of 8 gallons per operating hour, and assumes 120 hrs per month per piece of construction equipment. A large excavator, for example, may use 20 gallons per hour, a backhoe ~4 gal/hr. Clearly not a preferred estimation procedure, but reasonable in lieu of useful data from Poseidon.

Carlsbad Seawater Desalination Project
Richard Heede Climate Mitigation Services 1626 Gateway Road, Snowmass, [email protected] www.climatemitigation.com Colorado, 81654, USA 970-927-9511 8
• CMS’ suggestion that Poseidon should be able to design a facility with non-motor energy performance exceeding the company’s paltry 6 to 10 percent improvement goal (CMS suggests that a 30 percent improvement over conventional design is an achievable target);
• Poseidon considers the CO2 used in post-treatment is 100 percent sequestered, whereas CMS, using John Rosenblum’s more reasonable analysis, estimates a net sequestration rate two-thirds lower than Poseidon’s;
• CMS disputes Poseidon’s simple and erroneous assumption regarding avoided emissions from “displaced imported water.” CMS accounts for the origin of imported water, uses the varying electric intensities of conveying water from each system, accounts for the differing emission factors from each water source “displaced.” Poseidon uses SWP’s electric intensity, ignores CRA water imports, and applies SDGE’s emission factor of 780 lb CO2/MWh — as if the local emission factor should be used to estimate emissions avoided elsewhere;
• CMS estimates and adds to the baseline emissions from annual transportation. Poseidon ignores such annual operation emissions.
Poseidon estimates that 15,830 tonnes of CO2 offsets are needed for net zero emissions. CMS calculates that 52,860 tonnes of CO2 offsets are needed to achieve climate neutrality.
Table 1. Comparing Poseidon and CMS estimates of baseline emissions and reductions
Poseidon CMS Segment tonnes CO2 tonnes CO2
Baseline emissions 97,156 97,156 “High-efficiency” design: motors & Px -10,045 -9,814 Efficient plant design -141 -527 On-site solar electricity -275 -268 Sequestered CO2 for water treatment -2,076 -650 Reduced need for water reclamation -691 -691 Avoided emissions: imported water -67,750 -33,208 Wetlands sequestration -103 -103 Sequestration: San Diego reforestation -245 -245 Operations: trucking, waste disposal, & commuting ne 1,211 Indicated offsets needed for net zero emissions 15,830 52,860
CMS averaged some of Poseidon’s estimated ranges, corrected minor errors (long tons to metric tonnes), and specified estimates that were rounded up. See attached worksheets for details. “ne:” not estimated.
Figure 3. The Poseidon baseline, saving, and offset estimate

Carlsbad Seawater Desalination Project
Richard Heede Climate Mitigation Services 1626 Gateway Road, Snowmass, [email protected] www.climatemitigation.com Colorado, 81654, USA 970-927-9511 9
Figure 4. The CMS baseline, saving, and offset estimate
Figure 5. The Poseidon and CMS estimates compared
Figure 6. Details of the Poseidon and CMS estimates
Discussion All sectors of San Diego County’s water-consuming sectors have made strides in reducing water consumption, as demonstrated by successful programs run by many regional water utilities over the years. Yet, significant potential to save water at far lower cost and emissions than building a

Carlsbad Seawater Desalination Project
Richard Heede Climate Mitigation Services 1626 Gateway Road, Snowmass, [email protected] www.climatemitigation.com Colorado, 81654, USA 970-927-9511 10
$300 million facility remain untapped — and in the interest of economic priorities be captured before the Carlsbad Desalination Project is approved. A gallon not used has a much lower carbon footprint than expensive desalinated seawater.
Poseidon stresses the economic value of new and secure local sources of water, and the value of new jobs. Saving water — and electricity, for that matter — creates more jobs than supplying new resources, at far lower environmental impact and cost to the community. Further, boosting supplies of reclaimed water is also cheaper, as demonstrated in many progressive communities throughout California.18
Governor Schwarzenegger contends, speaking of seawater desalination, that “We need it. It’s not a choice.”19 On the contrary, our future is a choice, not fate, and the rationale for defeating this project is clear. California is leading an impressive initiative to achieve dramatic reductions in emissions of greenhouse gases. Approving this high-intensity, costly, and large new source of emissions in San Diego County runs counter to the state’s and the community’s interests.
Conclusion Poseidon’s Energy Minimization and Greenhouse Gas Reduction Plan is flawed, poorly detailed, erroneously argued, and inadequate to the task of informing the community and state decision-makers about true emissions and real opportunities to reduce costs and emissions. The Coastal Commission should not approve Poseidon’s application insofar as important conditions of the preliminary approval remain unanswered.
Respectfully,
Richard Heede Richard Heede Principal, Climate Mitigation Services
18 Powers (2007a) uses an electric intensity of 400 kWh/AF for non-potable reclaimed water and 2,246 kWh/AF for potable reclaimed water, — both significant savings from Poseidon’s 4,898 kWh/AF baseline and 4,397 kWh/AF in the “high-efficiency” scenario. 19 San Diego Union Tribune, 27Jul06, www.carlsbad-desal.com/

Carlsbad Seawater Desalination Project
Richard Heede Climate Mitigation Services 1626 Gateway Road, Snowmass, [email protected] www.climatemitigation.com Colorado, 81654, USA 970-927-9511 11
References
Brown, Richard E., & Jonathan G. Koomey (2002) Electricity Use in California: Past Trends and Present Usage Patterns, Lawrence Berkeley National Laboratory, MAy02, http://enduse.lbl.gov/info/LBNL-47992.pdf
California Coastal Commission (2008) Recommended Revised Findings: Coastal Development Permit Application, Poseidon Resources (Channelside) LLC, Staff memorandum W4a, 25Jul08. 133 pp.
California Energy Commission (2005) Integrated Energy Policy Report, Nov05. California Energy Commission (2006) Inventory of California Greenhouse Gas Emissions and Sinks,
1990-2004. Center for Clean Air Policy (2006) Cost Effective GHG Mitigation Measures for California Summary
Report: An Independent Analysis of Measures to Reduce Greenhouse Gas Emissions in 2010 and 2020 to Meet Executive Order S-3-05, Jan06, 15 pp
Davis, Stacy C., & Susan Diegel (2004) Transportation Energy Data Book 2004, Oak Ridge National Laboratory, Oak Ridge, TN, www-cta.ornl.gov/data/Index.html
E SOURCE (1999) State of the Art: Drivepower, E SOURCE, Boulder, Colorado, www.esource.com Gransberg, Douglas, Calin M. Popescu, & Richard Ryan (2006) Construction Equipment Management
for Engineers, Estimators, and Owners, CRC, 568 pp. Hayhoe, Katherine et al (2004) “Emissions Scenarios, Climate Change, and Impacts on California,”
Proceedings of the National Academy of Sciences, vol. 101(34):12422-12427. Heede, Richard (2008) Venoco Paredon Oil & Gas Project, Carpinteria, California: Greenhouse Gas
Emissions, commissioned by Environmental Defense Center Santa Barbara, 14 pp. plus worksheets. Heede, Richard (2006) LNG Supply Chain Greenhouse Gas Emissions for the Cabrillo Deepwater Port:
Natural Gas from Australia to California, commissioned by California Coastal Protection Network & Environmental Defense Center (Santa Barbara), May06, 28 pp., plus spreadsheets and notes.
Pacific Institute (2004) User Manual for the Pacific Institute Water to Air Models, Prepared by Gary Wolff, Sanjay Gaur, & Maggie Winslow, Oct04. [email protected], 510-251-1600x102
Pacific Institute (2004) Energy Down The Drain: The Hidden Costs of California's Water Supply, Ronnie Cohen, Gary Wolff, and Barry Nelson, Pacific Institute and NRDC, Aug04.
Poseidon (2005) Environmental Impact Report, Appendix D: Air Quality Assessment for the Carlsbad Seawater Desalination Plant, Prepared by: Scientific Resources Associates, San Diego, CA 92109 Apr05, 49 pp.
Powers, Bill (2007a) Assessment of Energy Intensity and CO2 Emissions Associated with Water Supply Options for San Diego County, prepared for Surfrider Foundation, 12Oct07, 5 pp.
Powers, Bill (2007b) San Diego Smart Energy 2020: The 21st Century Alternative, E Tech International, Santa Fe, NM.
San Diego County Water Authority (2007) Fluid Thinking, Solid Results, 2006 Annual Report, www.sdcwa.org
San Diego Gas & Electric (2008) 2006 Annual Entity Emissions, filed with California Climate Action Registry. www.climateregistry.org, 4 pp.
State of California (2003) Energy Action Plan, 9 pp. Union of Concerned Scientists (2005) Climate Change in California: Choosing Our Future, 8 pp.
Solutions for the Golden State, 4 pp. www.climatechoices.org.

Carlsbad Seawater Desalination Project
Richard Heede Climate Mitigation Services 1626 Gateway Road, Snowmass, [email protected] www.climatemitigation.com Colorado, 81654, USA 970-927-9511 12
U.S. DOE (2007) Transportation Energy Data Book, edition 26, Davis & Diegel, Oak Ridge National Laboratory, www-cta.ornl.gov/data/Index.html
U.S. DOE (2004) Off-Highway Transportation-Related Fuel Use, Apr04, Stacy C. Davis & Lorena F. Truett, ORNL/TM-2004/93, 39 pp, www.ornl.gov/~webworks/cppr/y2001/rpt/120222.pdf
U.S Environmental Protection Agency (2007) Cleaner Diesels: Low Cost Ways to Reduce Emissions from Construction Equipment, ICF International, www.epa.gov/ispd/pdf/emission_0307.pdf
Wilkinson, Robert (2000) Methodology for Analysis of The Energy Intensity of California's Water Systems, and an Assessment of Multiple Potential Benefits Through Integrated Water-Energy Efficiency Measures, Supported by: Lawrence Berkeley Laboratory, California Institute for Energy Efficiency, www.es.ucsb.edu/faculty/wilkinson.pdfs/Wilkinson_EWRPT01%20DOC.pdf