Embed Size (px)
Citation preview

Carnegie Mellon
1
Malloc Lab Debugging
18-213: Introduction to Computer SystemsApril 6, 2015
Courtesy:Previous two years’ slides.

Carnegie Mellon
2
News Malloc Lab due Friday, April 10th Not many people have been submitted yet…… If you have not started please do start. If you are stuck somewhere, please spend more time on
the problem before you come for office hours. You need to have a basic idea about the problem you are
facing, with limited time in office hours it is really difficult to debug an error from scratch.

Carnegie Mellon
3
Errors Some errors are identified by the driver
The error message is straightforward in most cases “garbled byte” means part of the allocated payload returned to the
user has been overwritten by your allocator, that is you have allocated an already allocated block.
Carnegie Mellon
4
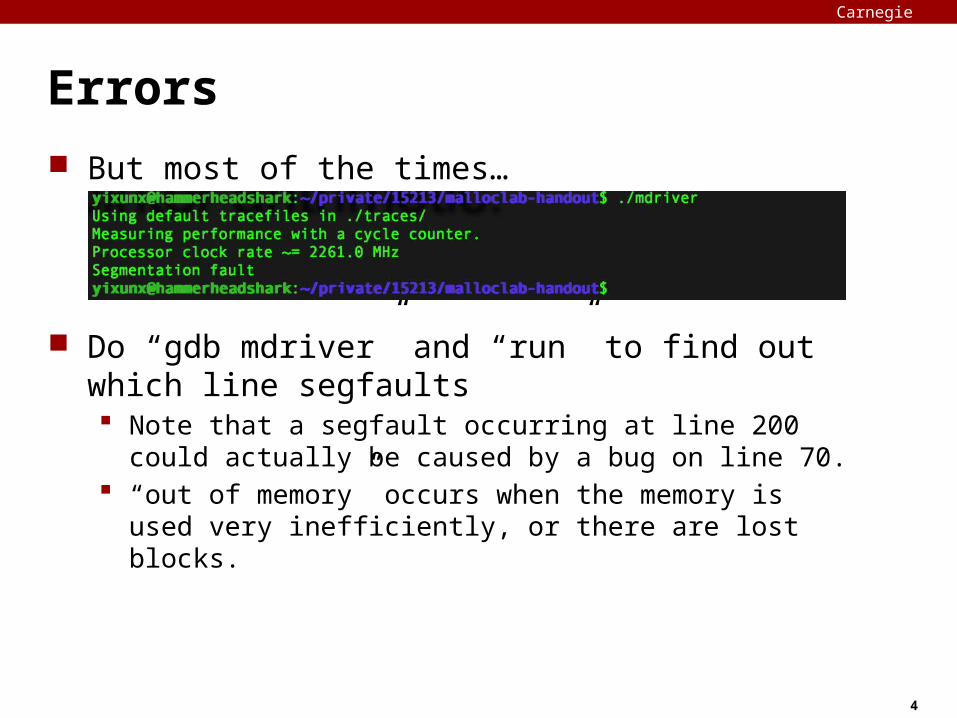
Errors But most of the times…
Do “gdb mdriver” and “run” to find out which line segfaults Note that a segfault occurring at line 200 could actually be caused
by a bug on line 70. “out of memory” occurs when the memory is used very
inefficiently, or there are lost blocks.

Carnegie Mellon
5
Segfault To resolve a segfault, it is necessary to identify the initial
instructions that might have deviated from the intended behaviour.
One way to do this is to print the whole heap before/after relevant functions Scroll up from the point of segfault and find the earliest operation
that makes the heap look corrupted. Sometimes this gives too much information, not all of which are
useful. The heap checker can make this easier
Checks violation of invariants (corruption of the heap)

Carnegie Mellon
6
Heap Checker Once you’ve settled on a design, write the heap checker
that checks all the invariants of the particular design The checking should be detailed enough that the heap
check passes if and only if the heap is truly well-formed Call the heap checker before/after the major operations
whenever the heap should be well-formed Define macros to enable/disable it conveniently
e.g.

Carnegie Mellon
7
Heap Checker, cont
FOR THE LOVE OF ALL THAT IS HOLY AND SACRED, WRITE A
GOOD HEAP CHECKER

Carnegie Mellon
8
Invariants (non-exhaustive) Block level:
Header and footer match Payload area is aligned
List level: Next/prev pointers in consecutive free blocks are consistent Free list contains no allocated blocks All free blocks are in the free list No contiguous free blocks in memory (unless you defer coalescing) No cycles in the list (unless you use circular lists) Segregated list contains only blocks that belong to the size class
Heap level: Prologue/Epilogue blocks are at specific locations (e.g. heap boundaries)
and have special size/alloc fields All blocks stay in between the heap boundaries
And your own invariants (e.g. address order)

Carnegie Mellon
9
Hare and Tortoise Algorithm Detects cycles in linked lists Set two pointers “hare” and “tortoise” to the beginning of
the list During each iteration, move the hare pointer forward two
nodes and move the tortoise forward one node. If they are pointing to the same node after this, the list has a cycle.
If the tortoise reaches the end of the list, there are no cycles.
Carnegie Mellon
10
Other things to watch for Uninitialized pointers and/or memory Make sure mm_init() initializes everything
It is called by the driver between each iteration of every trace If something is overlooked, you might be able to pass every single
trace file, but the complete driver test will not give you full points. If you write a faulty heap checker, it may complain even if
your malloc code is correct, so make sure you write a stable and correct heap checker. (out of experience)

Carnegie Mellon
11
Useful Tools Valgrind
Illegal accesses, uninitialized values… GDB
watch, rwatch, awatch
Carnegie Mellon
12
Asking for help It can be hard for the TAs to debug your allocator, because this
is a more open-ended lab Before asking for help, ask yourself some questions:
What part of which trace file triggers the error? Around the point of the error, what sequence of events do you expect? What part of the sequence already happened?
If you can’t answer, it’s a good idea to gather more information… How can you measure which step worked OK? printf, breakpoints, watchpoints (only use watchpoints if you’re willing
to wait several years)…

Carnegie Mellon
13
Asking for help Bring to us a detailed story, not just a “plot summary”
“Allocations of size blah corrupt my heap after coalescing the previous block at this line number...” is detailed
“It segfaults” is not Most importantly: don’t hesitate to come to office hours if
you really need help

Carnegie Mellon
14
Beyond Debugging: Error prevention It is hard to write code that are completely correct the first
time, but certain practices can make your code less error-prone Plan what each function does before writing code
Draw pictures when linked list is involved Consider edge cases when the block is at start/end of list
Write pseudocode first Document your code as you write it

Carnegie Mellon
15
Beyond Debugging: Version control “I had 60 util points just 5 minutes ago!” Save the allocator after each major progress Most basic: copy files around using the cp command Alternatively: keep different versions in separate c files, and
use “ln –s mm-version-x.c mm.c” to start using a particular version
Or use git/svn/cvs… Make sure your repository is private if you use remote repos

Carnegie Mellon
16
Optimization To achieve better performance, sometimes you would want
to tweak certain parameters. Number of size classes, the separation of size classes, the amount
by which the heap is extended (CHUNKSIZE)… It is better to write modular and encapsulated code so that
changing the parameters only requires changing a few lines of code Use macros wisely

Carnegie Mellon
17
Optimization When you hit a bottleneck, find which part is limiting your
performance A profiler is good for this kind of job To use gprof:
Change the Makefile to add “-pg” to the compilation flag Run the driver. This will generate a file called gmon.out Run “gprof ./mdriver” to see the result Don’t forget to change the Makefile back

Carnegie Mellon
18
Final Words Start now, if not already Come to office hours early Write the heap checker well Be prepared to start over several times Before handing in, check:
Does the header comment contain a detailed description of your approach?
Is the indentation correct? Any line over 80 chars? (go to autolab to verify these)

Carnegie Mellon
19
Questions? Good luck!