Embed Size (px)
Citation preview

Carolyn Federoff, Executive Vice President, AFGE Council 222
AFGECouncil222.com
Spending and revenue graphics atwww.cbo.gov/ftpdocs/125xx/doc12577/budgetinfographic.htm
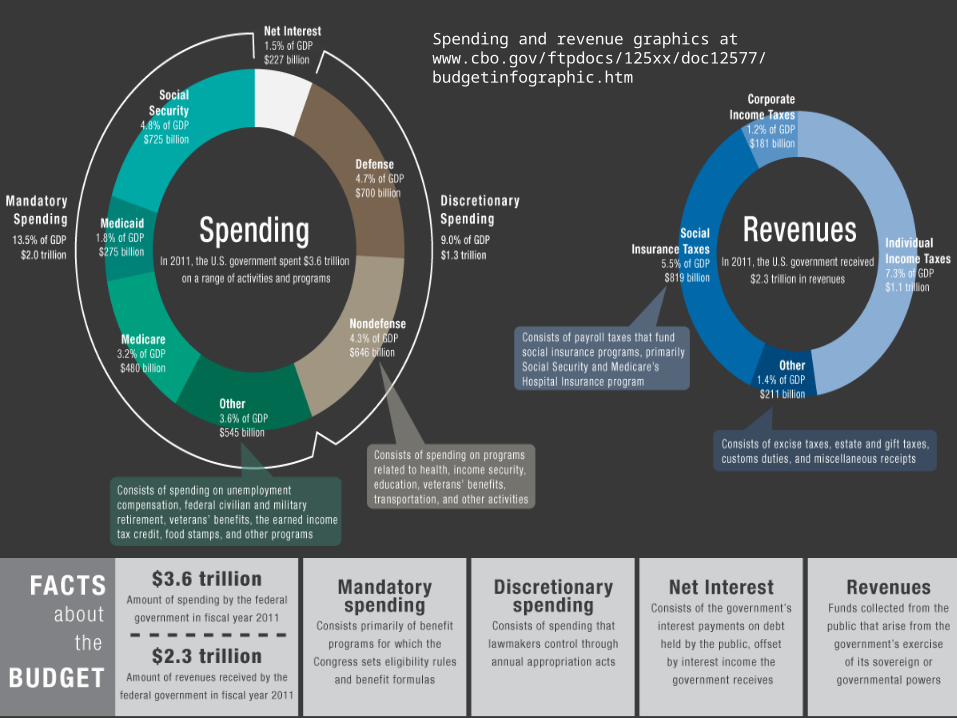
2011 FEDERAL BUDGET
$2.3 trillion $1.3 trillion
www.usa.gov/Agencies/Federal/Independent.shtml#
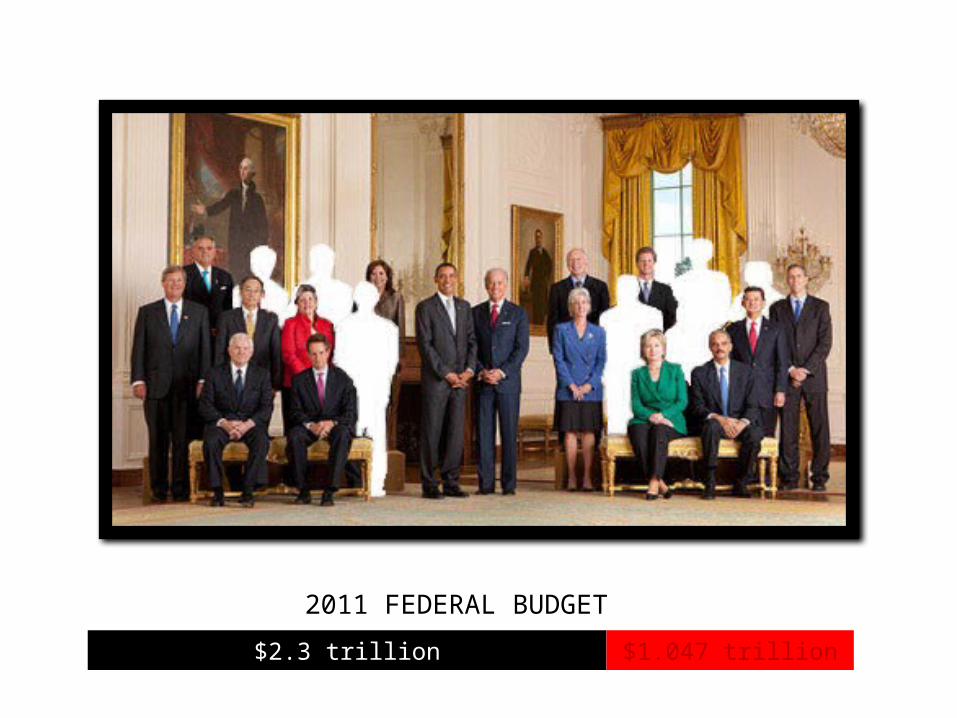
2011 FEDERAL BUDGET
$2.3 trillion $1.047 trillion
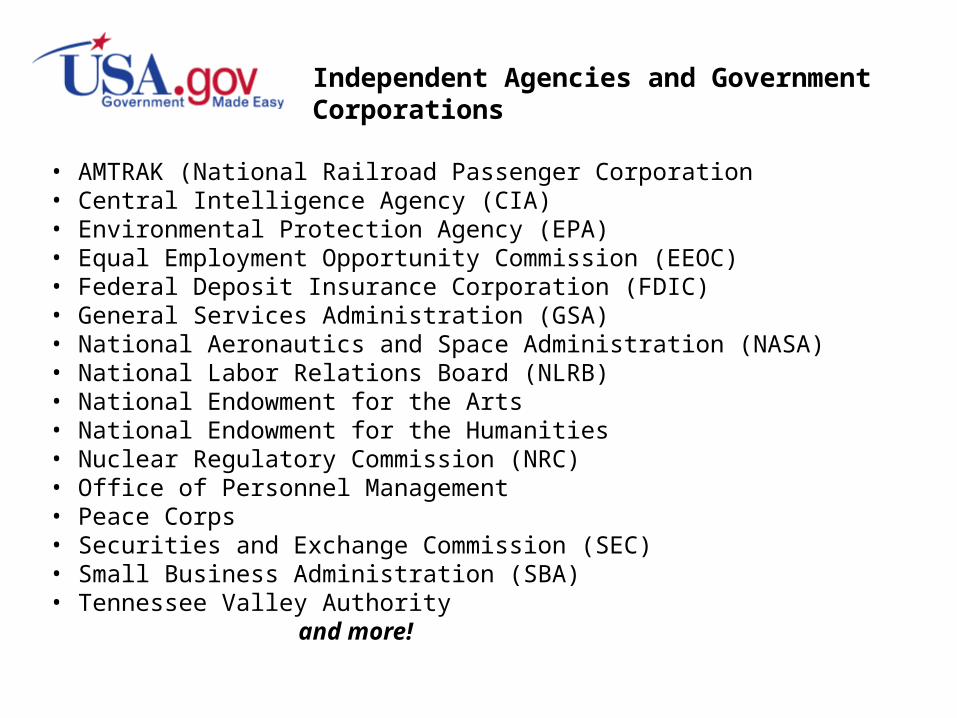
Independent Agencies and Government Corporations
• AMTRAK (National Railroad Passenger Corporation• Central Intelligence Agency (CIA)• Environmental Protection Agency (EPA)• Equal Employment Opportunity Commission (EEOC)• Federal Deposit Insurance Corporation (FDIC)• General Services Administration (GSA)• National Aeronautics and Space Administration (NASA)• National Labor Relations Board (NLRB)• National Endowment for the Arts• National Endowment for the Humanities• Nuclear Regulatory Commission (NRC)• Office of Personnel Management • Peace Corps• Securities and Exchange Commission (SEC)• Small Business Administration (SBA)• Tennessee Valley Authority and more!
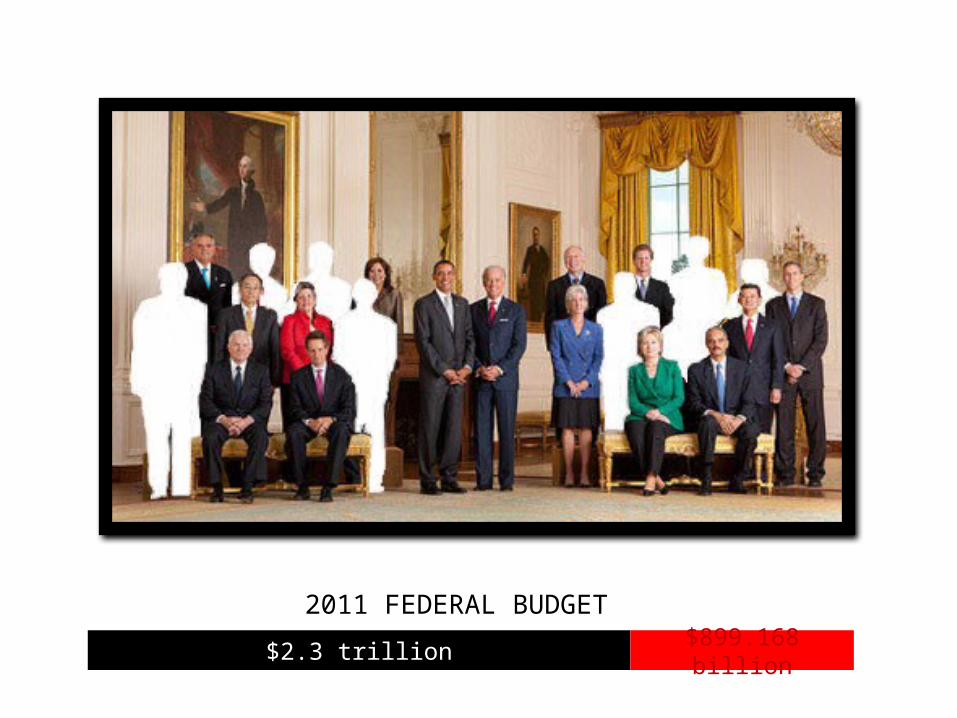
2011 FEDERAL BUDGET
$2.3 trillion $899.168 billion
2011 FEDERAL BUDGET
$2.3 trillion $822.65 billion
2011 FEDERAL BUDGET
$2.3 trillion $791.473 billion

2011 FEDERAL BUDGET
$2.3 trillion $738.786 billion
2011 FEDERAL BUDGET
$2.3 trillion $589.311 billion
2011 FEDERAL BUDGET
$2.3 trillion $576.932 billion
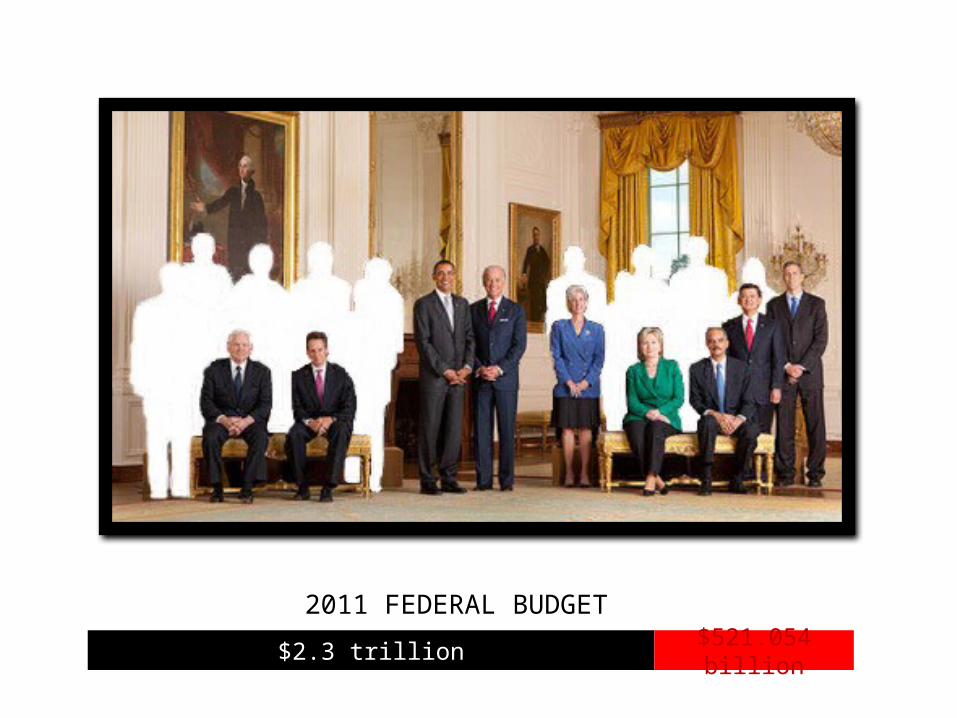
2011 FEDERAL BUDGET
$2.3 trillion $521.054 billion
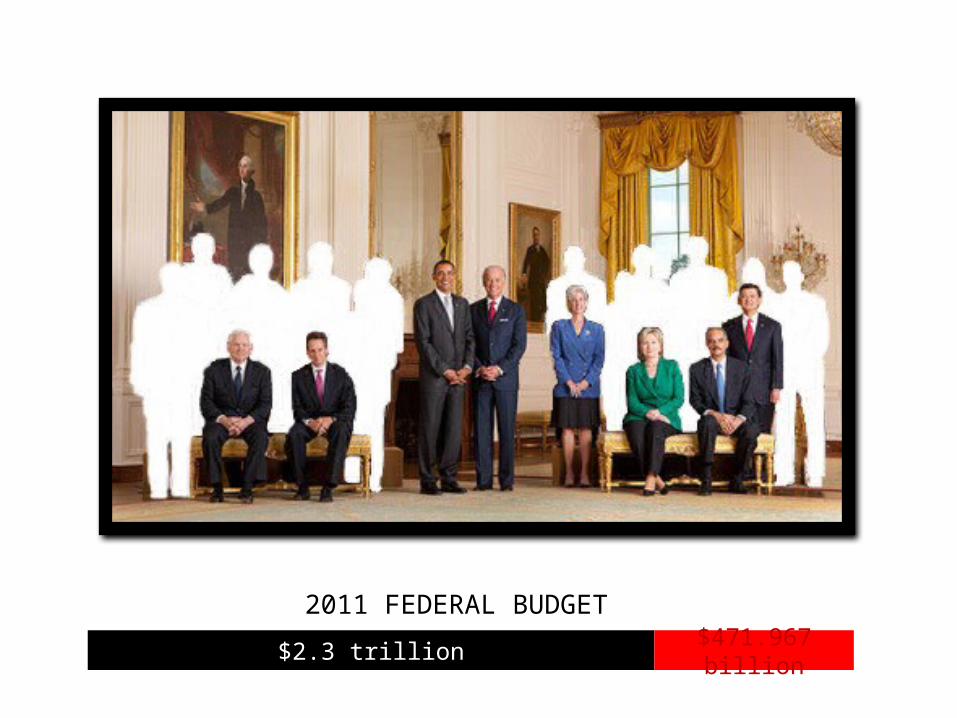
2011 FEDERAL BUDGET
$2.3 trillion $471.967 billion
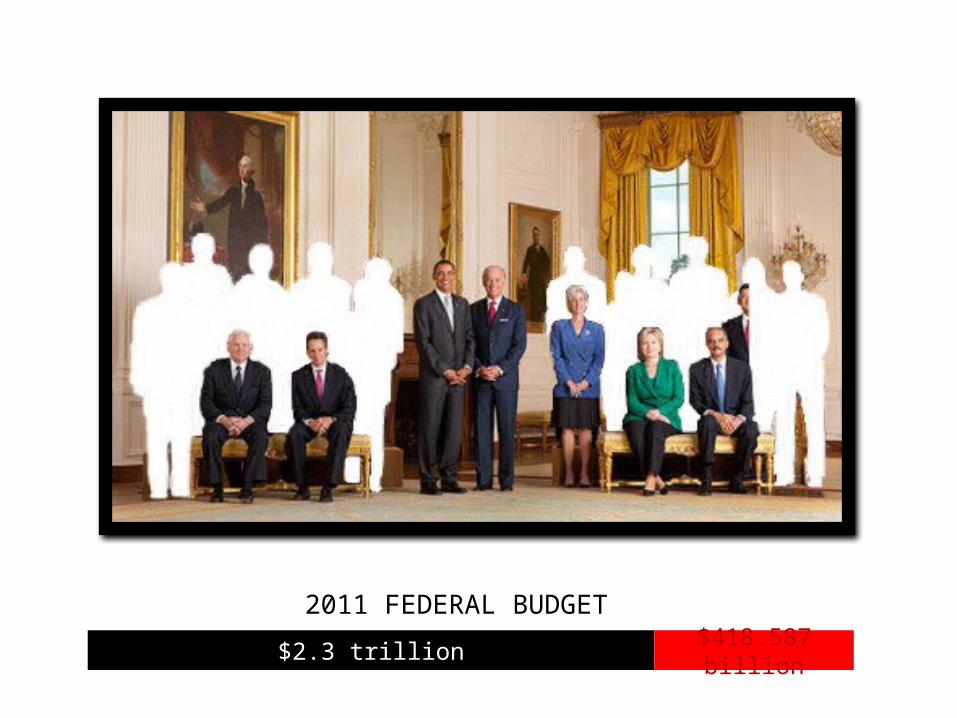
2011 FEDERAL BUDGET
$2.3 trillion $418.587 billion
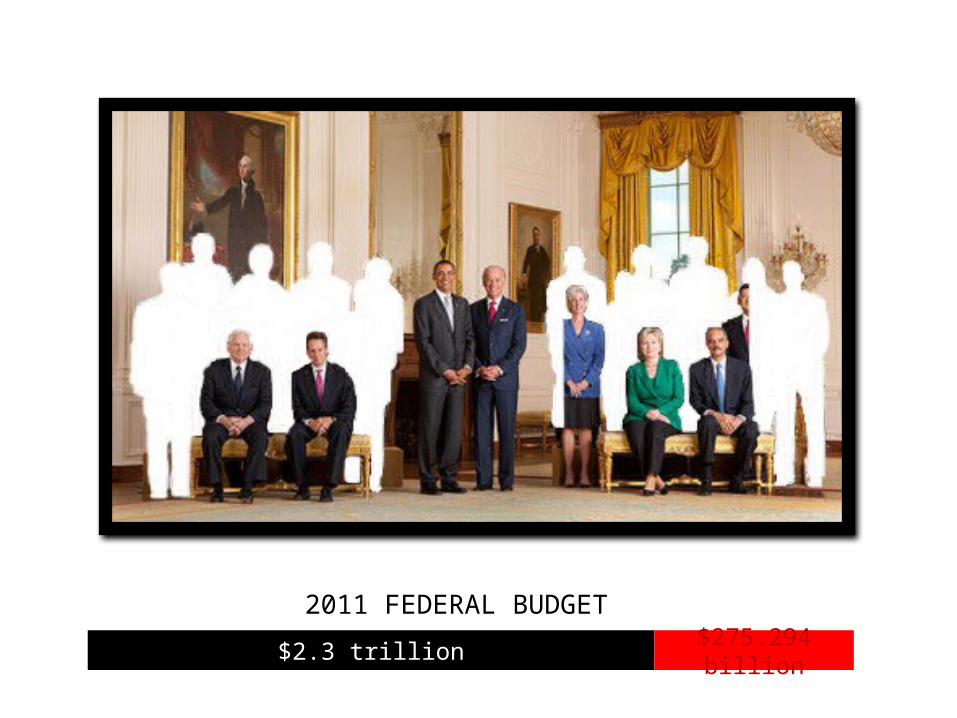
2011 FEDERAL BUDGET
$2.3 trillion $275.294 billion
2011 FEDERAL BUDGET
$2.3 trillion $245.606 billion

2011 FEDERAL BUDGET
$2.3 trillion $212.958 billion
2011 FEDERAL BUDGET
$2.3 trillion $200.086 billion
2011 FEDERAL BUDGET
$2.3 trillion $187.937 billion
2011 FEDERAL BUDGET
$2.3 trillion
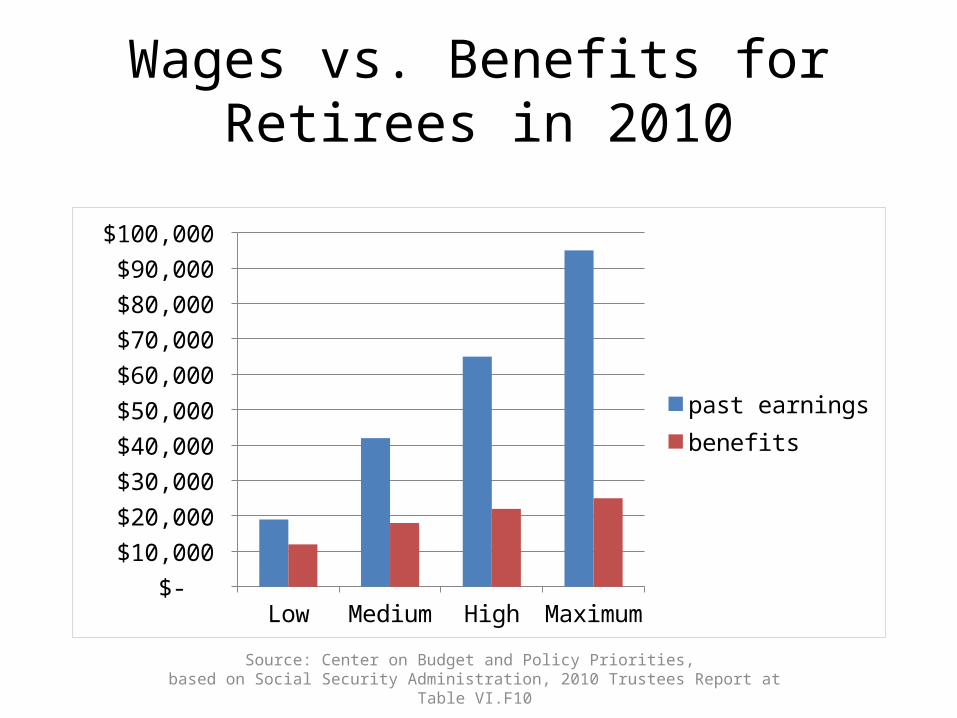
Wages vs. Benefits for Retirees in 2010
Low Medium High Maximum $-
$10,000
$20,000
$30,000
$40,000
$50,000
$60,000
$70,000
$80,000
$90,000
$100,000
past earningsbenefits
Source: Center on Budget and Policy Priorities, based on Social Security Administration, 2010 Trustees Report at Table VI.F10
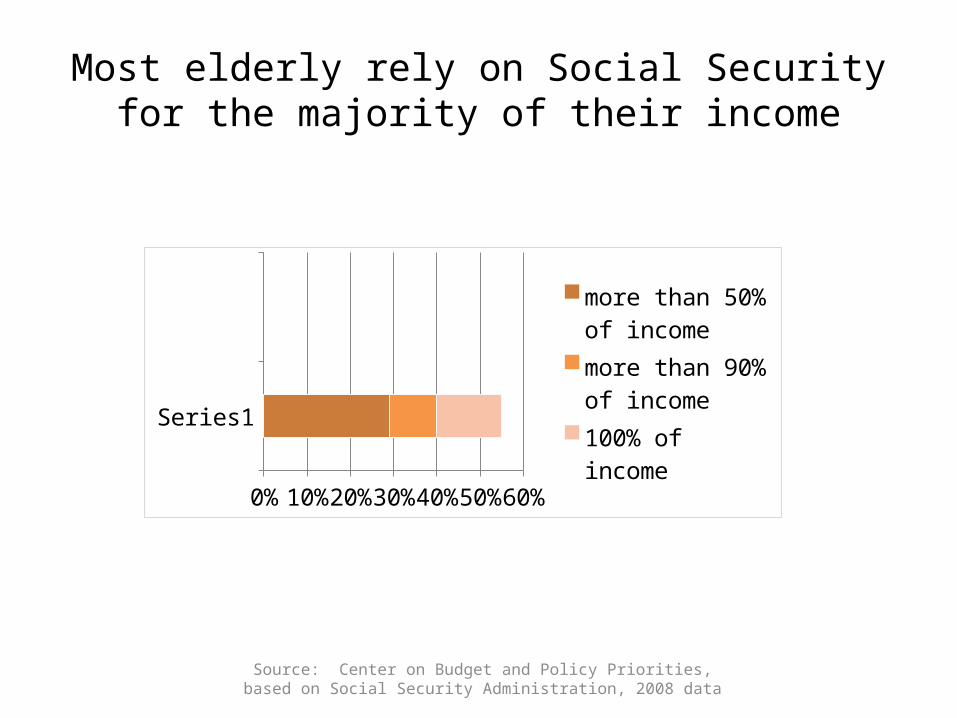
Most elderly rely on Social Security for the majority of their income
Series1
0% 10% 20% 30% 40% 50% 60%
more than 50% of incomemore than 90% of income100% of income
Source: Center on Budget and Policy Priorities,based on Social Security Administration, 2008 data

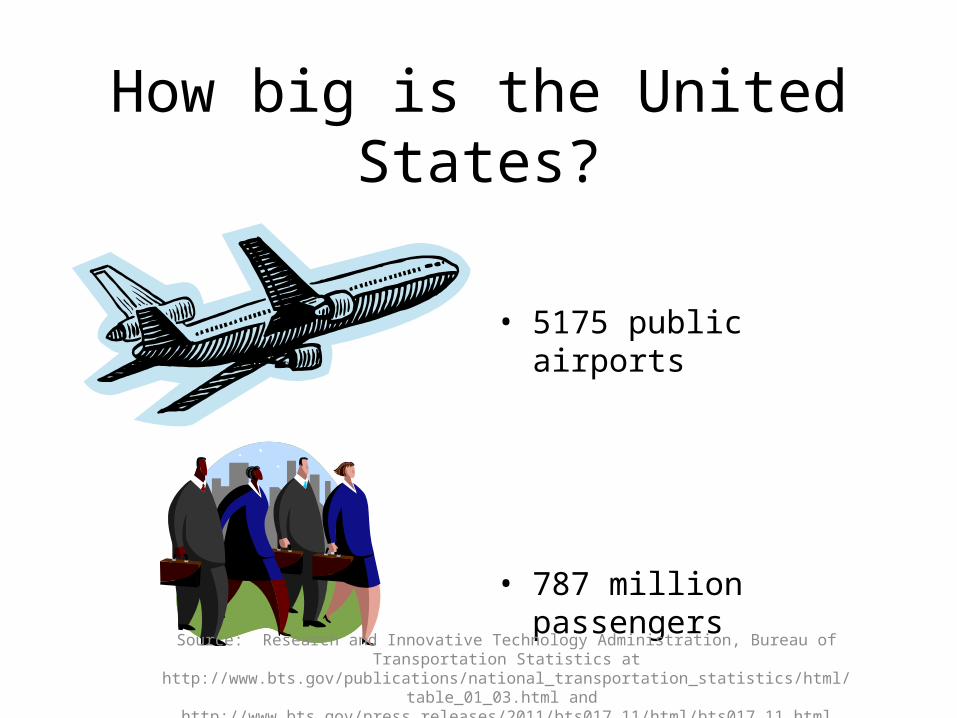
How big is the United States?
• 5175 public airports
• 787 million passengers
Source: Research and Innovative Technology Administration, Bureau of Transportation Statistics at http://www.bts.gov/publications/national_transportation_statistics/html/table_01_03.html and
http://www.bts.gov/press_releases/2011/bts017_11/html/bts017_11.html
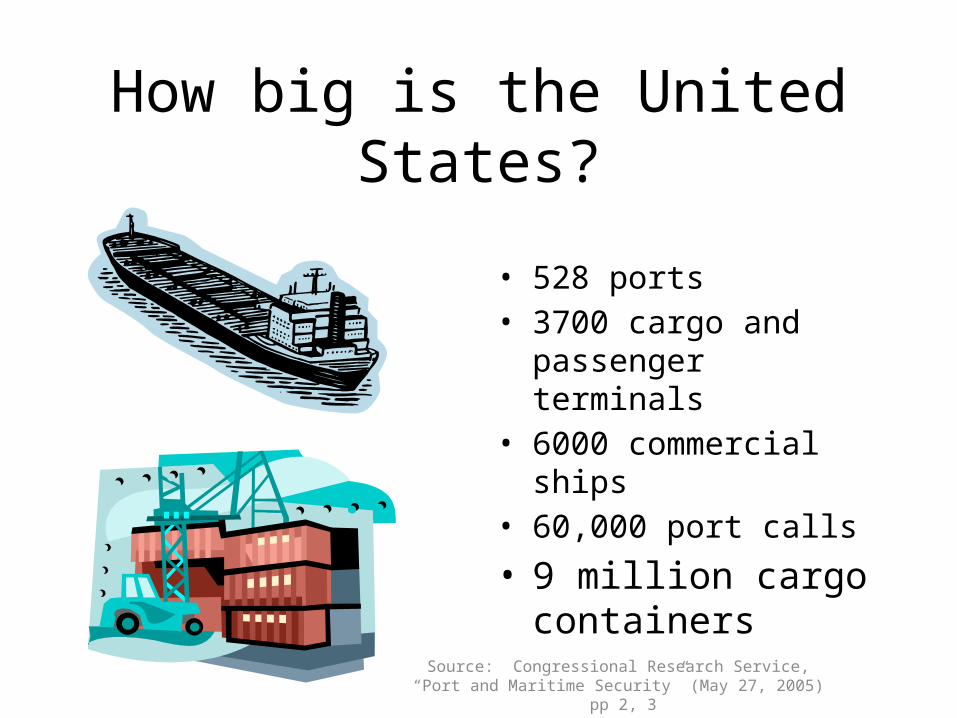
How big is the United States?
• 528 ports• 3700 cargo and passenger
terminals• 6000 commercial ships• 60,000 port calls
• 9 million cargo containers
Source: Congressional Research Service, “Port and Maritime Security” (May 27, 2005) pp 2, 3
How big is the United States?
• 13 million truck and rail cars crossing the Canadian and Mexican borders annually
Source: Congressional Research Service, “Port and Maritime Security” (May 27, 2005) p 3
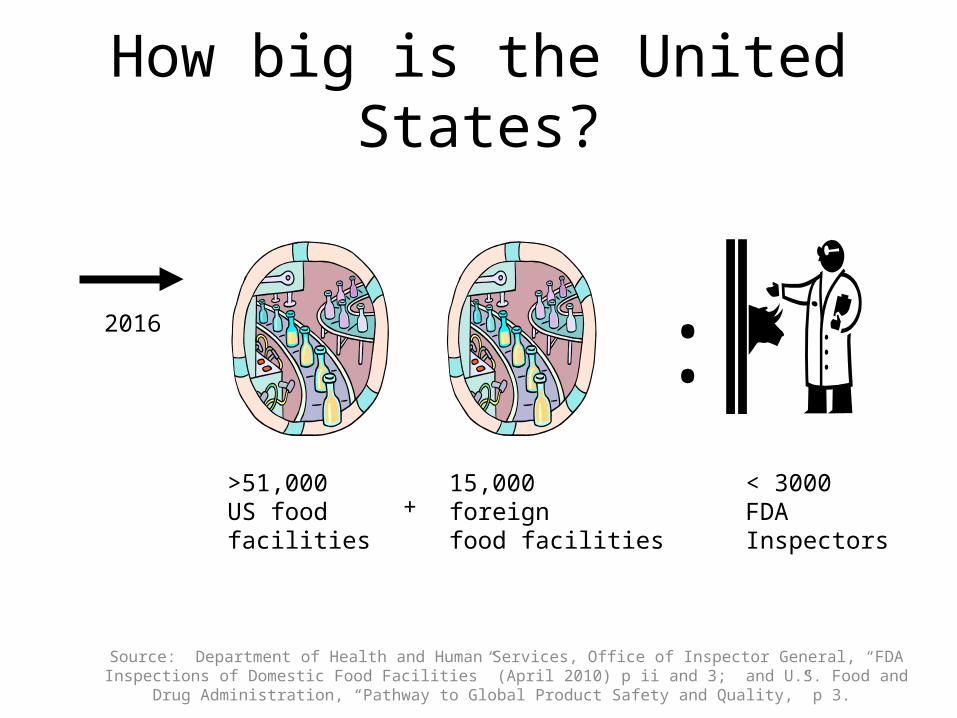
How big is the United States?
2016 :>51,000US foodfacilities
+15,000foreignfood facilities
< 3000FDAInspectors
Source: Department of Health and Human Services, Office of Inspector General, “FDA Inspections of Domestic Food Facilities” (April 2010) p ii and 3; and U.S. Food and Drug Administration, “Pathway to Global Product Safety and Quality,” p 3.
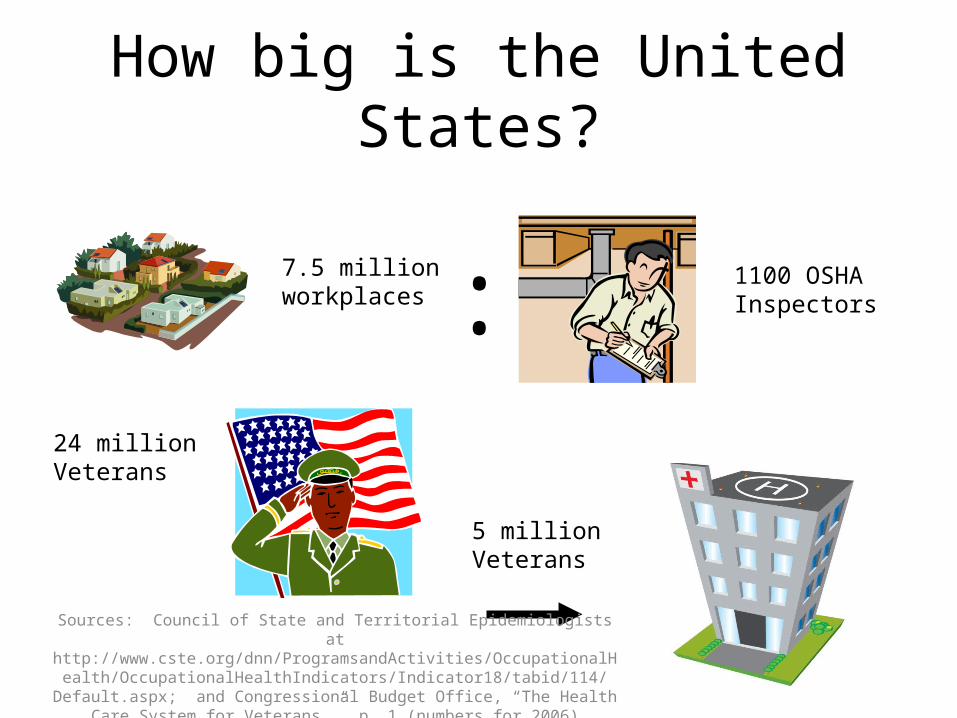
How big is the United States?
7.5 millionworkplaces : 1100 OSHA
Inspectors
5 millionVeterans
24 millionVeterans
Sources: Council of State and Territorial Epidemiologists at http://www.cste.org/dnn/ProgramsandActivities/OccupationalHealth/OccupationalHeal
thIndicators/Indicator18/tabid/114/Default.aspx; and Congressional Budget Office, “The Health Care System for Veterans,” p. 1 (numbers for 2006)
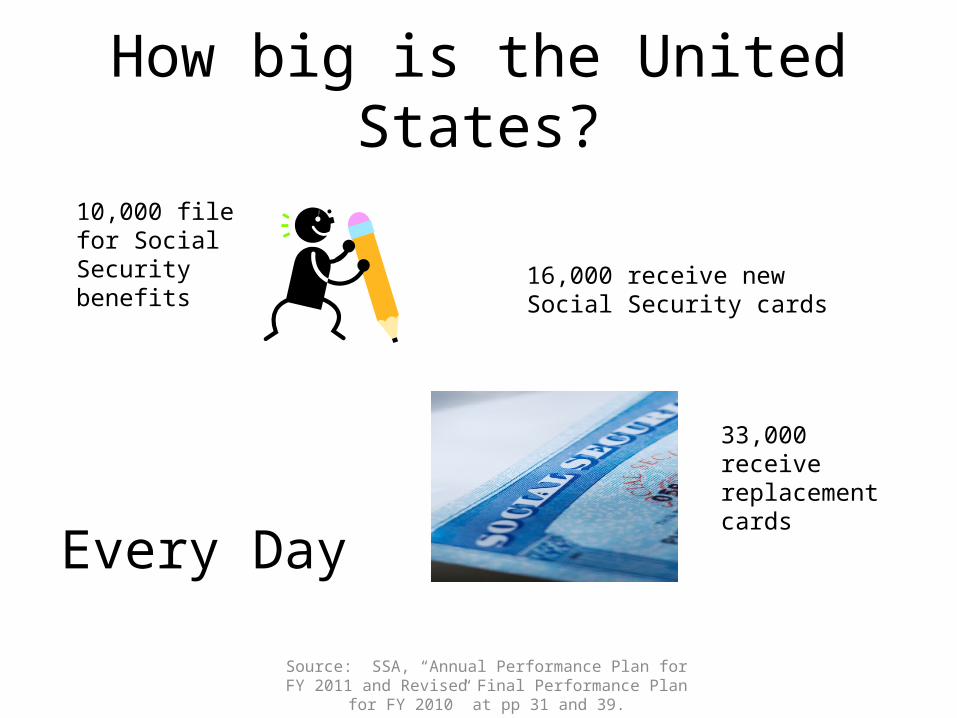
How big is the United States?
10,000 filefor SocialSecuritybenefits
16,000 receive newSocial Security cards
33,000receivereplacementcards
Every Day
Source: SSA, “Annual Performance Plan for FY 2011 and Revised Final Performance Plan for FY 2010” at pp 31 and 39.
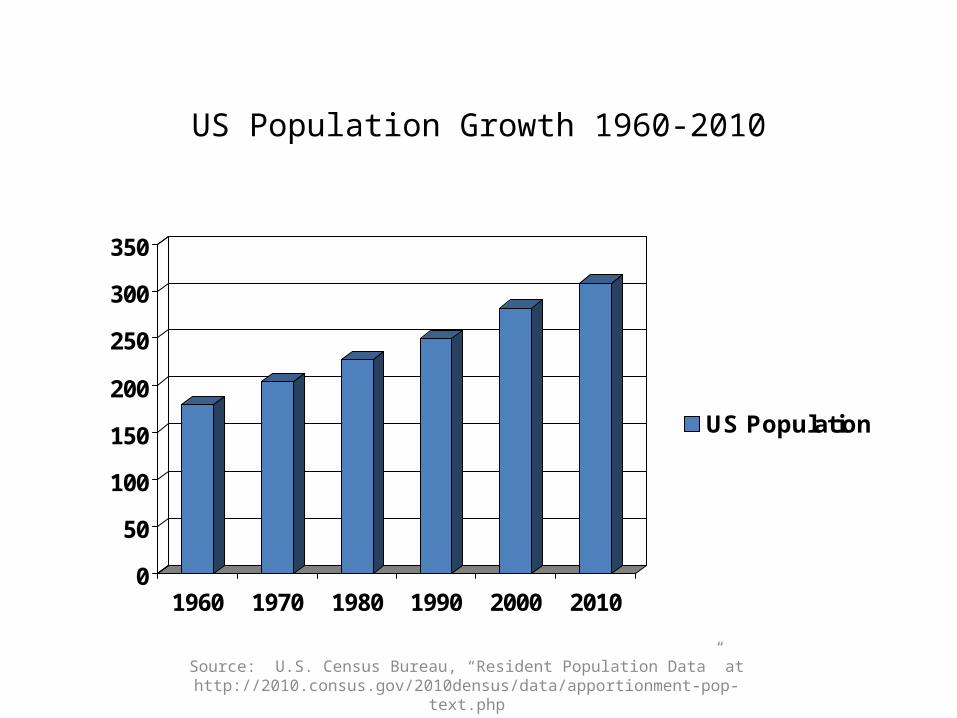
US Population Growth 1960-2010
0
50
100
150
200
250
300
350
1960 1970 1980 1990 2000 2010
US Population
Source: U.S. Census Bureau, “Resident Population Data” at http://2010.consus.gov/2010densus/data/apportionment-pop-text.php
In 1960. . .

In 1960 . . .
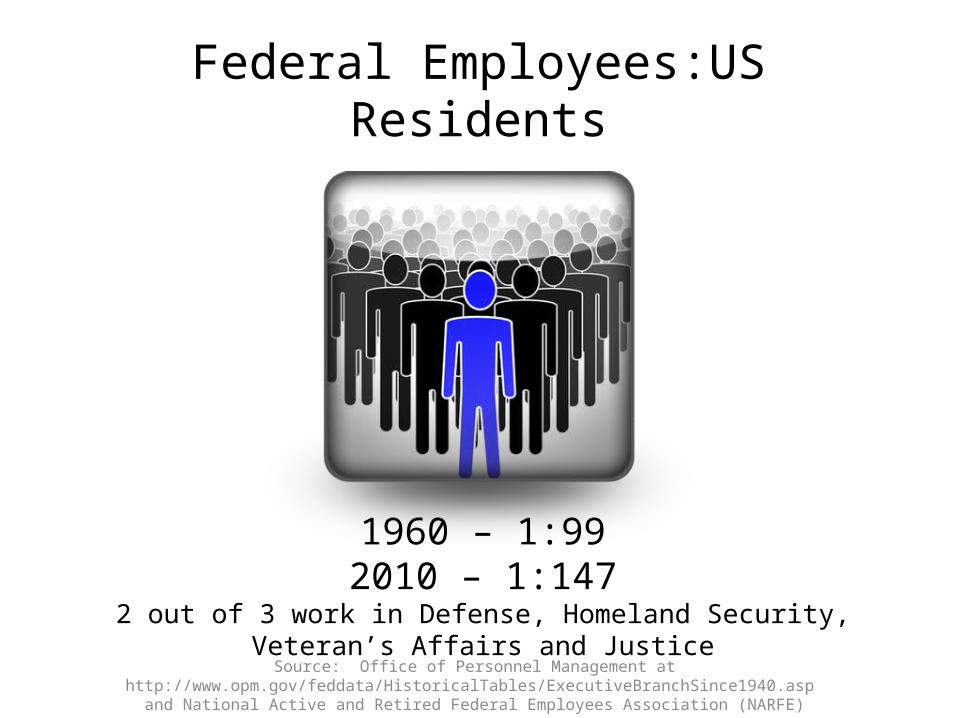
Federal Employees:US Residents
1960 – 1:992010 – 1:147
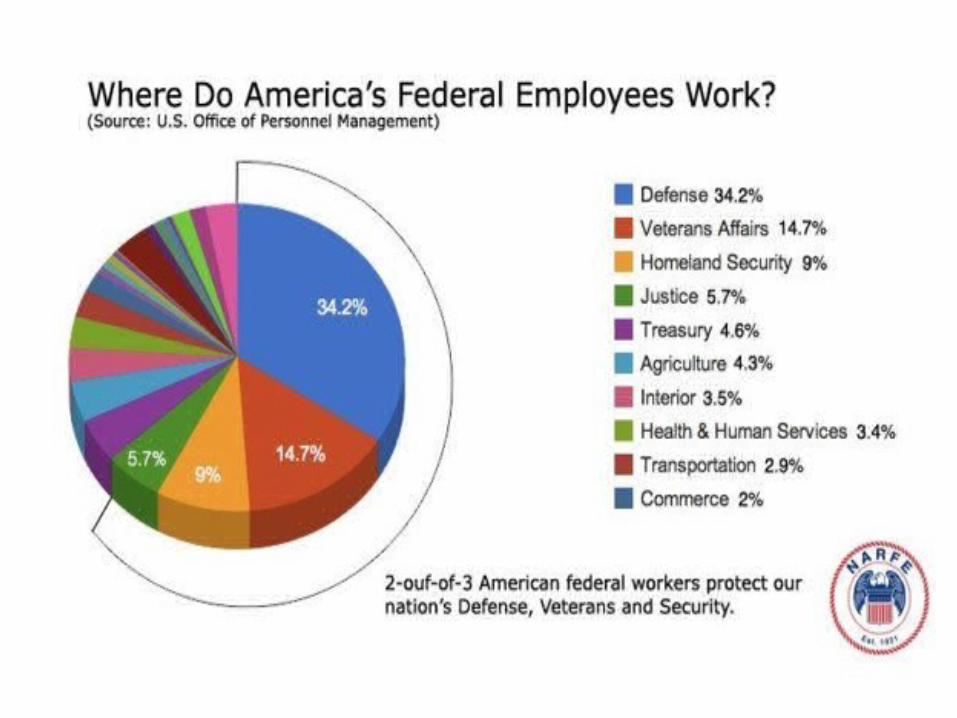
2 out of 3 work in Defense, Homeland Security, Veteran’s Affairs and Justice
Source: Office of Personnel Management at http://www.opm.gov/feddata/HistoricalTables/ExecutiveBranchSince1940.asp and National Active and Retired Federal Employees Association (NARFE)
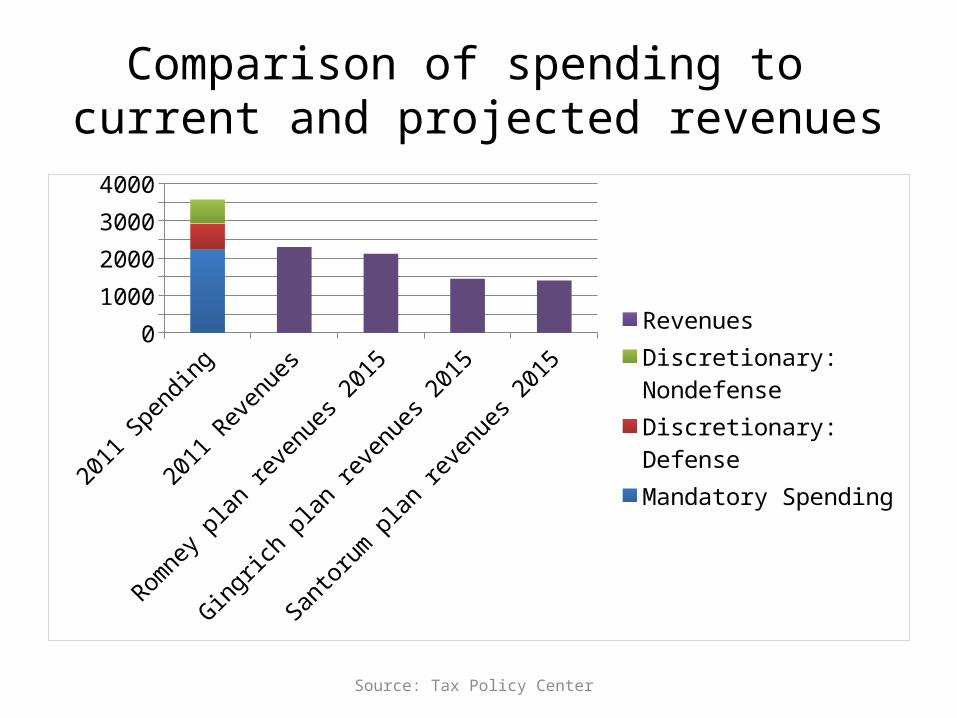
Source: Tax Policy Center
Comparison of spending to current and projected revenues
2011 Spending
2011 Revenues
Romney plan
reve
nues 2015
Gingrich
plan re
venues 2
015
Santo
rum plan
reve
nues 2015
0500
1000150020002500300035004000
RevenuesDiscretionary: Nonde-fenseDiscretionary: DefenseMandatory Spending

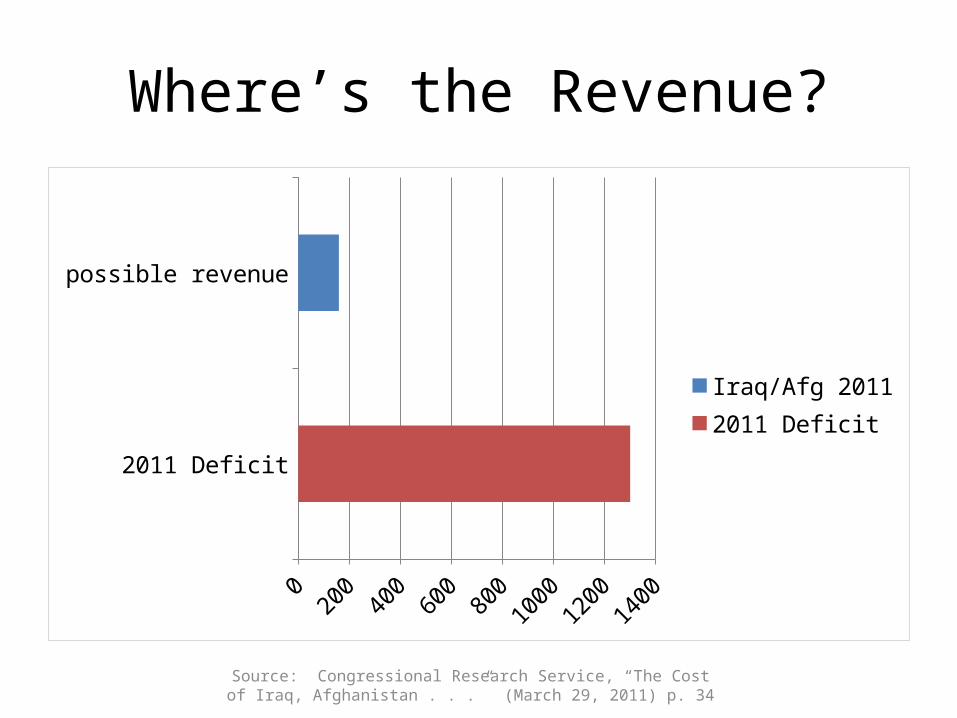
Where’s the Revenue?
2011 Deficit
possible revenue
0 200 400 600 800 1000 1200 1400
Iraq/Afg 20112011 Deficit
Source: Congressional Research Service, “The Cost of Iraq, Afghanistan . . .” (March 29, 2011) p. 34
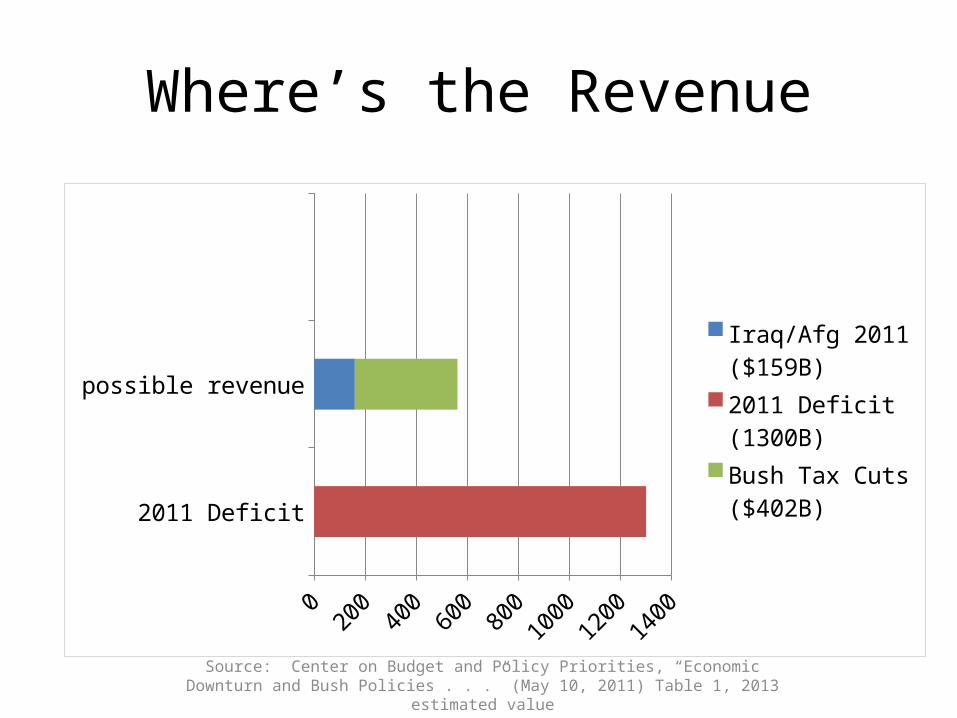
Where’s the Revenue
2011 Deficit
possible revenue
0 200 400 600 800 1000 1200 1400
Iraq/Afg 2011 ($159B)2011 Deficit (1300B)Bush Tax Cuts ($402B)
Source: Center on Budget and Policy Priorities, “Economic Downturn and Bush Policies . . .” (May 10, 2011) Table 1, 2013 estimated value
Where’s the Revenue?
2011 Deficit
possible revenue
0 200 400 600 800 100012001400
Iraq/Afg 2011 ($159B)2011 Deficit (1300B)Bush Tax Cuts ($402B)establish Financial Transaction tax ($177B)
Source: Center for Economic and Policy Research, “The Potential Revenue from Financial Transactions Taxes” (December 2009) Table 1
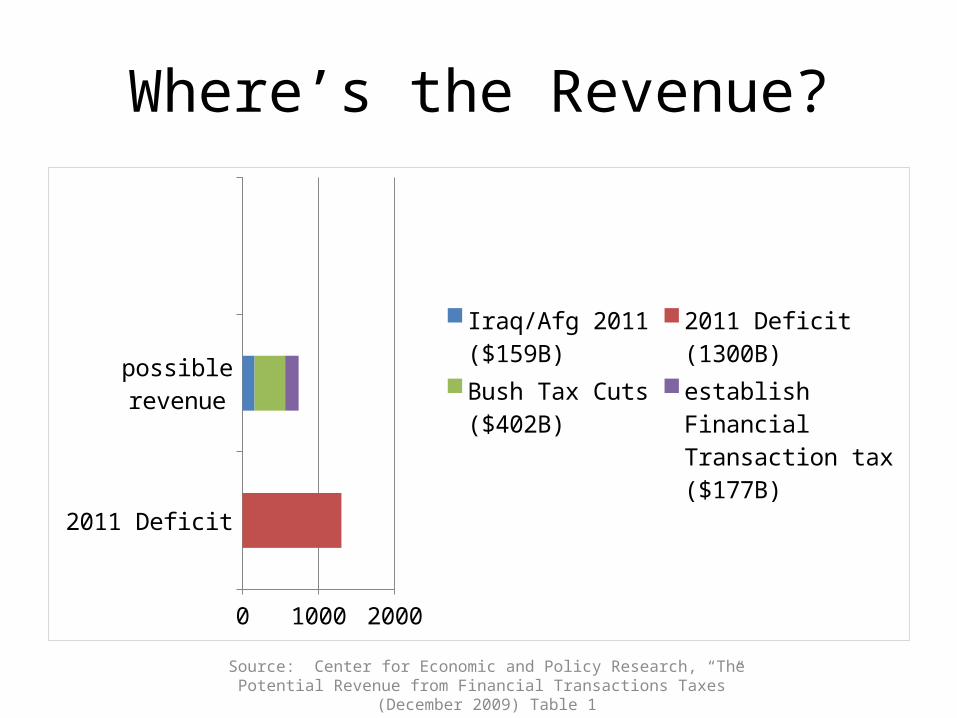
Where’s the Revenue?
2011 Deficit
possible revenue
0 200 400 600 800 100012001400
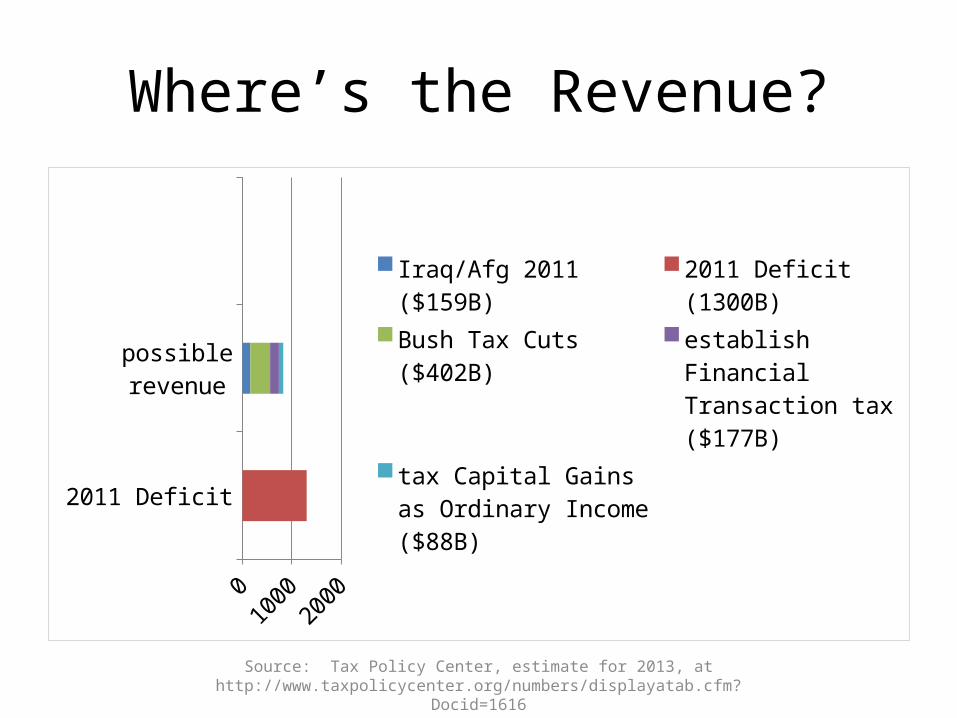
Iraq/Afg 2011 ($159B)2011 Deficit (1300B)Bush Tax Cuts ($402B)establish Financial Transaction tax ($177B)tax Capital Gains as Or-dinary Income ($88B)
Source: Tax Policy Center, estimate for 2013, at http://www.taxpolicycenter.org/numbers/displayatab.cfm?Docid=1616
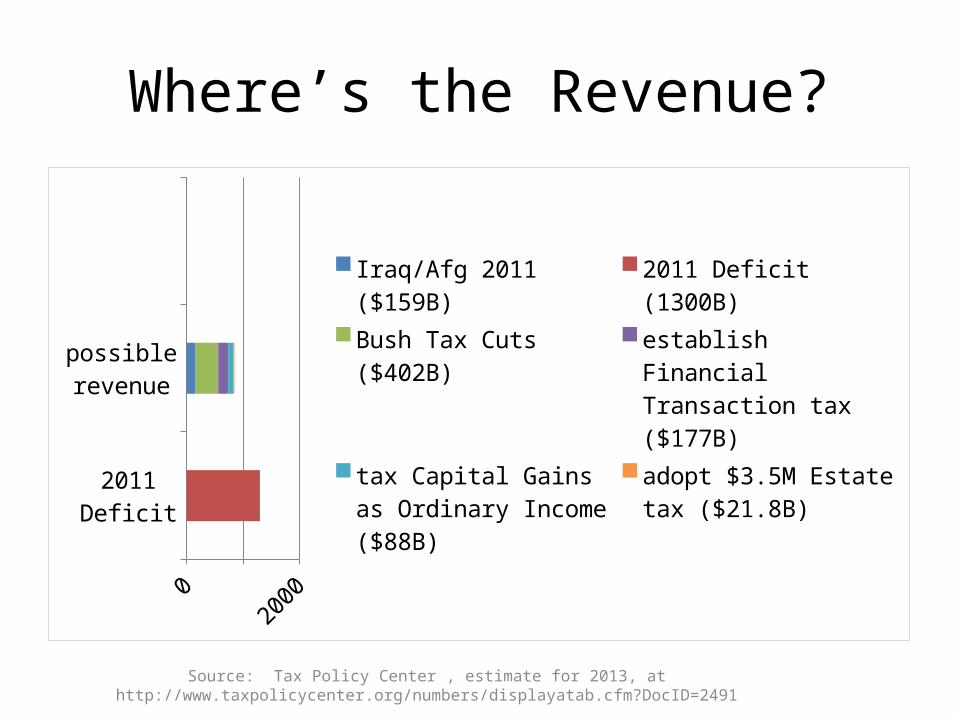
Where’s the Revenue?
2011 Deficit
possible revenue
0 200 400 600 800 100012001400
Iraq/Afg 2011 ($159B)2011 Deficit (1300B)Bush Tax Cuts ($402B)establish Financial Transaction tax ($177B)tax Capital Gains as Or-dinary Income ($88B)adopt $3.5M Estate tax ($21.8B)
Source: Tax Policy Center , estimate for 2013, at http://www.taxpolicycenter.org/numbers/displayatab.cfm?DocID=2491
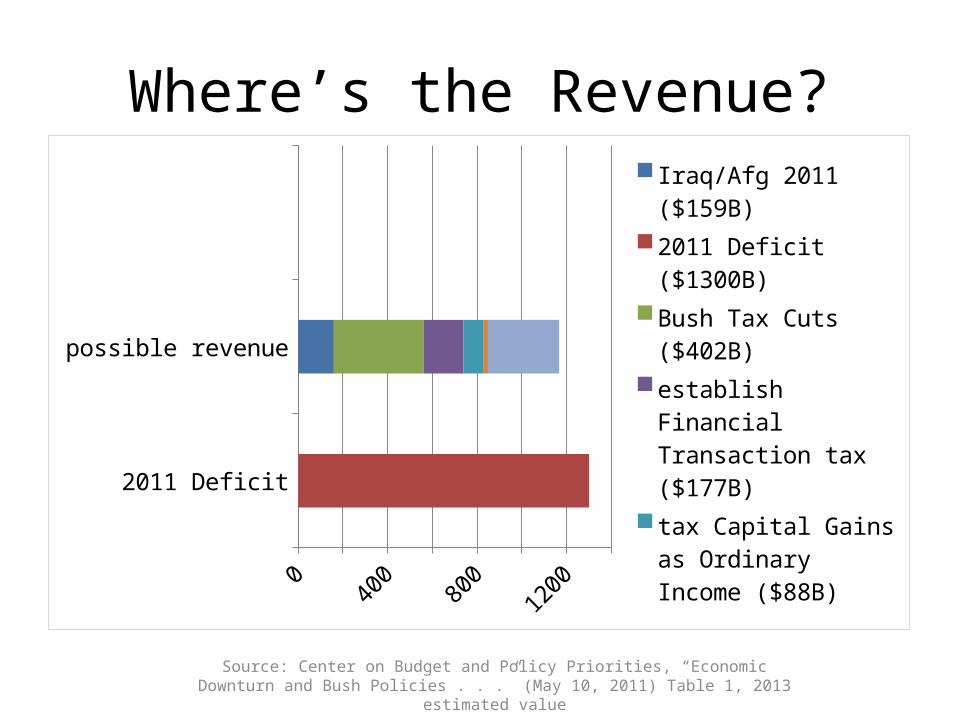
Where’s the Revenue?
2011 Deficit
possible revenue
0 200 400 600 800 100012001400
Iraq/Afg 2011 ($159B)
2011 Deficit ($1300B)
Bush Tax Cuts ($402B)
establish Financial Transaction tax ($177B)
tax Capital Gains as Or-dinary Income ($88B)
adopt $3.5M Estate tax ($21.8B)
put people back to work ($318B)
Source: Center on Budget and Policy Priorities, “Economic Downturn and Bush Policies . . .” (May 10, 2011) Table 1, 2013 estimated value
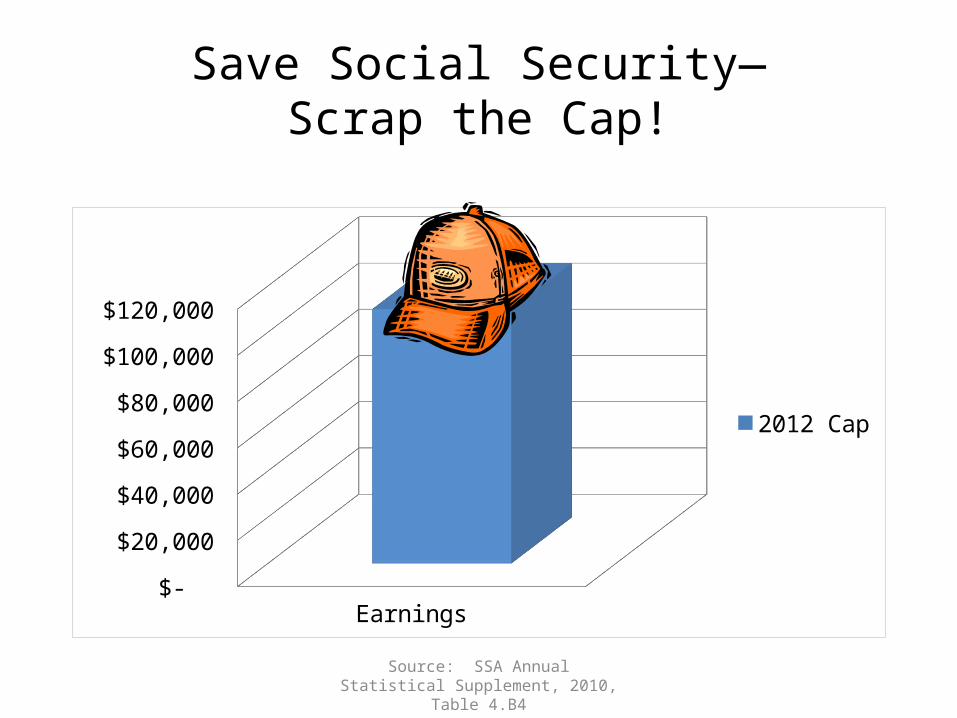
Save Social Security—Scrap the Cap!
Earnings $-
$20,000
$40,000
$60,000
$80,000
$100,000
$120,000
2012 Cap
Source: SSA Annual Statistical Supplement, 2010, Table 4.B4
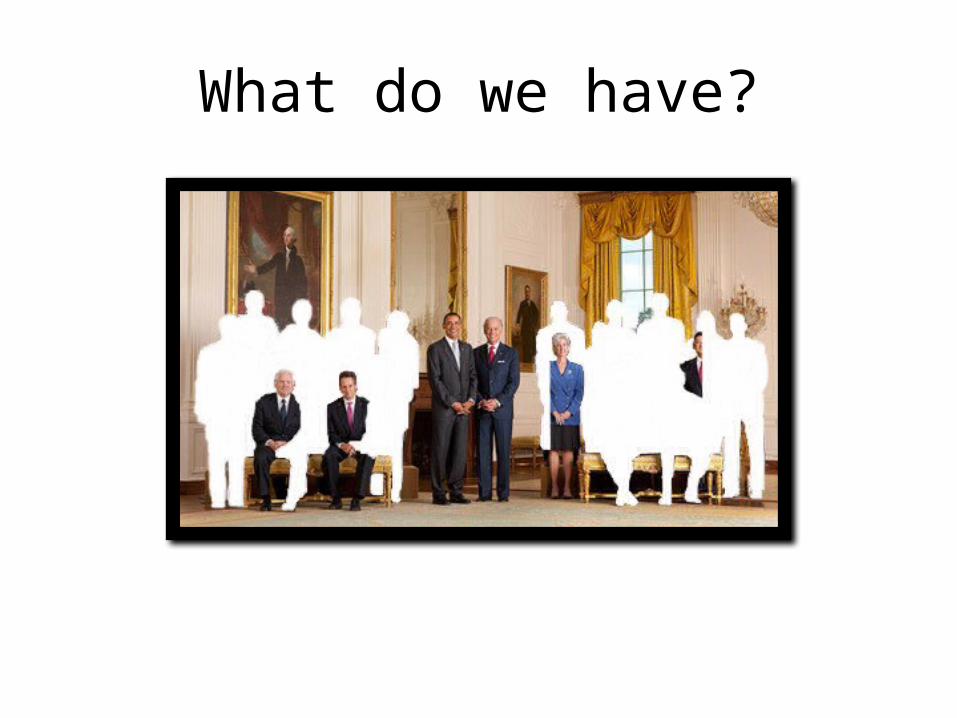
What do we have?
What do we have?
Big country Modest sized
government Small tax burden
The reckless aughts gave usMassive tax cutsUnfunded warsWall Street speculators
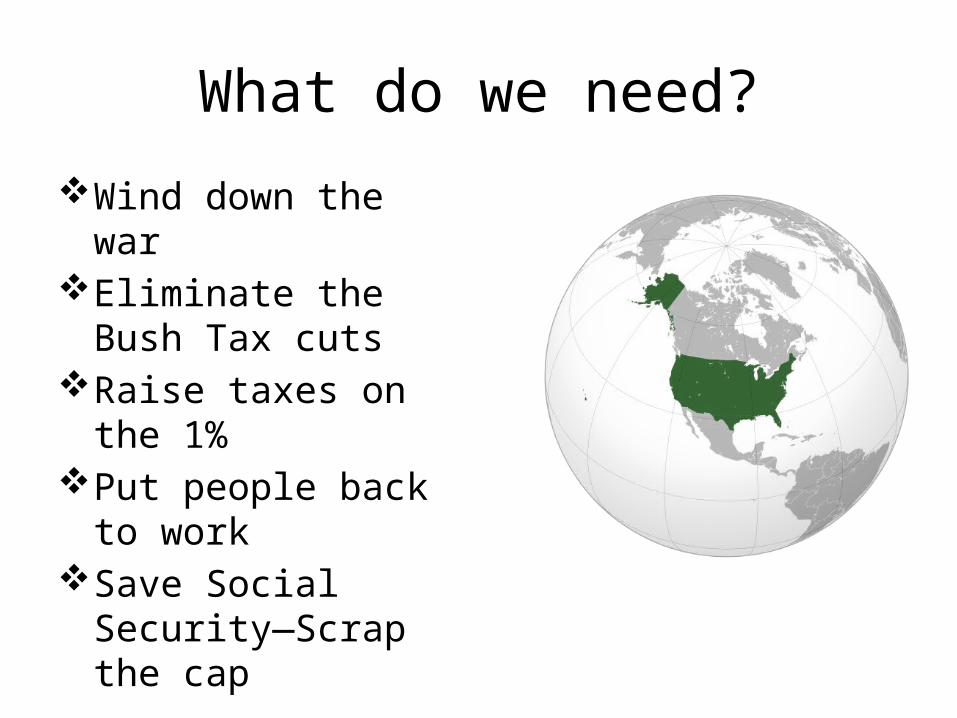
What do we need?
Wind down the warEliminate the Bush Tax
cutsRaise taxes on the 1%Put people back to workSave Social Security—
Scrap the cap