Embed Size (px)
Citation preview
Annual Report 2007

GRUPPO CARRARO ANNUAL REPORT 2006
1
Carraro Group Annual Report 2007
GRUPPO CARRARO ANNUAL REPORT 2006
3
Contents
5 Ownership structure of Carraro Spa 6 Letter from the Chairman 13 Highlights 14 Carraro Spa Financial Statements’ Charts 16 Consolidated Financial Statements’ Charts 20 Earnings and financial position figures by business segment
Consolidated Financial Statements 25 Report on Operations 57 Consolidated Financial Statements 139 Report of the Board of Statutory Auditors 140 Auditors’ Report 142 Ordinary Shareholders’ Meeting of Carraro Spa on 23/04/08

GRUPPO CARRARO ANNUAL REPORT 2006
4

GRUPPO CARRARO ANNUAL REPORT 2006
5
Ownership structure of Carraro Spaat 31 December 2007
BOARD OF DIRECTORS
In office until the approval of the
2008 Financial Statements
(Appointed by shareholders on 11/05/06,
powers conferred by resolution
of BoD on 11/05/06 and on 26/06/07)
BOARD OF STATUTORY AUDITORS
In office until the approval of the
2008 Financial Statements
(Appointed by shareholders on 11/5/2006)
INDEPENDENT AUDITORS
2007–2015
PARENT COMPANY
MARIO CARRARO Chairman
ENRICO CARRARO Executive Deputy Chairman
CARLO BORSARI Chief Executive Officer
FRANCESCO CARRARO Director
TOMASO CARRARO Director
GIORGIO BRUNETTI 1 Director
ANTONIO CORTELLAZZO 1/2 Director
SERGIO EREDE 2 Director
ONOFRIO TONIN 1/2 Director
1 Member of the Internal Auditing Committee2 Member of the Compensation Committee
ROBERTO SACCOMANI Chairman
FRANCESCO SECCHIERI Statutory Auditor
FEDERICO MEO Statutory Auditor
RENZO LOTTO Substitute Auditor
MARINA MANNA Substitute Auditor
PricewaterhouseCoopers Spa
Finaid Spa
Pursuant to Consob Communication no. 97001574 of 20 February 1997, we hereby
inform you that Chairman Mario Carraro and Chief Executive Officer Carlo Borsari hold
the powers of legal representation and signing authority in dealings with third parties
and the courts separately between them. They engage in their respective activities
within the framework of the powers assigned to them by the Board of Directors at
the session held on 11 May 2006 in accordance with restrictions under applicable
law, pertaining to subject matter that may not be delegated by the Board of Directors
and the issues reserved for the Board’s authority, as well as the principles and limits
envisaged by the Company’s corporate governance code.
CARRARO SPA
Registered office in Campodarsego (Italy) – 37 Via Olmo
Share capital: € 21,840,000, fully paid in
Italian Tax Code / VAT Registration and Registration in the
Padua Business Registry no. 00202040283
Padua Economic and Administrative Index no. 84033

GRUPPO CARRARO ANNUAL REPORT 2006
6
We grew in 2007 and we will continue to grow at a substantial rate in 2008. In the year to 31 December sales were up by 22% from 667.183 million Euro to 813.734 million Euro. Net income reached 15.587 million Euro, up by 48% year-on-year. These re-sults were achieved during a year of strong growth, even though there were obstacles to be overcome in speeding up production processes, also consider-ing the increased costs of raw materials for work in progress. In other words, we clearly have room for improvement.
In the meanwhile, reinforcement of the Group’s international structure continued. The Group’s pro-duction units, distributed across multiple continents, provide a tangible contribution to increasing the Group’s size and driving new growth strategies. Wor-thy of mention are India (43 million Euro in sales in 2007, showing a further sharp increase), where production of transmissions for agricultural and industrial vehicles is concentrated; Fon (Poland), whose sales leapt to 73 million Euro, and whose production runs parallel to Italian plans while at the same time serving as a gateway to Eastern European markets; Carraro Argentina (63 million Euro), a point of reference in South America, a region with a bright future; and O&K – Germany (65 million Euro), fundamental to the launch of innovative prod-ucts in the Drive segment for wind power. Not to mention the extraordinary role we have assigned to Carraro China, only inaugurated last October, and the considerable benefits we expect—especially at current exchange rates—from the production facility in Virginia Beach, Usa, obtained through the acquisi-tion of Minigears.
Alongside the strong drive towards internation-alization, an essential growth factor, Carraro has
Letter from the Chairman
GRUPPO CARRARO ANNUAL REPORT 2006
7
developed an effective diversification strategy that has strengthened its competitiveness and paved the way to significant new prospects for expansion as we approach the milestone of one billion euro in sales. Today there are four areas of operation into which we may divide the business, each identified with specific technological fields and boasting exceptional independent potential. These must be supported with intensive research initiatives in harmony with the innovative spirit that is encoded in the Group’s Dna.
Let us begin with the current core business, 4RM axles, mechanical and hydrostatic transmissions for tractors and earth-moving machines, in addition to drives for complex industrial applications. The core business represents the bulk of sales, but still offers substantial room for improvement through the expansion of the product line. Then we have gear manufacturing operations, which the acquisition of Minigears has grouped together under a holding company, Gear World, which is intended to expand production and sales to new markets through eight facilities located in Italy, India, China, and Argen-tina. Thirdly, we have Elettronica Santerno, which operates in a segment with remarkable potential, in both photovoltaic and wind power, and may take a leading role in the development of alternative ener-gy. Lastly, there is the manufacturing of specialized tractors, the result of integrated collaboration with prestigious brand names, which currently offers the opportunity to develop partnership agreements with sector companies in emerging countries.
A discussion of the foregoing leads us to recon-sider the very structure of the Group, in which Car-raro, the parent company, controls the four com-panies operating in the above areas. The goal is to
support each specific entity through a management style that seizes the genuinely vast opportunities available to them. This goal is pursued by support-ing significant organic growth while also imple-menting a policy of alliances and acquisitions. All of this is to be done within a framework that ensures stability and control by fully exploiting the consid-erable synergies offered.
What I am outlining is a transformation that has come about with the Group’s new size and the global reach of its operations. Yet this plan also coincides with a generational transition that offers a new im-petus in a business culture that has always relied on development as its main engine for growth over the company’s nearly one hundred years of history. With a strong team spirit involving all members of the company, across all levels of responsibility, and around the world. We aim to support professional growth by cultivating resources, skills, creativity, and management ability. This is my commitment today, in a passage, which, by its very nature, is not an easy one, but is nonetheless essential to the great achievements that await us.
MARIO CARRAROChairman
GRUPPO CARRARO ANNUAL REPORT 2006
8
GRUPPO CARRARO ANNUAL REPORT 2006
9
GRUPPO CARRARO ANNUAL REPORT 2006
10
GRUPPO CARRARO ANNUAL REPORT 2006
11
HIGHLIGHTS
12

HIGHLIGHTS
13
CARRARO SPA 2007 2006
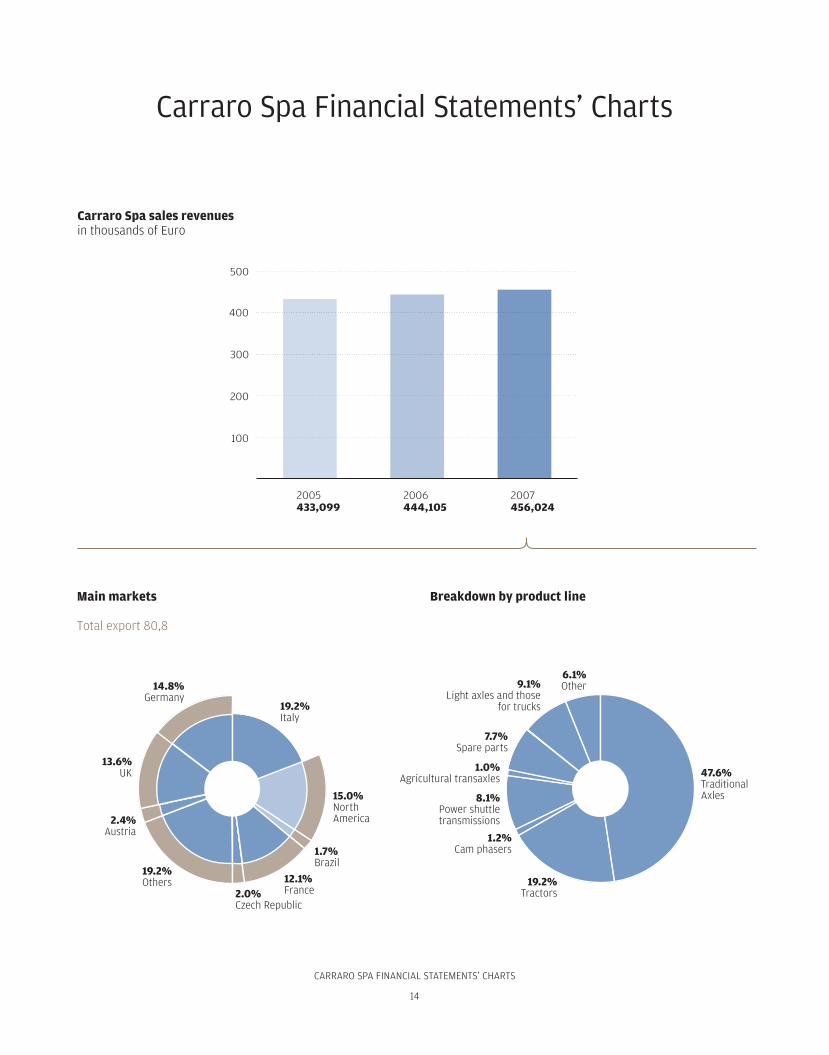
Net revenues 456,024 444,105
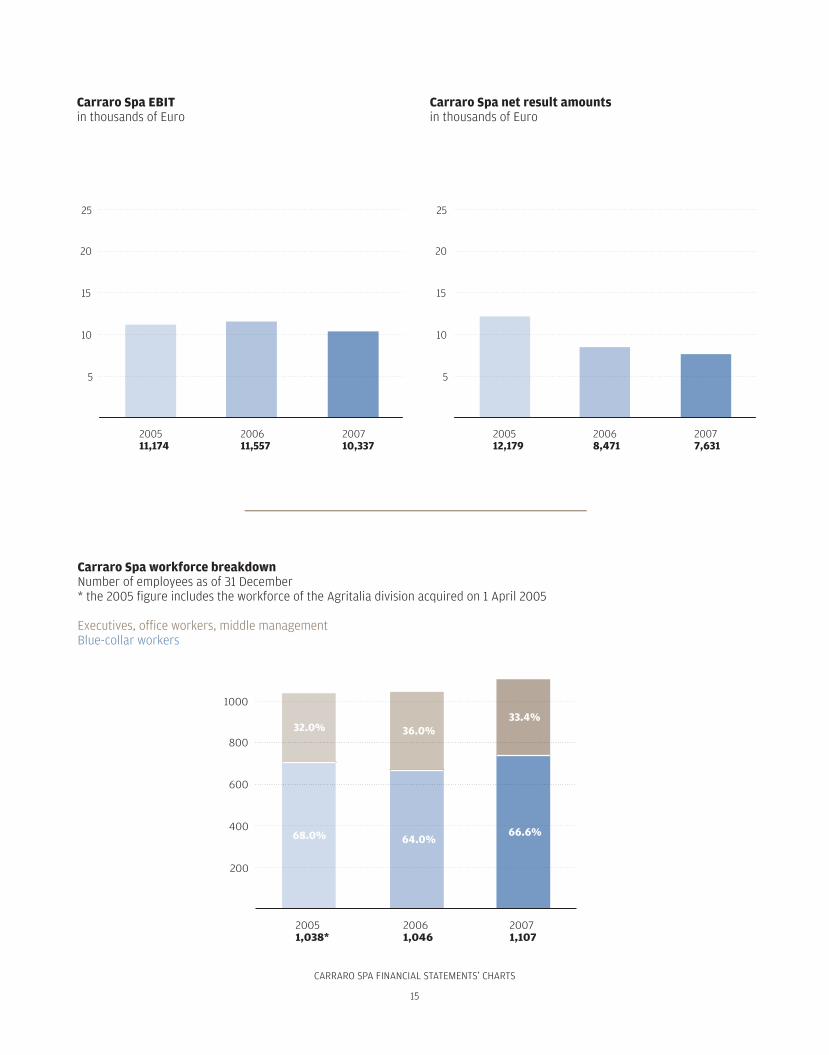
Operating income (adjusted for the effect of exchange differences) 10,337 11,557
Net income 7,631 8,471
Shareholders’ equity 84,489 82,168
Cash flow 15,576 16,829
ROE (Net income/equity) 9.93% 11.49%
ROI (Operating income/invested capital) 3.29% 3.59%
Workforce at 31/12 1,107 1,046
Research and development expenses/sales 2.79% 2.78%
Gross investments 8,643 11,336
CONSOLIDATED FINANCIAL STATEMENTS 2007 2006
Net revenues 813,734 667,183
Operating income (adjusted for the effect of exchange differences) 39,510 30,044
Net income (net of minority interests) 15,587 10,534
Shareholders’ equity (net of minority interests) 126,420 115,256
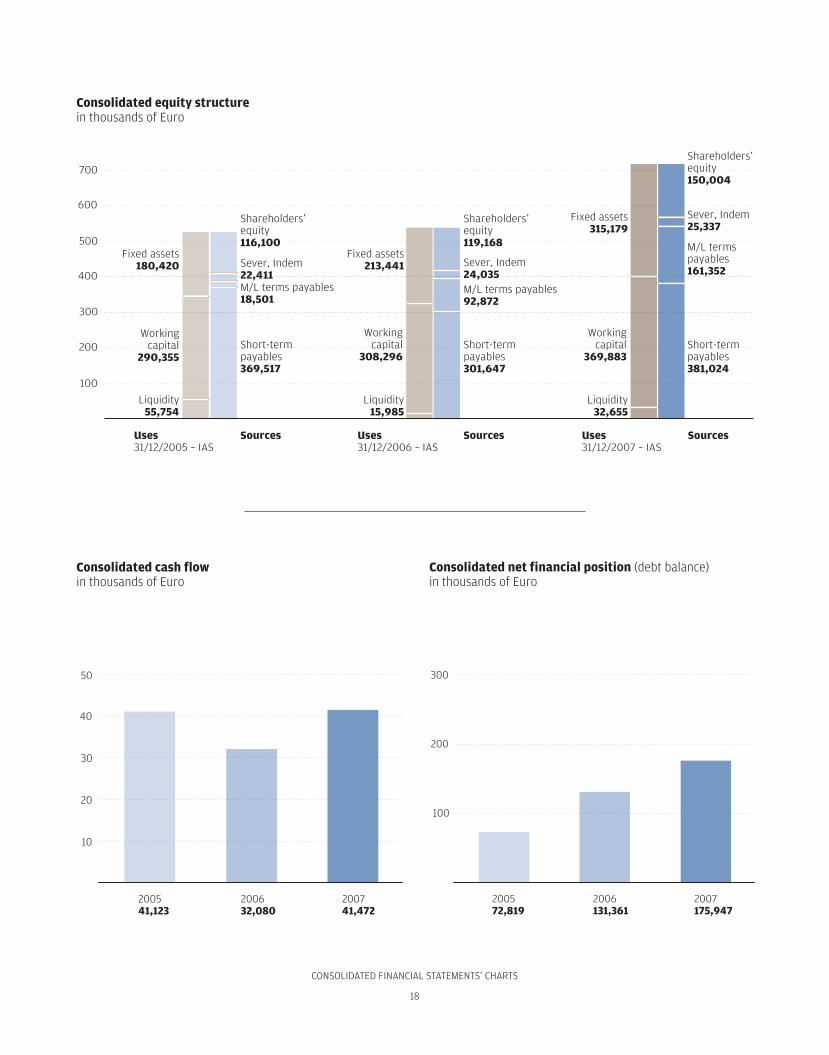
Cash flow 41,472 32,080
ROE (Net income/equity) 14.06% 10.06%
ROI (Operating income/invested capital) 5.50% 5.59%
Workforce at 31/12 4,036 2,857
Research and development expenses/sales 1.85% 2.08%
Gross investments 46,958 35,150
Highlights
Figu
res
in E
uro/
1.0
00
CARRARO SPA FINANCIAL STATEMENTS’ CHARTS
14
Carraro Spa Financial Statements’ Charts
�����������
�����������
�����������
���
���
���
���
���
�������������������������������������
�����������������
����������������������������������������������
�������������
��������������������������������
���������������
���������������������������
������������������������������
���������������
�������������
���������������������
������������
�������
����������
�����������
�����������
������������������
�����������
����������
������������������
CARRARO SPA FINANCIAL STATEMENTS’ CHARTS
15
����������
���������
���������
����������������������������������������������������������������������������������������������������������������������������������������������������������������
����������������������������������������������������������������
����������
����������
����������
���
��
��
��
��
���
��
��
��
��
������������������������������������
��������������������������������������������������
���
���
���
���
����
����������
�����
�����
���������
�����
�����
���������
�����
�����

CONSOLIDATED FINANCIAL STATEMENTS’ CHARTS
16
Consolidated Financial Statements’ Charts
�����������
�����������
�����������
������������������������
�������
��������������� �����
��������������������������
�����������������
������������������������������ ����
��������������
��������������
����������������������������������
������������
�����������������
������������������������
���
���
���
���
����
�����������������������������������������������
����������
��������������������
������������
������������������������
���������
�����������������
�������
���������
����������
����������
������������������
�������������
���������������
������������������
����������������

CONSOLIDATED FINANCIAL STATEMENTS’ CHARTS
17
����������
����������
����������
�����
�������
�����������������������������������������������������������������������������������������������������������������������
����������������������������������������������������������������
��
��
��
��
��
��
����������
����������
����������
�������������������������������������
�����������������������������������������������������������������������
����������������������������������
����
����
����
���������
�����
�����
���������
�����
�����
���������
�����
�����
CONSOLIDATED FINANCIAL STATEMENTS’ CHARTS
18
����������
����������
����������
��
��
��
��
��
������������������������������������������
����������������������������������������������������������������������
�������������������������������������������������
����������
�����������
�����������
���
���
���
���
���
���
���
���
���
���
��������������������������
������������������������
������������������
��������������������������
���������������
��������������
�������
�������������������
��������������������
�������
��������������������������
������������������������
������������������
��������������������������
���������������
��������������
�������
�������������������
��������������������
�������
��������������������������
�������������������������
������������������
��������������������������
���������������
��������������
�������
�������������������
��������������������
�������
CONSOLIDATED FINANCIAL STATEMENTS’ CHARTS
19
����������
����������
����������
��
��
��
��
��
��������������������������������������������������������������������������������
����������
�����������
����������
���
��
��
��
��
���������������������������������������������������������������������
EARNINGS AND FINANCIAL POSITION FIGURES
20
Earnings and financial position figuresby business segment
Figu
res
in E
uro/
1.0
00
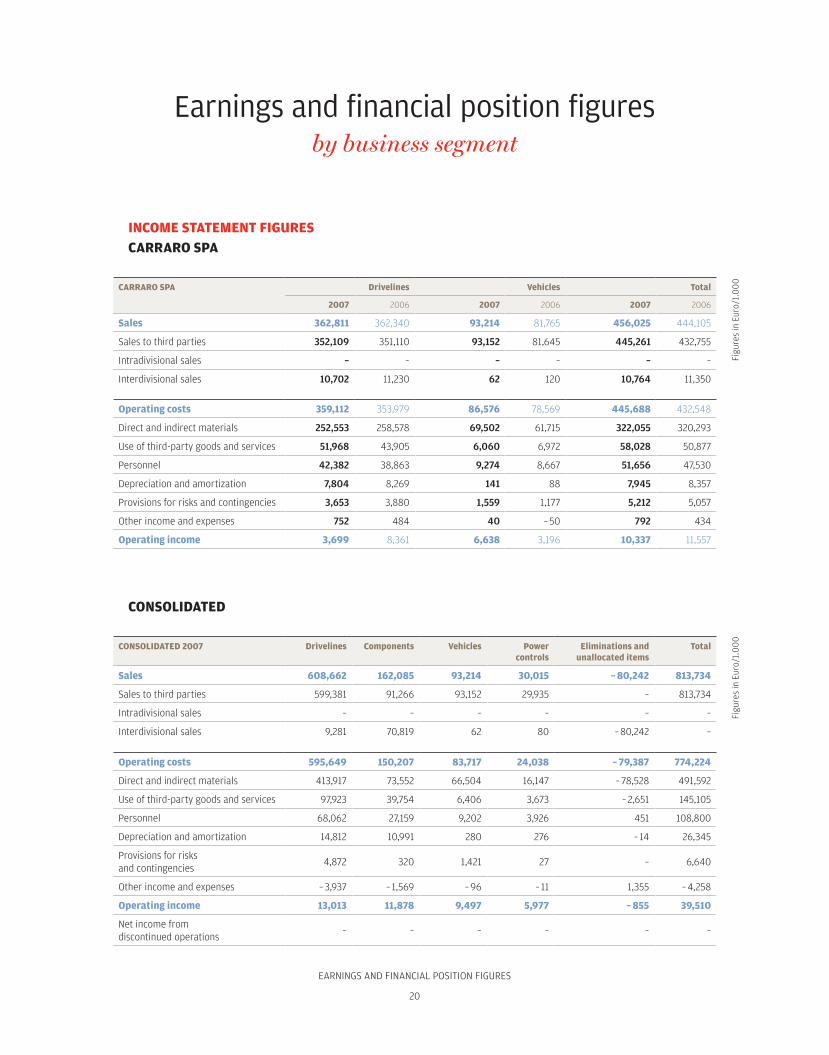
INCOME STATEMENT FIGURESCARRARO SPA
CARRARO SPA Drivelines Vehicles Total
2007 2006 2007 2006 2007 2006
Sales 362,811 362,340 93,214 81,765 456,025 444,105
Sales to third parties 352,109 351,110 93,152 81,645 445,261 432,755
Intradivisional sales – – – – – –
Interdivisional sales 10,702 11,230 62 120 10,764 11,350
Operating costs 359,112 353,979 86,576 78,569 445,688 432,548
Direct and indirect materials 252,553 258,578 69,502 61,715 322,055 320,293
Use of third-party goods and services 51,968 43,905 6,060 6,972 58,028 50,877
Personnel 42,382 38,863 9,274 8,667 51,656 47,530
Depreciation and amortization 7,804 8,269 141 88 7,945 8,357
Provisions for risks and contingencies 3,653 3,880 1,559 1,177 5,212 5,057
Other income and expenses 752 484 40 – 50 792 434
Operating income 3,699 8,361 6,638 3,196 10,337 11,557
CONSOLIDATED
CONSOLIDATED 2007 Drivelines Components Vehicles Powercontrols
Eliminations and unallocated items
Total
Sales 608,662 162,085 93,214 30,015 – 80,242 813,734
Sales to third parties 599,381 91,266 93,152 29,935 – 813,734
Intradivisional sales – – – – – –
Interdivisional sales 9,281 70,819 62 80 – 80,242 –
Operating costs 595,649 150,207 83,717 24,038 – 79,387 774,224
Direct and indirect materials 413,917 73,552 66,504 16,147 – 78,528 491,592
Use of third-party goods and services 97,923 39,754 6,406 3,673 – 2,651 145,105
Personnel 68,062 27,159 9,202 3,926 451 108,800
Depreciation and amortization 14,812 10,991 280 276 – 14 26,345
Provisions for risks and contingencies
4,872 320 1,421 27 – 6,640
Other income and expenses – 3,937 – 1,569 – 96 – 11 1,355 – 4,258
Operating income 13,013 11,878 9,497 5,977 – 855 39,510
Net income from discontinued operations
– – – – – –
Figu
res
in E
uro/
1.0
00
EARNINGS AND FINANCIAL POSITION FIGURES
21
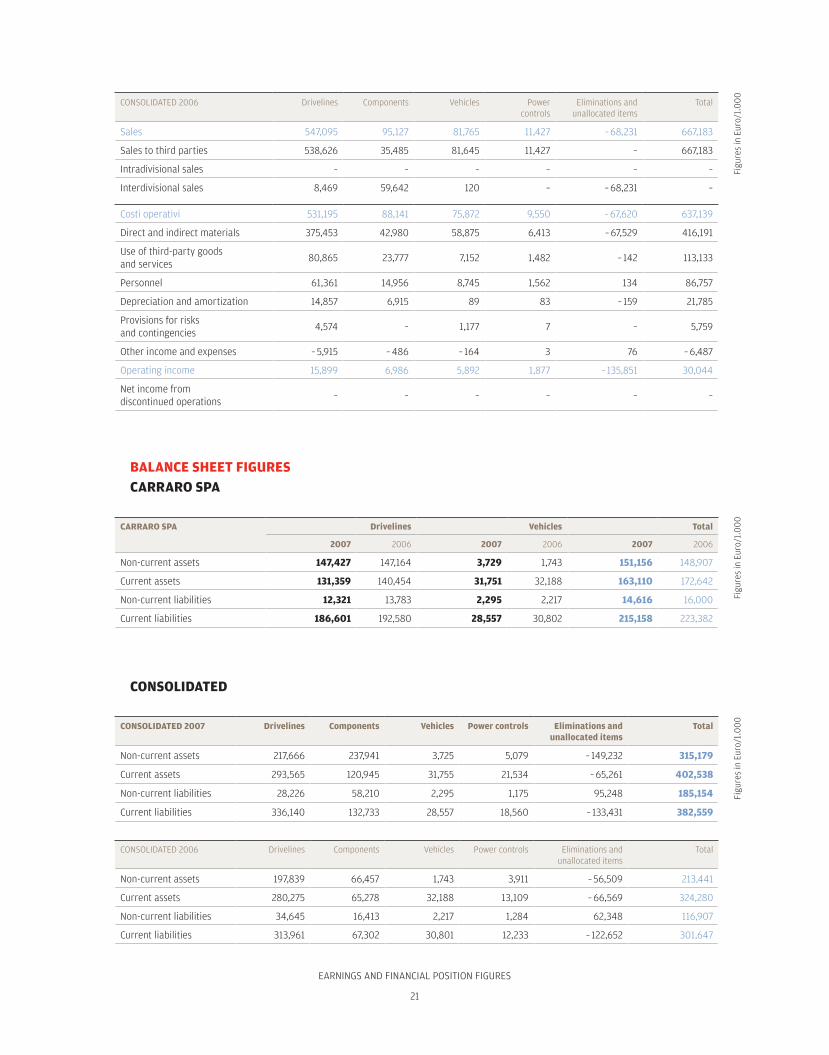
CONSOLIDATED 2006 Drivelines Components Vehicles Powercontrols
Eliminations and unallocated items
Total
Sales 547,095 95,127 81,765 11,427 – 68,231 667,183
Sales to third parties 538,626 35,485 81,645 11,427 – 667,183
Intradivisional sales – – – – – –
Interdivisional sales 8,469 59,642 120 – – 68,231 –
Costi operativi 531,195 88,141 75,872 9,550 – 67,620 637,139
Direct and indirect materials 375,453 42,980 58,875 6,413 – 67,529 416,191
Use of third-party goodsand services
80,865 23,777 7,152 1,482 – 142 113,133
Personnel 61,361 14,956 8,745 1,562 134 86,757
Depreciation and amortization 14,857 6,915 89 83 – 159 21,785
Provisions for risksand contingencies
4,574 – 1,177 7 – 5,759
Other income and expenses – 5,915 – 486 – 164 3 76 – 6,487
Operating income 15,899 6,986 5,892 1,877 – 135,851 30,044
Net income fromdiscontinued operations
– – – – – –
BALANCE SHEET FIGURESCARRARO SPA
CARRARO SPA Drivelines Vehicles Total
2007 2006 2007 2006 2007 2006
Non-current assets 147,427 147,164 3,729 1,743 151,156 148,907
Current assets 131,359 140,454 31,751 32,188 163,110 172,642
Non-current liabilities 12,321 13,783 2,295 2,217 14,616 16,000
Current liabilities 186,601 192,580 28,557 30,802 215,158 223,382
CONSOLIDATED
CONSOLIDATED 2007 Drivelines Components Vehicles Power controls Eliminations and unallocated items
Total
Non-current assets 217,666 237,941 3,725 5,079 – 149,232 315,179
Current assets 293,565 120,945 31,755 21,534 – 65,261 402,538
Non-current liabilities 28,226 58,210 2,295 1,175 95,248 185,154
Current liabilities 336,140 132,733 28,557 18,560 – 133,431 382,559
CONSOLIDATED 2006 Drivelines Components Vehicles Power controls Eliminations and unallocated items
Total
Non-current assets 197,839 66,457 1,743 3,911 – 56,509 213,441
Current assets 280,275 65,278 32,188 13,109 – 66,569 324,280
Non-current liabilities 34,645 16,413 2,217 1,284 62,348 116,907
Current liabilities 313,961 67,302 30,801 12,233 – 122,652 301,647
Figu
res
in E
uro/
1.0
00
Figu
res
in E
uro/
1.0
00
Figu
res
in E
uro/
1.0
00

CONSOLIDATED FINANCIAL STATEMENTS’ CHARTS
22

CONSOLIDATED FINANCIAL STATEMENTS’ CHARTS
23

REPORT ON OPERATIONS
24

REPORT ON OPERATIONS
25
Report on OperationsConsolidated financial statements at 31 December 2007
Another positive year for the Company came to a close on 31 December 2007. Sales were up by 22% from 667.183 million to 813.734 million Euro. Net income rose to 15.587 million Euro, up by 48% on the previous year’s figure of 10.534 million Euro. ebit and ebitda also showed improved in absolute terms, albeit with insignificant shifts as a percent-age of sales: the first was up from 4.50% to 4.86% of sales, and the second from 7.73% to 8.04%. The consolidation of the newly acquired Minigears in August and Stm for the entire year, compared with the second half of 2006, also played a role, if only to a marginal extent. All of these results were achieved despite that fact that in 2007, although there was strong market demand, the Company faced several difficult issues due to obstacles to the organization of new production processes and delays in deliver-ies by suppliers, resulting on several occasions in unforeseen price increases of the supply of goods and services during the year.
There are consequently areas in which concrete improvements are possible, namely more dynamic and punctual management of logistics and further steps towards improving the production facilities located in various sites around the world. These production facilities have posted current sales fig-ures that show that they are becoming solid compo-nents of the Group’s strategic development. These facilities include India (sales of 43 million Euro, showing further rapid growth), which is intended to become a central production facility for farm and construction equipment transmissions; Fon (Poland), where sales rose to over 73 million Euro, which in addition to providing support for Italian plans, aspires to playing a vital role in penetrating the markets of Central Eastern Europe; Carraro
Argentina (63 million Euro), a point of reference in South America, an area with a promising fu-ture; and, lastly, O&K – Germany (65 million Euro), which is planned to play an essential role in launch-ing innovative production in the Drive segment, a rapidly growing industry. We did not cite Carraro China, which only opened its doors last October, but is intended to serve a highly dynamic region of the world economy. Lastly, we would be remiss not to mention the Usa, where our Virginia Beach facility, obtained through the acquisition of Minigears, is intended to satisfy the demand for the production of axles directly for the North American market, thereby moving swiftly to seize the considerable opportunities offered by current exchange rates. In short, what we see today is not only the result of an industrial policy that has consolidated the Group’s leadership over the years, but also the foundation for building new strategies for a further phase of significant expansion.
We are able to make all of these claims while fi-nancial crises are shaking stock markets around the world and casting a shadow on the entire world economy. Nonetheless, we are confident that 2008 will continue to witness concrete plans for growth through the addition of new markets and further success on current areas (in addition to Asia, East-ern Europe, Russia, Turkey, the Middle East, and, of course, Brazil). The above is true not only of the Agriculture segment, which is currently in a state of heightened activity, but also for Construction Equipment, where the rising demand in the afore-mentioned countries has offset the current weak demand from the US. Furthermore, we are confi-dent that the sales levels achieved, the successful diversification that is considerably expanding the
REPORT ON OPERATIONS
26
range of products we offer, and the high degree of internationalization of the Group’s industrial processes are paving the way for Carraro’s access to highly interesting strategic prospects that will require a revision of the Company’s organizational structure in order to avoid missing the significant opportunities that are presenting themselves.
Let us begin with the core business: axles, farm and construction equipment transmissions, and drives in particular, produced by the German operation, in addi-tion to the production of tractors, all under the formula of industrial collaboration with large brand names. In all of these segments intense study of ways to expand product ranges is currently underway. Alongside this traditional business, which represents the bulk of sales by a large margin, in 2007 we announced the creation of Gear World (in which Interbanca holds a 26% stake), which brings together all of the Group’s gear production units. The acquisition of Minigears marked a con-siderable addition, expanding the product line in a complementary manner and strengthening its world presence. The Group has total sales of approximately 250 million Euro, of which only one third are intra-group. Lastly, Elettronica Santerno has shown renewed vigour. With its nearly exponential growth potential, the com-pany is poised to take a leading role in the renewable energy business, specifically solar and wind power generation. The resulting impression is that the organization as a whole needs to conceive of itself as a unit that does not merely avoid penalizing, but rather strongly facilitates the remarkable growth opportunities presented.
These assumptions mean that development programmes aimed at considerably expanding the Carraro Group’s industrial and economic weight and reinforcing its leadership in new areas of business, driven by current diversification processes, are realistic. These programmes naturally require a considerable commitment to re-search and development in order to guarantee that products maintain a constant technological edge, while also aiming at radical innovation, to satisfy what is today an essential need, namely to bring new knowledge to the mechanics industry, and thereby offering increasingly competitive products.
By the same token, improvement of management skills in the area of incisive, open human resource management deserves attention. The addition of the Mini-gears Group brought the workforce to 4,036 resources, of which as many as 45% live outside of Italy. Such considerations are clearly outdated for an organization whose identity consists of an individual commitment to seizing the opportunities presented through a joint effort to achieve professional growth and reward merit, regardless of nationality. We aim to create an environment in which the vision of an age of renewed development is shared by all and which stimulates a deep commit-ment to the fruitful cooperation that the Group requires. We consider this a priority for securing the success of our plans for the future.
REPORT ON OPERATIONS
27
SALESThe Group’s sales came to 813.734 million Euro at 31 December 2007, up by
21.97% from the figure recorded in 2006, 667.183 million Euro. This result was achieved through strong growth across all business areas and was
also driven by the increased volumes contributed by the acquisition of Minigears spa, which was included in the consolidation area effective from August 2007. Ex-cluding the 28.622 million Euro in sales posted by Minigears, and considering Stm srl as consolidated on a line-by-line basis for all of 2006 instead of according to the net equity method for the first ten months of the year, growth comes to 16.08%.
EBITDA AND EBITThe process of offshoring production initiated over the last few years and a shrewd
sourcing policy both contributed to the improvement in the Group’s earnings despite rising raw materials costs. Progress was also driven by the new renewable energy businesses (solar and wind power) and the growth of the Components area.
Ebitda (defined as operating income before the depreciation, amortization and impairment of fixed assets) was up by 26.76%, rising from 51.590 million Euro, or 7.73% of sales in 2006, to 65.395 million Euro or 8.04% of sales in 2007.
After 25.885 million Euro in depreciation and amortization (compared to 21.546 million Euro in 2006), consolidated ebit (defined as operating income disclosed on the income statement) was up by 31.51%, climbing from 30.044 million Euro in 2006 (or 4.50% of sales) to 39.510 million Euro in 2007 (or 4.86% of sales).
As in the case of sales, net of the effects of Stm and Minigears, ebitda comes to 62.746 million Euro, or 7.99% of sales, up by 15.42%, and ebit stands at 39.683 mil-lion Euro, or 5.05% of sales, up by 23.24%.
FINANCIAL EXPENSESDue to the increase in average debt, which was almost exclusively the result of the
acquisition of Minigears, financial expenses came to 10.859 million Euro, or 1.33% of sales, up from 7.060 million Euro in 2006 (or 1.06% of sales).
The ebitda interest cover ratio, calculated for all net financial expenses, came to 6.02, compared to 7.31 at 31 December 2006, and remains compatible with the Group’s earnings and financial position.
TRANSLATION DIFFERENCESAt 31 December 2007 translation differences came to a gain of 1.228 million Euro
(as opposed to a loss of 893 thousand Euro at 31 December 2006) and include the effect of the designation of derivatives at fair value.

REPORT ON OPERATIONS
28
NET INCOMEThe Group closed 2007 with a net income of 15.587 million Euro (1.92% of sales),
up by 47.97% from the figure of 10.534 million Euro (1.58% of sales) in 2006. On a like-for-like basis, i.e. excluding the results of Minigears and considering
Stm srl consolidated line-by-line throughout 2006 instead of according to the net equity method for the first ten months of the year, net income comes to 15.375 mil-lion Euro, up by 31.82%.
CASH FLOWNet cash provided (defined as the sum of net income and the depreciation, amor-
tization and impairment of fixed assets) came to 41.472 million Euro, up by 29.28% on the figure of 32.080 million Euro posted in 2006. The contribution of Stm and Minigears in 2007 should be remarked in this case as well. On a like-for-like basis, the 2007 figure comes to 38.438 million Euro, up by 13.62% Euro.
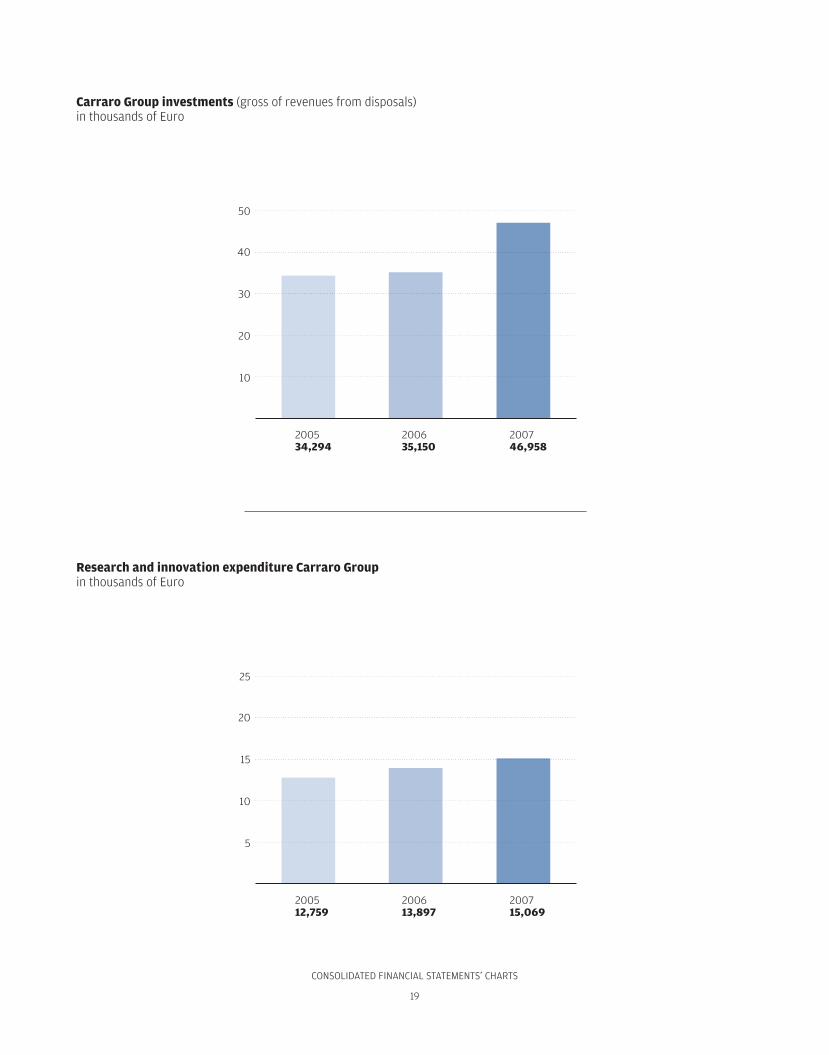
INVESTMENTS A total of 46.958 million Euro investments were made in 2007, compared to 35.150
million Euro in 2006, almost entirely aimed at expanding production capacity, includ-ing the new facility in China and the expansion of the Indian plant.
RESEARCH AND INNOVATIONResearch and innovation expenses, the purposes and applications of which are
commented upon a specific paragraph, remained high, coming to 15.069 million Euro in 2007, or 1.85% of sales, up by 8.43% on the 13.897 million Euro, or 2.08% of sales, posted in 2006.
NET FINANCIAL POSITION Net financial position (defined as the sum of accounts payable to banks, short
and medium/long-term bonds and loans, net of cash and equivalents, negotiable securities, and accounts receivable) showed net debt of 175.947 million Euro at 31 December 2007, up from the 131.300 million Euro in debt posted at 30 June 2007, and included the expenditure of 25 million Euro to acquire the equity investment in Minigears and the consolidation of the latter’s net financial debt of 16.482 million Euro.
Gearing (defined as the ratio of net financial position to equity) came to 117.30% at 31 December 2007, compared to 104.86% at 30 June 2007 and 110.23% at 31 December 2006, whereas the ratio of net financial position to ebitda stood at 2.69 (2.55 at 31 December 2006).

REPORT ON OPERATIONS
29
Analysis by business segment
DRIVELINESThe Drivelines BU posted an 11.28% increase in sales year-on-year. The year wit-
nessed strong growth of demand across all traditionally served markets: tractors and other farm equipment, construction equipment, mining equipment, material-mov-ing machines, etc. Demand remained high throughout the year and in all areas of the industrialized world. This trend, along with a general scarcity of components that affected the entire industry, clients and competitors alike, led to a sudden increase in the costs of production, procurement, and sales in the second half of the year and a considerable backlog of orders at year end.
Agricultural marketThe farm equipment segment posted exceptional growth in 2007, driven by ris-
ing world population and global prosperity and the ensuing increased demand for food. In addition, the use of corn, soybeans, and sugarcane to produce ethanol and biodiesel was on the rise. The production of agricultural foodstuffs rose consider-ably, without, however, being sufficient to satisfy demand. The prices of agricultural foodstuffs consequently remain high and contribute to maintaining the high de-mand for tractors and other farm equipment, and consequently axles and transmis-sions.
The use of four-wheel drive tractors is on the rise in emerging economies, result-ing in greater demand for axles, along with a trend towards technological change that is creating interesting opportunities in the farm transmission segment. De-mand grew very rapidly in the Usa, South America, Eastern Europe, India, China and Russia. Growth in Western Europe was more moderate, while reversing the structural downtrend shown in previous years, whereas the Middle East and Turkey were affected by political uncertainty in various regions.
In addition to the increased sales generated by the positive demand trend, in 2007 Carraro expanded its market penetration, winning important supply contracts in China, Eastern Europe, Russia, and the Middle East.
In 2008 projections call for further rises in South America, India, Eastern Eu-rope, and Russia and stability in Western Europe and the Usa.
Construction equipmentThis market also performed extremely well in 2007, with spikes in demand that
exceeded projections.The reasons for this state of affairs are also primarily to be sought in the increased
world population and the level of global prosperity, resulting in greater demand for housing, commercial and industrial buildings, and infrastructure, particularly in newly affluent countries, with the noteworthy exception of the Usa, where the mar-

REPORT ON OPERATIONS
30
ket showed the characteristics of what in retrospect appears a speculative bubble. Considerable effort was taken to satisfy the volume of demand, on some occasions to the detriment of the optimization of logistics and production.
In 2008 projections call for a downtrend in the U.S. market due the mortgage cri-sis and stability in Western Europe. In the rest of the world, we foresee an increase in demand on the order of 5%.
Mining equipmentThis market, which is becoming significant to the Drivelines Division, showed
moderate volumes but high value. The uptrend was constant and continues to be driven by the greater needed for minerals for industrial applications.
Material handling marketThe material handling market performed very well in 2007 due to the develop-
ment of emerging economies and the offshoring of production, which resulted in rapid expansion of the logistics segment. In 2008 the market will remain stable in Europe, decline in the United States, and expand in Eastern Europe and China.
The acquisition of an important new client in the premium segment will result in increased sales in 2008.
Planetary drives marketThe demand for gearboxes in 2007 remained very high, building on the trend
that began in 2006. The high demand for raw materials and energy drove the de-mand for construction and mining equipment throughout all of 2007. The high price of oil and continuing high demand for raw materials are projected to contin-ue to drive world demand for the entire supply industry throughout all of 2008.
Carraro’s growth in 2007 met the target of 22% despite difficulties in the area of procurement. Carraro, reaping the benefits of market growth, launched strategies to offshore production and expand production capacity, the results of which are foreseen to bring growth of 80% in 2008.
The escalator power-station segment remained stable in 2007 and is foreseen to continue this trend in 2008.
COMPONENTSIn 2007 the Group launched the Gear World project aimed at developing the
Components business by consolidating the Carraro Group’s current operations in the segment (Siap and Stm in Italy, Turbo Gears in India, and the gears division of Carraro Argentina) and integrating them with Minigears (three production facili-ties in Italy, the Usa and China), acquired at the end of July. The end result is a Group with a global presence and strong engineering skills in technologically rel-evant products and processes that will lay the foundation for the expansion of busi-
REPORT ON OPERATIONS
31
ness goals to areas of application and markets with high development potential. The Components business showed considerable growth in 2007 due to the sig-
nificant contribution to demand provided by the Carraro Group and all of its third-party clients.
The latter showed particularly relevant growth both in applications for CE and industrial markets and wind energy and provided confirmation of long-term growth rates and prospects exceeding those of traditional markets.
The client portfolio was also expanded by the addition of prestigious new ac-counts that will provide further future growth, primarily involving demand for high-quality, medium and large gears, for which the market of preference remains Northern Europe.
Effective from 1 August the Gear World consolidation area was expanded to include Minigears, which has paved the way for a significant presence in non-tra-ditional markets for the Group, such as Power Tools and professional Gardening, where Minigears has consolidated market leadership and continues to witness considerable demand, and strengthened Gear World’s presence in the automotive applications market as a tier-two supplier.
Also worthy of attention is the growth of Turbo Gears, the Indian gears facility, which continued to move in the planned direction, doubling sales with respect to 2006 and showing further prospects for strong growth.
VEHICLESIn 2007 the Vehicles BU posted a 14% increase in sales year-on-year.This sales growth is highly satisfactory considering that the market in question
(specialized tractors for orchards/vineyards and open fields of 50-100 horsepower) did not enjoy the same widespread growth as the higher-power product lines as it was effected by the stability or mild decline in several of the most important coun-tries in the Mediterranean basin, such as Spain and Italy. Market trends in Europe were not homogeneous. Several Northern European countries, driven by Germany, showed significant increases in demand, related in particular to the cultivation of crops for the biofuels business. Greece, which exploited government subsidies, was also particularly important for this segment.
The successful launch of the new line of open-field tractors for a new client, es-pecially in Central Northern Europe, allowed the BU to expand its client portfo-lio without cannibalizing its historical business and to increase its market share it countries with the most favourable trends. In the second part of the year this opera-tion was extended to several Asian countries, including Taiwan and Japan, for the first time in the history of the BU.
During the same period the Vehicles BU entered the Turkish market through commercial agreements that promise development in coming years.
The recent announcement of the launch of a new line of vineyard and orchard

REPORT ON OPERATIONS
32
tractors on the market will permit the division to achieve significant market share in the specialized vehicles segment. In 2008 the Vehicles BU consequently foresees fur-ther improvement in sales against the backdrop of a substantially stable market.
POWER CONTROLSFinancial year 2007 marked important developments in the power controls seg-
ment, which maintained and built on its growth prospects across various business areas and made power controls the business unit with the highest future growth rate.
Industrial drivesThe world industrial drive market is by and large a mature market. The only pos-
sible areas of development are those in which the industry is undergoing expansion or renovation, as for example, in the countries referred to by the acronym bric (Bra-zil, Russia, India and China).
From a technological standpoint, the market does not require specific innova-tions. The key to success is rather the capacity to provide good service.
In this respect, the BU succeeded in reacting to initial shortcomings by empha-sizing the reorganization of its commercial and distribution network in Italy and abroad and achieved a 20% increase in sales in the drives segment.
Nonetheless, plans for the future include the expansion of the product line to embrace the high-power segment and the acquisition of new areas of distribution through new branches in Russia and Brazil and a commercial agreement in China.
Energy managementThe renewable energy management market is undergoing constant, rapid devel-
opment.In the wind power generation segment, the growth rate has remained largely sta-
ble over the past few years at 10-15%, whereas growth of photovoltaic generators has been exponential. In some areas, Italy and Spain in particular, growth rates exceeded 100% in 2007.
In this scenario Elettronica Santerno achieved a 150% increase in sales of pho-tovoltaic inverters year-on-year due to the reorganization and rationalization of its product line and a broader-based distribution of products, involving in particular a distributor for the Spanish market.
Prospects for the next three-year period remain very good.
TractionIn this area of application in 2007 Elettronica Santerno engaged in preliminary
activity aimed at developing a new hybrid platform.

REPORT ON OPERATIONS
33
The following table breaks sales down by market segment:
SALES SALES TO THIRD PARTIES INFRA-GROUP SALES2007 2006 % Diff. 2007 2006 % Diff. 2007 2006 % Diff.
Drivelines 654,113 611,094 + 7.04 599,382 538,627 + 11.28 54,731 72,467 – 24.47
Gears & Components
180,177 100,769 + 78.80 91,265* 35,485 + 157.19 88,912 65,284 + 36.19
Vehicles 93,214 81,765 + 14.00 93,152 81,645 + 14.09 62 120 – 48.33
Power Controls 30,203 11,426 + 164.34 29,935 11,426 + 161.99 268 – –
All segments 957,707 805,054 + 18.96 813,734 667,183 + 21.97 143,973 137,871 – 4.43
Eliminations and unallocated assets
– 143,973 – 137,871 + 4.43 – – – – 143,973 – 137,871 + 4.43
Consolidated total
813,734 667,183 + 21.97 813,734 667,183 + 21.97 – – –
* Excluding the sales posted by MiniGears and considering Stm Srl as consolidated on a line-by-line basis for all of 2006 instead of according to the net equity method for the first ten months of the year, growth comes to 40.32%.
The following table breaks down sales by geographical area:
GEOGRAPHICAL AREA 2007 % 2006 % % ’07 – ’06
Germany 139,956 17.20 113,479 17.01 + 23.33
North America 127,061 15.61 149,921 22.47 – 15.25
United Kingdom 83,776 10.30 56,301 8.44 + 48.80
France 55,139 6.78 62,540 9.37 – 11.83
South America 41,929 5.15 27,482 4.12 + 52.57
India 32,687 4.02 32,430 4.86 + 0.79
China 25,513 3.14 15,428 2.31 + 65.37
Poland 22,564 2.77 18,648 2.80 + 21.00
Turkey 19,072 2.34 12,849 1.93 + 48.43
Other EU Countries 72,961 8.97 48,063 7.20 + 51.80
Other non-EU Countries 17,037 2.09 11,029 1.65 + 54.47
Total sales outside of Italy 637,695 78.37 548,170 82.16 + 16.33
Italy 176,039 21.63 119,013 17.84 + 47.92
Total 813,734 100.00 667,183 100.00 + 21.97
of which
Total EU sales 550,435 67.64 417,992 62.65 + 31.69
Total non-EU sales 263,299 32.36 249,191 37.35 + 5.66
Figu
res
in E
uro/
1.0
00
Figu
res
in E
uro/
1.0
00

REPORT ON OPERATIONS
34
PERSONNELThe Group’s workforce (including limited contracts, apprentices, and temporary
staff ) came to 4,036 resources at 31 December 2007, compared to 2,857 at 31 De-cember 2006. Of this total, 63 are classified as executives, 983 as middle managers and white-collar employees, 2,946 as blue-collar employees, and 44 as apprentices.
The total year-on-year increase of 1,179 resources was due to the following: the acquisition of the Minigears Group; the expansion of operations, and consequently, of the workforces of Carraro China, Carraro India, Turbo Gears India, and Elettron-ica Santerno; and the reinforcement of the Engineering Group at the Indian facil-ity, the Purchasing Team at the Chinese office, the R&D and Sales Departments of Elettronica Santerno, and the commercial teams in China, the Usa, and Europe.
TurnoverThe personnel turnover rate (outgoing personnel/incoming personnel), due to
the foregoing factors, was not significant, inasmuch as the considerable addition of new resources (even on a like-for-like consolidation area) due to the start-up of new operations significantly exceeded the number of outgoing staff members.
Human resources developmentA total of 18,412 man-hours of training were provided in 2007. Training focused
in particular on quality-control, organization, product development management, market management and development, leadership styles, the assessment of emerg-ing markets and industrial scenarios, and specialized professional skills.
Development Centre activities also moved forward. The programme, which was launched at the Group’s Italian facilities in 2006, involved the participation of more than 105 staff members, primarily middle managers and young white-collar employ-ees, and aimed to reveal and assess participants’ management skills and abilities, deemed instrumental to the Company’s growth. The results, in addition to confirm-ing that the staff members involved are more than adequate as a whole, allowed the identification and/or confirmation of “key people” for which to adopt ad hoc management and development policies, prepare training and growth programmes required to fill any gaps (scheduled to begin in May 2008) and reinforce the skills and abilities required for professional and personal development.
External consultants with a worldwide presence (the Hay Group) were brought in to initiate activities leading up to the launch of the Development Centre at the Group’s international facilities. Activities for staff members of the German and In-dian operations were launched as early as the first quarter of 2008 and the following months will witness the involvement of all countries in which the Group operates. At the end of this process, the Group will benefit from a more analytical assessment of the skills of a significant number of its international staff in order to bring the best possible resources to bear on the development on company projects.

REPORT ON OPERATIONS
35
RESEARCH AND INNOVATIONIn continuity with the projects developed in 2006, 2007 also witnessed intensive
product development activity in the area of innovative technology and systems inte-gration, with a particular focus on the concepts of energy efficiency, respect for the environment, and the use of renewable energy sources.
The constant expansion of areas of applications and product platforms and the increasing size of the Carraro Group required that even greater attention be devoted to the methods and organization of product development processes, thereby per-mitting the Group make even more significant use of the investments in the product life cycle over the last two years. In the area of management in particular, emphasis should be placed on the consolidation of the presence and the role of Carraro Tech-nologies India in the Group’s engineering operations both in terms of skills and the volume of activities carried out.
In the axles segment, for both agricultural and industrial applications, in addition to rationalizing the product line, a significant technological effort was made to en-able production in “best-cost” countries.
In the automatic transmission segment (for both agricultural and CE applica-tions), the roll-out of production of the new electronic platform consolidated the Group’s capacity to offer solutions with a high degree of integration and flexibility of application.
The consolidation of skills in the control systems segment also led to the achieve-ment of important goals in terms of product rationalization and optimization as well as the development of performance improvements, particularly in sensors and command hydraulics for agricultural and industrial transmissions.
Also in the industrial transmissions segment, the functionality and reliability is-sues of the new constant variation technology, VaryT, were perfected, bringing im-portant results in terms of performance, comfort and reduced consumption.
The electronically controlled robotization technique was consolidated as a com-petitive alternative to power-shift systems and was successfully applied to transmis-sions for back-hoe loaders and hydrostatic compact wheel loaders.
In the field of tractors for special applications development of the full range of vehicles compliant with new emissions standards continued and the first prototypes for functional vetting were created. In qualitative terms, there were clear benefits from activities in the area of knowledge management and the process improvement launched over the past few years.
By leveraging synergies between the Drivelines and Power Controls Business Units the Group developed a new range of low-cost inverters for low-voltage elec-trical transmission, particularly intended for Material Handling applications. The control platform of this product line was created along with the new line of inverters for photovoltaic applications to satisfy needs for modularity and standardization. In the area of sustainable mobility development, the process of defining and designing a new line of hybrid electric power trains was initiated. These power trains were

REPORT ON OPERATIONS
36
initially geared towards the urban and commercial transport industry but are also technologically transversal to off-highway vehicles.
Lastly, in the renewable energy field, in addition to work in progress to complete the line of photovoltaic inverters, development of new static converters for wind-power generators has begun.
Also in this sector, and in synergy with the foregoing, development of a family of reducers for pitch and yaw control for wind-power applications, already partly ear-marked for the first clients, was initiated.
Significant events in 2007
During 2007, the Carraro Group developed and completed an important project to design, organize and exploit the Components Business Unit, which was launched through the formation of the company Gear World srl on 27 April 2007.
On 10 May 2007 Carraro spa contributed 100% of the equity investment in Siap spa and 20.01% of the equity investment in Carraro Argentina sa for the future demerger of the gears division to Gear World.
On 29 May 2007 Carraro International sa contributed 99.9998% of the equity investment in Turbo Gears India Pvt. Ltd. to Gear World.
On 19 July 2007 the legal status of Gear World was transformed from a limited-liability company (srl) to a joint-stock company (spa) and a share capital issue of up to 35,084,397 Euro, the entirety of which was intended for subscription by Inter-banca spa, was approved. At the conclusion of the subscription of the share capital issue by Interbanca spa, the latter held 26.18% of the share capital of Gear World spa, whereas the remaining 74.82% was held by the Carraro Group, in particular by Carraro spa (45.60%) and Carraro International sa (28.22%).
On 30 July 2007 Gear World spa finalized the purchase of 100% of the shares of MG Holding spa, which in turn holds 100% of the shares of Minigears spa, a world leader in the production of high-quality gears, for the price of 50,000,000 Euro. In addition to the Padua production facility, the Minigears Group operates facilities in the United States (Virginia Beach) and China (Suzhou).
This acquisition is of strategic importance in that it permits the exploitation of the skills that the Group has built in the area of the production of high-quality gears, completing its worldwide presence and opening up prospects in new target mar-kets.
On 27 July 2007 Elettronica Santerno spa acquired 100% of the shares of the Russian company Zao Santerno from Fincasalfiumanese spa. Zao Santerno is spe-cialized in the distribution and marketing of inverters for industrial and photovol-taic applications.

REPORT ON OPERATIONS
37
On 17 October 2007 the new production facility of the recently formed Carraro China Drive Systems Co. Ltd. was inaugurated in Qingdao. The facility, which re-quired an investment of 15 million Euro, is intended to manufacture transmission systems for stationary applications, integrated transmissions for forklifts and mate-rial handling, axles for farm tractors, and earth-moving machines.
Performance of subsidiaries
The following section contains the most significant data pertaining to companies belonging to the Carraro Group.
CARRARO SPAThe Parent Company earned sales revenue of 456.024 million Euro, up by 2.68%
from the figure of 444.105 million Euro recorded in 2006. The decline in sales of agricultural axles (-11.82%) and construction equipment
axles (-3.31%) was more than offset by the growth in sales of tractors (+11.91%), axles for forklifts (+38.08%), fast axles (+37.26%) and industrial transmissions (+7.41%).
Exports represent 80.77% of sales revenue, compared to 85.14% in 2006. The fol-lowing markets were responsible for the bulk of sales: 14.66% in the United States of America (23.2% at 31 December 2006) and 55.49% in the European Union (ex-cluding Italy; 52.91% at 31 December 2006).
Ebitda came to 18.282 million Euro, or 4.01% of sales (19.665 million Euro, or 4.43% of sales in 2006) and ebit stood at 10.337 million Euro, or 2.27% of sales (11.557 million Euro, or 2.6% of sales at December 2006). Both were down in both absolute and percent terms due to the required increased in fixed costs due to devel-opment activities and the role of Parent Company played by Carraro spa.
Net financial expenses came to 4.648 million Euro, or 1.02% of sales (3.213 mil-lion Euro, or 0.72% sales in 2006), up by 44.66% due to the greater average debt for the year and the rise in the cost of money.
Net exchange differences, including hedging costs, came to a loss of 71 thousand Euro, compared to a gain of 129 thousand Euro in 2006.
Income from equity investments came to 6.400 million Euro, compared to 4.119 million Euro in 2006, and consists of dividends paid by the subsidiary Siap spa dur-ing the year.
After 4.387 million Euro in current and deferred taxes, financial year 2007 ended with net income of 7.631 million Euro, or 1.67% of sales, compared to net income of 8.471 million Euro in 2006, or 1.91% of sales.
REPORT ON OPERATIONS
38
In 2007 depreciation and amortization came to 7.945 million Euro (8.358 million Euro in 2006), resulting in cash flow of 15.576 million Euro, compared to 16.829 million Euro at 31 December 2006.
Gross investments stood at 8.643 million Euro in 2007, down from 11.336 million Euro in 2006. It should be noted that these investments included the purchase of the real-estate unit serving as the offices of the Replacement Parts Division, for a total price of 4.694 million Euro.
Net financial position amounted to net debt of 47.209 million Euro, marking an improvement over the figure of 54.288 million Euro in net debt at 30 June 2007 and the 69.182 million Euro in net debt at 31 December 2006 due to prudent work-ing capital management.
The workforce, including temporary employees, came to 1,107 resources at 31 De-cember 2007 (of which 702 in Campodarsego, 247 at the Rovigo facility, and 158 at the Gorizia facility) compared to 1,082 resources at 30 June 2007 (1,046 at Decem-ber 2006, of which 665 in Campodarsego, 238 at the Rovigo facility, 3 in Capriate, and 140 at the Gorizia facility).
A.E. SRL (ASSALI EMILIANI)Sales came to 29.983 million Euro at 31 December 2007, down by 21.30% from
the figure of 38.097 million Euro at December 2006 due to the decline in infra-group sales. In response to this significant drop in volume, the company took im-portant initiatives to recover production efficiency in order to minimize the negative impact on the income statement.
Ebitda came to 1.142 million Euro (3.81% of sales), up by 28.89% on the figure of 886 thousand Euro recorded in 2006 (2.33% of sales).
Ebit came to 1.003 million Euro (3.35% of sales), up by 39.50% on the figure of 719 thousand Euro recorded in 2006 (1.89% of sales).
Net income stood at 692 thousand Euro (2.31% of sales), up by 57.63% on the figure of 439 thousand Euro at 31 December 2006 (1.15% of sales).
After depreciation and amortization of 139 thousand Euro, cash flow came to 831 thousand Euro (606 thousand Euro in 2006).
A total of 57 thousand Euro in investments were made in production machinery and equipment.
Net financial position showed net debt of 2.754 million Euro, up from net debt of 5.009 million Euro at June 2007 and 2.908 million Euro at December 2006 due to action to improve working capital, particularly accounts receivable, during the last two months of the year.
The workforce stood at 63 resources at 31 December 2007 (65 resources at June 2007 and 61 at 31 December 2006).

REPORT ON OPERATIONS
39
FABRYKA OSI NAPEDOWYCH SAThe Polish subsidiary, due to strong demand from third parties and the Group,
posted sales of 71.384 million Euro, almost double (+81.09%) those recorded at December 2006 (39.420 million Euro).
Ebitda stood at 4.061 million Euro at 31 December 2007, or 5.69% of sales, com-pared to 1.590 million Euro(4.03% of sales) at 31 December 2006 and ebit came to 2.616 million Euro (3.66% of sales), up from 203 thousand Euro (0.51% of sales) at 31 December 2006.
Although the comparison with 2006 remains extremely positive, it should be noted that the company had difficulty in the second quarter of the year in sustain-ing growth due to procurement problems caused by several suppliers, resulting in the need to incur extraordinary air transport costs, which were partially offset by charge-backs of these costs. Net of these events, the company would certainly have been in a position to post better results.
Net financial expenses totalled 1.089 million Euro, or 1.53% of sales (508 thou-sand Euro or 1.29% of sales in 2006).
Net exchange differences, including hedging costs, came to a gain of 93 thousand Euro, compared to a loss of 57 thousand Euro in 2006.
The year ended with net income of 1.599 million Euro, compared to a net loss of 329 thousand Euro in 2006.
Depreciation and amortization stood at 1.445 million Euro (1.387 million Euro in 2006) and cash flow came to 3.044 million (1.058 million at 31 December 2006).
Investments amounted to 3.170 million Euro at 31 December 2007 (4.054 mil-lion Euro in 2006) and were intended to expand production capacity.
Net financial position at 31 December 2007 came to net debt of 7.334 million Euro due to the collection of a large payment on 31 December 2007. The figure showed significant improvement over that at June 2007 (15.643 million Euro, in line with the average for the year) as well as the 12.634 million Euro posted at 31 December 2006.
The workforce totalled 190 resources at 31 December 2007 (187 at 30 June 2007 and 188 at 31 December 2006).
CARRARO DEUTSCHLAND GMBHThe company serves as an investment holding company and holds a 100% stake
in O&K Antriebstechnik Gmbh.At 31 December 2007 the income statement showed a net loss of 47 thousand
Euro, down from 48 thousand Euro in 2006. Net financial position came to net debt of 255 thousand Euro, compared to 260
thousand Euro in June 2007 and 231 thousand Euro at 31 December 2006.

REPORT ON OPERATIONS
40
O&K ANTRIEBSTECHNIK GMBHAs already reported during the year, the company is in the midst of a reorganiza-
tion process aimed at redesigning the product mix and industrial structures. Al-though the last few months have witnessed improved profitability, this process will generate more significant effects in the year to come.
The German subsidiary’s sales stood at 64.586 million Euro, substantially in line with the figure of 64.870 million Euro recorded at 31 December 2006.
Ebitda came to 1.753 million Euro (2.71% of sales), compared to 1.526 million Euro at 31 December 2006 (2.35% of sales). Ebit was 1.067 million Euro, compared to 881 thousand Euro in 2006.
Net financial expenses stood at 788 thousand Euro at 31 December 2007, or 1.22% of sales, compared to 502 thousand Euro, or 0.77% of sales, in 2006. The increase was due to the greater average debt in 2007 than in 2006.
The reporting year ended with net income of 458 thousand Euro, 0.71% of sales, compared to 250 thousand Euro, or 0.39% of sales, in 2006.
After 686 thousand Euro in depreciation and amortization (645 thousand Euro in 2006), cash flow came to 1.144 million (895 thousand Euro in 2006).
A total of 1.195 million Euro in investments were made (880 thousand Euro in 2006) in reorganization and industrial efficiency.
Net financial position came to net debt of 9.570 million Euro at 31 December 2007, up from the 7.413 million Euro at 30 June 2007 and the 3.456 million Euro at 31 December 2006 due to an increase in working capital, primarily due to the rise in inventory due to procurement issues.
The company’s workforce came to 200 resources at 31 December 2007 (199 at 30 June 2007 and 188 at 31 December 2006).
CARRARO NORTH AMERICA INC.In 2007 Carraro North America posted 179 thousand Euro in sales, compared to
65 thousand Euro in 2006. The company showed an operating loss of 242 thousand Euro (compared to a loss of 159 thousand Euro at 31 December 2006).
After 131 thousand Euro in depreciation and amortization (500 thousand Euro in 2006), the company posted a negative cash flow of 111 thousand Euro in 2007, compared to a positive cash flow of 622 thousand Euro in 2006.
Net financial position came to net cash at hand of 87 thousand Euro, compared to 192 thousand Euro at 30 June 2007 and 81 thousand Euro at 31 December 2006.
The workforce totalled five resources at the end of 2007 (five in June 2007 and three in December 2006).

REPORT ON OPERATIONS
41
CARRARO ARGENTINA SACarraro Argentina continued to show increasing sales volumes against the back-
drop of greater demand from the North American and European agricultural mar-kets.
Nonetheless, earnings were negatively affected by some procurement issues that led to greater purchasing and logistics costs and a series of production inefficien-cies.
Sales came to 63.258 million Euro at 31 December 2007, up by 7.72% on the 58.724 million Euro recorded at 31 December 2006.
Ebitda came to 5.673 million Euro (8.97% of sales), down by 13.84% on the figure of 6.584 million Euro recorded in 2006 (11.21% of sales). Ebit stood at 3.182 million Euro (5.03% of sales), down by 20.73% on the figure of 4.014 million Euro recorded in 2006 (6.84% of sales).
Net financial expenses came to 125 thousand Euro, or 0.20% of sales, compared to 84 thousand Euro, or 0.14% of sales, in 2006.
Net exchange differences, including hedging costs, came to a gain of 484 thou-sand Euro at 31 December 2007, compared to a gain of 568 thousand Euro in at 31 December 2006.
After taxes of 1.470 million Euro, compared to 1.406 million Euro in 2006, net income came to 2.071 million Euro, down by 33.02% on the net income of 3.092 million Euro recorded at 31 December 2006.
After depreciation and amortization of 2.491 million Euro (2.570 million Euro in 2006), the company posted a positive cash flow of 4.562 million Euro (5.662 million Euro at 31 December 2006).
A total of 1.843 million Euro in investments were made, primarily in maintaining production capacity (2.497 million Euro at 31 December 2006).
Net financial position came to net cash at hand of 3.037 million Euro at 31 De-cember 2007, a considerable improvement over the 1.722 million Euro in net cash at hand on 30 June (1.757 million Euro in net cash at hand at 31 December 2006).
The workforce stood at 402 resources at 31 December 2007 (387 resources at 30 June 2007 and 356 at 31 December 2006).
REPORT ON OPERATIONS
42
CARRARO INDIA LTD.Due to demand from the local market and the transfer of production initiated
during the previous year, sales were up by 10.96% to 43.153 million Euro, compared to 38.889 million Euro at 31 December 2006.
Ebitda was up by 9.84% to 5.191 million Euro (12.03% of sales) compared to 4.726 million Euro (12.15% of sales) in 2006. Ebit stood at 3.939 million Euro, up by 4.98% from the 3.752 million Euro in 2006 (9.65% of sales).
Net financial expenses came to 997 thousand Euro, or 2.31% of sales (736 thou-sand Euro, or 1.89% of sales at 31 December 2006) and net exchange differences and hedging expenses came to a gain of 445 thousand Euro (compared to a loss of 1.115 million Euro at 31 December 2006).
After 576 thousand Euro in deferred tax liabilities, the year ended with net in-come of 2.811 million Euro, double the net income of 1.397 million Euro recorded at 31 December 2006.
Depreciation and amortization stood at 1.252 million Euro (974 thousand Euro at 31 December 2006), resulting in cash flow of 4.063 million Euro (2.371 million Euro at 31 December 2006).
A total of 4.206 million Euro in investments were made (890 thousand Euro at 31 December 2006), primarily aimed at enhancing production capacity and expanding the industrial facility.
Net financial position came to net debt of 12.261 million Euro, substantially un-changed from the 12.062 Euro million recorded at 30 June 2007 but up from the debt of 10.124 million Euro posted at 31 December 2006.
The workforce stood at 216 resources at 31 December 2007 (205 resources at 30 June 2007 and 192 at the end of December 2006).
CARRARO QINGDAO DRIVE SYSTEM CO. LTD.Sales were up by 73.43% at 31 December 2007 to 13.318 million Euro (7.679 mil-
lion Euro at 31 December 2006).Ebitda came to 1.745 million Euro (13.10% of sales), marking an 87.43% increase
in absolute value on the 931 thousand Euro recorded in 2006 (12.12% of sales), but a decrease in percentage terms due to increased transport costs and the required rise in structural costs.
For these same reasons, ebit rose to 1.291 million Euro (9.69% of sales), com-pared to the 824 thousand Euro recorded at 31 December 2006 (10.73% of sales).
Net income came to 1.154 million Euro (8.66% of sales), compared to 714 thou-sand Euro at 31 December 2006 (9.30% of sales). After depreciation and amortiza-tion of 454 thousand Euro, cash flow came to 1.608 million Euro, compared to 820 thousand Euro at 31 December 2006.
A total of 798 thousand Euro in investments were made to increase production capacity. Net financial position stood at net debt of 911 thousand Euro (compared

REPORT ON OPERATIONS
43
to net cash at hand of 464 thousand Euro in June 2007 and 201 thousand Euro at 31 December 2006).
The workforce came to 139 resources at 31 December 2007 (55 in June 2007 and 44 in December 2006).
CARRARO QINGDAO TRADING LTD.Sales climbed to 5.148 million at 31 December 2007 (1.010 million Euro in 2006).
Ebitda stood at 48 thousand Euro and net income was 22 thousand Euro.
CARRARO CHINA DRIVE SYSTEMS LTD.The company, which was formed on 19 January 2007, inaugurated a new axle
production facility in October and launched production in November.The figures presented are therefore to be considered as referring to the company’s
start-up phase.The company posted sales of 294 thousand Euro at 31 December 2007, a negative
ebitda of 573 thousand Euro, a negative ebit of 677 thousand Euro, and a net loss of 699 thousand Euro. The establishment of the new facility required 10.775 million Euro in investments, which were funded by share capital increases paid in by the parent company, Carraro International.
ELETTRONICA SANTERNO SPAThe company became a part of the Group on 1 July 2006. Consequently, no com-
parative figures are presented.Sales in 2007 came to 29.902 million Euro, 73.8% of which were posted on the
Italian market (65% in 2006) and 26.2% outside of Italy (35% in 2006), chiefly Australia (4.7%) and Brazil (3.8%).
Of total sales, 74% were posted in the industrial segment and 26% in the renew-able energy segment. The latter substantially includes the sales of products intend-ed for applications in alternative energy generation (solar and photovoltaic power).
Ebitda came to 6.190 million Euro (20.70% of sales), ebit stood at 5.975 million Euro (19.98% of sales), and net income was 3.339 million Euro (11.17% of sales).
After depreciation and amortization of 215 thousand Euro, cash flow stood at 3.554 million Euro. A total of 1.354 million Euro in investments were made in in-creasing production capacity, capitalizing research and development products, and software (1.076 million Euro in 2006). Net financial position came to net debt of 4.328 million Euro, compared to 4.912 million Euro in June 2007 (3.714 million Euro at 31 December 2006).
The workforce amounted to 85 resources, compared to 78 resources in June 2007 and 59 resources in December 2006.
REPORT ON OPERATIONS
44
GEAR WORLD SPAThe company, which was created in May 2007 with the aim of developing and
exploiting the Components business, incorporated all companies operating in the segment. As planned, the company has already executed its first acquisition, the Minigears Group.
The strategic force of this project is in line with the development programmes of the Carraro Group, which also aim to exploit the business skills and growth poten-tial of various markets.
The financial statements for the year ended on 31 December 2007 showed a net loss of 473 thousand Euro, which includes start-up costs, and net financial position stood at net debt of 12.810 million Euro.
SIAP SPAThe reporting year was positive for Siap and for companies in the gears/compo-
nents segment in general. Demand from both the Group and third parties remained extremely strong.
Sales came to 110.149 million Euro at 31 December 2007, up by 19.81% on the 91.936 million Euro recorded in 2006.
Ebitda stood at 13.579 million Euro (12.33% of sales), up by 3.67% on the figure of 13.098 million Euro recorded at 31 December 2006 (14.25% of sales). Ebit was 7.015 million Euro (6.37% of sales), up by 3.25% on the figure of 6.794 million Euro recorded in 2006 (7.39% of sales).
Earnings, despite the increase in absolute value, were down slightly in percent terms on 2006. The reasons for this state of affairs were to be sought in the in-creased costs of raw materials, which were not entirely reflected in sales prices, and the swift rise in volumes, which was not fully absorbed by installed production ca-pacity and consequently required greater recourse to outsourcing.
Net financial expenses totalled 1.140 million Euro, or 1.03% of sales, compared to 1.099 million Euro, or 1.20% of sales, in 2006.
After 3.004 million Euro taxes, financial year 2007 ended with net income of 3.030 million Euro, or 2.75% of sales, compared to net income of 2.862 million Euro in 2006, or 3.11% of sales, marking an increase of 5.87%.
After depreciation and amortization of 6.564 million Euro (6.304 million Euro in 2006), cash flow was 9.594 million Euro (9.166 million Euro at 31 December 2006).
A total of 8.529 million Euro in investments were made (8.702 million Euro at 31 December 2006), intended exclusively to increase production capacity.
Net financial position stood at net debt of 26.243 million Euro, which includes the payment of 6.400 million Euro in dividends in the second half of the year, up from the 16.400 million Euro in net debt recorded at 30 June 2007 (19.889 million Euro in debt at 31 December 2006).
REPORT ON OPERATIONS
45
The workforce amounted to 482 resources in December 2007 (of which 370 were employed in the Maniago facility and 112 at the Poggiofiorito facility), compared to 491 in June 2007 and 429 at 31 December 2006 (of which 338 were employed in the Maniago facility and 91 at the Poggiofiorito facility).
STM SRLThe company has been consolidated line-by-line since 1 November 2006. In
the interest of a more accurate comparison with 2007, the 2006 figures refer to a twelve-month period.
Sales came to 23.653 million Euro at 31 December 2007, up by 22.45% on the 19,317 million Euro recorded in 2006.
Ebitda stood at 3.970 million Euro (16.78% of sales) and was up by 26.39% on the 3.141 million Euro recorded in 2006 (16.26% of sales). Ebit was 3.170 million Euro (13.40% of sales), up by 31.15% on the 2.417 million Euro (12.51% of sales) posted in 2006.
Net financial expenses amounted to 227 thousand Euro, or 0.96% of sales, up by 50.33% on the 151 thousand Euro, or 0.78% of sales, in 2006.
After taxes of 1.082 million Euro (1.013 million Euro in 2006), the year ended with net income of 1.861 million Euro (7.87% of sales), up by 48.52% on the net income of 1.253 million Euro (6.49% of sales) in 2006.
After depreciation and amortization of 800 thousand Euro (725 thousand Euro in 2006), cash flow was 2.661 million Euro (1.978 million Euro at 31 December 2006).
A total of 841 thousand Euro in investments were made, down from 1.004 million Euro in 2006.
Net financial position came to net debt of 4.697 million Euro, up from net debt of 4.111 million Euro in June 2007 and 3.042 million Euro at 31 December 2006.
The workforce stood at 101 resources at 31 December 2007 (103 resources in June 2007 and 95 at 31 December 2006).
TURBO GEARS INDIA LTD.The company gradually became fully operational in 2006 and the 2007 compara-
tive figures therefore reflect a start-up scenario.Sales came to 12.572 million Euro at 31 December 2007, more than twice the
5.972 million Euro recorded in 2006. Ebitda was 2.194 million Euro (17.45% of sales), compared to 440 thousand Euro at 31 December 2006 (7.37% of sales). Ebit stood at 1.389 million Euro (11.05%) of sales, compared to a negative 69 thousand Euro in 2006.
Net financial expenses came to 741 thousand Euro, or 5.89% of sales, compared to 395 thousand Euro, or 6.61% of sales, at 31 December 2006.
REPORT ON OPERATIONS
46
The company ended financial year 2007 with net income of 610 thousand Euro (4.85% of sales) compared to a loss of 651 thousand Euro at 31 December 2006.
A total of 2.448 million Euro in investments were made during the year, all of which were aimed at increasing production capacity, marking a decrease on the figure of 3.741 million Euro posted at 31 December 2006.
Net financial position amounted to net debt of 10.493 million Euro, up on the 7.153 million Euro recorded in June 2007 and the 6.429 million Euro reported in December 2006 due to the rise in working capital generated by greater sales and investments.
The workforce stood at 292 resources at 31 December 2007 (215 resources in June 2007 and 180 at 31 December 2006).
MINIGEARS SPAThe company was acquired by the Carraro Group on 30 July 2007. From August to December 2007, sales totalled 22.713 million Euro, ebitda came
to 2.554 million (11.24% of sales), and ebit amounted to 444 thousand Euro (1.95% of sales).
Net financial expenses came to 214 thousand Euro, whereas exchange differences and hedging expenses stood at a loss of 122 thousand Euro.
After recognizing 1.022 million Euro in taxes, the period from August to Decem-ber ended with net income of 1.130 million Euro, equivalent to 4.98% of sales.
Depreciation and amortization of 2.110 million Euro generated cash flow of 3.240 million Euro.
Total investments of 1.525 million Euro were chiefly related to increasing produc-tion capacity.
Net financial position came to net debt of 10.319 million Euro.The workforce consisted of 379 resources at 31 December 2007.
MG HOLDING SPAThis equity investment holding company’s sole holding is control of Minigears
spa. The company resolved and launched a plan for a merger involving Minigears spa.
The company posted a net loss of 399 thousand Euro at 31 December 2007.Net financial position came to a net debt of 12.730 million Euro used to acquire
control of Minigears spa.
REPORT ON OPERATIONS
47
MINIGEARS SUZHOU CO. LTD.In the last five months of 2007 this Chinese subsidiary of Minigears spa posted
sales of 4.772 million, ebitda of 657 thousand Euro (13.77% of sales) and ebit of 316 thousand Euro (6.62% of sales). Financial expenses stood at 85 thousand Euro, net income came to 343 thousand Euro, and net financial position amounted to net debt of 2.702 million Euro.
MINIGEARS VIRGINIA BEACH In the last five months of 2007 this U.S. subsidiary of Minigears Spa posted sales
of 5.851 million Euro, ebitda of 332 thousand Euro (5.67% of sales) and a negative ebit of 33 thousand Euro. Financial expenses stood at 110 thousand Euro, net in-come came to 343 thousand Euro, and net financial position amounted to net debt of 3.644 million Euro.
CARRARO INTERNATIONAL SAIn line with its role as holding company for the Group’s foreign equity invest-
ments, Carraro International subscribed the share capital issues of Turbo Gears In-dia Pvt. Ltd. and Carraro China Drive System Co. Ltd. and also participated in the reorganization of the Components group by subscribing the share capital issue of Gear World Spa on 29 May 2007 by contributing its equity investment in Turbo Gears India Pvt. Ltd.
On 13 June 2007 the company, with the aim of strengthening commercial opera-tions, completed the process of forming a branch office in Switzerland (Lugano), the primary object of which is the marketing of products for the mechanics and electronics industries and the provision of commercial services.
In 2007 the company posted sales of 1.272 million Euro and it ended the year with net income of 1.052 million Euro. Net financial position stood at net debt of 37.589 million Euro (35.500 million Euro at 30 June 2007 and 29.539 million Euro at 31 December 2006).
CARRARO FINANCE LTD.The company’s registered office is in Dublin, Ireland, and its purpose is to support
its parent company, Carraro International, in undertaking international financing and treasury activity to benefit the Group.
The financial statements for the year ended on 31 December 2007 showed a net loss of 3 thousand Euro. Other significant items include 28 million Euro in financial receivables.

REPORT ON OPERATIONS
48
CARRARO TECHNOLOGIES INDIA LTD.No 2006 comparative data are provided inasmuch as the company began to oper-
ate in July 2006.The company engages in design, research, and development for the Group.It ended the year with sales revenues of 786 thousand Euro, ebitda of 197 thou-
sand Euro (25.06% of sales), ebit of 98 thousand Euro (12.47% of sales) and net income of 20 thousand Euro (compared to a loss of 82 thousand Euro in 2006).
Net financial position amounted to net cash at hand of 20 thousand Euro (133 thousand Euro at 31 December 2006).
The company employs 41 engineers that provide support to all of the Carraro Group’s engineering facilities.
Share performance
In 2007 Carraro’s shares continued to show an upwards trend that was sharper during the first part of the year and much flatter from August to December (in line with general stock market trends).
The official average price for 2007 was 7.218 Euro with a minimum official quo-tation of 4.130 Euro on 8 January and a maximum quotation of 9.449 Euro on 16 July.
In the first quarter of 2008 the Company’s shares were down sharply in line with the stock market at large, particularly small caps, falling from the maximum price for the year of 6.865 Euro on the first day of trading, 2 January 2008, to a low of 4.435 Euro on 22 January 2008, and then beginning to rise once more. The average price for the period to 17 March is 5.663 Euro.
REPORT ON OPERATIONS
49
Events subsequent to year end
On 13 February 2008 the Provincial Directorate of Legal Persons of Buenos Ai-res, Argentina formally approved and registered the plan for the non-proportional demerger of Carraro Argentina sa. The demerger resulted in the formation of South America Gears sa, the majority shareholder in which is Gear World spa, and which will engage in the manufacturing and marketing of precision gears for the South American market.
On 14 February 2008 Carraro North America Inc. completed the disposal of the Calhoun (GA) production facility for the price of Usd 5.9 million Euro.
On 21 February 2008 the Board of Directors of Carraro spa authorized a one-year extension of the lease agreement entered into with Agritalia spa governing the lease of the business engaged in the development, assembly and distribution of farm trac-tors operating out of the Rovigo facility.
Business outlook and projections for 2008
A review of the portfolio provides confirmation of the positive performance of all of the main target markets.
The Drivelines and Vehicles Business Units continued to show positive growth prospects in both the agriculture and construction equipment segments, particular-ly in emerging geographical areas such as Eastern Europe, Russia, South America, India and China.
Equally positive signs of growth may be seen in the Components area, both in traditional sectors and new market segments with high potential (wind-power gen-erators), as well as the Power Controls Business Unit, where the applications mar-ket remains strong both in terms of industrial applications and renewable energy.
Within this scenario, there continue to be critical issues pertaining to procure-ment inasmuch as there is tension surrounding the costs of raw materials and the production capacity on the market.
The Group will continue to handle this issue with great care, as it can count on a global production platform and global sourcing.
On the basis of these indications, despite a world macroeconomic scenario that shows signs of deterioration, we believe that the budget targets may be achieved.
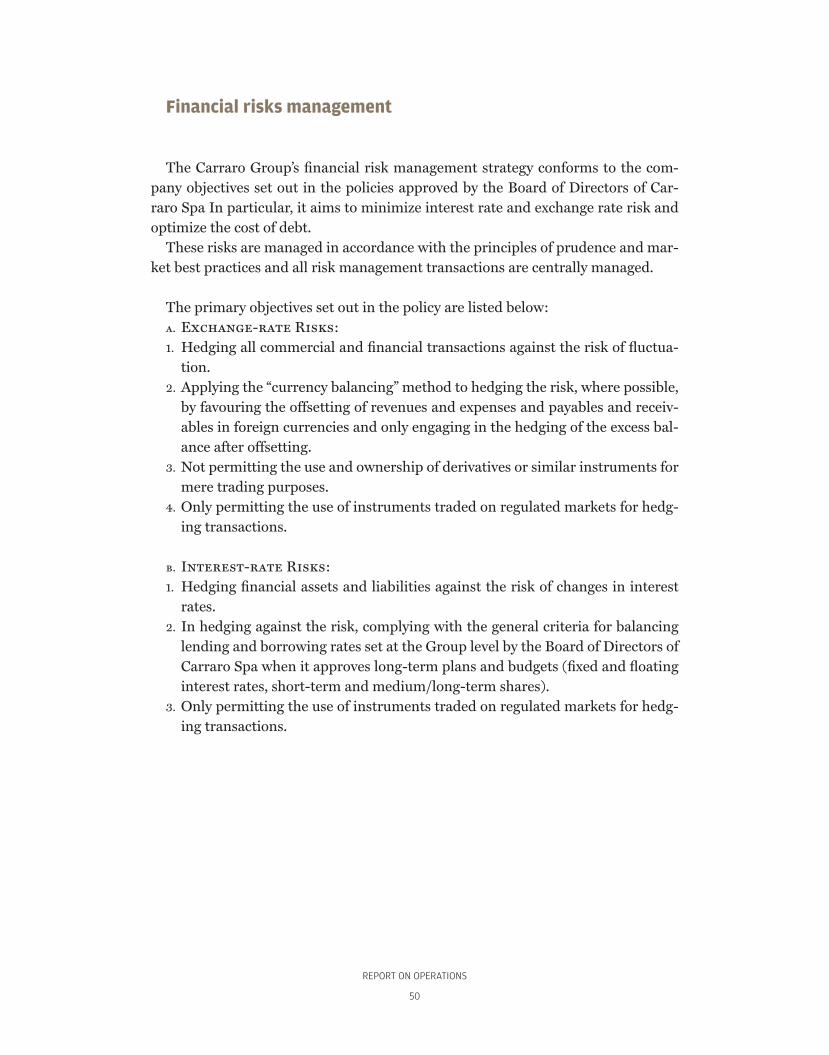
REPORT ON OPERATIONS
50
Financial risks management
The Carraro Group’s financial risk management strategy conforms to the com-pany objectives set out in the policies approved by the Board of Directors of Car-raro Spa In particular, it aims to minimize interest rate and exchange rate risk and optimize the cost of debt.
These risks are managed in accordance with the principles of prudence and mar-ket best practices and all risk management transactions are centrally managed.
The primary objectives set out in the policy are listed below:a. Exchange-rate Risks:1. Hedging all commercial and financial transactions against the risk of fluctua-
tion.2. Applying the “currency balancing” method to hedging the risk, where possible,
by favouring the offsetting of revenues and expenses and payables and receiv-ables in foreign currencies and only engaging in the hedging of the excess bal-ance after offsetting.
3. Not permitting the use and ownership of derivatives or similar instruments for mere trading purposes.
4. Only permitting the use of instruments traded on regulated markets for hedg-ing transactions.
b. Interest-rate Risks:1. Hedging financial assets and liabilities against the risk of changes in interest
rates.2. In hedging against the risk, complying with the general criteria for balancing
lending and borrowing rates set at the Group level by the Board of Directors of Carraro Spa when it approves long-term plans and budgets (fixed and floating interest rates, short-term and medium/long-term shares).
3. Only permitting the use of instruments traded on regulated markets for hedg-ing transactions.

REPORT ON OPERATIONS
51
Statement of reconciliation of consolidated net incomeand shareholders’ equity with the net income and shareholders’ equity of the parent company
The following table illustrates the reconciliation of the consolidated net income and shareholders’ equity as disclosed on the Consolidated Financial Statements and the net income and shareholders’ equity disclosed on the Financial Statements of Carraro spa:
ITEMS 2007 Net income 2007 Shareholders’ equity
2006 Net income 2006 Shareholders’ equity
Net income and shareholders’ equity of Carraro Spa
7,631 84,491 8,471 82,168
Net income and shareholders’ equity of subsidiaries and associates
18,267 305,832 8,675 171,572
Aggregate 25,898 390,323 17,146 253,740
Elimination of carrying value of subsidiaries and associates
– – 273,463 – 1,679 – 155,340
Consolidation adjustments – 8,776 33,143 – 4,377 20,767
Minority-interest share – 1,535 – 23,584 – 555 – 3,911
Group share of net income and shareholders’ equity
15,587 126,420 10,535 115,256
The information required by article 79 of the Issuer Regulations (information on the equity investments in the Parent Company Carraro spa and its subsidiaries owned by the directors, statutory auditors and… [omitted]) is set forth in a specific statement annexed to the Explanatory Notes to the Financial Statements to which this Report refers.
Figu
res
in E
uro/
1.0
00

REPORT ON OPERATIONS
52

REPORT ON OPERATIONS
53

REPORT ON OPERATIONS
54
REPORT ON OPERATIONS
55
CONSOLIDATED FINANCIAL STATEMENTS
56
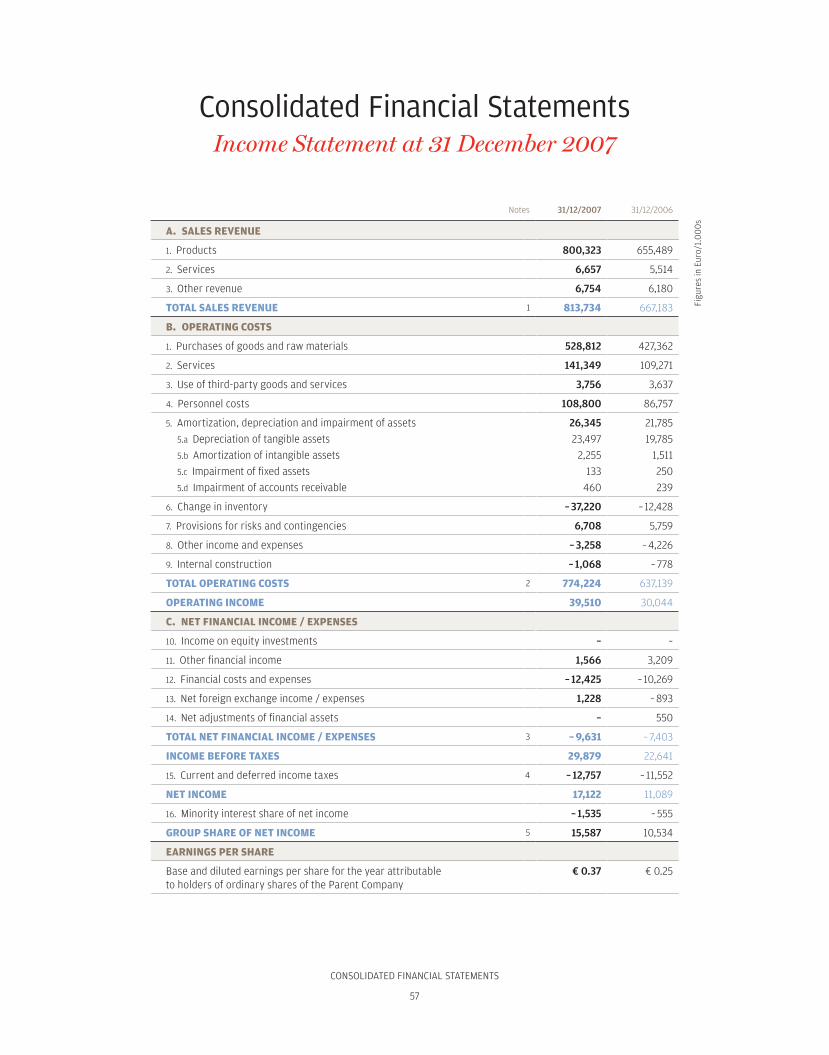
CONSOLIDATED FINANCIAL STATEMENTS
57
Consolidated Financial StatementsIncome Statement at 31 December 2007
Notes 31/12/2007 31/12/2006
A. SALES REVENUE
1. Products 800,323 655,489
2. Services 6,657 5,514
3. Other revenue 6,754 6,180
TOTAL SALES REVENUE 1 813,734 667,183
B. OPERATING COSTS
1. Purchases of goods and raw materials 528,812 427,362
2. Services 141,349 109,271
3. Use of third-party goods and services 3,756 3,637
4. Personnel costs 108,800 86,757
5. Amortization, depreciation and impairment of assets 26,345 21,785
5.a Depreciation of tangible assets 23,497 19,785
5.b Amortization of intangible assets 2,255 1,511
5.c Impairment of fixed assets 133 250
5.d Impairment of accounts receivable 460 239
6. Change in inventory – 37,220 – 12,428
7. Provisions for risks and contingencies 6,708 5,759
8. Other income and expenses – 3,258 – 4,226
9. Internal construction – 1,068 – 778
TOTAL OPERATING COSTS 2 774,224 637,139
OPERATING INCOME 39,510 30,044
C. NET FINANCIAL INCOME / EXPENSES
10. Income on equity investments – –
11. Other financial income 1,566 3,209
12. Financial costs and expenses – 12,425 – 10,269
13. Net foreign exchange income / expenses 1,228 – 893
14. Net adjustments of financial assets – 550
TOTAL NET FINANCIAL INCOME / EXPENSES 3 – 9,631 – 7,403
INCOME BEFORE TAXES 29,879 22,641
15. Current and deferred income taxes 4 – 12,757 – 11,552
NET INCOME 17,122 11,089
16. Minority interest share of net income – 1,535 – 555
GROUP SHARE OF NET INCOME 5 15,587 10,534
EARNINGS PER SHARE
Base and diluted earnings per share for the year attributableto holders of ordinary shares of the Parent Company
€ 0.37 € 0.25
Figu
res
in E
uro/
1.0
00
s
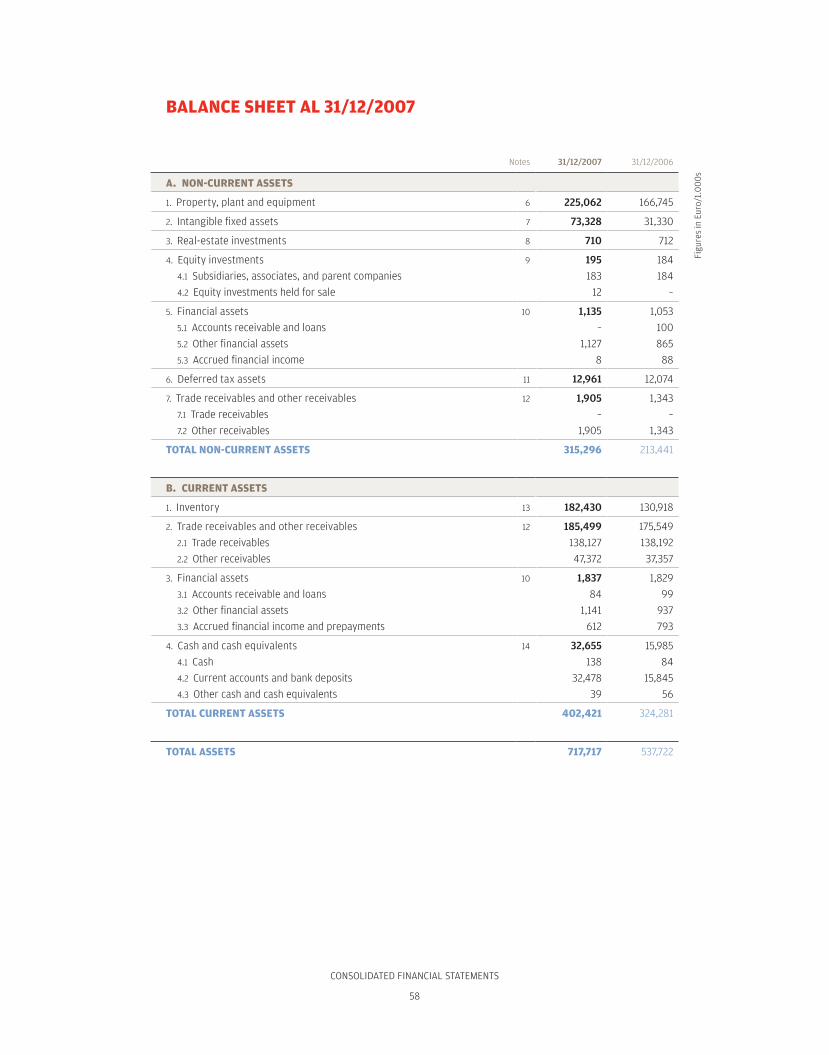
CONSOLIDATED FINANCIAL STATEMENTS
58
BALANCE SHEET AL 31/12/2007
Notes 31/12/2007 31/12/2006
A. NON-CURRENT ASSETS
1. Property, plant and equipment 6 225,062 166,745
2. Intangible fixed assets 7 73,328 31,330
3. Real-estate investments 8 710 712
4. Equity investments 9 195 184
4.1 Subsidiaries, associates, and parent companies 183 184
4.2 Equity investments held for sale 12 –
5. Financial assets 10 1,135 1,053
5.1 Accounts receivable and loans – 100
5.2 Other financial assets 1,127 865
5.3 Accrued financial income 8 88
6. Deferred tax assets 11 12,961 12,074
7. Trade receivables and other receivables 12 1,905 1,343
7.1 Trade receivables – –
7.2 Other receivables 1,905 1,343
TOTAL NON-CURRENT ASSETS 315,296 213,441
B. CURRENT ASSETS
1. Inventory 13 182,430 130,918
2. Trade receivables and other receivables 12 185,499 175,549
2.1 Trade receivables 138,127 138,192
2.2 Other receivables 47,372 37,357
3. Financial assets 10 1,837 1,829
3.1 Accounts receivable and loans 84 99
3.2 Other financial assets 1,141 937
3.3 Accrued financial income and prepayments 612 793
4. Cash and cash equivalents 14 32,655 15,985
4.1 Cash 138 84
4.2 Current accounts and bank deposits 32,478 15,845
4.3 Other cash and cash equivalents 39 56
TOTAL CURRENT ASSETS 402,421 324,281
TOTAL ASSETS 717,717 537,722
Figu
res
in E
uro/
1.0
00
s

CONSOLIDATED FINANCIAL STATEMENTS
59
Figu
res
in E
uro/
1.0
00
s
Notes 31/12/2007 31/12/2006
A. SHAREHOLDERS’ EQUITY 15
1. Share capital 21,840 21,840
2. Other reserves 52,040 40,627
3. Retained earnings / losses carried forward – –
4. Reserve for first-time application of Ias/Ifrs 44,384 44,384
5. Cash-flow hedge reserve – 143 749
Translation difference reserve – 7,288 – 2,878
6. Group share of net income for the year 15,587 10,534
GROUP SHAREHOLDERS’ EQUITY 126,420 115,256
7. Minority interests 23,584 3,912
TOTAL SHAREHOLDERS’ EQUITY 150,004 119,168
B. NON-CURRENT LIABILITIES
1. Financial liabilities 16 132,234 85,537
1.1 Bonds – –
1.2 Loans 132,234 85,537
2. Trade payables and other payables 17 14,331 1,759
2.1 Trade payables – –
2.2 Other payables 14,331 1,759
3. Deferred tax liabilities 11 11,941 4,175
4. Post-employment benefits 19 25,337 24,035
4.1 Post-employment benefits 20,602 19,163
4.2 Pension fund and similar provisions 4,735 4,872
5. Provisions for risks and contingencies 20 2,270 1,401
5.1 Guarantees 1,213 946
5.2 Legal disputes 879 388
5.3 Restructuring and conversion – –
5.4 Other provisions 178 67
TOTAL NON-CURRENT LIABILITIES 186,113 116,907

CONSOLIDATED FINANCIAL STATEMENTS
60
Figu
res
in E
uro/
1.0
00
s
Note 31/12/2007 31/12/2006
C. CURRENT LIABILITIES
1. Financial liabilities 16 79,004 63,303
1.1 Bonds – –
1.2 Loans 75,861 62,589
1.3 Accrued financial expense and deferred income 1,212 273
1.4 Other 1,931 441
2. Trade payables and other payables 17 289,877 228,942
2.1 Trade payables 255,997 201,976
2.2 Other payables 33,880 26,966
3. Current taxes payable 18 5,479 3,184
4. Provisions for risks and contingencies (short-term portion) 20 7,240 6,218
4.1 Guarantees 7,240 6,218
TOTAL CURRENT LIABILITIES 381,600 301,647
TOTAL LIABILITIES 567,713 418,554
TOTAL LIABILITIES AND SHAREHOLDERS’ EQUITY 717,717 537,722
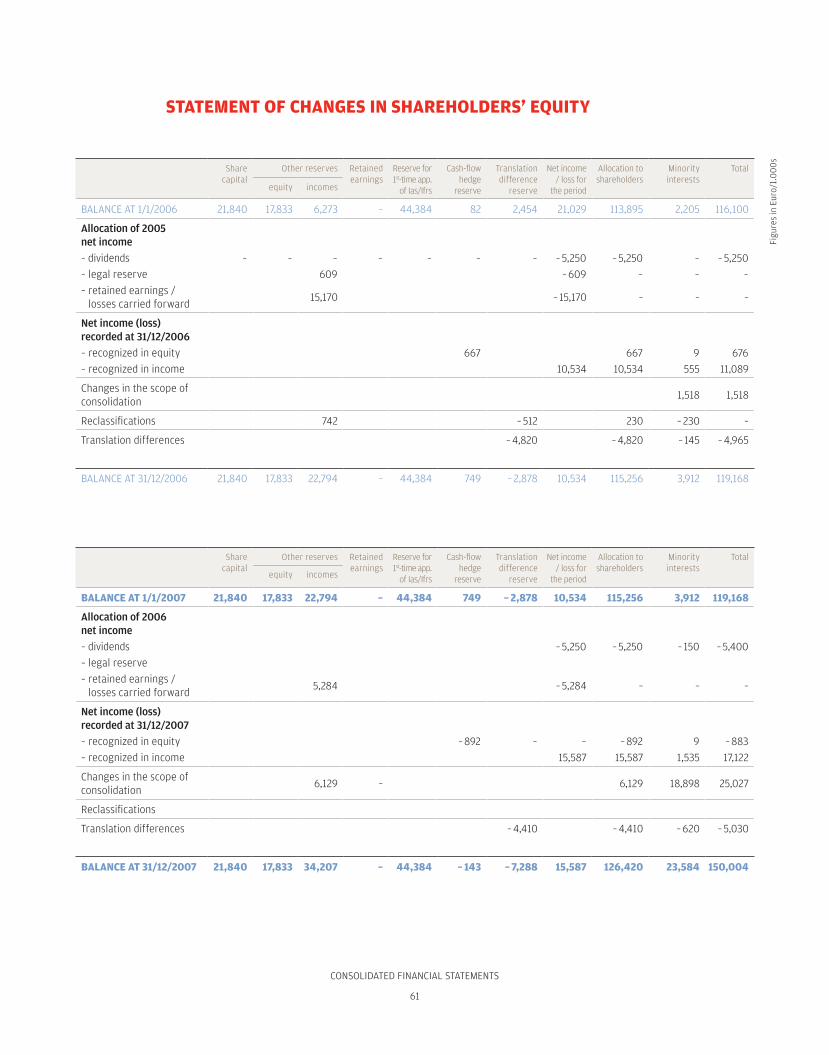
CONSOLIDATED FINANCIAL STATEMENTS
61
STATEMENT OF CHANGES IN SHAREHOLDERS’ EQUITY
Share capital
Other reserves Retained earnings
Reserve for1st-time app.
of Ias/Ifrs
Cash-flow hedge
reserve
Translation difference
reserve
Net income / loss for
the period
Allocation to shareholders
Minority interests
Total
equity incomes
BALANCE AT 1/1/2006 21,840 17,833 6,273 – 44,384 82 2,454 21,029 113,895 2,205 116,100
Allocation of 2005net income
– dividends – – – – – – – – 5,250 – 5,250 – – 5,250
– legal reserve 609 – 609 – – –
– retained earnings / losses carried forward
15,170 – 15,170 – – –
Net income (loss) recorded at 31/12/2006
– recognized in equity 667 667 9 676
– recognized in income 10,534 10,534 555 11,089
Changes in the scope of consolidation
1,518 1,518
Reclassifications 742 – 512 230 – 230 –
Translation differences – 4,820 – 4,820 – 145 – 4,965
BALANCE AT 31/12/2006 21,840 17,833 22,794 – 44,384 749 – 2,878 10,534 115,256 3,912 119,168
Share capital
Other reserves Retained earnings
Reserve for1st-time app.
of Ias/Ifrs
Cash-flow hedge
reserve
Translation difference
reserve
Net income / loss for
the period
Allocation to shareholders
Minority interests
Total
equity incomes
BALANCE AT 1/1/2007 21,840 17,833 22,794 – 44,384 749 – 2,878 10,534 115,256 3,912 119,168
Allocation of 2006net income
– dividends – 5,250 – 5,250 – 150 – 5,400
– legal reserve
– retained earnings / losses carried forward
5,284 – 5,284 – – –
Net income (loss) recorded at 31/12/2007
– recognized in equity – 892 – – – 892 9 – 883
– recognized in income 15,587 15,587 1,535 17,122
Changes in the scope of consolidation
6,129 – 6,129 18,898 25,027
Reclassifications
Translation differences – 4,410 – 4,410 – 620 – 5,030
BALANCE AT 31/12/2007 21,840 17,833 34,207 – 44,384 – 143 – 7,288 15,587 126,420 23,584 150,004
Figu
res
in E
uro/
1.0
00
s
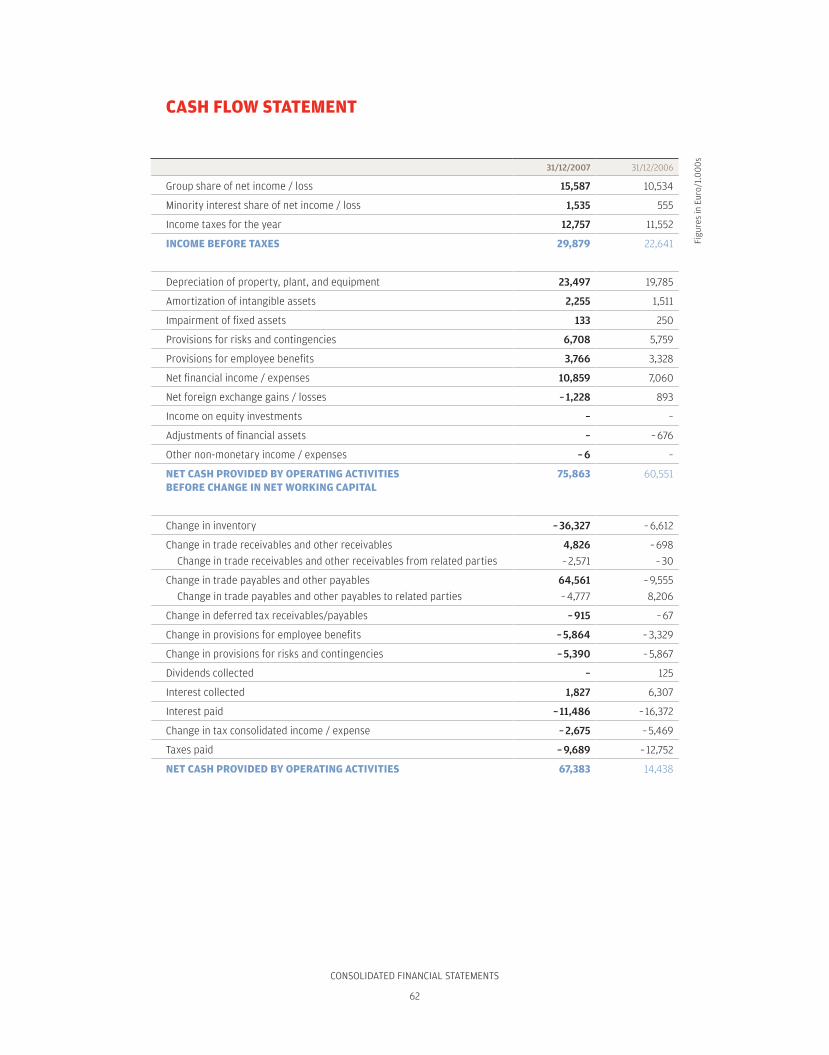
CONSOLIDATED FINANCIAL STATEMENTS
62
CASH FLOW STATEMENT
31/12/2007 31/12/2006
Group share of net income / loss 15,587 10,534
Minority interest share of net income / loss 1,535 555
Income taxes for the year 12,757 11,552
INCOME BEFORE TAXES 29,879 22,641
Depreciation of property, plant, and equipment 23,497 19,785
Amortization of intangible assets 2,255 1,511
Impairment of fixed assets 133 250
Provisions for risks and contingencies 6,708 5,759
Provisions for employee benefits 3,766 3,328
Net financial income / expenses 10,859 7,060
Net foreign exchange gains / losses – 1,228 893
Income on equity investments – –
Adjustments of financial assets – – 676
Other non-monetary income / expenses – 6 –
NET CASH PROVIDED BY OPERATING ACTIVITIESBEFORE CHANGE IN NET WORKING CAPITAL
75,863 60,551
Change in inventory – 36,327 – 6,612
Change in trade receivables and other receivables 4,826 – 698
Change in trade receivables and other receivables from related parties – 2,571 – 30
Change in trade payables and other payables 64,561 – 9,555
Change in trade payables and other payables to related parties – 4,777 8,206
Change in deferred tax receivables/payables – 915 – 67
Change in provisions for employee benefits – 5,864 – 3,329
Change in provisions for risks and contingencies – 5,390 – 5,867
Dividends collected – 125
Interest collected 1,827 6,307
Interest paid – 11,486 – 16,372
Change in tax consolidated income / expense – 2,675 – 5,469
Taxes paid – 9,689 – 12,752
NET CASH PROVIDED BY OPERATING ACTIVITIES 67,383 14,438
Figu
res
in E
uro/
1.0
00
s
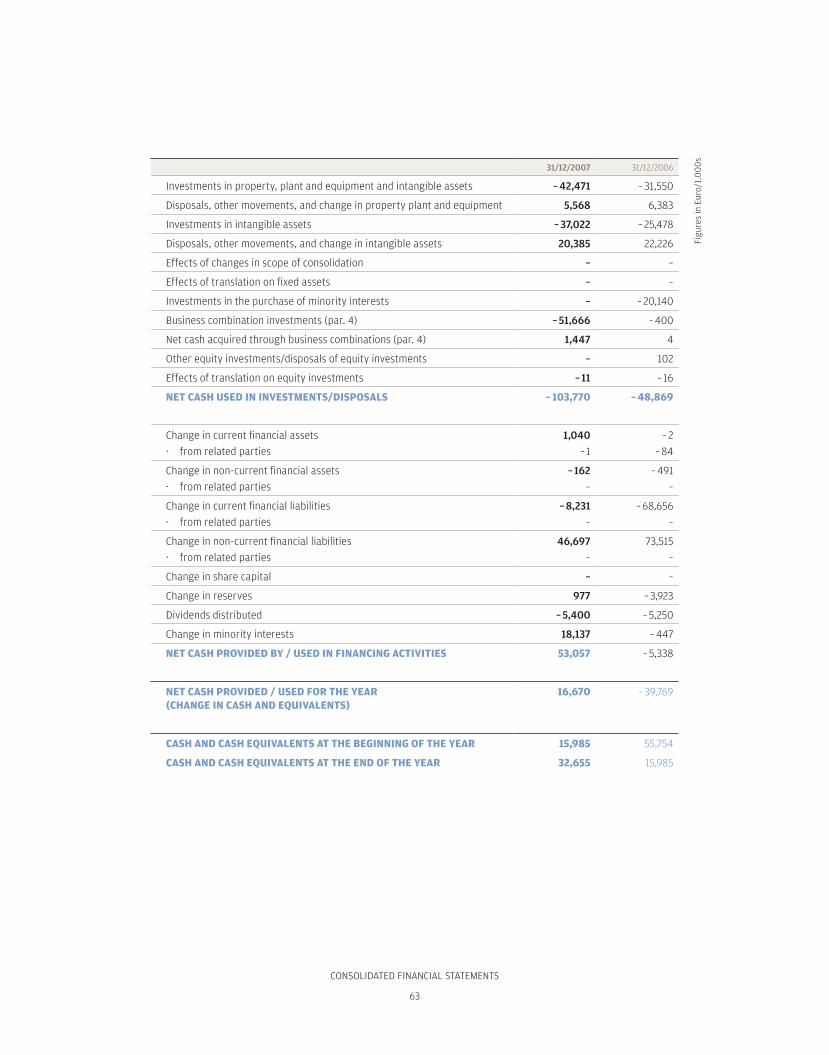
CONSOLIDATED FINANCIAL STATEMENTS
63
31/12/2007 31/12/2006
Investments in property, plant and equipment and intangible assets – 42,471 – 31,550
Disposals, other movements, and change in property plant and equipment 5,568 6,383
Investments in intangible assets – 37,022 – 25,478
Disposals, other movements, and change in intangible assets 20,385 22,226
Effects of changes in scope of consolidation – –
Effects of translation on fixed assets – –
Investments in the purchase of minority interests – – 20,140
Business combination investments (par. 4) – 51,666 – 400
Net cash acquired through business combinations (par. 4) 1,447 4
Other equity investments/disposals of equity investments – 102
Effects of translation on equity investments – 11 – 16
NET CASH USED IN INVESTMENTS/DISPOSALS – 103,770 – 48,869
Change in current financial assets 1,040 – 2
· from related parties – 1 – 84
Change in non-current financial assets – 162 – 491
· from related parties – –
Change in current financial liabilities – 8,231 – 68,656
· from related parties – –
Change in non-current financial liabilities 46,697 73,515
· from related parties – –
Change in share capital – –
Change in reserves 977 – 3,923
Dividends distributed – 5,400 – 5,250
Change in minority interests 18,137 – 447
NET CASH PROVIDED BY / USED IN FINANCING ACTIVITIES 53,057 – 5,338
NET CASH PROVIDED / USED FOR THE YEAR(CHANGE IN CASH AND EQUIVALENTS)
16,670 – 39,769
CASH AND CASH EQUIVALENTS AT THE BEGINNING OF THE YEAR 15,985 55,754
CASH AND CASH EQUIVALENTS AT THE END OF THE YEAR 32,655 15,985
Figu
res
in E
uro/
1.0
00
s
CONSOLIDATED FINANCIAL STATEMENTS
64
EXPLANATORY NOTES TO THE CONSOLIDATED FINANCIALSTATEMENTS FOR THE YEAR ENDED ON 31 DECEMBER 2007
1. GENERAL INFORMATIONThe publication of the Consolidated Financial Statements of Carraro spa for the
year ended on 31 December 2007 was authorized by resolution of the Directors on 20 March 2008.
Carraro spa is a joint-stock company formed in Italy, registered in the Padua Business Registry, and controlled by Finaid spa.
Carraro spa is not subject to direction and coordination as defined by articles 2497 et seq. of the Italian Civil Code. The majority shareholder, Finaid spa, does not exercise direction and coordination of Carraro. In further detail:
› Finaid is strictly a financial holding company; › Finaid does not issue directives for Carraro;› Finaid’s board of directors does not approve Carraro’s strategic or business
plans nor engage in programmatic “interference” in Carraro’s operations;› Finaid and Carraro do not engage in commercial or financial dealings.These Financial Statements are presented in euro, inasmuch as the euro is the
currency in which most Group transactions are undertaken. Foreign companies are included in the Consolidated Financial Statements according to the principles set forth in the following Notes. These Financial Statements are presented in thou-sands of euro.
Carraro Group companies have as their principal object the manufacturing and marketing of motor propulsion system for farm tractors, earth-moving machines, material-moving machines, light commercial vehicles, and automobiles. Subse-quent to the acquisition of Elettronica Santerno spa, the Group has also been man-ufacturing electronic control and power systems since 1 July 2006.
Basis of preparationThe Financial Statements have been prepared in accordance with the Interna-
tional Financial Reporting Standards (ifrs) adopted by the European Union. These principles are consistent with those used for the Financial Statements at 31 Decem-ber 2006.
The Financial Statements have been prepared on the basis of the historical cost principle, with the exception of derivative instruments, which have been recognized at their fair value.
Certain items of property, plant and equipment and real-estate investments have been measured for the purposes of first-time application of ifrs (1 January 2004) at their value fair on the basis of their “deemed cost”. Subsequent to initial recognition, the aforementioned items of property, plant and equipment and real-estate invest-ments are measured on the basis of the amortized historical cost method and de-
CONSOLIDATED FINANCIAL STATEMENTS
65
creased for impairment (as explained in further detail in paragraph 3, which provides a detailed illustration of the valuation criteria and accounting policies applied).
2. STRUCTURE AND CONTENT OF FINANCIAL STATEMENTSThese Consolidated Financial Statements have been prepared in accordance with
international accounting standards (ias / ifsr) adopted by the European Union. The figures of the financial statements of consolidated subsidiaries have been reclassified and adjusted as required for this purpose.
2.1 Format of Consolidated Financial StatementsThe Company opted to employ the following presentations for the Consolidated
Financial Statements:› Consolidated Balance Sheet The Consolidated Balance Sheet is presented in comparative sections with sepa-
rate indication of assets, liabilities, and shareholders’ equity. Assets and liabili-ties are in turn presented on the Consolidated Balance Sheet on the basis of their classification as current and non-current.
› Consolidated Income Statement The Consolidated Income Statement is presented according to classification by
nature.› Consolidated Cash Flow Statement The Consolidated Cash Flow Statement is presented according to changes in
cash and equivalents (as set forth in the Balance Sheet), broken down into ar-eas by the formation of cash flows and presenting cash flows according to the “indirect method” as permitted by ias 7.
› Change in Consolidated Shareholders’ Equity The Statement of Changes in Consolidated Shareholders’ Equity is presented in
accordance with international accounting standards with separate indication of the net income or loss for the year and all revenues, income, costs and expenses not recognized on the income statement but rather booked directly to consoli-dated shareholders’ equity on the basis of specific provisions of ias / ifrs.
› Adjustment of presentation to conform to Consob resolution no. 15519 In accordance with Consob resolution no. 15519 of 27 July 2006, transactions
with related parties with balances considered sufficient in amount to require separate indication for the purposes of understanding the Group’s earnings and financial position have not been included in the Financial Statements. A spe-cific table dedicated to transactions with related parties has been included in paragraph 12 to provide a full breakdown of these figures.
The income statement was not adjusted for significant costs and revenues of a non-recurring nature and/or arising from atypical and/or unusual transac-tions.
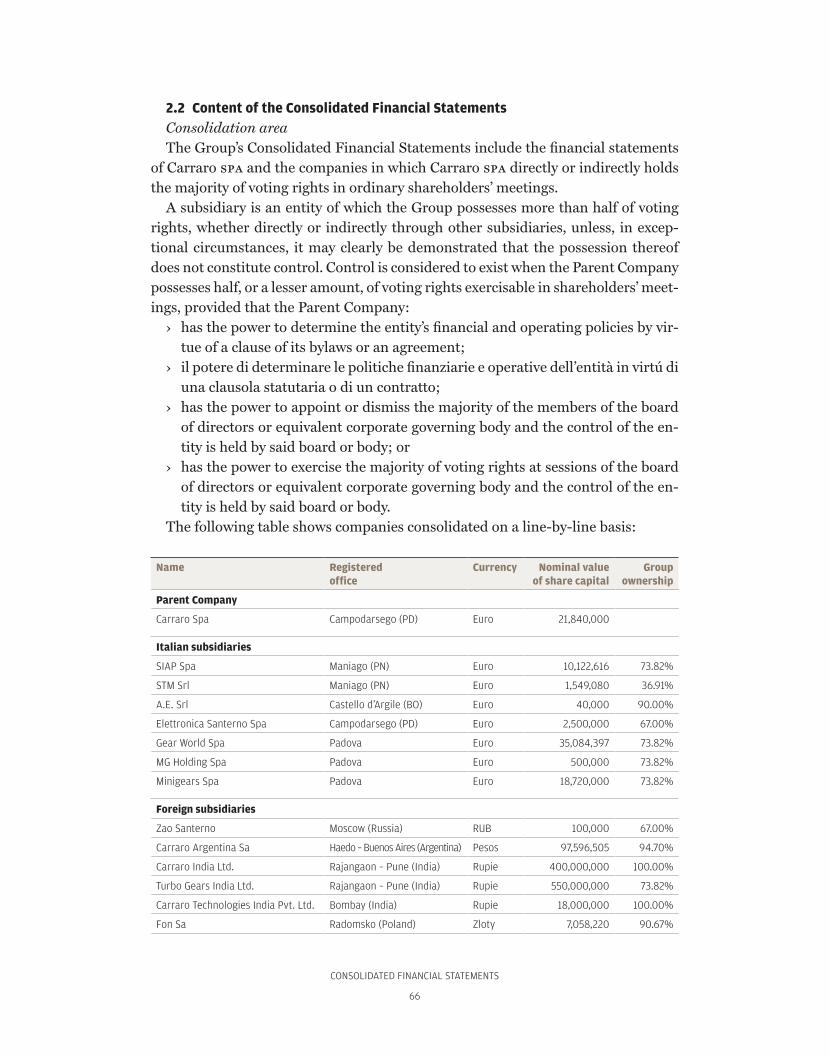
CONSOLIDATED FINANCIAL STATEMENTS
66
2.2 Content of the Consolidated Financial StatementsConsolidation areaThe Group’s Consolidated Financial Statements include the financial statements
of Carraro spa and the companies in which Carraro spa directly or indirectly holds the majority of voting rights in ordinary shareholders’ meetings.
A subsidiary is an entity of which the Group possesses more than half of voting rights, whether directly or indirectly through other subsidiaries, unless, in excep-tional circumstances, it may clearly be demonstrated that the possession thereof does not constitute control. Control is considered to exist when the Parent Company possesses half, or a lesser amount, of voting rights exercisable in shareholders’ meet-ings, provided that the Parent Company:
› has the power to determine the entity’s financial and operating policies by vir-tue of a clause of its bylaws or an agreement;
› il potere di determinare le politiche finanziarie e operative dell’entità in virtú di una clausola statutaria o di un contratto;
› has the power to appoint or dismiss the majority of the members of the board of directors or equivalent corporate governing body and the control of the en-tity is held by said board or body; or
› has the power to exercise the majority of voting rights at sessions of the board of directors or equivalent corporate governing body and the control of the en-tity is held by said board or body.
The following table shows companies consolidated on a line-by-line basis:
Name Registeredoffice
Currency Nominal valueof share capital
Group ownership
Parent Company
Carraro Spa Campodarsego (PD) Euro 21,840,000
Italian subsidiaries
SIAP Spa Maniago (PN) Euro 10,122,616 73.82%
STM Srl Maniago (PN) Euro 1,549,080 36.91%
A.E. Srl Castello d’Argile (BO) Euro 40,000 90.00%
Elettronica Santerno Spa Campodarsego (PD) Euro 2,500,000 67.00%
Gear World Spa Padova Euro 35,084,397 73.82%
MG Holding Spa Padova Euro 500,000 73.82%
Minigears Spa Padova Euro 18,720,000 73.82%
Foreign subsidiaries
Zao Santerno Moscow (Russia) RUB 100,000 67.00%
Carraro Argentina Sa Haedo – Buenos Aires (Argentina) Pesos 97,596,505 94.70%
Carraro India Ltd. Rajangaon – Pune (India) Rupie 400,000,000 100.00%
Turbo Gears India Ltd. Rajangaon – Pune (India) Rupie 550,000,000 73.82%
Carraro Technologies India Pvt. Ltd. Bombay (India) Rupie 18,000,000 100.00%
Fon Sa Radomsko (Poland) Zloty 7,058,220 90.67%
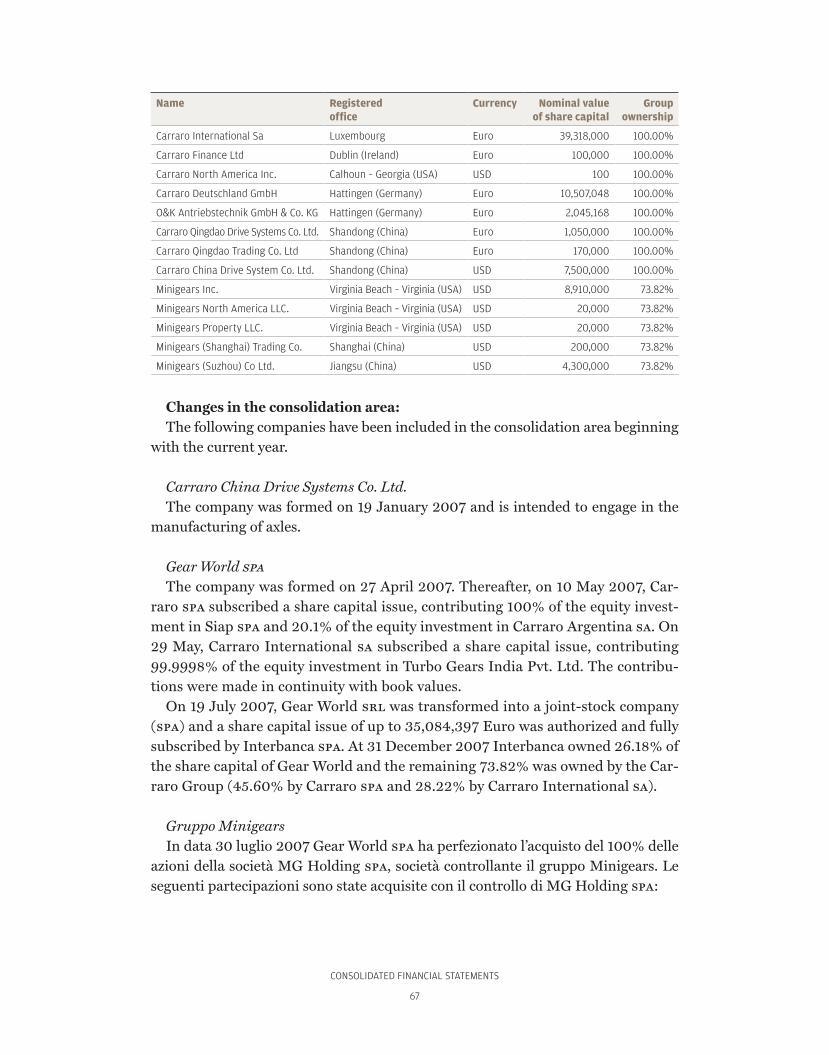
CONSOLIDATED FINANCIAL STATEMENTS
67
Name Registeredoffice
Currency Nominal valueof share capital
Group ownership
Carraro International Sa Luxembourg Euro 39,318,000 100.00%
Carraro Finance Ltd Dublin (Ireland) Euro 100,000 100.00%
Carraro North America Inc. Calhoun – Georgia (USA) USD 100 100.00%
Carraro Deutschland GmbH Hattingen (Germany) Euro 10,507,048 100.00%
O&K Antriebstechnik GmbH & Co. KG Hattingen (Germany) Euro 2,045,168 100.00%
Carraro Qingdao Drive Systems Co. Ltd. Shandong (China) Euro 1,050,000 100.00%
Carraro Qingdao Trading Co. Ltd Shandong (China) Euro 170,000 100.00%
Carraro China Drive System Co. Ltd. Shandong (China) USD 7,500,000 100.00%
Minigears Inc. Virginia Beach – Virginia (USA) USD 8,910,000 73.82%
Minigears North America LLC. Virginia Beach – Virginia (USA) USD 20,000 73.82%
Minigears Property LLC. Virginia Beach – Virginia (USA) USD 20,000 73.82%
Minigears (Shanghai) Trading Co. Shanghai (China) USD 200,000 73.82%
Minigears (Suzhou) Co Ltd. Jiangsu (China) USD 4,300,000 73.82%
Changes in the consolidation area:The following companies have been included in the consolidation area beginning
with the current year.
Carraro China Drive Systems Co. Ltd.The company was formed on 19 January 2007 and is intended to engage in the
manufacturing of axles.
Gear World spaThe company was formed on 27 April 2007. Thereafter, on 10 May 2007, Car-
raro spa subscribed a share capital issue, contributing 100% of the equity invest-ment in Siap spa and 20.1% of the equity investment in Carraro Argentina sa. On 29 May, Carraro International sa subscribed a share capital issue, contributing 99.9998% of the equity investment in Turbo Gears India Pvt. Ltd. The contribu-tions were made in continuity with book values.
On 19 July 2007, Gear World srl was transformed into a joint-stock company (spa) and a share capital issue of up to 35,084,397 Euro was authorized and fully subscribed by Interbanca spa. At 31 December 2007 Interbanca owned 26.18% of the share capital of Gear World and the remaining 73.82% was owned by the Car-raro Group (45.60% by Carraro spa and 28.22% by Carraro International sa).
Gruppo MinigearsIn data 30 luglio 2007 Gear World spa ha perfezionato l’acquisto del 100% delle
azioni della società MG Holding spa, società controllante il gruppo Minigears. Le seguenti partecipazioni sono state acquisite con il controllo di MG Holding spa:
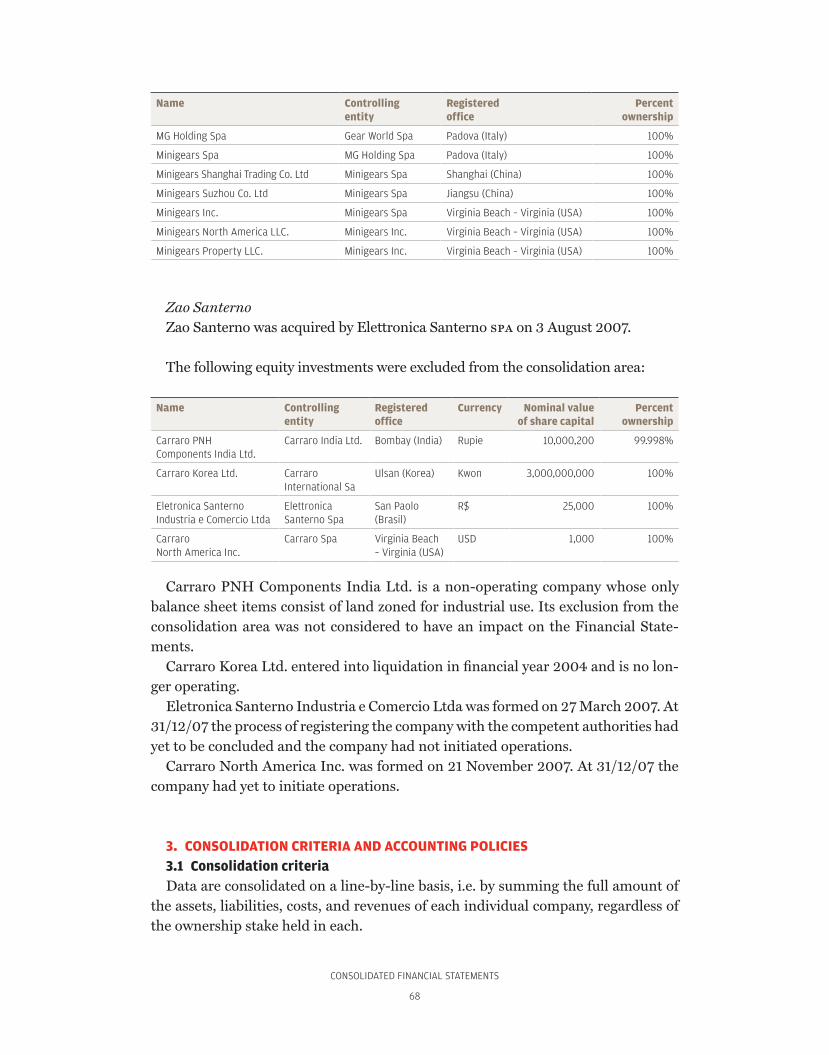
CONSOLIDATED FINANCIAL STATEMENTS
68
Name Controllingentity
Registeredoffice
Percent ownership
MG Holding Spa Gear World Spa Padova (Italy) 100%
Minigears Spa MG Holding Spa Padova (Italy) 100%
Minigears Shanghai Trading Co. Ltd Minigears Spa Shanghai (China) 100%
Minigears Suzhou Co. Ltd Minigears Spa Jiangsu (China) 100%
Minigears Inc. Minigears Spa Virginia Beach – Virginia (USA) 100%
Minigears North America LLC. Minigears Inc. Virginia Beach – Virginia (USA) 100%
Minigears Property LLC. Minigears Inc. Virginia Beach – Virginia (USA) 100%
Zao SanternoZao Santerno was acquired by Elettronica Santerno spa on 3 August 2007.
The following equity investments were excluded from the consolidation area:
Name Controlling entity
Registered office
Currency Nominal valueof share capital
Percent ownership
Carraro PNHComponents India Ltd.
Carraro India Ltd. Bombay (India) Rupie 10,000,200 99.998%
Carraro Korea Ltd. Carraro International Sa
Ulsan (Korea) Kwon 3,000,000,000 100%
Eletronica Santerno Industria e Comercio Ltda
Elettronica Santerno Spa
San Paolo (Brasil)
R$ 25,000 100%
CarraroNorth America Inc.
Carraro Spa Virginia Beach – Virginia (USA)
USD 1,000 100%
Carraro PNH Components India Ltd. is a non-operating company whose only balance sheet items consist of land zoned for industrial use. Its exclusion from the consolidation area was not considered to have an impact on the Financial State-ments.
Carraro Korea Ltd. entered into liquidation in financial year 2004 and is no lon-ger operating.
Eletronica Santerno Industria e Comercio Ltda was formed on 27 March 2007. At 31/12/07 the process of registering the company with the competent authorities had yet to be concluded and the company had not initiated operations.
Carraro North America Inc. was formed on 21 November 2007. At 31/12/07 the company had yet to initiate operations.
3. CONSOLIDATION CRITERIA AND ACCOUNTING POLICIES3.1 Consolidation criteriaData are consolidated on a line-by-line basis, i.e. by summing the full amount of
the assets, liabilities, costs, and revenues of each individual company, regardless of the ownership stake held in each.
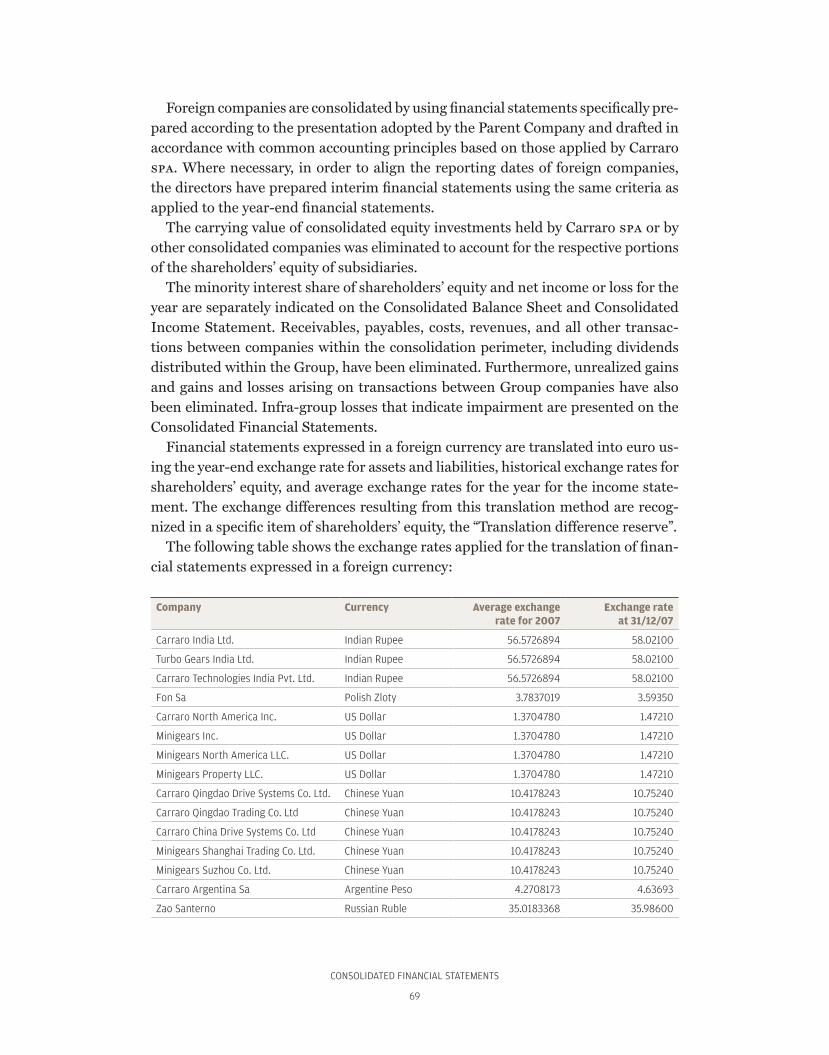
CONSOLIDATED FINANCIAL STATEMENTS
69
Foreign companies are consolidated by using financial statements specifically pre-pared according to the presentation adopted by the Parent Company and drafted in accordance with common accounting principles based on those applied by Carraro spa. Where necessary, in order to align the reporting dates of foreign companies, the directors have prepared interim financial statements using the same criteria as applied to the year-end financial statements.
The carrying value of consolidated equity investments held by Carraro spa or by other consolidated companies was eliminated to account for the respective portions of the shareholders’ equity of subsidiaries.
The minority interest share of shareholders’ equity and net income or loss for the year are separately indicated on the Consolidated Balance Sheet and Consolidated Income Statement. Receivables, payables, costs, revenues, and all other transac-tions between companies within the consolidation perimeter, including dividends distributed within the Group, have been eliminated. Furthermore, unrealized gains and gains and losses arising on transactions between Group companies have also been eliminated. Infra-group losses that indicate impairment are presented on the Consolidated Financial Statements.
Financial statements expressed in a foreign currency are translated into euro us-ing the year-end exchange rate for assets and liabilities, historical exchange rates for shareholders’ equity, and average exchange rates for the year for the income state-ment. The exchange differences resulting from this translation method are recog-nized in a specific item of shareholders’ equity, the “Translation difference reserve”.
The following table shows the exchange rates applied for the translation of finan-cial statements expressed in a foreign currency:
Company Currency Average exchange rate for 2007
Exchange rateat 31/12/07
Carraro India Ltd. Indian Rupee 56.5726894 58.02100
Turbo Gears India Ltd. Indian Rupee 56.5726894 58.02100
Carraro Technologies India Pvt. Ltd. Indian Rupee 56.5726894 58.02100
Fon Sa Polish Zloty 3.7837019 3.59350
Carraro North America Inc. US Dollar 1.3704780 1.47210
Minigears Inc. US Dollar 1.3704780 1.47210
Minigears North America LLC. US Dollar 1.3704780 1.47210
Minigears Property LLC. US Dollar 1.3704780 1.47210
Carraro Qingdao Drive Systems Co. Ltd. Chinese Yuan 10.4178243 10.75240
Carraro Qingdao Trading Co. Ltd Chinese Yuan 10.4178243 10.75240
Carraro China Drive Systems Co. Ltd Chinese Yuan 10.4178243 10.75240
Minigears Shanghai Trading Co. Ltd. Chinese Yuan 10.4178243 10.75240
Minigears Suzhou Co. Ltd. Chinese Yuan 10.4178243 10.75240
Carraro Argentina Sa Argentine Peso 4.2708173 4.63693
Zao Santerno Russian Ruble 35.0183368 35.98600

CONSOLIDATED FINANCIAL STATEMENTS
70
3.2 Discretionary valuations and significant accounting estimatesDiscretionary valuationsIn applying the Group’s accounting policies, the Directors have not taken any
decisions based on discretionary valuations (excluding those that involve estimates) with a significant impact on the figures recognized on the Financial Statements, with the exception of those indicated in the section Accounting policies and valu-ation criteria concerning the purchase of equity investments after control has been established.
Estimates and assumptionsFollowing are the key assumptions relating to the future and other significant
sources of uncertainty underlying estimates made at the balance sheet date, which could result in significant adjustments to the carrying value of assets and liabilities within the next financial year.
Impairment of goodwillGoodwill is subject to impairment testing on at least an annual basis. Such test-
ing involves the estimation of the value in use of the cash-generating unit to which the goodwill is attributed, which is in turn based on an estimate of the expected cash flows discounted at an appropriate discount rate. At 31 December 2007 the carry-ing value of goodwill was 57.41 million Euro(24.879 million Euro in 2006). Further details are provided in Note 7.
Deferred tax assetsDeferred tax assets are recognized in accordance with ias 12 and include assets
pertaining to tax losses carried forward, to the extent it is likely that there will be adequate future net income against which such losses may be used and reversals of the temporary differences absorbed. The Directors are required to conduct a significant discretionary valuation to determine the amount of deferred tax assets which may be recognized. In further detail, they are required to estimate the likely timing and amount of future taxable income in addition to a forward-looking tax strategy. The carrying value of deferred tax assets as recognized at 31 December 2007 was 12.961 million (12.074 million Euro in 2006), whereas tax losses for which it was decided not to recognize deferred tax assets at 31 December 2007 came to 7.24 million Euro (8.68 million Euro in 2006). Further details are pro-vided in Note 11.
Pension funds and other post-employment benefits The cost of defined-benefit pension plans is determined by applying actuarial
valuations. Actuarial valuations require assumptions pertaining to discount rates, expected rates of return, future salary increases, mortality rates and future pension increases. Due to the long-term nature of such plans, these estimates are subject to
CONSOLIDATED FINANCIAL STATEMENTS
71
a significant degree of uncertainty. The net liability to employees at 31 December 2007 came to 25.337 million Euro (24.035 million Euro in 2006). Further details are provided in Note 19.
Development costsDevelopment costs are capitalized using the accounting treatment detailed here-
inafter. In determining the amount to be capitalized, Directors are required make assumptions relating to the future cash flows expected from an asset, the discount rate to be applied and the duration of expected future economic benefits. The best estimate for the book value of capitalized development costs was 2.783 million Euro at 31 December 2007 (3.323 million Euro in 2006). See Note 7 for further details.
3.3 Accounting policies and valuation criteriaThe valuation criteria and accounting polices are consistent with those adopted
for the preparation of the Consolidated Annual Financial Statements at 31.12.06, with the exception of the adoption of the following new or revised IFRS and IFRIC rules. The adoption of such revised standards and interpretations did not have an impact on the Group’s Financial Statements.
However, these changes have required, as applicable, the following additional dis-closures:
› ifrs 7 – Financial Instruments: Disclosures.› ias 1 – Amendment to ias 1. Presentation of Financial Statements: Capital Disclosures.› ifric 8 – Scope of Application of ifrs 2.› ifric 9 – Reassessment of Embedded Derivatives.› ifric 10 – Interim Reporting and Impairment.
The primary effects of these changes are illustrated below:› ifrs 7 financial instruments: disclosures This standard requires that disclosures permit readers of the Financial State-
ments to assess the significance of the Group’s financial instruments and the na-ture of the risks associated with such financial instruments. The new disclosure requirements involve various parts of the Financial Statements. Although there were no effects on financial position or results, comparative data were revised where necessary.
› ias 1 presentation of financial statements This amendment requires the Group to provide new disclosures that permit
readers of the Financial Statements to assess the Group’s capital management goals, policies and procedures. This new information is set out in paragraph 8.
› ifric 8 scope of application of ifrs 2 This interpretation requires the application of ifrs 2 to all transactions for
CONSOLIDATED FINANCIAL STATEMENTS
72
which the Group may not specifically identify the goods or portion thereof re-ceived, in particular those involving the issue of equity instruments at a price that appears lower than the fair value. The interpretation did not have an im-pact on the Group’s Financial Statements.
› ifric 9 reassessment of embedded derivatives ifric 9 establishes that the date for determining the existence of an embedded
derivative is the date on which the Group becomes the contractual counter-party for the first time, with reassessment only if there is an amendment to the agreement that substantially modifies cash flows. Since the Group does not own embedded derivatives that need to be separated from the host contract, this interpretation did not have an impact on the Group’s Financial Statements.
› ifric 10 interim reporting and impairment Il Gruppo ha adottato l’interpretazione ifric 10 dal 1° gennaio 2007. The Group
adopted ifric 10 effective from 1 January 2007. The interpretation requires that the Group not write back impairment of goodwill recorded in a previous interim period or impairment on an investment in equity instruments or finan-cial instruments held at cost. Since the Group did not write back any previous recorded impairment, the interpretation did not have an impact on the Group’s Financial Statements.
Business combinations and goodwill Business combinations are recognized according to the purchase method. This
method requires that the identifiable assets (including previously unrecognized in-tangible fixed assets) and identifiable liabilities (including contingent liabilities and excluding future restructuring) of the acquired company be recognized at their fair value.
Goodwill acquired through a business combination is initially recognized at cost, which is represented by the surplus of the cost of the business aggregation with re-spect to the Group’s share of the net fair value of identifiable assets, liabilities and potential liabilities (from the acquisition). For the purposes of congruity analysis, the goodwill acquired in a business combination is allocated at the date of acquisition to the Group’s individual cash-generating units or the groups of cash-generating units that are to benefit from the synergies of the aggregation, regardless of whether other Group assets and liabilities have been assigned to such units or groups of units.
Each unit or group of units to which goodwill is allocated:› represents the lowest Group level at which goodwill is monitored for internal
management purposes;› is no larger than the segments identified on the basis of either the primary or
secondary scheme for presentation of the Group’s segment reporting disclosures, as determined according to the provisions of ias 14, segment reporting.
When goodwill represents a portion of a cash-generating unit (or group of cash-generating units) and part of the activity internal to the unit is disposed of, the good-
CONSOLIDATED FINANCIAL STATEMENTS
73
will associated with the transferred activity is included in the carrying value of the activity to determine the gain or loss on the disposal. Goodwill transferred in such circumstances is measured on the basis of the figures for the transferred activity and the retained portion of the unit.
When the transfer involves a subsidiary, the difference between the transfer price and net assets plus accumulated translation differences and unamortized goodwill is recognized on the Income Statement.
Acquisitions of further equity investments after control has been establishedIfrs 3 only applies to transactions that involve the acquisition of control by the
acquiring entity of the business activities of the acquired company. Consequently, acquisitions of further equity investments after control has been established are not specifically governed by ifrs 3.
Absent an accounting treatment specified by ias / ifrs, lo ias 8, paragraph 10 et seq. require that management apply technical discretion in establishing and apply-ing a relevant and reliable accounting treatment.
Considering the following factors:› for transactions in which control is acquired, the parent company approach
theory requires the recognition of the positive difference between the cost in-curred by the acquiring party and said party’s ownership stake of the net value of the distinctly identifiable assets and liabilities belonging to the acquired company as measured at their fair value (current value) at the date of acquisi-tion;
› ifrs 3 is specifically limited to further revaluation of the assets and liabilities of the subsidiary subsequent to the date of acquisition.
In the acquisition of further minority interests, goodwill is defined as the differ-ence between the price paid and the book value of the minority interests.
This method is consistently applied to all acquisitions of further equity invest-ments after control has been established.
Ias 27 does not govern the accounting treatment of the disposal of equity invest-ments that does not result in the loss of control. In accordance with the approach described above for the acquisition of minority interests, the income or loss on di-lution due to the disposal of equity investments is recognized on the income state-ment.
The valuation criteria and accounting polices for the most significant items are set out below.
Tangible fixed assetsProperty, plant and equipmentProperty, plant and equipment are recognized at their historical cost, less accu-
mulated depreciation and impairment. Said cost includes the costs of partial re-
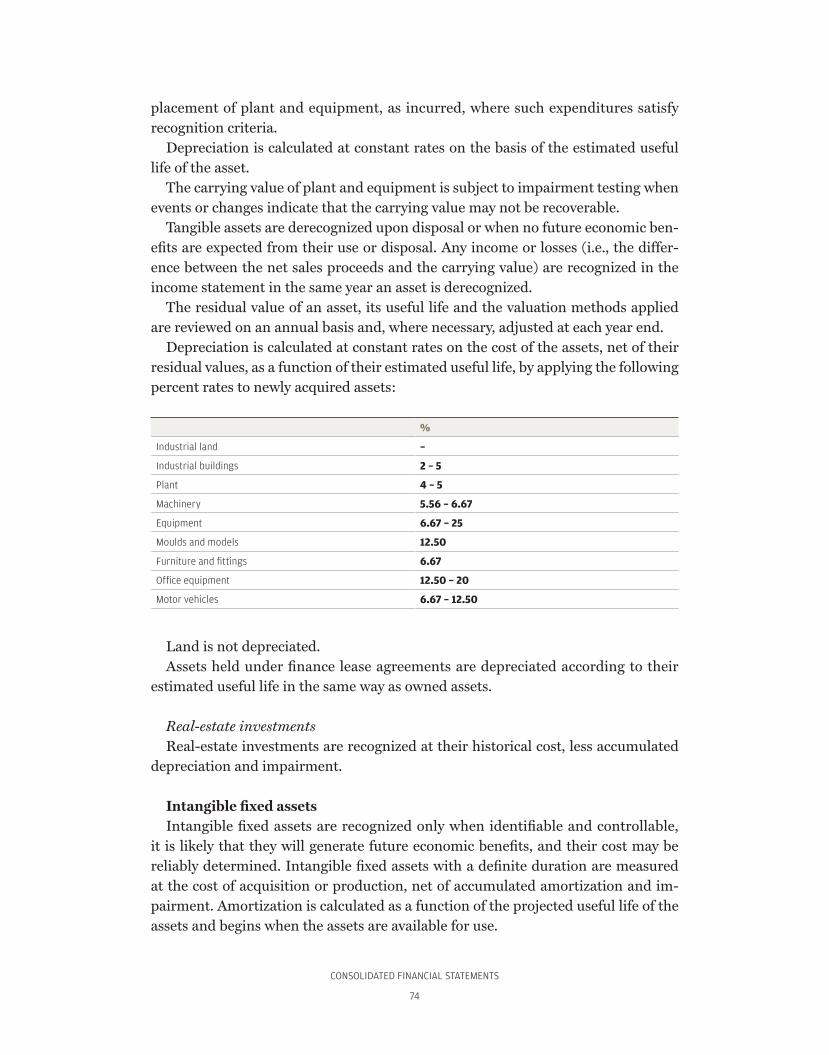
CONSOLIDATED FINANCIAL STATEMENTS
74
placement of plant and equipment, as incurred, where such expenditures satisfy recognition criteria.
Depreciation is calculated at constant rates on the basis of the estimated useful life of the asset.
The carrying value of plant and equipment is subject to impairment testing when events or changes indicate that the carrying value may not be recoverable.
Tangible assets are derecognized upon disposal or when no future economic ben-efits are expected from their use or disposal. Any income or losses (i.e., the differ-ence between the net sales proceeds and the carrying value) are recognized in the income statement in the same year an asset is derecognized.
The residual value of an asset, its useful life and the valuation methods applied are reviewed on an annual basis and, where necessary, adjusted at each year end.
Depreciation is calculated at constant rates on the cost of the assets, net of their residual values, as a function of their estimated useful life, by applying the following percent rates to newly acquired assets:
%
Industrial land –
Industrial buildings 2 – 5
Plant 4 – 5
Machinery 5.56 – 6.67
Equipment 6.67 – 25
Moulds and models 12.50
Furniture and fittings 6.67
Office equipment 12.50 – 20
Motor vehicles 6.67 – 12.50
Land is not depreciated.Assets held under finance lease agreements are depreciated according to their
estimated useful life in the same way as owned assets.
Real-estate investmentsReal-estate investments are recognized at their historical cost, less accumulated
depreciation and impairment.
Intangible fixed assetsIntangible fixed assets are recognized only when identifiable and controllable,
it is likely that they will generate future economic benefits, and their cost may be reliably determined. Intangible fixed assets with a definite duration are measured at the cost of acquisition or production, net of accumulated amortization and im-pairment. Amortization is calculated as a function of the projected useful life of the assets and begins when the assets are available for use.
CONSOLIDATED FINANCIAL STATEMENTS
75
GoodwillGoodwill represents the surplus cost of acquisition with respect to the acquiring
entity’s share of the fair value of the net values of the identifiable assets and liabili-ties of the acquired entity.
Subsequent to initial recognition, goodwill is calculated as cost less any accumu-lated impairment.
Goodwill is subject to impairment testing on an annual basis aimed at identifying any impairment. For the purposes of proper conduct of congruity analysis, goodwill is allocated to each of the cash-generating units that will benefit from the effects of the acquisition.
Research and development costsResearch costs are charged to the income statement when incurred as required by
ias 38. In accordance with ias 38, development costs associated with specific proj-ects are recognized as assets only if all of the following conditions are satisfied::
› the asset is identifiable;› it is likely that the asset created will generate future economic benefits;› the cost of developing the asset may be reliably measured.Such intangible assets are amortized at constant rates over their useful life.
Licenses and brandsLicenses and brands are measured at cost, net of accumulated amortization and
impairment. This cost is amortized over the lesser of contractual duration and defi-nite useful life.
SoftwareThe costs of software licenses, including accessory costs, are capitalized and rec-
ognized net of any accumulated amortization and impairment. Such intangible as-sets are amortized at constant rates over their useful life.
ImpairmentWhen there is specific evidence of impairment, tangible and intangible fixed assets
are subject to impairment testing, which involves estimating the asset’s recoverable value and comparing it with the asset’s net carrying value. Recoverable value is calcu-lated as the greater of the fair value of an asset, net of the costs of sale, and the asset’s value in use, and is calculated for individual assets, except when assets do not gener-ate cash flows that are broadly independent of those generated by other assets.
If recoverable value is less than the carrying value, the carrying value is decreased accordingly. This decrease is impairment, which is charged to the income state-ment.
When the reasons for previously recognized impairment cease to apply, the car-rying value is written back to the new estimated value, with the limit that said value
CONSOLIDATED FINANCIAL STATEMENTS
76
may not exceed the net carrying value that the asset would have had if no impairment had ever been recognized. Write-backs are also recorded on the income statement.
Impairment testing of intangible fixed assets with an indefinite useful life and intangible fixed assets in progress is conducted on an annual basis.
Equity investments in associatesAn associate is a company over which the Group exercises significant influence,
but not control or joint control, through participation in the company’s financial and operating policies.
The earnings, assets, and liabilities of associates are recognized in the Consoli-dated Financial Statements according to the net equity method, except for cases in which such assets are classified held for sale.
Equity investments in other companies and other securitiesIn accordance with the provisions of ias 39 and 32, equity investments in compa-
nies other than subsidiaries and associates are classified as available-for-sale finan-cial assets and measured at their fair value, except for situations in which market price or fair value may not be determined, in which case the cost method is applied.
Income and losses arising from adjustments of value are recognized in a specific shareholders’ equity reserve.
When such investments are impaired or disposed of, the income and losses previ-ously recognized in shareholders’ equity are recorded in the income statement.
Financial assetsIas 39 provides the following classification of financial instruments: financial as-
sets designated at fair value through the income statement, loans and receivables, held-to-maturity investments, and available-for-sale financial assets. All financial assets are initially recognized at fair value, plus transaction costs for assets not mea-sured at fair value through the income statement. The Group determines how fi-nancial assets are to be classified after initial recognition and, where permitted and appropriate, reviews those classifications at the end of each financial year.
All regular-way purchases and disposals of financial assets are recognized on the trade date or the date on which the Group enters into a commitment to purchase the asset. Regular-way purchases and sales are those transactions where the asset is delivered within the period generally required by the rules and conventions of the market in which the trade takes place.
Financial assets at fair value through the income statementThis category includes financial assets held for trading (i.e., purchased with in-
tention of selling them in the short term). Derivatives are classified as held-for-trad-ing financial assets unless they are designated as effective hedges. Profits and losses on held-for-trading assets are recognized in the income statement.
CONSOLIDATED FINANCIAL STATEMENTS
77
Held-to-maturity investmentsNon-derivative financial instruments with fixed or determinable payments are
classified as held-for-trading investments when the Group intends and is able to hold them until maturity. Financial assets which the Group intends to hold for an indefinite period are not included in this category. Long-term financial investments held to maturity, such as bonds, are subsequently measured using the amortized cost method. Amortized cost represents the amount initially recognized less any repayments of principal, plus or minus the cumulative amortization, calculated us-ing the effective interest method, of any difference between the initial value and the value at maturity. This calculation includes all commissions and spreads payable between the parties representing the effective interest rate, transaction costs and other premiums or discounts. For investments measured at amortized cost, gains and losses are recognized in the income statement when the investment is derecog-nized or when a diminution in value occurs (other than through amortization).
Loans and receivablesLoans and receivables are non-derivative financial assets with fixed or determin-
able payments that are not quoted in an active market. These assets are measured at amortized cost using the effective interest method. Gains and losses are recognized in the income statement when the loan or receivable is derecognized or when a diminution in value occurs (other than through amortization).
Available-for-sale financial assetsAvailable-for-sale financial assets are those financial assets, with the exclusion of
financial derivatives, specifically designated as such or which are not included with any of the previous three categories. After initial recognition at cost, available-for-sale financial assets are measured at fair value. Gains or losses are recognized in equity until the asset is derecognized or an impairment loss is recognized, at which time the cumulative gains or losses are recognized in the income statement.
For securities which are actively traded on a regulated market, fair value is based on the official closing price on the balance sheet date. For those investments where an active market does not exist, fair value is determined using valuation techniques based on the value of recent transactions between unrelated parties, the current market value of instruments which are substantially similar, discounted cash flow analysis and/or option pricing models.
InventoryInventory is measured at the lesser of the average cost of purchase or production
for the year and market value. Cost of production includes the cost of materials, labour, and direct and direct production costs. Inventory is written down to reflect obsolescence or slow turnover.

CONSOLIDATED FINANCIAL STATEMENTS
78
Trade receivables and other receivablesTrade receivables and other receivables are measured at their presumed realiz-
able value. This value corresponds to their nominal value adjusted through a spe-cifically accrued provision for doubtful debts, which is intended to cover both losses due to accounts receivable that have already been proven uncollectible and other recognized accounts receivable that are likely to prove uncollectible in the future.
Cash and equivalentsCash and equivalents include cash at hand, sight deposits, and investments with
maturities within three months of the date of original acquisition.
Loans and bondsLoans are initially recognized at the fair value of the amount received net of the
accessory costs of transacting the loan. Subsequent to initial recognition, loans are recognized according to the amortized cost criterion, calculated by applying the ef-fective interest rate. Amortized cost is calculated by taking account of the cost of issue and any discounts or premiums payable at settlement.
Derecognition of financial assets and liabilitiesFinancial assetsA financial asset (or, where applicable, part of a financial asset or group of similar
financial assets) is derecognized when:› the right to receive cash flows ceases;› the Group retains the right to receive the cash flows from the asset, but has as-
sumed a contractual obligation to immediately remit them in their entirety to a third party;
› the Group has transferred the right to receive the cash flows from the asset and (a) has also transferred substantially all of the risks and rewards of ownership of the financial asset or (b) has neither transferred nor retained substantially all of the risks and rewards of ownership, but has transferred control of the asset.
Where the Group has transferred the right to receive the cash flows from an as-set but has neither transferred nor retained substantially all of the risks and re-wards of ownership or has not relinquished control, the asset is recognized on the Group’s balance sheet to the extent that it has a continuing involvement in that as-set. Continuing involvement in the form of a guarantee on the transferred asset is valued at the lesser of the initial value of the asset and the maximum consideration which the Group may be required to pay.
When continuing involvement takes the form of an option issued and/or acquired on the transferred asset (including options settled in cash or similar forms), the measure of the Group’s involvement corresponds to the amount of the transferred asset that the Group may reacquire. However, when put options are issued on an asset measured at fair value (including options settled in cash or with similar provi-
CONSOLIDATED FINANCIAL STATEMENTS
79
sions), the measure of the Group’s continuing involvement is limited to the lesser of the fair value of the transferred asset and the strike price of the option.
Financial liabilitiesA financial liability is derecognized when the obligation underlying the liability is
expired, cancelled or discharged.Where an existing financial liability is replaced by another from the same lender
having substantially different terms, or the terms and conditions of an existing fi-nancial liability are modified substantially, such replacement or modification is ac-counted for as the extinguishment of the original liability and the recognition of a new financial liability. A gain or loss from extinguishment of the original liability is recognized in the income statement.
Impairment of financial assetsAt each balance sheet date the Group reassess whether a financial asset or group
of financial assets have suffered impairment losses.
Assets measured using the amortized cost methodWhere objective evidence exists that a loan or receivable measured at amortized
cost has suffered a loss in value, the amount of the loss is measured as the difference between the carrying amount of the asset and the present value of estimated future cash flows (excluding future credit losses) discounted using the original effective interest rate for the asset (i.e., the effective interest rate at the date of initial recogni-tion). The carrying amount of the asset is reduced directly or through a related pro-vision. The amount of the impairment loss is recognized in the income statement.
The Group first assesses objective evidence of impairment of assets individually, for those financial assets which are individually significant, and then individually or collectively for other financial assets. Where there is no objective evidence of impairment for financial assets which are assessed individually, whether significant or otherwise, that asset is then grouped with other financial assets having similar credit characteristics and that group of assets is assessed collectively for impair-ment. Assets which are assessed individually and for which impairment losses have or continue to be identified are not included in the collective assessment.
If, in a subsequent period, the amount of the impairment loss decreases and can be objectively attributed to an event occurring after the impairment was originally recognized, the previously recognized impairment loss may be reversed. Such rever-sals are recognized through the income statement and the restated carrying amount of the asset may not exceed its amortized cost at the date of the reversal.
Assets recognized at cost Where there is objective evidence of the impairment of an unlisted equity instru-
ment not recognized at fair value because its fair value may not be reliably mea-
CONSOLIDATED FINANCIAL STATEMENTS
80
sured, or of a derivative instrument that is linked to an equity instrument of this sort and must be settled by delivering said instrument, the amount of the impair-ment loss is measured as the difference between the carrying value of the asset and the current value of expected future cash flows, discounted at the current market rate of return for a similar financial asset.
Available-for-sale financial assets In the event of impairment of an available-for-sale financial asset, an amount
equal to the difference between its cost (less repayment of principal and amorti-zation) and current fair value, less any impairment losses previously recognized through the income statement, is written off through the income statement. Re-versals of impairment losses on capital instruments designated as available for sale are not recognized in the income statement. Reversals of impairment losses on debt instruments are recognized in the income statement if the increase in fair value of the instrument can be objectively attributed to an event which occurred after the impairment loss was recognized in the income statement.
Provisions and accrualsProvisions for risks and contingenciesProvisions for risks and contingencies are made when the Group has a current
obligation (express or implied) resulting from a past event, it is likely that internal resources will be sacrificed to fulfil the obligation, and the amount can be reliably measured. If the Group believes that a provision will be partially or entirely reim-bursed (e.g., an event covered by an insurance policy) a separate asset is recognized if, and only if, the outcome is virtually certain. In this case, the amount of the provi-sion is shown in the income statement net of the expected reimbursement. If the time value of money is a material factor, provisions are stated at present value using a pre-tax discount rate which reflects, where appropriate, the specific risk of the liability. When a provision is discounted, any resulting increase in the provision is recognized as a financial expense.
Employee benefits and similar obligationsIn accordance with ias 19, employee benefits payable subsequent to the termina-
tion of the employment relationship and other long-term benefits (including the termination benefits in force in Italy) are subject to actuarial valuations in which a series of variables (such as mortality rates, projected future salary increases, infla-tion rate forecasts, etc.) is considered.
According to this method, the liability recognized represents the current value of the obligation, net of any assets in service of the plans, adjusted for any unrecog-nized actuarial gains or losses.
Actuarial gains and losses are recognized directly through the income statement without applying the corridor approach.
CONSOLIDATED FINANCIAL STATEMENTS
81
Revenue recognitionSales of goods are recognized when the goods have been shipped and the Com-
pany has transferred the significant risks and benefits associated with ownership of the goods to the purchaser.
Service revenues are recognized on the basis of the state of completion.Interest income is recognized on an accruals basis, calculated according to the
amount of principal and the effective applicable interest rate, which represents the rate that discounts the estimated future cash flows over the expected life of the fi-nancial asset to bring it into line with the carrying value of the asset.
Dividend revenue is recognized when the right to collect it arises, which normally corresponds with the shareholders’ resolution to distribute a dividend. Dividends distributed are recognized as a liability when the resolution authorizing distribution is passed.
Public grantsPublic grants are recognized when it is reasonably certain that they will be re-
ceived and all related conditions have been satisfied. Where grants are associated with cost items, they are recognized as revenue, but are systematically allocated be-tween financial years so that they are commensurate to the costs they are intended to cover. Where grants are associated with an asset, the fair value is suspended in the long-term liability and is gradually released to the income statement in constant instalments over the expected useful life of the asset.
Financial expensesFinancial expenses are recognized on the income statement in accordance with
the accruals principle by using the effective interest rate.
TaxesTaxes for the year consist of the sum of current and deferred taxes.
Current taxesCurrent taxes are set aside on the basis of an estimate of the taxable income of
consolidated companies in accordance with provisions issued or substantially is-sued at the balance sheet date and taking account of any application exemptions.
Deferred taxesDeferred taxes are calculated on the basis of the temporary taxable differences
between the carrying value of assets and liabilities and the value of said assets and liabilities for tax purposes and are classified among non-current assets and liabili-ties.
Deferred tax assets are only recognized insofar as it is likely that there will be ad-equate future taxable income against which such assets may be recovered.
CONSOLIDATED FINANCIAL STATEMENTS
82
The carrying value of deferred tax assets is reviewed at each balance sheet date and reduced to the extent that it is no longer considered probable that there will be sufficient future taxable income to enable all or part of the tax credits to be utilized. Unrecognized deferred tax assets are reviewed annually at each year end and are recognized where it becomes probable that taxable income will be sufficient to en-able those deferred tax assets to be recovered.
Deferred tax assets and liabilities are determined on the basis of the tax rates it is expected will apply during the period in which said assets or liabilities will be real-ized, considering the tax rates currently in force or known future tax rates.
Taxes related to items which are recognized directly in equity are also recognized directly in equity rather than through the income statement.
Deferred tax assets and liabilities are offset where there exists a legal right to off-set current tax assets with current tax liabilities and deferred taxes arise from the same tax entity and tax authority.
Value added taxRevenue, expense and assets are recognized net of value added tax except where:› the tax applied to goods and services purchased is non-deductible. In such cas-
es, it is recognized as part of the cost of the asset purchased or expense recog-nized in the income statement;
› it relates to a recognized trade receivable or payable which includes valued added tax.
Earnings per shareBase earnings per share is calculated by dividing the net income or loss for the
period attributable to the Parent Company’s ordinary shareholders by the weighted average number of ordinary shares outstanding during the period.
Diluted earnings per share is calculated by adjusting the weighted average num-ber of outstanding shares to account for all potential ordinary shares having dilutive force.
Translation of items in foreign currenciesFunctional currencyGroup companies prepare their financial statements according to the accounting
currency used in their host countries.The Group’s functional currency is the euro, which is the currency in which the
Consolidated Financial Statements are prepared and published.
Transactions and accounting entriesTransactions undertaken in foreign currency are initially recognized at the ex-
change rate on the date of the transaction.At the balance sheet date, monetary assets and liabilities denominated in a for-

CONSOLIDATED FINANCIAL STATEMENTS
83
eign currency are reconverted at the exchange rate in force on said date.Non-monetary items measured at their historical cost in a foreign currency are
converted using the exchange rate in force on the date of the transaction.Non-monetary items measured at their fair values are converted using the ex-
change rate on the date said values are calculated.
Derivatives and hedging transactionsThe Carraro Group’s financial risk management strategy conforms to the com-
pany objectives set out in the policies approved by the Board of Directors of Carraro spa. In particular, it aims to minimize interest rate and exchange rate risk and op-timize the cost of debt.
These risks are managed in accordance with the principles of prudence and mar-ket best practices and all risk management transactions are centrally managed.
The primary objectives set out in the policy are listed below:
a. exchange-rate risks:1. Hedging all commercial and financial transactions against the risk of fluctua-
tion; 2. Applying the “currency balancing” method to hedging the risk, where possible,
by favouring the offsetting of revenues and expenses and payables and receiv-ables in foreign currencies and only engaging in the hedging of the excess bal-ance after offsetting;
3. Not permitting the use and ownership of derivatives or similar instruments for mere trading purposes;
4. Only permitting the use of instruments traded on regulated markets for hedg-ing transactions.
b. interest-rate risks:1. Hedging financial assets and liabilities against the risk of changes in interest
rates;2. In hedging against the risk, complying with the general criteria for balancing
lending and borrowing rates set at the Group level by the Board of Directors of Carraro spa when it approves long-term plans and budgets (fixed and floating interest rates, short-term and medium/long-term shares);
3. Only permitting the use of instruments traded on regulated markets for hedg-ing transactions.
The Group uses financial derivatives such as currency forwards and interest rate swaps to hedge against risks arising primarily from fluctuations in interest and ex-change rates. These derivatives are initially recognized at fair value at inception and reassessed periodically. They are recognized as assets when fair value is positive and liabilities when the fair value is negative.
CONSOLIDATED FINANCIAL STATEMENTS
84
Any gains or losses arising from changes in the fair value of derivatives not suit-able for hedge accounting are booked directly to the income statement.
The fair value of forwards in foreign currencies is determined on the basis of the forward exchange rates for contracts with similar maturity profiles. The fair value of interest rate swaps is determined on the basis of the market value of similar instru-ments.
For hedge accounting purposes, hedging transactions are classified as follows: › fair value hedges if they hedge against the risk of changes in the fair value of the
underlying asset or liability; › cash flow hedges if they hedge against the risk of changes in cash flows arising
from existing assets or liabilities or future transactions; › hedges of net investment in a foreign entity.
Hedging transactions that hedge against the exchange rate risk pertaining to an irrevocable commitment are recognized as cash flow hedges.
At the inception of a hedge, the Group formally designates and documents the hedging relationship to which it intends to apply the hedge accounting method, its risk management objectives, and the strategy it wishes to pursue. The above docu-mentation includes the identification of the hedging instrument, the hedged item or transaction, the nature of the risk, and the methods whereby the entity intends to assess the effectiveness of the hedge in offsetting the exposure to changes in the fair value of the hedged item or the cash flows pertaining to the hedged risk.
Hedges are expected to be highly effective in offsetting the hedged item’s expo-sure to changes in fair value or the cash flows attributable to the hedged risk. As-sessment as to whether hedges have proven highly effective is conducted on a con-stant basis during the years in which the hedges are designated.
Transactions that satisfy the conditions for hedge accounting are recognized as follows.
Fair value hedgesThe Group undertakes fair value hedging transactions to hedge against the expo-
sure to changes in the fair value of a recognized asset or liability, an unrecognized firm commitment, or an identified part of such an asset, liability, or irrevocable commitment that is attributable to a particular risk and could have an impact on the income statement. In fair value hedging, the carrying value of the hedged item is adjusted to reflect gains and losses attributable to the hedged risk, the derivative is premeasured at fair value, and gains and losses are taken on the income state-ment.
Where fair value hedges refer to items recognized according to the amortized cost method, the adjustment of carrying value is charged to the income statement over the residual period leading up to maturity. Any adjustments of the carrying value of

CONSOLIDATED FINANCIAL STATEMENTS
85
a hedge financial instrument to which the effective interest rate method is applied are charged to the income statement.
Amortization may begin as soon as adjustment has occurred but no later than the date on which the hedged item ceases to be adjusted due to changes in its fair value attributable to the hedged risk.
Where an unrecognized firm commitment is designated a hedged item, subse-quent cumulative changes in the fair value attributable to the hedged risk are recog-nized as assets or liabilities and the corresponding gains or losses are taken on the income statement. The changes in the fair value of the hedged instrument are also booked to the income statement.
An instrument is not recognized as a fair value hedge where it has expired, been sold, extinguished, or exercised, no longer satisfies hedge accounting requirements, or the Group revokes its designation as a hedge. Any adjustments of the carrying value of a hedged financial instrument to which the effective interest rate method is applied are charged to the income statement. Amortization may begin as soon as adjustment has occurred but no later than the date on which the hedged item ceases to be adjusted due to changes in its fair value attributable to the hedged risk.
Cash flow hedgesCash flow hedges are transactions that hedge against the risk of changes in the
cash flows attributable to a particular risk associated with a recognized asset or lia-bility or a highly probably future transaction that could affect the income statement. The gains or losses arising from the hedging instrument are entered to equity for the effective portion of the hedge, whereas the remainder (the ineffective portion) is entered to the income statement.
Gains or losses entered to equity are reclassified to the income statement in the period in which the hedged transaction affects the income statement (for example, when the financial income or expense is recognized or when the projected sale or purchase is transacted). When the hedged item is the cost of non-financial assets or liabilities, the sums entered to equity are transferred at the initial carrying value of the asset or liability.
If it is no longer believed that the projected transaction will be undertaken, the sums initially recorded in equity are transferred to the income statement. If the hedging instrument expires or is disposed of, cancelled or exercised without re-placement, or if its designation as a hedge is revoked, the sums previously entered to equity remain in equity until the projected transaction is undertaken. If it is be-lieved that this will no longer occur, the sums are transferred to the income state-ment.
Hedge of a net investment in a foreign operationHedges of net investments in foreign operations, including hedges of a monetary
item recognized as part of a net investment, are recognized in a similar manner
CONSOLIDATED FINANCIAL STATEMENTS
86
to cash flow hedges. The gains or losses arising from the hedging instrument are entered to equity for the effective portion of the hedge, whereas the remainder (the ineffective portion) is entered to the income statement. When the foreign asset is disposed of, the cumulative value of such gains or losses taken in equity is trans-ferred to the income statement.
Credit riskThe Group’s clients include the world’s leading manufacturers of farm equipment,
earth-moving machines, industrial transport vehicles, and light tools. Risk concen-tration is related to the size of these clients, which are, on average, large by world standards. This risk is offset, however, by the fact that credit risk exposure is divided amongst a wide range of counterparties operating in different geographical areas.
Credit management aims at the preferential acquisition of leading Italian and in-ternational clients seeking long-term supply arrangements. This provides the basis for the creation of consolidated, longstanding relationships with the Group’s main clients. These relationships are typically governed by ad hoc supply agreements. Credit control involves periodic monitoring of principal financial information (in-cluding delivery programmes) pertaining to the client.
Credit guarantees are not normally acquired, except in limited circumstances in which this is justified by counterparty risk or country risk.
Accounts receivable are recognized net of any impairment, which is in turn calcu-lated by assessing the risk of insolvency of the counterparty on the basis of available information.
Liquidity riskThe Group’s liquidity risk is primarily linked to securing and maintaining ad-
equate funding for industrial operations. The procurement of financial resources in accordance with the Group’s short and
medium-term development plans is intended to fund both working capital, par-ticularly inventory used in the manufacturing process, and investments in the fixed assets required to provide the production capacity needed to drive growth. These needs are directly proportional to the trend in orders from clients and the ensuing increase in operating volumes.
The Group’s funding strategy is normally aimed at expanding medium-term fund-ing, in part to benefit working capital requirements, while decreasing short-term debt accordingly.
Funding is procured by drawing on bank loans with maturities in line with the Group’s liquidity cycle. The collection and payment cycle reflects average payment times of trade payables of approximately 120 days and average collection times of receivables of 60 days.
Projected cash flow for financial year 2008 reflects, in addition to the aforemen-tioned working capital trend, the effects of the maturity of current liabilities and
CONSOLIDATED FINANCIAL STATEMENTS
87
short-term portion of non-current liabilities and the effects (assuming the same exchange rates as at 31.12.2007) of the unwinding of currency derivatives in force at the balance sheet date. These effects (values and maturities) are represented here-inafter in the tables detailing the relative items.
Transactions aimed at expanding the Group through the acquisition of new enti-ties are undertaken with resources obtained through ad hoc loans or the raising of funds directly on the market (e.g., debenture loans).
Liquidity management, funding needs, and cash flows are under the control and direct management of the Group Treasury Department, which aims to manage the available resources as efficiently as possible.
Exchange-rate and interest-rate riskThe Group is exposed to exchange-rate risk due to the fact that a significant por-
tion of its sales and part of its purchases are transacted in currencies other than the Group’s functional currency, i.e. entities within the euro area undertake commercial transactions with counterparties outside of the euro area, and vice versa.
Another aspect of exchange-rate risk is related to the fact that various Group enti-ties present their financial statements in currencies other than the Group’s functional currency. Each entity’s exposure to exchange-rate risk is regularly monitored by the Group’s Treasury Department according to a strategy that aims first and foremost to offset purchases and sales in foreign currencies and engage in opportune hedging ini-tiatives or the reduction of identified risks using instruments available on the market for the residual amount after offsetting according to the provisions of the Company’s financial risk management policy.
The Group is also exposed to interest-rate risk in connection with financial liabili-ties contracted to fund ordinary operations, and, in some cases, its expansion through acquisitions. Changes in interest rates may have positive or negative effects on net income and cash flow.
The control and management provided by the Group’s Treasury Department for interest-rate risk is also compliant with the guidelines set out the aforementioned Company policy. The strategy adopted pursues the underlying goal of balancing fixed-rate and floating-rate debt. The interest-rate risk on the floating-rate portion is then decreased through targeted hedging transactions.
Infra-group transactionsIn accordance with consob recommendations of 20 February 1997 (dac/97001574)
and 27 February 1998 (dac/98015375), we report that:a. infra-group transactions and transactions with related parties undertaken dur-
ing the year gave rise to commercial and financial dealings and consulting ar-rangements, and were undertaken at market conditions in the economic inter-est of the individual companies participating in the transactions;
b. no transactions considered atypical or unusual in terms of normal business

CONSOLIDATED FINANCIAL STATEMENTS
88
operations were undertaken and the interest rates and borrowing and lending conditions in financial dealings between the various companies were in line with market conditions.
NEW STANDARDS AND INTERPRETATIONS ADOPTED BY THE EUROPEAN UNION BUT NOT YET IN FORCEAs required by ias 8 (Accounting Policies, Changes in Accounting Estimates, and
Errors), we report that the iasb has issued the following standards and interpreta-tions that have yet to enter into force and that the Group has not adopted in ad-vance:
Ifrs 8 – Operating SegmentsOn 30 November 2006, the iasb issued ifrs 8 Operating Segments, which re-
places ias 14 Segment Reporting. and will be applied from 1 January 2009. This new accounting standard requires companies to base their segment reporting on the same components which management uses to make decisions on operational matters and, therefore, requires that reporting segments be based on the internal reports regularly reviewed by management for the purposes of allocating resources to the various segments and analyzing performance. The Company does not believe that this disclosure will have significant effects.
The following additional standards and interpretations are not believed to be ap-plicable to the Group:
ifric 11 – ifrs 2 Group and Treasury Share Transactions;ifric 12 – Service Concession Agreements.
4. BUSINESS COMBINATIONS AND THE ACQUISITION OF MINORITY INTERESTS4.1 Acquisition of the Mini Gears GroupOn 30 July 2007 the Group acquired 100% of shares with voting rights of MG
Holding spa, an unlisted company having its registered office in Padua (Italy) and the parent company of a group specialized in manufacturing gears.
The net assets and goodwill acquired are set out below:
Cost
Payment in cash 50,000
Transaction costs 1,666
Total 51,666
Fair value of net assets acquired 31,451
Goodwill 20,215
Figu
res
in E
uro/
1.0
00
s
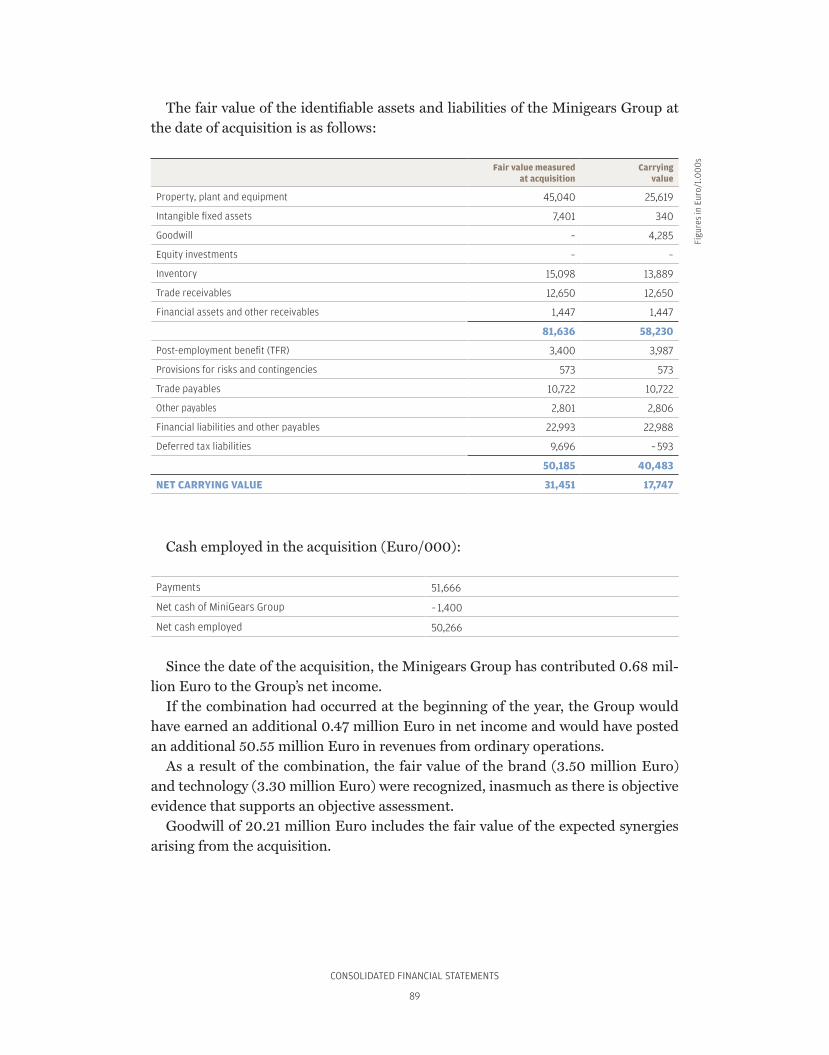
CONSOLIDATED FINANCIAL STATEMENTS
89
The fair value of the identifiable assets and liabilities of the Minigears Group at the date of acquisition is as follows:
Fair value measured at acquisition
Carryingvalue
Property, plant and equipment 45,040 25,619
Intangible fixed assets 7,401 340
Goodwill – 4,285
Equity investments – –
Inventory 15,098 13,889
Trade receivables 12,650 12,650
Financial assets and other receivables 1,447 1,447
81,636 58,230
Post-employment benefit (TFR) 3,400 3,987
Provisions for risks and contingencies 573 573
Trade payables 10,722 10,722
Other payables 2,801 2,806
Financial liabilities and other payables 22,993 22,988
Deferred tax liabilities 9,696 – 593
50,185 40,483
NET CARRYING VALUE 31,451 17,747
Cash employed in the acquisition (Euro/000):
Payments 51,666
Net cash of MiniGears Group – 1,400
Net cash employed 50,266
Since the date of the acquisition, the Minigears Group has contributed 0.68 mil-lion Euro to the Group’s net income.
If the combination had occurred at the beginning of the year, the Group would have earned an additional 0.47 million Euro in net income and would have posted an additional 50.55 million Euro in revenues from ordinary operations.
As a result of the combination, the fair value of the brand (3.50 million Euro) and technology (3.30 million Euro) were recognized, inasmuch as there is objective evidence that supports an objective assessment.
Goodwill of 20.21 million Euro includes the fair value of the expected synergies arising from the acquisition.
Figu
res
in E
uro/
1.0
00
s
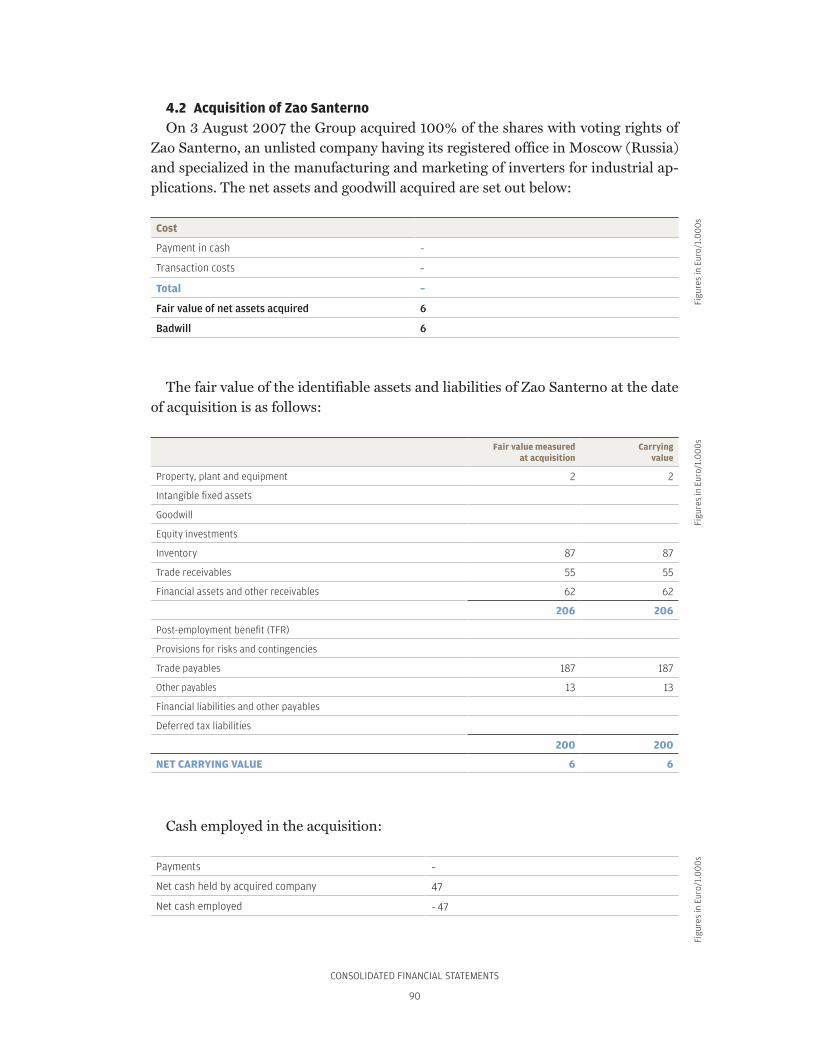
CONSOLIDATED FINANCIAL STATEMENTS
90
4.2 Acquisition of Zao SanternoOn 3 August 2007 the Group acquired 100% of the shares with voting rights of
Zao Santerno, an unlisted company having its registered office in Moscow (Russia) and specialized in the manufacturing and marketing of inverters for industrial ap-plications. The net assets and goodwill acquired are set out below:
Cost
Payment in cash –
Transaction costs –
Total –
Fair value of net assets acquired 6
Badwill 6
The fair value of the identifiable assets and liabilities of Zao Santerno at the date of acquisition is as follows:
Fair value measured at acquisition
Carryingvalue
Property, plant and equipment 2 2
Intangible fixed assets
Goodwill
Equity investments
Inventory 87 87
Trade receivables 55 55
Financial assets and other receivables 62 62
206 206
Post-employment benefit (TFR)
Provisions for risks and contingencies
Trade payables 187 187
Other payables 13 13
Financial liabilities and other payables
Deferred tax liabilities
200 200
NET CARRYING VALUE 6 6
Cash employed in the acquisition:
Payments –
Net cash held by acquired company 47
Net cash employed – 47
Figu
res
in E
uro/
1.0
00
sFi
gure
s in
Eur
o/1.
00
0s
Figu
res
in E
uro/
1.0
00
s

CONSOLIDATED FINANCIAL STATEMENTS
91
Since the date of the acquisition, Zao Santerno has contributed 0.31 million Euro to the Group’s sales and – 0.002 million Euro to the Group’s net income.
If the combination had occurred at the beginning of the year, the Group would have earned an additional 3 thousand Euro in net income and would have posted an additional 188 thousand Euro in revenues from ordinary operations.
5. REPORTING BY BUSINESS SEGMENT AND GEOGRAPHICAL AREAThe Group’s business is primarily organized into business units that represent the
combined entities forming the Group by the main product types. The Group’s other businesses are accessory and complementary to its core busi-
nesses.The business units are broken down as follows:1. Drivelines, with groups together the entities dedicated to manufacturing trans-
mission systems (axles and transmissions): Carraro spa, excluding the former Agritalia facility, AE srl, O&K Antriebstechnik, Carraro Deutschland GmbH, Carraro Argentina, Fon, Carraro India, Carraro North America, Carraro Qing-dao Drive Systems Co., Carraro China Drive Systems Co., and Carraro Qingdao Trading Co.
2. Components, which groups together the entities dedicated to the manufac-turing of components for axles and transmissions: Siap spa, Turbo Gears In-dia, Stm spa, Minigears spa, Minigears Suzhou Co Ltd., Minigears Shanghai Trad. Ltd, and Minigears Inc.
3. Vehicles, consisting of the former Agritalia facility, on business lease to Carraro spa, dedicated to manufacturing farm tractors.
4. Power Controls, consisting of Elettronica Santerno spa and the newly acquired Zao Santerno.
In 2007 Carraro Deutschland GmbH was added to the Drivelines Business Unit, whereas in 2006 it had been classified amongst unallocated operations.
In 2007 Carraro Technologies India Ltd. was added to unallocated operations, whereas in 2006 it had been classified amongst the Drivelines Business Unit.
Information on 2006 was reclassified to provide a basis for comparison with 2007.

CONSOLIDATED FINANCIAL STATEMENTS
92
5.1 Business segmentsThe following table shows the most significant figures per business segment on a
comparative basis (2006 and 2007).
A. Income Statement Highlights
2007 Drivelines Components Vehicles Power controls Eliminations and unallocated items
Consolidated total
SALES 608,662 162,085 93,214 30,015 – 80,242 813,734
Sales to third parties 599,381 91,266 93,152 29,935 – 813,734
Intradivisional sales – – – – – –
Interdivisional sales 9,281 70,819 62 80 – 80,242 –
OPERATING COSTS 595,649 150,207 83,717 24,038 – 79,387 774,224
Direct/indirect materials 413,917 73,552 66,504 16,147 – 78,528 491,592
Use of third-partyservices and assets
97,923 39,754 6,406 3,673 – 2,651 145,105
Personnel 68,062 27,159 9,202 3,926 451 108,800
Depreciationand amortization
14,812 10,991 280 276 – 14 26,345
Provisions 4,872 320 1,421 27 – 6,640
Other income and expenses – 3,937 – 1,569 – 96 – 11 1,355 – 4,258
OPERATING INCOME 13,013 11,878 9,497 5,977 – 855 39,510
Net income on discontinued operations
– – – – – –
2006 Drivelines Components Vehicles Power controls Eliminations and unallocated items
Consolidated total
SALES 547,095 95,127 81,765 11,427 – 68,231 667,183
Sales to third parties 538,626 35,485 81,645 11,427 – 667,183
Intradivisional sales – – – – – –
Interdivisional sales 8,469 59,642 120 – – 68,231 –
OPERATING COSTS 531,195 88,141 75,873 9,550 – 67,620 637,139
Direct/indirect materials 375,453 42,979 58,874 6,413 – 67,529 416,190
Use of third-partyservices and assets
80,865 23,777 7,152 1,482 – 142 113,134
Personnel 61,361 14,956 8,745 1,562 134 86,758
Depreciationand amortization
14,857 6,915 89 83 – 159 21,785
Provisions 4,574 – 1,177 7 – 5,758
Other income and expenses – 5,915 – 486 – 164 3 76 – 6,486
OPERATING INCOME 15,900 6,986 5,892 1,877 – 611 30,044
Net income on discontinued operations
– – – – – –
The earnings of the associate Stm srl at 31/10/06 were recognized on the Con-solidated Financial Statements at 0.55 million Euro and are attributable to the Components segment.
Figu
res
in E
uro/
1.0
00
s

CONSOLIDATED FINANCIAL STATEMENTS
93
In the interest of greater comparability, the information pertaining to segment reporting in 2006 was revised to reflect to new allocations carried out in 2007.
B. Balance Sheet Highlights
2007 Drivelines Components Vehicles Power controls
Eliminations and unallocated
items
Consolidated total
Non-current assets * 217,666 238,058 3,725 5,079 – 149,232 315,296
Current assets 293,565 120,827 31,755 21,534 – 65,260 402,421
Non-current liabilities 29,722 57,673 2,295 1,175 95,248 186,113
Current liabilities 334,644 133,270 28,557 18,560 – 133,431 381,600
* Non-current assets include Euro 21.08 million in goodwill pertaining to the Drivelines BU, Euro 16.12 million in goodwill pertaining to the Power Controls BU and Euro 20.21 million in goodwill attributable to the Components segment.
2006 Drivelines Components Vehicles Power controls Eliminations and unallocated items
Consolidated total
Non-current assets ** 197,839 66,457 1,743 3,911 – 56,509 213,441
Current assets 280,275 65,278 32,188 13,109 – 66,569 324,281
Non-current liabilities 34,645 16,413 2,217 1,284 62,348 116,907
Current liabilities 313,961 67,302 30,801 12,233 – 122,650 301,647
** Non-current assets include Euro 21.08 million in goodwill pertaining to the Drivelines BU and Euro 3.80 million in goodwill pertaining to the Power Controls BU.
In the interest of greater comparability, the information pertaining to segment reporting in 2006 was revised to reflect to new allocations carried out in 2007.
C. Other information
2007 Drivelines Components Vehicles Power controls
Eliminations and unallocated
items
Consolidated total
Investments (Euro/1.000) 29,957 14,472 766 1,355 32,943 79,493
Workforce 2,097 1,583 225 90 41 4,036
Eliminations and unallocated items include 20.21 million Euro in goodwill at-tributable to the Components segment arising from consolidation entries and 12.32 million Euro attributable to the Power Controls Business Unit.
2006 Drivelines Components Vehicles Power controls Eliminations and unallocated items
Consolidated total
Investments (Euro/1.000) 19,604 13,355 1,005 3,964 19,100 57,028
Workforce 1,859 704 219 59 16 2,857
Figu
res
in E
uro/
1.0
00
sFi
gure
s in
Eur
o/1.
00
0s
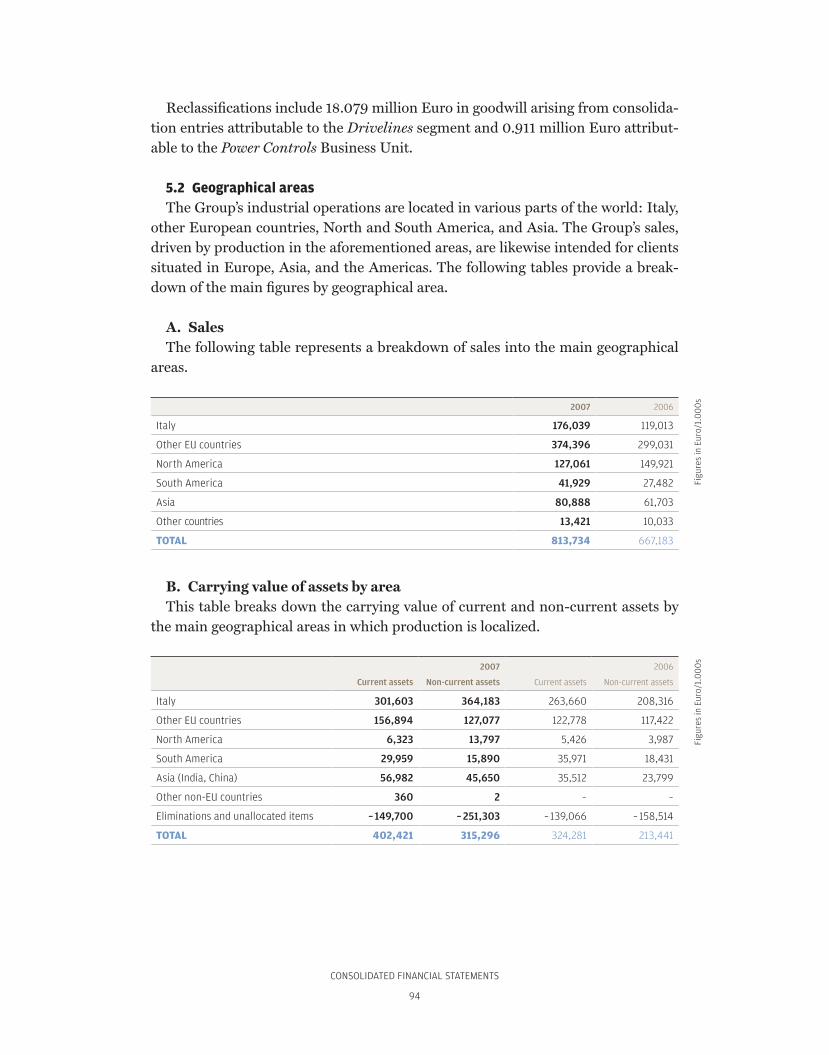
CONSOLIDATED FINANCIAL STATEMENTS
94
Reclassifications include 18.079 million Euro in goodwill arising from consolida-tion entries attributable to the Drivelines segment and 0.911 million Euro attribut-able to the Power Controls Business Unit.
5.2 Geographical areasThe Group’s industrial operations are located in various parts of the world: Italy,
other European countries, North and South America, and Asia. The Group’s sales, driven by production in the aforementioned areas, are likewise intended for clients situated in Europe, Asia, and the Americas. The following tables provide a break-down of the main figures by geographical area.
A. SalesThe following table represents a breakdown of sales into the main geographical
areas.
2007 2006
Italy 176,039 119,013
Other EU countries 374,396 299,031
North America 127,061 149,921
South America 41,929 27,482
Asia 80,888 61,703
Other countries 13,421 10,033
TOTAL 813,734 667,183
B. Carrying value of assets by areaThis table breaks down the carrying value of current and non-current assets by
the main geographical areas in which production is localized.
2007 2006
Current assets Non-current assets Current assets Non-current assets
Italy 301,603 364,183 263,660 208,316
Other EU countries 156,894 127,077 122,778 117,422
North America 6,323 13,797 5,426 3,987
South America 29,959 15,890 35,971 18,431
Asia (India, China) 56,982 45,650 35,512 23,799
Other non-EU countries 360 2 – –
Eliminations and unallocated items – 149,700 – 251,303 – 139,066 – 158,514
TOTAL 402,421 315,296 324,281 213,441
Figu
res
in E
uro/
1.0
00
sFi
gure
s in
Eur
o/1.
00
0s
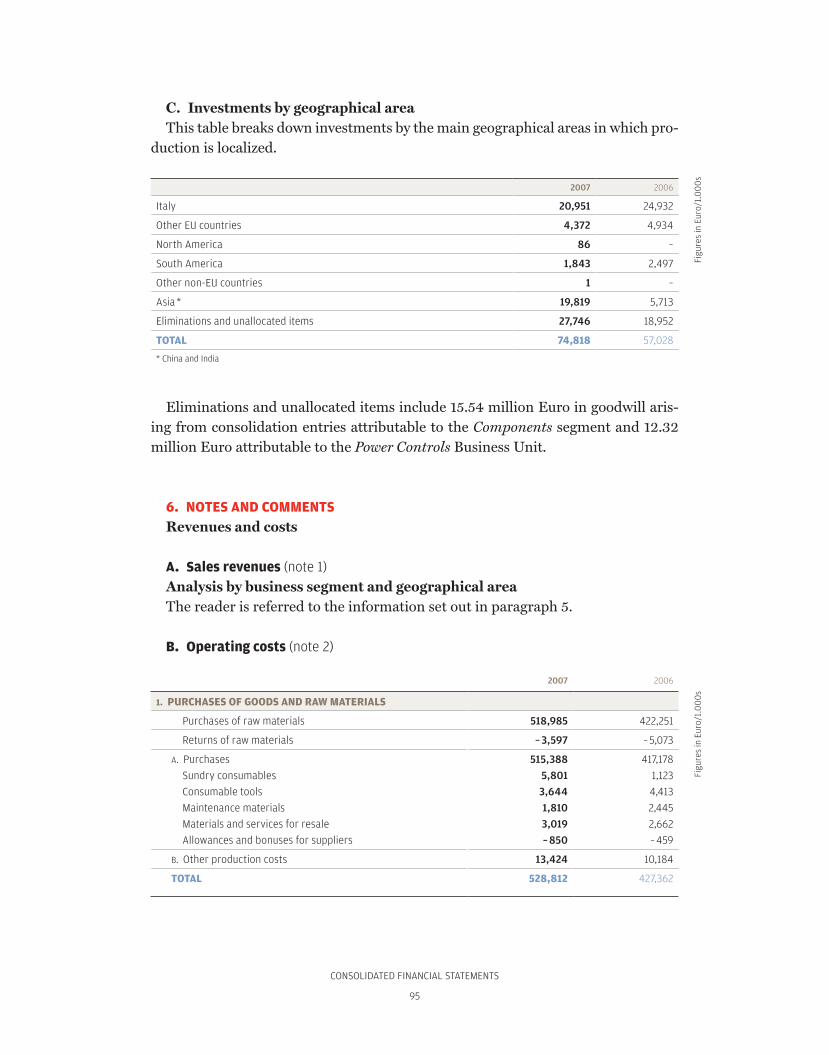
CONSOLIDATED FINANCIAL STATEMENTS
95
C. Investments by geographical areaThis table breaks down investments by the main geographical areas in which pro-
duction is localized.
2007 2006
Italy 20,951 24,932
Other EU countries 4,372 4,934
North America 86 –
South America 1,843 2,497
Other non-EU countries 1 –
Asia * 19,819 5,713
Eliminations and unallocated items 27,746 18,952
TOTAL 74,818 57,028
* China and India
Eliminations and unallocated items include 15.54 million Euro in goodwill aris-ing from consolidation entries attributable to the Components segment and 12.32 million Euro attributable to the Power Controls Business Unit.
6. NOTES AND COMMENTS Revenues and costs
A. Sales revenues (note 1)Analysis by business segment and geographical areaThe reader is referred to the information set out in paragraph 5.
B. Operating costs (note 2)
2007 2006
1. PURCHASES OF GOODS AND RAW MATERIALS
Purchases of raw materials 518,985 422,251
Returns of raw materials – 3,597 – 5,073
A. Purchases 515,388 417,178
Sundry consumables 5,801 1,123
Consumable tools 3,644 4,413
Maintenance materials 1,810 2,445
Materials and services for resale 3,019 2,662
Allowances and bonuses for suppliers – 850 – 459
B. Other production costs 13,424 10,184
TOTAL 528,812 427,362
Figu
res
in E
uro/
1.0
00
sFi
gure
s in
Eur
o/1.
00
0s
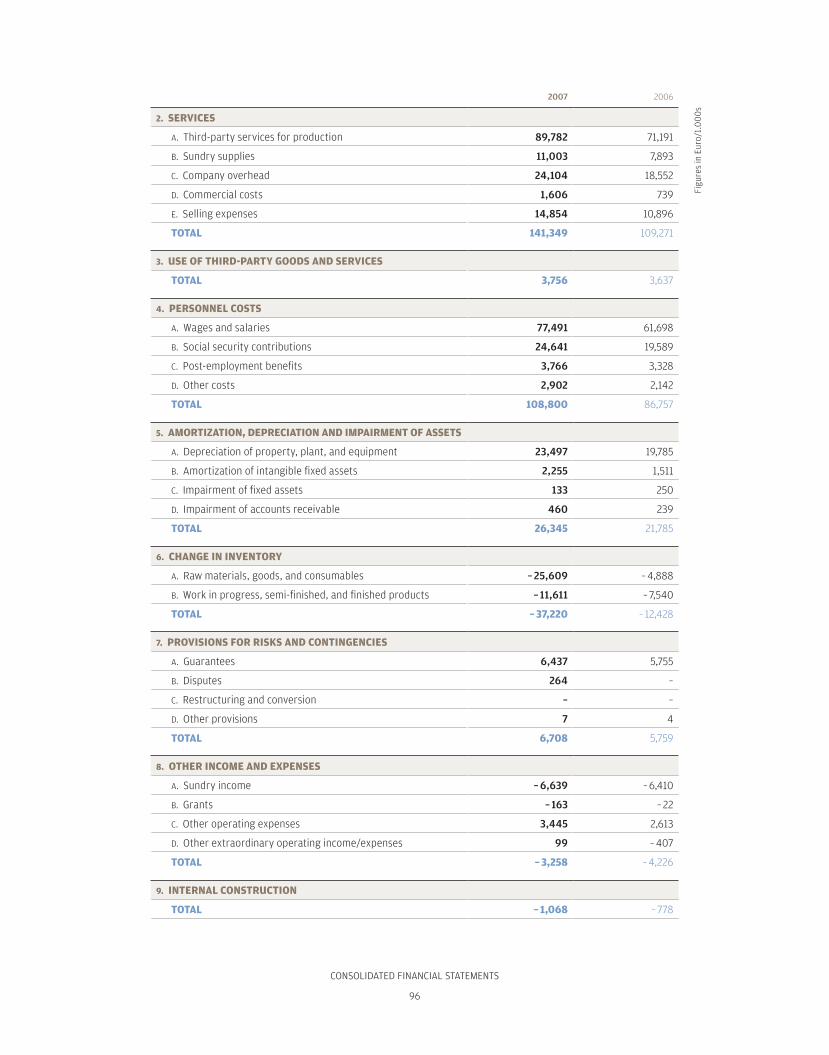
CONSOLIDATED FINANCIAL STATEMENTS
96
2007 2006
2. SERVICES
A. Third-party services for production 89,782 71,191
B. Sundry supplies 11,003 7,893
C. Company overhead 24,104 18,552
D. Commercial costs 1,606 739
E. Selling expenses 14,854 10,896
TOTAL 141,349 109,271
3. USE OF THIRD-PARTY GOODS AND SERVICES
TOTAL 3,756 3,637
4. PERSONNEL COSTS
A. Wages and salaries 77,491 61,698
B. Social security contributions 24,641 19,589
C. Post-employment benefits 3,766 3,328
D. Other costs 2,902 2,142
TOTAL 108,800 86,757
5. AMORTIZATION, DEPRECIATION AND IMPAIRMENT OF ASSETS
A. Depreciation of property, plant, and equipment 23,497 19,785
B. Amortization of intangible fixed assets 2,255 1,511
C. Impairment of fixed assets 133 250
D. Impairment of accounts receivable 460 239
TOTAL 26,345 21,785
6. CHANGE IN INVENTORY
A. Raw materials, goods, and consumables – 25,609 – 4,888
B. Work in progress, semi-finished, and finished products – 11,611 – 7,540
TOTAL – 37,220 – 12,428
7. PROVISIONS FOR RISKS AND CONTINGENCIES
A. Guarantees 6,437 5,755
B. Disputes 264 –
C. Restructuring and conversion – –
D. Other provisions 7 4
TOTAL 6,708 5,759
8. OTHER INCOME AND EXPENSES
A. Sundry income – 6,639 – 6,410
B. Grants – 163 – 22
C. Other operating expenses 3,445 2,613
D. Other extraordinary operating income/expenses 99 – 407
TOTAL – 3,258 – 4,226
9. INTERNAL CONSTRUCTION
TOTAL – 1,068 – 778
Figu
res
in E
uro/
1.0
00
s

CONSOLIDATED FINANCIAL STATEMENTS
97
The main cost items pertaining to industrial operations (purchases, industrial ser-vices, personnel costs) were up on 2006, driven by the growth of production vol-umes and sales recorded in 2007. In some cases, as for purchases, cost items grew more rapidly to satisfy procurement requirements for the launch of new production and new industrial sites.
These structural costs include the increased weight of research and development expenses. Further analysis is provided in the Directors’ Report on Operations.
C. Net financial income and expenses (note 3)
2007 2006
10. INCOME ON EQUITY INVESTMENTS
TOTAL – –
11. OTHER FINANCIAL INCOME
A. Financial assets 14 20
B. Current accounts and bank deposits 534 413
C. Other cash and equivalents 13 8
D. Other income 874 2,768
E. Changes in the fair value of interest-rate derivatives 131 –
TOTAL 1,566 3,209
12. FINANCIAL COSTS AND EXPENSES
A. Financial liabilities – 8,270 – 8,400
B. Current accounts and bank deposits – 3,182 – 626
C. Other expenses – 624 – 833
D. Changes in the fair value of interest-rate derivatives – 349 – 410
TOTAL – 12,425 – 10,269
13. FOREIGN EXCHANGE GAINS AND LOSSES
Foreign-exchange losses:
– exchange-rate derivatives – 541 – 2,062
– change in the fair value of exchange-rate derivatives 72 – 170
– other – 6,265 – 4,979
– 6,734 – 7,211
Foreign-exchange gains:
– exchange-rate derivatives 1,451 799
– change in the fair value of exchange-rate derivatives 84 1,746
– other 6,427 3,773
7,962 6,318
TOTAL 1,228 – 893
14. ADJUSTMENTS TO THE VALUE OF FINANCIAL ASSETS
– Equity investments – –
– Non-current financial assets – –
– Current financial assets – –
Figu
res
in E
uro/
1.0
00
s
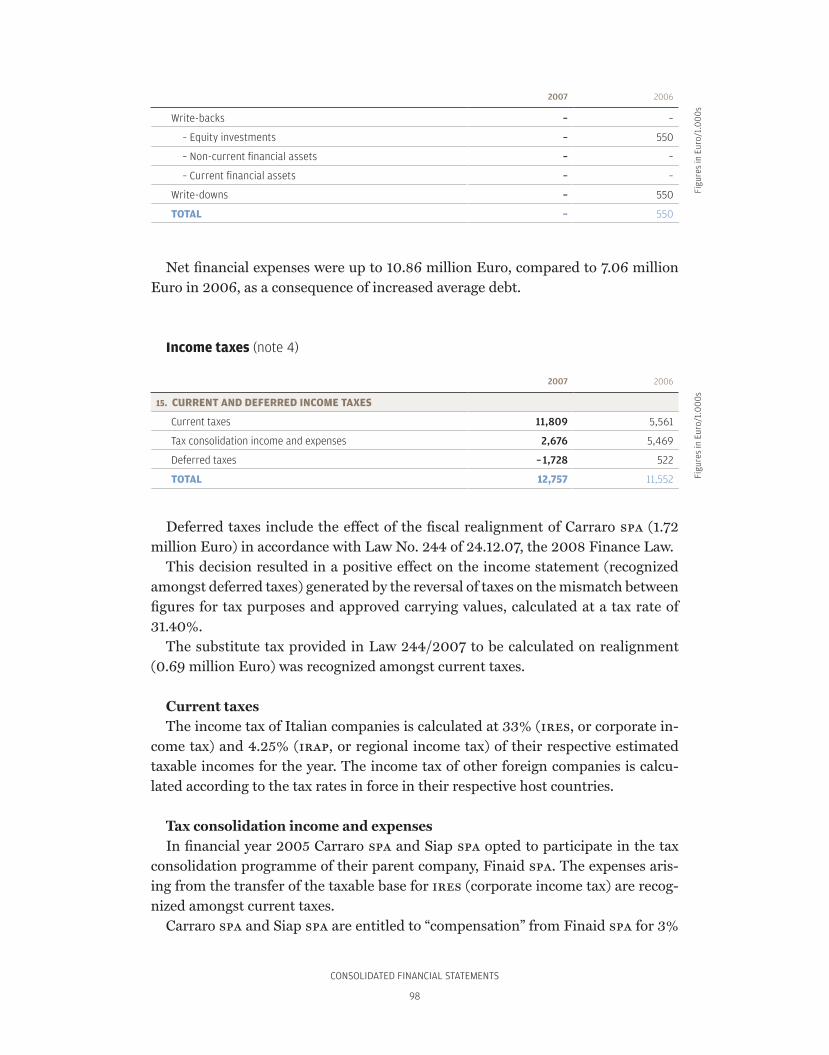
CONSOLIDATED FINANCIAL STATEMENTS
98
2007 2006
Write-backs – –
– Equity investments – 550
– Non-current financial assets – –
– Current financial assets – –
Write-downs – 550
TOTAL – 550
Net financial expenses were up to 10.86 million Euro, compared to 7.06 million Euro in 2006, as a consequence of increased average debt.
Income taxes (note 4)
2007 2006
15. CURRENT AND DEFERRED INCOME TAXES
Current taxes 11,809 5,561
Tax consolidation income and expenses 2,676 5,469
Deferred taxes – 1,728 522
TOTAL 12,757 11,552
Deferred taxes include the effect of the fiscal realignment of Carraro spa (1.72 million Euro) in accordance with Law No. 244 of 24.12.07, the 2008 Finance Law.
This decision resulted in a positive effect on the income statement (recognized amongst deferred taxes) generated by the reversal of taxes on the mismatch between figures for tax purposes and approved carrying values, calculated at a tax rate of 31.40%.
The substitute tax provided in Law 244/2007 to be calculated on realignment (0.69 million Euro) was recognized amongst current taxes.
Current taxesThe income tax of Italian companies is calculated at 33% (ires, or corporate in-
come tax) and 4.25% (irap, or regional income tax) of their respective estimated taxable incomes for the year. The income tax of other foreign companies is calcu-lated according to the tax rates in force in their respective host countries.
Tax consolidation income and expensesIn financial year 2005 Carraro spa and Siap spa opted to participate in the tax
consolidation programme of their parent company, Finaid spa. The expenses aris-ing from the transfer of the taxable base for ires (corporate income tax) are recog-nized amongst current taxes.
Carraro spa and Siap spa are entitled to “compensation” from Finaid spa for 3%
Figu
res
in E
uro/
1.0
00
sFi
gure
s in
Eur
o/1.
00
0s

CONSOLIDATED FINANCIAL STATEMENTS
99
of the tax losses arising from tax consolidation, offset with the taxable bases trans-ferred by each.
Following the capital issue by Gear World spa, subscribed in July 2007 by Inter-banca spa, the subsidiary Siap spa ceased to satisfy the requirements to participate in the tax consolidation programme of Finaid spa.
The tax consolidation expenses recognized amongst current taxes may be broken down as follows:
Tax consolidation expenses (33%) on the taxable base transferred 2,703
“Compensation” for the use of tax losses arising from tax consolidation (3%) – 27
TOTAL 2,676
Deferred taxesDeferred taxes are set aside on the temporary differences between the carrying
values of assets and liabilities and their corresponding values for tax purposes.The deferred taxes of Italian companies were recalculated according to the new
tax rates in force in 2008 (ires of 27.50% and irap of 3.90%). The effect on the income statement was a positive 0.16 million Euro.
The provision for taxes for the year may be reconciled with the figure posted on the Financial Statements as follows:
31/12/2007 % 31/12/2006 %
Income before taxes 29,879 22,641
Theoretical tax rate of 37.25% 11,130 37.25% 8,434 37.25%
Fiscal realignment – 1,026 – 3.43% – –
Effect of non-deductible costs 3,615 12.10% 3,146 13.90%
Non-taxable income 90 0.30% 121 0.53%
Unrecognized tax losses – 727 – 2.43% – 85 – 0.38%
Other unrecognized deferred taxes – 142 – 0.48% 479 2.12%
Change in deferred tax rates – 165 – 0.55% – –
Difference of tax rates of foreign entities – 18 – 0.06% – 543 – 2.40%
Taxes at effective tax rate 12,757 42.70% 11,552 51.02%
In addition to the taxes recognized on the Income Statement for the year, 0.26 million Euro in deferred tax assets were booked directly to equity.
Research and development costs (not subject to capitalization)In financial year 2007 studies and experiments were conducted involving the use
of resources engaged in development and production.The Group incurred a total of 15.069 million Euro in costs for these activities in
2007 (which may not be capitalized as they do not satisfy the requirements set out in ias 38).
Figu
res
in E
uro/
1.0
00
s

CONSOLIDATED FINANCIAL STATEMENTS
100
Group earnings per share (note 5)
EARNINGS 31/12/2007Euro/1.000
31/12/2006Euro/1.000
Earnings for the calculation of base earnings per share 15,586 10,534
Effect of dilution arising from potential ordinary shares: – –
Earnings for the calculation of diluted earnings per share 15,586 10,534
NUMBER OF SHARES 31/12/2007N./1.000
31/12/2006N./1.000
Weighted average number of ordinary shares for the calculationof base earnings per share:
42,000 42,000
Effect of dilution arising from potential ordinary shares – –
Weighted average number of ordinary shares for the calculationof diluted earnings per share:
42,000 42,000
31/12/2007Euro
31/12/2006Euro
Base earnings per share: 0.37 0.25
Diluted earnings per share: 0.37 0.25
Dividends paidThe dividends paid by Carraro spa in 2007 (pertaining to the distribution of 2006
earnings, as authorized by the Shareholders’ Meeting on 15 May 2007) came to a total of 5,250 thousand Euro, or 0.125 Euro per ordinary share.
The Company has not issued shares other than ordinary shares.In 2006 dividends paid (pertaining to the distribution of 2005 earnings) came to
a total of 5,250 thousand Euro, or 0.125 Euro per ordinary share.
Property, plant and equipment (note 6)The item showed a net balance of 225.06 million Euro, compared to 166.74 mil-
lion Euro in 2006.It was broken down as follows:
ITEMS Land and buildings
Plant and machinery
Industrial equipment
Other assets Assets under development and
payments on account
Total
Historical cost 50,869 112,451 47,809 8,696 2,636 222,461
Accumulated depreciation – 6,225 – 37,636 – 20,012 – 4,053 – – 67,926
Impairment – 1,117 – 13 – 9 – – – 1,139
NET VALUE 31/12/2005 43,527 74,802 27,788 4,643 2,636 153,396
Changes in 2006
Increases 5,469 13,802 7,300 2,019 2,960 31,550
Decrementi – – 326 – 19 – 107 – 805 – 1,257
Capitalization – 886 280 32 – 1,198 –
Figu
res
in E
uro/
1.0
00
s

CONSOLIDATED FINANCIAL STATEMENTS
101
ITEMS Land and buildings
Plant and machinery
Industrial equipment
Other assets Assets under development and
payments on account
Total
Change inconsolidation area
2,359 3,581 1,032 265 143 7,380
Depreciation – 1,610 – 10,872 – 5,954 – 1,089 – – 19,525
Reclassifications 729 286 – 98 – 208 – 709 –
Impairment – – 250 – 252 – – – 502
Translation difference – 1,562 – 1,913 – 653 – 96 – 73 – 4,297
NET VALUEAT 31/12/2006
48,912 79,996 29,424 5,459 2,954 166,745
Consisting of:
Historical cost 58,866 135,013 57,357 10,823 2,954 265,013
Accumulated depreciation
– 8,947 – 54,754 – 27,692 – 5,364 – – 96,757
Impairment – 1,007 – 263 – 241 – – – 1,511
ITEMS Land and buildings
Plant and machinery
Industrial equipment
Other assets Assets under development and
payments on account
Total
Historical cost 58,866 135,013 57,357 10,823 2,954 265,013
Accumulated depreciation – 8,947 – 54,754 – 27,692 – 5,364 – – 96,757
Impairment – 1,007 – 263 – 241 – – – 1,511
NET VALUE 31/12/2006 48,912 79,996 29,424 5,459 2,954 166,745
Changes in 2007
Increases 7,571 11,551 13,347 2,035 7,967 42,471
Decrementi – 12 – 1,057 – 72 – 144 – 1,572 – 2,857
Capitalization – 2,104 892 28 – 3,024 –
Change inconsolidation area
3,650 32,141 7,170 695 1,387 45,043
Depreciation – 1,863 – 12,850 – 7,445 – 1,339 – – 23,497
Reclassifications 161 255 – 39 – 308 – 69 –
Impairment – – 16 – 89 – 28 – – 133
Translation difference – 1,013 – 1,157 – 505 – 35 – – 2,710
NET VALUEAT 31/12/2007
57,406 110,967 42,683 6,363 7,643 225,062
Consisting of:
Historical cost 69,211 175,875 77,154 12,836 7,643 342,719
Accumulated depreciation
– 10,798 – 64,629 – 34,141 – 6,445 – – 116,013
Impairment – 1,007 – 279 – 330 – 28 – – 1,644
At 31/12/ 07 a total of 4.64 million Euro in leased assets were recognized amongst plant and machinery and 4.03 million Euro amongst land and buildings.
The increase in land and buildings was primarily related to the new industrial building of Carraro China Drive Systems Co. (6.25 million Euro) and the increase in
Figu
res
in E
uro/
1.0
00
sFi
gure
s in
Eur
o/1.
00
0s

CONSOLIDATED FINANCIAL STATEMENTS
102
the industrial building of Siap spa (0.66 million Euro).The increases in plant and machinery were primarily related to investments by
Siap spa, Turbo Gears India Ltd., Fon sa, Carraro Argentina sa and Carraro spa.The increases in industrial equipment were primarily related to the purchase of
models for casting and tools by Carraro spa , Carraro China Drive Systems Co. Ltd., Siap spa, Carraro Argentina sa and Mini Gears spa. The increases in assets under development and payments on account were primarily related to investments in progress by Carraro India Ltd. (3.09 million Euro), Fon sa (1.30 million Euro), Mini Gears (Suzhou) Co. Ltd. (0.52 million Euro), Carraro China Drive Systems Co. Ltd. (0.47 million Euro) and Turbo Gears India Ltd. (0.45 million Euro).
A total of 5.68 million Euro in liens securing outstanding loans from bnp were in place on the property, plant, and equipment of Carraro India.
Intangible assets (note 7)The item showed a net balance of 73.33 million Euro, compared to 31.33 million
Euro in 2006. It was broken down as follows:
ITEMS Goodwill Dev. costs Intellectual property rights
and patents
Franchises, licenses, and
trademarks
Assets under development and
payments on account
Other intangible
fixed assets
Total
Historical cost 4,000 5,016 380 3,457 989 271 14,113
Accumulated depreciation
– – 2,127 – 174 – 2,181 – – 187 – 4,669
Impairment – 1,000 – 90 – – – – – 1,090
NET VALUE 31/12/2005
3,000 2,799 206 1,276 989 84 8,354
Changes in 2006
Increases 21,879 1,088 60 879 1,401 172 25,479
Decrementi – – – – – – 1,006 – 1,006
Capitalization of internal costs
– 1,078 – 212 – 1,290 – –
Change inconsolidation area
– – – 3 12 – 6 15
Amortization – – 721 – 96 – 664 – – 30 – 1,511
Reclassifications – – 925 – 40 – 60 945 –
Impairment – – – – – – –
Translation difference – 4 – 1 – – 6 – 1
NET VALUEAT 31/12/2006
24,879 3,323 167 1,756 1,040 165 31,330
Consisting of:
Historical cost 25,879 6,265 438 4,586 1,040 365 38,573
Accumulated depreciation
– – 2,851 – 271 – 2,830 – – 200 – 6,152
Impairment – 1,000 – 91 – – – – – 1,091
Figu
res
in E
uro/
1.0
00
s

CONSOLIDATED FINANCIAL STATEMENTS
103
ITEMS Goodwill Dev. costs Intellectual property rights
and patents
Franchises, licenses, and
trademarks
Assets under development and
payments on account
Other intangible
fixed assets
Total
Historical cost 25,879 6,265 438 4,586 1,040 365 38,573
Accumulated depreciation
– – 2,851 – 271 – 2,830 – – 200 – 6,152
Impairment – 1,000 – 91 – – – – – 1,091
NET VALUE 31/12/2006
24,879 3,323 167 1,756 1,040 165 31,330
Changes in 2007
Increases 32,535 238 79 1,278 2,396 496 37,022
Decrementi – – – 3 – – 216 – 213
Capitalization of internal costs
– 180 – 35 – 215 – –
Change inconsolidation area
– 2 – 6,906 – 493 7,401
Amortization – – 969 – 80 – 1,063 – – 143 – 2,255
Reclassifications – – 43 – – 81 59 65 –
Impairment – – – – – – –
Translation difference – 52 – 1 – – 10 43
NET VALUEAT 31/12/2007
57,414 2,783 166 8,835 3,280 850 73,328
Consisting of:
Historical cost 58,414 6,728 518 12,743 3,280 2,316 83,999
Accumulated depreciation
– – 3,854 – 352 – 3,908 – – 375 – 8,489
Impairment – 1,000 – 91 – – – – 1,091 – 2,182
The item “Franchises, licenses, and trademarks” includes the fair value of the brand (3.50 million Euro) and the technology (3.30 million Euro) acquired through the purchase of the Mini Gears Group. Intangible fixed assets such as the above with a definite useful life are amortized at constant rates over their useful life, estimated at 10 and 7 years for the brand and the technology.
Other intangible fixed assets with a definite useful life are amortized at constant rates over their useful life, estimated at between 3 and 5 years.
GoodwillThe item “Goodwill” may be broken down as follows.In regard to the stated goodwill values:› 3.00 million Euro generated by the consolidation entries of the unit corre-
sponding to O&K Antriebstechnik GmbH & Co. KG., as the difference between the value of the equity investment and the current values of the subsidiary’s assets and liabilities;
› 18.08 million Euro generated by the consolidation entries of the unit corre-sponding to Carraro India Ltd., as the difference between the value of the re-
Figu
res
in E
uro/
1.0
00
s

CONSOLIDATED FINANCIAL STATEMENTS
104
sidual share of the equity investment acquired in 2006 and the corresponding share of the carrying value of the company’s assets and liabilities;
› 16.12 million Euro pertaining to the unit corresponding to Elettronica San-terno spa, consisting of 2.89 million euro in goodwill paid to Casalfiumanese spa for the purchase and 13.23 million Euro as the difference between the val-ue of the equity investment and the current values of the subsidiary’s assets and liabilities. The increase during the year (12.32 million Euro) pertained to the adjustment of the valuation of the put option held by the minority-interest shareholder. Carraro spa has a call option on the remaining 33% of Elettronica Santerno, which may be exercised between 1 June 2009 and 31 May 2011, and the minority-interest shareholder has a call option on the same stake, which may be exercised within 30 days of 31 May 2011;
› 20.21 million Euro generated by the consolidation entries of the unit corre-sponding to the Mini Gears Group, as the difference between the value of the equity investment acquired during the year and the current values of the assets and liabilities of subsidiaries.
Each of the four above components of goodwill pertains to a cash-generating unit and has been subjected to specific impairment testing. As these production units belong to the industrial manufacturing segment, the following common criteria were applied to impairment testing:
› financial projections were based on the Group’s three-year strategic plan and internal estimates for subsequent periods;
› the assumptions in the plan and additional estimates were borne out both by the amount of current order portfolios and information on the produc-tion plans of the Group’s main clients, as well as the projected performance of source markets and an awareness of the dynamics of underlying industrial processes;
› the time horizon applied in estimating future cash flows embraces a period of four to five years. Thereafter a perpetuity in line with the cash flows from the final year of the analytical projection is assumed;
› the assumed growth rate for periods subsequent to the time horizon of the ana-lytical estimate ranges from 1.5% to 1.8%;
› the pre-tax discount rates applied to cash flow projections reflect the cost of debt in the country in question and spreads for investment in risk capital.

CONSOLIDATED FINANCIAL STATEMENTS
105
The main parameters adopted by the Group are summarized below:
31/12/2006 Change 31/12/2007 Period of explicit projection
(years)
Growth rate after period of explicit
projection
Pre-taxdiscount rate
Acquisition of 100% of O&K Antriebstechnik GmbH &Co. KG
3,000 – 3,000 5 1.5% 10.83%
Acquisition of minority interests in Carraro India Ltd. (remaining 49% stake)
18,079 – 18,079 5 1.5% 15.87%
Acquisition of Elettronica Santerno S.p.A.
3,799 12,321 16,120 5 1.5% 11.91%
Acquisition of 100% of Mini Gears Group
– 20,215 20,215 4 1.8% 7.40%
Total 24,879 32,536 57,414
Development costsThe main increases were due to the development costs incurred by Siap spa and
Fon sa. These pertained to the design of new product lines developed in connection with similar projects launched by clients. Other product-related studies are current being planned and have been recognized amongst assets under development.
Internally-generated development costs are capitalized at cost.
Franchises, licenses, and trademarksThe increase was primarily related to the purchase of new software by Carraro
spa and Elettronica Santerno spa.
Real-estate investments (note 8)The item showed a net balance of 0.7 million Euro. It was broken down as fol-
lows:
ITEMS Land Buildings Total
Value at 31/12/2006 – 712 712
Changes in 2007:
Increases – – –
Decreases – – –
Depreciation – – –
Change in exchange rate – – 2 – 2
Value at 31/12/2007 – 710 710
Real-estate investments pertain to civil real estate owned by Carraro spa, Siap spa and Carraro Argentina sa.
Figu
res
in E
uro/
1.0
00
sFi
gure
s in
Eur
o/1.
00
0s

CONSOLIDATED FINANCIAL STATEMENTS
106
The fair value of these investments does not diverge significantly from the cost of initial recognition, considering that these investments were recognized at their fair value, taken as their “deemed cost”, during the first-time application of ifrs.
These investments are not depreciated.
Equity investments (note 9)Changes in equity investments in 2007:
ITEMS Value at 31/12/2006
Increases / Decreases
Write-downs / Write-backs
Changes in the scope of
consolidation
Adjustment of exchange
rates
Value at 31/12/2007
Carraro PNH Components India Ltd. 172 – – – – 172
Eletronica Santerno Industriae Comercio Ltda
– 10 – – – 10
Carraro North America Inc. – 1 – – – 1
Subsidiaries 172 11 – – – 183
Elcon Srl 12 – 12 – – – –
Associates 12 – 12 – – – –
Parent companies – – – – – –
Held for sale – 12 – – – 12
Total equity investments 184 11 – – – 195
The equity investment in Elcon srl was reclassified to equity investments held for sale.
Equity investments held for saleThe equity investment in the associate Elcon srl was reclassified as a non-cur-
rent asset held for sale inasmuch as there is an agreement with the company’s share-holders to dispose of the company.
Equity investments in subsidiariesThe item showed a balance of 0.18 million Euro and may be broken down as fol-
lows:
Company Controlling entity Registered office Currency Shareholders’ Equity31/12/07 (Euro)
Percent ownership
Carrying value
Carraro PNHComponents India Ltd.
Carraro India Ltd. Bombay (India) INR 195 99.998% 172
Eletronica SanternoIndustria e Comercio Ltda
Elettronica Santerno Spa
San Paolo (Brasil)
BRL 10 100% 10
CarraroNorth America Inc.
Carraro Spa Virginia Beach Virginia (USA)
USD 1 100% 1
Carraro Korea Ltd. Carraro International Sa
Ulsan (Korea) KW 9 100% –
Figu
res
in E
uro/
1.0
00
s

CONSOLIDATED FINANCIAL STATEMENTS
107
Financial assets (note 10)
31/12/2007 31/12/2006
Non-current financial assets
Loans and receivables
Third parties – 100
– 100
Other financial assets
At current values – –
Held to maturity – –
Available for sale 167 152
Cash flow hedge derivatives (Irs on loans) 960 713
1,127 865
Prepaid financial expenses and accrued income
Third parties 8 88
8 88
Current financial assets
Loans and receivables
Associates 84 84
Third parties – 15
84 99
Other financial assets
At current values (exchange-rate derivatives) 163 220
At current values (interest-rate derivatives) – –
Held to maturity – –
Available for sale – 73
Cash flow hedge derivatives (exchange-rate derivatives) 978 644
1,141 937
Prepaid financial expenses and accrued income
Third parties 612 793
612 793
Current loans and receivables› Associates (0.084 million Euro): this item consists of loans granted by Carraro
spa to Elcon srl bearing interest at a rate of 4%.
Other non-current financial assets› Available for sale (0.1687 million Euro): this item consists of minority-interest
equity investments, which consequently have no set date of redemption;› Cash flow hedge derivatives (1.01 million Euro): the figure refers to the fair
value of seven irs contracts entered into by Carraro International and Minige-ars spa at 31/12/07.
Other current financial assets› Cash flow hedge derivatives (0.98 million Euro): The figure refers to the posi-
Figu
res
in E
uro/
1.0
00
s
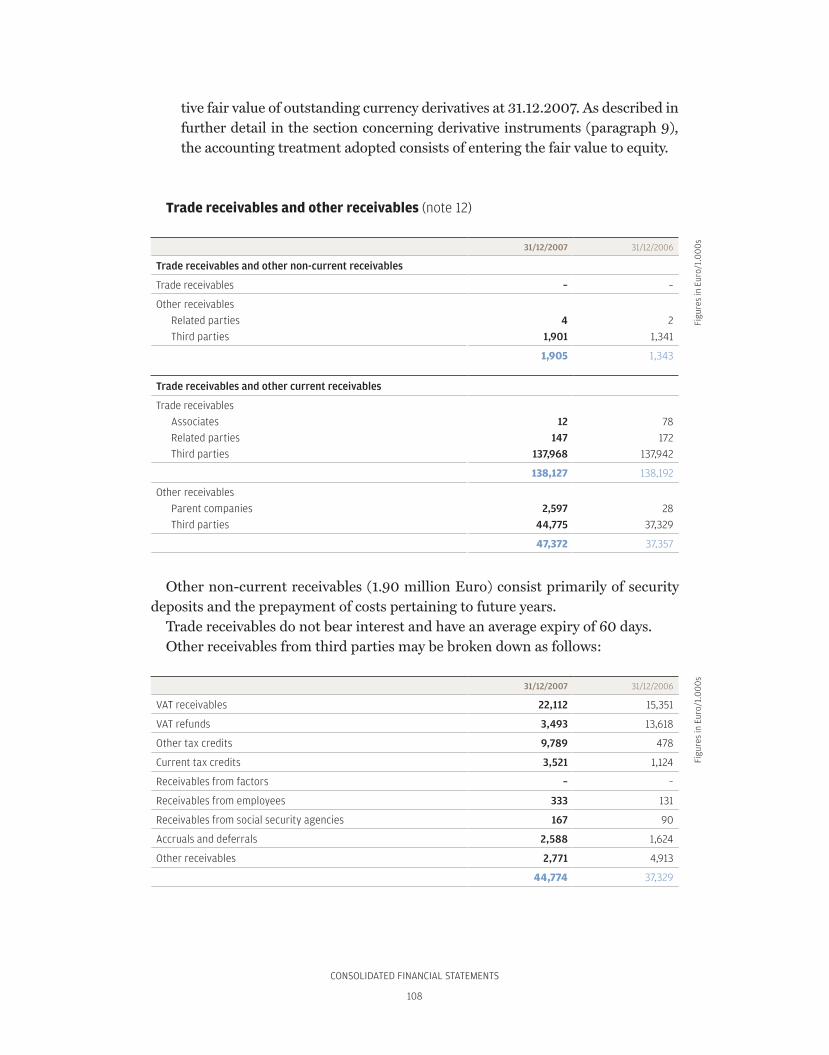
CONSOLIDATED FINANCIAL STATEMENTS
108
tive fair value of outstanding currency derivatives at 31.12.2007. As described in further detail in the section concerning derivative instruments (paragraph 9), the accounting treatment adopted consists of entering the fair value to equity.
Trade receivables and other receivables (note 12)
31/12/2007 31/12/2006
Trade receivables and other non-current receivables
Trade receivables – –
Other receivables
Related parties 4 2
Third parties 1,901 1,341
1,905 1,343
Trade receivables and other current receivables
Trade receivables
Associates 12 78
Related parties 147 172
Third parties 137,968 137,942
138,127 138,192
Other receivables
Parent companies 2,597 28
Third parties 44,775 37,329
47,372 37,357
Other non-current receivables (1.90 million Euro) consist primarily of security deposits and the prepayment of costs pertaining to future years.
Trade receivables do not bear interest and have an average expiry of 60 days.Other receivables from third parties may be broken down as follows:
31/12/2007 31/12/2006
VAT receivables 22,112 15,351
VAT refunds 3,493 13,618
Other tax credits 9,789 478
Current tax credits 3,521 1,124
Receivables from factors – –
Receivables from employees 333 131
Receivables from social security agencies 167 90
Accruals and deferrals 2,588 1,624
Other receivables 2,771 4,913
44,774 37,329
Figu
res
in E
uro/
1.0
00
sFi
gure
s in
Eur
o/1.
00
0s

CONSOLIDATED FINANCIAL STATEMENTS
109
Where the requirements are satisfied, Vat refunds of Italian companies accrue interest at the rate of 2.75%.
Trade receivables and other receivables (gross of the provision for doubtful debts) are set out in the following table:
31/12/2007
PAST DUE DUE
By less than 1 year By more than 1 year Within 1 year Beyond 1 year TOTAL
Trade receivables 30,618 1,058 110,514 – 142,190
Other receivables – – 47,372 1,905 49,277
TOTAL 30,618 1,058 157,886 1,905 191,467
31/12/2006
PAST DUE DUE
By less than 1 year By more than 1 year Within 1 year Beyond 1 year TOTAL
Trade receivables 27,622 1,276 112,408 - 141,306
Other receivables - - 37,357 1,343 38,700
TOTAL 27,622 1,276 149,765 1,343 180,006
The items subject to analytical write-downs come to 3.374 million; all Euro of these were past due by more than one year.
Provisions for doubtful debtsThe following table breaks down the gross and net values of receivables:
31/12/2007 31/12/2006
Trade receivables from third parties 142,030 141,056
Provision for doubtful debts – 4,063 – 3,114
Net 137,967 137,942
Other receivables from parent companies 1,292 1,292
– 1,292 – 1,292
– –
Other receivables from third parties 44,970 37,584
Provision for doubtful debts – 196 – 255
44,774 37,329
The following table shows the changes in the provision for doubtful debts over the years considered.
Figu
res
in E
uro/
1.0
00
sFi
gure
s in
Eur
o/1.
00
0s

CONSOLIDATED FINANCIAL STATEMENTS
110
31/12/2006 Increases Decreases Change in consolidation area
Other changes
31/12/2007
Provision for doubtful trade receivables
3,114 409 – 41 653 – 72 4,063
Provision for doubtful other receivables
255 64 – 105 – – 18 196
Provision for doubtful receivables from subsidiaries
1,292 – – – – 1,292
TOTAL 4,661 473 – 146 653 – 90 5,551
The provision for doubtful trade receivables is recognized to cover projected loss-es on specific receivable positions totalling 2.082 million Euro. The remainder of the provision for doubtful trade receivables and other receivables is recognized to cover the risk on other past-due positions according to the estimate of the loss that is currently believed likely to be incurred. The provision for doubtful receivables from subsidiaries refers to residual receivables from the subsidiary Carraro Korea ltd, which has discontinued operations and is currently in liquidation.
Inventory (note 13)
ITEMS 31/12/2007 31/12/2006
Raw materials 107,463 75,754
Work in progress and semi-finished products 47,396 34,493
Finished products 40,968 32,976
Goods in transit 406 188
Total inventory 196,233 143,411
Inventory allowance – 13,803 – 12,493
Total inventory 182,430 130,918
Inventory stood at 182.43 million Euro, up from 130.92 million Euro at 31/12/06. The increase in 2007 was due both to the rise in orders and production volumes and the ensuing need to increase stock on hand and the inclusion of the Minigears Group (13.85 million Euro at 31/12/07) in the consolidation area.
The following changes affected the inventory allowance during the year:
Balance at 31/12/2006 12,493
Accruals 3,335
Changes in the scope of consolidation 771
Releases – 2,751
Translation differences – 45
Balance at 31/12/2007 13,803
Figu
res
in E
uro/
1.0
00
sFi
gure
s in
Eur
o/1.
00
0s
Figu
res
in E
uro/
1.0
00
s

CONSOLIDATED FINANCIAL STATEMENTS
111
Cash and equivalents (note 14)
31/12/2007 31/12/2006
Cash 138 84
Current accounts and bank deposits 32,478 15,845
Other cash and equivalents 39 56
Total 32,655 15,985
Short-term bank deposits bear interest at a floating rate.
Shareholders’ equity (note 15)Share capitalThe share capital of Carraro spa came to 21,840,000 Euro at 31 December 2007,
broken down into 42,000,000 shares with a nominal value of 0.52 Euro each.The Company has issued a single category of ordinary shares that do not pay a fixed
dividend. No other financial instruments that confer equity or ownership rights have been issued. No capital issues were undertaken during the year.
Other reservesShare premium account
Share premium
At 1 January, 2007 17,833
Share capital issue –
Other changes for the year –
At 31 December 2007 17,833
There were no changes to the share premium account during the year.
Retained earningsThe item includes the undistributed or retained portion of net income:› 4,458 thousand Euro pertaining to the legal reserve of Carraro spa;› 8,791 thousand Euro pertaining to the retained earnings of Carraro spa;› 20,958 thousand Euro generated by the excess shareholders’ equity of subsid-
iaries with respect to the carrying value of the corresponding equity invest-ments and consolidation adjustments.
Reserve for first-time application of ias/ifrsThe reserve for first-time application of ias/ifrs came to 44.384 million Euro at
31/12/07.
Figu
res
in E
uro/
1.0
00
sFi
gure
s in
Eur
o/1.
00
0s

CONSOLIDATED FINANCIAL STATEMENTS
112
Cash-flow hedge reserve The item includes the sums arising from the application of the criterion applied
to cash flow hedges.
Translation difference reserveThis reserve is used to record the exchange differences arising from the transla-
tion of the financial statements of foreign subsidiaries.
Financial liabilities (note 16)
31/12/2007 31/12/2006
Non-current financial liabilities
Loans
Third parties 132,234 85,537
132,234 85,537
Current financial liabilities
Loans
Third parties 75,861 62,589
75,861 62,589
Accrued financial liabilities and deferred expenses
Third parties 1,212 273
1,212 273
Other financial liabilities
Fair value of interest-rate derivatives 37 38
Fair value of exchange-rate derivatives 1,894 403
1,931 441
The following table breaks down financial liabilities by maturity:
31/12/2007 31/12/2006
Company Within 1 year
From 1 to 5 years
Beyond 5 years
Total Within 1 year
From 1 to 5 years
Beyond 5 years
Total
Carraro Argentina Sa 40 40
Carraro India Ltd. 1,535 1,535 4,179 4,179
Carraro International Sa 10,239 78,194 2,847 91,280 66,640 6,680 73,320
Carraro Spa 686 2,093 2,779 662 2,760 3,422
Elettronica Santerno Spa 58 174 232 290 290
Fon Sa 2,406 6,708 9,114 11,146 11,146
Gear World Spa 12,500 12,500
Minigears Suzhou Co. Ltd. 349 349 698
MG Holding Spa 12,500 12,500
Minigears Spa 6,494 6,494
Siap Spa 2,051 266 2,317 2,812 2,812
Figu
res
in E
uro/
1.0
00
sFi
gure
s in
Eur
o/1.
00
0s

CONSOLIDATED FINANCIAL STATEMENTS
113
31/12/2007 31/12/2006
Company Within 1 year
From 1 to 5 years
Beyond 5 years
Total Within 1 year
From 1 to 5 years
Beyond 5 years
Total
Stm Srl 837 1,884 2,721 3,830 3,830
Turbo Gears Ltd. 1,758 5,219 1,471 8,448 3,652 2,207 5,859
Total 18,384 127,916 4,318 150,618 662 95,349 8,887 104,898
The following table provides further detailed information concerning financial liabilities.
Company Lender Value in euro(M/L-term share)
Maturity Interest rate
Ratetype
Currency
Carraro Spa San Paolo IMI (F.I.T.) 802 Jun ‘11 1.01% fixed Euro
Carraro Spa Mps Leasing 1,291 Feb ‘11 5.41% variable Euro
Siap Spa Banca Pop. Verona 266 Mar ‘09 5.627% variable Euro
Stm Srl Banca Pop. Verona 1,568 Dec ‘10 5.529% variable Euro
Stm Srl Mps Leasing 316 Nov ‘11 5.659% variable Euro
Elettronica Santerno Spa Simest 174 Nov ‘11 1.3951% fixed Euro
Fon Sa Fortis Bank 1,565 Nov ‘11 6.09% variable PLN
Fon Sa Capitalia Lux 5,143 Sep ‘11 6.45% variable PLN
Carraro India Ltd. Mcc 565 Apr ‘10 5.986% variable Euro
Carraro India Ltd. Mcc 565 Apr ‘11 5.986% variable Euro
Carraro India Ltd. Exim 405 Mar 12 12.50% variable INR
Turbo Gears Ltd. Bnp 2,449 Nov ‘11 8.58% fixed INR
Turbo Gears Ltd. Mcc 4,241 Dec ‘14 5.66% variable Euro
Carraro International Sa Pool banche 49,632 May ‘12 5.493% variable Euro
Carraro International Sa Mps 10,000 Mar ‘13 5.16% variable Euro
Carraro International Sa Banca Antonveneta 15,000 Jun ‘13 5.097% variable Euro
Carraro International Sa Fortis Bank 5,009 Dec ‘08 5.53% variable PLN
Carraro International Sa Banca Pop. Verona 1,400 Dec ‘08 4.86% variable Euro
Gear World Spa Banca Pop. Verona 12,500 Jan ‘09 4.907% variable Euro
MG Holding Spa Banca Pop. Verona 12,500 Jan ‘09 4.907% variable Euro
Minigears Spa San Paolo Leas./Intesa/Locat Leas.
1,236 Mar ‘09/May ‘12
5.58% variable Euro
Minigears Spa Interbanca 3,000 Dec ‘11 5.20% variable Euro
Minigears Spa Ministero Industria 56 Jun ‘09 3.425% fixed Euro
Minigears Spa Ministero Ricerca 567 Jan ‘13 2% fixed Euro
Minigears Spa Unicredit 161 Jun ‘09 5.90% variable Euro
Minigears Spa Intesa Mediocredito 1,474 Jun ‘10 5.55% variable Euro
Minigears Suzhou Co. Ltd. Intesa 349 Nov ‘09 6.0025% variable USD
TOTAL 132,234
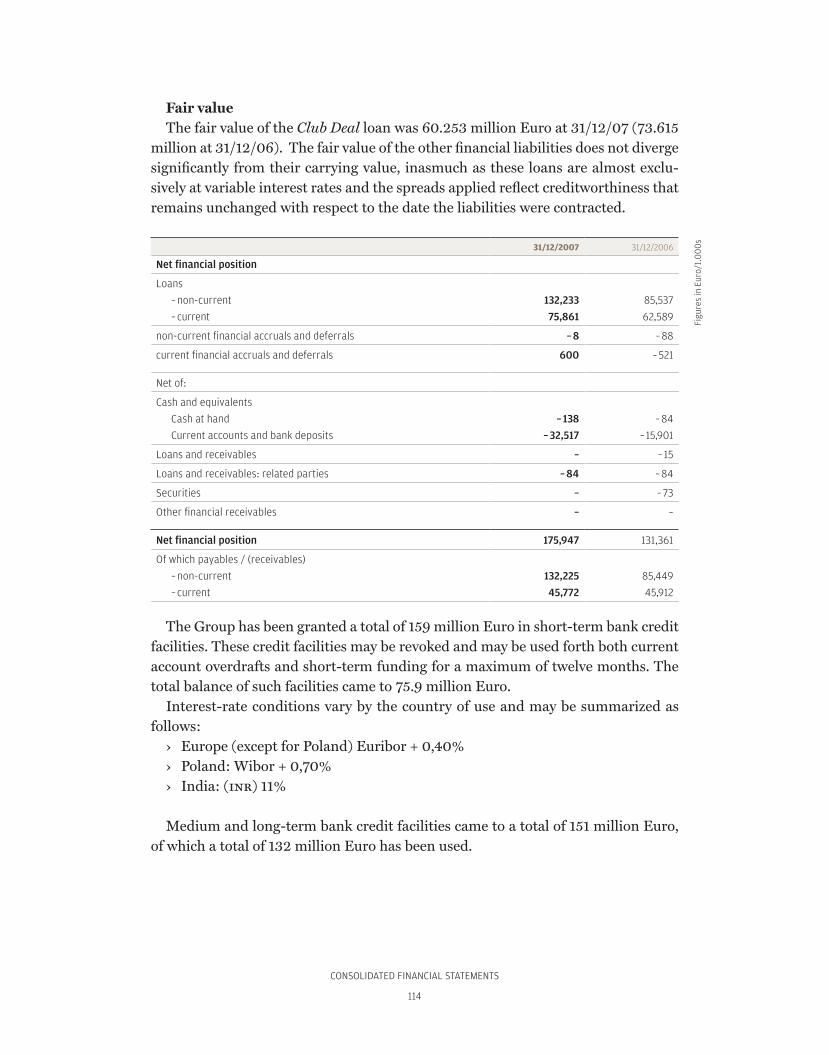
CONSOLIDATED FINANCIAL STATEMENTS
114
Fair valueThe fair value of the Club Deal loan was 60.253 million Euro at 31/12/07 (73.615
million at 31/12/06). The fair value of the other financial liabilities does not diverge significantly from their carrying value, inasmuch as these loans are almost exclu-sively at variable interest rates and the spreads applied reflect creditworthiness that remains unchanged with respect to the date the liabilities were contracted.
31/12/2007 31/12/2006
Net financial position
Loans
– non-current 132,233 85,537
– current 75,861 62,589
non-current financial accruals and deferrals – 8 – 88
current financial accruals and deferrals 600 – 521
Net of:
Cash and equivalents
Cash at hand – 138 – 84
Current accounts and bank deposits – 32,517 – 15,901
Loans and receivables – – 15
Loans and receivables: related parties – 84 – 84
Securities – – 73
Other financial receivables – –
Net financial position 175,947 131,361
Of which payables / (receivables)
– non-current 132,225 85,449
– current 45,772 45,912
The Group has been granted a total of 159 million Euro in short-term bank credit facilities. These credit facilities may be revoked and may be used forth both current account overdrafts and short-term funding for a maximum of twelve months. The total balance of such facilities came to 75.9 million Euro.
Interest-rate conditions vary by the country of use and may be summarized as follows:
› Europe (except for Poland) Euribor + 0,40%› Poland: Wibor + 0,70%› India: (inr) 11%
Medium and long-term bank credit facilities came to a total of 151 million Euro, of which a total of 132 million Euro has been used.
Figu
res
in E
uro/
1.0
00
s
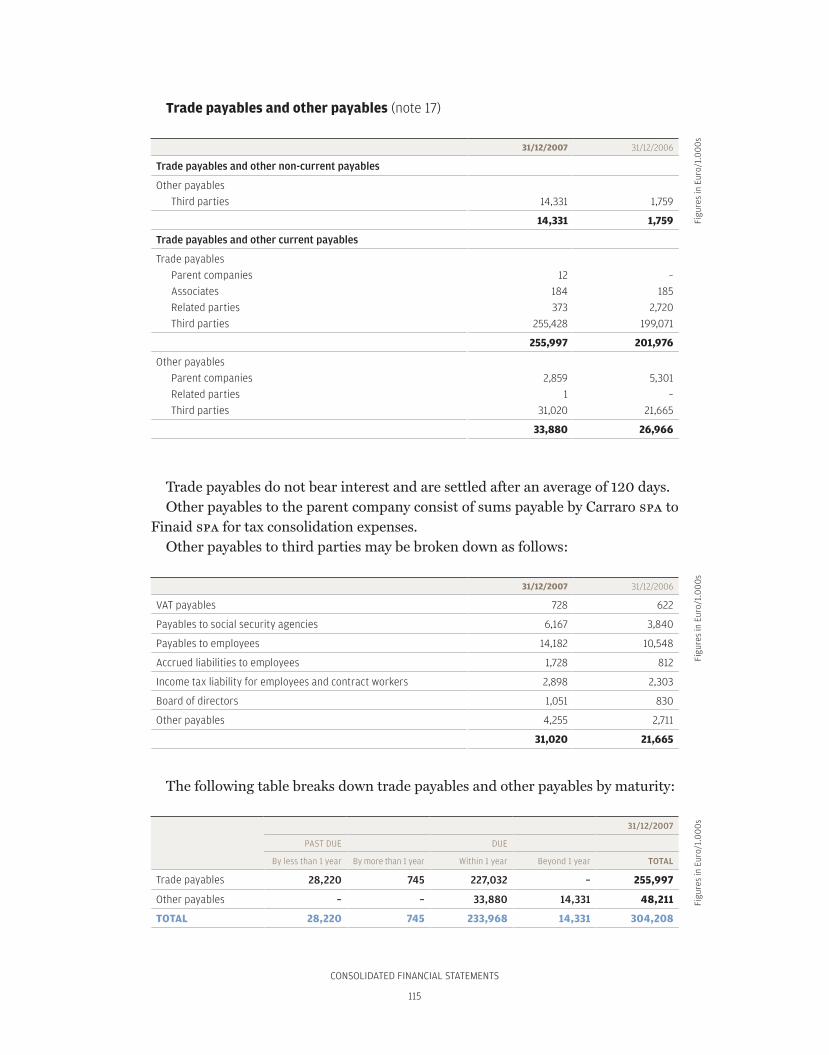
CONSOLIDATED FINANCIAL STATEMENTS
115
Trade payables and other payables (note 17)
31/12/2007 31/12/2006
Trade payables and other non-current payables
Other payables
Third parties 14,331 1,759
14,331 1,759
Trade payables and other current payables
Trade payables
Parent companies 12 –
Associates 184 185
Related parties 373 2,720
Third parties 255,428 199,071
255,997 201,976
Other payables
Parent companies 2,859 5,301
Related parties 1 –
Third parties 31,020 21,665
33,880 26,966
Trade payables do not bear interest and are settled after an average of 120 days.Other payables to the parent company consist of sums payable by Carraro spa to
Finaid spa for tax consolidation expenses.Other payables to third parties may be broken down as follows:
31/12/2007 31/12/2006
VAT payables 728 622
Payables to social security agencies 6,167 3,840
Payables to employees 14,182 10,548
Accrued liabilities to employees 1,728 812
Income tax liability for employees and contract workers 2,898 2,303
Board of directors 1,051 830
Other payables 4,255 2,711
31,020 21,665
The following table breaks down trade payables and other payables by maturity:
31/12/2007
PAST DUE DUE
By less than 1 year By more than 1 year Within 1 year Beyond 1 year TOTAL
Trade payables 28,220 745 227,032 – 255,997
Other payables – – 33,880 14,331 48,211
TOTAL 28,220 745 233,968 14,331 304,208
Figu
res
in E
uro/
1.0
00
sFi
gure
s in
Eur
o/1.
00
0s
Figu
res
in E
uro/
1.0
00
s

CONSOLIDATED FINANCIAL STATEMENTS
116
31/12/2006
PAST DUE DUE
By less than 1 year By more than 1 year Within 1 year Beyond 1 year TOTAL
Trade payables 11,972 2,053 187,951 – 201,976
Other payables – – 26,966 1,759 28,725
TOTAL 11,972 2,053 165,567 1,759 230,701
Deferred tax assets and liabilities (note 11)The following table provides a breakdown of deferred tax assets and liabilities by
the temporary differences that give rise to them. The change corresponds to the net effect of deferred taxes on the income statement and equity.
DESCRIPTION OF DIFFERENCES Initial31/12/2005
Reclassifi-cations
Change incons. area
Effect on Exchangedifference
Final31/12/2006
income equity
Assets
Depreciation of Ppe 1,331 – – 884 – 93 – 65 2,057
Amortization of goodwill 1,389 – – – 298 – – 1,091
Impairment of equity investments 1,308 – – – 1,146 – – 162
Impairment of receivables – 236 – – – 179 – – – 415
Measurement of financialassets / liabilities
545 – – – 545 – 45 – – 45
Adjustment of termination / pension benefits
217 – – – 84 – 42 – 91
Provisions for risks and contingencies 4,912 – – 935 – – 6 5,841
Tax losses 1,954 – – – 135 – 2,089
Other 1,275 – 80 – 97 – – 55 1,203
TOTAL 12,695 – 80 – 530 – 45 – 126 12,074
Liabilities
Amortization of intangible assets – 3,638 – – 459 – 85 – 407 – 3,775
Impairment of equity investments – – – – – – –
Measurement of receivables – – – 12 115 – – 5 98
Measurement of financialassets / liabilities
– 230 – – 212 – 252 1 – 269
Adjustment of termination / pension benefits
– 28 – – 26 – 15 – – – 69
Provisions for risks and contingencies – – – – 168 – 8 – 160
Other – 1 – 52 – 51 – – –
TOTAL – 3,897 – – 445 8 – 252 411 – 4,175
BALANCE 8,798 – – 365 – 522 – 297 285 7,899
Figu
res
in E
uro/
1.0
00
s

CONSOLIDATED FINANCIAL STATEMENTS
117
DESCRIPTION OF DIFFERENCES Initial31/12/2006
Reclassifi-cations
Change incons. area
Effect on Exchangedifference
Final31/12/2007
income equity
Assets
Depreciation of Ppe 2,057 – 30 – 1,495 – – 34 3,488
Amortization of goodwill 1,091 – – – 962 – – 129
Impairment of equity investments 162 – – – 213 – – – 51
Impairment of receivables – 415 – 59 469 – – 17 96
Measurement of financialassets / liabilities
– 45 – – – 91 149 – 5 8
Adjustment of termination / pension benefits
91 – – – 676 – – – 585
Provisions for risks and contingencies 5,841 – – – 381 – – 9 5,451
Tax losses 2,089 – 323 582 – – 27 2,967
Other 1,203 – 8 36 261 – – 34 1,458
TOTAL 12,074 – 38 418 484 149 – 126 12,961
Liabilities
Amortization of tangible assets – 3,775 30 – 7,248 738 – 436 – 9,819
Impairment of equity investments – – – – – – –
Measurement of receivables 98 – 67 – 11 – – 15 139
Measurement of financialassets / liabilities
– 269 – – 18 413 – 162
Adjustment of termination / pension benefits
– 69 – – 194 – 5 – – – 268
Provisions for risks and contingencies – 160 – 508 – 140 – 20 228
Other – 8 – 3,210 819 – – – 2,383
TOTAL – 4,175 38 – 10,077 1,419 413 441 – 11,941
BALANCE 7,899 – – 9,659 1,903 562 315 1,020
Deferred tax assets include the potential benefits arising from tax loss carry-for-wards, to the extent it is likely that there will be adequate future taxable income against which these tax losses can be utilized in the reasonably near future.
In regard to the foregoing, the tax losses for which the associated deferred ben-efits were not recognized consist of:
› 3.90 million Euro by Carraro International sa, with no time limit on the use thereof, primarily generated by the impairment of equity investments which may become subject to taxes if written back or if capital gains are earned on disposal;
› 3.10 million by Euro O&KA Gmbh and Carraro Deutschland Gmbh, with no time limit on the use thereof;
› 0.24 million Euro by Carraro North America Inc., with no time limit on the use thereof.
Figu
res
in E
uro/
1.0
00
s
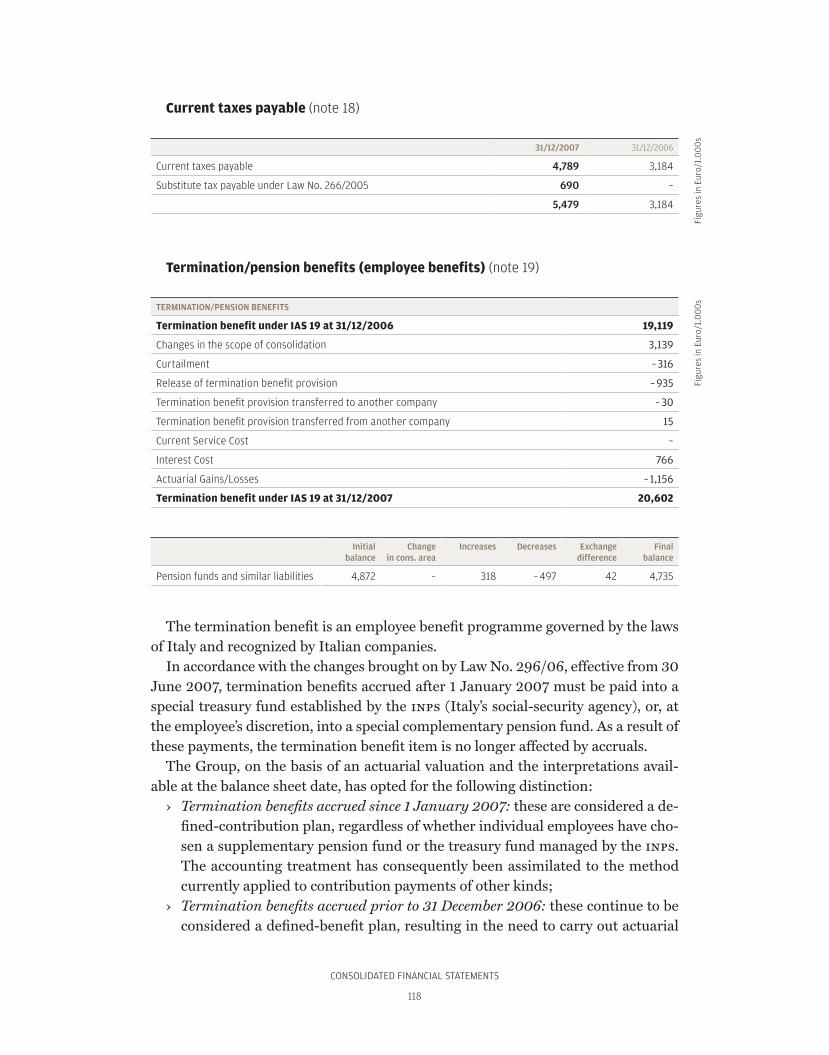
CONSOLIDATED FINANCIAL STATEMENTS
118
Current taxes payable (note 18)
31/12/2007 31/12/2006
Current taxes payable 4,789 3,184
Substitute tax payable under Law No. 266/2005 690 –
5,479 3,184
Termination/pension benefits (employee benefits) (note 19)
TERMINATION/PENSION BENEFITS
Termination benefit under IAS 19 at 31/12/2006 19,119
Changes in the scope of consolidation 3,139
Curtailment – 316
Release of termination benefit provision – 935
Termination benefit provision transferred to another company – 30
Termination benefit provision transferred from another company 15
Current Service Cost –
Interest Cost 766
Actuarial Gains/Losses – 1,156
Termination benefit under IAS 19 at 31/12/2007 20,602
Initial balance
Changein cons. area
Increases Decreases Exchange difference
Finalbalance
Pension funds and similar liabilities 4,872 – 318 – 497 42 4,735
The termination benefit is an employee benefit programme governed by the laws of Italy and recognized by Italian companies.
In accordance with the changes brought on by Law No. 296/06, effective from 30 June 2007, termination benefits accrued after 1 January 2007 must be paid into a special treasury fund established by the inps (Italy’s social-security agency), or, at the employee’s discretion, into a special complementary pension fund. As a result of these payments, the termination benefit item is no longer affected by accruals.
The Group, on the basis of an actuarial valuation and the interpretations avail-able at the balance sheet date, has opted for the following distinction:
› Termination benefits accrued since 1 January 2007: these are considered a de-fined-contribution plan, regardless of whether individual employees have cho-sen a supplementary pension fund or the treasury fund managed by the inps. The accounting treatment has consequently been assimilated to the method currently applied to contribution payments of other kinds;
› Termination benefits accrued prior to 31 December 2006: these continue to be considered a defined-benefit plan, resulting in the need to carry out actuarial
Figu
res
in E
uro/
1.0
00
sFi
gure
s in
Eur
o/1.
00
0s
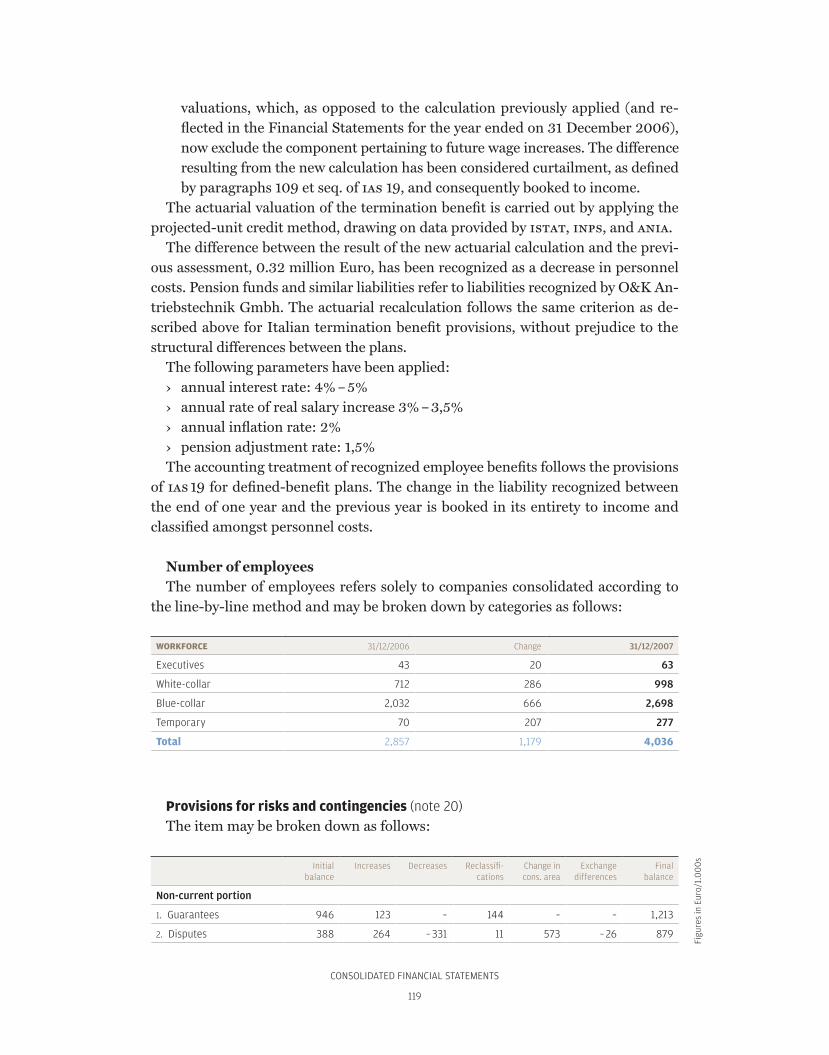
CONSOLIDATED FINANCIAL STATEMENTS
119
valuations, which, as opposed to the calculation previously applied (and re-flected in the Financial Statements for the year ended on 31 December 2006), now exclude the component pertaining to future wage increases. The difference resulting from the new calculation has been considered curtailment, as defined by paragraphs 109 et seq. of ias 19, and consequently booked to income.
The actuarial valuation of the termination benefit is carried out by applying the projected-unit credit method, drawing on data provided by istat, inps, and ania.
The difference between the result of the new actuarial calculation and the previ-ous assessment, 0.32 million Euro, has been recognized as a decrease in personnel costs. Pension funds and similar liabilities refer to liabilities recognized by O&K An-triebstechnik Gmbh. The actuarial recalculation follows the same criterion as de-scribed above for Italian termination benefit provisions, without prejudice to the structural differences between the plans.
The following parameters have been applied:› annual interest rate: 4% – 5%› annual rate of real salary increase 3% – 3,5%› annual inflation rate: 2%› pension adjustment rate: 1,5%The accounting treatment of recognized employee benefits follows the provisions
of ias 19 for defined-benefit plans. The change in the liability recognized between the end of one year and the previous year is booked in its entirety to income and classified amongst personnel costs.
Number of employeesThe number of employees refers solely to companies consolidated according to
the line-by-line method and may be broken down by categories as follows:
WORKFORCE 31/12/2006 Change 31/12/2007
Executives 43 20 63
White-collar 712 286 998
Blue-collar 2,032 666 2,698
Temporary 70 207 277
Total 2,857 1,179 4,036
Provisions for risks and contingencies (note 20)The item may be broken down as follows:
Initial balance
Increases Decreases Reclassifi-cations
Change in cons. area
Exchange differences
Final balance
Non-current portion
1. Guarantees 946 123 – 144 – – 1,213
2. Disputes 388 264 – 331 11 573 – 26 879
Figu
res
in E
uro/
1.0
00
s
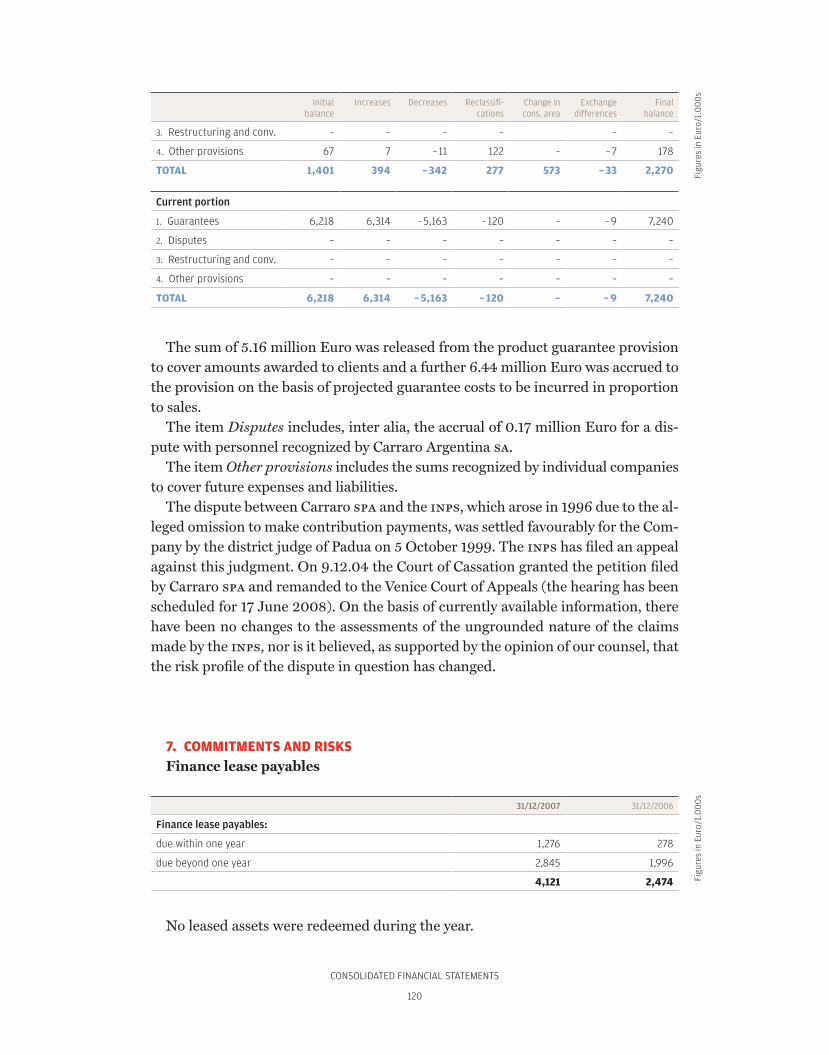
CONSOLIDATED FINANCIAL STATEMENTS
120
Initial balance
Increases Decreases Reclassifi-cations
Change in cons. area
Exchange differences
Final balance
3. Restructuring and conv. – – – – – –
4. Other provisions 67 7 – 11 122 – – 7 178
TOTAL 1,401 394 – 342 277 573 – 33 2,270
Current portion
1. Guarantees 6,218 6,314 – 5,163 – 120 – – 9 7,240
2. Disputes – – – – – – –
3. Restructuring and conv. – – – – – – –
4. Other provisions – – – – – – –
TOTAL 6,218 6,314 – 5,163 – 120 – – 9 7,240
The sum of 5.16 million Euro was released from the product guarantee provision to cover amounts awarded to clients and a further 6.44 million Euro was accrued to the provision on the basis of projected guarantee costs to be incurred in proportion to sales.
The item Disputes includes, inter alia, the accrual of 0.17 million Euro for a dis-pute with personnel recognized by Carraro Argentina sa.
The item Other provisions includes the sums recognized by individual companies to cover future expenses and liabilities.
The dispute between Carraro spa and the inps, which arose in 1996 due to the al-leged omission to make contribution payments, was settled favourably for the Com-pany by the district judge of Padua on 5 October 1999. The inps has filed an appeal against this judgment. On 9.12.04 the Court of Cassation granted the petition filed by Carraro spa and remanded to the Venice Court of Appeals (the hearing has been scheduled for 17 June 2008). On the basis of currently available information, there have been no changes to the assessments of the ungrounded nature of the claims made by the inps, nor is it believed, as supported by the opinion of our counsel, that the risk profile of the dispute in question has changed.
7. COMMITMENTS AND RISKS Finance lease payables
31/12/2007 31/12/2006
Finance lease payables:
due within one year 1,276 278
due beyond one year 2,845 1,996
4,121 2,474
No leased assets were redeemed during the year.
Figu
res
in E
uro/
1.0
00
sFi
gure
s in
Eur
o/1.
00
0s

CONSOLIDATED FINANCIAL STATEMENTS
121
None of the residual sums payable are due in more than five years.
Guarantees provided and commitments
31/12/2007 31/12/2006
Risks – –
Operating lease commitments 356 1,778
Operating lease feesThe item refers to the business division lease agreement entered into on 24/03/05
and having an initial term of three years, renewable from one year to the next. The lessor is Agritalia spa (a related party) and the annual fee (1.422 million Euro) was determined on the basis of an independent appraisal. Following the acquisition of a lease agreement for an industrial property by Agritalia spa, the annual lease fee was renegotiated from 1.90 million Euro to 1.422 million Euro. The agreement also grants the Company a call option at a fixed price. According to the provisions of ias 17, the agreement is not considered a finance lease. Commitments for fees due in less than twelve months came to 0.356 million Euro at 31/12/07.
Transactions with related partiesThe Carraro Group is directly controlled by Finaid spa, which held 50.001% of
outstanding shares at 31/12/07. Transactions between Carraro spa. and its subsidiaries, which are related parties
of Carraro spa, have been eliminated from the Consolidated Financial Statements and are not discussed in these Notes. The details of transactions between the Carraro Group and other related parties are set forth below.
In financial year 2005 Carraro spa and Siap spa exercised the option to participate in the tax consolidation programme of their parent company, Finaid spa The expens-es arising from the transfer of the taxable base for ires (corporate income tax) are recognized amongst current taxes. Under tax consolidation rules, Carraro spa and Siap spa are entitled to “compensation” for the use of the tax losses of its subsidiaries by Finaid. This “compensation” comes to 3% of the tax loss, offset with the taxable income of Carraro spa and Siap spa.
Further information concerning related parties are set out in paragraph 8 below.
Fair value Where the carrying value and the fair value of assets and liabilities do not sub-
stantially coincide, a comparison between the two values is included.At the end of 2007 there were no significant differences between the carrying
value and fair value of the financial assets and liabilities that had not already been recognized at fair value according to the criteria set forth above.
Figu
res
in E
uro/
1.0
00
s
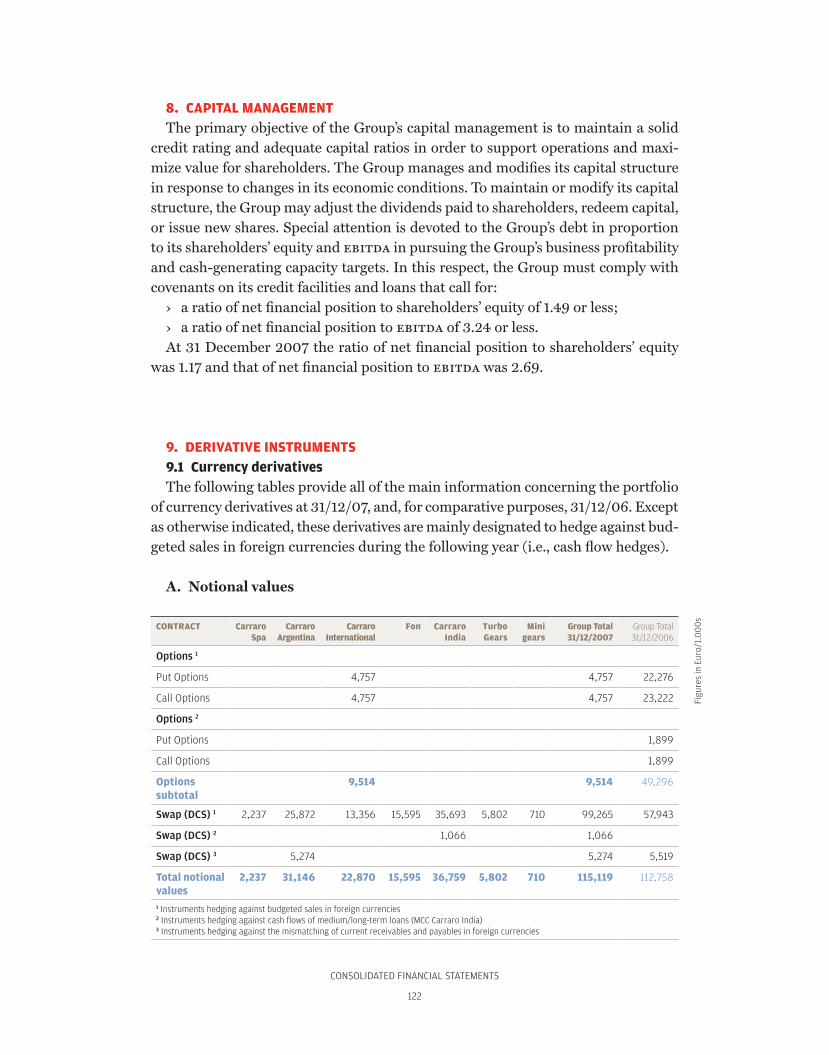
CONSOLIDATED FINANCIAL STATEMENTS
122
8. CAPITAL MANAGEMENTThe primary objective of the Group’s capital management is to maintain a solid
credit rating and adequate capital ratios in order to support operations and maxi-mize value for shareholders. The Group manages and modifies its capital structure in response to changes in its economic conditions. To maintain or modify its capital structure, the Group may adjust the dividends paid to shareholders, redeem capital, or issue new shares. Special attention is devoted to the Group’s debt in proportion to its shareholders’ equity and ebitda in pursuing the Group’s business profitability and cash-generating capacity targets. In this respect, the Group must comply with covenants on its credit facilities and loans that call for:
› a ratio of net financial position to shareholders’ equity of 1.49 or less;› a ratio of net financial position to ebitda of 3.24 or less.At 31 December 2007 the ratio of net financial position to shareholders’ equity
was 1.17 and that of net financial position to ebitda was 2.69.
9. DERIVATIVE INSTRUMENTS9.1 Currency derivativesThe following tables provide all of the main information concerning the portfolio
of currency derivatives at 31/12/07, and, for comparative purposes, 31/12/06. Except as otherwise indicated, these derivatives are mainly designated to hedge against bud-geted sales in foreign currencies during the following year (i.e., cash flow hedges).
A. Notional values
CONTRACT Carraro Spa
Carraro Argentina
Carraro International
Fon Carraro India
Turbo Gears
Mini gears
Group Total 31/12/2007
Group Total 31/12/2006
Options 1
Put Options 4,757 4,757 22,276
Call Options 4,757 4,757 23,222
Options 2
Put Options 1,899
Call Options 1,899
Optionssubtotal
9,514 9,514 49,296
Swap (DCS) 1 2,237 25,872 13,356 15,595 35,693 5,802 710 99,265 57,943
Swap (DCS) 2 1,066 1,066
Swap (DCS) 3 5,274 5,274 5,519
Total notional values
2,237 31,146 22,870 15,595 36,759 5,802 710 115,119 112,758
1 Instruments hedging against budgeted sales in foreign currencies2 Instruments hedging against cash flows of medium/long-term loans (MCC Carraro India)3 Instruments hedging against the mismatching of current receivables and payables in foreign currencies
Figu
res
in E
uro/
1.0
00
s
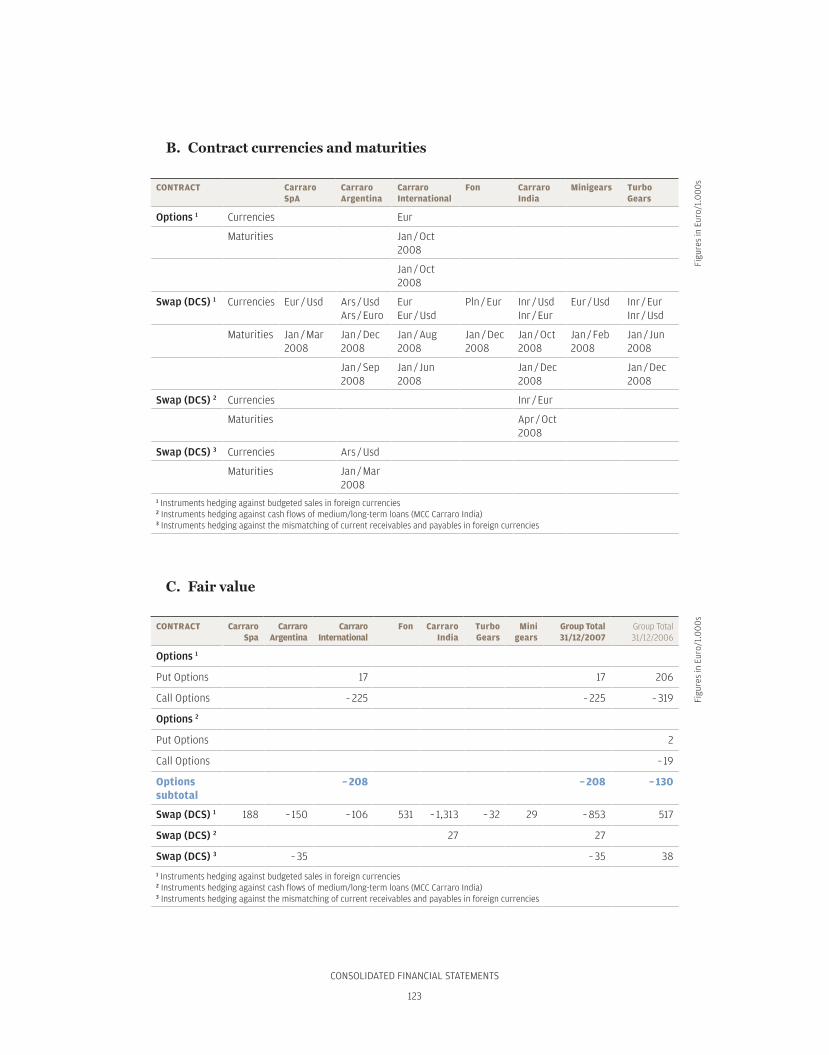
CONSOLIDATED FINANCIAL STATEMENTS
123
B. Contract currencies and maturities
CONTRACT Carraro SpA
Carraro Argentina
Carraro International
Fon Carraro India
Minigears Turbo Gears
Options 1 Currencies Eur
Maturities Jan / Oct 2008
Jan / Oct 2008
Swap (DCS) 1 Currencies Eur / Usd Ars / UsdArs / Euro
EurEur / Usd
Pln / Eur Inr / UsdInr / Eur
Eur / Usd Inr / EurInr / Usd
Maturities Jan / Mar 2008
Jan / Dec2008
Jan / Aug2008
Jan / Dec2008
Jan / Oct 2008
Jan / Feb 2008
Jan / Jun2008
Jan / Sep2008
Jan / Jun2008
Jan / Dec 2008
Jan / Dec 2008
Swap (DCS) 2 Currencies Inr / Eur
Maturities Apr / Oct2008
Swap (DCS) 3 Currencies Ars / Usd
Maturities Jan / Mar 2008
1 Instruments hedging against budgeted sales in foreign currencies2 Instruments hedging against cash flows of medium/long-term loans (MCC Carraro India)3 Instruments hedging against the mismatching of current receivables and payables in foreign currencies
C. Fair value
CONTRACT Carraro Spa
Carraro Argentina
Carraro International
Fon Carraro India
Turbo Gears
Mini gears
Group Total 31/12/2007
Group Total 31/12/2006
Options 1
Put Options 17 17 206
Call Options – 225 – 225 – 319
Options 2
Put Options 2
Call Options – 19
Optionssubtotal
– 208 – 208 – 130
Swap (DCS) 1 188 – 150 – 106 531 – 1,313 – 32 29 – 853 517
Swap (DCS) 2 27 27
Swap (DCS) 3 – 35 – 35 38
1 Instruments hedging against budgeted sales in foreign currencies2 Instruments hedging against cash flows of medium/long-term loans (MCC Carraro India)3 Instruments hedging against the mismatching of current receivables and payables in foreign currencies
Figu
res
in E
uro/
1.0
00
sFi
gure
s in
Eur
o/1.
00
0s
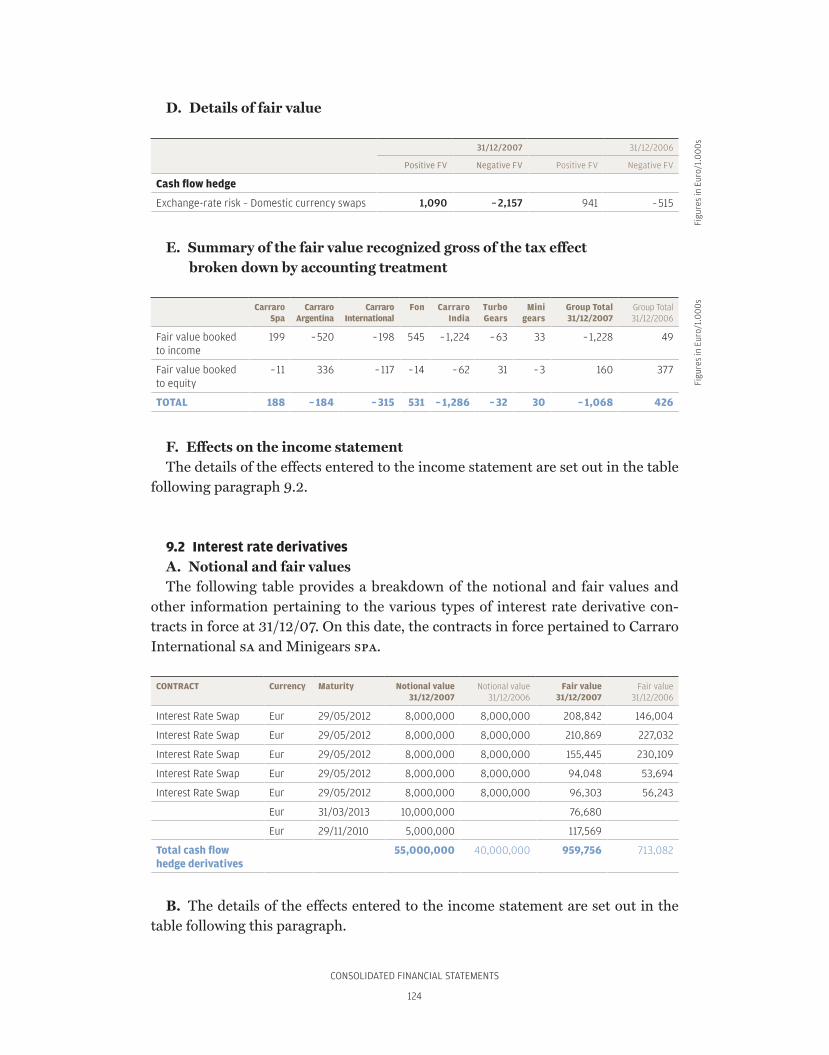
CONSOLIDATED FINANCIAL STATEMENTS
124
D. Details of fair value
31/12/2007 31/12/2006
Positive FV Negative FV Positive FV Negative FV
Cash flow hedge
Exchange-rate risk – Domestic currency swaps 1,090 – 2,157 941 – 515
E. Summary of the fair value recognized gross of the tax effect broken down by accounting treatment
Carraro Spa
Carraro Argentina
Carraro International
Fon Carraro India
Turbo Gears
Mini gears
Group Total 31/12/2007
Group Total 31/12/2006
Fair value booked to income
199 – 520 – 198 545 – 1,224 – 63 33 – 1,228 49
Fair value booked to equity
– 11 336 – 117 – 14 – 62 31 – 3 160 377
TOTAL 188 – 184 – 315 531 – 1,286 – 32 30 – 1,068 426
F. Effects on the income statementThe details of the effects entered to the income statement are set out in the table
following paragraph 9.2.
9.2 Interest rate derivativesA. Notional and fair valuesThe following table provides a breakdown of the notional and fair values and
other information pertaining to the various types of interest rate derivative con-tracts in force at 31/12/07. On this date, the contracts in force pertained to Carraro International sa and Minigears spa.
CONTRACT Currency Maturity Notional value31/12/2007
Notional value31/12/2006
Fair value 31/12/2007
Fair value 31/12/2006
Interest Rate Swap Eur 29/05/2012 8,000,000 8,000,000 208,842 146,004
Interest Rate Swap Eur 29/05/2012 8,000,000 8,000,000 210,869 227,032
Interest Rate Swap Eur 29/05/2012 8,000,000 8,000,000 155,445 230,109
Interest Rate Swap Eur 29/05/2012 8,000,000 8,000,000 94,048 53,694
Interest Rate Swap Eur 29/05/2012 8,000,000 8,000,000 96,303 56,243
Eur 31/03/2013 10,000,000 76,680
Eur 29/11/2010 5,000,000 117,569
Total cash flow hedge derivatives
55,000,000 40,000,000 959,756 713,082
B. The details of the effects entered to the income statement are set out in the table following this paragraph.
Figu
res
in E
uro/
1.0
00
sFi
gure
s in
Eur
o/1.
00
0s

CONSOLIDATED FINANCIAL STATEMENTS
125
General summary of the effects of derivative instrumentson the income statement
31/12/2007 Fin. Income
Fin. Expense
Exchange gains
Exchange losses
Revenue
FINANCIAL ASSETS
Financial instruments designated at fair value
Assets held to maturity
Loans and receivables Bank accounts with positive balances
– 505
Trade receivables – 192 – 2,377 3,714
Assets available for sale
Cash flow hedge derivatives on currencies
Equity reserve 349 – 237 81 1,274
Profit/loss – 1,429 444
Cash flow hedge derivatives on interest rates
– 270 – 135 7
FINANCIAL LIABILITIES
Financial instruments designated at fair value
Liabilities held to maturity
Loans From financial institutions – 334 7,571
Other loans – 222 407 – 3,074 1,157
Liabilities designatedat amortized cost
“Club Deal” loan 4,097
Trade payables – 1,223 1,843
TOTAL – 1,523 12,424 – 8,475 7,246 1,274
31/12/2006 Fin. Income
Fin. Expense
Exchange gains
Exchange losses
Revenue
FINANCIAL ASSETS
Financial instruments designated at fair value
Assets held to maturity
Loans and receivables Bank accounts with positive balances
– 405
Trade receivables – 190 – 1,527 2,142
Assets available for sale
Cash flow hedge derivatives on currencies
Equity reserve – 204 – 1,372
Profit/loss – 799 2,062
Cash flow hedge derivatives on interest rates
– 292 587
Figu
res
in E
uro/
1.0
00
sFi
gure
s in
Eur
o/1.
00
0s

CONSOLIDATED FINANCIAL STATEMENTS
126
31/12/2006 Fin. Income
Fin. Expense
Exchange gains
Exchange losses
Revenue
FINANCIAL LIABILITIES
Financial instruments designated at fair value
Liabilities held to maturity
Loans From financial institutions
– 2,447 10,134 – 1,781 339
Other loans 135
Liabilities designatedat amortized cost
“Club Deal” loan
Trade payables – 465 2,204
TOTAL – 3,042 10,269 – 5,068 5,962 –
Sensitivity analysis
The following tables show the effects generated by recognized assets and liabil-ities (at 31/12/07 and 31/12/06, respectively) on the income statement and shareholders’ equity of theoretical immediate changes in the following market variables:
› exchange rates between the primary foreign currencies and the euro: +/– 10%› interest rates: +/– 100 basis points.
The following methods have been employed:› the discounted cash flow method was applied to interest rate swaps;› domestic currency swap contracts were calculated by applying the forward ex-
change-rate method;› synthetic currency forward contracts were calculating by breaking the instru-
ment down into its basic components, which have in turn been assessed using the Black & Scholes formula.
The exchange-rate risks arising from the translation of the financial statements of foreign subsidiaries from their local currencies into euro have not been taken into consideration.
Balances at 31/12/2007 Interest-rate risk Exchange-rate risk
+ 1% – 1% + 10% – 10%
Effect on income
Effect on Equity
Effect on income
Effect on Equity
Effect on income
Effect on Equity
Effect on income
Effect on Equity
ASSETS
Trade receivables 1,841 – 1,651
Other fin. assets– currency derivatives
– 9,187 – 10,187 – 2,438 9,722
Other fin. assets– interest-rate derivatives
– 902 944
Figu
res
in E
uro/
1.0
00
sFi
gure
s in
Eur
o/1.
00
0s
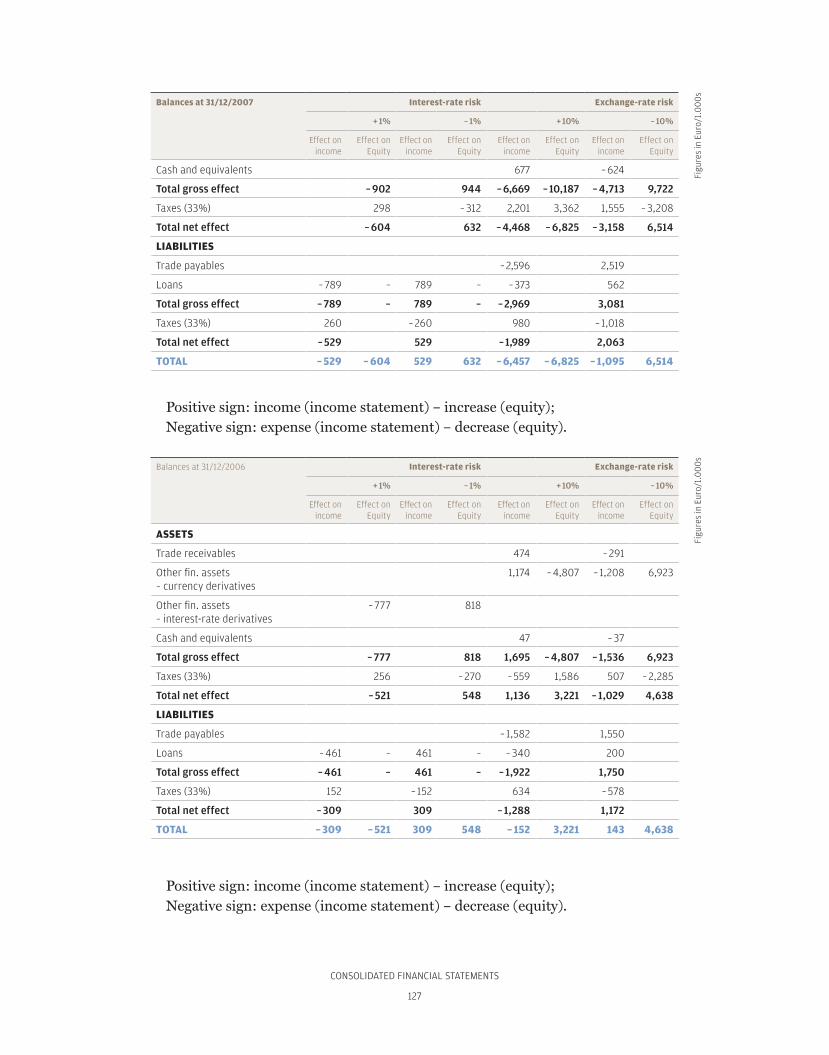
CONSOLIDATED FINANCIAL STATEMENTS
127
Balances at 31/12/2007 Interest-rate risk Exchange-rate risk
+ 1% – 1% + 10% – 10%
Effect on income
Effect on Equity
Effect on income
Effect on Equity
Effect on income
Effect on Equity
Effect on income
Effect on Equity
Cash and equivalents 677 – 624
Total gross effect – 902 944 – 6,669 – 10,187 – 4,713 9,722
Taxes (33%) 298 – 312 2,201 3,362 1,555 – 3,208
Total net effect – 604 632 – 4,468 – 6,825 – 3,158 6,514
LIABILITIES
Trade payables – 2,596 2,519
Loans – 789 – 789 – – 373 562
Total gross effect – 789 – 789 – – 2,969 3,081
Taxes (33%) 260 – 260 980 – 1,018
Total net effect – 529 529 – 1,989 2,063
TOTAL – 529 – 604 529 632 – 6,457 – 6,825 – 1,095 6,514
Positive sign: income (income statement) – increase (equity);Negative sign: expense (income statement) – decrease (equity).
Balances at 31/12/2006 Interest-rate risk Exchange-rate risk
+ 1% – 1% + 10% – 10%
Effect on income
Effect on Equity
Effect on income
Effect on Equity
Effect on income
Effect on Equity
Effect on income
Effect on Equity
ASSETS
Trade receivables 474 – 291
Other fin. assets– currency derivatives
1,174 – 4,807 – 1,208 6,923
Other fin. assets– interest-rate derivatives
– 777 818
Cash and equivalents 47 – 37
Total gross effect – 777 818 1,695 – 4,807 – 1,536 6,923
Taxes (33%) 256 – 270 – 559 1,586 507 – 2,285
Total net effect – 521 548 1,136 3,221 – 1,029 4,638
LIABILITIES
Trade payables – 1,582 1,550
Loans – 461 – 461 – – 340 200
Total gross effect – 461 – 461 – – 1,922 1,750
Taxes (33%) 152 – 152 634 – 578
Total net effect – 309 309 – 1,288 1,172
TOTAL – 309 – 521 309 548 – 152 3,221 143 4,638
Positive sign: income (income statement) – increase (equity);Negative sign: expense (income statement) – decrease (equity).
Figu
res
in E
uro/
1.0
00
sFi
gure
s in
Eur
o/1.
00
0s
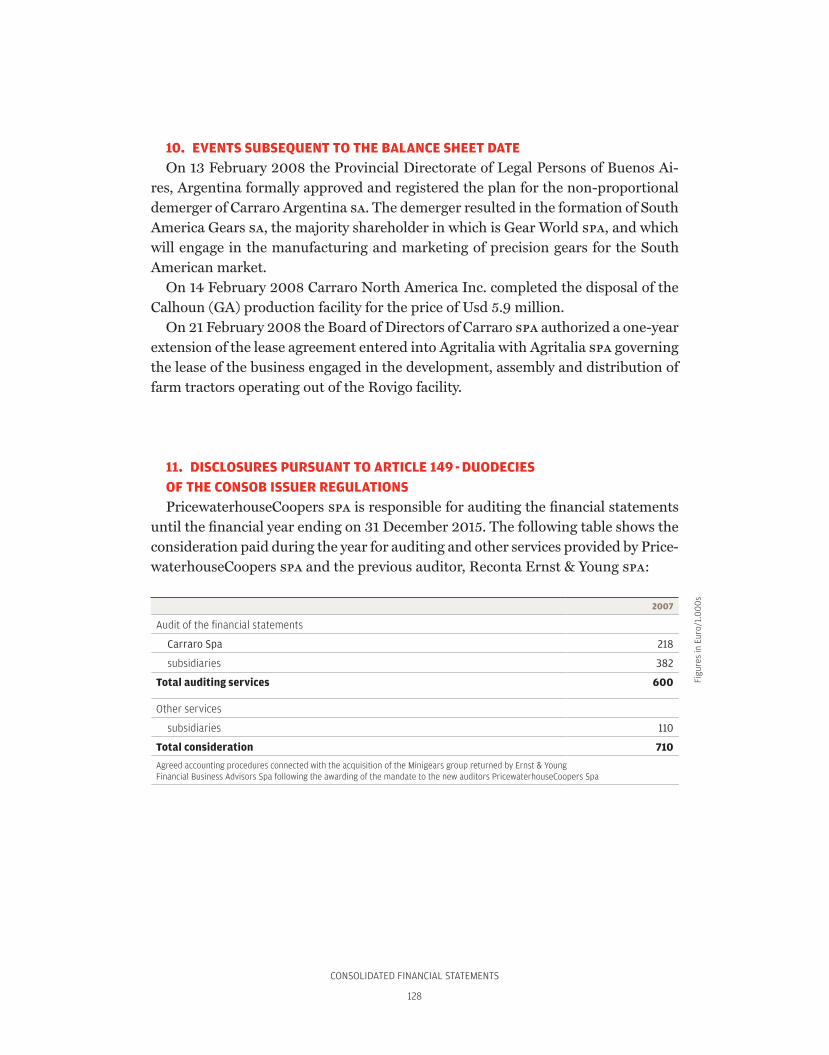
CONSOLIDATED FINANCIAL STATEMENTS
128
10. EVENTS SUBSEQUENT TO THE BALANCE SHEET DATEOn 13 February 2008 the Provincial Directorate of Legal Persons of Buenos Ai-
res, Argentina formally approved and registered the plan for the non-proportional demerger of Carraro Argentina sa. The demerger resulted in the formation of South America Gears sa, the majority shareholder in which is Gear World spa, and which will engage in the manufacturing and marketing of precision gears for the South American market.
On 14 February 2008 Carraro North America Inc. completed the disposal of the Calhoun (GA) production facility for the price of Usd 5.9 million.
On 21 February 2008 the Board of Directors of Carraro spa authorized a one-year extension of the lease agreement entered into Agritalia with Agritalia spa governing the lease of the business engaged in the development, assembly and distribution of farm tractors operating out of the Rovigo facility.
11. DISCLOSURES PURSUANT TO ARTICLE 149 - DUODECIESOF THE CONSOB ISSUER REGULATIONSPricewaterhouseCoopers spa is responsible for auditing the financial statements
until the financial year ending on 31 December 2015. The following table shows the consideration paid during the year for auditing and other services provided by Price-waterhouseCoopers spa and the previous auditor, Reconta Ernst & Young spa:
2007
Audit of the financial statements
Carraro Spa 218
subsidiaries 382
Total auditing services 600
Other services
subsidiaries 110
Total consideration 710
Agreed accounting procedures connected with the acquisition of the Minigears group returned by Ernst & YoungFinancial Business Advisors Spa following the awarding of the mandate to the new auditors PricewaterhouseCoopers Spa
Figu
res
in E
uro/
1.0
00
s

CONSOLIDATED FINANCIAL STATEMENTS
129
12. TRANSACTIONS WITH RELATED PARTIES The following tables provide information concerning transactions with related
parties pursuant to ias 24.
Equity investments of directors, statutory auditors, general managersand their close family relations
Surname and name Company: Carraro Spa
No. of shares held at 31/12/2006
No. of shares purchased
No. of shares sold
No. of shares held at 31/12/2007
Mario Carraro Directly owned 1,679,650 – – 1,679,650
Through Finaid Spa 21,000,005 1,000 – 21,001,005
Francesco Carraro Directly owned 1,182,395 – – 1,182,395
Valentina Carraro Directly owned 223,600 – – 223,600
Chiara Alessandri Directly owned 20,000 – – 20,000
Onofrio Tonin Directly owned 1,800 – 250 1,550
COMPENSATION PAID TO BOARD OF DIRECTORS, MANAGEMENTAND BOARD OF STATUTORY AUDITORS(ias 24, consob Communication dem/2064231 of 30/09/02)
PARTY DESCRIPTION OF POSITION COMPENSATIONSurname and name Company Position held Term of office 2007
Mario Carraro Carraro Spa Chairman 3-year period 06-08(shareholders’ meeting 11.05.06)
900,0
Siap Spa Chairman 3-year period 06-08(shareholders’ meeting 27.04.06)
30,0
Stm Srl Chairman 3-year period 06-08(shareholders’ meeting 27.04.06)
20,0
Carlo Borsari Carraro Spa Chief Executive Officer
3-year period 06-08(shareholders’ meeting 11.05.06)
salary420,0
as director 400,0
Siap Spa Chief Executive Officer
3-year period 06-08(shareholders’ meeting 27.04.06)
60,0
Elettronica Santerno Spa
Chief Executive Officer
3-year period 06-08(shareholders’ meeting 30.06.06)
–
Gear World Spa Director 3-year period 07-09(shareholders’ meeting 19.07.07)
20,0
Minigears Spa Director 3-year period 07-09(shareholders’ meeting 30.07.07)
–
MG Holding Spa Director 3-year period 07-09(shareholders’ meeting 30.07.07)
–
Francesco Carraro Carraro Spa Director 3-year period 06-08(shareholders’ meeting 11.05.06)
50,0
Enrico Carraro Carraro Spa Director 3-year period 06-08(shareholders’ meeting 11.05.06)
230,0
Siap Spa Director 3-year period 06-08(shareholders’ meeting 27.04.06)
–
Figu
res
in E
uro/
1.0
00
sFi
gure
s in
Eur
o/1.
00
0s
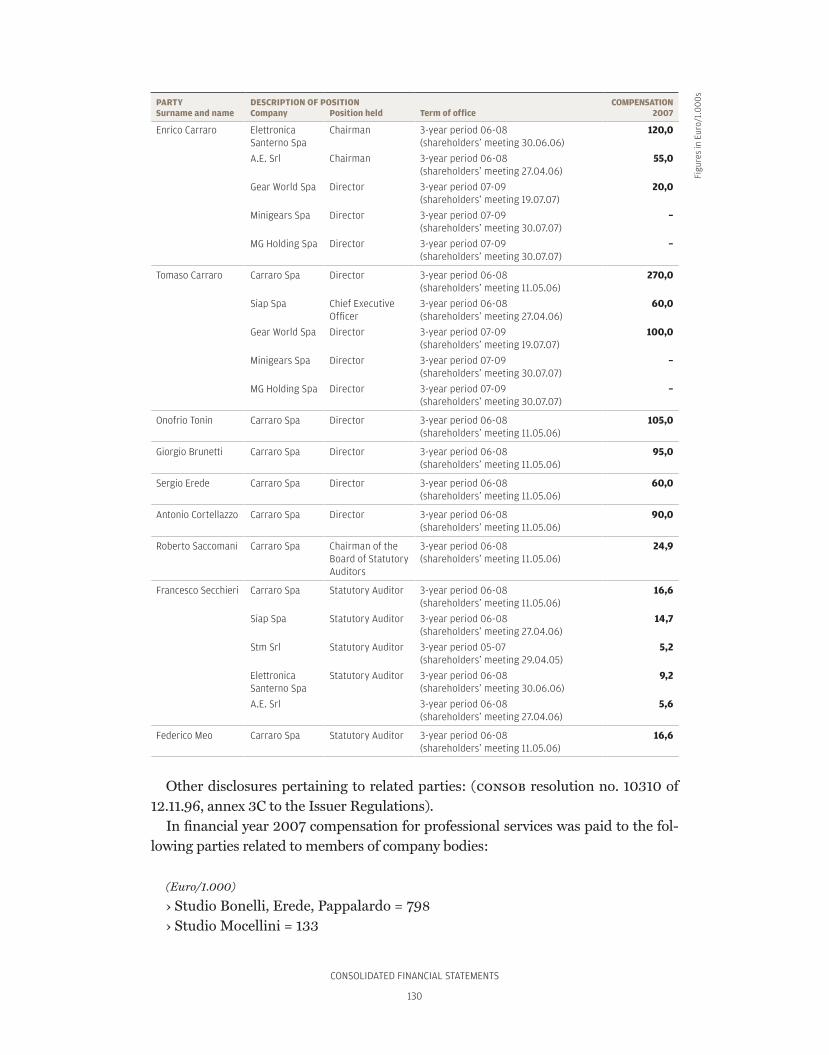
CONSOLIDATED FINANCIAL STATEMENTS
130
PARTY DESCRIPTION OF POSITION COMPENSATIONSurname and name Company Position held Term of office 2007
Enrico Carraro Elettronica Santerno Spa
Chairman 3-year period 06-08(shareholders’ meeting 30.06.06)
120,0
A.E. Srl Chairman 3-year period 06-08(shareholders’ meeting 27.04.06)
55,0
Gear World Spa Director 3-year period 07-09(shareholders’ meeting 19.07.07)
20,0
Minigears Spa Director 3-year period 07-09(shareholders’ meeting 30.07.07)
–
MG Holding Spa Director 3-year period 07-09(shareholders’ meeting 30.07.07)
–
Tomaso Carraro Carraro Spa Director 3-year period 06-08(shareholders’ meeting 11.05.06)
270,0
Siap Spa Chief Executive Officer
3-year period 06-08(shareholders’ meeting 27.04.06)
60,0
Gear World Spa Director 3-year period 07-09(shareholders’ meeting 19.07.07)
100,0
Minigears Spa Director 3-year period 07-09(shareholders’ meeting 30.07.07)
–
MG Holding Spa Director 3-year period 07-09(shareholders’ meeting 30.07.07)
–
Onofrio Tonin Carraro Spa Director 3-year period 06-08(shareholders’ meeting 11.05.06)
105,0
Giorgio Brunetti Carraro Spa Director 3-year period 06-08(shareholders’ meeting 11.05.06)
95,0
Sergio Erede Carraro Spa Director 3-year period 06-08(shareholders’ meeting 11.05.06)
60,0
Antonio Cortellazzo Carraro Spa Director 3-year period 06-08(shareholders’ meeting 11.05.06)
90,0
Roberto Saccomani Carraro Spa Chairman of the Board of Statutory Auditors
3-year period 06-08(shareholders’ meeting 11.05.06)
24,9
Francesco Secchieri Carraro Spa Statutory Auditor 3-year period 06-08(shareholders’ meeting 11.05.06)
16,6
Siap Spa Statutory Auditor 3-year period 06-08(shareholders’ meeting 27.04.06)
14,7
Stm Srl Statutory Auditor 3-year period 05-07(shareholders’ meeting 29.04.05)
5,2
Elettronica Santerno Spa
Statutory Auditor 3-year period 06-08(shareholders’ meeting 30.06.06)
9,2
A.E. Srl 3-year period 06-08(shareholders’ meeting 27.04.06)
5,6
Federico Meo Carraro Spa Statutory Auditor 3-year period 06-08(shareholders’ meeting 11.05.06)
16,6
Other disclosures pertaining to related parties: (consob resolution no. 10310 of 12.11.96, annex 3C to the Issuer Regulations).
In financial year 2007 compensation for professional services was paid to the fol-lowing parties related to members of company bodies:
(Euro/1.000)
› Studio Bonelli, Erede, Pappalardo = 798› Studio Mocellini = 133
Figu
res
in E
uro/
1.0
00
s
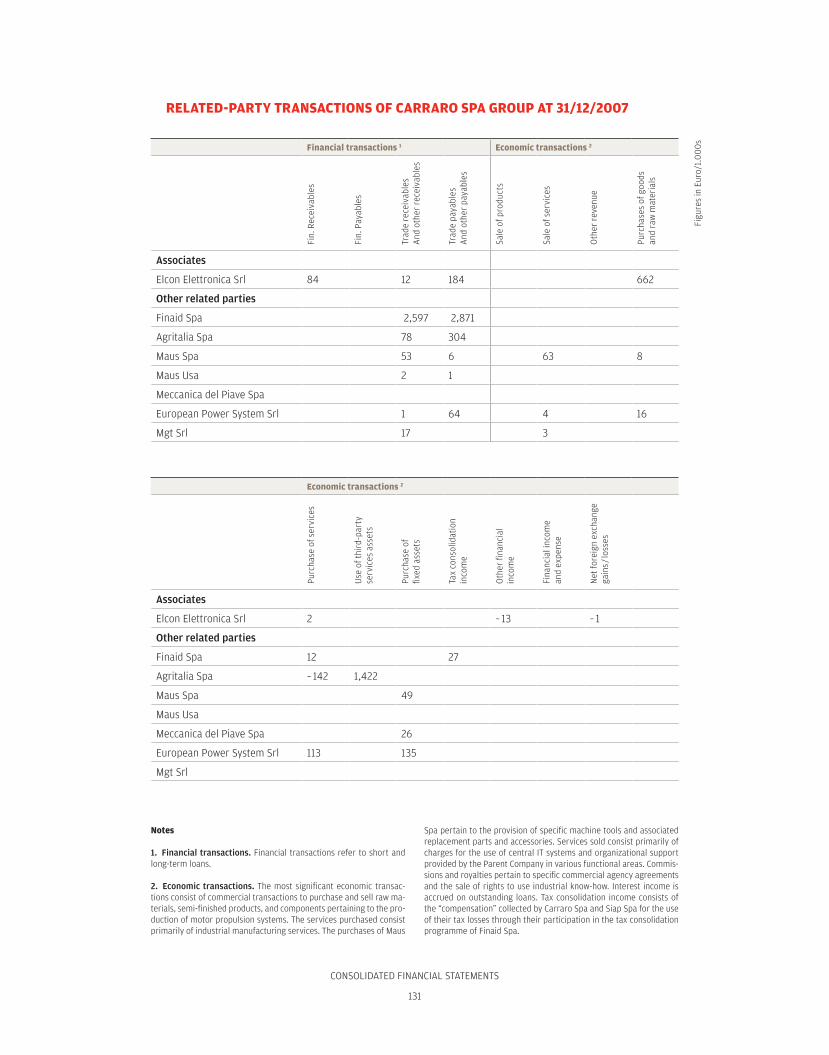
CONSOLIDATED FINANCIAL STATEMENTS
131
RELATED-PARTY TRANSACTIONS OF CARRARO SPA GROUP AT 31/12/2007
Financial transactions 1 Economic transactions 2
Fin.
Rec
eiva
bles
Fin.
Pay
able
s
Trad
e re
ceiv
able
sA
nd o
ther
rec
eiva
bles
Trad
e pa
yabl
esA
nd o
ther
pay
able
s
Sale
of p
rodu
cts
Sale
of s
ervi
ces
Oth
er r
even
ue
Purc
hase
s of
goo
ds
and
raw
mat
eria
ls
Associates
Elcon Elettronica Srl 84 12 184 662
Other related parties
Finaid Spa 2,597 2,871
Agritalia Spa 78 304
Maus Spa 53 6 63 8
Maus Usa 2 1
Meccanica del Piave Spa
European Power System Srl 1 64 4 16
Mgt Srl 17 3
Economic transactions 2
Purc
hase
of s
ervi
ces
Use
of t
hird
-par
ty
serv
ices
ass
ets
Purc
hase
of
fixed
ass
ets
Tax
cons
olid
atio
n in
com
e
Oth
er fi
nanc
ial
inco
me
Fina
ncia
l inc
ome
and
expe
nse
Net
fore
ign
exch
ange
ga
ins /
loss
esAssociates
Elcon Elettronica Srl 2 – 13 – 1
Other related parties
Finaid Spa 12 27
Agritalia Spa – 142 1,422
Maus Spa 49
Maus Usa
Meccanica del Piave Spa 26
European Power System Srl 113 135
Mgt Srl
Notes
1. Financial transactions. Financial transactions refer to short and long-term loans.
2. Economic transactions. The most significant economic transac-tions consist of commercial transactions to purchase and sell raw ma-terials, semi-finished products, and components pertaining to the pro-duction of motor propulsion systems. The services purchased consist primarily of industrial manufacturing services. The purchases of Maus
Spa pertain to the provision of specific machine tools and associated replacement parts and accessories. Services sold consist primarily of charges for the use of central IT systems and organizational support provided by the Parent Company in various functional areas. Commis-sions and royalties pertain to specific commercial agency agreements and the sale of rights to use industrial know-how. Interest income is accrued on outstanding loans. Tax consolidation income consists of the “compensation” collected by Carraro Spa and Siap Spa for the use of their tax losses through their participation in the tax consolidation programme of Finaid Spa.
Figu
res
in E
uro/
1.0
00
s

CONSOLIDATED FINANCIAL STATEMENTS
132
CERTIFICATION OF THE CONSOLIDATED FINANCIAL STATEMENTS PURSUANT TO ARTICLE 81-TER OF CONSOB REGULATION NO. 11971 OF 14 MAY 1999, AS AMENDED.
1. The undersigned, Carlo Borsari, the Chief Executive Officer, and Enrico Go-miero, the executive in charge of the preparation of the corporate accounting docu-ments of Carraro spa, hereby attest to the following pursuant to the provisions of article 154-bis, sections 3 and 4, of legislative decree no. 58 of 24 February 1998:
a. the adequacy in relation to characteristics of the enterprise, and
b. the effective application of administrative and accounting procedures applied to form the Consolidated Financial Statements in 2007.
2. Furthermore, the undersigned hereby attest that the Consolidated Financial Statements:
a. correspond to the results of company records and accounting entries;
b. have been drafted in accordance with the ias / ifrs recognized within the Eu-ropean Community pursuant to ec Regulation No. 1606/2002 of the European Parliament and the Council of 19 July 2002, and, to the best of their knowled-ge, are suitable for providing a truthful and accurate representation of the ear-nings and financial position of the issuer and the group of companies included in the consolidation area.
Date: 20 March 2008
CARLO BORSARI ENRICO GOMIEROChief Executive Officer Chief Financial Officer

CONSOLIDATED FINANCIAL STATEMENTS
133

CONSOLIDATED FINANCIAL STATEMENTS
134

CONSOLIDATED FINANCIAL STATEMENTS
135

RELAZIONE SULLA GESTIONE
136
RELAZIONE SULLA GESTIONE
137

RELAZIONE SULLA GESTIONE
138
RELAZIONE SULLA GESTIONE
139
Report of the Board of Statutory Auditorson the Consolidated Financial Statements
Shareholders,In performing the duties entrusted to us and re-
garding the Consolidated Financial Statements of the Carraro Group for the year ended on 31 Decem-ber 2007, we acknowledge the following:
– for information on our supervisory activity dur-ing financial year 2007 we refer the reader to our Report on the Financial Statements of the Parent Company, Carraro spa;
– we reviewed and supervised, to the extent of our responsibility, the adequacy of the Com-pany’s organizational structure and its com-pliance with the principles of proper admin-istration, by means of direct observation, the gathering of information from the heads of administration, and periodic meetings with the Independent Auditors and members of the boards of statutory auditors of Italian subsid-iaries in the interest of the reciprocal exchange of significant data and information;
– we received the Consolidated Financial State-ments and the associated Directors’ Report on Operations from the Board of Directors by the legal deadline;
– we verified compliance with the provisions of law that govern the Consolidated Financial Statements and Directors’ Report on Opera-tions and acknowledged the Independent Au-ditors’ Report on the Consolidated Financial Statements of the Carraro Group, which does not contain any remarks or request further disclosures.
The aforementioned Consolidated Financial State-ments have been prepared in accordance with the ias / ifrs issued by the International Accounting
Standards Board (iasb) pursuant to the provisions of Legislative Decree No. 38 of 28 February 2005, which implemented EC Regulation No. 1606/2002 of the European Parliament and the Council of 19 July 2002.
The Board of Statutory Auditors has reviewed the criteria applied in preparing the Consolidated Financial Statements, particularly as concerns the scope of consolidation and the uniformity of applica-tion of the above-mentioned accounting standards and the controls we carried out permitted us to establish the compliance of the procedures applied with applicable legislation.
It is our opinion that the Consolidated Financial Statements as a whole provide an accurate represen-tation of the Carraro Group’s earnings and financial position for the year ended on 31 December 2007 in accordance with the cited provisions governing the preparation of consolidated financial statements. The Board further finds that the Directors’ Report on Operations is accurate and corresponds with the Consolidated Financial Statements.
Campodarsego (Italy), 7 April 2008
THE BOARD OF STATUTORY AUDITORSFederico MeoRoberto SaccomaniFrancesco Secchieri

RELAZIONE SULLA GESTIONE
140
Auditors’ Reportin accordance with Art. 156 of Law Decree No. 58/1998
RELAZIONE SULLA GESTIONE
141
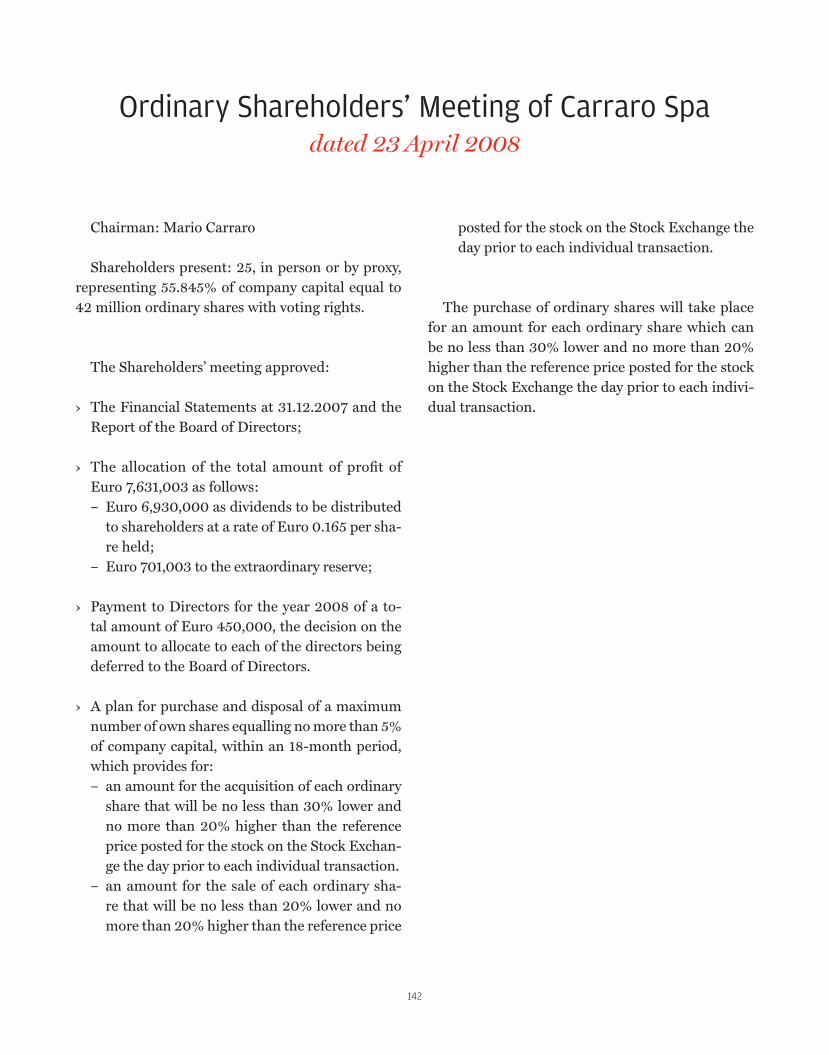
RELAZIONE SULLA GESTIONE
142
Ordinary Shareholders’ Meeting of Carraro Spadated 23 April 2008
Chairman: Mario Carraro
Shareholders present: 25, in person or by proxy, representing 55.845% of company capital equal to 42 million ordinary shares with voting rights.
The Shareholders’ meeting approved:
› The Financial Statements at 31.12.2007 and the Report of the Board of Directors;
› The allocation of the total amount of profit of Euro 7,631,003 as follows:– Euro 6,930,000 as dividends to be distributed
to shareholders at a rate of Euro 0.165 per sha-re held;
– Euro 701,003 to the extraordinary reserve;
› Payment to Directors for the year 2008 of a to-tal amount of Euro 450,000, the decision on the amount to allocate to each of the directors being deferred to the Board of Directors.
› A plan for purchase and disposal of a maximum number of own shares equalling no more than 5% of company capital, within an 18-month period, which provides for: – an amount for the acquisition of each ordinary
share that will be no less than 30% lower and no more than 20% higher than the reference price posted for the stock on the Stock Exchan-ge the day prior to each individual transaction.
– an amount for the sale of each ordinary sha-re that will be no less than 20% lower and no more than 20% higher than the reference price
posted for the stock on the Stock Exchange the day prior to each individual transaction.
The purchase of ordinary shares will take place for an amount for each ordinary share which can be no less than 30% lower and no more than 20% higher than the reference price posted for the stock on the Stock Exchange the day prior to each indivi-dual transaction.

RELAZIONE SULLA GESTIONE
143
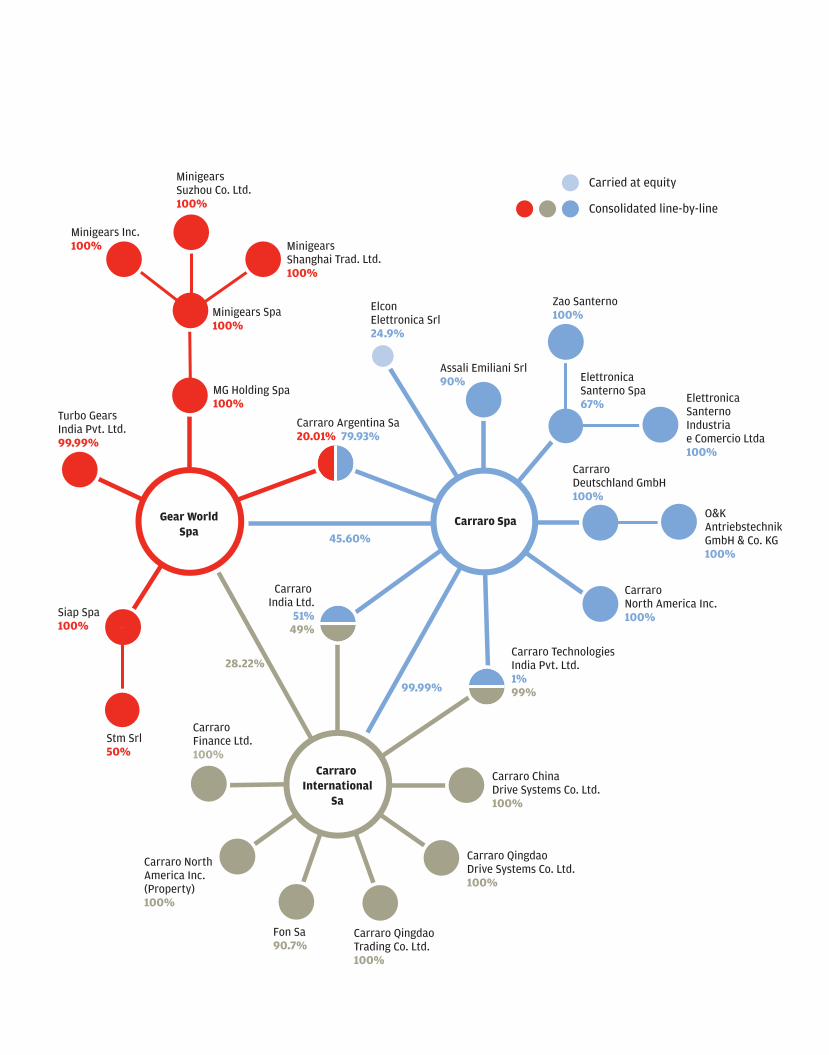
�����������������
�������������������������
��������������������������
����������������������������������������
�����������������������
������������������
���������������������������������
�����������������
�����������������������������
���������������������������������
������������������
����������������������������������������
�����������������������������������������
����������������������������������������
�����������������������������������
�����������
������������������
������
������������
���������������������������
����������������������������������
����������������������
����������������������������
������
������
������
����������������������������������������������
����������������
��������������������������������������������������
���������������������
��
�������������
����������
������������������������������

Carraro SpaCampodarsegoHeadquartersVia Olmo, 3735011 Campodarsego(Padova), ItalyP +39 049 9219111F +39 049 [email protected]
www.carraro.com
Carraro SpaGorizia PlantVia Brigata Casale, 7034170 Gorizia, ItalyP +39 0481 597711F +39 0481 [email protected]
Carraro SpaSpare Parts DivisionRovigo Plant Via A. Grandi, 2545100 Rovigo, ItalyP +39 0425 365711F +39 0425 [email protected]
Carraro SpaAgritalia DivisionRovigo Plant Via del Lavoro, 145100 Rovigo, ItalyP +39 0425 403611F +39 0425 [email protected]
SIAP SpaManiago PlantVia Monfalcone, 433085 Maniago(Pordenone), ItalyP +39 0427 706911F +39 0427 [email protected]
SIAP SpaPoggiofiorito PlantContrada Mortella, 6466030 Poggiofiorito(Chieti), ItalyP +39 0871 938111F +39 0871 [email protected]
ElettronicaSanterno SpaVia G. di Vittorio, 340020 Casalfiumanese(Bologna), ItalyP +39 0542 668611F +39 0542 [email protected]
A.E. SrlVia Provinciale Nord, 4540050 Castello D’Argile(Bologna), ItalyP +39 051 6868111F +39 051 [email protected]
O&K AntriebstechnikGmbH & Co. KGNierenhofer Str. 10D- 45525 HattingenGermanyP +49 2324 20501F +49 2324 205429o&[email protected]
Fabryka OsiNapedowych S.A.Ul. l. Krasickiego 63/7197-500 Radomsko, PolandP +48 44 6821592F +48 44 [email protected]
CarraroArgentina S.A.Valentìn Gomez 5771706 Haedo, Buenos AiresArgentinaP +54 11 44897200F +54 11 [email protected]
CarraroNorth America Inc.2505 International ParkwayVirginia BeachVA 23452 UsaP +1 757 6893725F +1 757 [email protected]
Carraro India Ltd.B2/2 MIDC Ind. AreaRanjangaon, 412210 PuneIndiaP +91 2138 232101-662666F +91 2138 [email protected]
Turbo GearsIndia Pvt. Ltd.B 2/3 MIDC Ind. AreaRanjangaon, 412210 PuneIndiaP +91 2138 661600F +91 2138 [email protected]
Carraro TechnologiesIndia Pvt. Ltd.Gigaspace, Building Beta 1Third floor, Office No. 301Viman Nagar, PuneIndiaP +91 20 66216700F +91 20 [email protected]
Carraro QingdaoDrive Systems Co., Ltd.No 11 Road,Qingda Industrial Park,Jihongtan Subdistrict,Chengyang District Qingdao266111 Shandong ProvinceChinaP +86 532 66963000F +86 532 [email protected]
Andy Potts
« It was an exciting opportunity to be invited to illustrate the Carraro
Annual Report, especially to be able to visit the people in their envi-
ronment and understand how the company works first hand.
During my visit I was able to observe every level of the company
from the management offices to the administration and design areas
then to the factory floor to see how the products are physically put
together. For me it was a unique and inspirational experience to be
given that kind of insight and gave me the confidence to take on the
job of visualising the Carraro world.
I found that the product designs of the axles, gears and drivelines
provided wonderful shapes to create illustrations with. Using hand
drawn elements, painted textures and photographic materials I
wanted to create dynamic collages and colourful compositions that
best explored the many faces of Carraro.
The illustrations take in the human aspect of the diverse global
workforce, the range of products and their industrial applications,
the international and cultural expansion of Carraro and the environ-
mental aspirations of the company for a greener future.
It has been a great experience and I hope you like the results as
much as I have enjoyed creating them ».
Hailing from Dudley in the UK, Andy graduated with a BA Hons in Illustration from Portsmouth University in 1995. Soon afterwards he moved to London and partnered up with an Apple Mac to pursue dual careers in digital media and freelance illustration. Since then the commissions have flown in, ranging from advertising, book covers and editorial spots for international newspapers and magazines. His style is an energetic fusion of traditional and new techniques, where hand crafted elements collide with digital collage, 3d and photography with colourful results. He has exhibited work in London, Europe and the US and also works with animation – recently creating his first feature film titles and having worked as Lead Designer/animator for 7 years at Abbey Road Studios. Some of his clients include IBM, BBC, Random House, The Guardian, Time Maga-zine, New York Times, Wired and Channel 4.

Carraro GruppoAnnual Report 2007
DesignFrancesco CeccarelliMarco Comastri[Bunker / www.bnkr.it]
IllustrationsAndy Potts[www.andy-potts.com]
Typeset inAmplitude[Christian Schwartz, 2003]Miller Text[Matthew Carter, 2002]
PrintGrafiche Rebecchi CeccarelliModena