Embed Size (px)
Citation preview
Cartographic, Geophysical and Diver Surveys of the MedievalTown Site at Dunwich, Suffolk, England
D. A. SearSchool of Geography, University of Southampton, Highfield, Southampton SO17 1BJ, UK
S. R. BaconSuffolk Underwater Studies, Front Street, Orford, Suffolk IP12 2LN, UK
A. Murdock and G. DoneghanGeoData Institute, School of Geography, University of Southampton, Highfield, Southampton SO17 1BJ, UK
P. Baggaley and C. SerraWessex Archaeology, Portway House, Old Sarum Park, Salisbury SP4 6EB, UK
T. P. LeBasNational Oceanography Centre, Southampton, University of Southampton Waterfront Campus, European Way,Southampton SO14 3ZH, UK
This paper presents the results of an integrated historical and geophysical survey of a medieval town lost through cliff recessionand coastal inundation. Key objectives included evaluating historic maps in supporting the relocation and identification ofmajor buildings, and applying integrated multibeam, side-scan and sub-bottom profiling to determine the location and extentof archaeological remains. The results demonstrate that cartographic sources from 1587 onwards can be a reliable source of datato guide geophysical survey. Integration of historical mapping with geophysical data enabled identification of the remains oftwo medieval structures, and the tentative identification of two others.
© 2010 The Authors
Key words: geophysical survey, Dunwich, medieval, multibeam, side-scan.
Interest in the archaeological and heritage value ofcoastal and near-shore sites is increasing inresponse to concerns over damage due to
enhanced coastal recession (Fulford et al., 1997), agrowing realisation that structural remains are moreextensive than previously thought (Sear et al., 2009),and improvements in the geophysical technology avail-able for site investigation (Grøn et al., 2007; Pletset al., 2009). Protection and exploration of inundatedsites remains challenging, particularly in near-shoreareas with limited visibility. Conventional approachesbased on diver investigation of discrete remains (suchas wrecks) are less effective in low-visibility environ-ments where the archaeological remains may be dis-
tributed over a wider area by the processes of cliffrecession or movement under storm or tidal currents(Fulford et al., 1997).
The potential scale of the heritage and archaeologi-cal resource within former coastal sites is demonstratedby the presence of over 150 documented settlementsknown to have been lost to coastal recession within theNorth Sea basin over the last 1000 years. Most of theselie in shallow turbid water, often less than 500 m fromthe current coastline, and range in size from largemedieval towns (such as Dunwich, UK, or Rungholt,Germany) to small villages and hamlets. Collectivelythey represent a relatively under-researched and largelyunprotected archaeological resource. This paper
The International Journal of Nautical Archaeology (2010) ••.••: ••–••doi: 10.1111/j.1095-9270.2010.00275.x
© 2010 The Authors. Journal Compilation © 2010 The Nautical Archaeology Society.Published by Blackwell Publishing Ltd. 9600 Garsington Road, Oxford OX4 2DQ, UK and 350 Main Street, Malden, MA 02148, USA.
describes research on a large medieval port and townsite on the east coast of England, where cliff recessionand inundation of low-lying land has resulted in theloss of over 90% of the settlement. In the study weintegrate historical analysis with the latest marine geo-physical survey technology to reconstruct the urbangeography and to relocate and identify the remains ofsome of the larger stone structures within the town.
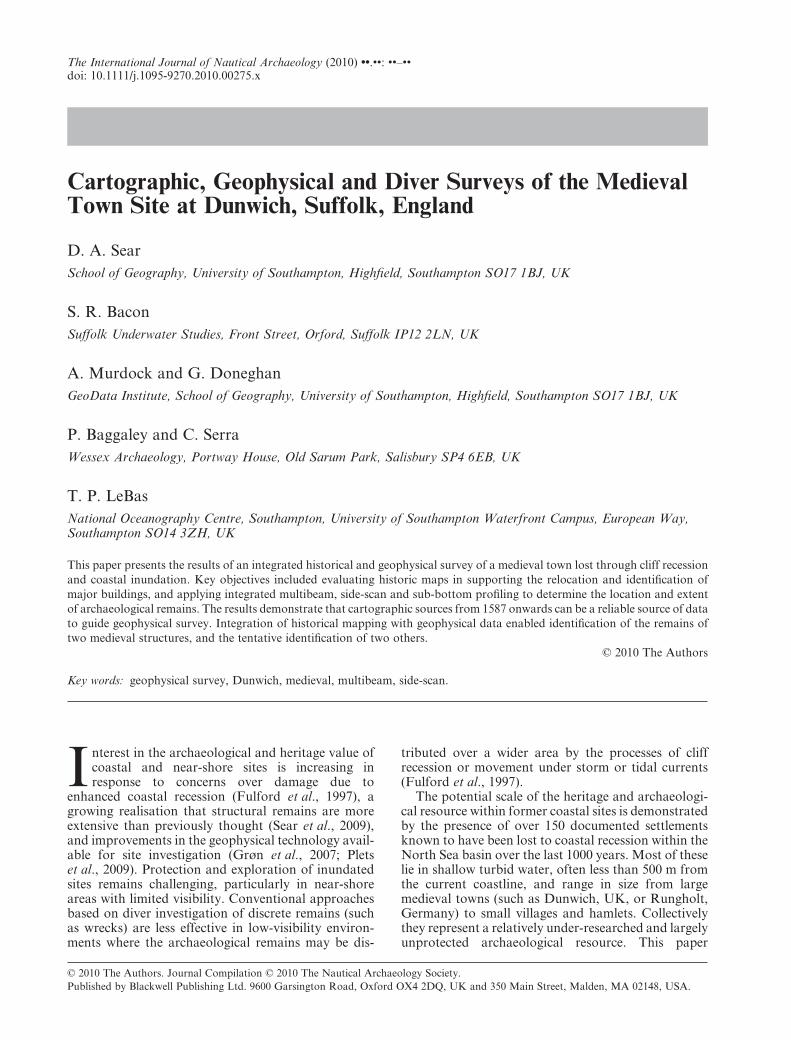
The siteThe former medieval port and town of Dunwich islocated in the county of Suffolk, East Anglia (Fig. 1),on the southern margin of the former estuary of theBlyth and Dunwich rivers at British National Grid TM47678 70558 (52.27731°N, 1.62937°E). The site islocated on the western margin of the southern NorthSea basin, an area that is currently experiencing slowsubsidence as a result of both regional tectonic factorsand the collapse of a proglacial forebulge (Shennan,1989; Lambeck, 1995; Pye and Blott, 2006; Rose,2008). The solid geology of the Dunwich area consistsmainly of Pliocene and Pleistocene age (3.75–1.5million years old) sediments and weakly-cementedsedimentary rocks, notably the Coralline Crag(Pliocene) and the Red and Norwich Crags (Pleis-tocene). These latter deposits are mainly shallowmarine, coastal, and estuarine in origin (Zalasiewiczet al.,1988; Rose, 2008).
The Westleton Beds are particularly coarse (Rose,2008: 9) and represent nearshore beach depositionalenvironments. Drift deposits that lie above theNorwich Crag consist mainly of boulder clay andfluvial deposits belonging to the Lowestoft Till Forma-tion, with deposits of Holocene alluvium and peatwithin the modern valleys. An estuary existed at
Dunwich, deriving fluvial drainage from the riversBlyth and Dunwich catchments. These are now cut offfrom the sea by a shingle-and-sand barrier systemwhich migrated shoreward and southwards during theMiddle Ages to form a spit. The estuary, and formerharbour, were formed as a result of early to mid-Holocene flooding of river valleys which were cut to alower level during glacial low sea-level stands (Pye andBlott, 2006). Since the closure of the southern mouth ofthe estuary at Dunwich, freshwater marshes and peatdeposits have developed. These areas of marsh havebeen drained and reclaimed. Most recently, rising sea-levels, storms and a decrease in longshore sedimentsupply have led to increased breaching of the barrierand the deposition of higher-energy sands and shingleover the marshes (Pye and Blott, 2009).
HistoryThe history of Dunwich is relatively well documented(for example Gardner, 1754; Bacon, 1982; Comfort,1994; Bailey, 2007). The settlement was established as aport due to the presence of a sheltered natural harbourat the mouth of the estuary of the Dunwich and Blythrivers, with good access to the fishing grounds of theNorth Sea and later the north Atlantic, and good traderoutes with the rest of the country and continentalEurope.
The first unequivocal reference to Dunwich is in theDomesday survey of England in 1089 AD. This statesthat in 1086 the town had one church, but by 1089there were three. At the time of the Domesday surveyDunwich was the second-largest town in Suffolk, andin terms of population was among the 18 largest townsin England (Darby, 1971: 25). The growth of Dunwichas a leading seaport may be linked to the development
Figure 1. Location of the Dunwich site in the context of the southern North Sea basin. (D. Sear and R. Smith)
NAUTICAL ARCHAEOLOGY, ••.••
2 © 2010 The Authors. Journal Compilation © 2010 The Nautical Archaeology Society
of the marine fishing industry in the North Sea between950 and 1050 (Barrett et al., 2004). The change tomarine fish exploitation (particularly herring) wasdriven by a series of factors including development ofChristian fasting regulations (important post-950),national population growth, increasing urbanism anda declining freshwater fish resource (Barrett et al.,2004). Dunwich, along with other North Sea coastalsettlements, was well placed to harvest the near-shoreherring shoals.
The town was sufficiently important to havereceived a Royal Charter granting it borough status in1199, and the position of mayor was established bycharter in 1215 (Comfort, 1994: 27–8.). In 1242Dunwich was the largest port in the county of Suffolk,and at the time of Edward I’s assessment of the wealthof towns in England in 1282, Dunwich was ranked 6thin East Anglia (value £66, compared with Ipswich thecounty town, valued at £100). At its height (c.1250)Dunwich was approximately 1.6 km (1 mile) fromnorth to south, with an area similar to the City ofLondon (Comfort, 1994: 36). The population ofDunwich has been estimated at this time to have beenover 5000, with at least 800 taxable houses and anarea of c.800 acres (Bailey, 1992: 3; Comfort, 1994:36).
The economy of the town was focused on the port,with trade in fish, salt, cloth, wool and other agricul-tural products (Bailey, 1992: 19). Imports were variedand included wine, potash, bowstaffs, pottery andCaen stone for building (Comfort, 1994: 78). Tradelinks were extensive, mainly with the Low Countries,Germany and France (Bailey, 1992: 20; Comfort, 1994:77) but extending as far as Spain and Iceland. Coastaltrade was also carried out around the east and southcoasts of England, with, for example, regular export ofagricultural produce to London. Dunwich was also animportant shipbuilding centre, often required to sendships to support the king’s navy. Royal galleys werebuilt and based at Dunwich up to the 15th century, andmerchantmen and fishing barks were built there untilthe end of the 16th century. Fishing for herring, andlater cod, was an important part of the town’seconomy. Herring fishing was undertaken closeinshore from Michaelmas (29 September) until Mar-tinmas (11 November) (Gardner, 1754: 37; Comfort,1994: 71). The importance of this trade is indicated bythe holding of fairs on these dates, and the dedicationof two of the town’s churches to St Martin and StMichael.
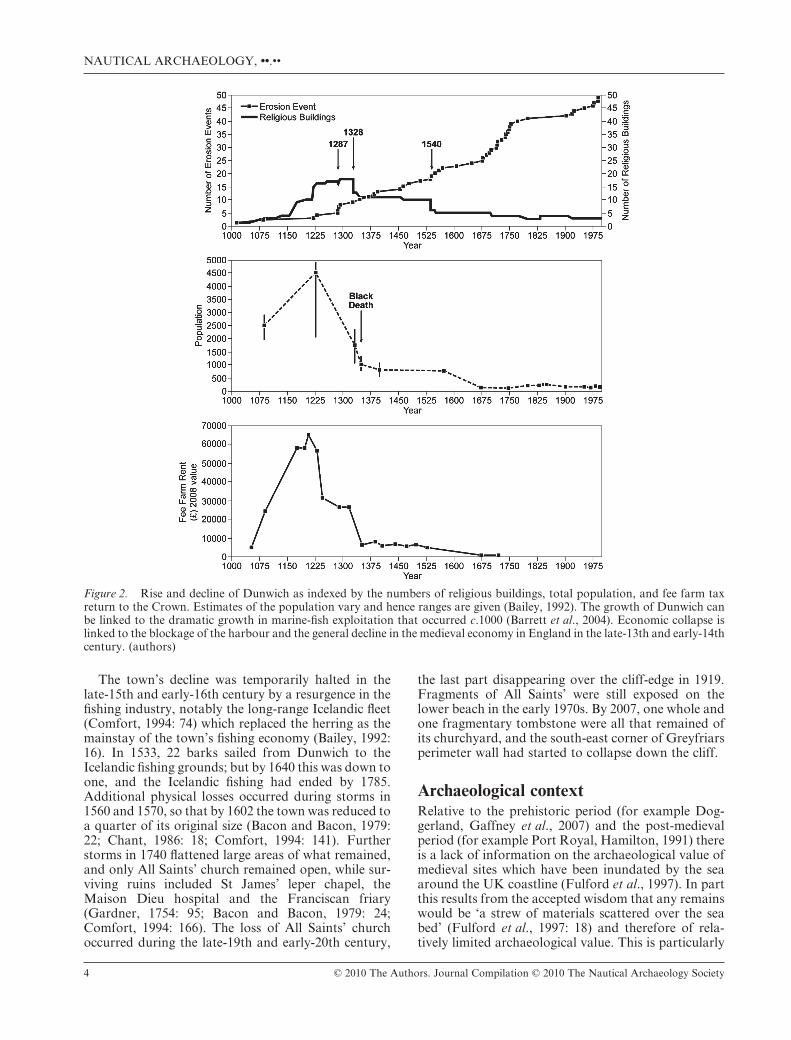
It was revenue from the port which paid the town’srent to the Crown (fee farm) and tithes to the churches.Figure 2 documents the rise and fall of Dunwich asindexed by the total population, the number of eccle-siastical buildings (itself a crude measure of the town’swealth) and the fee farm tax value of the town(Gardner, 1754: 23–5) adjusted to 2008 values (Officer,2009). Rapid development occurred in the town from1086 AD, with the Norman occupation enabling free
trade with France and continental Europe (Haslam,1992: 44). In an age when the Church was the onlypan-European organisation, creation of an ecclesiasti-cal infrastructure was important for wider economicdevelopment (Mann, 1986: 503). The extent of thatinfrastructure also reflects the capacity of medievalpeople to invest in religion and the afterlife, both ofwhich were regarded as of paramount importance.Thus in Dunwich, as happened nationwide, churchbuilding accelerated rapidly during the 12th and13th centuries, with the arrival of various religiousorders—Greyfriars (Franciscans), Blackfriars(Dominicans) and the Knights Templar—and thebuilding of 15 new ecclesiastical structures. The popu-lation grew rapidly over the period 1086–1250,attracted by the opportunities and wealth of the port(Bailey, 1992: 2–3; Comfort, 1994: 36).
Loss of land at Dunwich is recorded as early as theDomesday book, when over half the taxable farmlandwas lost to the sea between 1066 and 1086 (Gardner,1754: 6). The storms of 1287–88 resulted in the destruc-tion of c.400–600 houses, particularly in the low-lyingportions (Gardner, 1754: 96; Bacon and Bacon, 1979:19; Bailey, 1991: 196; Bailey, 1992: 2; Comfort, 1994:132), while in 1328, 375 out of 400 houses were lostfrom the parishes of St Leonards, St Martins and StBartholomew (Bailey, 1991: 196; Comfort, 1994: 132).Figure 2 shows a decline in the value of the fee farmrent for the town following the 1328 event. Bailey(1991: 197–8) makes the point that the indirect effectsof coastal recession and sedimentation, such as repairsto infrastructure and the cost of rebuilding seadefences, were often as significant as the direct physicaldamage. Similarly, Galloway and Potts (2007: 372)report that climatic deterioration, particularly theincreasing frequency and severity of storms, made itever more difficult and uneconomic to defend the morevulnerable stretches of the east coast during the period1250–1450.
The major losses of infrastructure and land atDunwich between 1275 and 1350 coincided with aperiod of national economic crisis (Bailey, 2007: 72).Increased costs of harbour maintenance and loss ofincome due to blockage and diversion of the harbourentrance weakened the town’s economy. This isreflected in the collapse in market revenue in Dunwichduring this period, and in the repeated pleas to theCrown for easements on the fee-farm rent (Bailey,1992: 21). An enquiry in 1326 highlighted the abandon-ment of houses by their owners (and hence a reductionin rental income to the town) due to ‘obstruction anddeterioration’ of the port since 1278 (Bailey, 1991:197). This was made worse by the arrival of the plaguein 1340, which reduced the population still further.Economic decline continued into the 15th century.During the first three decades the fishing fleet slumpedand income from market stalls fell by 66% (Bailey1992: 21). In c.1489 the status of royal harbour wastransferred to Southwold, 5 km to the north.
D. A. SEAR ET AL.: CARTOGRAPHIC, GEOPHYSICAL AND DIVER SURVEYS OF DUNWICH, UK
© 2010 The Authors. Journal Compilation © 2010 The Nautical Archaeology Society 3
The town’s decline was temporarily halted in thelate-15th and early-16th century by a resurgence in thefishing industry, notably the long-range Icelandic fleet(Comfort, 1994: 74) which replaced the herring as themainstay of the town’s fishing economy (Bailey, 1992:16). In 1533, 22 barks sailed from Dunwich to theIcelandic fishing grounds; but by 1640 this was down toone, and the Icelandic fishing had ended by 1785.Additional physical losses occurred during storms in1560 and 1570, so that by 1602 the town was reduced toa quarter of its original size (Bacon and Bacon, 1979:22; Chant, 1986: 18; Comfort, 1994: 141). Furtherstorms in 1740 flattened large areas of what remained,and only All Saints’ church remained open, while sur-viving ruins included St James’ leper chapel, theMaison Dieu hospital and the Franciscan friary(Gardner, 1754: 95; Bacon and Bacon, 1979: 24;Comfort, 1994: 166). The loss of All Saints’ churchoccurred during the late-19th and early-20th century,
the last part disappearing over the cliff-edge in 1919.Fragments of All Saints’ were still exposed on thelower beach in the early 1970s. By 2007, one whole andone fragmentary tombstone were all that remained ofits churchyard, and the south-east corner of Greyfriarsperimeter wall had started to collapse down the cliff.
Archaeological contextRelative to the prehistoric period (for example Dog-gerland, Gaffney et al., 2007) and the post-medievalperiod (for example Port Royal, Hamilton, 1991) thereis a lack of information on the archaeological value ofmedieval sites which have been inundated by the seaaround the UK coastline (Fulford et al., 1997). In partthis results from the accepted wisdom that any remainswould be ‘a strew of materials scattered over the seabed’ (Fulford et al., 1997: 18) and therefore of rela-tively limited archaeological value. This is particularly
Figure 2. Rise and decline of Dunwich as indexed by the numbers of religious buildings, total population, and fee farm taxreturn to the Crown. Estimates of the population vary and hence ranges are given (Bailey, 1992). The growth of Dunwich canbe linked to the dramatic growth in marine-fish exploitation that occurred c.1000 (Barrett et al., 2004). Economic collapse islinked to the blockage of the harbour and the general decline in the medieval economy in England in the late-13th and early-14thcentury. (authors)
NAUTICAL ARCHAEOLOGY, ••.••
4 © 2010 The Authors. Journal Compilation © 2010 The Nautical Archaeology Society
the case for structures that have undergone a process ofcollapse down a cliff, followed by incorporation andtransport within the beach and breaker-zone (Allenet al., 1997: 24). These arguments are somewhat circu-lar, since the investigation of such sites is limited, andhence the evidence-base supporting these assumptionsis poor. It could be argued that there is importantheritage as well as archaeological value to submergedsites where contextual information exists in the form ofhistorical accounts which enable reconstruction of thesocial, economic and urban geographies. On this basisthe Dunwich town site is important as a submergedsettlement which spans the medieval period.
This value stems from four main factors. Firstly, anextensive documentary archive survives dating back tothe early medieval period, including data on the urbangeography, social structures, economy, political struc-tures, trade, and relationships with neighbouringsettlements, and including records of erosion and inun-dation (cf. Bailey, 1991; Bailey, 1992; Chant, 1986;Comfort, 1994). Secondly, the harbour area with itsassociated sea-defences and port infrastructure areknown to have been low-lying and subject to inunda-tion rather than cliff collapse. Repeated reference ismade to the uncovering of foundations of formerbuildings and wharfs (Gardner, 1754), suggestinghigher preservation potential in this area of the town.Thirdly, significant medieval and post-medieval struc-tures have survival potential, including nine churches,four chapels, and two friaries. Fourthly, the oldcourses of the Dunwich and Blythe rivers provide apotentially important sedimentary record of coastalregression, as well as potential for the preservation ofearly boat remains. Collectively the combination ofarchived documents, maps and images provides impor-tant information on the nature of the town, althoughthe full value of these, before the earliest reliable map(1587), is limited by the absence of a plan. Thus there ishistorical value in extending our understanding of theurban geography of the town, since this would helpwith the interpretation of periods of erosion recordedin documents prior to 1587, and aid historians inunderstanding the recorded disputes between individu-als from different parishes, as well as providing geo-graphical context for the declines in economic valuereported for each parish over the period 1280–1587.
Prior to the current project, considerable evidenceexisted which suggested the preservation of largermasonry remains and the potential for higher preser-vation in lower-lying areas of the former town. Divingsurveys (Bacon, 1974; 1982), and the evidence fromphotographs of the preservation of All Saints’ churchdespite cliff collapse, provide evidence that large struc-tural remains can be preserved and remain close to thepoint of entry to the foreshore (Bacon, 1974). Forexample, survival of the ruins of more massive struc-tures (churches/chapels/wells) is evidenced by the pres-ervation of large sections of All Saints’ and St Peter’son the sea-floor after 100 and 320 years of submergence
respectively (Bacon, 1982). Physically, the highest-energy conditions within the breaker-zone of the beachtend to result in scour around the larger blocks ofmasonry, resulting in their partial burial. Smaller frag-ments will be more widely dispersed and incorporatedwithin the beach material following the model of Allenet al. (1997). Off shore, tidal and wave-generated cur-rents have less energy and are therefore less likely todisperse the larger stonework, but instead scour andaccretion of sand is known to create periods of expo-sure and burial at the site (Bacon, 1974). The preser-vation of subsurface Pleistocene or early Holoceneriver-channel sediments at the site has been demon-strated by the Institute of Oceanographic Studies(Lees, 1979; Lees, 1983; Gaffney et al., 2007). Knowl-edge of the position and dimensions of the formerDunwich river would be valuable for reconstructingthe location of the harbour area and the northernlimits of the town.
Despite the inherent value in undertaking investiga-tions at Dunwich, the site represents a significant chal-lenge to underwater archaeology for three reasons.First, some of the site lies buried beneath mobile sand/silt deposits; secondly, visibility across the site is typi-cally poor to zero; and thirdly, the remains are often ina poor state of preservation after experiencing collapsefrom cliff retreat. However several factors suggestedthat a more detailed survey approach to the site waswarranted. First, the post-1587 plan of the town isrelatively well documented; secondly, extensive sea-floor exploration by divers over the period 1971–1989has confirmed the preservation of debris from some ofthe larger buildings in positions similar to thosemarked on early maps (Bacon, 1974; 1982) and thirdly,technological developments have improved the resolu-tion and positional accuracy of underwater surveyincluding sub-bottom profiling (for example, Pletset al., 2009). Despite over 30 years of very challengingdiving on the site (Bacon, 1982), it has proved difficultto map the whole of the site of the town, or accuratelyto locate and map the ruins discovered on the sea-bed.As a result the archaeological value of the town,despite its shallow depth (<12 m) and proximity to thecoast (0–800 m), remained largely unknown.
The aims of the Dunwich 2008 project were toundertake a high-resolution, non-invasive multibeam,side-scan and sub-bottom profiling survey of theformer town of Dunwich in order to determine itsarchaeological potential. This overall aim was brokendown into four key objectives. To assess the value ofhistoric mapping in supporting the relocation of majorbuildings within the former town of Dunwich usingremote underwater survey. To evaluate the potential ofintegrated multibeam, side-scan and sub-bottom pro-filing for visualizing structures associated with themedieval town. To determine the location and extentof remains which lie exposed or partially buried on thesea-bed. And to document and publish the results ofthe project for display in the Dunwich Museum, and to
D. A. SEAR ET AL.: CARTOGRAPHIC, GEOPHYSICAL AND DIVER SURVEYS OF DUNWICH, UK
© 2010 The Authors. Journal Compilation © 2010 The Nautical Archaeology Society 5
make the data available to the public and otherresearchers. The project started in December 2007,with survey of the site during May to September 2008.An additional survey of four key areas identified by the2008 survey was undertaken in June 2009.
MethodsThe 2008 and 2009 geophysical surveys were integratedin a Geographic Information System (GIS), andincluded cartographic analysis to create accurate digitalmaps of the former town with the purpose of guidingand interpreting the geophysical survey. The subse-quent geophysical survey combined 3-dimensionalmultibeam swath bathymetry, 2-dimensional (plani-metric) dual-frequency side-scan sonar, and 2-dimensional (vertical) sub-bottom transects.
The approach to cartographic analysis followedstandard cartographic procedures (Longley et al.,2001). The maps available for Dunwich were screenedto determine those which were of sufficient carto-graphic accuracy to take forward for georeferencingand those which contained information that coulddefine the survey area, but were known to be specula-tive. A decision was taken to georeference all the mapsfor the purpose of constraining the geophysical surveyarea on the basis that they summarize the availabledocumentary evidence for the extent of the town(Chant, 1986). Although Ordnance Survey maps existfor Dunwich back to 1882, these were not used forguiding the survey since by that time only the positionof one of the former churches (All Saints’) was marked(its location was taken from the 1882 OS 1:10560map). Rather, the maps of the lost town were con-structed from the 1826 tithe map and the 1587 RalphAgas map. In addition, a map of the debris-fieldslocated by Stuart Bacon and associated divers over the
period 1970–1989 was made available to the project.These maps were based on compass-bearings andtaped offsets measured from known points on the cliff-line (Bacon, 1982). Table 1 lists the maps selected forgeoreferencing and summarizes their accuracy and usein the geophysical survey.
The absence of any topographic data prior to theOrdnance Survey of 1882 made it impossible toaccount for terrain effects on position, as would bedone with ortho-rectification, so the georeferencingwas only able to apply planimetric shifts. In reality, thetotal topographic variability is less than 20 m acrossthe site, so the positional errors associated with thisconstraint were assumed to be negligible. All the his-torical maps were converted into standard WGS-84projection co-ordinates. Each map was scanned at 600dpi and the digital raster image was used to identify arange of Ground Control Points (GCPs) which werecommon to both the historical map and the OrdnanceSurvey Landline 2000 base-map which was used toderive the accurate co-ordinates for the chosen GCPs.The position accuracy of the Landline map is estimatedat 1.1 m (Ordnance Survey, 2005). Georeferencing wasperformed using a first-order polynomial transforma-tion with RMS-errors ranging from 8.2 to 49.7 m(Table 1). The georeferenced maps were then overlainwith the Ordnance Survey Landline 2000 data to checkthe alignment of features found in both data-sets. Ifalignment offset was unsatisfactory, georeferencingwas repeated with other reference points until align-ment errors were as small as possible given the limita-tions of the mapping (Theiler and Danforth, 1994).
All the processing was undertaken within ESRIARCGIS 9.2 using a minimum of 10 GCPs (Hugheset al., 2006). The difference in location between theGCPs on the transformed layer and base layer is oftenrepresented by the total root-mean-square error
Table 1. Summary RMS errors and positional accuracy for different maps georeferenced against the OS 2000 Landline. Theresulting maps were used for guiding the geophysical survey
Map BasemapNo. GCP/No. Test
pointsRMS Error
+/- (m)Accuracy+/- (m) Map use
Bacon (1982) Diversurvey map
OS Landline 2000 10/5 9.340 11.241 Location of All Saints,St Peters, andunidentified debris.
1826 Tithe Map OS Landline 2000 23/5 8.203m 9.698 Location of All Saints1587 Ralph Agas
Gardner (1754)OS Landline 2000 10/6 10.114 13.311 Location of buildings
post 15871300 Chant (1986)
(Reconstruction)OS Landline 2000 12/5 38.357 49.708 Define Survey Area
Define PotentialBuilding Location
1280 Parker(1975)(Reconstruction)
1587 Georeferenced 10/4 19.882 23.686 Define Survey AreaDefine PotentialBuilding Location
1300 Watling (1858)(Reconstruction)
1587 Georeferenced 10/4 28.225 34.304 Define Survey AreaDefine PotentialBuilding Location
NAUTICAL ARCHAEOLOGY, ••.••
6 © 2010 The Authors. Journal Compilation © 2010 The Nautical Archaeology Society
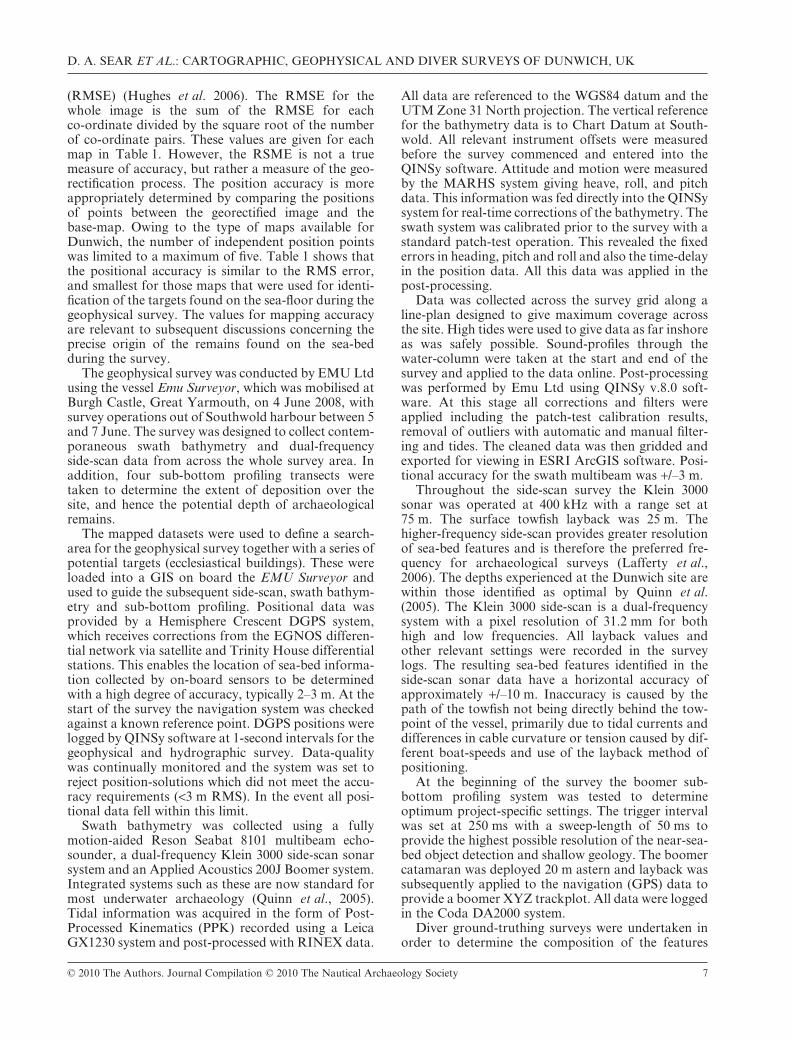
(RMSE) (Hughes et al. 2006). The RMSE for thewhole image is the sum of the RMSE for eachco-ordinate divided by the square root of the numberof co-ordinate pairs. These values are given for eachmap in Table 1. However, the RSME is not a truemeasure of accuracy, but rather a measure of the geo-rectification process. The position accuracy is moreappropriately determined by comparing the positionsof points between the georectified image and thebase-map. Owing to the type of maps available forDunwich, the number of independent position pointswas limited to a maximum of five. Table 1 shows thatthe positional accuracy is similar to the RMS error,and smallest for those maps that were used for identi-fication of the targets found on the sea-floor during thegeophysical survey. The values for mapping accuracyare relevant to subsequent discussions concerning theprecise origin of the remains found on the sea-bedduring the survey.
The geophysical survey was conducted by EMU Ltdusing the vessel Emu Surveyor, which was mobilised atBurgh Castle, Great Yarmouth, on 4 June 2008, withsurvey operations out of Southwold harbour between 5and 7 June. The survey was designed to collect contem-poraneous swath bathymetry and dual-frequencyside-scan data from across the whole survey area. Inaddition, four sub-bottom profiling transects weretaken to determine the extent of deposition over thesite, and hence the potential depth of archaeologicalremains.
The mapped datasets were used to define a search-area for the geophysical survey together with a series ofpotential targets (ecclesiastical buildings). These wereloaded into a GIS on board the EMU Surveyor andused to guide the subsequent side-scan, swath bathym-etry and sub-bottom profiling. Positional data wasprovided by a Hemisphere Crescent DGPS system,which receives corrections from the EGNOS differen-tial network via satellite and Trinity House differentialstations. This enables the location of sea-bed informa-tion collected by on-board sensors to be determinedwith a high degree of accuracy, typically 2–3 m. At thestart of the survey the navigation system was checkedagainst a known reference point. DGPS positions werelogged by QINSy software at 1-second intervals for thegeophysical and hydrographic survey. Data-qualitywas continually monitored and the system was set toreject position-solutions which did not meet the accu-racy requirements (<3 m RMS). In the event all posi-tional data fell within this limit.
Swath bathymetry was collected using a fullymotion-aided Reson Seabat 8101 multibeam echo-sounder, a dual-frequency Klein 3000 side-scan sonarsystem and an Applied Acoustics 200J Boomer system.Integrated systems such as these are now standard formost underwater archaeology (Quinn et al., 2005).Tidal information was acquired in the form of Post-Processed Kinematics (PPK) recorded using a LeicaGX1230 system and post-processed with RINEX data.
All data are referenced to the WGS84 datum and theUTM Zone 31 North projection. The vertical referencefor the bathymetry data is to Chart Datum at South-wold. All relevant instrument offsets were measuredbefore the survey commenced and entered into theQINSy software. Attitude and motion were measuredby the MARHS system giving heave, roll, and pitchdata. This information was fed directly into the QINSysystem for real-time corrections of the bathymetry. Theswath system was calibrated prior to the survey with astandard patch-test operation. This revealed the fixederrors in heading, pitch and roll and also the time-delayin the position data. All this data was applied in thepost-processing.
Data was collected across the survey grid along aline-plan designed to give maximum coverage acrossthe site. High tides were used to give data as far inshoreas was safely possible. Sound-profiles through thewater-column were taken at the start and end of thesurvey and applied to the data online. Post-processingwas performed by Emu Ltd using QINSy v.8.0 soft-ware. At this stage all corrections and filters wereapplied including the patch-test calibration results,removal of outliers with automatic and manual filter-ing and tides. The cleaned data was then gridded andexported for viewing in ESRI ArcGIS software. Posi-tional accuracy for the swath multibeam was +/–3 m.
Throughout the side-scan survey the Klein 3000sonar was operated at 400 kHz with a range set at75 m. The surface towfish layback was 25 m. Thehigher-frequency side-scan provides greater resolutionof sea-bed features and is therefore the preferred fre-quency for archaeological surveys (Lafferty et al.,2006). The depths experienced at the Dunwich site arewithin those identified as optimal by Quinn et al.(2005). The Klein 3000 side-scan is a dual-frequencysystem with a pixel resolution of 31.2 mm for bothhigh and low frequencies. All layback values andother relevant settings were recorded in the surveylogs. The resulting sea-bed features identified in theside-scan sonar data have a horizontal accuracy ofapproximately +/–10 m. Inaccuracy is caused by thepath of the towfish not being directly behind the tow-point of the vessel, primarily due to tidal currents anddifferences in cable curvature or tension caused by dif-ferent boat-speeds and use of the layback method ofpositioning.
At the beginning of the survey the boomer sub-bottom profiling system was tested to determineoptimum project-specific settings. The trigger intervalwas set at 250 ms with a sweep-length of 50 ms toprovide the highest possible resolution of the near-sea-bed object detection and shallow geology. The boomercatamaran was deployed 20 m astern and layback wassubsequently applied to the navigation (GPS) data toprovide a boomer XYZ trackplot. All data were loggedin the Coda DA2000 system.
Diver ground-truthing surveys were undertaken inorder to determine the composition of the features
D. A. SEAR ET AL.: CARTOGRAPHIC, GEOPHYSICAL AND DIVER SURVEYS OF DUNWICH, UK
© 2010 The Authors. Journal Compilation © 2010 The Nautical Archaeology Society 7
identified by the geophysical survey. An underwatervideo camera with integral lighting system was used totake film and photographic images of the features.Samples of loose stone from two of the church siteswere recovered for the identification of provenance andevidence of human origin. Nine individual stones wererecovered from positions immediately adjacent tostone structures, four from St Nicholas’ church site andfive from St Peter’s church site. These were kept inseawater and examined on shore. Three stones fromthe St Nicholas site had remains of mortar attached. Asmall sample of mortar (5 gm) was sent off to SandbergLLP labs for analysis together with an 8-gm sample oflime mortar recovered from the collapsing south-eastern section of the Greyfriars perimeter wall on thecliff at Dunwich. The samples were prepared andanalyzed using a combination of hand and chemicalseparation techniques and the chemical content andgrain-size compared. Eleven dives, totalling 345minutes, were conducted on 19, 21 and 22 September2008, over the two main church sites. The position ofthe centre of each target was occupied using GPS anda shot-line with surface buoy was positioned as close tothat point as possible. Divers descended the shot-lineto the sea-bed, then carried out a circular offset surveyaround the shot-line out to a maximum distance of5 m, while attached to the shot line at all times. Divingwas restricted to a 2-hour period of slack water on theturn of the tide. Visibility was <10 cm on all dives.
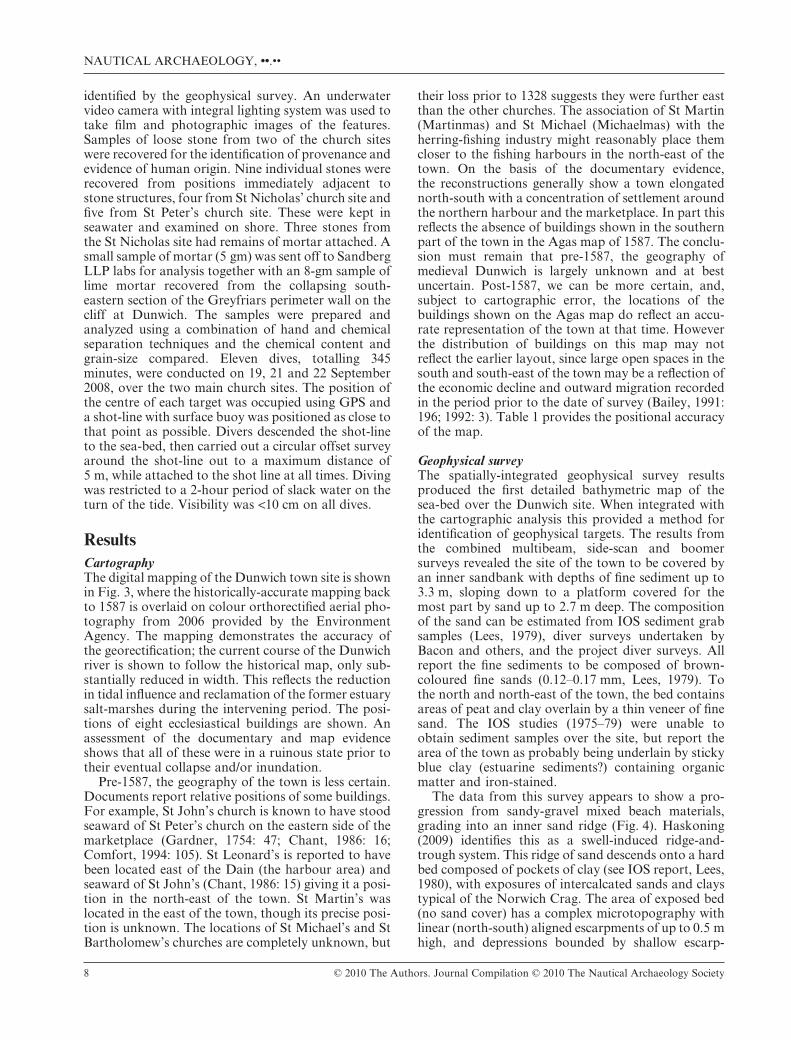
ResultsCartographyThe digital mapping of the Dunwich town site is shownin Fig. 3, where the historically-accurate mapping backto 1587 is overlaid on colour orthorectified aerial pho-tography from 2006 provided by the EnvironmentAgency. The mapping demonstrates the accuracy ofthe georectification; the current course of the Dunwichriver is shown to follow the historical map, only sub-stantially reduced in width. This reflects the reductionin tidal influence and reclamation of the former estuarysalt-marshes during the intervening period. The posi-tions of eight ecclesiastical buildings are shown. Anassessment of the documentary and map evidenceshows that all of these were in a ruinous state prior totheir eventual collapse and/or inundation.
Pre-1587, the geography of the town is less certain.Documents report relative positions of some buildings.For example, St John’s church is known to have stoodseaward of St Peter’s church on the eastern side of themarketplace (Gardner, 1754: 47; Chant, 1986: 16;Comfort, 1994: 105). St Leonard’s is reported to havebeen located east of the Dain (the harbour area) andseaward of St John’s (Chant, 1986: 15) giving it a posi-tion in the north-east of the town. St Martin’s waslocated in the east of the town, though its precise posi-tion is unknown. The locations of St Michael’s and StBartholomew’s churches are completely unknown, but
their loss prior to 1328 suggests they were further eastthan the other churches. The association of St Martin(Martinmas) and St Michael (Michaelmas) with theherring-fishing industry might reasonably place themcloser to the fishing harbours in the north-east of thetown. On the basis of the documentary evidence,the reconstructions generally show a town elongatednorth-south with a concentration of settlement aroundthe northern harbour and the marketplace. In part thisreflects the absence of buildings shown in the southernpart of the town in the Agas map of 1587. The conclu-sion must remain that pre-1587, the geography ofmedieval Dunwich is largely unknown and at bestuncertain. Post-1587, we can be more certain, and,subject to cartographic error, the locations of thebuildings shown on the Agas map do reflect an accu-rate representation of the town at that time. Howeverthe distribution of buildings on this map may notreflect the earlier layout, since large open spaces in thesouth and south-east of the town may be a reflection ofthe economic decline and outward migration recordedin the period prior to the date of survey (Bailey, 1991:196; 1992: 3). Table 1 provides the positional accuracyof the map.
Geophysical surveyThe spatially-integrated geophysical survey resultsproduced the first detailed bathymetric map of thesea-bed over the Dunwich site. When integrated withthe cartographic analysis this provided a method foridentification of geophysical targets. The results fromthe combined multibeam, side-scan and boomersurveys revealed the site of the town to be covered byan inner sandbank with depths of fine sediment up to3.3 m, sloping down to a platform covered for themost part by sand up to 2.7 m deep. The compositionof the sand can be estimated from IOS sediment grabsamples (Lees, 1979), diver surveys undertaken byBacon and others, and the project diver surveys. Allreport the fine sediments to be composed of brown-coloured fine sands (0.12–0.17 mm, Lees, 1979). Tothe north and north-east of the town, the bed containsareas of peat and clay overlain by a thin veneer of finesand. The IOS studies (1975–79) were unable toobtain sediment samples over the site, but report thearea of the town as probably being underlain by stickyblue clay (estuarine sediments?) containing organicmatter and iron-stained.
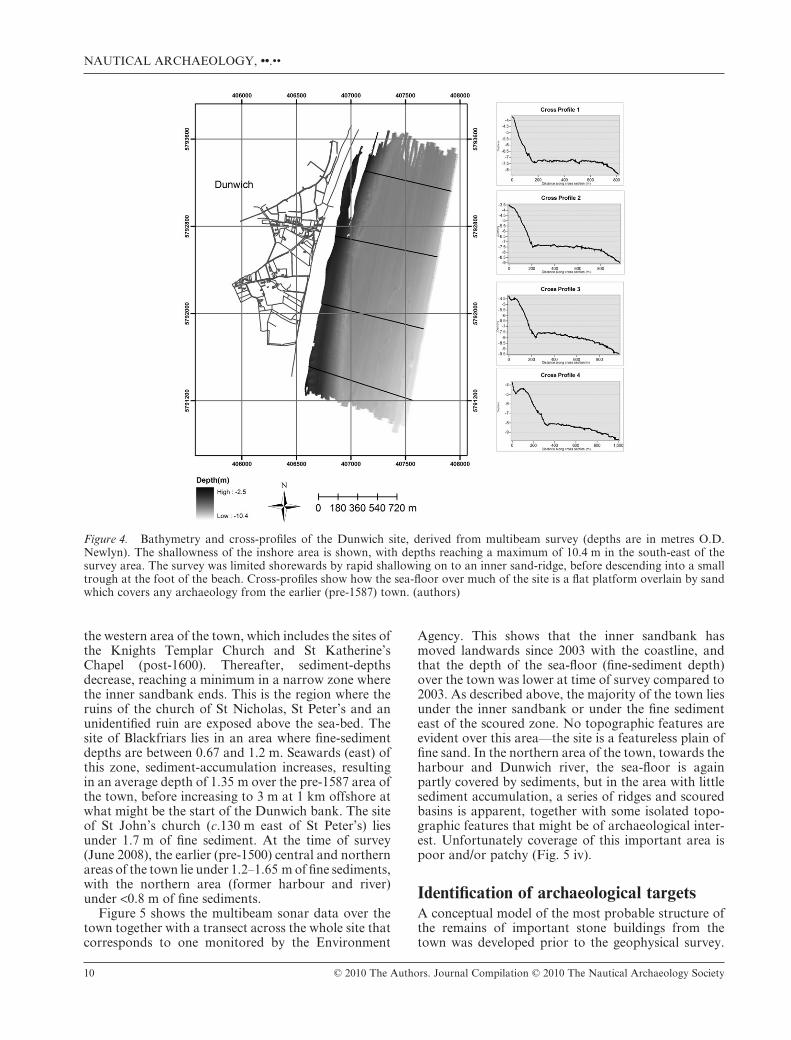
The data from this survey appears to show a pro-gression from sandy-gravel mixed beach materials,grading into an inner sand ridge (Fig. 4). Haskoning(2009) identifies this as a swell-induced ridge-and-trough system. This ridge of sand descends onto a hardbed composed of pockets of clay (see IOS report, Lees,1980), with exposures of intercalcated sands and claystypical of the Norwich Crag. The area of exposed bed(no sand cover) has a complex microtopography withlinear (north-south) aligned escarpments of up to 0.5 mhigh, and depressions bounded by shallow escarp-
NAUTICAL ARCHAEOLOGY, ••.••
8 © 2010 The Authors. Journal Compilation © 2010 The Nautical Archaeology Society
ments. The main exposed archaeological finds lie inthis area (Fig. 4). The clay/crag surface has a veneer offine sands, and patches of gravel that are perhaps asso-ciated with the decomposition of the church sites.Seaward of this area, the sea-bed is essentially a flatplain of sand, dipping gently seawards and to thesouth-east. This then climbs up on to the Dunwichbank, some 2 km offshore.
The boomer data collected for the Dunwich 2008project produced four transects. These showed a
shallow layer of sand and strong sub-surface reflectionsjust below the surface. These are interpreted to repre-sent the fine sand layers lying over more consolidatedquaternary deposits, which in this area are comprisedof intercalcated sand and clay (Lees, 1980). To producea measure of the fine-sediment depth, the boomersurvey transects were sampled every 50 m and the depthfrom the surface reflection to the lower sub-bottomreflection was obtained. Fine-sediment depths acrossthe site are up to 3.3 m where the inner sandbank covers
Figure 3. Dunwich town digital map. Buildings recorded on Ralph Agas’s map of 1587 are shown in light grey. Buildings onthe OS 2000 Landline maps are in white. The course of the present and 1587 Dunwich river is shown in bright white and darkgrey respectively. Shrinkage of the river is evident, and demonstrates the reduction in tidal influence over the intervening period.(authors)
D. A. SEAR ET AL.: CARTOGRAPHIC, GEOPHYSICAL AND DIVER SURVEYS OF DUNWICH, UK
© 2010 The Authors. Journal Compilation © 2010 The Nautical Archaeology Society 9
the western area of the town, which includes the sites ofthe Knights Templar Church and St Katherine’sChapel (post-1600). Thereafter, sediment-depthsdecrease, reaching a minimum in a narrow zone wherethe inner sandbank ends. This is the region where theruins of the church of St Nicholas, St Peter’s and anunidentified ruin are exposed above the sea-bed. Thesite of Blackfriars lies in an area where fine-sedimentdepths are between 0.67 and 1.2 m. Seawards (east) ofthis zone, sediment-accumulation increases, resultingin an average depth of 1.35 m over the pre-1587 area ofthe town, before increasing to 3 m at 1 km offshore atwhat might be the start of the Dunwich bank. The siteof St John’s church (c.130 m east of St Peter’s) liesunder 1.7 m of fine sediment. At the time of survey(June 2008), the earlier (pre-1500) central and northernareas of the town lie under 1.2–1.65 m of fine sediments,with the northern area (former harbour and river)under <0.8 m of fine sediments.
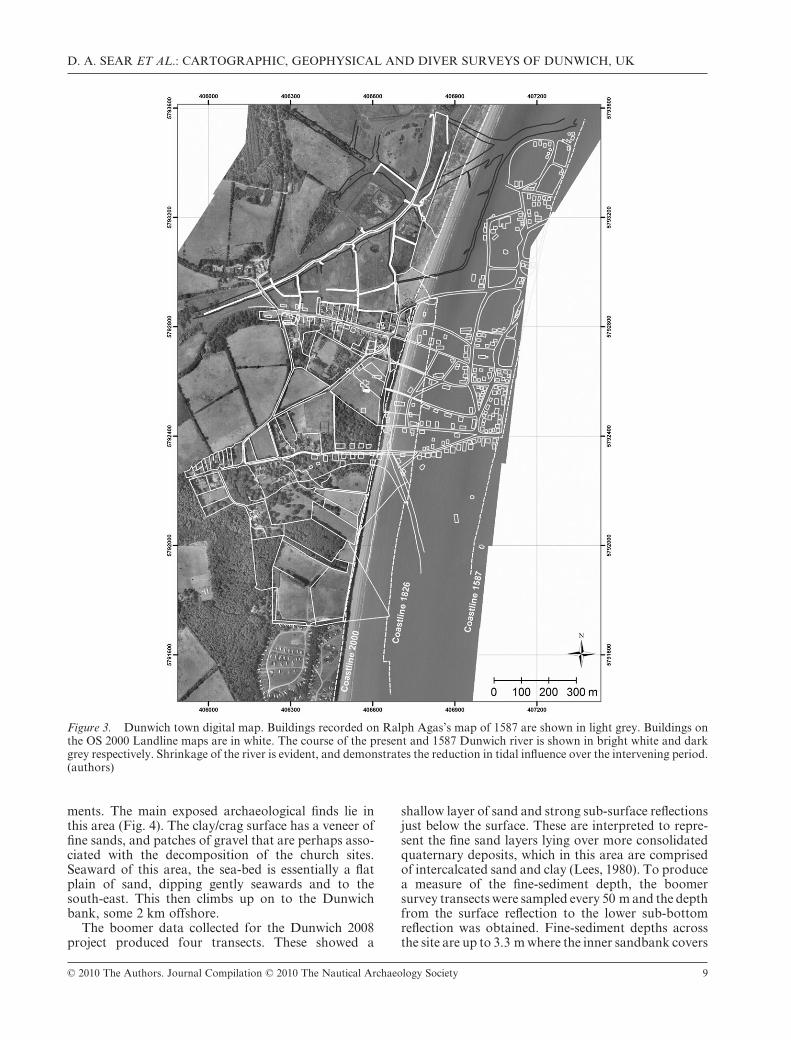
Figure 5 shows the multibeam sonar data over thetown together with a transect across the whole site thatcorresponds to one monitored by the Environment
Agency. This shows that the inner sandbank hasmoved landwards since 2003 with the coastline, andthat the depth of the sea-floor (fine-sediment depth)over the town was lower at time of survey compared to2003. As described above, the majority of the town liesunder the inner sandbank or under the fine sedimenteast of the scoured zone. No topographic features areevident over this area—the site is a featureless plain offine sand. In the northern area of the town, towards theharbour and Dunwich river, the sea-floor is againpartly covered by sediments, but in the area with littlesediment accumulation, a series of ridges and scouredbasins is apparent, together with some isolated topo-graphic features that might be of archaeological inter-est. Unfortunately coverage of this important area ispoor and/or patchy (Fig. 5 iv).
Identification of archaeological targetsA conceptual model of the most probable structure ofthe remains of important stone buildings from thetown was developed prior to the geophysical survey.
Figure 4. Bathymetry and cross-profiles of the Dunwich site, derived from multibeam survey (depths are in metres O.D.Newlyn). The shallowness of the inshore area is shown, with depths reaching a maximum of 10.4 m in the south-east of thesurvey area. The survey was limited shorewards by rapid shallowing on to an inner sand-ridge, before descending into a smalltrough at the foot of the beach. Cross-profiles show how the sea-floor over much of the site is a flat platform overlain by sandwhich covers any archaeology from the earlier (pre-1587) town. (authors)
NAUTICAL ARCHAEOLOGY, ••.••
10 © 2010 The Authors. Journal Compilation © 2010 The Nautical Archaeology Society
This was based on the evidence already existing fromphotographs of the ruins of All Saints’ church on thebeach (after collapse down the cliff), diver surveys ofthe All Saints’ and St Peter’s ruins (Bacon and Bacon,1979; Bacon, 1982) and 18th-century images of ananalogous site at the Walton Roman shore fort. Thismodel hypothesized that the ruins would be in theform of an area of rubble blocks standing up to 1 mabove the sea-bed, and of the order of between 1 and4 m in width or length. The ruins were expected to
show an accumulation of larger blocks towards thewest, associated with the more substantial structure ofa western tower, or at the centre where the church hada central tower (St Nicholas’, St John’s, and theTemple church); the positions of the ruins werehypothesized to be offset to the east from their original(mapped) location as a result of their collapse downthe cliff; to show a dispersal towards the north-south(drift movement) and east (off-shore movement)during their period within the breaker-zone of the
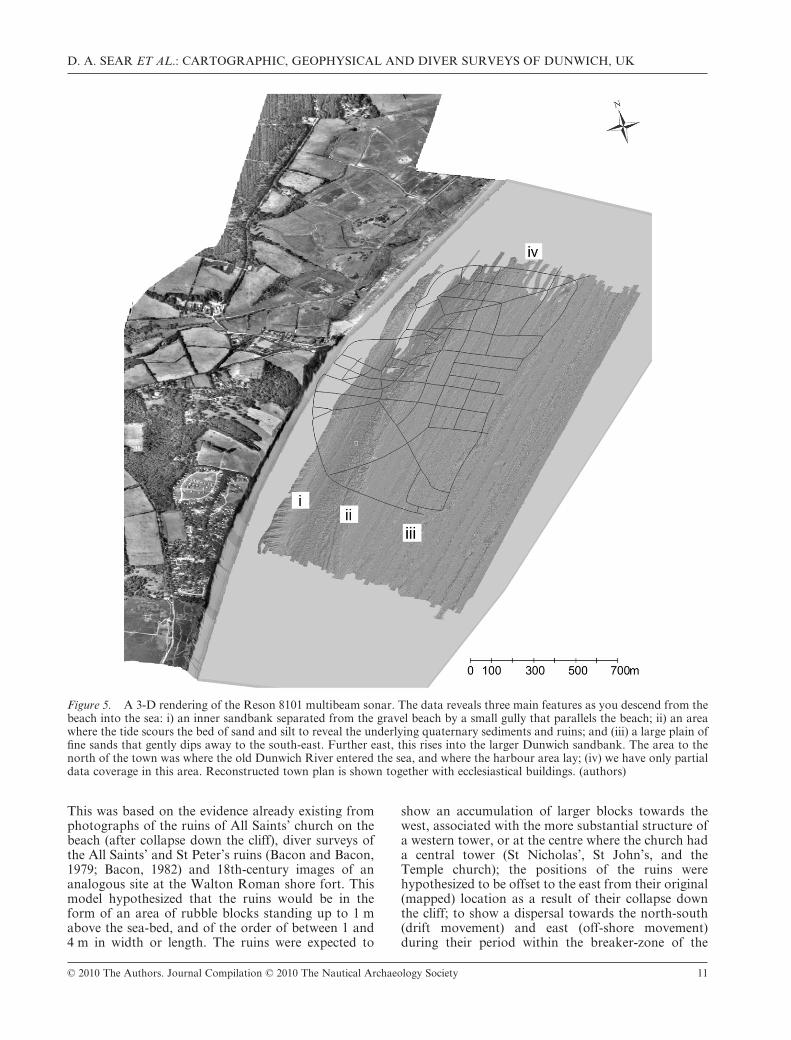
Figure 5. A 3-D rendering of the Reson 8101 multibeam sonar. The data reveals three main features as you descend from thebeach into the sea: i) an inner sandbank separated from the gravel beach by a small gully that parallels the beach; ii) an areawhere the tide scours the bed of sand and silt to reveal the underlying quaternary sediments and ruins; and (iii) a large plain offine sands that gently dips away to the south-east. Further east, this rises into the larger Dunwich sandbank. The area to thenorth of the town was where the old Dunwich River entered the sea, and where the harbour area lay; (iv) we have only partialdata coverage in this area. Reconstructed town plan is shown together with ecclesiastical buildings. (authors)
D. A. SEAR ET AL.: CARTOGRAPHIC, GEOPHYSICAL AND DIVER SURVEYS OF DUNWICH, UK
© 2010 The Authors. Journal Compilation © 2010 The Nautical Archaeology Society 11
beach; and to be discrete, and not widely dispersed,thus providing a clear area of complex sonar shadowsand intense returns, associated with a complex topo-graphic signal from the multibeam.
The multibeam and side-scan sonar surveys over thetown revealed four potential targets which containedelements of the conceptual model. Three of the targets(T1, T2 and T4) closely matched the model, of whichtwo (T1 and T2) were close to buildings shown on thedigital maps of the town. These two targets wereselected for further diver-based ground-truthing.
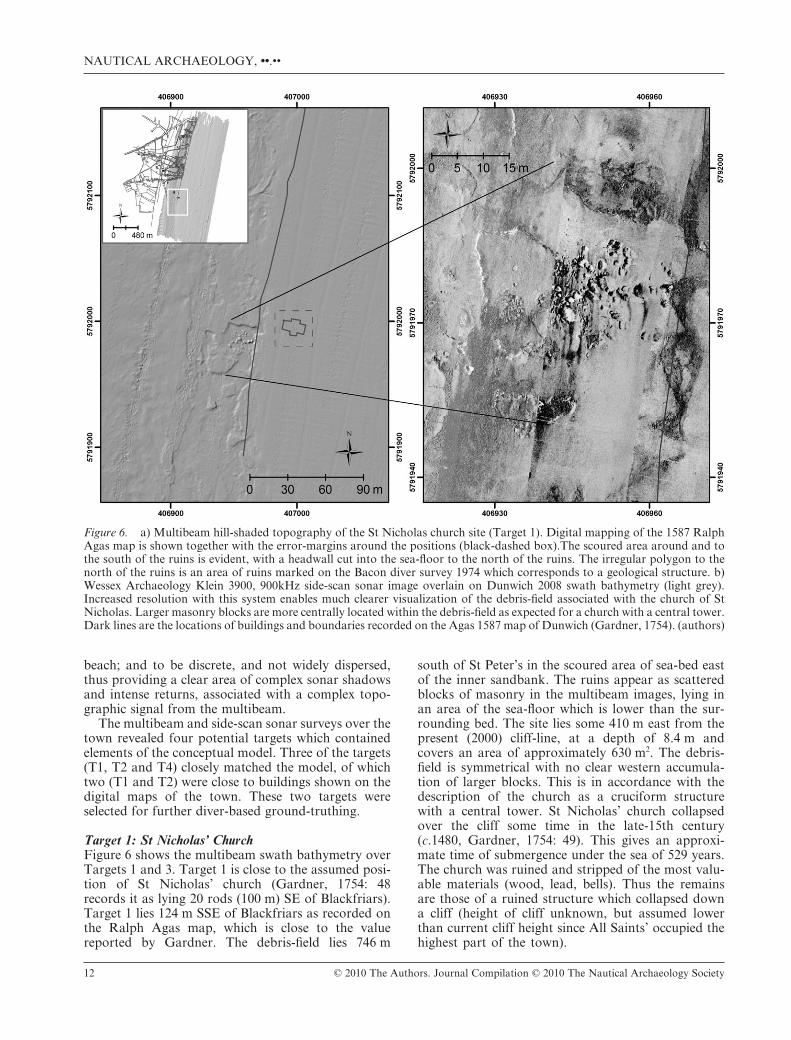
Target 1: St Nicholas’ ChurchFigure 6 shows the multibeam swath bathymetry overTargets 1 and 3. Target 1 is close to the assumed posi-tion of St Nicholas’ church (Gardner, 1754: 48records it as lying 20 rods (100 m) SE of Blackfriars).Target 1 lies 124 m SSE of Blackfriars as recorded onthe Ralph Agas map, which is close to the valuereported by Gardner. The debris-field lies 746 m
south of St Peter’s in the scoured area of sea-bed eastof the inner sandbank. The ruins appear as scatteredblocks of masonry in the multibeam images, lying inan area of the sea-floor which is lower than the sur-rounding bed. The site lies some 410 m east from thepresent (2000) cliff-line, at a depth of 8.4 m andcovers an area of approximately 630 m2. The debris-field is symmetrical with no clear western accumula-tion of larger blocks. This is in accordance with thedescription of the church as a cruciform structurewith a central tower. St Nicholas’ church collapsedover the cliff some time in the late-15th century(c.1480, Gardner, 1754: 49). This gives an approxi-mate time of submergence under the sea of 529 years.The church was ruined and stripped of the most valu-able materials (wood, lead, bells). Thus the remainsare those of a ruined structure which collapsed downa cliff (height of cliff unknown, but assumed lowerthan current cliff height since All Saints’ occupied thehighest part of the town).
Figure 6. a) Multibeam hill-shaded topography of the St Nicholas church site (Target 1). Digital mapping of the 1587 RalphAgas map is shown together with the error-margins around the positions (black-dashed box).The scoured area around and tothe south of the ruins is evident, with a headwall cut into the sea-floor to the north of the ruins. The irregular polygon to thenorth of the ruins is an area of ruins marked on the Bacon diver survey 1974 which corresponds to a geological structure. b)Wessex Archaeology Klein 3900, 900kHz side-scan sonar image overlain on Dunwich 2008 swath bathymetry (light grey).Increased resolution with this system enables much clearer visualization of the debris-field associated with the church of StNicholas. Larger masonry blocks are more centrally located within the debris-field as expected for a church with a central tower.Dark lines are the locations of buildings and boundaries recorded on the Agas 1587 map of Dunwich (Gardner, 1754). (authors)
NAUTICAL ARCHAEOLOGY, ••.••
12 © 2010 The Authors. Journal Compilation © 2010 The Nautical Archaeology Society
Diver surveys at this site resulted in the recovery offour stones which were adjacent to larger structuralblocks. Three were geologically erratic to the area,being a pink granite, a basalt, and a schist. The otherwas a large unworked flint. Two of the erratic blockshad traces of what appeared to be a lime mortar adher-ing to their surface. Blind analysis of a sample of thismortar and a sample of mortar recovered from inside acollapsed section of the southern wall of Greyfriarswas undertaken for English Heritage by Sandberg LLP(report 39360/C). This confirmed the sample recoveredfrom the submerged site as feebly-hydraulic limemortar of identical composition to that of the Greyfri-ars sample. Hence the structures on the sea-floor areconfidently ascribed to human origin and are mostlikely to be part of St Nicholas’ church. Diver surveysundertaken in poor visibility confirm the presence ofrelatively-large blocks of flint and rubble scattered overthe site, and the possible presence of some workedstone. The divers estimated the block sizes as c.1.4 mlong and between 0.3 and 0.6 m above the sea-bed. TheKlein 3900 side-scan survey (Fig. 6b) gives an average
block size of 1.3 ¥ 0.9 m, and the multibeam survey aheight above sea-bed of between 0.3 and 0.8 m, similarto those at the St Peter’s and All Saints’ sites.
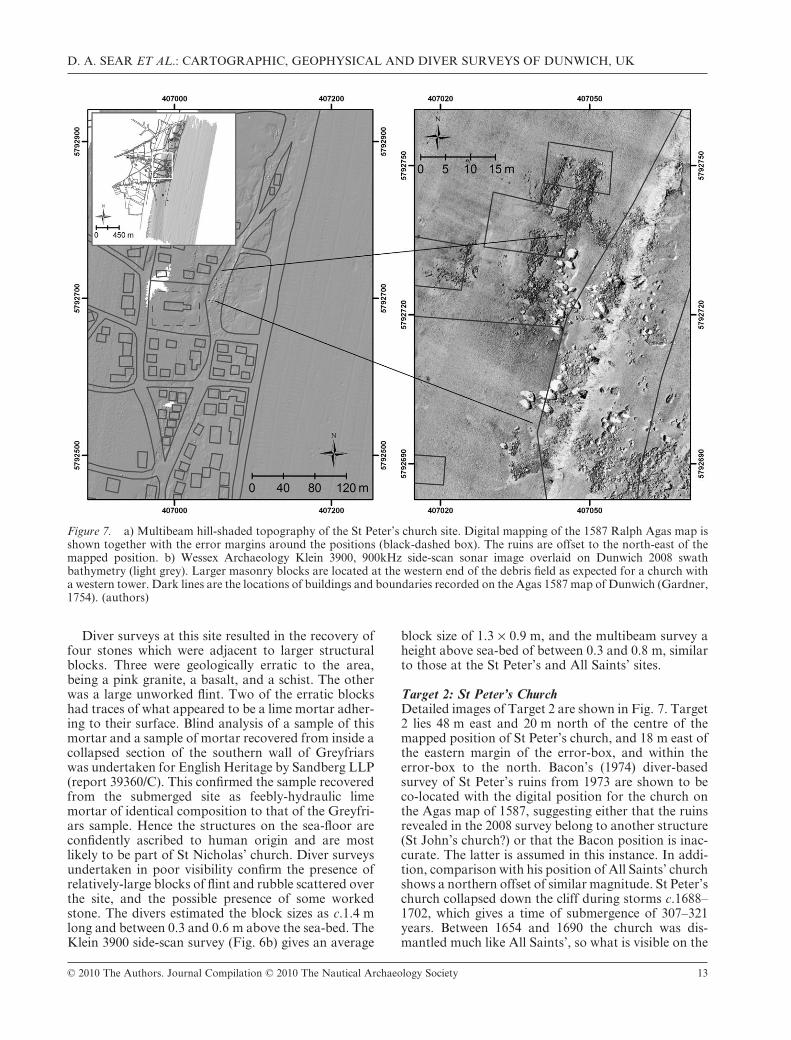
Target 2: St Peter’s ChurchDetailed images of Target 2 are shown in Fig. 7. Target2 lies 48 m east and 20 m north of the centre of themapped position of St Peter’s church, and 18 m east ofthe eastern margin of the error-box, and within theerror-box to the north. Bacon’s (1974) diver-basedsurvey of St Peter’s ruins from 1973 are shown to beco-located with the digital position for the church onthe Agas map of 1587, suggesting either that the ruinsrevealed in the 2008 survey belong to another structure(St John’s church?) or that the Bacon position is inac-curate. The latter is assumed in this instance. In addi-tion, comparison with his position of All Saints’ churchshows a northern offset of similar magnitude. St Peter’schurch collapsed down the cliff during storms c.1688–1702, which gives a time of submergence of 307–321years. Between 1654 and 1690 the church was dis-mantled much like All Saints’, so what is visible on the
Figure 7. a) Multibeam hill-shaded topography of the St Peter’s church site. Digital mapping of the 1587 Ralph Agas map isshown together with the error margins around the positions (black-dashed box). The ruins are offset to the north-east of themapped position. b) Wessex Archaeology Klein 3900, 900kHz side-scan sonar image overlaid on Dunwich 2008 swathbathymetry (light grey). Larger masonry blocks are located at the western end of the debris field as expected for a church witha western tower. Dark lines are the locations of buildings and boundaries recorded on the Agas 1587 map of Dunwich (Gardner,1754). (authors)
D. A. SEAR ET AL.: CARTOGRAPHIC, GEOPHYSICAL AND DIVER SURVEYS OF DUNWICH, UK
© 2010 The Authors. Journal Compilation © 2010 The Nautical Archaeology Society 13
sea-floor is the ruins of ruins. The site lies some 337 mfrom the present (2000) cliff-line, in line with St James’Street at a depth of 8.2 m, and covers an area ofapproximately 934 m2.
Klein 3000 side-scan data is not clear for this site,despite enhancement, thus making it difficult to inter-pret the archaeology. More recent side-scan dataacquired by Wessex Archaeology in June 2009, using aKlein 3900 towfish, has a much-higher resolution andenables the larger elements of the ruin to be mapped(Fig. 7b). The site is characterised as a series of blockswith concentrations of larger blocks at the westernside. The blocks vary in size up to 2.1 m long (based onthe Klein 3900 side-scan survey) and stand between 0.2and 0.8 m proud of the sea-floor (based on swathbathymetry confirmed by diver survey). Average blocksize is 1.1 ¥ 0.87 m, with a tendency to be symmetricalrather than elongated.
Diver surveys confirmed the presence of flint andmortar blocks of similar estimated dimensions to thosemeasured from the side-scan and swath bathymetry.Five sample stones were recovered from this site: allwere large flints, and none showed traces of mortar.The sea-floor around the blocks at the St Peter’s site is
covered in large flints and stones which have fallen outof the walls, presumably as the lime mortar dissolvedover time. Recent underwater filming during a rareperiod of good visibility has revealed evidence ofworked stones at the site, and the complete encrusta-tion of the wall and tower fragments with sponges,highlighting the ecological value of the ruins in anotherwise sand-covered sea-floor.
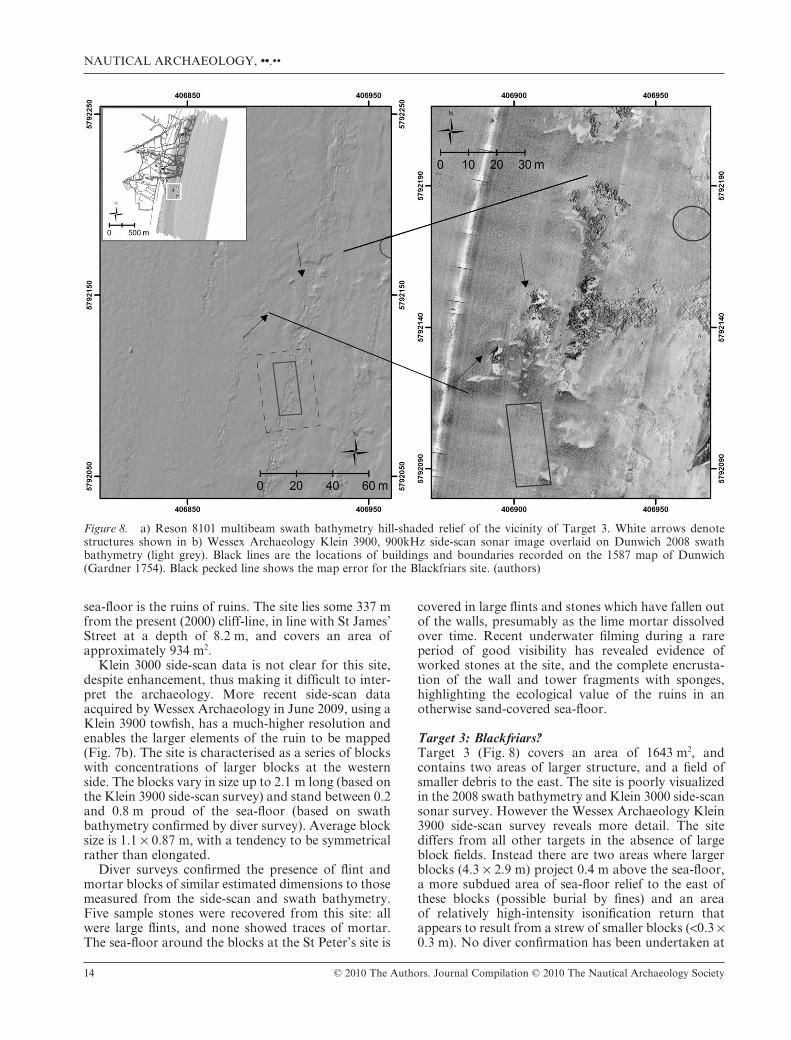
Target 3: Blackfriars?Target 3 (Fig. 8) covers an area of 1643 m2, andcontains two areas of larger structure, and a field ofsmaller debris to the east. The site is poorly visualizedin the 2008 swath bathymetry and Klein 3000 side-scansonar survey. However the Wessex Archaeology Klein3900 side-scan survey reveals more detail. The sitediffers from all other targets in the absence of largeblock fields. Instead there are two areas where largerblocks (4.3 ¥ 2.9 m) project 0.4 m above the sea-floor,a more subdued area of sea-floor relief to the east ofthese blocks (possible burial by fines) and an areaof relatively high-intensity isonification return thatappears to result from a strew of smaller blocks (<0.3 ¥0.3 m). No diver confirmation has been undertaken at
Figure 8. a) Reson 8101 multibeam swath bathymetry hill-shaded relief of the vicinity of Target 3. White arrows denotestructures shown in b) Wessex Archaeology Klein 3900, 900kHz side-scan sonar image overlaid on Dunwich 2008 swathbathymetry (light grey). Black lines are the locations of buildings and boundaries recorded on the 1587 map of Dunwich(Gardner 1754). Black pecked line shows the map error for the Blackfriars site. (authors)
NAUTICAL ARCHAEOLOGY, ••.••
14 © 2010 The Authors. Journal Compilation © 2010 The Nautical Archaeology Society
the time of writing. The location of the site immedi-ately north and east of the mapped position of Black-friars suggests a possible association. The Agas maprecords Blackfriars as an overgrown ruin similar tothat of the current surviving Greyfriars. No tower isshown in the illustration although large masonry struc-ture is present and should have resulted in bockssimilar to those found at the other sites. Further inves-tigation is required in order to confirm a human originto the structures, and to confirm this as the friary.
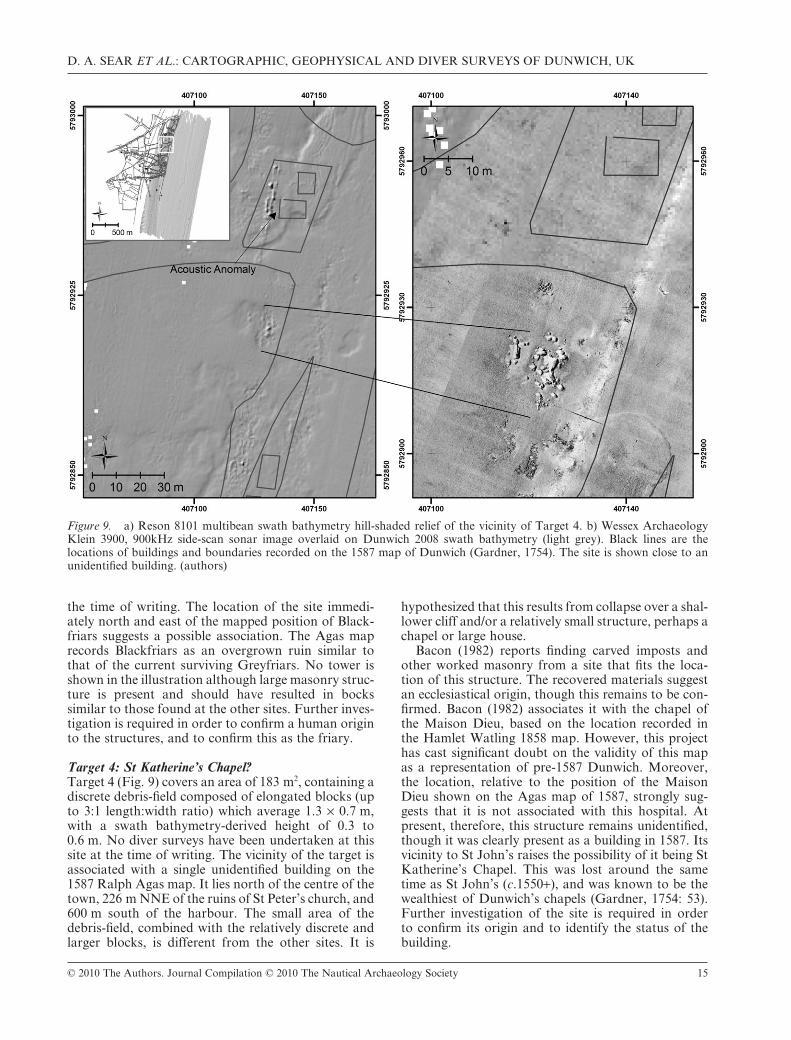
Target 4: St Katherine’s Chapel?Target 4 (Fig. 9) covers an area of 183 m2, containing adiscrete debris-field composed of elongated blocks (upto 3:1 length:width ratio) which average 1.3 ¥ 0.7 m,with a swath bathymetry-derived height of 0.3 to0.6 m. No diver surveys have been undertaken at thissite at the time of writing. The vicinity of the target isassociated with a single unidentified building on the1587 Ralph Agas map. It lies north of the centre of thetown, 226 m NNE of the ruins of St Peter’s church, and600 m south of the harbour. The small area of thedebris-field, combined with the relatively discrete andlarger blocks, is different from the other sites. It is
hypothesized that this results from collapse over a shal-lower cliff and/or a relatively small structure, perhaps achapel or large house.
Bacon (1982) reports finding carved imposts andother worked masonry from a site that fits the loca-tion of this structure. The recovered materials suggestan ecclesiastical origin, though this remains to be con-firmed. Bacon (1982) associates it with the chapel ofthe Maison Dieu, based on the location recorded inthe Hamlet Watling 1858 map. However, this projecthas cast significant doubt on the validity of this mapas a representation of pre-1587 Dunwich. Moreover,the location, relative to the position of the MaisonDieu shown on the Agas map of 1587, strongly sug-gests that it is not associated with this hospital. Atpresent, therefore, this structure remains unidentified,though it was clearly present as a building in 1587. Itsvicinity to St John’s raises the possibility of it being StKatherine’s Chapel. This was lost around the sametime as St John’s (c.1550+), and was known to be thewealthiest of Dunwich’s chapels (Gardner, 1754: 53).Further investigation of the site is required in orderto confirm its origin and to identify the status of thebuilding.
Figure 9. a) Reson 8101 multibean swath bathymetry hill-shaded relief of the vicinity of Target 4. b) Wessex ArchaeologyKlein 3900, 900kHz side-scan sonar image overlaid on Dunwich 2008 swath bathymetry (light grey). Black lines are thelocations of buildings and boundaries recorded on the 1587 map of Dunwich (Gardner, 1754). The site is shown close to anunidentified building. (authors)
D. A. SEAR ET AL.: CARTOGRAPHIC, GEOPHYSICAL AND DIVER SURVEYS OF DUNWICH, UK
© 2010 The Authors. Journal Compilation © 2010 The Nautical Archaeology Society 15
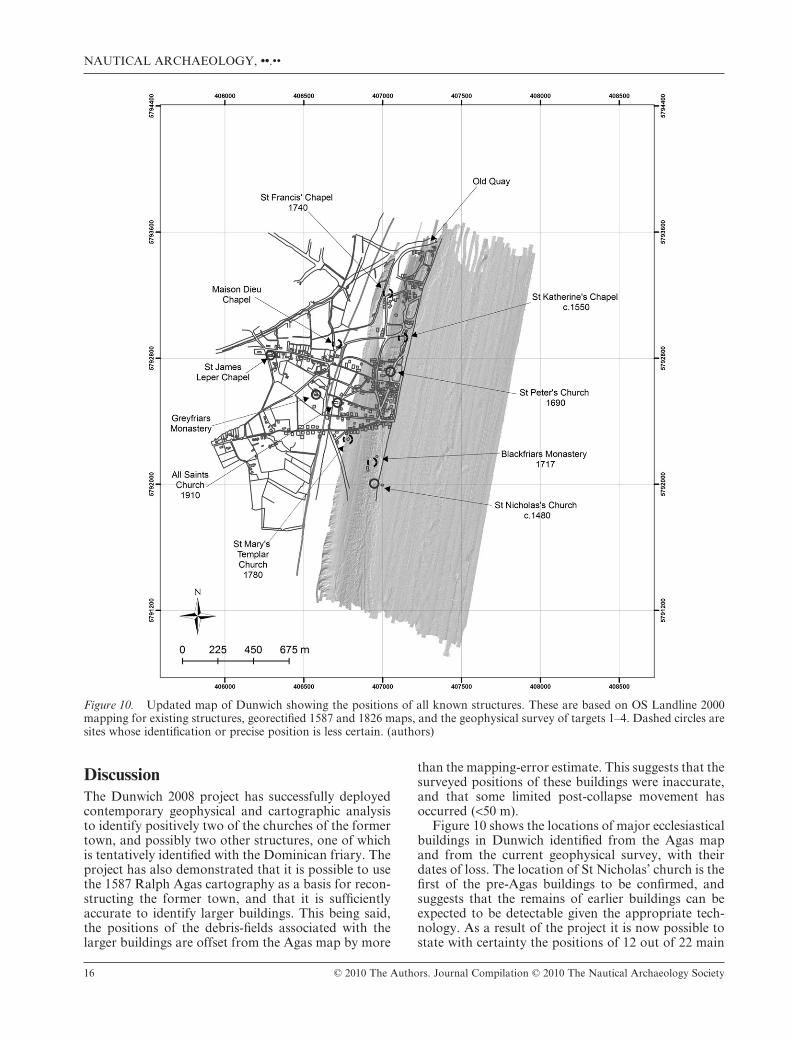
DiscussionThe Dunwich 2008 project has successfully deployedcontemporary geophysical and cartographic analysisto identify positively two of the churches of the formertown, and possibly two other structures, one of whichis tentatively identified with the Dominican friary. Theproject has also demonstrated that it is possible to usethe 1587 Ralph Agas cartography as a basis for recon-structing the former town, and that it is sufficientlyaccurate to identify larger buildings. This being said,the positions of the debris-fields associated with thelarger buildings are offset from the Agas map by more
than the mapping-error estimate. This suggests that thesurveyed positions of these buildings were inaccurate,and that some limited post-collapse movement hasoccurred (<50 m).
Figure 10 shows the locations of major ecclesiasticalbuildings in Dunwich identified from the Agas mapand from the current geophysical survey, with theirdates of loss. The location of St Nicholas’ church is thefirst of the pre-Agas buildings to be confirmed, andsuggests that the remains of earlier buildings can beexpected to be detectable given the appropriate tech-nology. As a result of the project it is now possible tostate with certainty the positions of 12 out of 22 main
Figure 10. Updated map of Dunwich showing the positions of all known structures. These are based on OS Landline 2000mapping for existing structures, georectified 1587 and 1826 maps, and the geophysical survey of targets 1–4. Dashed circles aresites whose identification or precise position is less certain. (authors)
NAUTICAL ARCHAEOLOGY, ••.••
16 © 2010 The Authors. Journal Compilation © 2010 The Nautical Archaeology Society
ecclesiastical buildings (54%). Of these only one pre-dates the Agas map of 1587. The ten buildings lostearlier than 1587 (excepting St Nicholas’) all liebeneath a dynamic and relatively-thin layer of sand(<2 m). The preservation of the church of St Nicholassupports the view that the structural remains of theseearlier buildings will be preserved, and are thereforepotentially detectable. The main targets, in order ofpriority based on highest likelihood of detection,are: St John the Baptist (possibly detected in 2008survey); St Martin’s (lost c.1350); St Leonard’s (lostpre-1350); St Bartholomew’s (lost pre-1350); and StMichael’s (lost pre-1350).
The relocation of St John’s church is a high prioritysince its position relative to St Peter’s church is known.Identification would enable the location and dimen-sions of the central marketplace of Dunwich to bedetermined. This was the commercial centre of themedieval town for which records of market-traders andstall accounts exist (Bailey, 2007). The site currentlylies under 1.7 m of fine sands and silt and will requiresub-bottom profiling geophysical survey. The fourother churches represent the earliest and low-lying partof the town around the area of the main quayside.Detection of these would enable reconstruction of thenorthern and eastern limits of the town and, given theirlow-lying position, they may be in a better state ofpreservation compared to those buildings which havecollapsed down a cliff. This hypothesis is supported bythe relatively discrete and larger blocks found at theunidentified Target 4 site. These buildings lie underrelatively-shallow sediment (0.8–1.5 m) and theirdetection may be possible using shallow sub-bottomprofiling technology coupled to magnetometer survey.The concentration of erratic lithology derived fromboat-ballast associated with stone (church) structuresmay provide detectable magnetic anomalies. Smallerand earlier buildings are less likely to be detected sincethe depth of sediment-burial increases eastwards(rising to 3 m), and the structures themselves may betoo small to locate using current technology.
The results of the Dunwich 2008 project enablecomment to be made on the preservation of ruins ofmedieval structures in moderate-energy coarse clasticcoastal environments. These may be summarized asfollows. Substantial structural elements from medievalstone buildings remain in the vicinity of their originallocation, though with some dispersal due to storm, tideand wave action while in the breaker-zone. The posi-tions are sufficient to enable reconstruction of the rela-tive geography of sites as confirmed by cartographicanalysis. Building materials degrade over time, withblocks of flint masonry falling apart as evidenced bythe strew of flints and loose stones with remnantmasonry around blocks seen in the side-scan data andreported by divers. Despite this, detectable blocks offlint-and-mortar rubble masonry occur even after c.500years submergence (for example St Nicholas’ church).Existence of carved masonry fragments—where pro-
tected by sediment or of hard stone—show high pres-ervation of detail. Others which have been mobile, orsubjected to attrition by sand moving over them, showwear and loss of detail (cf. Dunwich Museum andSuffolk Underwater Studies collections).
Some possible response in the sea-floor to the pres-ence of larger masonry blocks inducing scour aroundthe sites (such as St Nicholas’, Target 4) appearsevident. Interactions between the tidal currents(locally attaining 1 ms-1, Lees, 1983: 8) and the largerblocks will induce turbulence and vortex-sheddingresulting in the potential to create longitudinal scour.This mechanism results in local lowering of archaeo-logical remains into the sea-floor, which in time couldincrease the relative depth of deposition. There islimited evidence to support the hypothesis that cliff-collapsed structures present a more dispersed andfragmented assemblage compared with those whichhave experienced lower or no cliff collapse. The frag-mentation of masonry structures into smaller blocksduring the collapse process renders them more mobileunder storm, wave and tidal action. This may explainthe more-widely-dispersed remains of St Peter’schurch (this survey) and All Saints’ (Bacon, 1982)compared to the larger blocks and discrete ruins asso-ciated with Target 4.
The loss of similar structures over a long period atDunwich provides an opportunity to explore the effectof different periods of exposure to coastal processes onthe preservation of archaeology on the sea-bed. This iscomplicated, however, by the different architecture(cruciform/western tower) of these buildings and themode of entry into the beach/littoral-zone. The dis-persed nature of the sites makes interpretation of thebuildings difficult. This is particularly the case forsmaller worked fragments whose original positionwithin a building is likely to have been changed by theprocess of collapse and the subsequent mobility underwave and tidal action.
The results from this survey have wider implicationsfor the preservation of maritime heritage dating fromthe medieval period along the UK coastline. Dunwichis one (albeit the largest) of the coastal settlementsknown to have been lost to coastal erosion and inun-dation (Fulford et al., 1997). Other settlements on thesouth and east coasts contained churches built ofstone, and, as the results of this survey demonstrate,their ruins will be extant and close to their originalposition. Examples where the remains of other churchbuildings exist include Church Rocks, Shipden-Juxta-Mare (Cromer, Norfolk) located 300 m off shore,and St Helen’s, Old Kilnsea in East Yorkshire. Theruins of the latter are marked on the foreshore in theearliest edition Ordnance Survey maps. In addition tomedieval heritage, earlier stone buildings are alsodocumented, including a Saxon church at Selsey,West Sussex, the Roman shore-fort at Walton, andpotentially another Roman shore-fort off the coast atSkegness.
D. A. SEAR ET AL.: CARTOGRAPHIC, GEOPHYSICAL AND DIVER SURVEYS OF DUNWICH, UK
© 2010 The Authors. Journal Compilation © 2010 The Nautical Archaeology Society 17
Evaluation of the methodologyThe survey methodology used in the Dunwich 2008project has highlighted the limitations of the tech-niques and methods used as an approach to detailedsite investigation. The Reson 8101 MBS and Klein3000 side-scan sonar were unable to visualize thenecessary detail required to conclusively confirm theorigin of the structures or to determine the fullextent of the site. Inability to identify features out ofcontext has been reported by Quinn et al. (2005).Similarly, the diver surveys were severely limitedby the high turbidity at the site. Visibility at theDunwich site was typically less than 0.1 m and fre-quently zero, as is normal for most of the year. Theseconditions effectively limit further mapping andrecording of the sites. In turn this prevents any quan-titative analysis of the sites in terms of: description ofthe remains (for example site mapping); the nature ofstructural preservation; and information on the extentand nature of the dispersal of material by initialcollapse and subsequent wave/tidal action. Thus thecurrently-deployed technology was suitable for ageneral assessment of the whole site, but was unsuit-able, even with diver ground-truthing, at the morelocal target level.
The use of the higher-frequency, higher-resolutionKlein 3900 side-scan sonar, when focused on specifictargets, improved the resolution of imaging to theextent that quantitative analysis of the major structuralelements of each target was possible where they areexposed above the sea-floor. Despite the improvedresolution, it was still not possible to identify indi-vidual structural elements within each site. In thefuture, a higher-resolution geoacoustic technology willbe required. Candidate technology includes higher-frequency Edgetech 4200 dual-frequency side-scansonar, integrated with Reson 7125 high-resolutionmultibeam swath bathymetry. Each target will beinsonified from multiple angles to build up a 3-D DTMover which the higher-frequency side-scan mosaicswill be laid. In addition, the use of latest-generationacoustic-imaging systems such as the SoundmetricsDidson system (Belcher et al., 2002) will permit ultra-high-resolution (cm-scale) investigation of the sites. Analternative approach could include the use of environ-mental sensing to alert local divers to periods ofhigh visibility (Glasgow et al., 2004). Buoy-mountedturbidity-probes coupled to telemetry might usefully bedeployed to send mobile-phone alarm-texts to localdivers. This has the advantage of maximizing theopportunity to undertake visual identification andmapping of the ruins, but would require rapid mobili-zation capability.
The Dunwich site bathymetry creates limitationsfor geophysical survey methodology. Shallow areas,particularly in the vicinity of the inner sandbank, pre-clude the use of larger boat-mounted equipment. Thislimits the investigation of the Temple and All Saints’
sites. Shallow-draught boats might be used at highspring tides, or alternatively a diver-towed system (seePlets et al., 2009). Grøn et al. (2007) report applica-tion of a Chirp system in 0.5 m depths. However, theapplication of Chirp sub-bottom profiling at theDunwich site is limited by the presence of coarsersediments.
The main challenge posed by the site remains theburial of structures under shallow sand-drapes andthe inner sandbank. The boomer transects used inthis survey were unable to resolve details within theshallow sand-drapes due to the strong return of theunderlying bedrock. An alternative technology suchas parametric sonar, which returns data on signal-strength and intensity, should be tested over the sitein order to determine the most effective frequency topenetrate sand while returning identifiable reflectionsfrom buried structures often resting on sea-bed mate-rial of similar acoustic signature. Integration of arange of novel geophysical technologies will thereforebe necessary to further the archaeological investiga-tions at Dunwich.
ConclusionsThe Dunwich 2008 project has achieved the mainaim of undertaking a town-scale survey of thesite. Integrating geophysical, diver and cartographicmethodologies within a GIS has enabled positive iden-tification of two of the lost churches, and identifica-tion of two other potential archaeological sites. Thesurvey has also created the first detailed bathymetricsurvey of the site, enhancing our understanding of itsenvironment.
The archaeological discoveries have confirmed theexistence of substantive ruins associated with medievalchurch structures even after 500 years of submergence.The nature of the sites varies from localized strews ofmasonry to discrete elements of structure. Thesesuggest different preservation potentials within the lit-toral zone, which are considered to reflect the mode ofentry into the beach environment. Dispersal occurswhen structures collapse progressively over largercliffs. Discrete structural remains occur in the presenceof shallow or no cliffs. The preservation potential ofearlier stone structures located to the north of the townis therefore considered to be high.
The heritage value of the Dunwich site is significant,representing a mid-to-late medieval port of nationaland international importance. The ruins on the sea-floor have both worked and carved stone, and containartefacts which are recoverable. However, the interpre-tation of the remains is difficult because of the loss ofcontext arising from the collapse and mobilization ofthe materials. Detailed mapping and careful excava-tion is required to determine what information can bederived from these types of site in terms of the ability toidentify their age, use, architectural design and specificdedication.
NAUTICAL ARCHAEOLOGY, ••.••
18 © 2010 The Authors. Journal Compilation © 2010 The Nautical Archaeology Society
AcknowledgementsThe authors gratefully acknowledge the support of the Esmée Fairbairn Foundation (Grant 2411) and English HeritageMaritime Division (Grants 5546 and 5825) in particular Peter Murphy and Ian Oxley. We would also like to thank GeorgeSpence, Andy Spence, Kevin Spence, Duncan Coles, and Andy Rose of Historic Wreck Recovery; Dr Justin Dix, School ofOcean & Earth Sciences, University of Southampton, for advice on sub-bottom profiling; Chris Hill from Geodata; PamBaldaro and Alex Kent for cartographic work, Adam Cross, Ed Hendon and Richard Cooke of EMU Ltd for hydrographic andgeophysical survey; and all those from Dunwich Museum for enthusiastic support and space. For more detail about the projectsee www.Dunwich.org.uk.
ReferencesAllen, J. R. L., 1997, A conceptual model for the archaeology of the English coastal zone, in M. Fulford, T. Champion and
A. Long (eds), England’s Coastal Heritage. English Heritage Archaeological Report 15, London.Bacon, J. and Bacon S. R., 1979, The search for Dunwich City under the Sea. Colchester.Bacon, S. R., 1974, Underwater Exploration at Dunwich, Suffolk, IJNA 3.2, 314–18.Bacon, S. R., 1982, Underwater Exploration at Dunwich, Suffolk, Second Report, IJNA 11.2, 155–62.Bailey, M., 1991, Per impetum maris: natural disaster and economic decline in eastern England, 1275–1350, in M. S. Campbell
(ed.), Before the Black Death: studies in the ‘crisis’ of the early fourteenth century, 184–209. Manchester.Bailey, M., 1992, The Bailiffs’ Minute book of Dunwich: 1404–1430. Woodbridge, Suffolk.Bailey, M., 2007, Medieval Suffolk: an economic and social history, 1200–1500. Woodbridge, Suffolk.Barrett, J. H., Locker, A. M., and Roberts, C. M., 2004, The origins of intensive marine fishing in medieval Europe: the English
evidence, Proceedings of the Royal Society of London B271, 2417–21.Belcher, E. O., Fox, W. L., and Hanot, W. H., 2002, Dual frequency acoustic camera: a candidate for an obstacle avoidance,
gap-filler and identification sensor for un-tethered underwater vehicles, in Proceedings of the MTS/IEEE Oceans 2002International Conference, Biloxi, MS, October 29–31, 2124–8.
Chant, K., 1986, The history of Dunwich, 2nd edn, Dunwich Museum.Comfort, N., 1994, The Lost City of Dunwich. Lavenham, Suffolk.Darby, H. C., 1971, The Domesday geography of eastern England. Cambridge.Fulford, M., Champion, T., and Long, A. J. (eds), 1997, England’s Coastal Heritage. English Heritage Archaeological Report
15, London.Gaffney V., Thomson, K., and Fitch, S. (eds), 2007, Mapping Doggerland: The Mesolithic Landscapes of the Southern North Sea.
Oxford.Galloway, J. A. and Potts, J. S., 2007, Marine flooding in the Thames Estuary and tidal river c.1250–1450: impact and response,
Area 39.3, 370–79.Gardner, T., 1754, An historical account of Dunwich, { Blithburgh, { Southwold, { with remarks on some places contiguous thereto.
London.Glasgow, H., Burkholder, J., Reed, R., Lewitus, A., and Kleinman, J., 2004, Real-time remote monitoring of water quality: a
review of current applications, and advancements in sensor, telemetry, and computing technologies, Journal of ExperimentalMarine Biology and Ecology, 409–48.
Grøn, O., Jørgensen, A., and Hoffmann, G., 2007, Marine archaeological survey by high resolution sub-bottom profilers, NorskSjøfartsmuseums Årbok 2007, 115–44.
Hamilton, D., 1991, A decade of excavations at Port Royal, Jamaica: underwater archaeology, in J. Broadwater, (ed.),Proceedings of the Conference of the Society for Historical Archaeology, 90–94.
Haskoning, 2009, Suffolk SMP2 Sub-cell 3c: Policy Development Zone 3—Easton Broad to Dunwich Cliffs, unpublished reportno. 9S4195/RPDZ3/301164/PBor, Haskoning, Peterborough.
Haslam, J., 1992, Dommoc and Dunwich: a reappraisal, Anglo-Saxon Studies in Archaeology and History 5, 41–6.Hughes, M. L., McDowell, P. F., and Marcus, W. A., 2006, Accuracy assessment of georectified aerial photographs: Implica-
tions for measuring lateral channel movement in a GIS, Geomorphology 74, 1–16.Lafferty, B., Quinn, R., and Breen, C., 2006, A side-scan sonar and high-resolution Chirp sub-bottom profile study of the
natural and anthropogenic sedimentary record of Lower Lough Erne, northwestern Ireland, Journal of ArchaeologicalScience 33, 756–66.
Lambeck, K., 1995, Late Devonian and Holocene shorelines of the British Isles and North Sea from models of glacio-hydro-isostatic rebound, Journal of the Geological Society, London 152, 437–48.
Lees, B. J., 1979, Sizewell, Dunwich banks field studies, Institute of Oceanographic Sciences Report No. 72.Lees, B. J., 1980, Sizewell, Dunwich banks field studies, Institute of Oceanographic Sciences, Report No. 88.Lees, B. J., 1983, The relationship of sediment transfer rates and paths to sandbanks in a tidally dominated area off the coast
of East Anglia, UK, Sedimentology 30, 461–83.Longley, P., Goodchild, M., Maguire, D., and Rhind, D., 2001, Geographic information Systems and Science. 2nd edn,
Chichester.Mann, M., 1986, The sources of social power: Volume I: A history of power from the beginning to AD 1760. Cambridge.Officer, L. H., 2009, Purchasing Power of the British Pound 1264 to present, www.measuringworth.com/ppoweruk/, accessed
28/08/09.
D. A. SEAR ET AL.: CARTOGRAPHIC, GEOPHYSICAL AND DIVER SURVEYS OF DUNWICH, UK
© 2010 The Authors. Journal Compilation © 2010 The Nautical Archaeology Society 19
Ordnance Survey, 2005, Technical Information: Positional accuracy improvement programme, http://www.ordnancesurvey.co.uk/oswebsite/pai/backgroundinformation.html, accessed 12/06/09.
Plets, R., Dix, J., Adams, J., Bull, J., Henstock, T., Gutowski, M., and Best, A., 2009, The use of a high-resolution 3D Chirpsub-bottom profiler for the reconstruction of the shallow water archaeological site of the Grace Dieu (1439), River Hamble,UK, Journal of Archaeological Science 36.2, 408–18.
Pye, K. and Blott, S. J., 2006, Coastal processes and morphological change in the Dunwich-Sizewell area, Suffolk, UK, Journalof Coastal Research 22.3, 453–73.
Pye, K., and Blott, S. J., 2009, Progressive Breakdown of a Gravel-Dominated Coastal Barrier, Dunwich–Walberswick,Suffolk, UK, Processes and Implications, Journal of Coastal Research 25.3, 589–602.
Quinn, R., Dean, M., Lawrence, M., Liscoe, S., and Boland, D., 2005, Backscatter responses and resolution considerations inarchaeological side-scan sonar surveys: a control experiment, Journal of Archaeological Science 32, 1252–64.
Rose, J., 2008, Palaeogeography of eastern England during the Early and Middle Pleistocene, in I. Candy, J. Lee and A.Harrison (eds), The Quaternary of Northern East Anglia, 5–42. London.
Sear, D., Bacon, S., Murdock, A., Doneghan, G., and LeBas, T., 2009, Dunwich 2008. Final report to Esmée FairbairnFoundation, English Heritage and Dunwich Museum, GeoData Report No. UC1064, available online at www.Dunwi-ch.org.uk.
Shennan, I., 1989, Holocene crustal movements and sea-level change in Great Britain, Journal of Quaternary Science 4, 77–88.Theiler, E. R. and Danforth, W. W., 1994, Historical shoreline mapping (I): improving techniques and reducing position errors,
Journal of Coastal Research 10.3, 549–63.Zalasiewicz, J. A. and Gibbard, P. L., 1988, The Pliocene to Early Middle Pleistocene of East Anglia: an overview, in P. Gibbard
and J. Zalasiewicz (eds), Pliocene–Middle Pleistocene of East Anglia. Quaternary Research Association Field Guide, 1–32.Cambridge.
NAUTICAL ARCHAEOLOGY, ••.••
20 © 2010 The Authors. Journal Compilation © 2010 The Nautical Archaeology Society