Embed Size (px)
Citation preview
CAS Ratemaking Seminar
Price Governance I: Price Monitoring for Standard and Middle Market Commercial Lines March 8, 9 2007
Chris NyceSenior Manager
KPMG LLP
Brian HughesSenior Vice PresidentArch Insurance Group
2
Disclaimer
•The views expressed in this presentation are those of the speakers; and
•They are not necessarily the views of the CAS, KPMG, Arch Insurance or any other sponsor of this seminar;
•Anyone who says otherwise is not only wrong, but is itching for a fight.
3
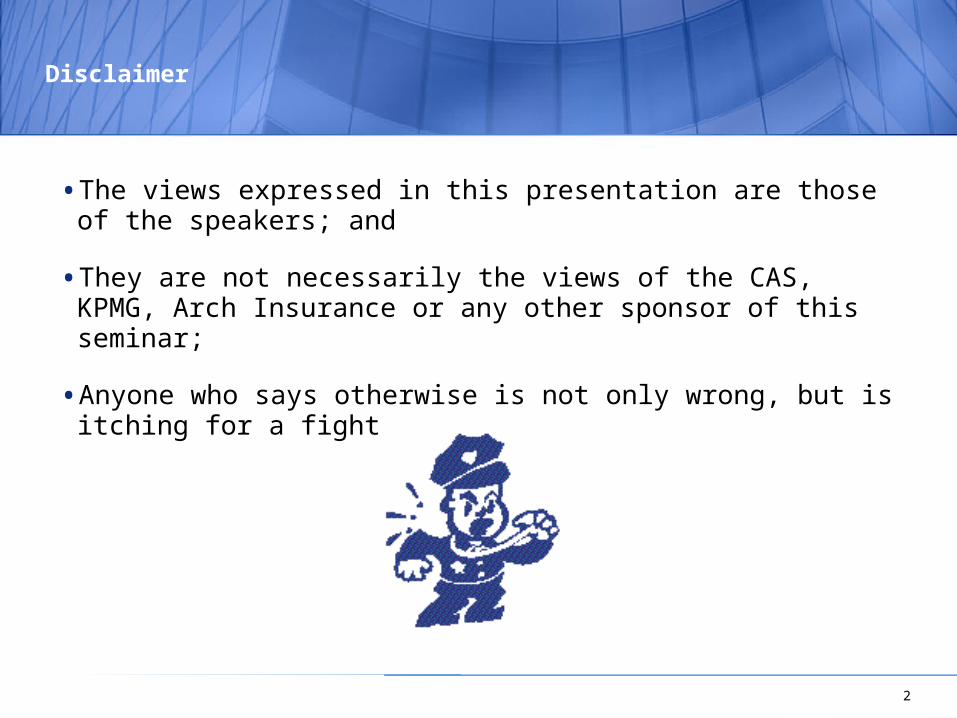
Contents for the Presentation
Introductions
Why is price monitoring critical (and failures of the past)
Chris Nyce
Interactions between manual rates and prices charged
Automating approaches:
Standard commercial renewal price monitoring
Price monitoring framework Brian HughesIndustry sources of price information
Large commercial lines - Methods 1-5
Challenges and practical issues
Handling less straightforward lines of business Chris Nyce
Implementation model
4
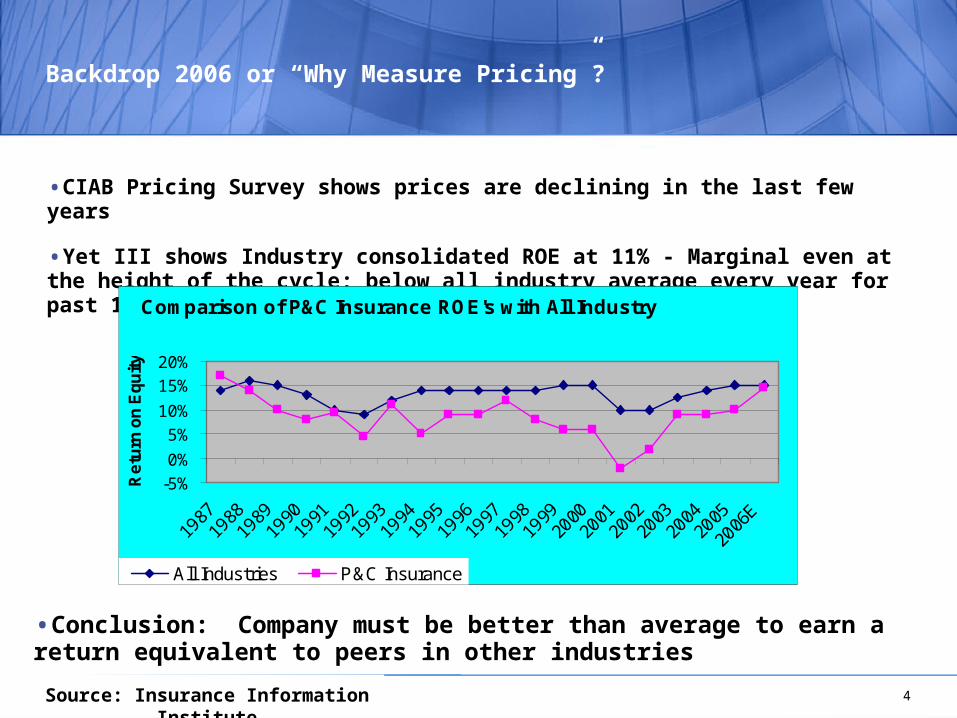
Backdrop 2006 or “Why Measure Pricing”?
•CIAB Pricing Survey shows prices are declining in the last few years
•Yet III shows Industry consolidated ROE at 11% - Marginal even at the height of the cycle; below all industry average every year for past 18 years
•Conclusion: Company must be better than average to earn a return equivalent to peers in other industries
Comparison of P&C Insurance ROE's with All Industry
-5%
0%
5%
10%
15%
20%
1987
1988
1989
1990
1991
1992
1993
1994
1995
1996
1997
1998
1999
2000
2001
2002
2003
2004
2005
2006
E
Re
turn
on
Eq
uit
y
All Industries P&C Insurance
Source: Insurance Information Institute
5
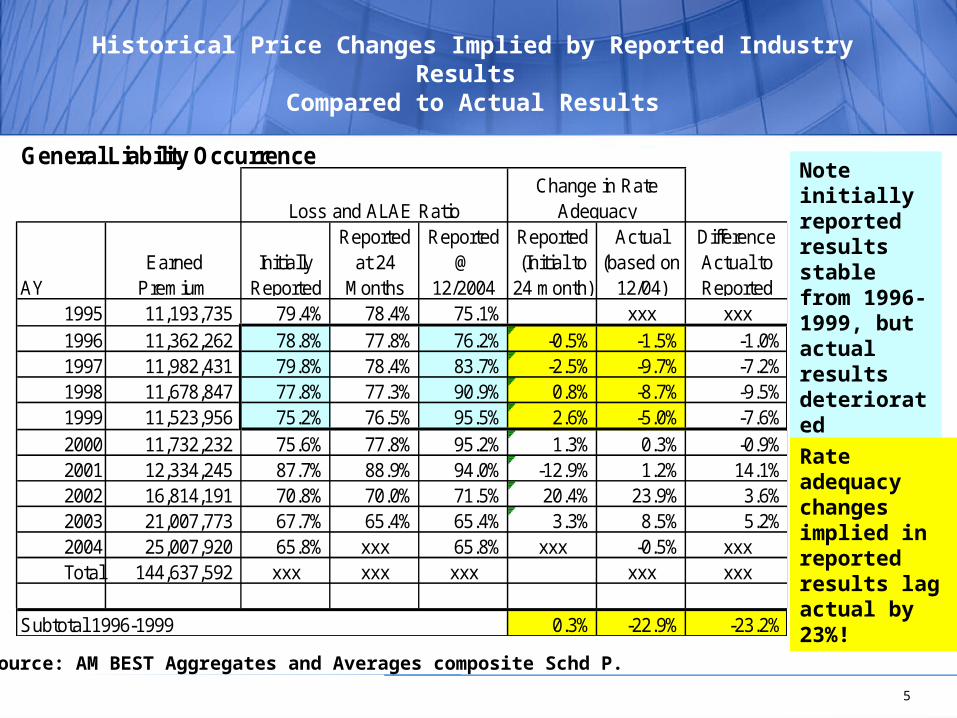
Historical Price Changes Implied by Reported Industry Results Compared to Actual Results
General Liability Occurrence
AYEarned
PremiumInitially
Reported
Reported at 24
Months
Reported @
12/2004
Reported (Initial to
24 month)
Actual (based on
12/04)
Difference Actual to Reported
1995 11,193,735 79.4% 78.4% 75.1% xxx xxx1996 11,362,262 78.8% 77.8% 76.2% -0.5% -1.5% -1.0%1997 11,982,431 79.8% 78.4% 83.7% -2.5% -9.7% -7.2%1998 11,678,847 77.8% 77.3% 90.9% 0.8% -8.7% -9.5%1999 11,523,956 75.2% 76.5% 95.5% 2.6% -5.0% -7.6%2000 11,732,232 75.6% 77.8% 95.2% 1.3% 0.3% -0.9%2001 12,334,245 87.7% 88.9% 94.0% -12.9% 1.2% 14.1%2002 16,814,191 70.8% 70.0% 71.5% 20.4% 23.9% 3.6%2003 21,007,773 67.7% 65.4% 65.4% 3.3% 8.5% 5.2%2004 25,007,920 65.8% xxx 65.8% xxx -0.5% xxxTotal 144,637,592 xxx xxx xxx xxx xxx
0.3% -22.9% -23.2%
Loss and ALAE RatioChange in Rate
Adequacy
Subtotal 1996-1999
Note initially reported results stable from 1996-1999, but actual results deteriorated markedlyRate adequacy changes implied in reported results lag actual by 23%!
Source: AM BEST Aggregates and Averages composite Schd P.
6
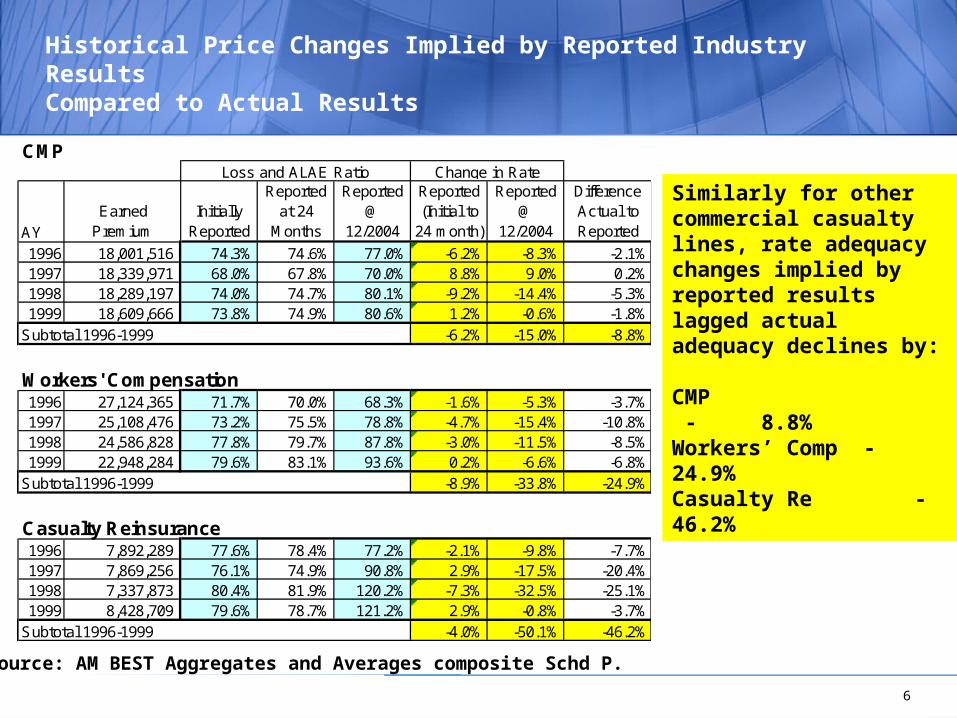
Historical Price Changes Implied by Reported Industry Results Compared to Actual Results
CMP
AYEarned
PremiumInitially
Reported
Reported at 24
Months
Reported @
12/2004
Reported (Initial to
24 month)
Reported @
12/2004
Difference Actual to Reported
1996 18,001,516 74.3% 74.6% 77.0% -6.2% -8.3% -2.1%1997 18,339,971 68.0% 67.8% 70.0% 8.8% 9.0% 0.2%1998 18,289,197 74.0% 74.7% 80.1% -9.2% -14.4% -5.3%1999 18,609,666 73.8% 74.9% 80.6% 1.2% -0.6% -1.8%
-6.2% -15.0% -8.8%
Workers' Compensation1996 27,124,365 71.7% 70.0% 68.3% -1.6% -5.3% -3.7%1997 25,108,476 73.2% 75.5% 78.8% -4.7% -15.4% -10.8%1998 24,586,828 77.8% 79.7% 87.8% -3.0% -11.5% -8.5%1999 22,948,284 79.6% 83.1% 93.6% 0.2% -6.6% -6.8%
-8.9% -33.8% -24.9%
Casualty Reinsurance1996 7,892,289 77.6% 78.4% 77.2% -2.1% -9.8% -7.7%1997 7,869,256 76.1% 74.9% 90.8% 2.9% -17.5% -20.4%1998 7,337,873 80.4% 81.9% 120.2% -7.3% -32.5% -25.1%1999 8,428,709 79.6% 78.7% 121.2% 2.9% -0.8% -3.7%
-4.0% -50.1% -46.2%
Loss and ALAE Ratio Change in Rate
Subtotal 1996-1999
Subtotal 1996-1999
Subtotal 1996-1999
Similarly for other commercial casualty lines, rate adequacy changes implied by reported results lagged actual adequacy declines by:
CMP - 8.8%Workers’ Comp - 24.9%Casualty Re - 46.2%
Source: AM BEST Aggregates and Averages composite Schd P.

7
Climbing the Continuum: Various Stages of Rate Adequacy Capabilities
Basic Monitoring of Renewal Price Changes
Capturing Other Changes in Terms and Conditions
Capturing Changes in Limits, Deductibles, Term
Establishing a Standard Benchmark to Measure New Business
Reconciling Price Monitoring Data to Financial Systems
Automating Data Feeds from Policy Systems
Capturing Changes in Classifications
Measuring and Acting in Real Time
Climbing the Price Monitoring Pyramid!
8
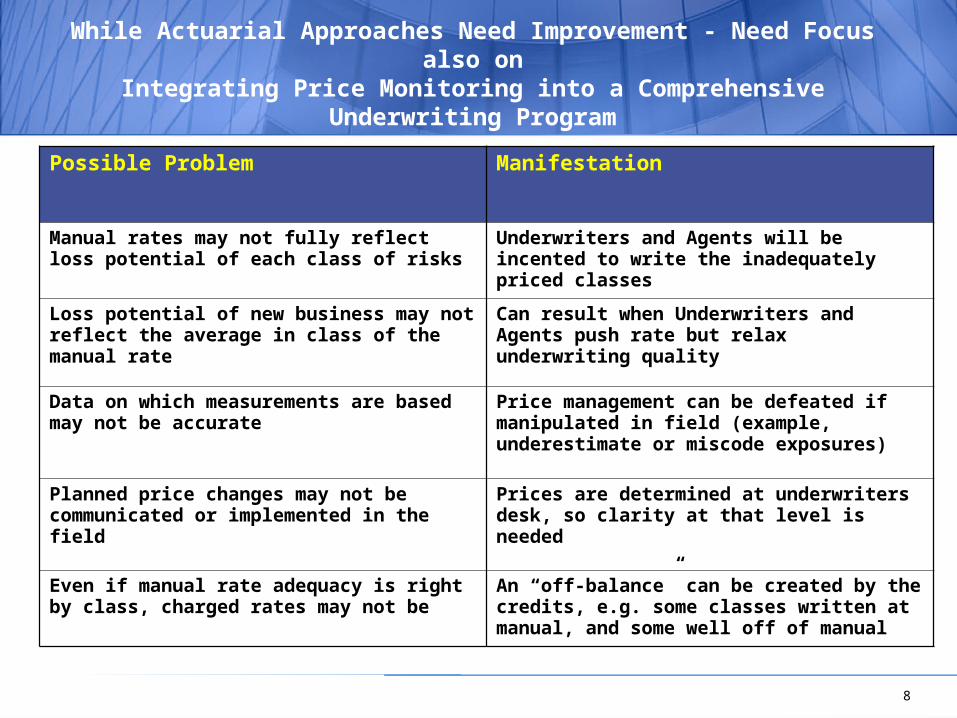
While Actuarial Approaches Need Improvement - Need Focus also on
Integrating Price Monitoring into a Comprehensive Underwriting Program
Possible Problem Manifestation
Manual rates may not fully reflect loss potential of each class of risks
Underwriters and Agents will be incented to write the inadequately priced classes
Loss potential of new business may not reflect the average in class of the manual rate
Can result when Underwriters and Agents push rate but relax underwriting quality
Data on which measurements are based may not be accurate
Price management can be defeated if manipulated in field (example, underestimate or miscode exposures)
Planned price changes may not be communicated or implemented in the field
Prices are determined at underwriters desk, so clarity at that level is needed
Even if manual rate adequacy is right by class, charged rates may not be
An “off-balance” can be created by the credits, e.g. some classes written at manual, and some well off of manual
9
Quality of Risk Within Class
•Standard underwriting execution is key
– Reasonable authorities and delegations
– Data and risk validation
– Field audit schedules
– Self audit and management reviews
– Strong field and home office referral processes
•Underwriting Audits should include data quality
– Exposure information, coverage additions if not considered in the price monitor
•Rating plan refinements may be needed
– Any recognition of variation of loss cost within a rating segment is candidate for new rating variable
– If no manual rating differential, needs to be segmented and tracked
10
Discussion of a General Approach for Standard Commercial Lines
Today we will discuss general renewal monitoring
New business (to benchmark) can be generalized in an analogous manner
Note also that Actuaries are critical to the business management process:
11
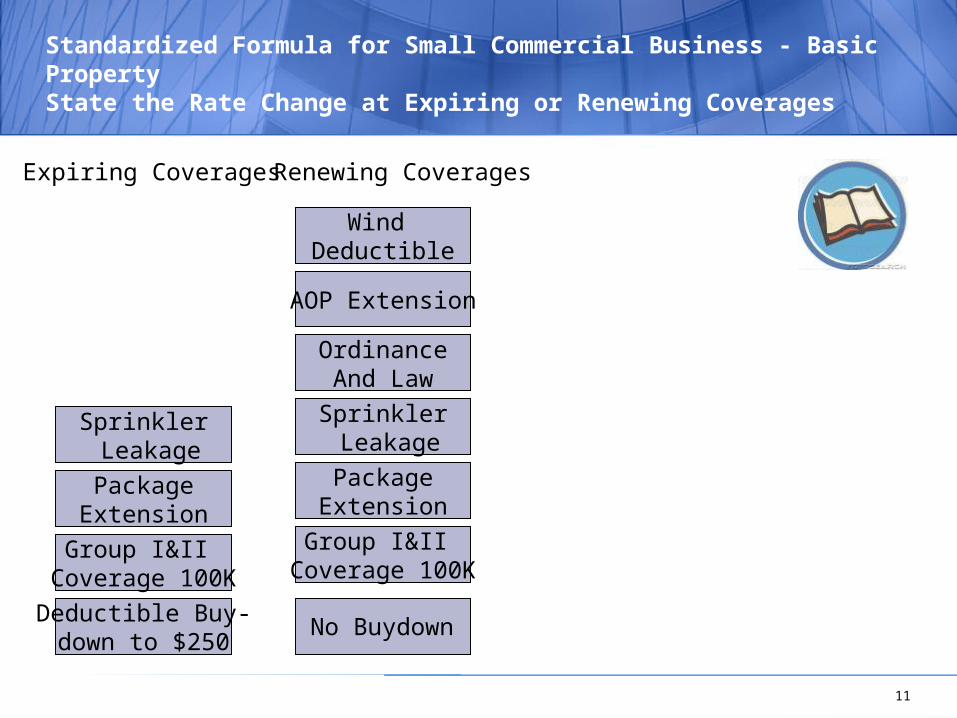
Standardized Formula for Small Commercial Business - Basic PropertyState the Rate Change at Expiring or Renewing Coverages
Expiring Coverages Renewing Coverages
AOP Extension
OrdinanceAnd Law
Sprinkler Leakage
PackageExtension
Group I&II Coverage 100K
Wind Deductible
Deductible Buy-down to $250
Sprinkler Leakage
PackageExtension
Group I&II Coverage 100K
No Buydown
12
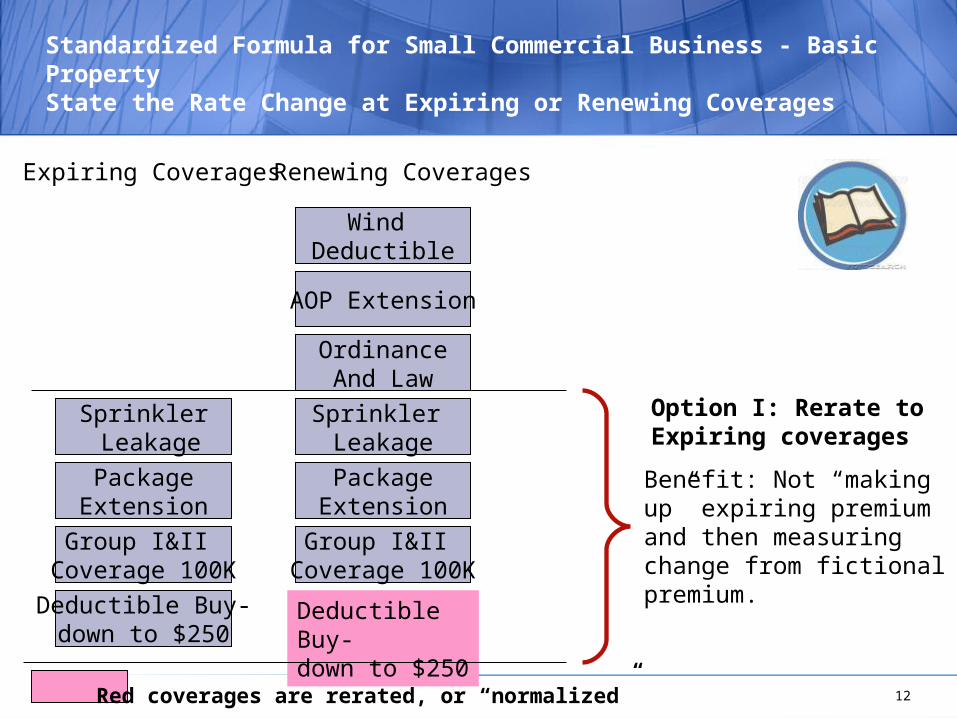
Standardized Formula for Small Commercial Business - Basic PropertyState the Rate Change at Expiring or Renewing Coverages
Expiring Coverages Renewing Coverages
AOP Extension
OrdinanceAnd Law
Sprinkler Leakage
PackageExtension
Group I&II Coverage 100K
Wind Deductible
Deductible Buy-down to $250
Sprinkler Leakage
PackageExtension
Group I&II Coverage 100K
Deductible Buy-down to $250
Option I: Rerate to Expiring coverages
Benefit: Not “makingup” expiring premiumand then measuringchange from fictionalpremium.
Red coverages are rerated, or “normalized”
13
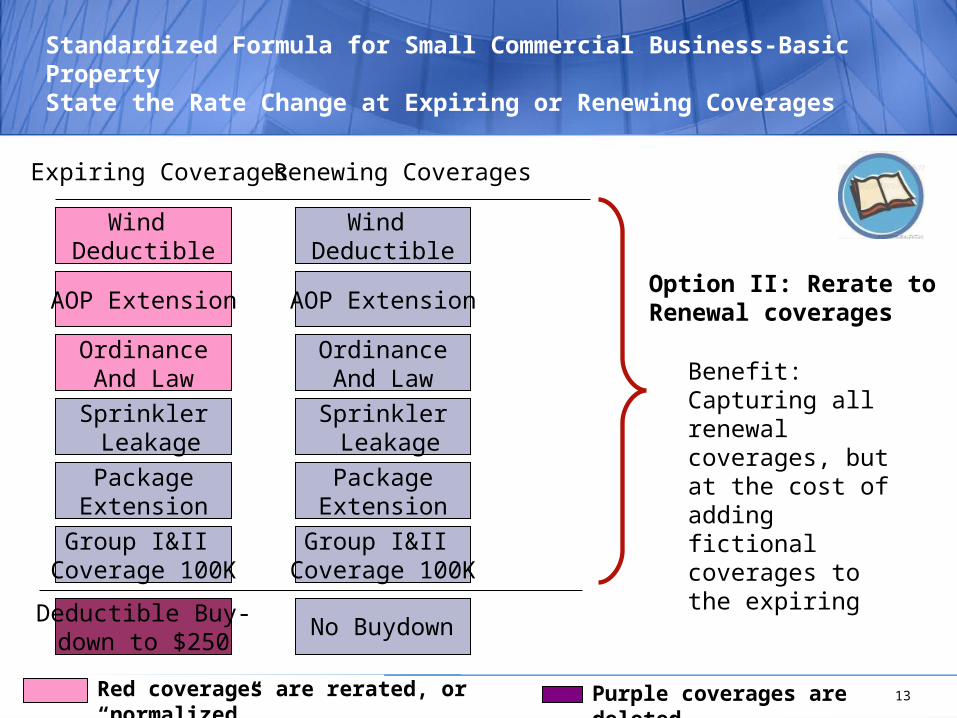
Standardized Formula for Small Commercial Business-Basic PropertyState the Rate Change at Expiring or Renewing Coverages
Expiring CoveragesRenewing Coverages
AOP Extension
OrdinanceAnd Law
Sprinkler Leakage
PackageExtension
Group I&II Coverage 100K
Wind Deductible
Deductible Buy-down to $250
Sprinkler Leakage
PackageExtension
Group I&II Coverage 100K
No Buydown
Option II: Rerate to Renewal coverages
Benefit: Capturing all renewal coverages, but at the cost of adding fictional coverages to the expiring
Red coverages are rerated, or “normalized”
Wind Deductible
AOP Extension
OrdinanceAnd Law
Purple coverages are deleted

14
Balancing Capture of Complete Information with Accuracy of MeasurementLine of Business and Coverage - Basic Property Example
Perform calculations at the coverage level so you can include or exclude coverages depending on renewal status:
“Property Coverage”
Instead of one coverage :
Consider whether to treat each coverage at each locationas separate calculation, or alternatively “normalize”
“Basic Group I-Building”“Basic Group II-Building”“AOP-Building”
“Earth Movement”
“Money and Securities
“Packaged Extension”“Brands and Labels”
“Accounts Receivable”
“Off Premises Power”
“Basic Group I-Contents”“Basic Group II-Contents”“AOP-Contents”
“Ordinance and Law”
“Debris Removal” And so forth…….
“Fire Dept Charges”
“Sprinkler Leakage”
“Off Premises Contents”
“Adjacent Structures”
15
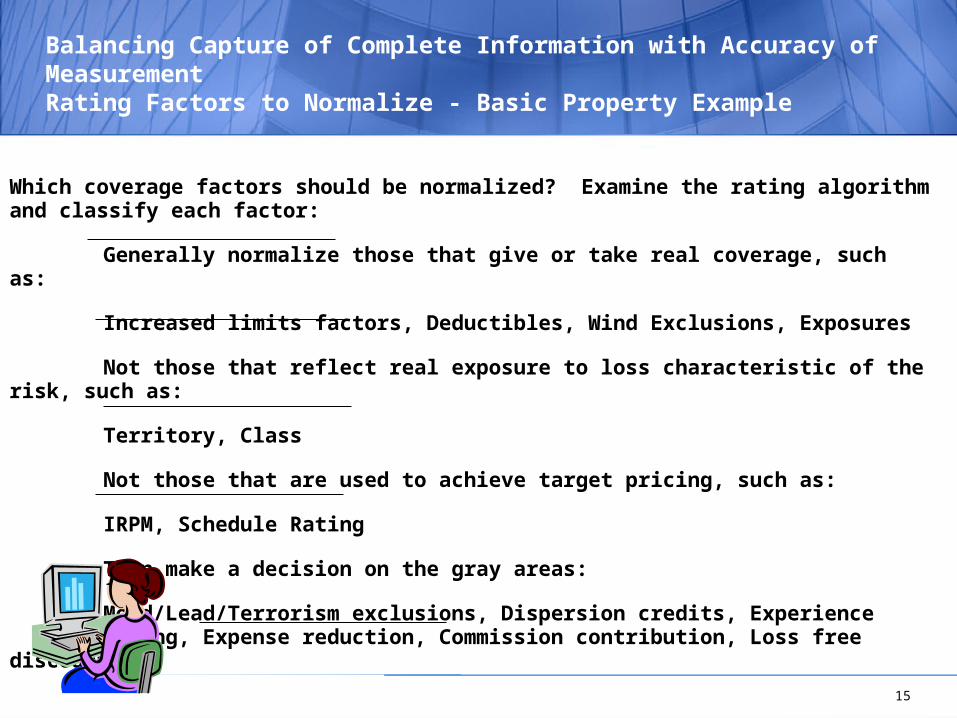
Balancing Capture of Complete Information with Accuracy of MeasurementRating Factors to Normalize - Basic Property Example
Which coverage factors should be normalized? Examine the rating algorithm and classify each factor:
Generally normalize those that give or take real coverage, such as:
Increased limits factors, Deductibles, Wind Exclusions, Exposures
Not those that reflect real exposure to loss characteristic of the risk, such as:
Territory, Class
Not those that are used to achieve target pricing, such as:
IRPM, Schedule Rating
Then make a decision on the gray areas:
Mold/Lead/Terrorism exclusions, Dispersion credits, Experience rating, Expense reduction, Commission contribution, Loss free discount

16
Calculating a Normalized Renewal Rate Change - Basic Formula
Assume the “expiring coverage” approach (and decide to normalize based on expiring or current rates)
Define a “normalizing factor” for each coverage
Expiring factor/Renewal factor (example: Expiring ILF/Renewal ILF)
A robust and automated approach to renewal price change is then:
Normalized Renewal Rate/Expiring Rate =
(Normalized Renewal Premium/Renewal Exposure) (Expiring Premium/Expiring Exposure)
Normalized Renewal Premium=Charged Renewal Premium × Normalizing Factor
Where:

17
Price Monitoring and the Quote/Issuance Renewal Cycle
Step in the process Practical Opportunity to ActOn Price Monitoring
Business is quoted by
underwriter (not issued)
Monthly quotesare issued to
agents/insureds
Quarterly reviews of business performed
Can influence underwriters to change quotes before
issuance
Prices Measured When?
Can react to influence next months quotes
Can react a quarter in arrears to influence prices
or just use to set ELR’s
BatchOption
Real TimeOption
18© 2004 KPMG LLP, the U.S. member firm of KPMG International, a Swiss cooperative. All rights reserved. Printed in the U.S.A. 27365atl. KPMG and the KPMG logo are registered trademarks of KPMG International, a Swiss cooperative.
Break for Brian’s PresentationIntroducing Brian Hughes,
19
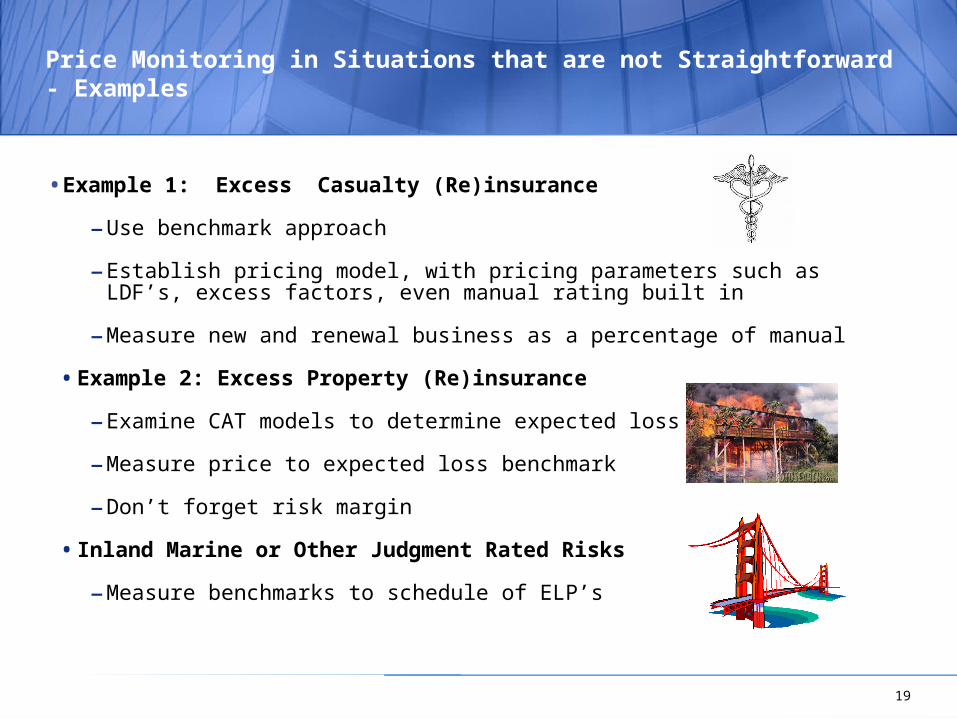
Price Monitoring in Situations that are not Straightforward - Examples
•Example 1: Excess Casualty (Re)insurance
– Use benchmark approach
– Establish pricing model, with pricing parameters such as LDF’s, excess factors, even manual rating built in
– Measure new and renewal business as a percentage of manual
•Example 2: Excess Property (Re)insurance
– Examine CAT models to determine expected loss
– Measure price to expected loss benchmark
– Don’t forget risk margin
• Inland Marine or Other Judgment Rated Risks
– Measure benchmarks to schedule of ELP’s

20
Driving Price by Segment-Mainstreet Commercial Example
1. Analyze book
of business by
overall rate
need and
by meaningful
segment
3. Get agreement on the price need by larger segments
2. Divide the book into a manageable
number of segments (stratify
into A,B,C, for example)
4. Set up segmentation
model to drive price achievement by segment, and
communicate to all underwriters
5. Monitor, Measure, Report Deviations
Drive Underwriting Quality Throughout the Process
21
Segmentation Approaches – Understand the Business
•Understand internal experience
•Understand market experience
– Suggest at collected level, not manual
– If performing Premium on Level, must account for discretionary price changes
•Understand market rate adequacy
– Again at collected premiums, not manual
– Rating Bureaus can be a decent source for this information
22
How are the Segments Defined?
•Meaningful segments that company/underwriters manage
•Common Examples
–NAICS code
–Class code
–Program
–Geographical region
–Size of risk
–Combination of the above
23
Business Drivers – Set Specific Targets
Price change on renewals
Price on new business to benchmarks
Renewal retention desired
Underwriting approach
24
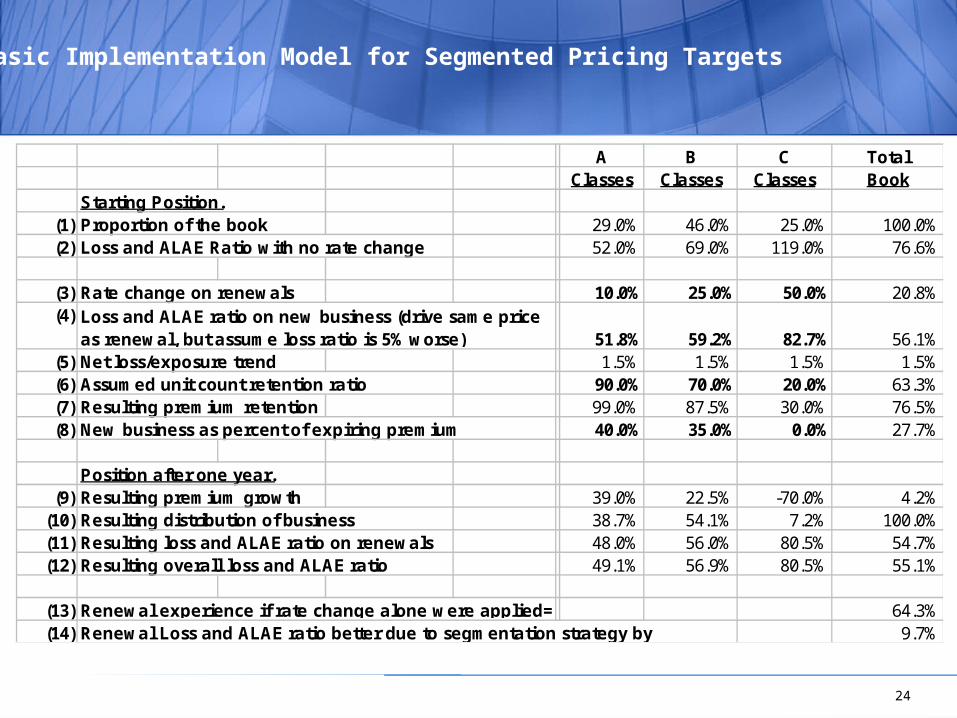
A B C TotalClasses Classes Classes Book
Starting Position.(1) Proportion of the book 29.0% 46.0% 25.0% 100.0%(2) Loss and ALAE Ratio with no rate change 52.0% 69.0% 119.0% 76.6%
(3) Rate change on renewals 10.0% 25.0% 50.0% 20.8%(4)
51.8% 59.2% 82.7% 56.1%(5) Net loss/exposure trend 1.5% 1.5% 1.5% 1.5%(6) Assumed unit count retention ratio 90.0% 70.0% 20.0% 63.3%(7) Resulting premium retention 99.0% 87.5% 30.0% 76.5%(8) New business as percent of expiring premium 40.0% 35.0% 0.0% 27.7%
Position after one year.(9) Resulting premium growth 39.0% 22.5% -70.0% 4.2%
(10) Resulting distribution of business 38.7% 54.1% 7.2% 100.0%(11) Resulting loss and ALAE ratio on renewals 48.0% 56.0% 80.5% 54.7%(12) Resulting overall loss and ALAE ratio 49.1% 56.9% 80.5% 55.1%
(13) Renewal experience if rate change alone were applied= 64.3%(14) Renewal Loss and ALAE ratio better due to segmentation strategy by 9.7%
Loss and ALAE ratio on new business (drive same price as renewal, but assume loss ratio is 5% worse)
Basic Implementation Model for Segmented Pricing Targets
25
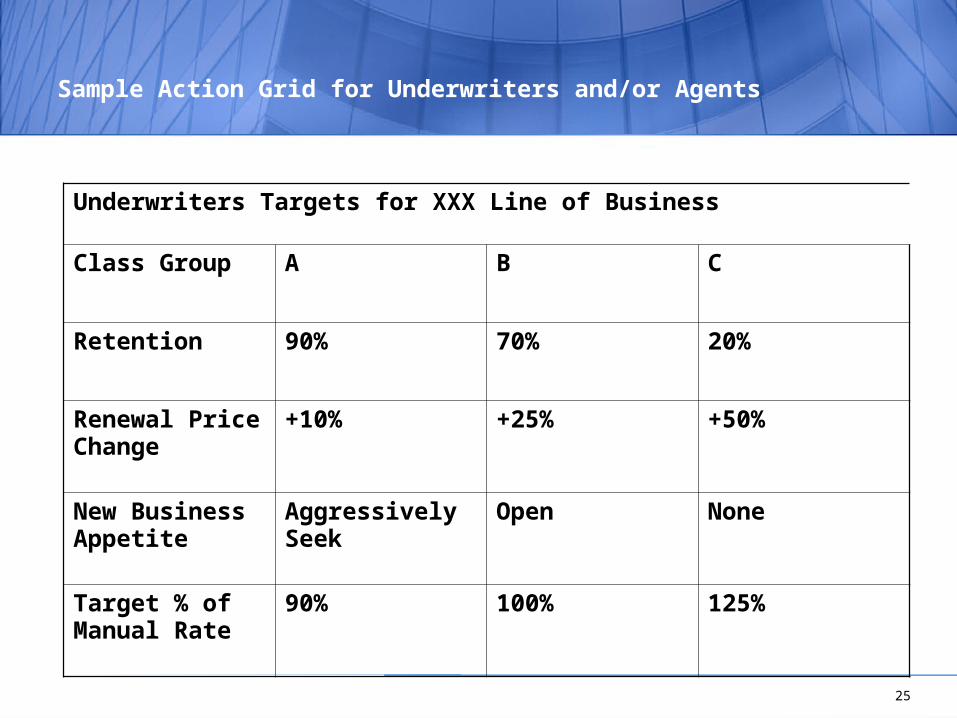
Sample Action Grid for Underwriters and/or Agents
Underwriters Targets for XXX Line of Business
Class Group A B C
Retention 90% 70% 20%
Renewal Price Change
+10% +25% +50%
New Business Appetite
Aggressively Seek
Open None
Target % of Manual Rate
90% 100% 125%

26
Class Group Line of Business I
Line of Business II Line of Business III
Offices A or B or C A or B or C A or B or C
Services A or B or C A or B or C A or B or C
BuildingOwners A or B or C A or B or C A or B or C
Light Manufacturing A or B or C A or B or C A or B or C
Contracting A or B or C A or B or C A or B or C
Wholesalers-Durable Goods A or B or C A or B or C A or B or C
Office Condo A or B or C A or B or C A or B or C
Residential Condos A or B or C A or B or C A or B or C
Shopping Centers A or B or C A or B or C A or B or C
Churches A or B or C A or B or C A or B or C
Clubs A or B or C A or B or C A or B or C
Hotels A or B or C A or B or C A or B or C
Restaurants A or B or C A or B or C A or B or C
Retail-not separately listed A or B or C A or B or C A or B or C
Listed Retail Classes A or B or C A or B or C A or B or C
Auto Services A or B or C A or B or C A or B or C
Sample Appetite Guide