Embed Size (px)
Citation preview

September 21, 2021 Oregon Public Utility Commission Attn: Filing Center P.O. Box 1088 Salem, OR 97308-1088 RE: UM 2178 Natural Gas Fact Finding Per EO 20-04 Supplemental Filing
Attention: Filing Center Enclosed for filing is Cascade Natural Gas Corporation’s (Cascade or Company) UM 2178 revised supplemental filing containing the revised presentation that was presented during the Natural Gas Fact Finding Workshop #3 on September 14, 2021. Cascade has amended the original presentation to included analysis regarding potential rate impacts to the Company’s various rate classes, as well as a clarifying statement on its total system cost slides. If there are any questions regarding this request, please contact me at (509) 734-4546 or via email at [email protected]. Sincerely, CASCADE NATURAL GAS CORPORATION /s/ Brian Robertson Brian Robertson Supervisor, Resource Planning UM 2178 CNGC Enclosed UM 2178 CNGC Natural Gas Fact Finding Supplemental Presentation.pptx

Cascade Natural Gas – UM 2178 Fact Finding Results
September 14th, 2021
1
Agenda• Introduction to Cascade• Top Level Model Inputs• Baseline Emissions• Energy Efficiency • Renewable Natural Gas – Biogas and Hydrogen• CCIs• Modeling Results• Questions
2

Introduction to Cascade
3

Today, Cascade's service territory covers about 32,000 square miles and extends over 700 highway miles from end to end, encompassing a diverse economic base as well as varying climatological areas.
Cascade delivers natural gas service to more than 299,000 customers with approximately 77,000 customers in Oregon and 222,000 customers in Washington. The Company’s customers reside in 96 communities--28 in Oregon and 68 in Washington.
Cascade's service area consists of smaller, rural communities in central and eastern Oregon, as well as communities across Washington.
4
About Cascade

• Cascade's residential customers represent approximately 13% of the total natural gas delivered on Cascade's system
• Commercial customers represent roughly 10%, and the approximately 500 core industrial customers consume around 2% of total gas throughput.
• The remaining non-core industrial customers represent the balance of the 75% of total throughput.
5
About Cascade

• The climate of the service territory is almost as diverse as its geographicalextension. Oregon’s service territory is in rural areas throughout northerncentral and central Oregon as well as eastern Oregon.
• All regions of Oregon have semi- arid climates with periods of arctic cold in thewinter and heat waves in the summer.
• The western Washington portion of the service territory, nicknamed the I-5corridor, has a marine climate with occasionally significant snow events.
• In general, the climate in the western part of the service territory is mild withfrequent cloud cover, winter rain, and warm summers.
• Cascade’s eastern Washington service territory has a semi-arid climate withperiods of arctic cold in the winter and heat waves in the summer.
6
About Cascade
Understanding UM 2178
• Initiated in response to Executive Order 20-04, which establishes GHG reduction goals that will be mandated under DEQ’s Climate Protection Program (CPP)
• From OPUC 6/8/2021 Year One Work Plan:• “The purpose of this Fact Finding will be to analyze the potential natural gas utility bill impacts that may result
from limiting GHG emissions of regulated natural gas utilities under the DEQ's Climate Protection Program and to identify appropriate regulatory tools to mitigate potential customer impacts.”
• Costs are evaluated under expected conditions (Base Case) as well as several sensitivities as outlined by the OPUC
7
UM 2178 - Deliverables
• Cascade has provided its emissions reduction model, which evaluates potential resources for carbon mitigation relative to each other
• All workpapers supporting the inputs and assumptions have also been provided
• Results are provided as both a resource stack and impact to costs. Resource stacks are mostly illustrative, as costs are the primary deliverable
8
UM 2178 – Risk Analysis
• Uncertainties surrounding CCIs
• Hydrogen Resource Potential & Costs
• RNG Potential & Costs
• New/Incomplete guidance around CPP rulemaking
• Load uncertainties
9

Emissions Reduction Model – Top Level Overview
• Excel Based Model – Solver using GRG Nonlinear optimization to minimize costs
• Inputs• Knowns• Unknowns• Scenario-based variables
• Outputs• Optimal Resource Mix• Delta to costs over planning horizon• Projected impact to revenue requirement

Model Inputs – Known Values
• Baseline Emissions - Load Forecast from Integrated Resource Plan (IRP)
• Expected Energy Efficiency (EE) – Conservation Potential Assessment (CPA)
• Expected RNG – Intel from internal subject matter experts
• Cost/Quantity of Community Climate Investment (CCI) Credits – Proposed OAR 340-271
• Emissions Targets – Function of all other inputs

Model Inputs – Unknown Values
• Maximum Incremental EE – Broken down into 4 buckets, grouped by similar levelized costs
• Maximum Incremental RNG – Based on 2019 AGF/ICF Study
• Maximum Incremental Hydrogen – Calculated as a function of load for a given year

13
-
200,000
400,000
600,000
800,000
1,000,000
1,200,000
2022 2023 2024 2025 2026 2027 2028 2029 2030 2031 2032 2033 2034 2035 2036 2037 2038 2039 2040 2041
Emiss
ions
(Ton
CO
2e)
LESS - Expected AvoidedEmissions - EE
LESS - Expected AvoidedEmissions - RNG
LESS - Optimal IncrementalEE
LESS - Optimal IncrementalRNG
LESS - Optimal Hydrogen
LESS - CCIs Needed
Cascade BaselineEmissions
Emissions Goal
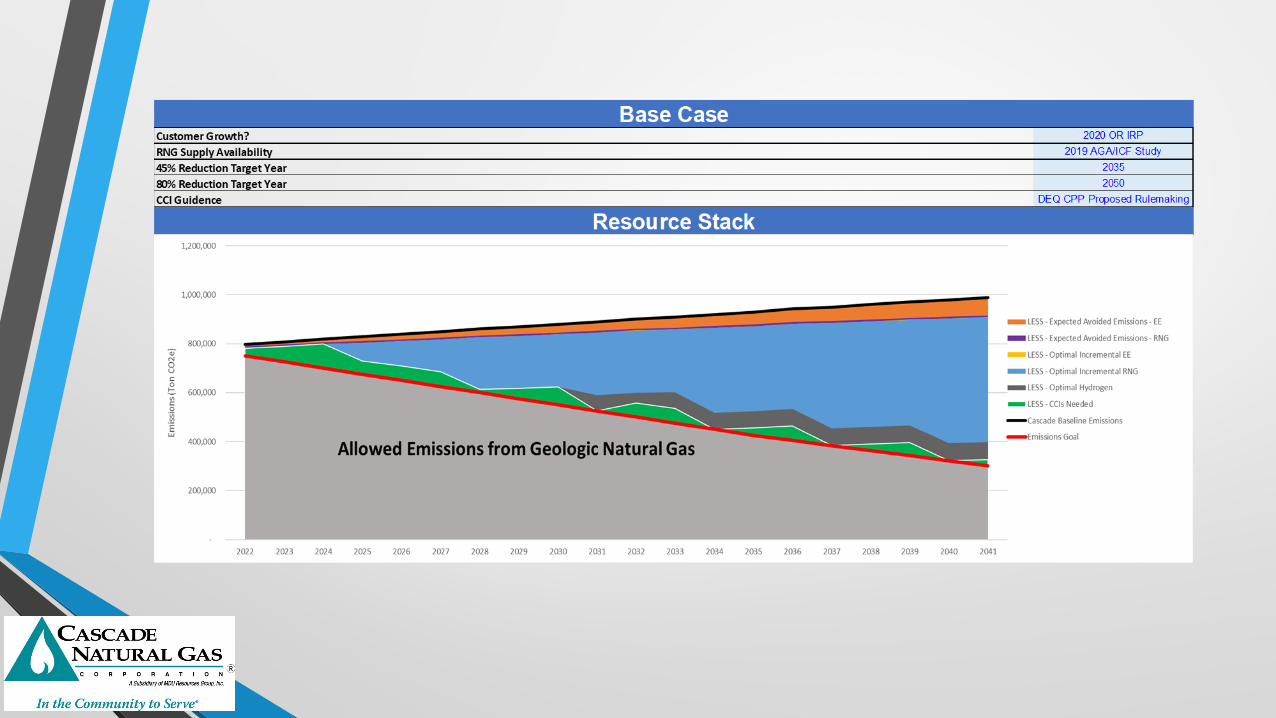
Allowed Emissions from Geologic Natural Gas

Baseline Emissions
14

Demand Forecast
• The Cascade demand forecast developed for the IRP is a forecast of customers, core natural gas demand, and core peak demand for the next 20 years.
• Demand is forecasted at:
• the citygate and citygate loop level;
• the rate schedule level; and
• the daily level.
• Resulting in ~200 models
15

Process
16

Customer Forecast
• CCG,Class = α0 + α1PopCG + α2EmpCG + Fourier(k) + ARIMA∈(p,d,q)
• Model Notes:• C = Customers; CG = Citygate; Class = Residential, Commercial, Industrial, or
Interruptible; ARIMA∈(p,d,q) = Indicates that the model has p autoregressive terms, d difference terms, and q moving average terms; Pop = Population; Emp = Employment; Fourier(k) = Captures seasonality of k number of seasons.
17

Use Per Customer Forecast
• Therms/CCG,Class = α0 + α1HDDCG, M + α2Iw + α4WINDCG, M +Trend+ Fourier(k)+ARIMA∈(p,d,q)
• Model Notes:
• Therms/C = Therms per customer; CG = Citygate; Class = Residential, Commercial, Industrial, or Interruptible; HDD = Heating Degree Days; M= Month; Iw = Indicator Variable set to 1 if it is a weekend; T = Trend Variable increasing by 1 for each day forecasted; WIND = Daily average wind speed.
18

Non-Core Outlook
• Cascade forecasts the load for its non-core customers going out five years.• Unlike the core, non-core (or transportation) customers are customers who
schedule and purchase their own gas, generally through a marketer, to get gas to the citygate. The customer then uses Cascade’s distribution system to receive the gas.
• Cascade’s transportation customers include all types of industrial customers. These include farms that may not use any gas during the winter to food manufacturers that average 800,000 therms per month throughout the year.
• Electric Generation customers are excluded from Cascade’s emission reduction requirements, and thus not included in this analysis.
19
Converting Customer Natural Gas Usage to GHG Emissions
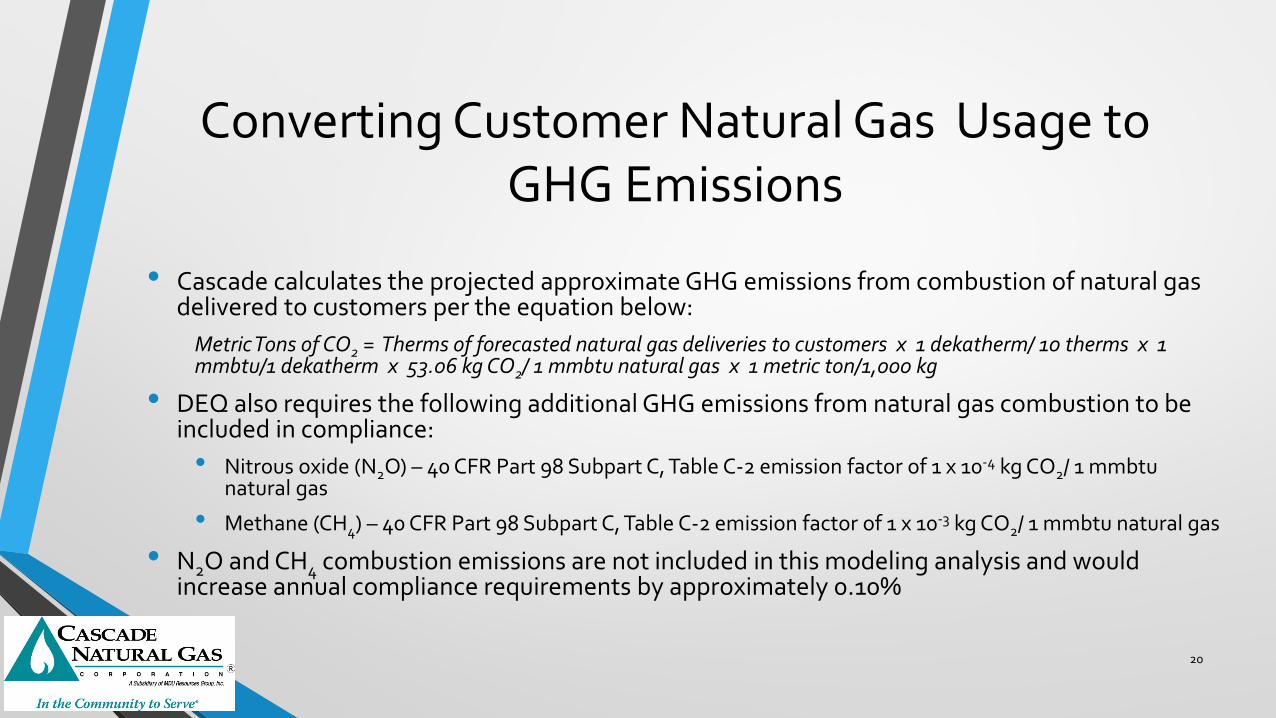
• Cascade calculates the projected approximate GHG emissions from combustion of natural gas delivered to customers per the equation below:
Metric Tons of CO2 = Therms of forecasted natural gas deliveries to customers x 1 dekatherm/ 10 therms x 1 mmbtu/1 dekatherm x 53.06 kg CO2/ 1 mmbtu natural gas x 1 metric ton/1,000 kg
• DEQ also requires the following additional GHG emissions from natural gas combustion to be included in compliance:• Nitrous oxide (N2O) – 40 CFR Part 98 Subpart C, Table C-2 emission factor of 1 x 10⁻⁴ kg CO2/ 1 mmbtu
natural gas
• Methane (CH4) – 40 CFR Part 98 Subpart C, Table C-2 emission factor of 1 x 10⁻³ kg CO2/ 1 mmbtu natural gas
• N2O and CH4 combustion emissions are not included in this modeling analysis and would increase annual compliance requirements by approximately 0.10%
20

Energy Efficiency
21

Energy Efficiency’s Role in Emissions Reduction
• LDCs will be working hard to pursue every viable avenue to GHG emissions reductions to ensure we are able to reduce emissions below the required threshold. Meeting thresholds means pursuing all available pathways to decarbonization, including expanded energy efficiency.
• Every therm conserved through energy efficiency efforts reduces the total carbon associated with gas usage in homes and buildings.
• Energy Trust is the designated vehicle for non-LI natural gas energy efficiency programs in the state of OR. Cascade has partnered with the Energy Trust of Oregon for over a decade to deliver cost-effective energy efficiency services to core gas customers in our service area.
22

Energy Trust and Cost-Effective Conservation
• Energy Trust offers a suite of rebates to qualified customers for baseload energy reductions, and for utilizing high efficiency equipment in place of lower efficiency gas equipment. This includes access to custom EE options for commercial/industrial facilities on core rate schedules.
• Funds for the EE programs operated via the Energy Trust are collected via Public Purpose Funds from core customers. However, natural gas fuel suppliers will soon be responsible for most transport customer emissions under the CPP, meaning that there will be a need for expanded services (such as those offered by Energy Trust) to serve these facilities.
• There is no PPC collection from transport customers as they have been responsible for their own emissions reductions to-date. However, there will need to be a vehicle to support these now required emissions reductions.
23
Energy Trust and Cost-Effective Conservation (cont.)
• Energy Trust conducts a Conservation Potential Assessment for LDCs has been based on cost-effectiveness thresholds and calculations approved by the OPUC. Cost effectiveness is based on a modified Total Resource Cost/Societal Cost Test and is anchored to the avoided cost of gas. This is identified in Cascade’s model as “Expected EE”
• Energy Trust has currently identified all technical potential for core customers. There is additional technical potential that can be achieved in all sectors, including the transport sector.
24

Beyond Cost-Effective
• Technical core potential is based on incremental savings that could be achieved beyond what is considered cost-effective under the TRC/SCT. The TRC/SCT is not based on carbon reductions, but on therm savings.
• Cascade has partnered with ETO to evaluate what additional pathways to decarbonization are possible beyond Cost-Effective EE. The results of this analysis are included in the model as “Incremental EE” and will require an alternative valuation methodology
• This methodology should be considered to factor for the GHG reductions that could be achieved by acquiring the additional therm savings identified by Energy Trust that would be available through expanded energy efficiency efforts. These efforts will lead to GHG emissions reductions consistent with the CPP.
25

Renewable Natural Gas –Biogas and Hydrogen
26
What is Renewable Natural Gas (RNG)?
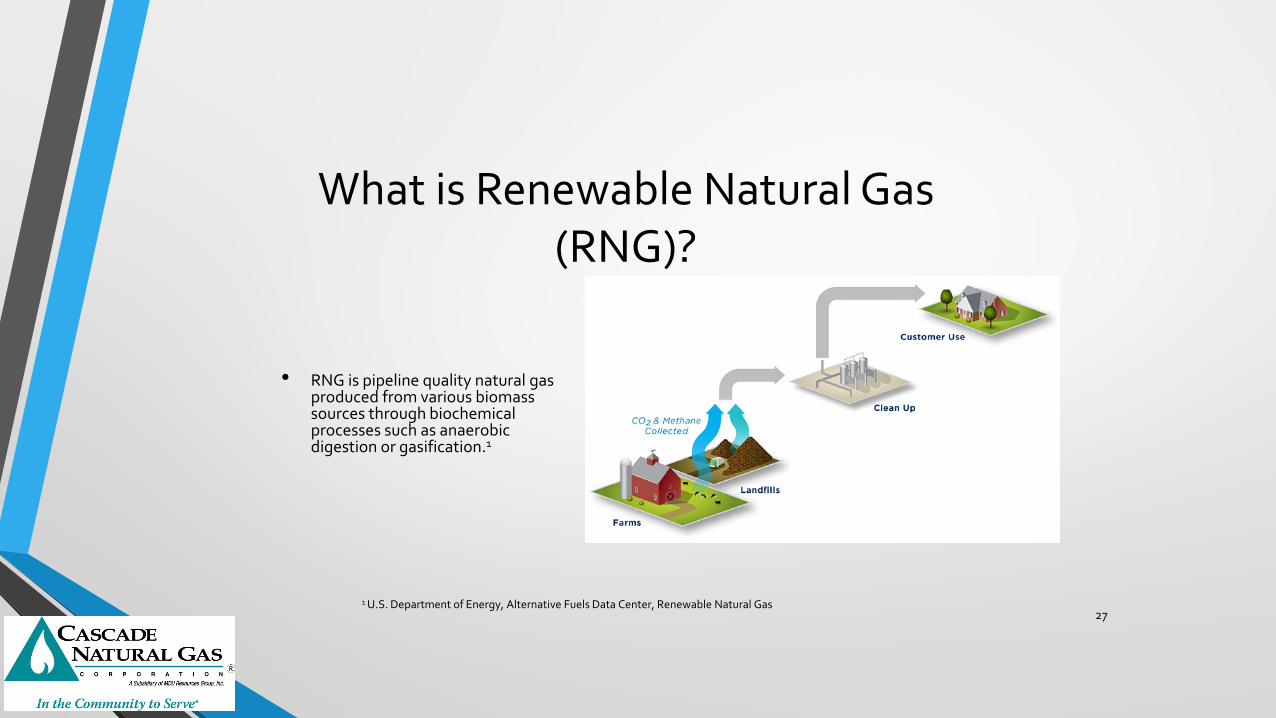
• RNG is pipeline quality natural gas produced from various biomass sources through biochemical processes such as anaerobic digestion or gasification.1
271 U.S. Department of Energy, Alternative Fuels Data Center, Renewable Natural Gas

• Examples:
• Biogas from Landfills
• Collect waste from residential, industrial, and commercial entities.
• Digestion process takes place in the ground, rather than in a digester.
• Biogas from Livestock Operations
• Collects animal manure and delivers to anaerobic digester.
• Biogas from Wastewater Treatment
• Produced during digestion of solids that are removed during the wastewater treatment process.
• Other sources include organic waste from food manufacturers and wholesalers, supermarkets, restaurants, hospitals, and more.1
28
1 U.S. Department of Energy, Alternative Fuels Data Center, Renewable Natural Gas
Renewable Natural Gas

Blending Hydrogen with Geologic Gas
• Cascade is excited to explore the opportunities presented by blending hydrogen into its system
• There are many factors to account for when attempting to quantify hydrogen as a future resource• Regional availability of hydrogen
• Safety aspects with hydrogen blends
• Cost of hydrogen
• Source of hydrogen
• End-use appliances/systems
29
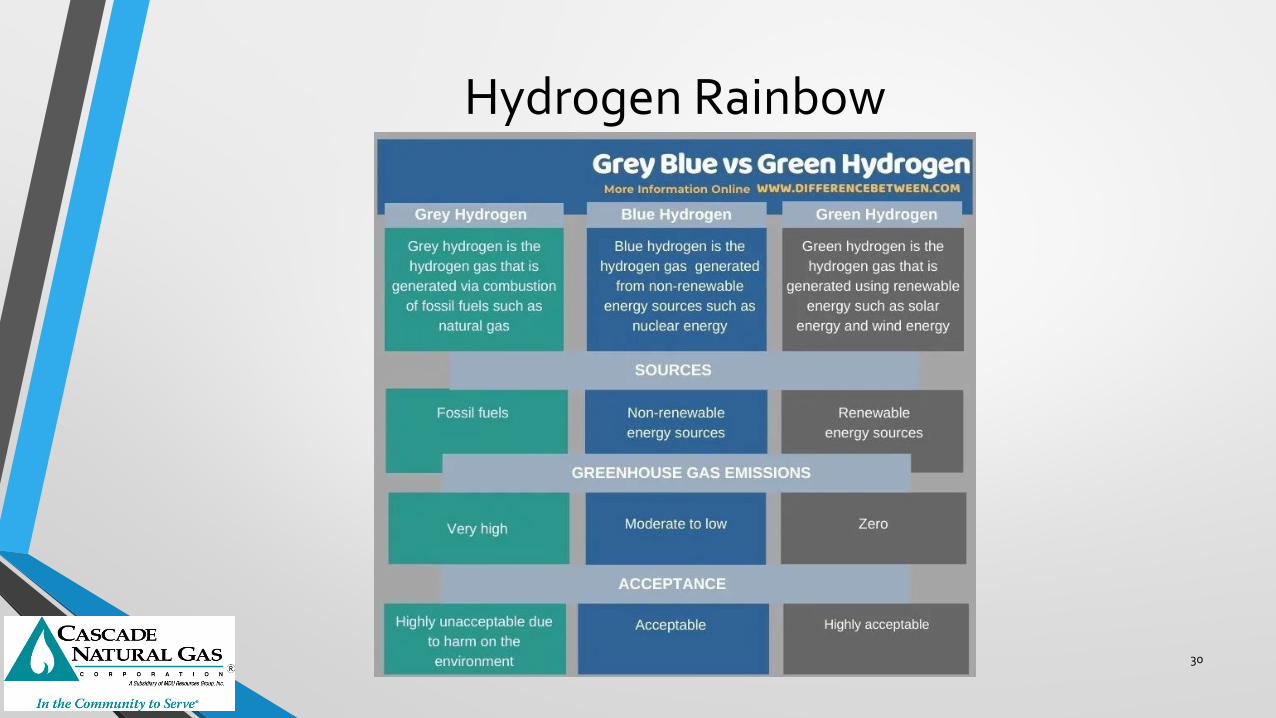
Hydrogen Rainbow
30

Model Inputs – RNG Quantities and Costs• RNG limits in the model are set based on Cascade’s potential share of
statewide RNG projected values in the Company’s service territory
• The 2019 AGF study provides RNG potential by 2040 by state, and adoption curves for the various types of RNG are then used to generate acquisition curves for each resource
• RNG cost projections are derived from the Combined RNG Supply-Cost Curve from the 2019 AGAFStudy• Cascade’s position is that a majority of its RNG purchases will occur in the first half of
the provided curve due to regional policy adoption supporting RNG acquisition
• The study’s combined cost curve is used because Cascade’s model is agnostic to the type of RNG acquired with regards to carbon intensity
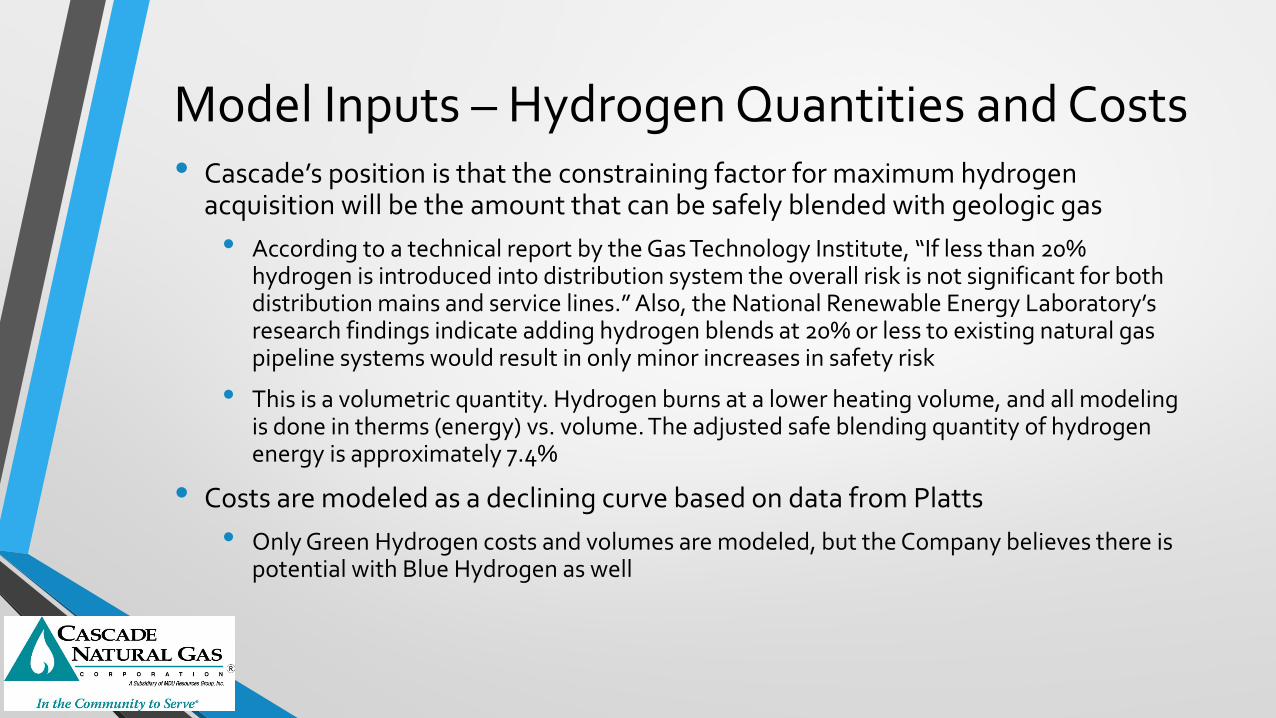
Model Inputs – Hydrogen Quantities and Costs• Cascade’s position is that the constraining factor for maximum hydrogen
acquisition will be the amount that can be safely blended with geologic gas• According to a technical report by the Gas Technology Institute, “If less than 20%
hydrogen is introduced into distribution system the overall risk is not significant for both distribution mains and service lines.” Also, the National Renewable Energy Laboratory’s research findings indicate adding hydrogen blends at 20% or less to existing natural gas pipeline systems would result in only minor increases in safety risk
• This is a volumetric quantity. Hydrogen burns at a lower heating volume, and all modeling is done in therms (energy) vs. volume. The adjusted safe blending quantity of hydrogen energy is approximately 7.4%
• Costs are modeled as a declining curve based on data from Platts• Only Green Hydrogen costs and volumes are modeled, but the Company believes there is
potential with Blue Hydrogen as well

Community Climate Investment (CCI) Credits
33

Community Climate Investment Credits
• Community Climate Investment (CCI) Credits provide a different mechanism for demonstrating compliance
• CCI Credits are proposed as an instrument issued by DEQ to track a covered fuel supplier’s payment of community climate investment (CCI) funds.
• CCI funds means money paid by a covered fuel supplier to a community climate investment (CCI) entity to support implementation of DEQ-approved community climate investment projects.
• CCI Credits may be generated and distributed by DEQ to a covered entity when a covered entity contributes funds to approved CCI entities.
• If no CCI entities are approved, no CCI funds can be contributed.
• CCI Credits may be used by covered fuel suppliers in lieu of a compliance instrument to demonstrate compliance, but there is a limit to the percent of a covered entity’s total compliance obligations that CCI Credits can be used in demonstrating compliance for each compliance period.

Community Climate Investment Credits (cont.)• Covered entities are limited in using CCI credits for demonstrating compliance as follows:
• Up to 10 percent of compliance obligation in 2022-2024
• Up to 15 percent of compliance obligation in 2025-2027
• Up to 20 percent of compliance obligation in 2028-2030 and thereafter
• Covered entities are limited in the amount of CCI Credits that can be acquired (or generated and distributed by DEQ) in each compliance period per the following equation and maximum quantities:
Maximum number of CCI credits that can be generated/distributed = Percentage for compliance period (see table below) x average annual compliance instruments distributed in the compliance period x number of years in compliance period

Community Climate Investment Credits (cont.)• The following attributes also apply to CCI credits in the proposed rule:
• Meant to represent one metric ton of allowable greenhouse gas emissions for compliance demonstration.
• Cost of CCI Credits are equal to the carbon dioxide social cost of carbon projections developed by the Interagency Working Group on Social Cost of Greenhouse Gases and are adjusted for inflation annually.
• Can be banked indefinitely unless no longer a covered entity or use for demonstrating compliance.
• Cannot be traded or transferred to another covered entity.
• Represents a regulatory instrument and is not personal property, a security or other form of property.

Community Climate Investment Credits (cont.)Projected CCI credit contribution costs
Equation in OAR 340-271-0820(3)(a)(A):
CCI Credit Contribution Amount = CCI Credit Contribution Amount in Table 7 x CPI-U West for January of the calendar year for the price in Table 7 that is currently in effect / CPI-U West for January 2021
Jan 2021 CPI-U West =$277.24

Community Climate Investment Credits (cont.)• Purpose of CCI Credits:
• Reduce anthropogenic GHGs by an average of at least 1 MT CO2e per CCI credit
• Reduce other non-GHG air emissions particularly in and near environmental justice communities in Oregon;
• Promote public health, environmental, and economic benefits for environmental justice communities in Oregon to mitigate impacts from climate change, air contamination, energy costs, or any combination of these; and
• Accelerate the transition of residential, commercial, industrial and transportation-related uses of fossil fuels to lower carbon sources of energy in order to protect people, communities and businesses from increases in the prices of fossil fuels

Modeling Results
39

Total System and Incremental Costs for Base Case and Sensitivities
• Base Case
• Customer Growth• Current IRP forecasted load growth through 2025; no new customers beginning from 2025 through 2030;
-0.75% customer growth beginning in 2031 through the end of model’s time horizon.
• RNG Availability• Limit RNG availability to the annual percentages set by SB 98 and found in ORS 757.396(1).
• More Aggressive Timeline on Climate Policy• CPP targets of 45% below baseline by 2030, 80% below baseline by 2040.
• No CCI Credits

Rate Impact Analysis
• Cascade used historical system cost broken out by RCI with an inflation factor for projected.
• WACOG uses historical and projected costs for the period.
• CPP compliance was applied to RCI classes on a uniform percentage increase to the underlining system costs.
• Non-core customers would expect compliance cost increases relative to current gas supply costs as shown in the Projected AVG CPP Increase chart.

43

44

45

46

Data Item 2022-2025 2026-2030 2031-2035 2036-2039Total System Cost 638,770,304 856,212,411 900,511,713 751,056,344 Optimal Incremental EE 53,117 81,426 74,661 50,915 Optimal Incremental RNG 8,256,677 88,515,721 120,874,453 111,351,037 Optimal Incremental Hydrogen - - 19,357,358 10,212,810 CCIs Needed 19,392,683 17,932,489 9,782,555 8,454,179
Years
Note: Total System Cost included 2020 IRP forecasted values for Washington and Oregon, while CPP compliance costs are Oregon only

Customer Growth? Declining Per UM2178RNG Supply Availability 2019 AGA/ICF Study45% Reduction Target Year 203580% Reduction Target Year 2050CCI Guidence DEQ CPP Proposed Rulemaking
Sensitivity #1 -Declining Growth
Sensitivity #1 - Declining Growth

Data Item 2022-2025 2026-2030 2031-2035 2036-2039Total System Cost 638,770,304 856,212,411 900,511,713 751,056,344 Optimal Incremental EE 53,117 81,426 74,661 50,915 Optimal Incremental RNG 8,256,694 78,802,504 85,223,688 69,628,251 Optimal Incremental Hydrogen 0 - 16,212,259 8,461,791 Alternative Compliance Needed 0 0 0 0 CCIs Needed 19,392,671 15,204,902 6,928,953 3,892,581
Years
Note: Total System Cost included 2020 IRP forecasted values for Washington and Oregon, while CPP compliance costs are Oregon only

Customer Growth? 2020 OR IRPRNG Supply Availability SB 98 Constraints45% Reduction Target Year 203580% Reduction Target Year 2050CCI Guidence DEQ CPP Proposed Rulemaking
Sensitivity #2 - RNG Availability
Sensitivity #2 - Resource Stack
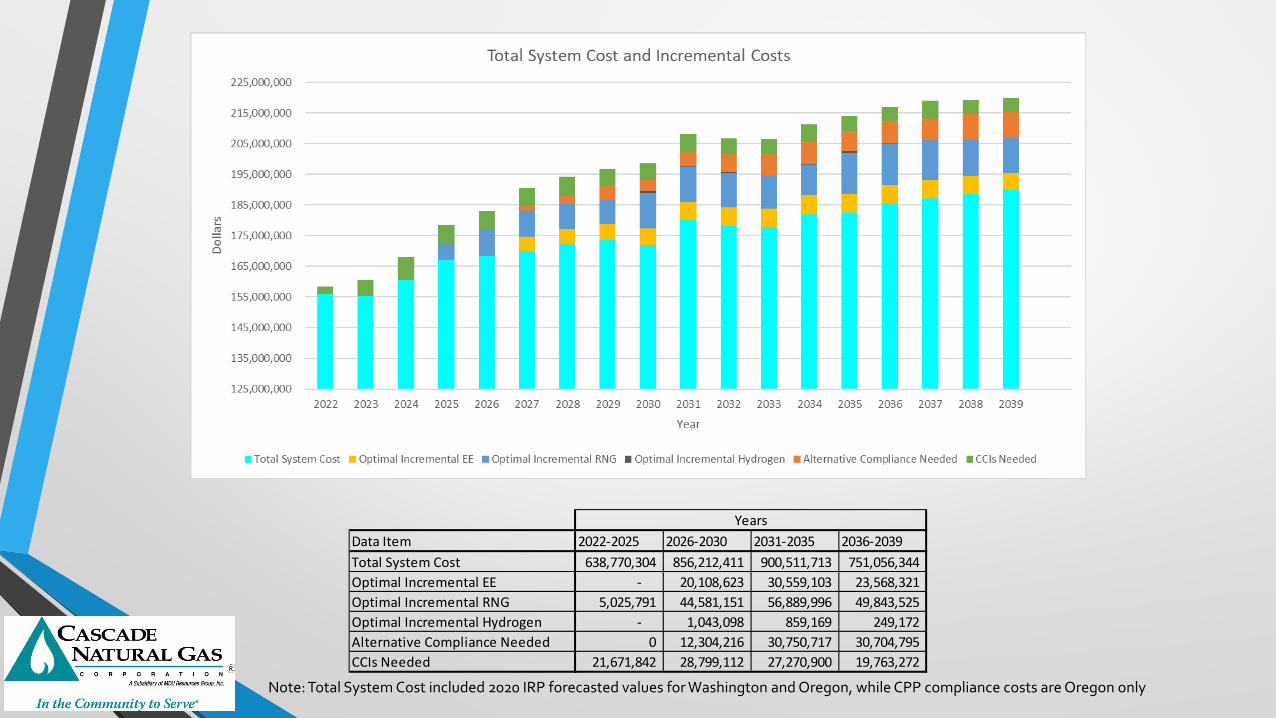
Data Item 2022-2025 2026-2030 2031-2035 2036-2039Total System Cost 638,770,304 856,212,411 900,511,713 751,056,344 Optimal Incremental EE - 20,108,623 30,559,103 23,568,321 Optimal Incremental RNG 5,025,791 44,581,151 56,889,996 49,843,525 Optimal Incremental Hydrogen - 1,043,098 859,169 249,172 Alternative Compliance Needed 0 12,304,216 30,750,717 30,704,795 CCIs Needed 21,671,842 28,799,112 27,270,900 19,763,272
Years
Note: Total System Cost included 2020 IRP forecasted values for Washington and Oregon, while CPP compliance costs are Oregon only
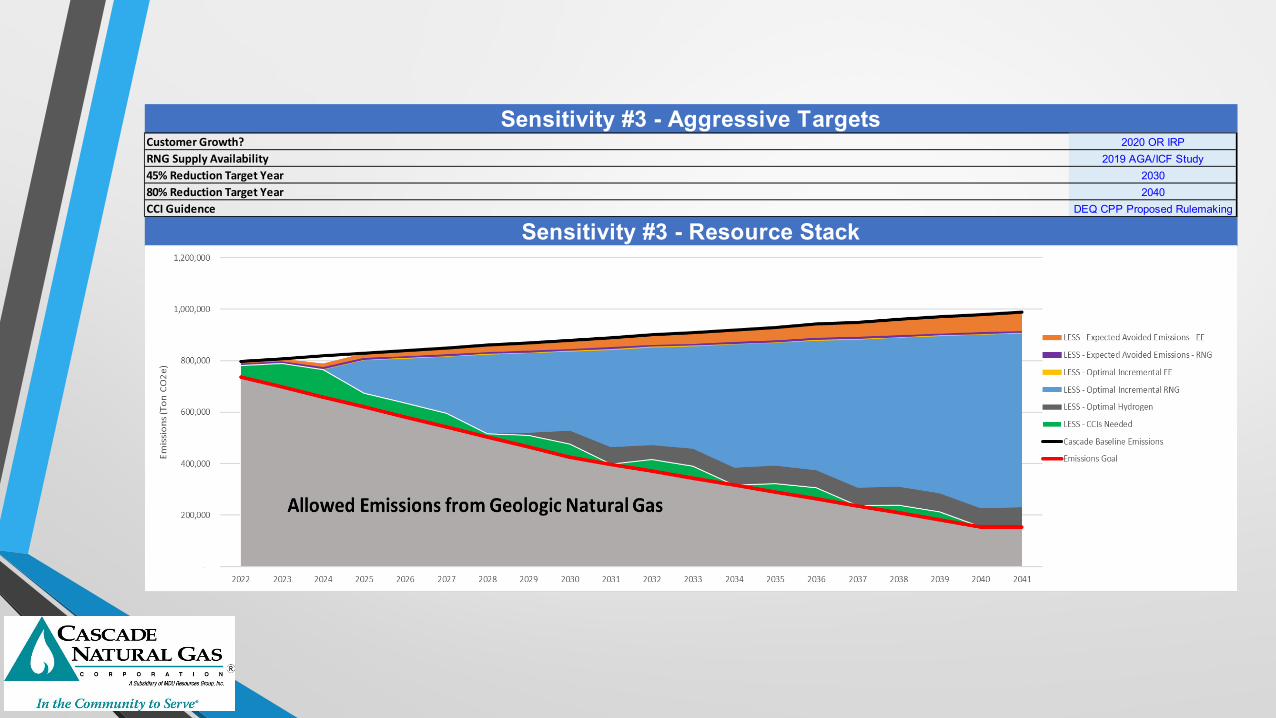
Customer Growth? 2020 OR IRPRNG Supply Availability 2019 AGA/ICF Study45% Reduction Target Year 203080% Reduction Target Year 2040CCI Guidence DEQ CPP Proposed Rulemaking
Sensitivity #3 - Aggressive Targets
Sensitivity #3 - Resource Stack

Data Item 2022-2025 2026-2030 2031-2035 2036-2039Total System Cost 638,770,304 856,212,411 900,511,713 751,056,344 Optimal Incremental EE 4,625,251 9,120,704 6,527,963 3,846,056 Optimal Incremental RNG 14,077,899 131,045,615 172,381,761 150,717,962 Optimal Incremental Hydrogen - 5,478,997 20,372,356 10,212,810 Alternative Compliance Needed 2,229,354 0 0 0 CCIs Needed 23,345,754 15,720,216 8,163,794 6,336,872
Years
Note: Total System Cost included 2020 IRP forecasted values for Washington and Oregon, while CPP compliance costs are Oregon only

Customer Growth? 2020 OR IRPRNG Supply Availability 2019 AGA/ICF Study45% Reduction Target Year 203580% Reduction Target Year 2050CCI Guidence None
Sensitivity #4 - No CCIs
Sensitivity #4 - Resource Stack

Data Item 2022-2025 2026-2030 2031-2035 2036-2039Total System Cost 638,770,304 856,212,411 900,511,713 751,056,344 Optimal Incremental EE 7,733,419 9,120,704 6,527,963 3,846,056 Optimal Incremental RNG 13,827,294 98,084,109 125,854,686 118,273,505 Optimal Incremental Hydrogen 0 8,662,012 21,023,083 10,212,810 Alternative Compliance Needed 13,827,611 0 0 0 CCIs Needed - - - -
Years
Note: Total System Cost included 2020 IRP forecasted values for Washington and Oregon, while CPP compliance costs are Oregon only

Questions?
56

Cascade Natural Gas – UM 2178 Fact Finding Results
September 14th, 2021
57