Embed Size (px)
Citation preview
Case Center for Proteomics and Bioinformatics Workshop SeriesMarch 5: Masaru Miyagi and Chao Yuan Will Present:
“Quantitative proteomic analysis using stable isotopic labeling”
April 2: Elizabeth Yohannes Will Present:“2D-DIGE workflow: An applied quantitative proteomics for molecular signature identification for diabetic bladder and erectile dysfunction”
We will continue the workshop series in the Fall with the following topics:
Structural Mass SpectrometryPosttranslational modifications of proteins and peptidesInteraction ProteomicsBioinformatics
CWRU has a license for Ingenuity software. The software conducts pathways analysis from your supplied targets. If you are interested in utilizing this software, send an e-mail request to [email protected]
Global Proteome ProfilingUsing Label Free Technology in Human Clinical Studies and Animal Models of
DiseaseDaniela Schlatzer and Chao Yuan, Ph. D
Case Western Reserve UniversityExpression Proteomics Workshop
February 5, 2009
OutlineOverview of Quantitative Proteomics
Discuss Label Free Expression Platform
Section 1 – Solution Based AnalysisExample Center Clinical Proteomics Projects
DiabetesCardiovascularCancer
Example Proteomic Techniques for Validation of Targets/and or Biomarkers
Multiple Reaction Monitoring – Absolute QuantificationMS Western Technique – Relative Quantification
Section 2 - Gel Based AnalysisExample of Tissue Analysis in Animal Models
Cardiovascular
Quantitative ProteomicsDetermine changes in a protein’s abundance and/or expression due to a biological challenge (disease,drug)
Better understand biological function and pathophysiology of diseaseBiomarker Discovery
Disease preventionTreatment
Quantitative Proteomics – Analysis Platforms
‘Top Down’ ProteomicsQuantify in tact proteins
2-Dimensional gel electrophoresis2D-DIGE, SELDI-TOF
‘Bottom Up’ ProteomicsQuantify peptides via enzymatic cleavage of one or many proteins
Isotope Coding – iTRAQ, SILAC, O18
Direct Quantification – Label free expressionTargeted Quantification – MS Western, Isotope Dilution Tandem Mass Spectrometry
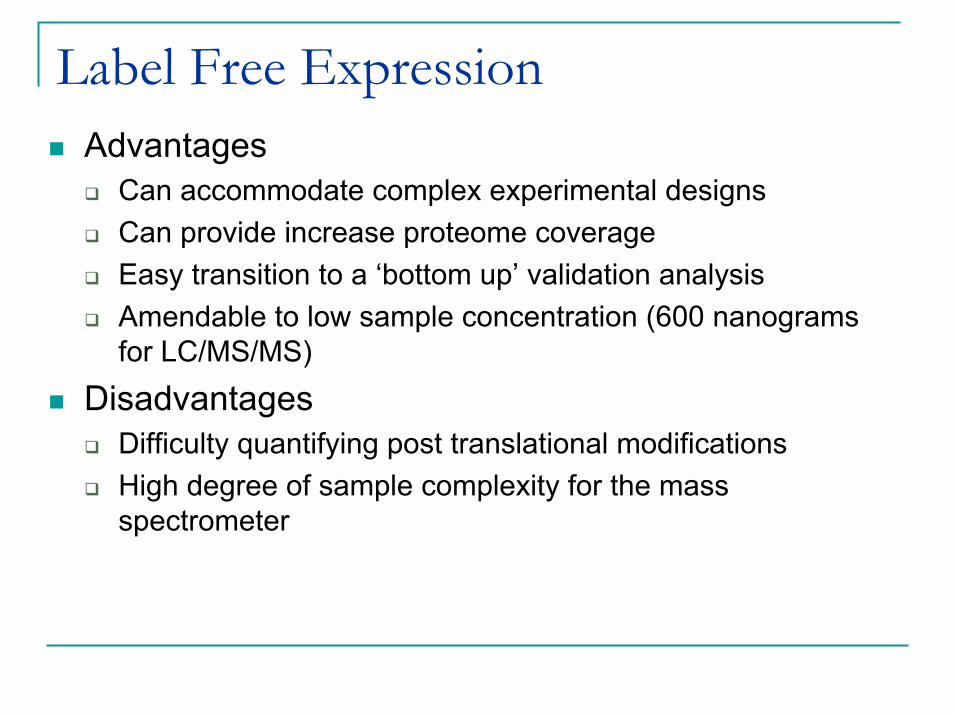
Label Free ExpressionAdvantages
Can accommodate complex experimental designsCan provide increase proteome coverageEasy transition to a ‘bottom up’ validation analysisAmendable to low sample concentration (600 nanogramsfor LC/MS/MS)
DisadvantagesDifficulty quantifying post translational modificationsHigh degree of sample complexity for the mass spectrometer
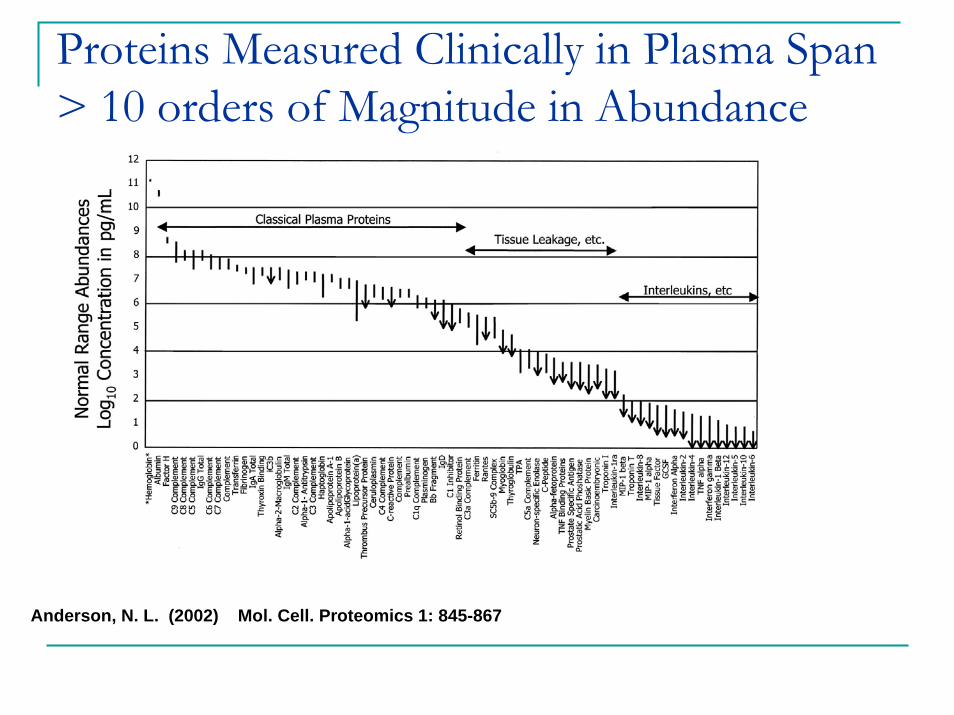
Anderson, N. L. (2002) Mol. Cell. Proteomics 1: 845-867
Proteins Measured Clinically in Plasma Span > 10 orders of Magnitude in Abundance
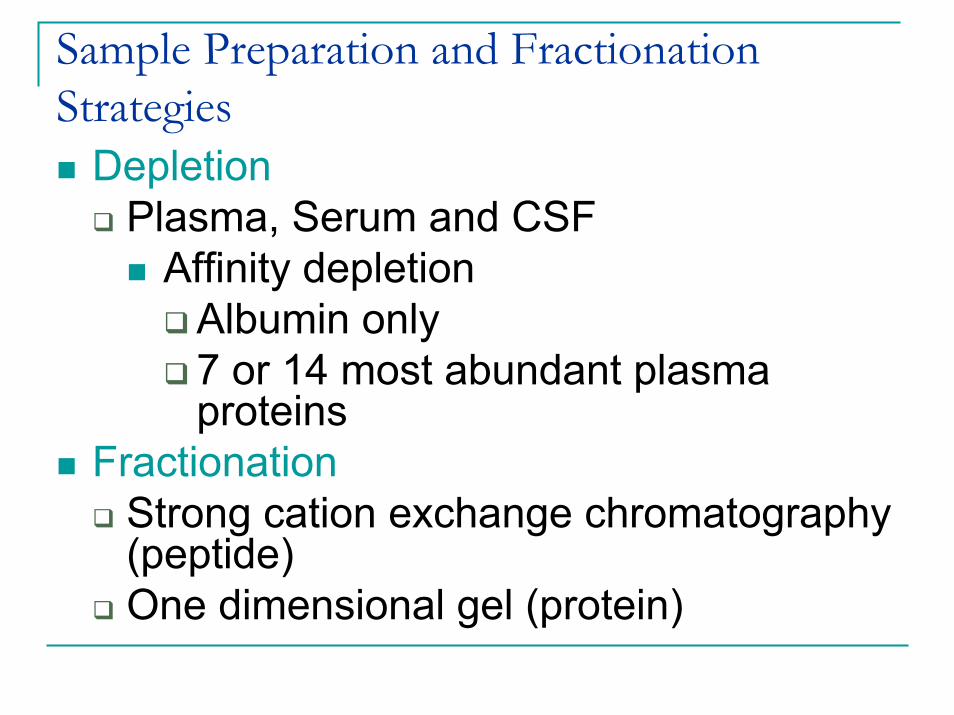
Sample Preparation and Fractionation Strategies
DepletionPlasma, Serum and CSF
Affinity depletionAlbumin only7 or 14 most abundant plasma proteins
FractionationStrong cation exchange chromatography (peptide)One dimensional gel (protein)
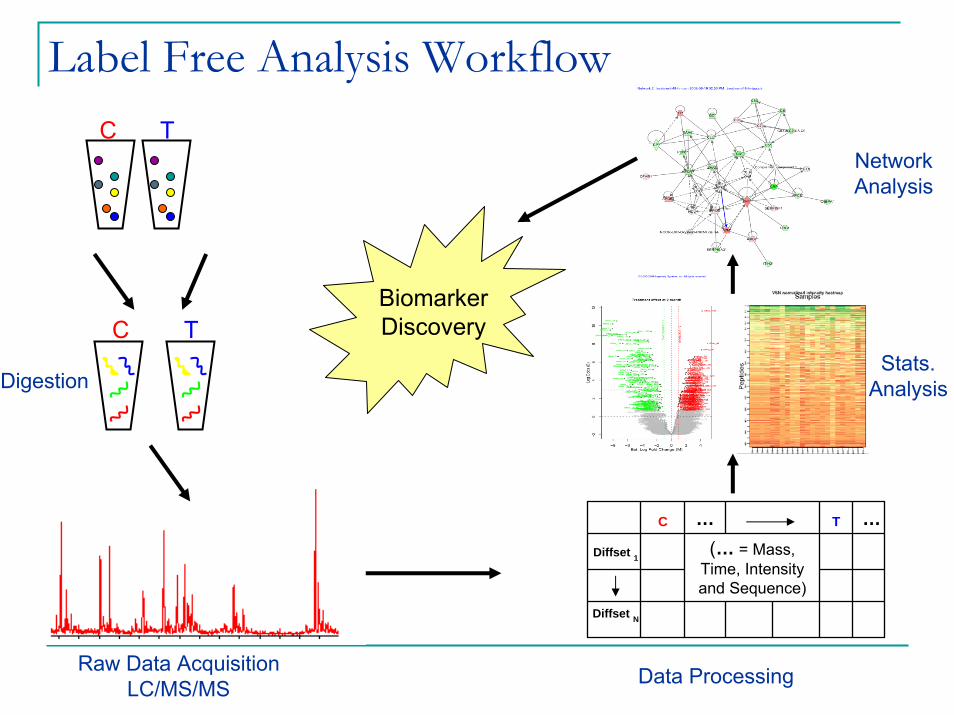
Label Free Analysis WorkflowC T
C TBiomarker Discovery
Stats.Analysis
Diffset N
(… = Mass, Time, Intensity and Sequence)
…T…C
Digestion
Raw Data AcquisitionLC/MS/MS Data Processing
NetworkAnalysis
Diffset 1
450 500 550 600 650 700 750 800 850 90m/z
0
5
10
15
20
25
30
35
40
45
50
55
60
Rel
ativ
e A
bund
ance
440.54470.27
586.82
682.29
821.37509.27
660.30754.55
522.26497.93 655.97620.76
801.78548.51 703.39581.79
787.36 845.94 890.7
732.312 Mo DM
1 Mo DM
3 Day DM
C:\FT_MS Raw Data\...\Dani15_LF_1 8/7/2007 10:28:51 PM
RT: 0.00 - 110.01
0 10 20 30 40 50 60 70 80 90 100 110Time (min)
0
20
40
60
80
1000
20
40
60
80
100
Rel
ativ
e A
bund
ance
0
20
40
60
80
10011.50
107.74
21.56 27.31 33.10 44.76
68.93
15.41 63.9553.2440.1320.57 37.39 106.7848.69 77.8711.03 92.5862.51 104.066.79 74.26 89.33 94.07
107.48
33.8528.4122.33 45.8834.14
43.7038.59 64.7225.3115.73 54.36
14.7111.65 78.6317.63 63.4410.93 106.5452.646.75 62.61 69.74 92.3375.30 103.1280.80 86.686.17
107.58
44.5232.0426.7120.93 32.34 36.78
25.83 64.3353.8042.3413.52
106.6912.43 18.11 92.8875.0962.98 78.82 104.0968.8252.056.72 82.6658.86 102.366.29
NL:5.81E6Base Peak F: FTMS + p NSI Full ms [400.00-1600.00] MS Dani15_LF_1
NL:4.14E6Base Peak F: FTMS + p NSI Full ms [400.00-1600.00] MS dani15_lf_11
NL:5.71E6Base Peak F: FTMS + p NSI Full ms [400.00-1600.00] MS dani15_lf_6
Retention Time
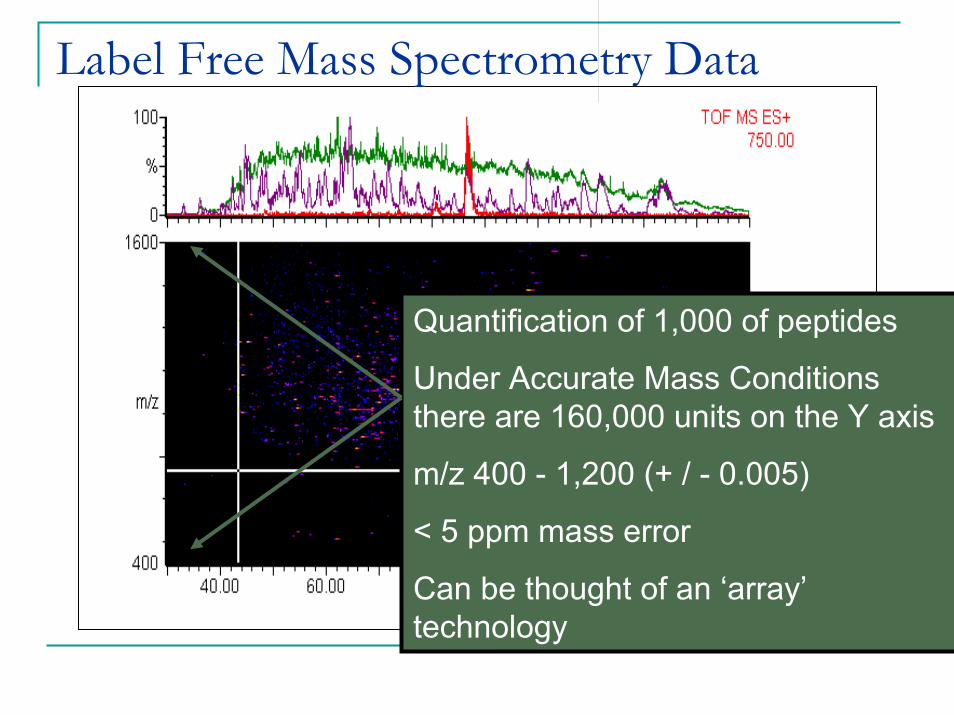
Label Free Mass Spectrometry Data
Quantification of 1,000 of peptides
Under Accurate Mass Conditions there are 160,000 units on the Y axis
m/z 400 - 1,200 (+ / - 0.005)
< 5 ppm mass error
Can be thought of an ‘array’technology
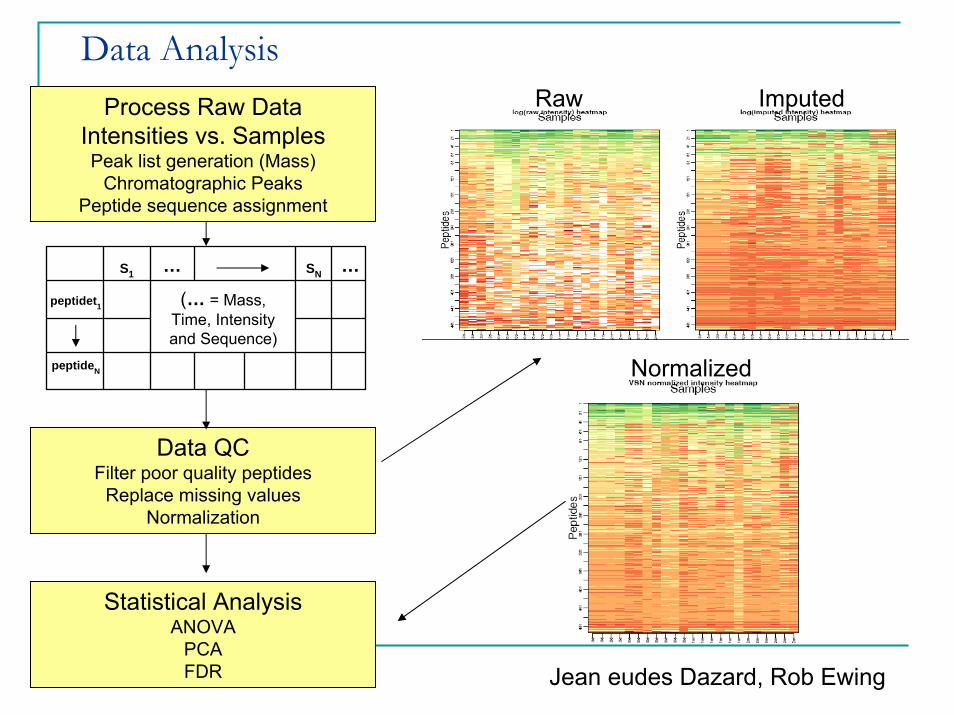
Data AnalysisProcess Raw Data
Intensities vs. SamplesPeak list generation (Mass)
Chromatographic Peaks Peptide sequence assignment
Data QCFilter poor quality peptides
Replace missing valuesNormalization
Statistical AnalysisANOVA
PCAFDR
Raw Imputed
NormalizedpeptideN
(… = Mass, Time, Intensity and Sequence)
…SN…S1
peptidet1
Jean eudes Dazard, Rob Ewing
Bioinformatic AnalysisData mining to enable biological interpretation of high dimensional datasets
Molecular network relevant to disease pathway understudy
Software tools which we use:Ingenuity Pathway Analysis (IPA)
Curated literature and protein interaction databasesPathway Studio
Automated literature search and protein interaction databases
MetaCoreProtein interaction databases
Example 1 – DiabetesMark Chance Ph.d – Center for Proteomics
Urine Biomarker for diabetic complications (CAD and DM nephropathy)
20 million people in the US have Type I or II diabetes; 150 million worldwideEnd Stage Renal Disease (ESRD) and Coronary Artery Disease are important disease complications
DM is leading cause of kidney failure Approximately 60,000 with ESRD die yearly
CAD leading cause of mortality in the US with a 3-10 fold increase risk in those with diabetes
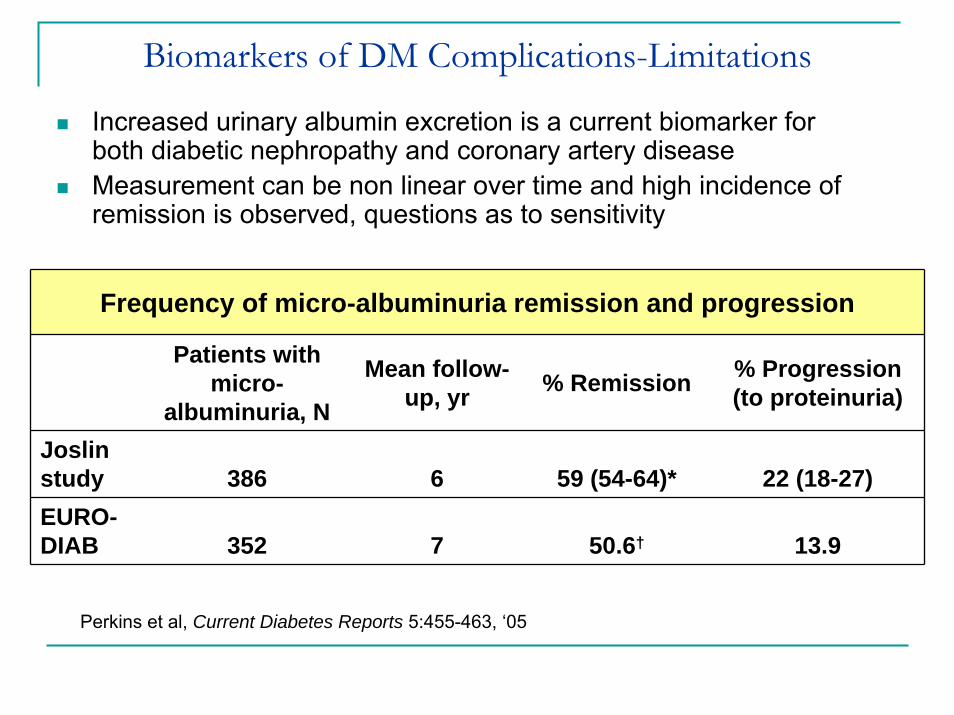
Biomarkers of DM Complications-Limitations
Increased urinary albumin excretion is a current biomarker for both diabetic nephropathy and coronary artery diseaseMeasurement can be non linear over time and high incidence of remission is observed, questions as to sensitivity
Perkins et al, Current Diabetes Reports 5:455-463, ‘05
Frequency of micro-albuminuria remission and progression
Patients with micro-
albuminuria, N
Mean follow-up, yr % Remission % Progression
(to proteinuria)
Joslin study 386 6 59 (54-64)* 22 (18-27)EURO-DIAB 352 7 50.6† 13.9
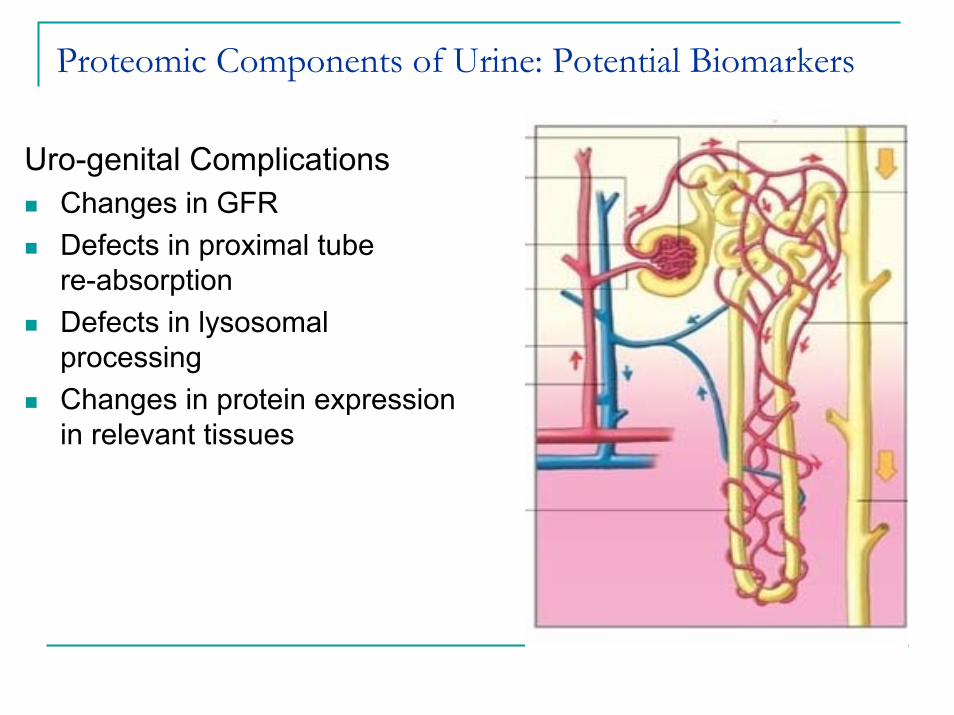
Proteomic Components of Urine: Potential Biomarkers
Sources of Urinary ProteinsSoluble Proteins
Glomerular filtration of plasma proteinsEpithelial cell secretion of soluble proteins
Solid Phase ComponentEpithelial cells – whole cell sheddingExosome secretion
Uro-genital ComplicationsChanges in GFRDefects in proximal tube re-absorptionDefects in lysosomal processingChanges in protein expression in relevant tissues
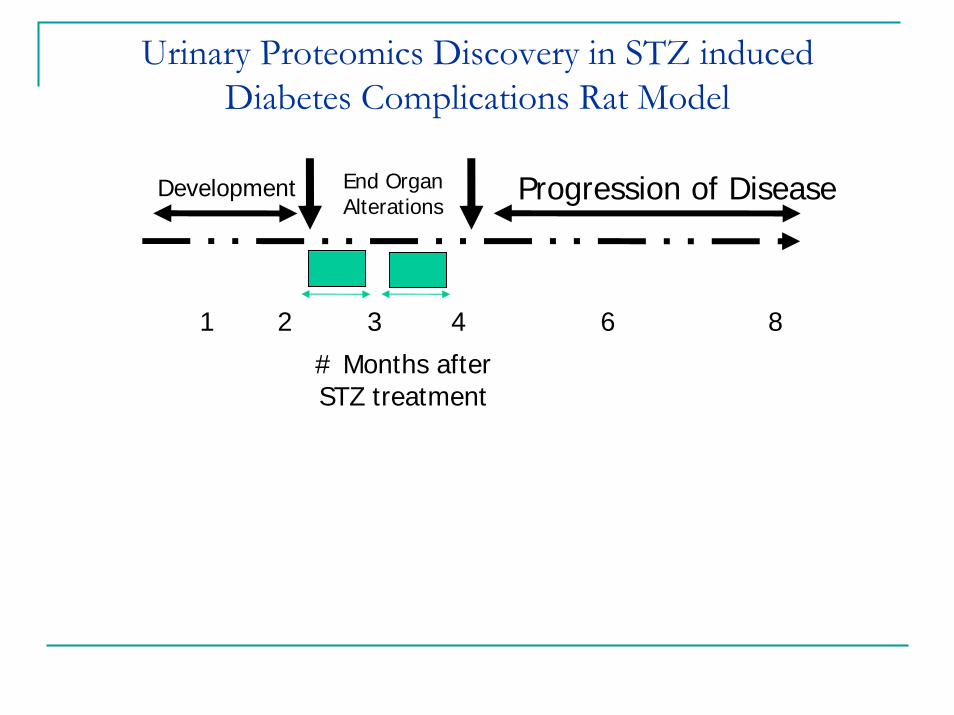
Urinary Proteomics Discovery in STZ induced Diabetes Complications Rat Model
3 day 10 day 1 month 2 monthControl 1 3 2 3
STZ Treated 3 4 4 3
1 2 3 4 6 8
Development Progression of DiseaseEnd Organ Alterations
# Months after STZ treatment
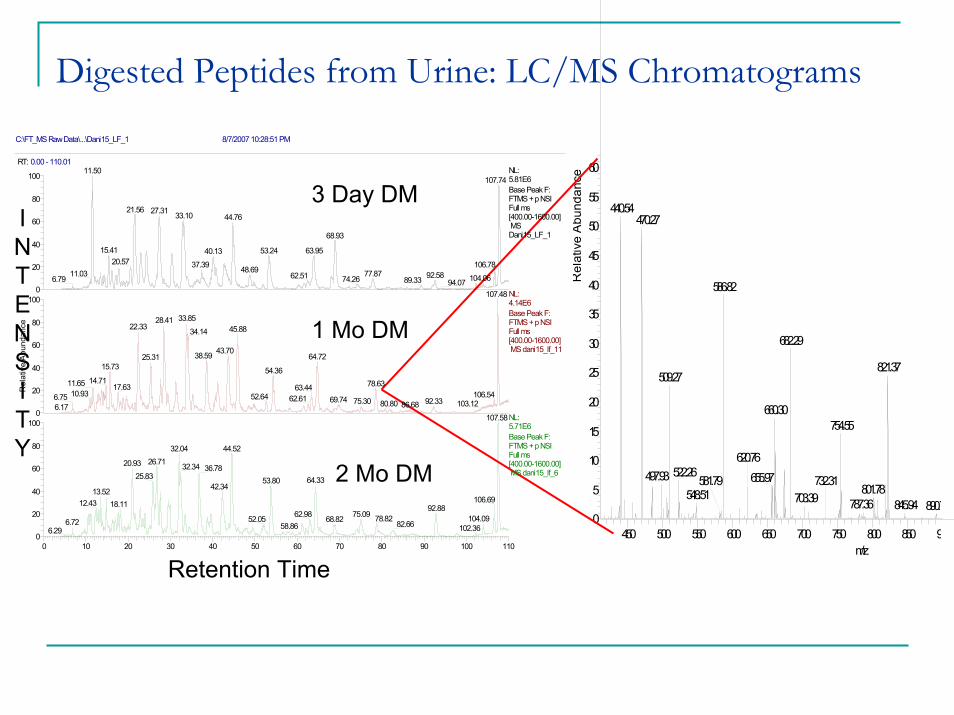
Digested Peptides from Urine: LC/MS Chromatograms
INTENSITY
450 500 550 600 650 700 750 800 850 90m/z
0
5
10
15
20
25
30
35
40
45
50
55
60
Rel
ativ
e A
bund
ance
440.54470.27
586.82
682.29
821.37509.27
660.30754.55
522.26497.93 655.97620.76
801.78548.51 703.39581.79
787.36 845.94 890.7
732.312 Mo DM
1 Mo DM
3 Day DM
C:\FT_MS Raw Data\...\Dani15_LF_1 8/7/2007 10:28:51 PM
RT: 0.00 - 110.01
0 10 20 30 40 50 60 70 80 90 100 110Time (min)
0
20
40
60
80
1000
20
40
60
80
100
Rel
ativ
e A
bund
ance
0
20
40
60
80
10011.50
107.74
21.56 27.31 33.10 44.76
68.93
15.41 63.9553.2440.1320.57 37.39 106.7848.69 77.8711.03 92.5862.51 104.066.79 74.26 89.33 94.07
107.48
33.8528.4122.33 45.8834.14
43.7038.59 64.7225.3115.73 54.36
14.7111.65 78.6317.63 63.4410.93 106.5452.646.75 62.61 69.74 92.3375.30 103.1280.80 86.686.17
107.58
44.5232.0426.7120.93 32.34 36.78
25.83 64.3353.8042.3413.52
106.6912.43 18.11 92.8875.0962.98 78.82 104.0968.8252.056.72 82.6658.86 102.366.29
NL:5.81E6Base Peak F: FTMS + p NSI Full ms [400.00-1600.00] MS Dani15_LF_1
NL:4.14E6Base Peak F: FTMS + p NSI Full ms [400.00-1600.00] MS dani15_lf_11
NL:5.71E6Base Peak F: FTMS + p NSI Full ms [400.00-1600.00] MS dani15_lf_6
Retention Time
Summary Statistics for Diabetic ComplicationProteomics Discovery
2868 chromatographic peaks were generated812 of these received a peptide assignment 494 peptides passed QC filter and were analyzed by ANOVAOut of the 494 peptides, 64 of these had p-values of <0.05 for interaction (time & treatment)These peptides represent approximately 30 different proteins that:showed progression upon treatment
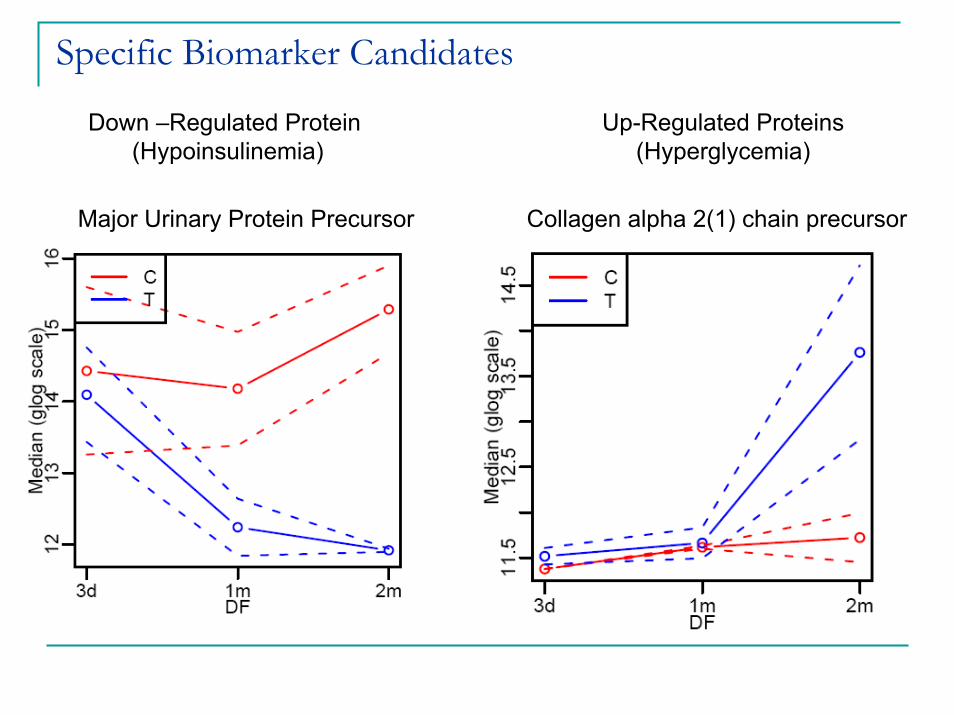
Specific Biomarker Candidates
Down –Regulated Protein (Hypoinsulinemia)
Up-Regulated Proteins (Hyperglycemia)
Major Urinary Protein Precursor Collagen alpha 2(1) chain precursor
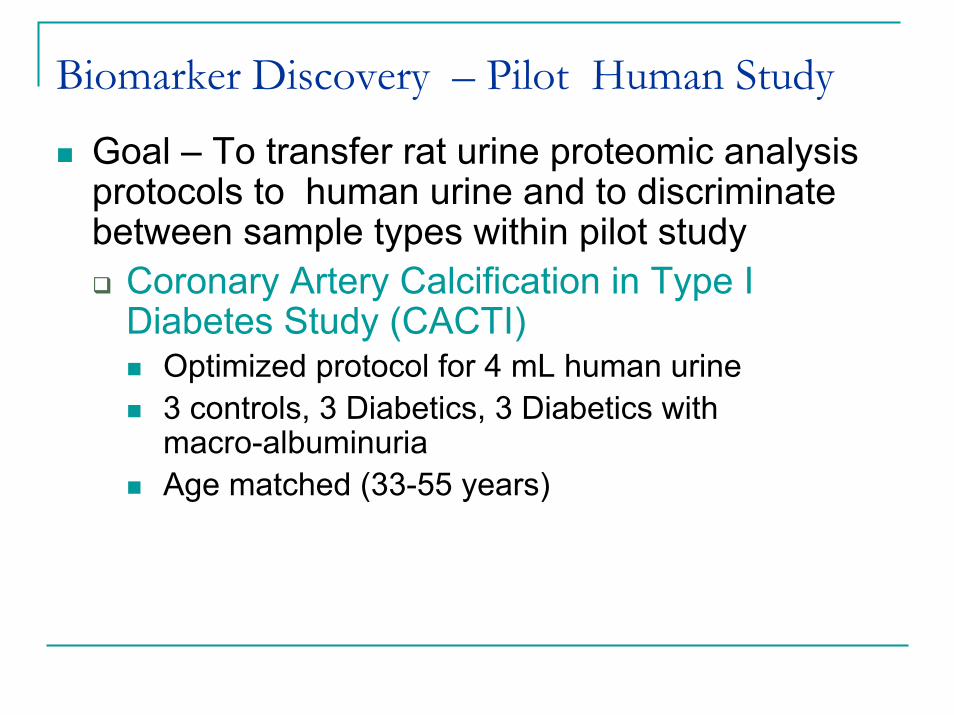
Biomarker Discovery – Pilot Human Study
Goal – To transfer rat urine proteomic analysis protocols to human urine and to discriminate between sample types within pilot study
Coronary Artery Calcification in Type I Diabetes Study (CACTI)
Optimized protocol for 4 mL human urine3 controls, 3 Diabetics, 3 Diabetics with macro-albuminuriaAge matched (33-55 years)
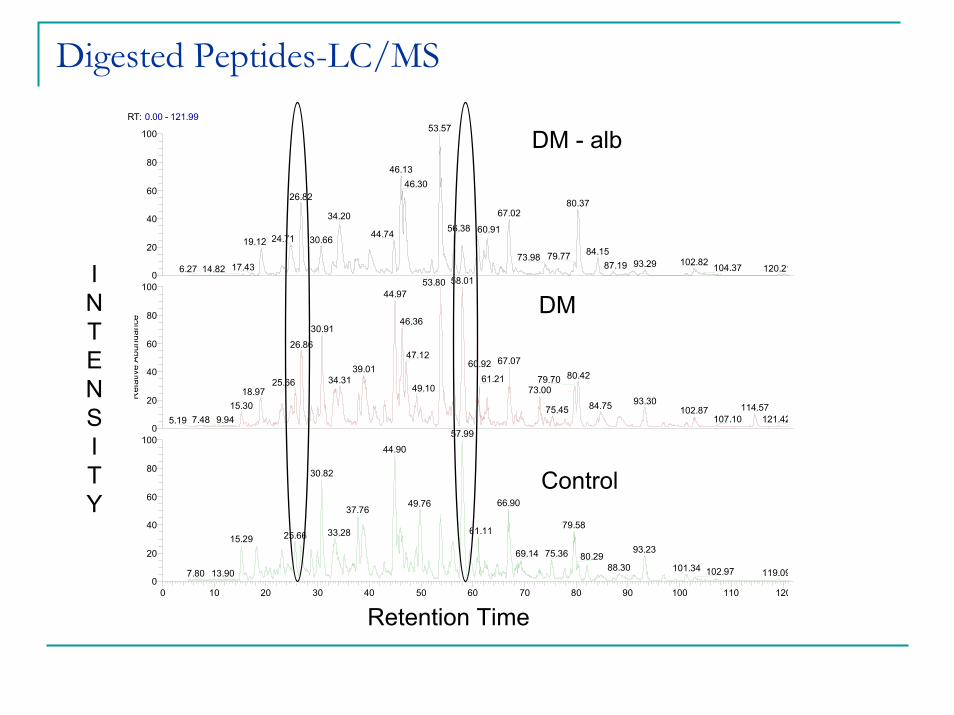
Digested Peptides-LC/MS
DM - alb
DM
Control
RT: 0.00 - 121.99
0 10 20 30 40 50 60 70 80 90 100 110 120Time (min)
0
20
40
60
80
1000
20
40
60
80
100
Rel
ativ
e A
bund
ance
0
20
40
60
80
100 53.57
46.1346.30
26.8280.37
67.0234.2056.38 60.9144.7424.71 30.6619.12
84.1579.7773.98 102.8293.2987.1917.43 104.37 120.2114.826.2758.0153.80
44.97
46.3630.91
26.8647.12 67.0760.9239.01
80.4261.21 79.7034.3125.66 49.10 73.0018.9793.3084.7515.30 114.5775.45 102.87
107.10 121.427.48 9.945.1957.99
44.90
30.82
66.9049.7637.76
79.5861.1133.2825.6615.2993.2369.14 75.36 80.29
88.30 101.34 102.97 119.0913.907.80
Retention Time
INTENSITY
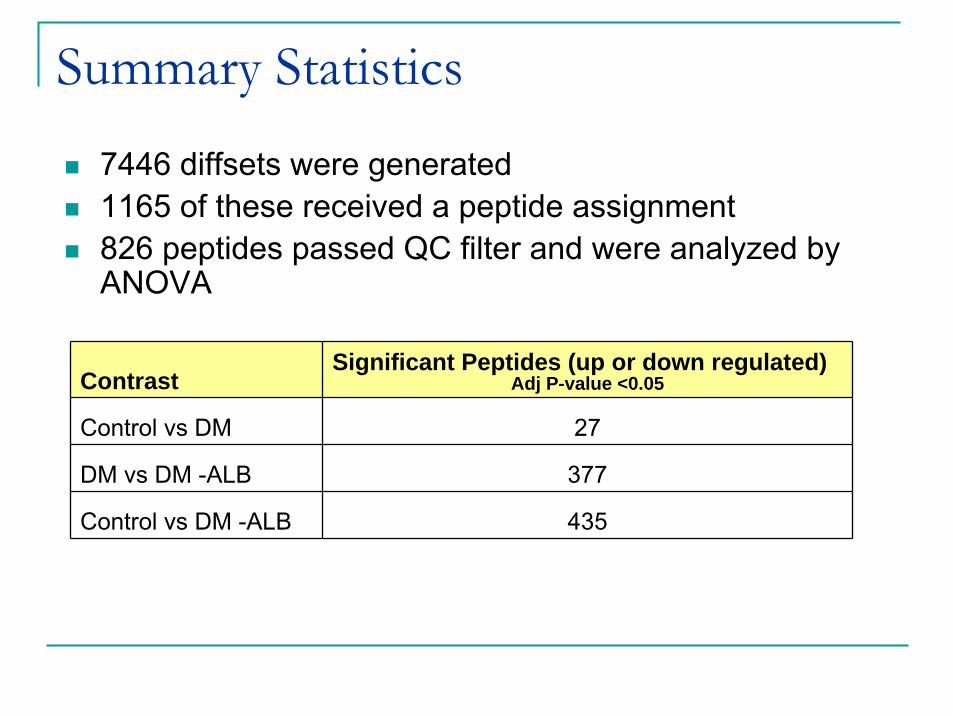
Summary Statistics
7446 diffsets were generated1165 of these received a peptide assignment 826 peptides passed QC filter and were analyzed by ANOVA
Contrast Significant Peptides (up or down regulated)
Adj P-value <0.05
Control vs DM 27
DM vs DM -ALB 377
Control vs DM -ALB 435
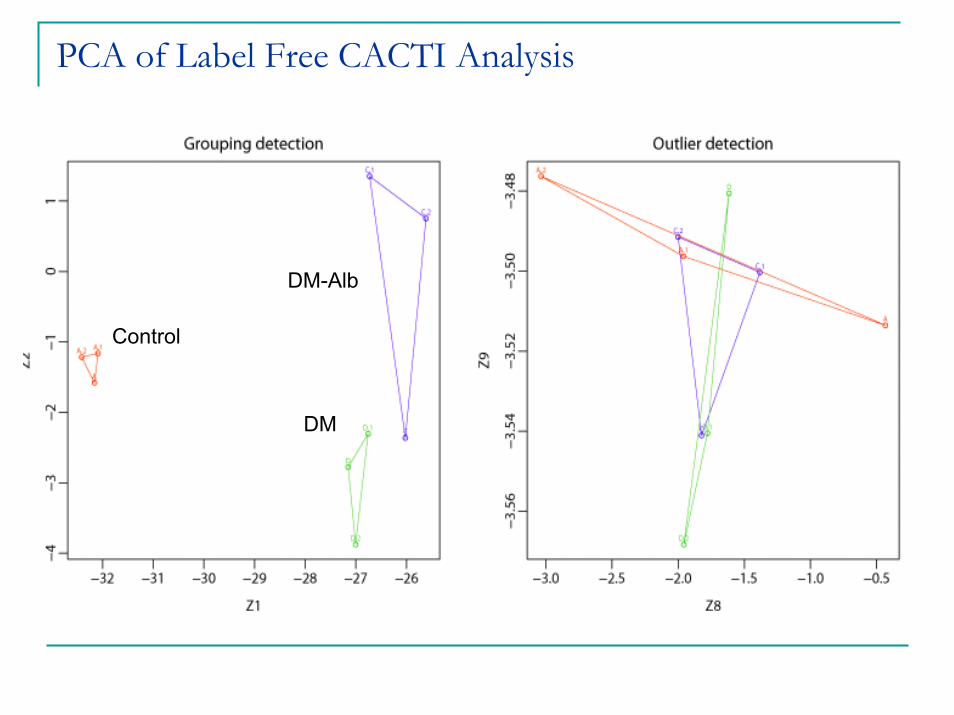
PCA of Label Free CACTI Analysis
DM-Alb
Control
DM
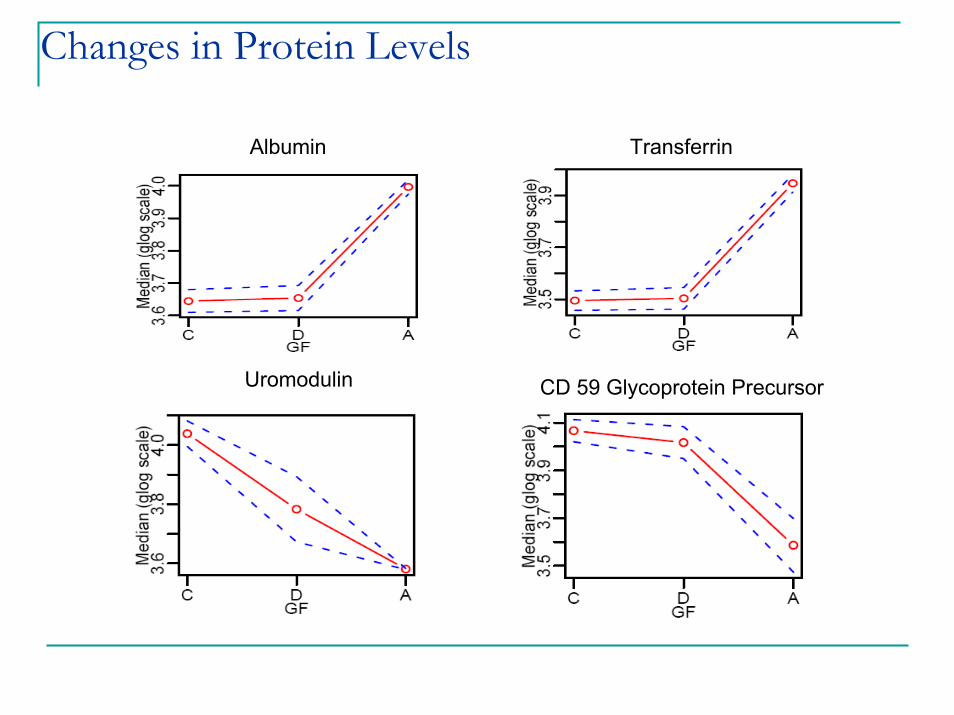
Changes in Protein Levels
Albumin Transferrin
CD 59 Glycoprotein PrecursorUromodulin
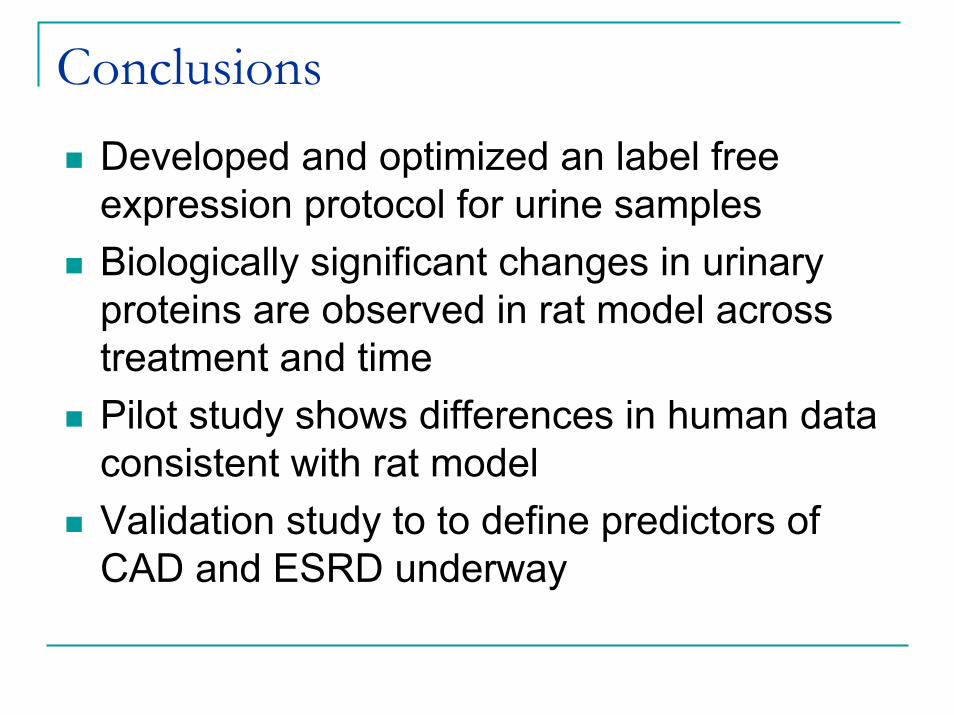
ConclusionsDeveloped and optimized an label free expression protocol for urine samplesBiologically significant changes in urinary proteins are observed in rat model across treatment and timePilot study shows differences in human data consistent with rat modelValidation study to to define predictors of CAD and ESRD underway
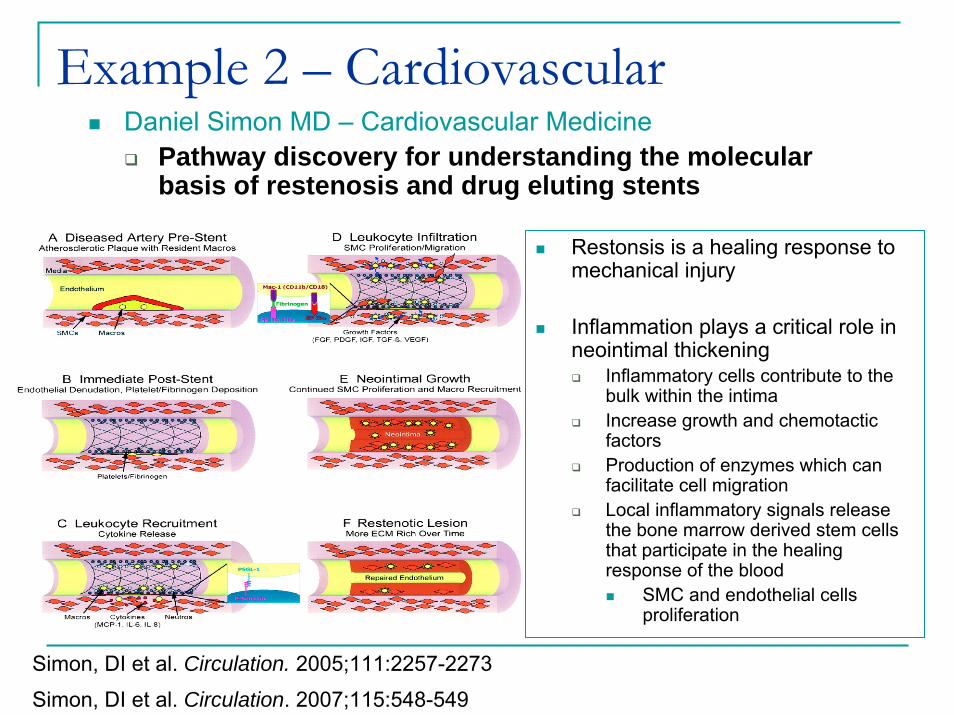
Example 2 – CardiovascularDaniel Simon MD – Cardiovascular Medicine
Pathway discovery for understanding the molecular basis of restenosis and drug eluting stents
Restonsis is a healing response to mechanical injury
Inflammation plays a critical role in neointimal thickening
Inflammatory cells contribute to the bulk within the intimaIncrease growth and chemotactic factorsProduction of enzymes which can facilitate cell migrationLocal inflammatory signals release the bone marrow derived stem cells that participate in the healing response of the blood
SMC and endothelial cells proliferation
Simon, DI et al. Circulation. 2005;111:2257-2273
Simon, DI et al. Circulation. 2007;115:548-549
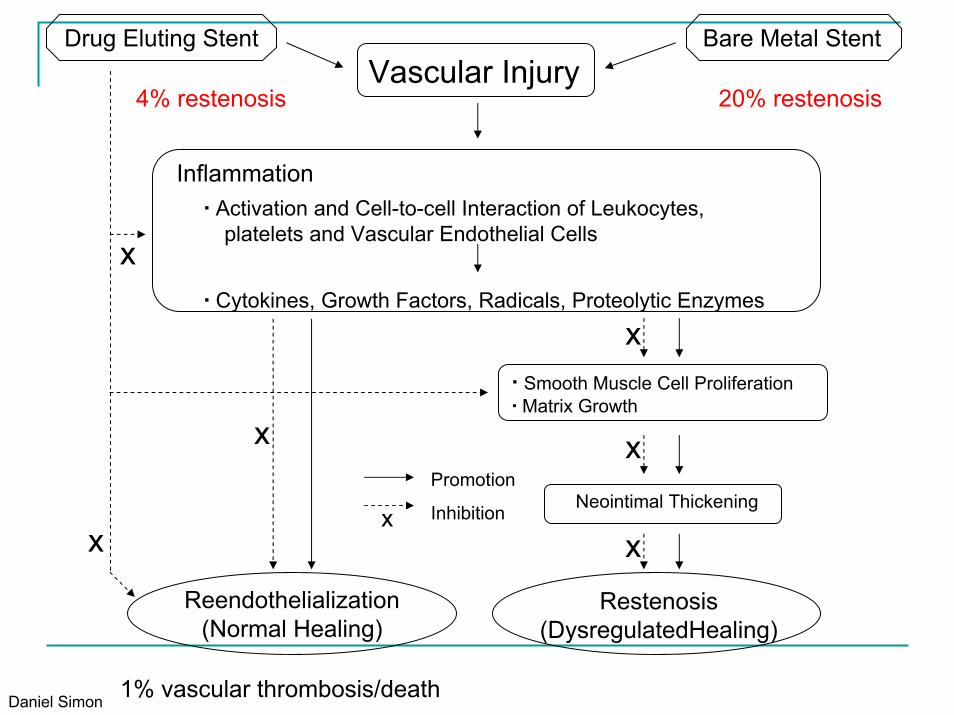
Restenosis(DysregulatedHealing)
▪ Smooth Muscle Cell Proliferation▪ Matrix Growth
Neointimal Thickening
Reendothelialization(Normal Healing)
Inflammation▪ Activation and Cell-to-cell Interaction of Leukocytes,
platelets and Vascular Endothelial Cells
▪ Cytokines, Growth Factors, Radicals, Proteolytic Enzymes
Drug Eluting Stent
x
x
x
x
xxx
Vascular InjuryBare Metal Stent
Promotion
Inhibition
Daniel Simon
20% restenosis
1% vascular thrombosis/death
4% restenosis
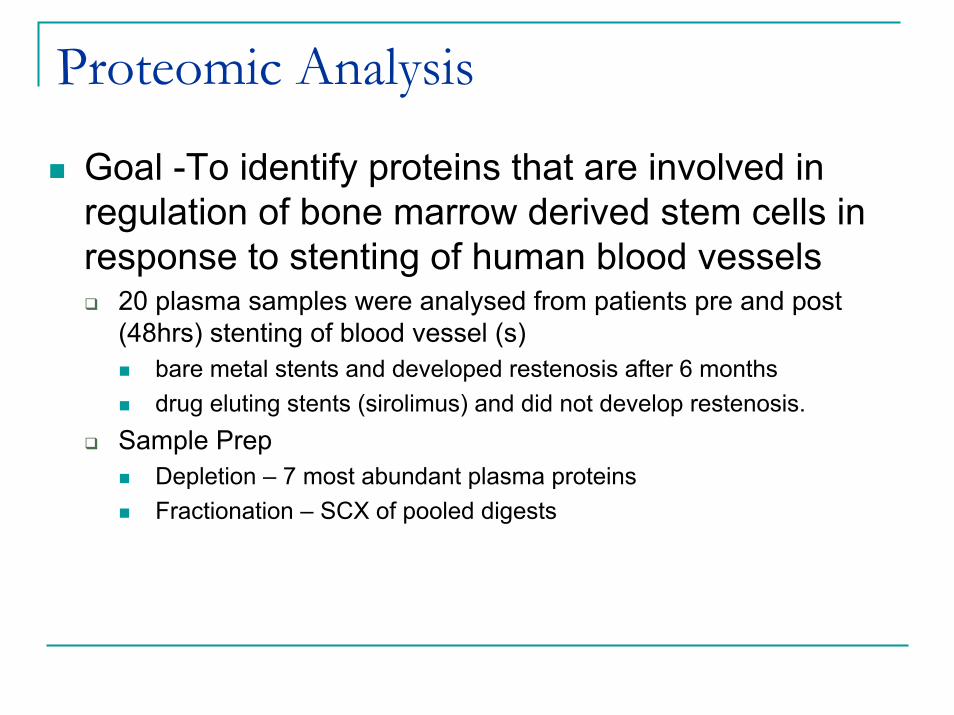
Proteomic Analysis
Goal -To identify proteins that are involved in regulation of bone marrow derived stem cells in response to stenting of human blood vessels
20 plasma samples were analysed from patients pre and post (48hrs) stenting of blood vessel (s)
bare metal stents and developed restenosis after 6 monthsdrug eluting stents (sirolimus) and did not develop restenosis.
Sample Prep Depletion – 7 most abundant plasma proteinsFractionation – SCX of pooled digests
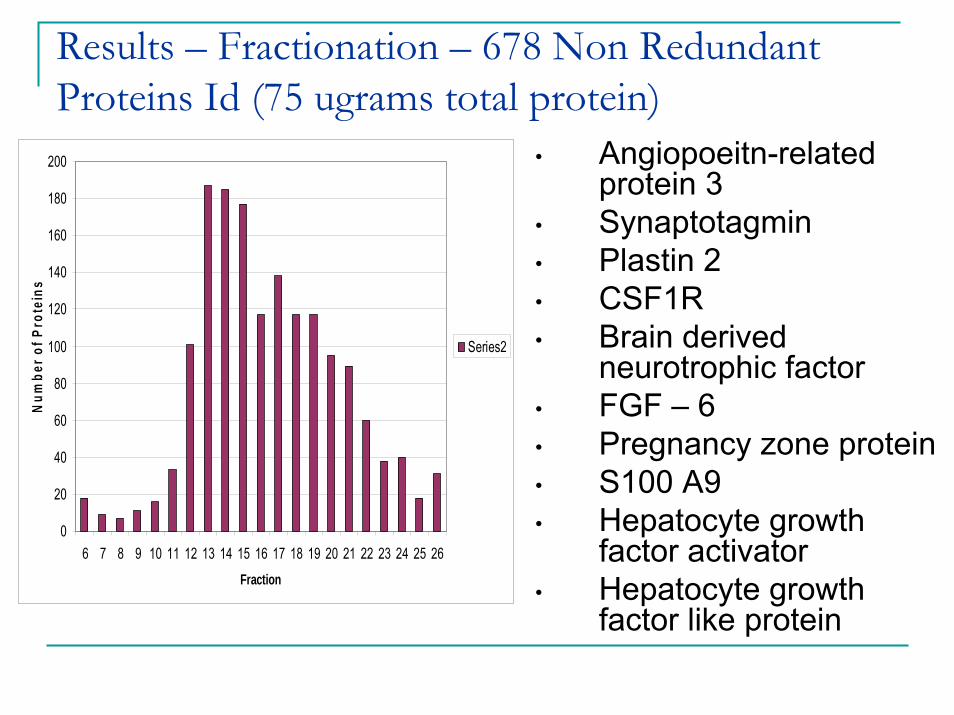
Results – Fractionation – 678 Non Redundant Proteins Id (75 ugrams total protein)
0
20
40
60
80
100
120
140
160
180
200
6 7 8 9 10 11 12 13 14 15 16 17 18 19 20 21 22 23 24 25 26Fraction
Num
ber o
f Pro
tein
s
Series2
• Angiopoeitn-related protein 3
• Synaptotagmin• Plastin 2• CSF1R• Brain derived
neurotrophic factor• FGF – 6• Pregnancy zone protein• S100 A9• Hepatocyte growth
factor activator• Hepatocyte growth
factor like protein
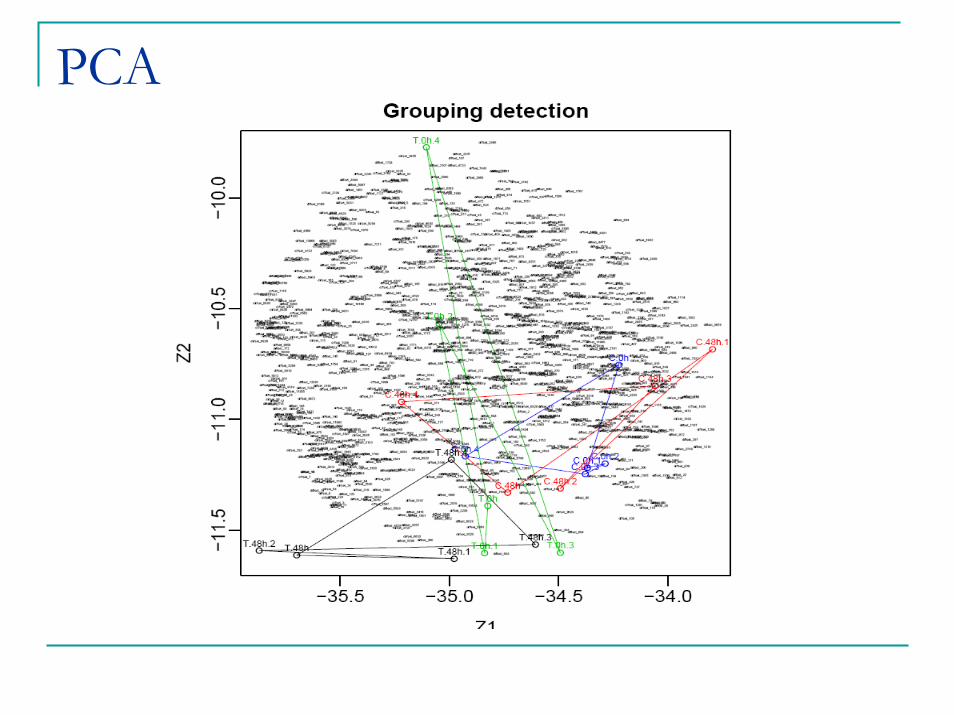
PCA
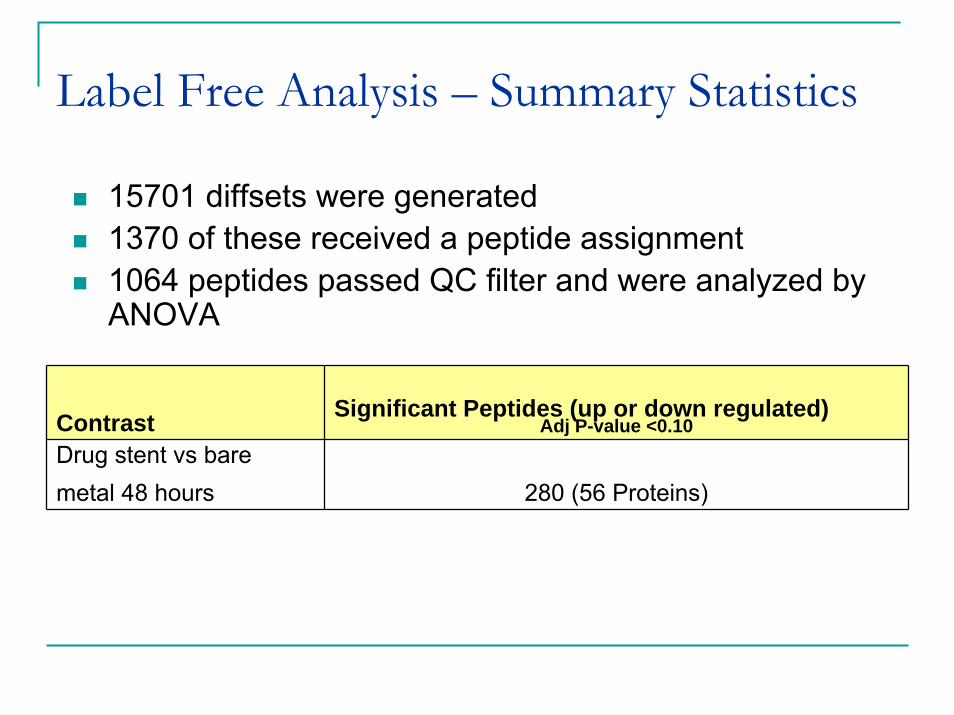
Label Free Analysis – Summary Statistics
Contrast Significant Peptides (up or down regulated) Adj P-value <0.10
Drug stent vs bare metal 48 hours 280 (56 Proteins)
15701 diffsets were generated1370 of these received a peptide assignment 1064 peptides passed QC filter and were analyzed by ANOVA
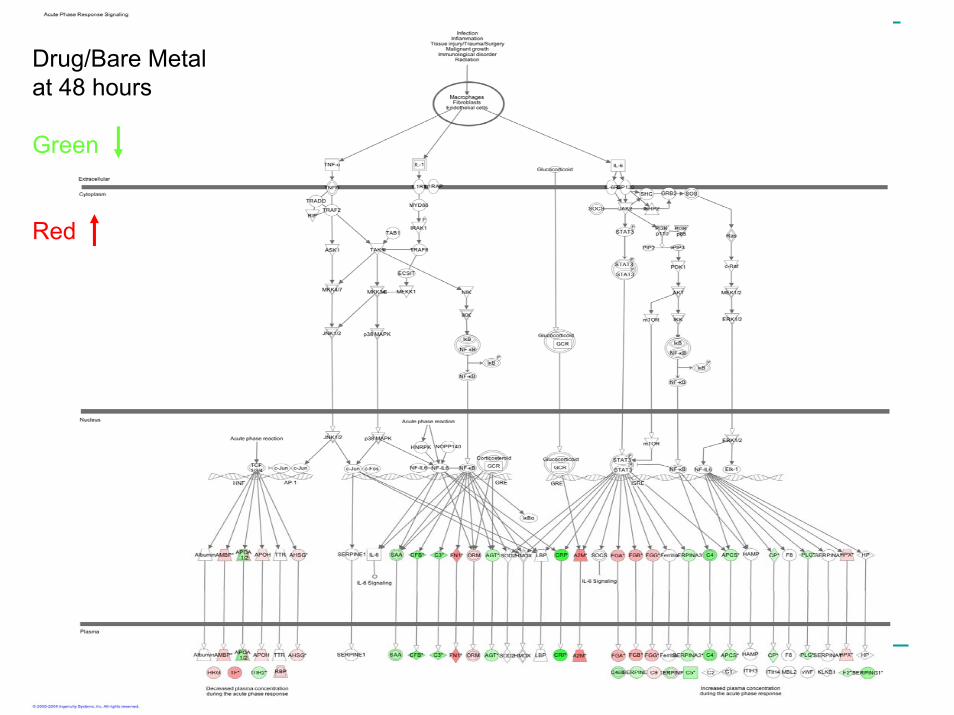
Drug/Bare Metal at 48 hours
Green
Red
Follow Up
Two animal models to evaluate importance of CRP and complement pathway in recruitment of stem cell progenitors to vessel healing
Femoral hind limb artery ischemiaCRP knock in mice – increase recruitmentComplement knock out mice – decrease recruitment
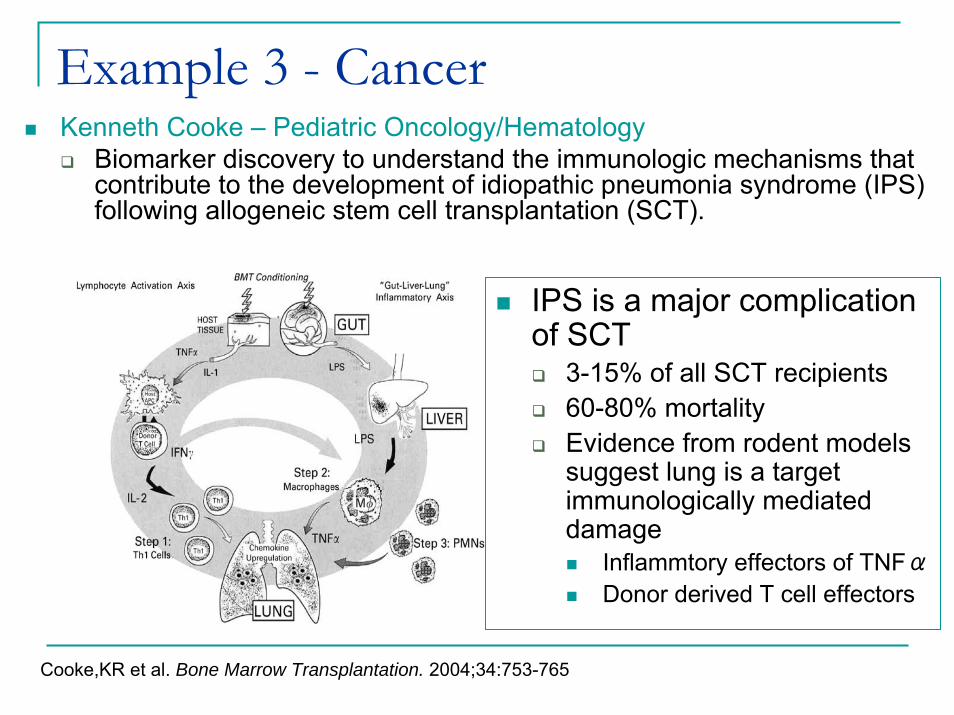
Example 3 - CancerKenneth Cooke – Pediatric Oncology/Hematology
Biomarker discovery to understand the immunologic mechanisms that contribute to the development of idiopathic pneumonia syndrome (IPS) following allogeneic stem cell transplantation (SCT).
IPS is a major complication of SCT
3-15% of all SCT recipients60-80% mortalityEvidence from rodent models suggest lung is a target immunologically mediated damage
Inflammtory effectors of TNFαDonor derived T cell effectors
Cooke,KR et al. Bone Marrow Transplantation. 2004;34:753-765
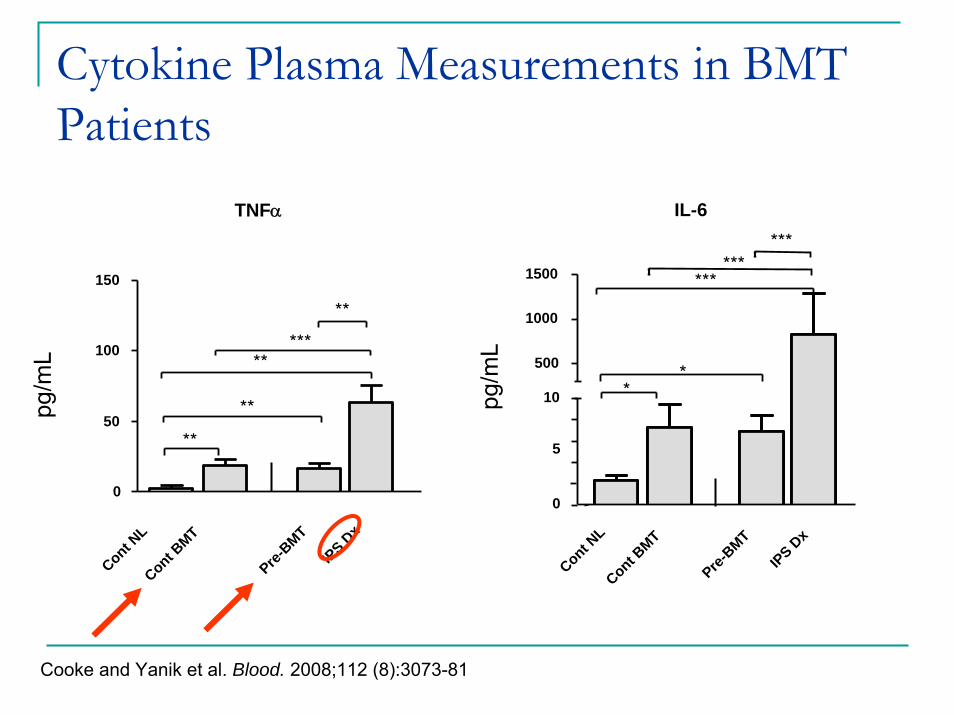
Cytokine Plasma Measurements in BMT Patients
TNFα
Cont NL
Cont BMT
Pre-BMT
IPS Dx
0
50
100
150
**
*****
**
**
pg/m
L
IL-6
Cont NL
Cont BMT
0
5
10
500
1000
1500 ***
**
******
Pre-BMT
IPS Dx
pg/m
L
Cooke and Yanik et al. Blood. 2008;112 (8):3073-81
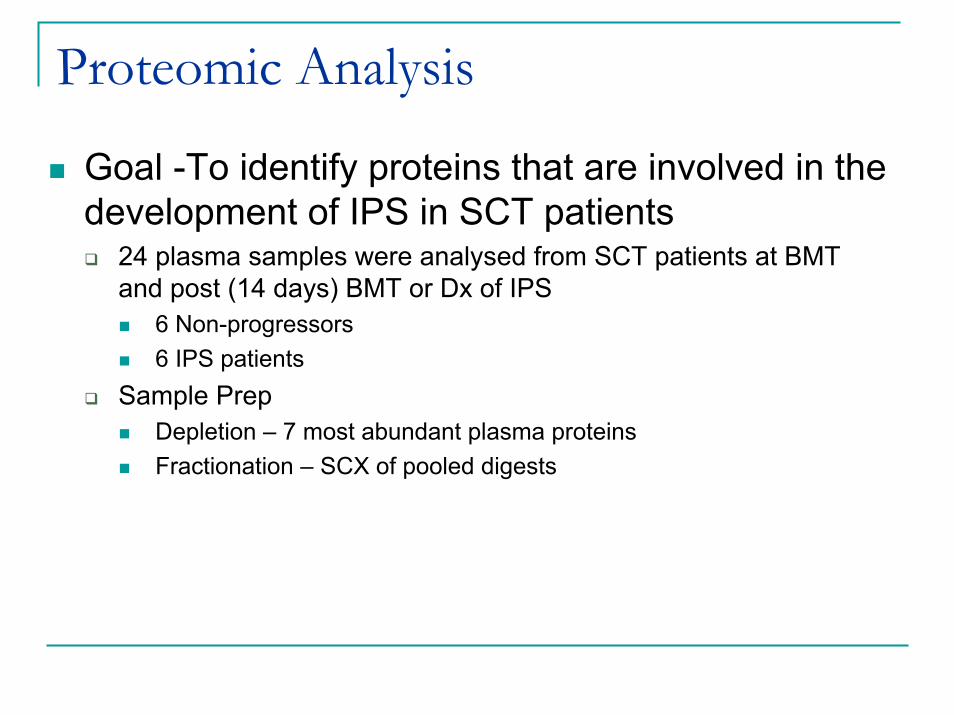
Proteomic Analysis
Goal -To identify proteins that are involved in the development of IPS in SCT patients
24 plasma samples were analysed from SCT patients at BMT and post (14 days) BMT or Dx of IPS
6 Non-progressors6 IPS patients
Sample Prep Depletion – 7 most abundant plasma proteinsFractionation – SCX of pooled digests
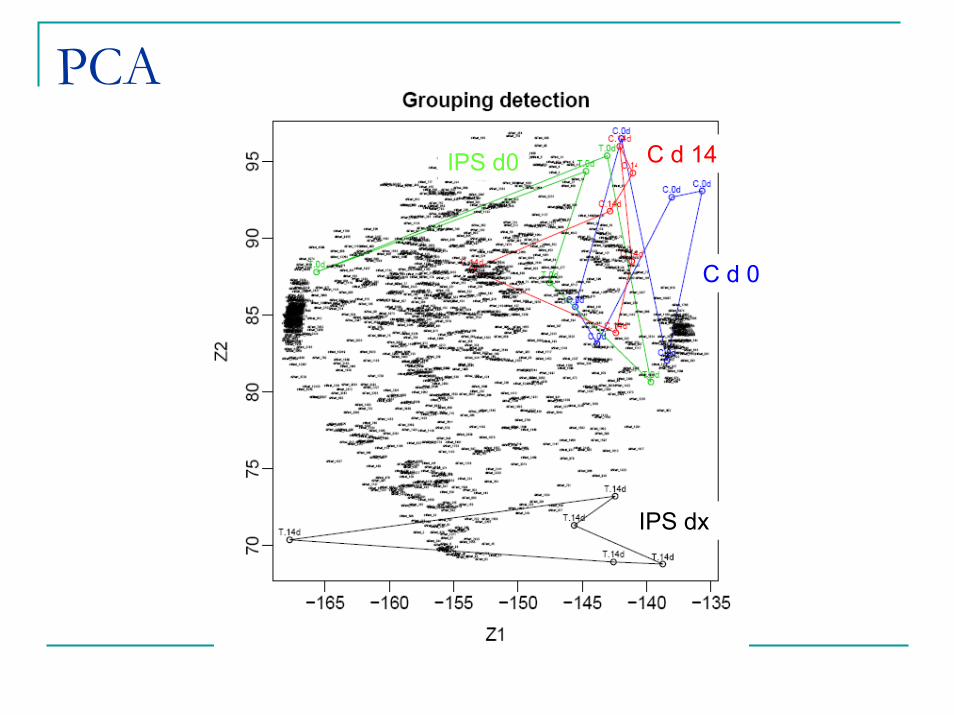
PCA
IPS dx
IPS d0
C d 0
C d 14
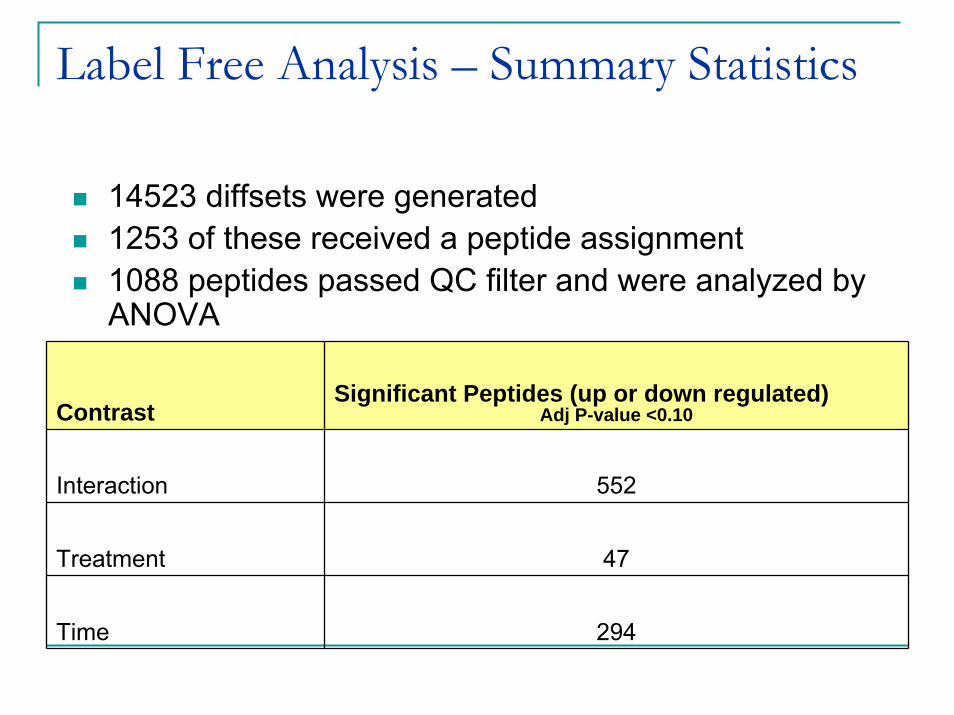
Label Free Analysis – Summary Statistics
14523 diffsets were generated1253 of these received a peptide assignment 1088 peptides passed QC filter and were analyzed by ANOVA
Contrast Significant Peptides (up or down regulated)
Adj P-value <0.10
Interaction 552
Treatment 47
Time 294
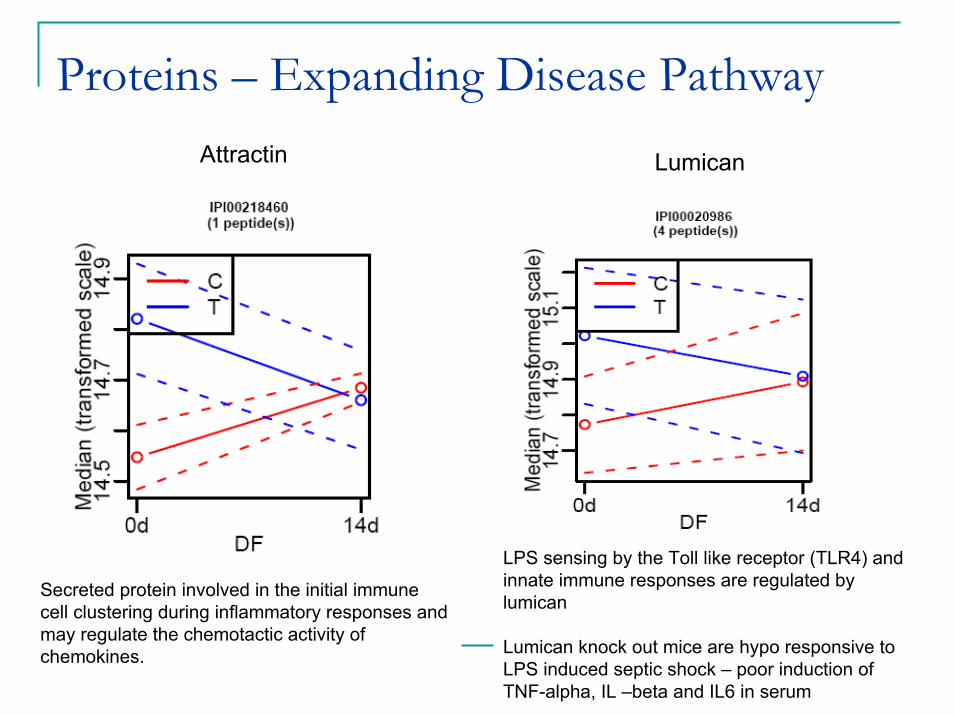
Proteins – Expanding Disease PathwayAttractin Lumican
Secreted protein involved in the initial immune cell clustering during inflammatory responses and may regulate the chemotactic activity of chemokines.
LPS sensing by the Toll like receptor (TLR4) and innate immune responses are regulated by lumican
Lumican knock out mice are hypo responsive to LPS induced septic shock – poor induction of TNF-alpha, IL –beta and IL6 in serum
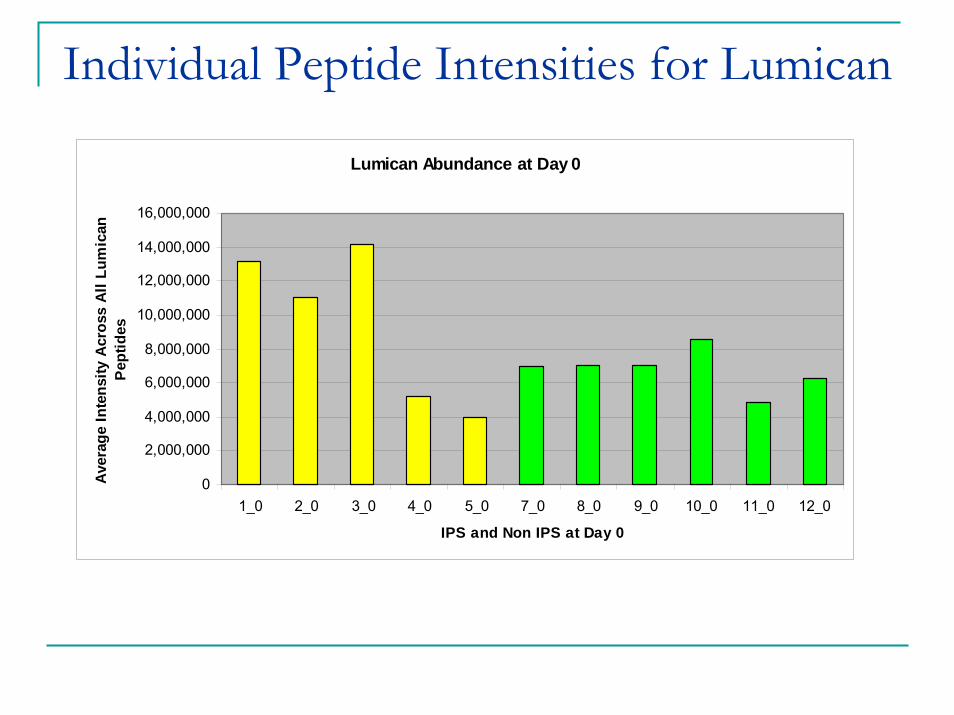
Individual Peptide Intensities for Lumican
Lumican Abundance at Day 0
0
2,000,000
4,000,000
6,000,000
8,000,000
10,000,000
12,000,000
14,000,000
16,000,000
1_0 2_0 3_0 4_0 5_0 7_0 8_0 9_0 10_0 11_0 12_0
IPS and Non IPS at Day 0
Ave
rage
Inte
nsity
Acr
oss
All L
umic
an
Pept
ides
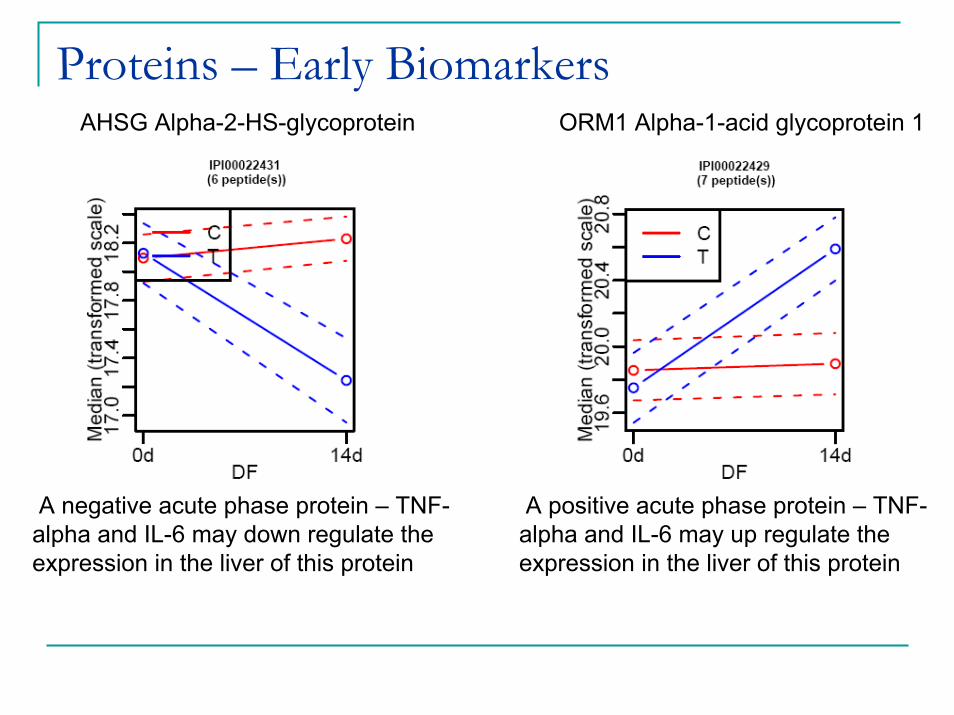
Proteins – Early BiomarkersAHSG Alpha-2-HS-glycoprotein ORM1 Alpha-1-acid glycoprotein 1
A positive acute phase protein – TNF-alpha and IL-6 may up regulate the expression in the liver of this protein
A negative acute phase protein – TNF-alpha and IL-6 may down regulate the expression in the liver of this protein
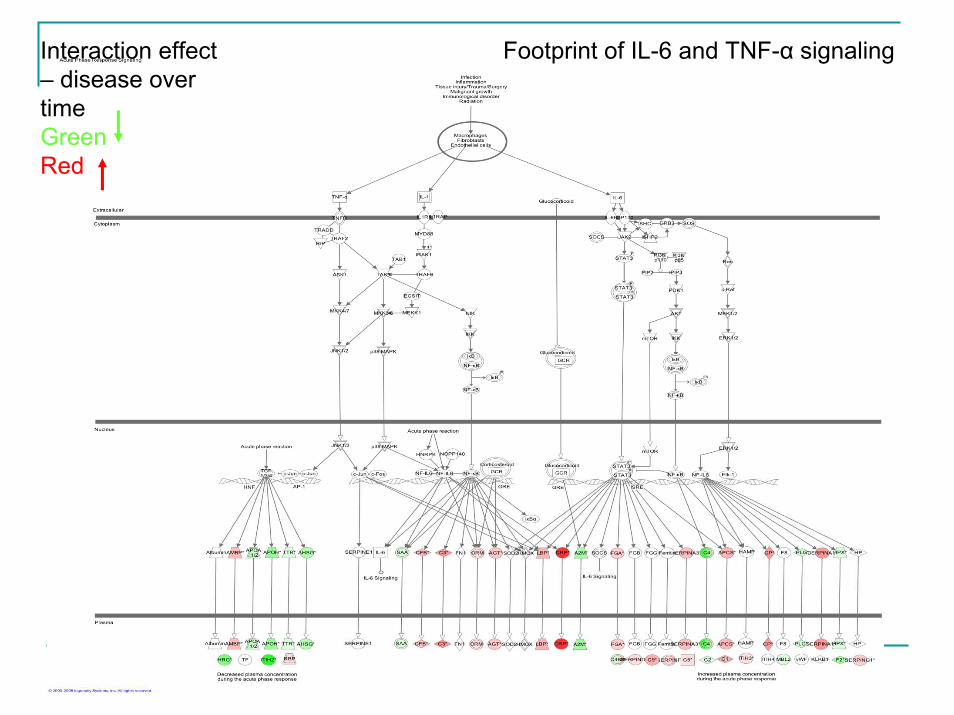
Footprint of IL-6 and TNF-α signalingInteraction effect – disease over timeGreen Red
Follow Up
Validation of Lumican by WesternInvestigate knock out of rodent model of disease
Additional network analysis of using Pathway Studio for further data miningAnalysis including day 7 samples to detect potential early biomarkers id’d in initial analysis
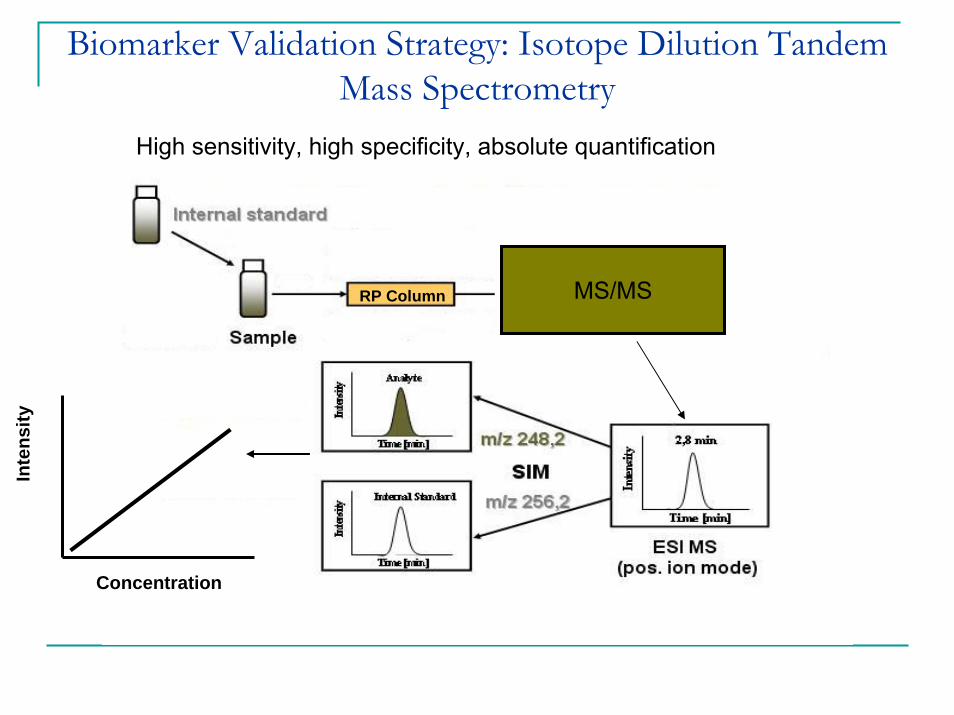
Inte
nsity
MS/MSRP Column
Concentration
Biomarker Validation Strategy: Isotope Dilution Tandem Mass Spectrometry
High sensitivity, high specificity, absolute quantification
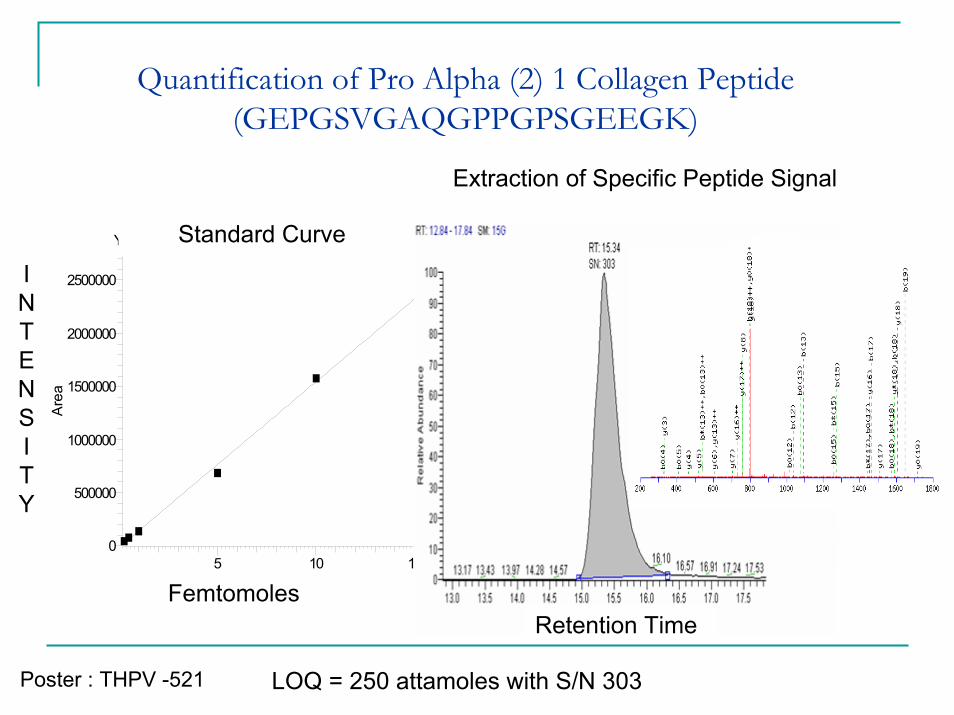
Quantification of Pro Alpha (2) 1 Collagen Peptide (GEPGSVGAQGPPGPSGEEGK)
ProalphacollagenY = -13012+155553*X R̂ 2 = 0.9956 W: Equal
5 10 15fmole
0
500000
1000000
1500000
2000000
2500000
Are
a
LOQ = 250 attamoles with S/N 303
Femtomoles
INTENSITY
Retention Time
Standard Curve
Extraction of Specific Peptide Signal
Poster : THPV -521
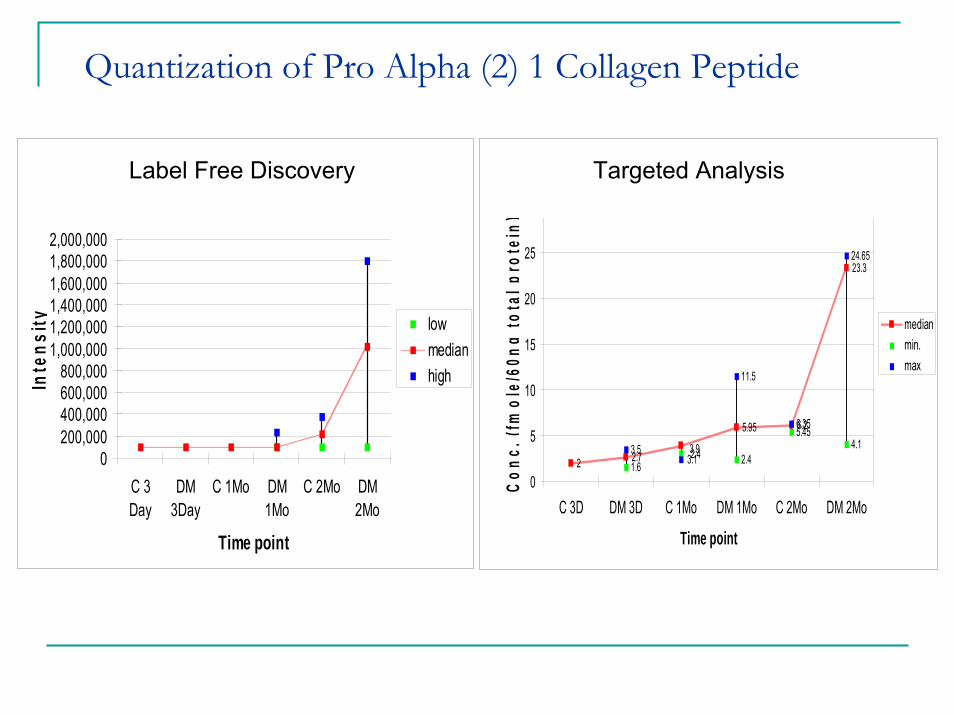
Quantization of Pro Alpha (2) 1 Collagen Peptide
Label Free Quantification - Proalpha(2) 1 collagen Peptide
0200,000400,000600,000800,000
1,000,0001,200,0001,400,0001,600,0001,800,0002,000,000
C 3Day
DM3Day
C 1Mo DM1Mo
C 2Mo DM2Mo
Time point
Inte
nsity low
medianhigh
SRM - Proalpha(2) 1 collagen Peptide
2 2.7
5.95 6.2
23.3
1.6 2.4
5.454.13.5
11.5
6.35
24.65
3.93.12.4
0
5
10
15
20
25
30
C 3D DM 3D C 1Mo DM 1Mo C 2Mo DM 2Mo
Time pointC
onc.
(fm
ole/
60ng
tota
l pro
tein
)
medianmin.max
Label Free Discovery Targeted Analysis
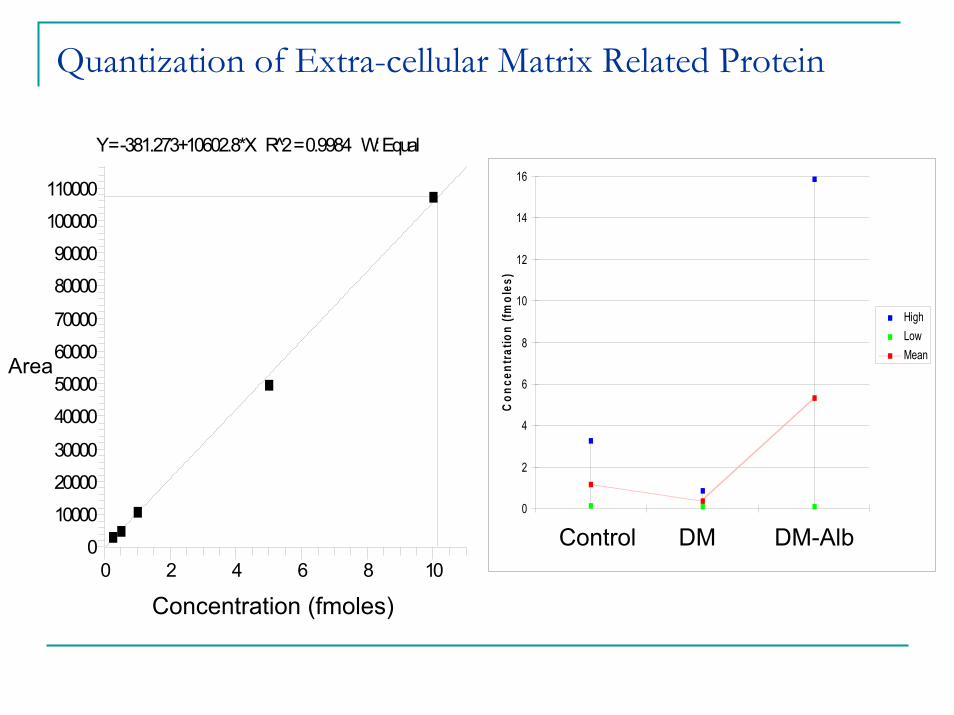
Quantization of Extra-cellular Matrix Related ProteinHuman_Proalpah
Y = -381.273+10602.8*X R̂2 = 0.9984 W: Equal
0 2 4 6 8 100
10000
20000
30000
40000
50000
60000
70000
80000
90000
100000
110000
Are
a
Area
Concentration (fmoles)
0
2
4
6
8
10
12
14
16
Control DM DM_Alb
Treatment
Con
cent
ratio
n (fm
oles
)
HighLow Mean
DM-AlbControl DM

AcknowledgementsMark Chance Ph.D Director Center for Bioinformatics and Proteomics
CollaboratorsDaniel Simon M.D.Ken Cooke M.D.CACTI
Marian Rewers, David Maahs and Janet Snell-Bergeon
Andrea Romani Ph.D
All Center Staff and Faculty
Jean Eudes Dazard Ph.DBiostatistics and experimental design
Rob M. Ewing Ph.DBioinformatics
Infochromics software
Label-Free Mass Spectrometry Analysis of Diabetic Cardiomyopathy
Chao Yuan02/05/2009
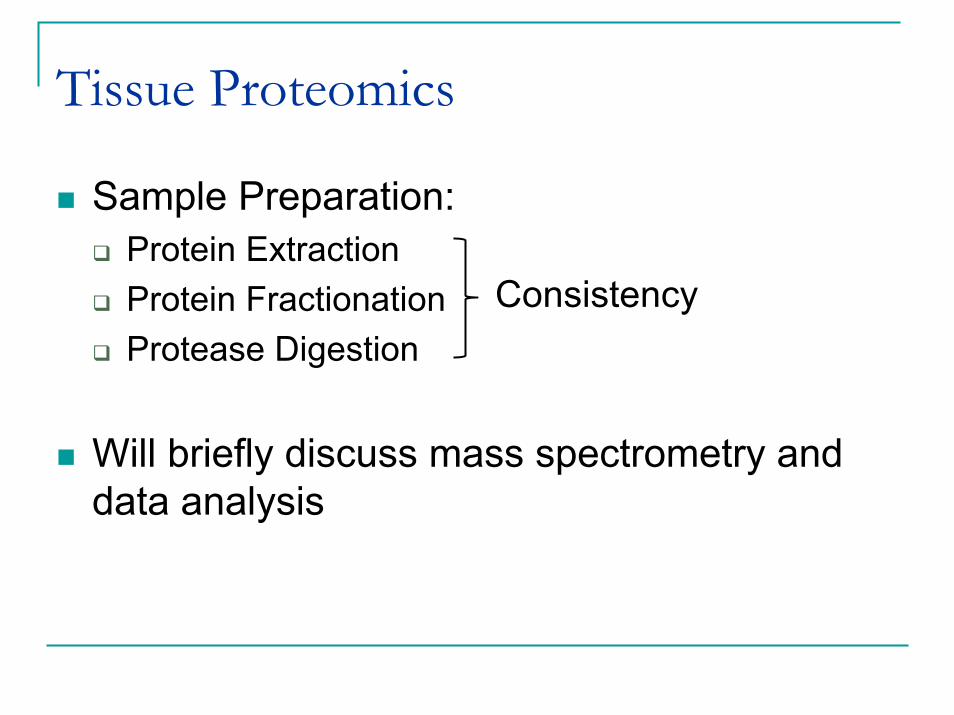
Tissue Proteomics
Sample Preparation:Protein ExtractionProtein FractionationProtease Digestion
Will briefly discuss mass spectrometry and data analysis
Consistency
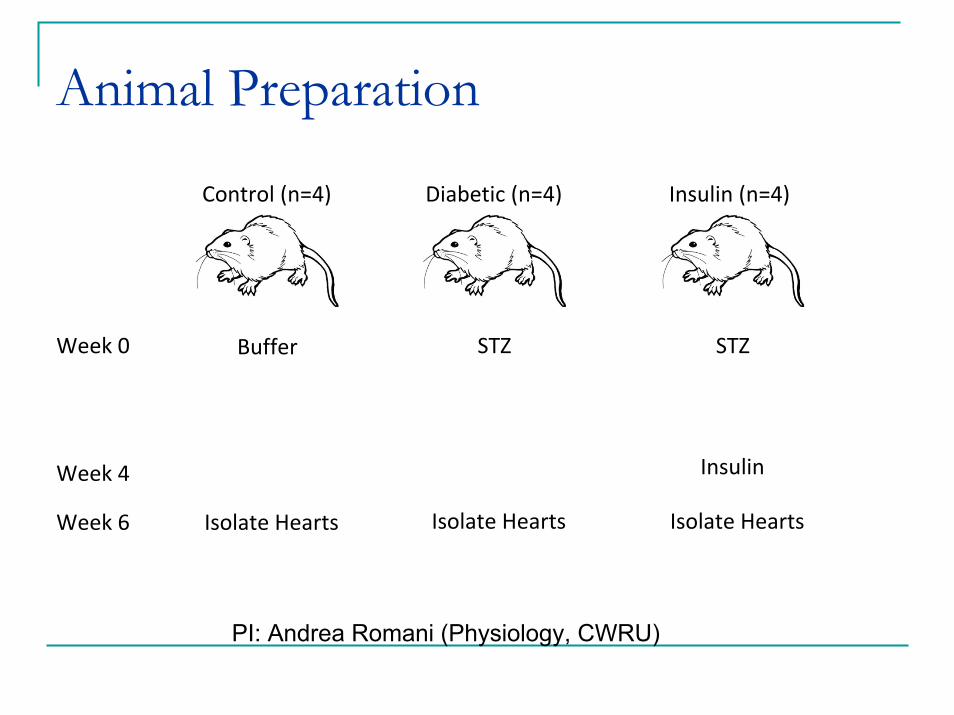
Animal Preparation
Control (n=4)
Buffer
Isolate Hearts
Diabetic (n=4)
STZ
Isolate Hearts
Insulin (n=4)
STZ
Insulin
Isolate Hearts
Week 0
Week 4
Week 6
PI: Andrea Romani (Physiology, CWRU)
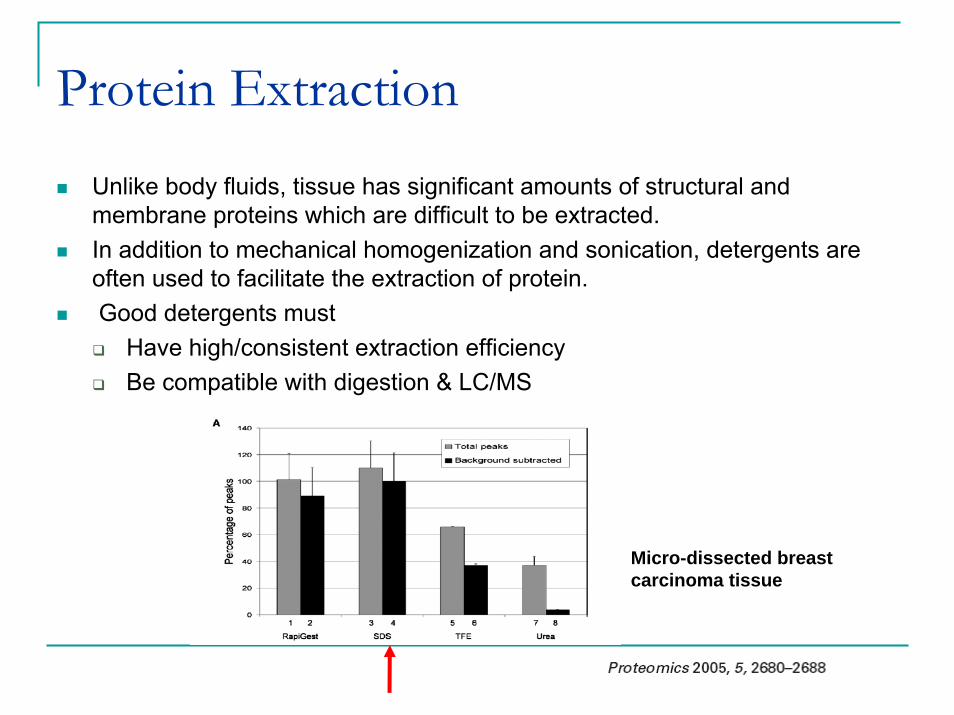
Protein ExtractionUnlike body fluids, tissue has significant amounts of structural and membrane proteins which are difficult to be extracted.In addition to mechanical homogenization and sonication, detergents are often used to facilitate the extraction of protein.Good detergents must
Have high/consistent extraction efficiencyBe compatible with digestion & LC/MS
Micro-dissected breast carcinoma tissue
Benefits of 1D-Gel
Compatible with most extraction buffers.
RemoveDetergentsAbundant protein speciesLow molecular weight contaminates
Protein fractionation
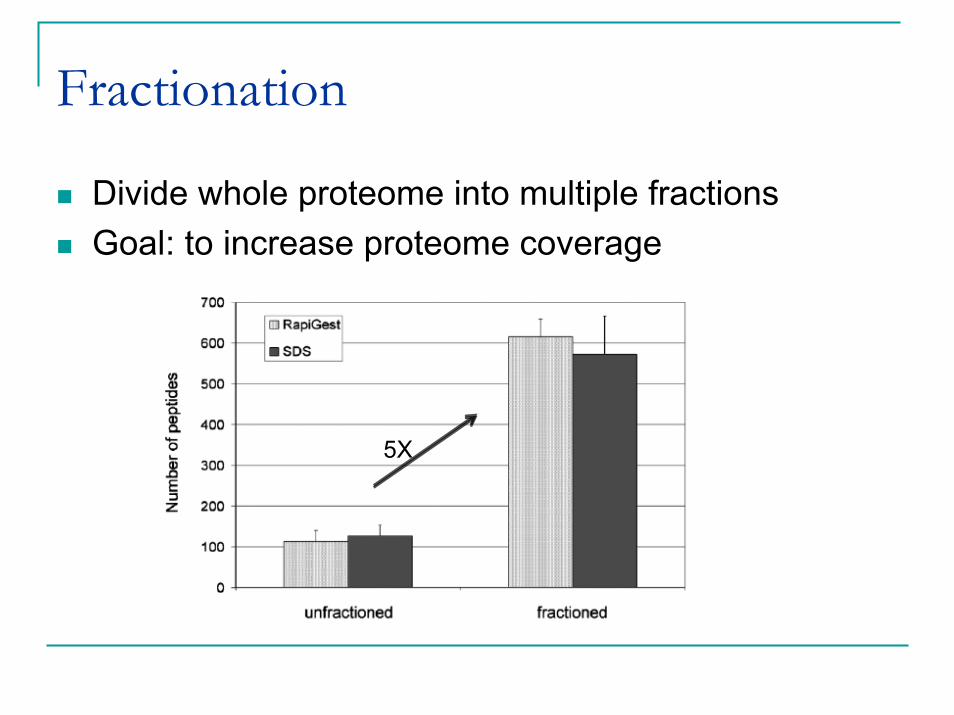
Fractionation
Divide whole proteome into multiple fractionsGoal: to increase proteome coverage
5X
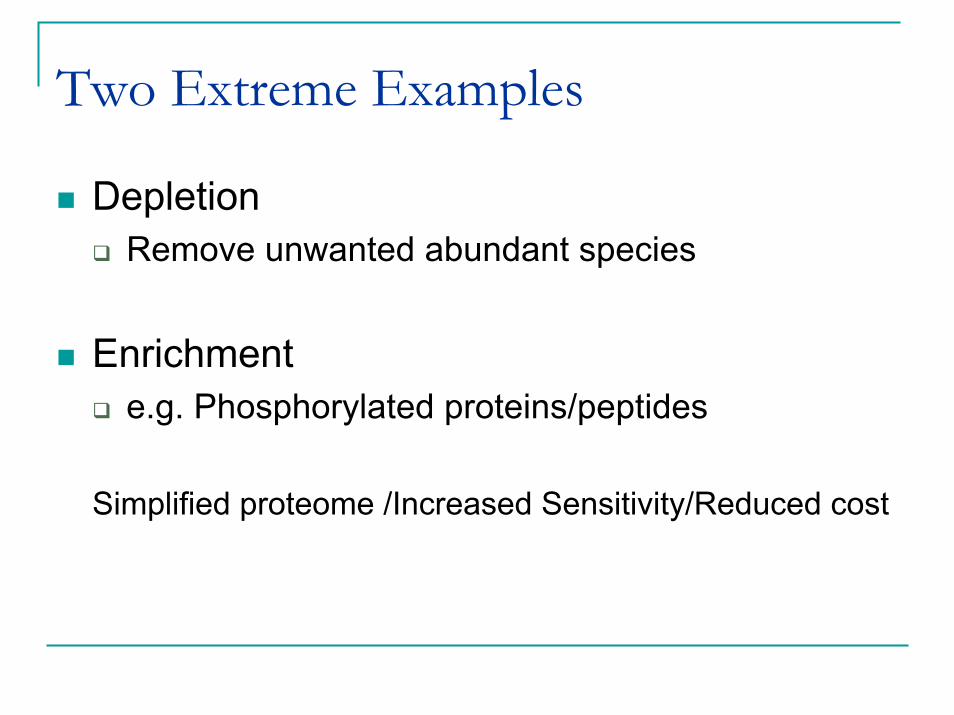
Two Extreme Examples
DepletionRemove unwanted abundant species
Enrichmente.g. Phosphorylated proteins/peptides
Simplified proteome /Increased Sensitivity/Reduced cost
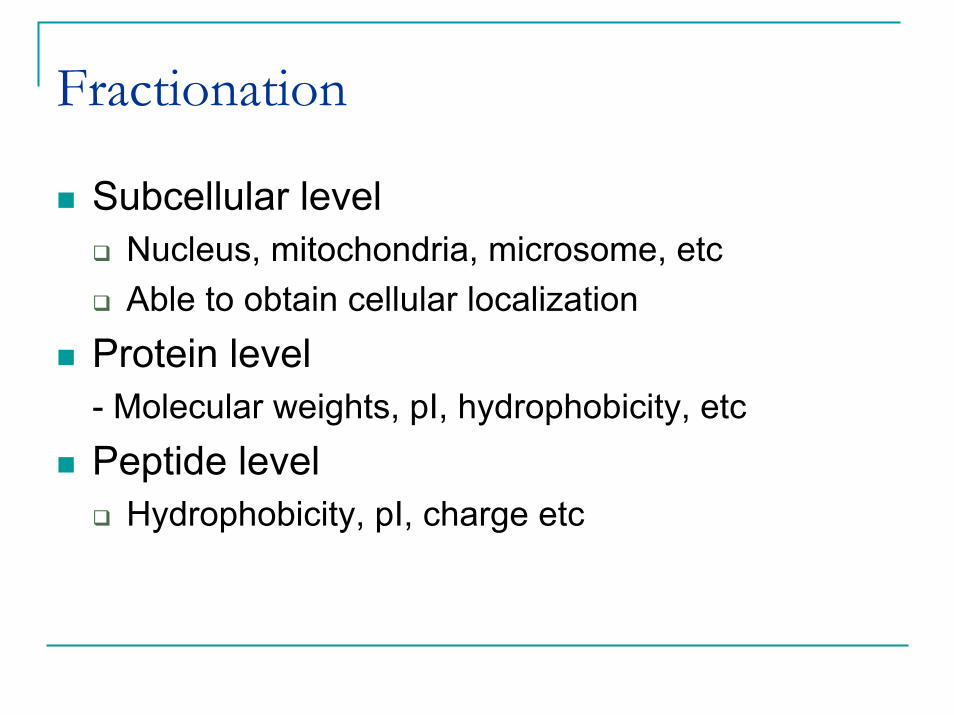
Fractionation
Subcellular levelNucleus, mitochondria, microsome, etcAble to obtain cellular localization
Protein level- Molecular weights, pI, hydrophobicity, etcPeptide level
Hydrophobicity, pI, charge etc
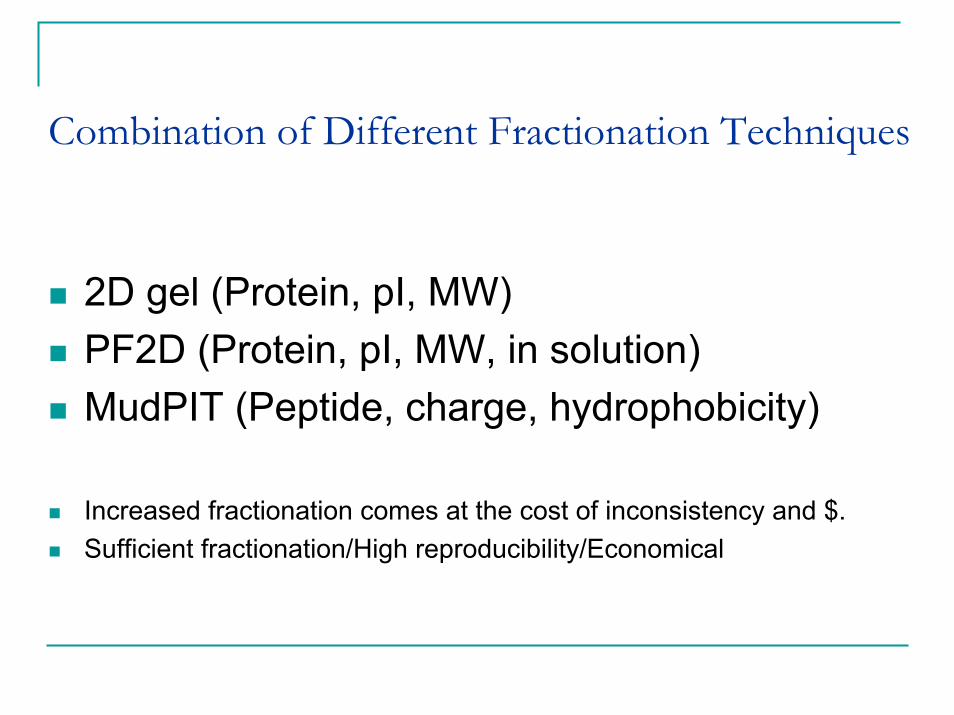
Combination of Different Fractionation Techniques
2D gel (Protein, pI, MW)PF2D (Protein, pI, MW, in solution)MudPIT (Peptide, charge, hydrophobicity)
Increased fractionation comes at the cost of inconsistency and $.Sufficient fractionation/High reproducibility/Economical
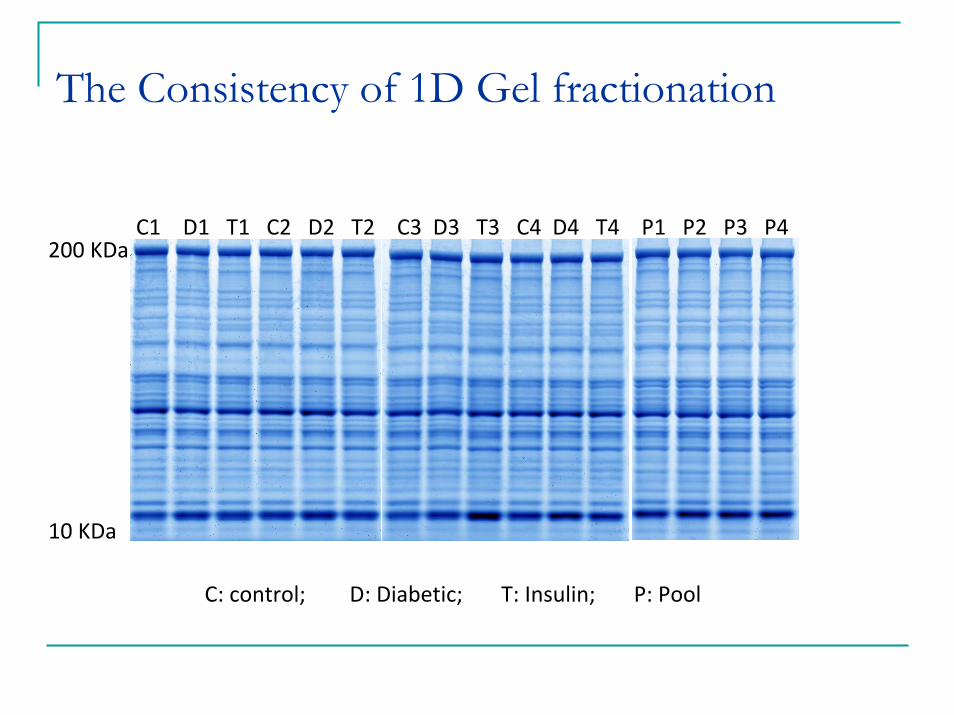
The Consistency of 1D Gel fractionation
C1 D1 T1 C2 D2 T2 C3 D3 T3 C4 D4 T4 P1 P2 P3 P4
C: control; D: Diabetic; T: Insulin; P: Pool
200 KDa
10 KDa
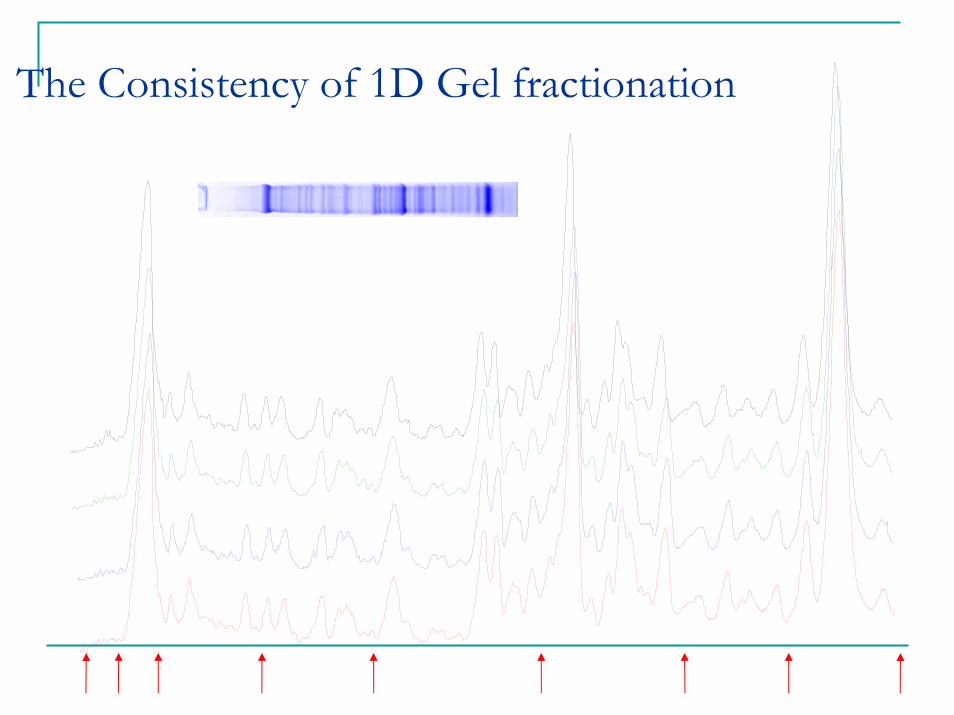
The Consistency of 1D Gel fractionation
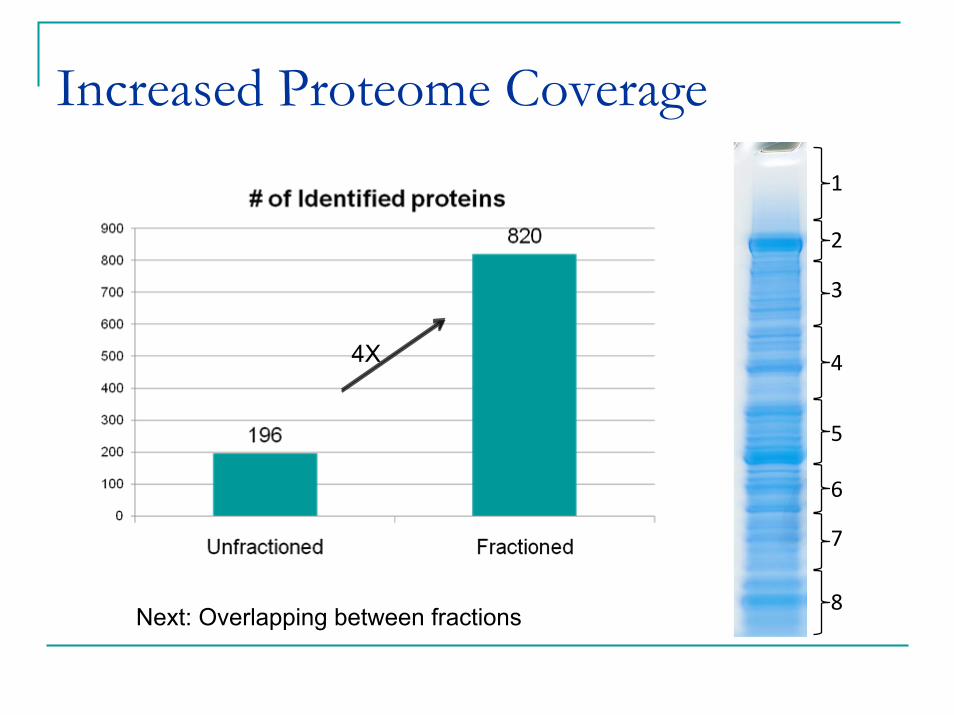
Increased Proteome Coverage1
2
3
4
5
6
7
8Next: Overlapping between fractions
4X
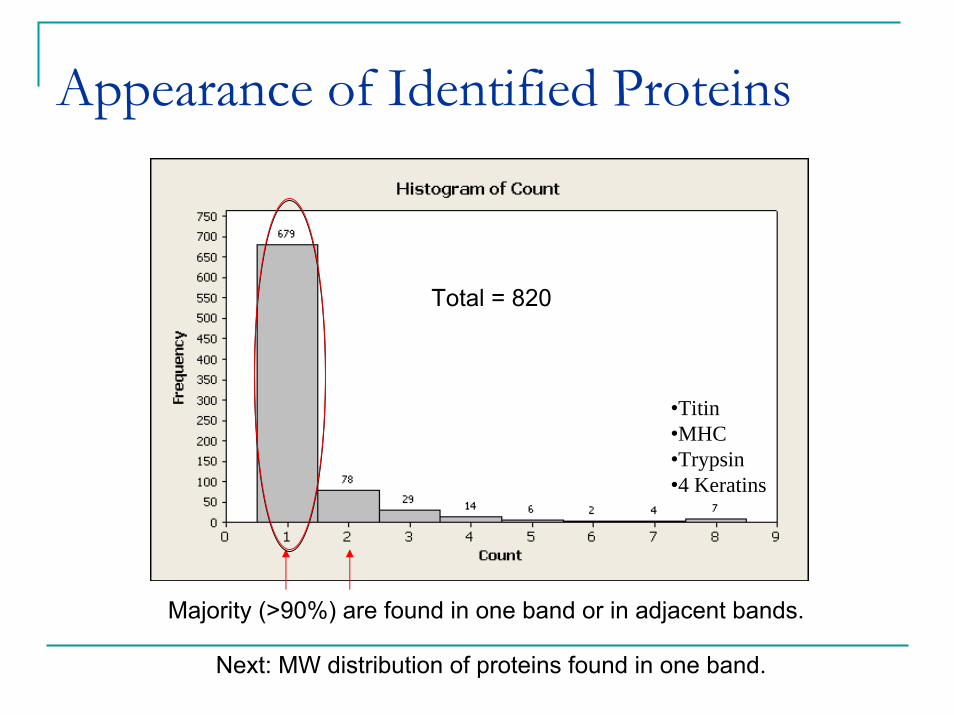
Appearance of Identified Proteins
•Titin•MHC•Trypsin•4 Keratins
Total = 820
Majority (>90%) are found in one band or in adjacent bands.
Next: MW distribution of proteins found in one band.
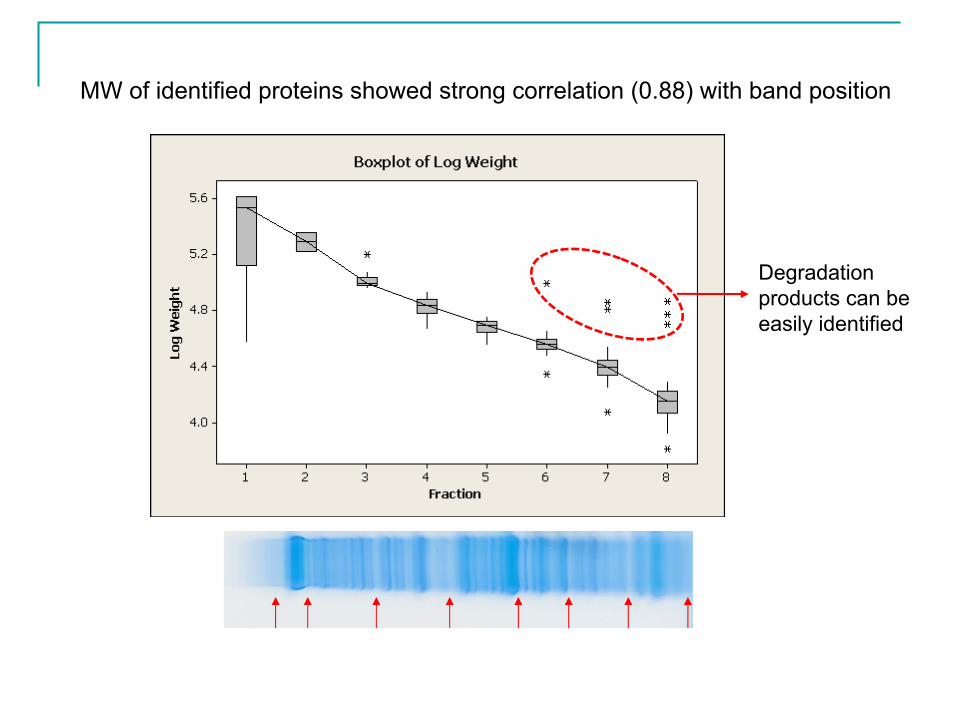
MW of identified proteins showed strong correlation (0.88) with band position
Degradation products can be easily identified
Digestion
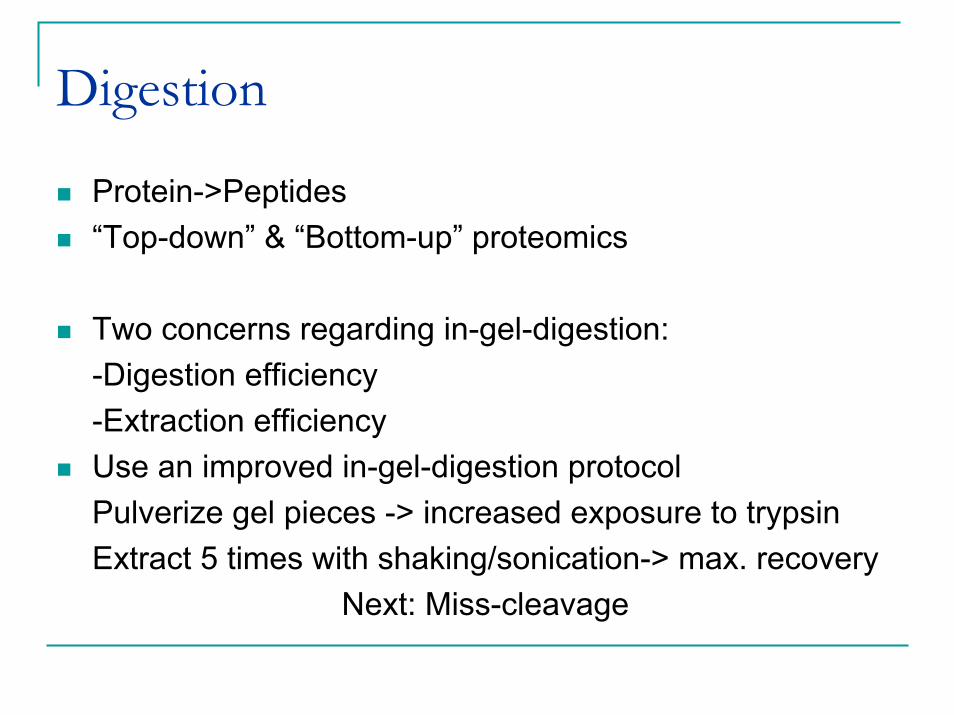
Protein->Peptides“Top-down” & “Bottom-up” proteomics
Two concerns regarding in-gel-digestion:-Digestion efficiency-Extraction efficiencyUse an improved in-gel-digestion protocolPulverize gel pieces -> increased exposure to trypsinExtract 5 times with shaking/sonication-> max. recovery
Next: Miss-cleavage
Miss-Cleavage
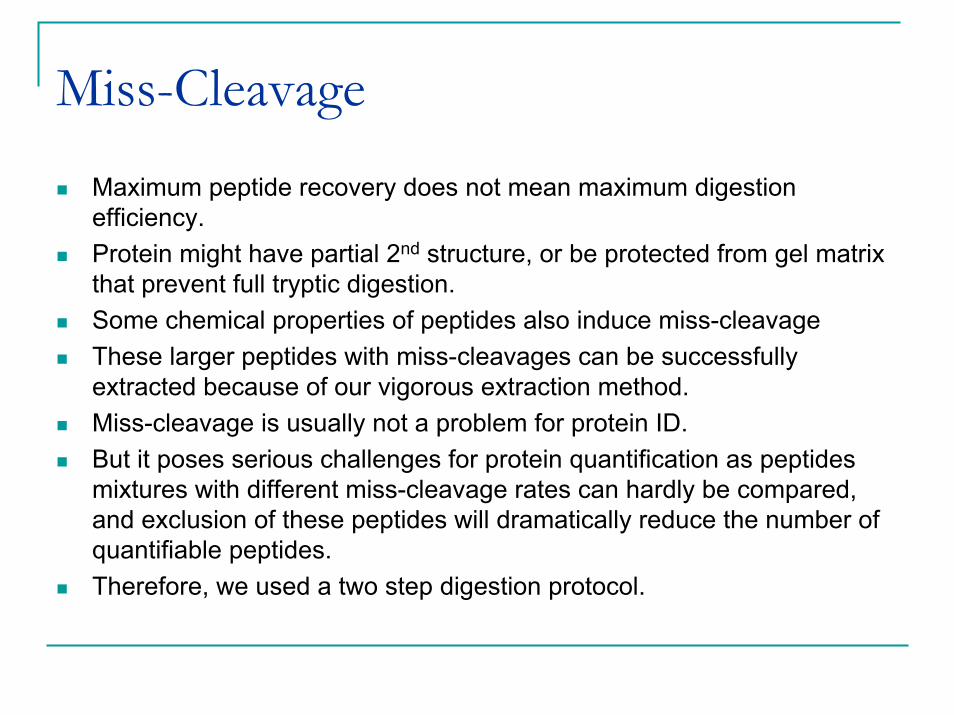
Maximum peptide recovery does not mean maximum digestion efficiency.Protein might have partial 2nd structure, or be protected from gel matrix that prevent full tryptic digestion.Some chemical properties of peptides also induce miss-cleavageThese larger peptides with miss-cleavages can be successfully extracted because of our vigorous extraction method.Miss-cleavage is usually not a problem for protein ID.But it poses serious challenges for protein quantification as peptides mixtures with different miss-cleavage rates can hardly be compared, and exclusion of these peptides will dramatically reduce the number of quantifiable peptides.Therefore, we used a two step digestion protocol.
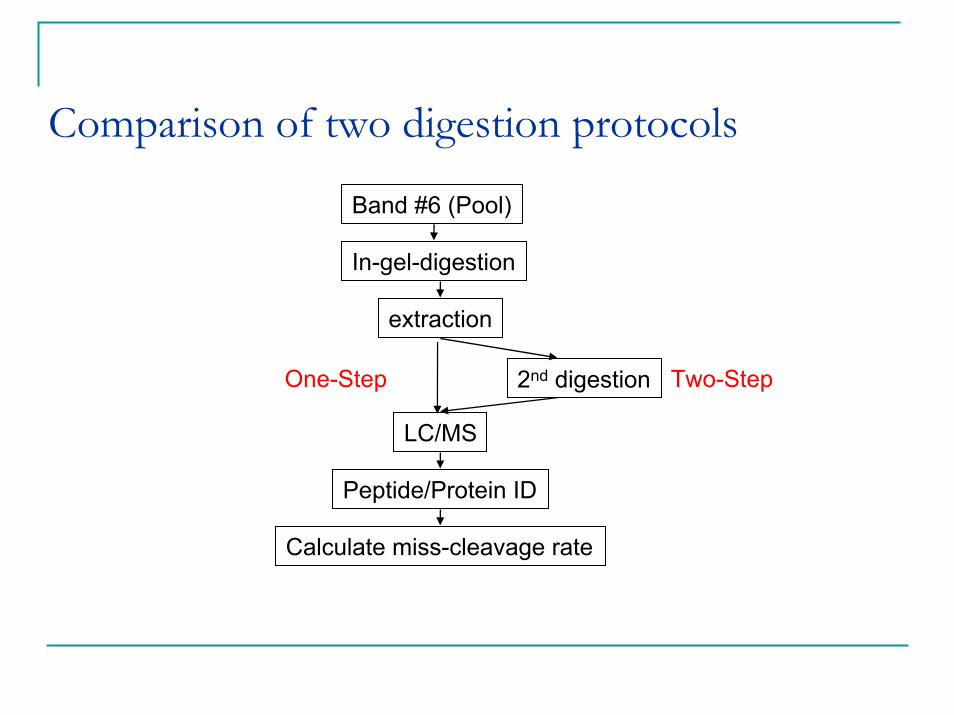
Comparison of two digestion protocols
Band #6 (Pool)
In-gel-digestion
extraction
2nd digestion
LC/MS
Peptide/Protein ID
Calculate miss-cleavage rate
One-Step Two-Step
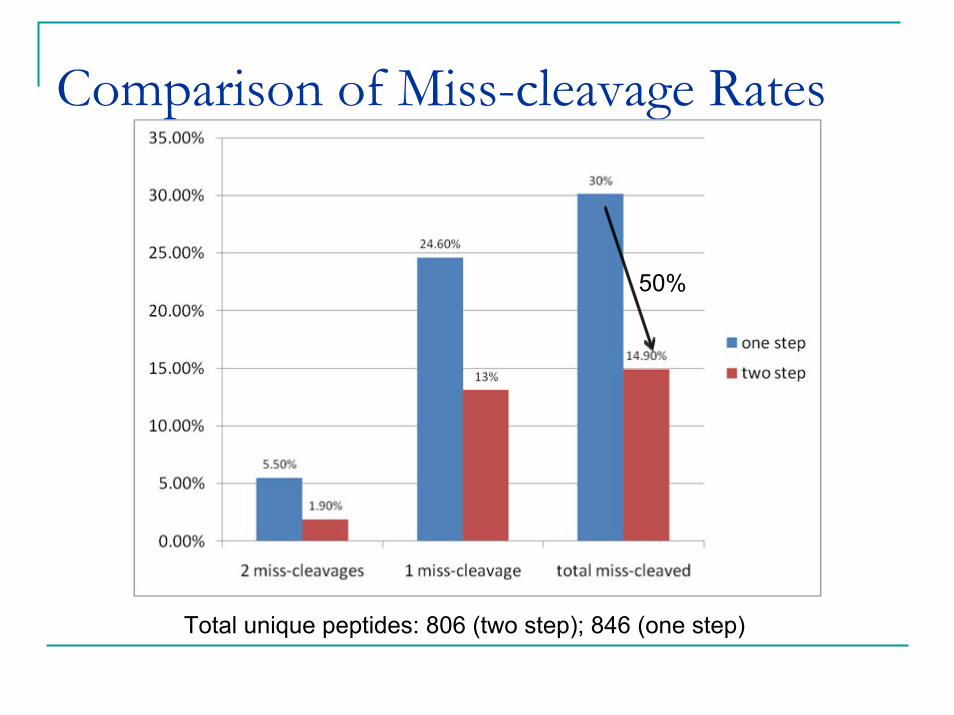
Total unique peptides: 806 (two step); 846 (one step)
Comparison of Miss-cleavage Rates
50%
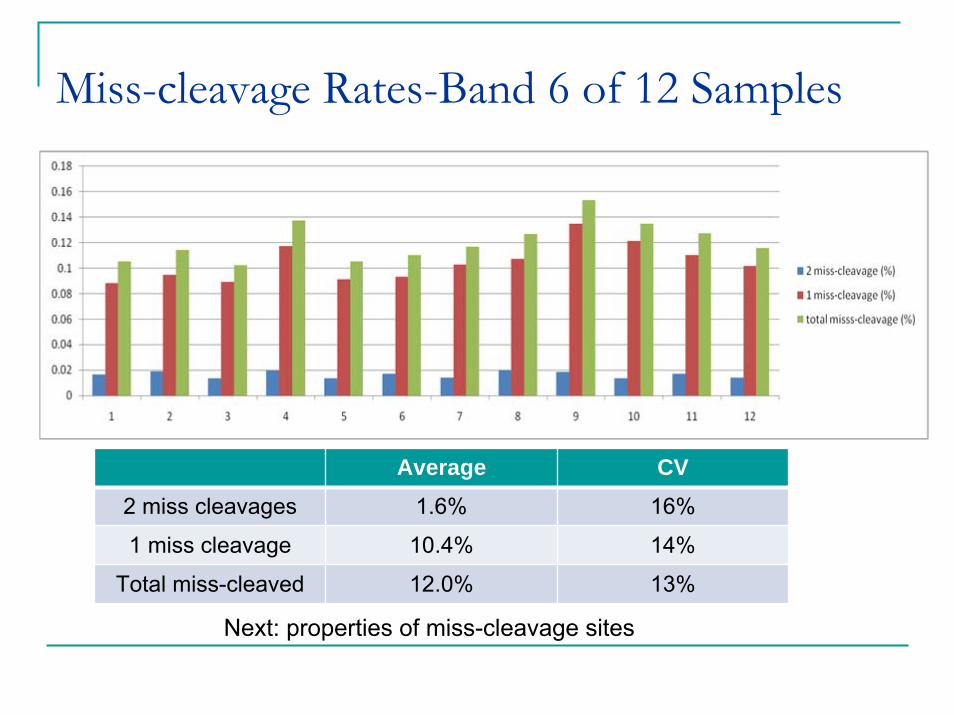
Miss-cleavage Rates-Band 6 of 12 Samples
Average CV2 miss cleavages 1.6% 16%
1 miss cleavage 10.4% 14%
Total miss-cleaved 12.0% 13%
Next: properties of miss-cleavage sites
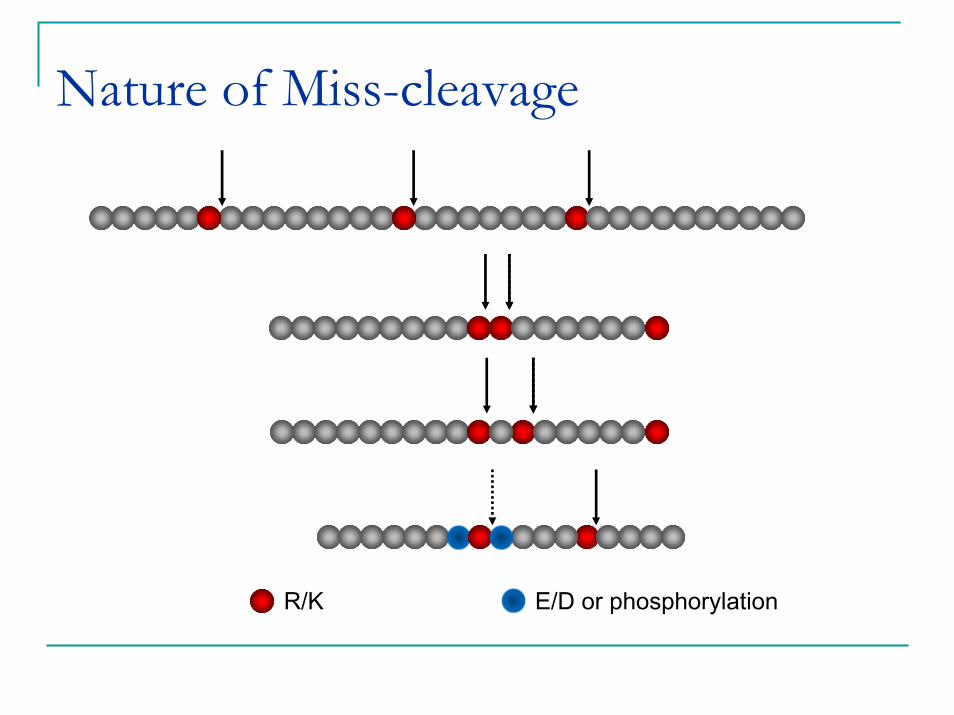
Nature of Miss-cleavage
R/K E/D or phosphorylation
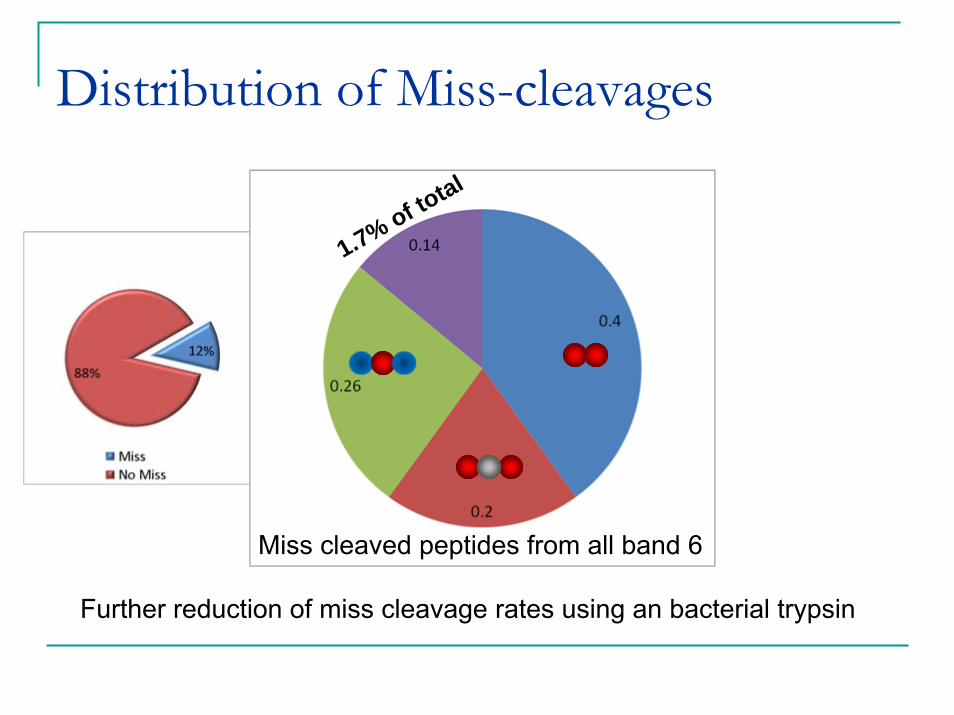
Distribution of Miss-cleavages
Further reduction of miss cleavage rates using an bacterial trypsin
1.7% of total
Miss cleaved peptides from all band 6
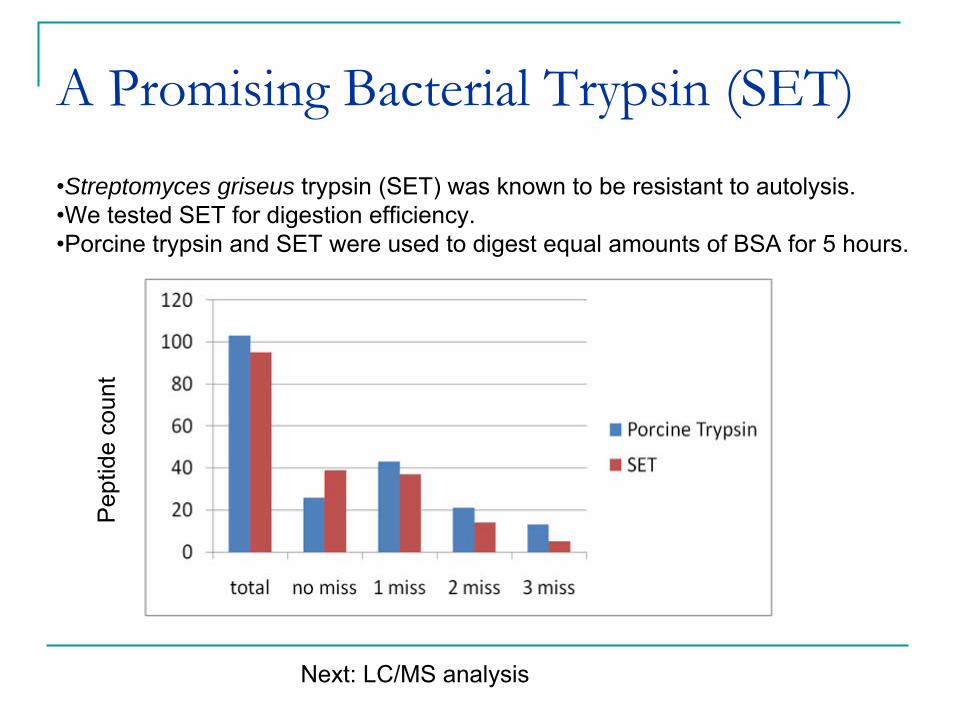
A Promising Bacterial Trypsin (SET)•Streptomyces griseus trypsin (SET) was known to be resistant to autolysis.•We tested SET for digestion efficiency.•Porcine trypsin and SET were used to digest equal amounts of BSA for 5 hours.
Pep
tide
coun
t
Next: LC/MS analysis
71
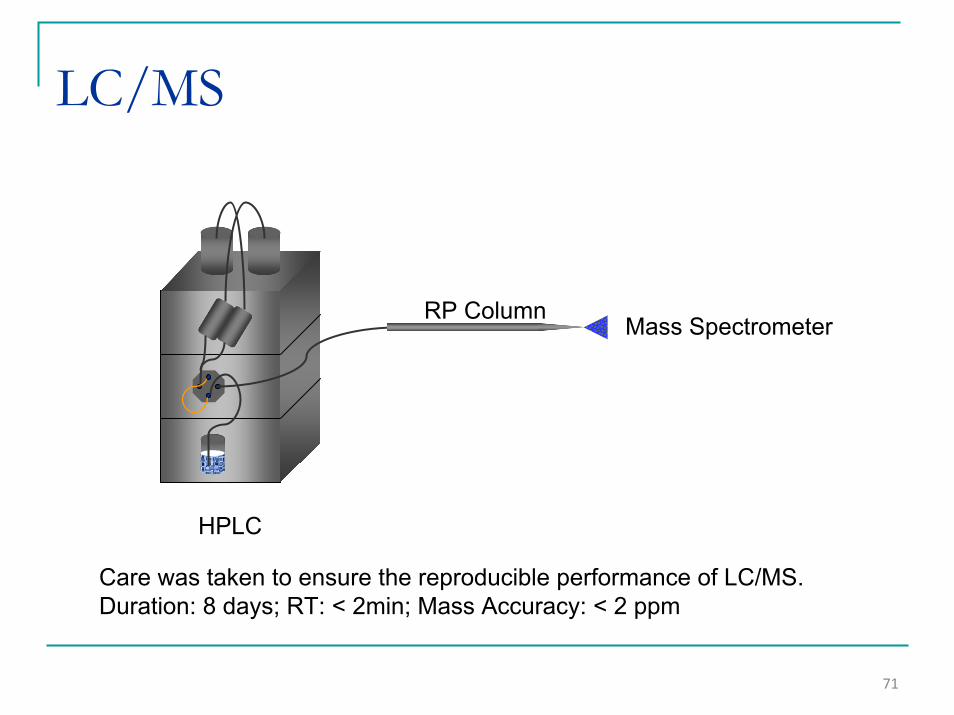
LC/MS
Mass SpectrometerRP Column
HPLC
Care was taken to ensure the reproducible performance of LC/MS.Duration: 8 days; RT: < 2min; Mass Accuracy: < 2 ppm
72
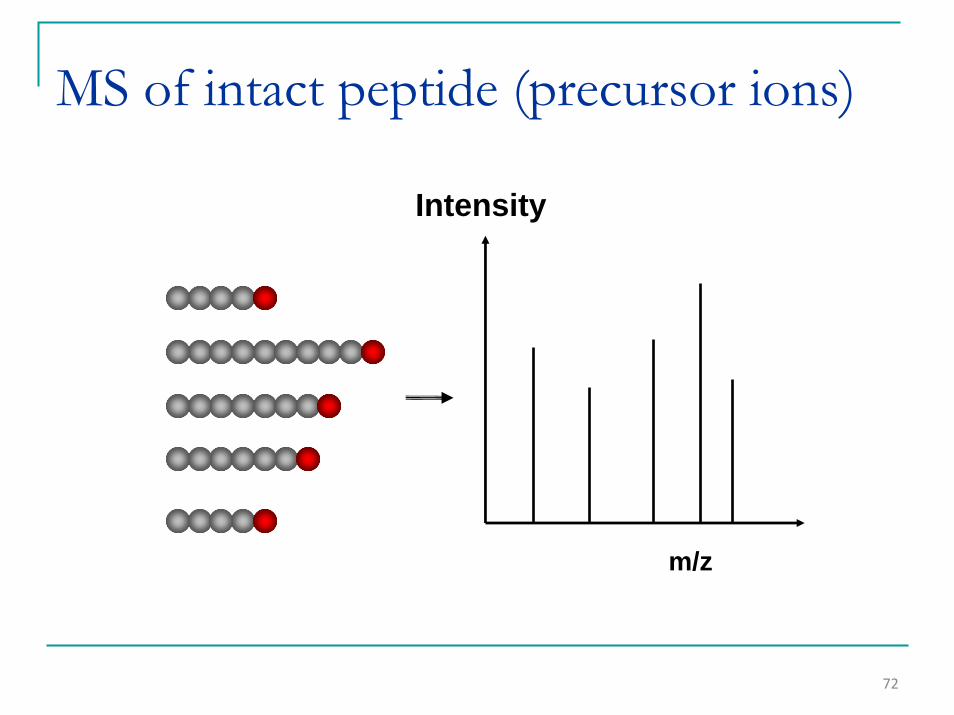
MS of intact peptide (precursor ions)
m/z
Intensity
73
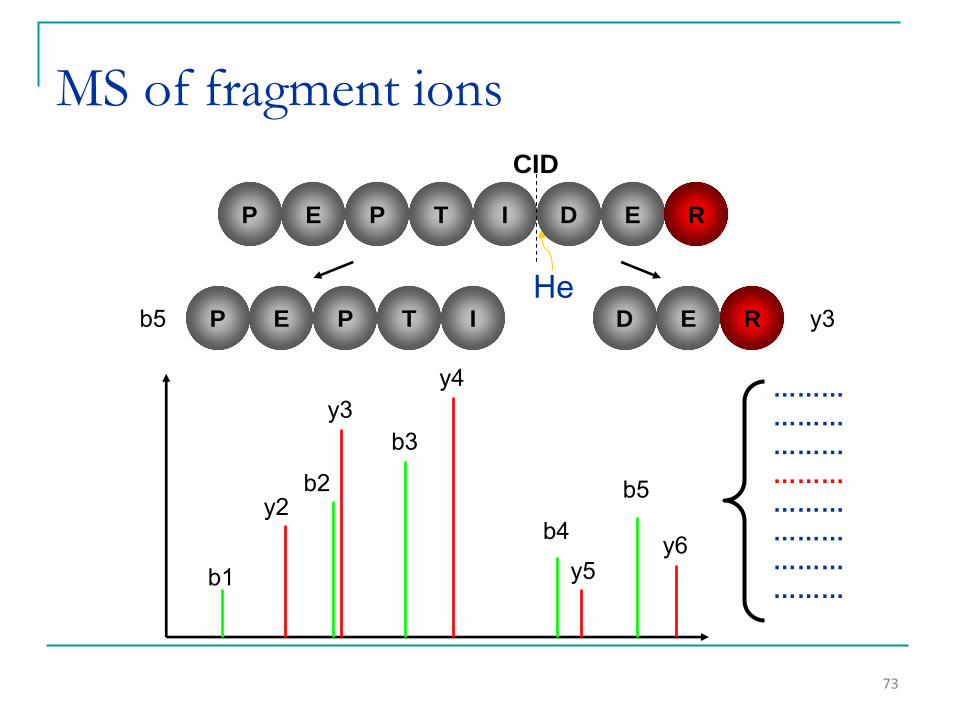
MS of fragment ions
P E P T I D E
P E P T I D Eb5 y3
y4
b3
b2
b1
y2
y3
y5y6b4
b5
R
RHe
………………………………………………………………
CID
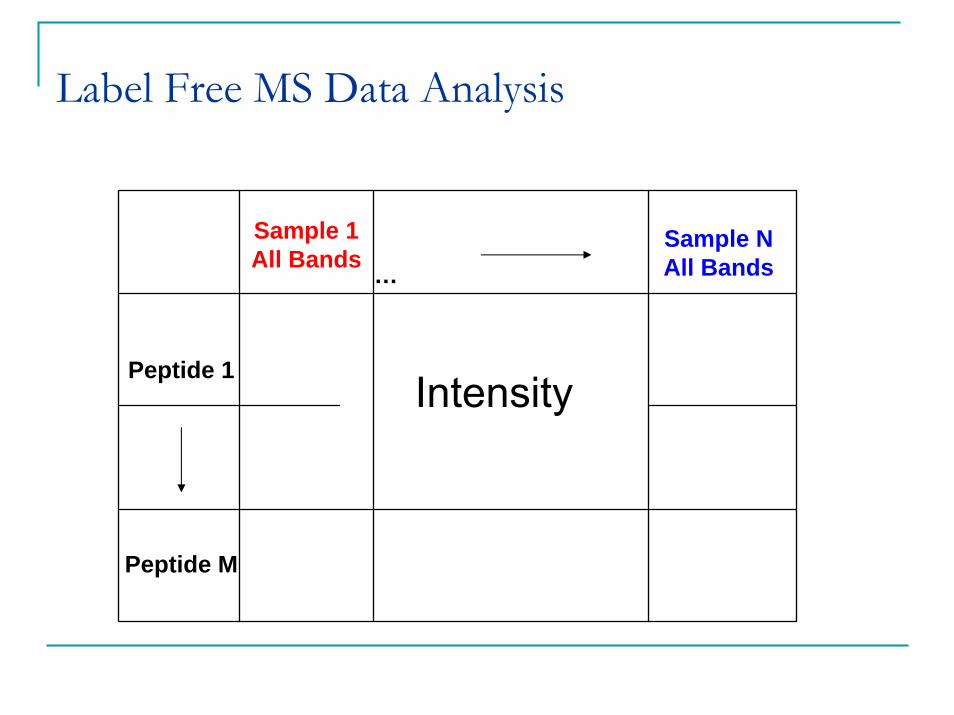
Label Free MS Data Analysis
Peptide M
Intensity
Sample NAll Bands…
Sample 1All Bands
Peptide 1
LC/MS & Data Analysis
4106 unique peptides and 820 unique proteins were were identified with high confidence.Data are subjected to label free data analysis using a commercial software.Some changes can be observed even at chromatographic level.
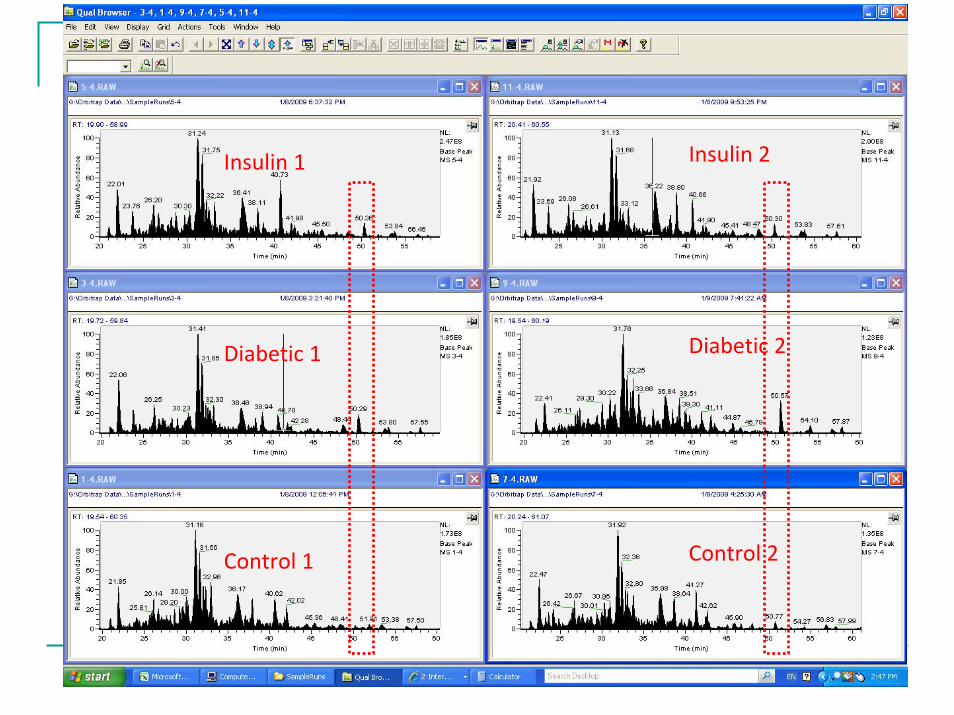
Control 1
Diabetic 1
Insulin 1
Control 2
Diabetic 2
Insulin 2
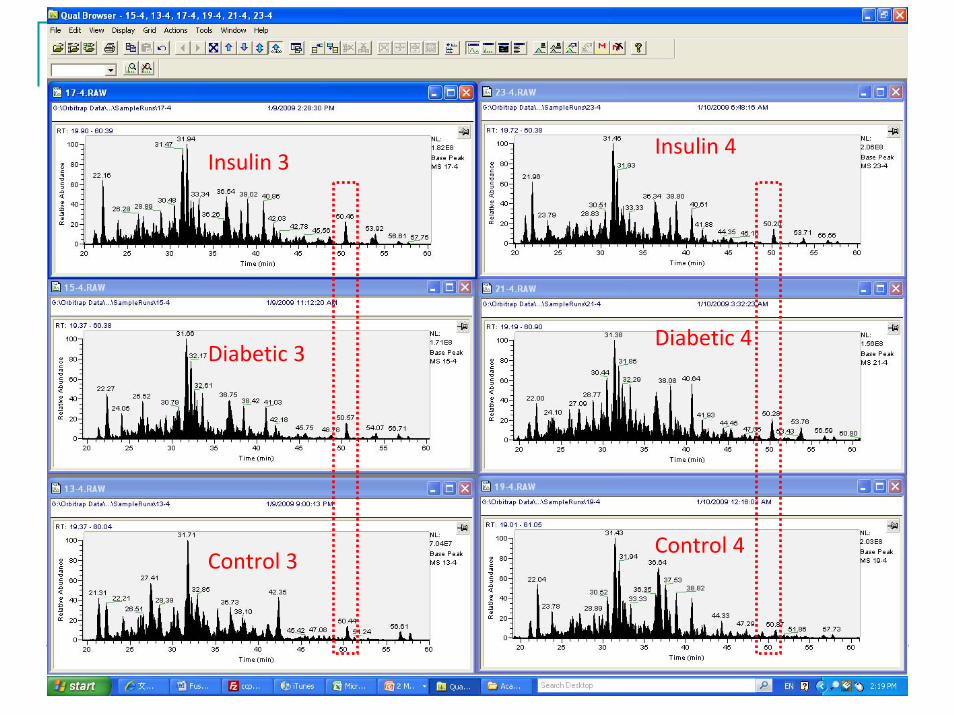
Control 3
Diabetic 3
Insulin 3
Control 4
Diabetic 4
Insulin 4
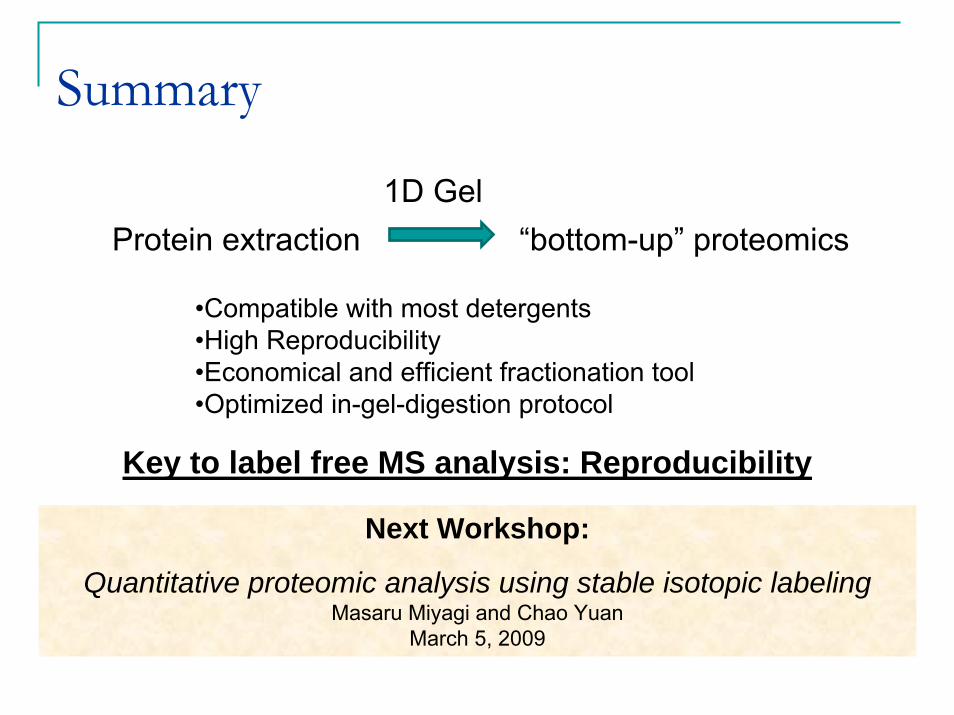
Summary
1D GelProtein extraction “bottom-up” proteomics
•Compatible with most detergents•High Reproducibility•Economical and efficient fractionation tool•Optimized in-gel-digestion protocol
Next Workshop:
Quantitative proteomic analysis using stable isotopic labelingMasaru Miyagi and Chao Yuan
March 5, 2009
Key to label free MS analysis: Reproducibility
AcknowledgementsMark Chance Ph.D Director Center for Bioinformatics and Proteomics
CollaboratorsDaniel Simon M.D.Ken Cooke M.D.CACTI
Marian Rewers, David Maahsand Janet Snell-Bergeon
Andrea Romani Ph.D
All Center Staff and Faculty
Jean Eudes Dazard Ph.DBiostatistics and experimental design
Rob M. Ewing Ph.DBioinformatics
Infochromics software