Embed Size (px)
Citation preview
Farm Torque: electric orchard
tractors
Emerging climate-smart business opportunities
2018
BUSINESS CASE
ZA
2018
BUSINESS CASE
ZA
Page 2
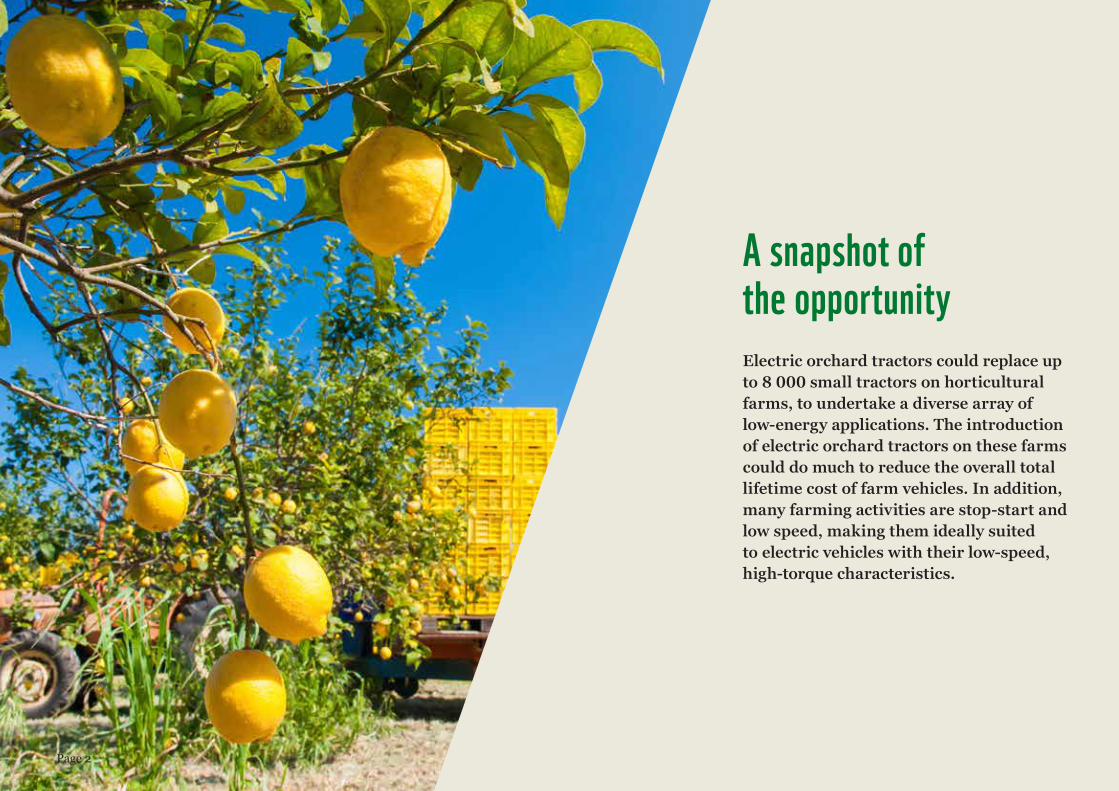
A snapshot of the opportunityElectric orchard tractors could replace up to 8 000 small tractors on horticultural farms, to undertake a diverse array of low-energy applications. The introduction of electric orchard tractors on these farms could do much to reduce the overall total lifetime cost of farm vehicles. In addition, many farming activities are stop-start and low speed, making them ideally suited to electric vehicles with their low-speed, high-torque characteristics.
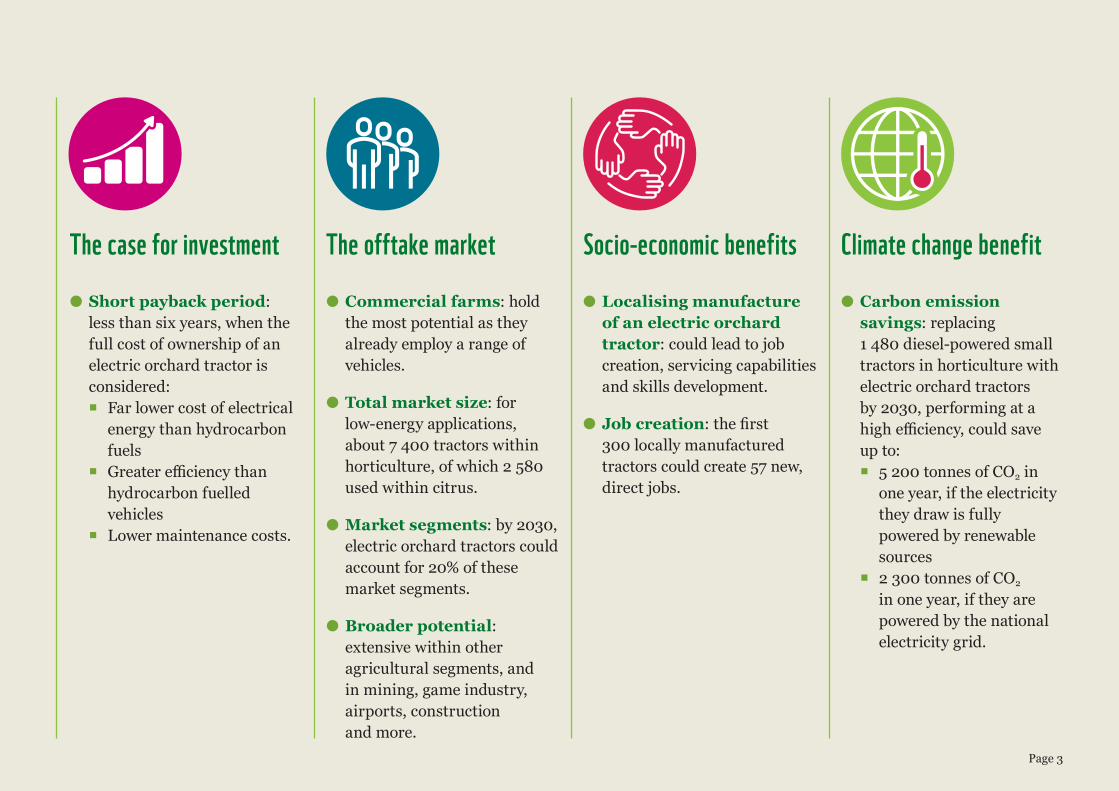
The case for investment
● Short payback period: less than six years, when the full cost of ownership of an electric orchard tractor is considered:
� Far lower cost of electrical energy than hydrocarbon fuels
� Greater efficiency than hydrocarbon fuelled vehicles
� Lower maintenance costs.
The offtake market
● Commercial farms: hold the most potential as they already employ a range of vehicles.
● Total market size: for low-energy applications, about 7 400 tractors within horticulture, of which 2 580 used within citrus.
● Market segments: by 2030, electric orchard tractors could account for 20% of these market segments.
● Broader potential: extensive within other agricultural segments, and in mining, game industry, airports, construction and more.
Socio-economic benefits
● Localising manufacture of an electric orchard tractor: could lead to job creation, servicing capabilities and skills development.
● Job creation: the first 300 locally manufactured tractors could create 57 new, direct jobs.
Climate change benefit
● Carbon emission savings: replacing 1 480 diesel-powered small tractors in horticulture with electric orchard tractors by 2030, performing at a high efficiency, could save up to:
� 5 200 tonnes of CO2 in one year, if the electricity they draw is fully powered by renewable sources
� 2 300 tonnes of CO2 in one year, if they are powered by the national electricity grid.
Page 3
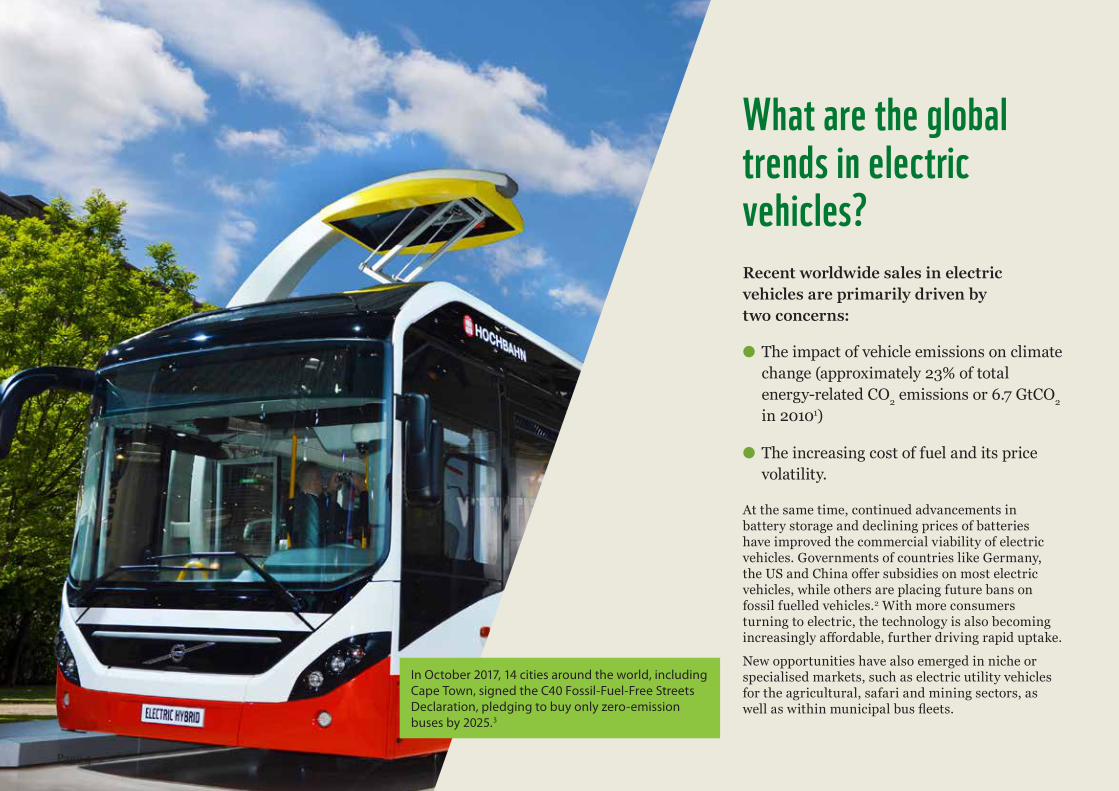
What are the global trends in electric vehicles? Recent worldwide sales in electric vehicles are primarily driven by two concerns:
● The impact of vehicle emissions on climate change (approximately 23% of total energy-related CO2 emissions or 6.7 GtCO2 in 20101)
● The increasing cost of fuel and its price volatility.
At the same time, continued advancements in battery storage and declining prices of batteries have improved the commercial viability of electric vehicles. Governments of countries like Germany, the US and China offer subsidies on most electric vehicles, while others are placing future bans on fossil fuelled vehicles.2 With more consumers turning to electric, the technology is also becoming increasingly affordable, further driving rapid uptake.
New opportunities have also emerged in niche or specialised markets, such as electric utility vehicles for the agricultural, safari and mining sectors, as well as within municipal bus fleets.
In October 2017, 14 cities around the world, including Cape Town, signed the C40 Fossil-Fuel-Free Streets Declaration, pledging to buy only zero-emission buses by 2025.3
Page 4
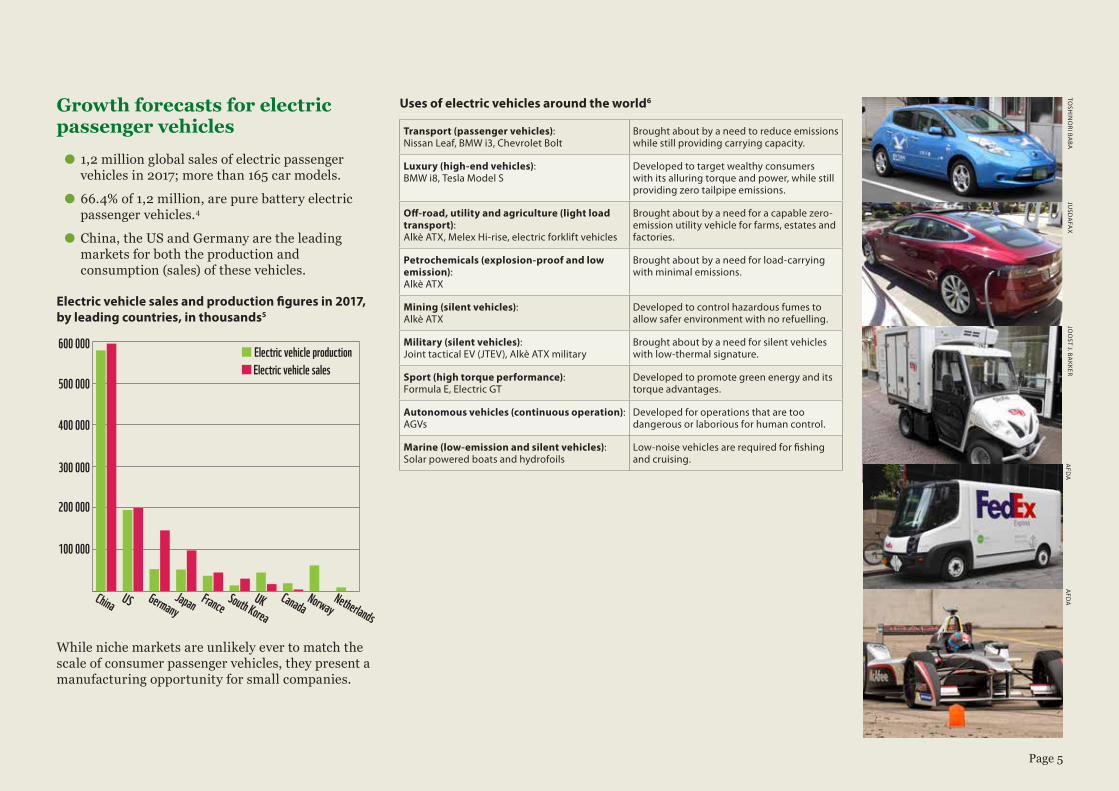
Growth forecasts for electric passenger vehicles
● 1,2 million global sales of electric passenger vehicles in 2017; more than 165 car models.
● 66.4% of 1,2 million, are pure battery electric passenger vehicles.4
● China, the US and Germany are the leading markets for both the production and consumption (sales) of these vehicles.
Electric vehicle sales and production figures in 2017, by leading countries, in thousands5
100 000
200 000
300 000
400 000
500 000
600 000
NetherlandsNorway
CanadaUKSouth Korea
FranceJapanGermany
USChina
Electric vehicle salesElectric vehicle production
While niche markets are unlikely ever to match the scale of consumer passenger vehicles, they present a manufacturing opportunity for small companies.
Uses of electric vehicles around the world6
Transport (passenger vehicles): Nissan Leaf, BMW i3, Chevrolet Bolt
Brought about by a need to reduce emissions while still providing carrying capacity.
Luxury (high-end vehicles): BMW i8, Tesla Model S
Developed to target wealthy consumers with its alluring torque and power, while still providing zero tailpipe emissions.
Off-road, utility and agriculture (light load transport): Alkè ATX, Melex Hi-rise, electric forklift vehicles
Brought about by a need for a capable zero-emission utility vehicle for farms, estates and factories.
Petrochemicals (explosion-proof and low emission): Alkè ATX
Brought about by a need for load-carrying with minimal emissions.
Mining (silent vehicles): Alkè ATX
Developed to control hazardous fumes to allow safer environment with no refuelling.
Military (silent vehicles): Joint tactical EV (JTEV), Alkè ATX military
Brought about by a need for silent vehicles with low-thermal signature.
Sport (high torque performance): Formula E, Electric GT
Developed to promote green energy and its torque advantages.
Autonomous vehicles (continuous operation): AGVs
Developed for operations that are too dangerous or laborious for human control.
Marine (low-emission and silent vehicles): Solar powered boats and hydrofoils
Low-noise vehicles are required for fishing and cruising.
TOSH
INO
RI BABA
JUSD
AFA
XA
FDA
AFD
AJO
OST J. BA
KKER
Page 5
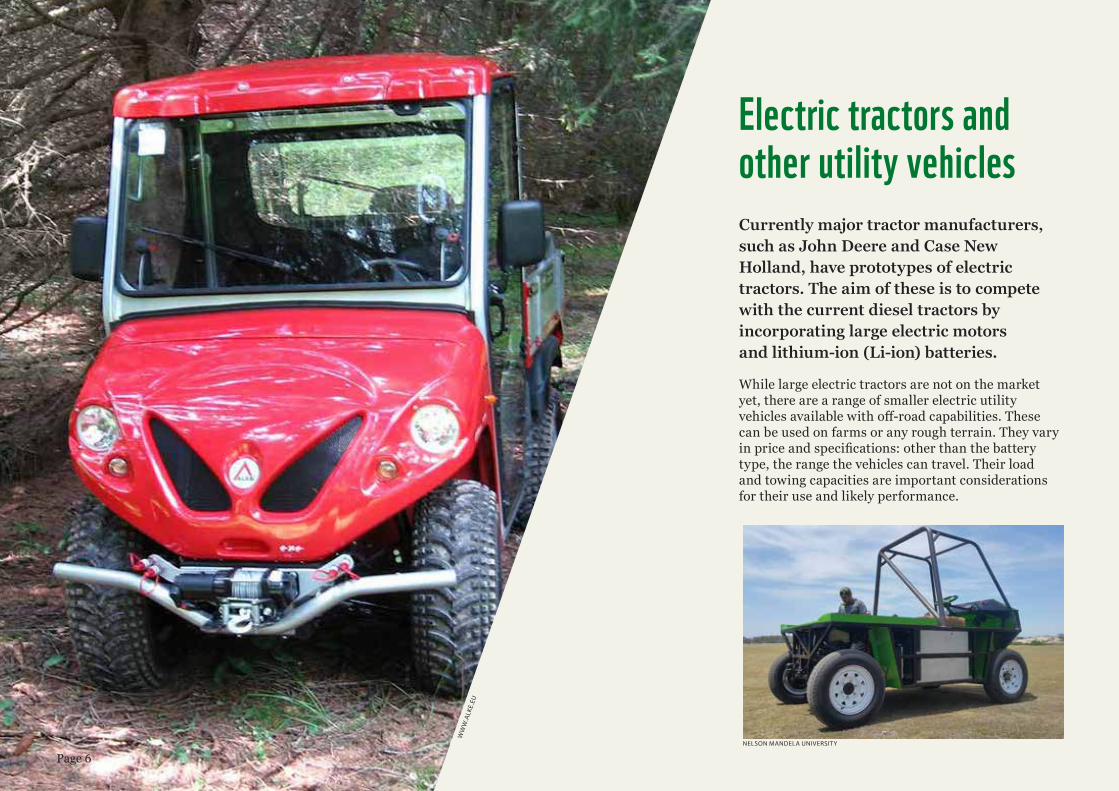
Electric tractors and other utility vehiclesCurrently major tractor manufacturers, such as John Deere and Case New Holland, have prototypes of electric tractors. The aim of these is to compete with the current diesel tractors by incorporating large electric motors and lithium-ion (Li-ion) batteries.
While large electric tractors are not on the market yet, there are a range of smaller electric utility vehicles available with off-road capabilities. These can be used on farms or any rough terrain. They vary in price and specifications: other than the battery type, the range the vehicles can travel. Their load and towing capacities are important considerations for their use and likely performance.
WW
W.A
LKE.
EU
NELSON MANDELA UNIVERSITY
Page 6
Comparison of certain Li-ion and lead acid battery electric utility vehicles7
Model Alkè ATX230E Alkè ATX240E Ranger EV Li-ion
Polaris GEM eL XD
John Deere Gator TE Electric
Price (exchange rate as of 22/06/2018)
R362 789– R425 915
R362 789–R425 915
R311 273 R175 940 R157 830
Battery type Lead acid Li-ion Li-ion Li-ion Lead acid
Battery capacity (kilowatt hour)
10 kWh 20 kWh 12 kWh 12.4 kWh 10.8 kWh
Weight 1170kg 965kg 602.4kg 719kg 590kg
Motor 48V AC 48V AC 48V AC induction
48V AC induction
48V DC motor
Max power (kilowatts)
14 kW 14 kW 22 kW 5 kW 4.6 kW
Range (perfect condition)
75km 150km 80km 110km 65km
Load capacity (kilograms)
1 000kg 1 000kg 226kg 500kg 273kg
Towing capacity 3 000kg 3 000kg 567kg N/S N/S
What is the uptake of electric vehicles in South Africa?Electric passenger vehiclesThere are three electric passenger vehicles available in South Africa:
● Nissan Leaf (sales price: R474 900)
● BMW i3 (sales price: R606 800)
● BMW i3 eDrive REx (sales price: R683 600).9
Electric utility vehicles Currently the market for electric utility vehicles in South Africa is small. Companies like Melex produce vehicles for private estates, safari and golf estates, with adapted models for agricultural uses, such as for transporting light loads (<500kg) and personnel.
41 total sales in 2016,
down from 79 in 2015 (±0.01% of all
new vehicle sales)8
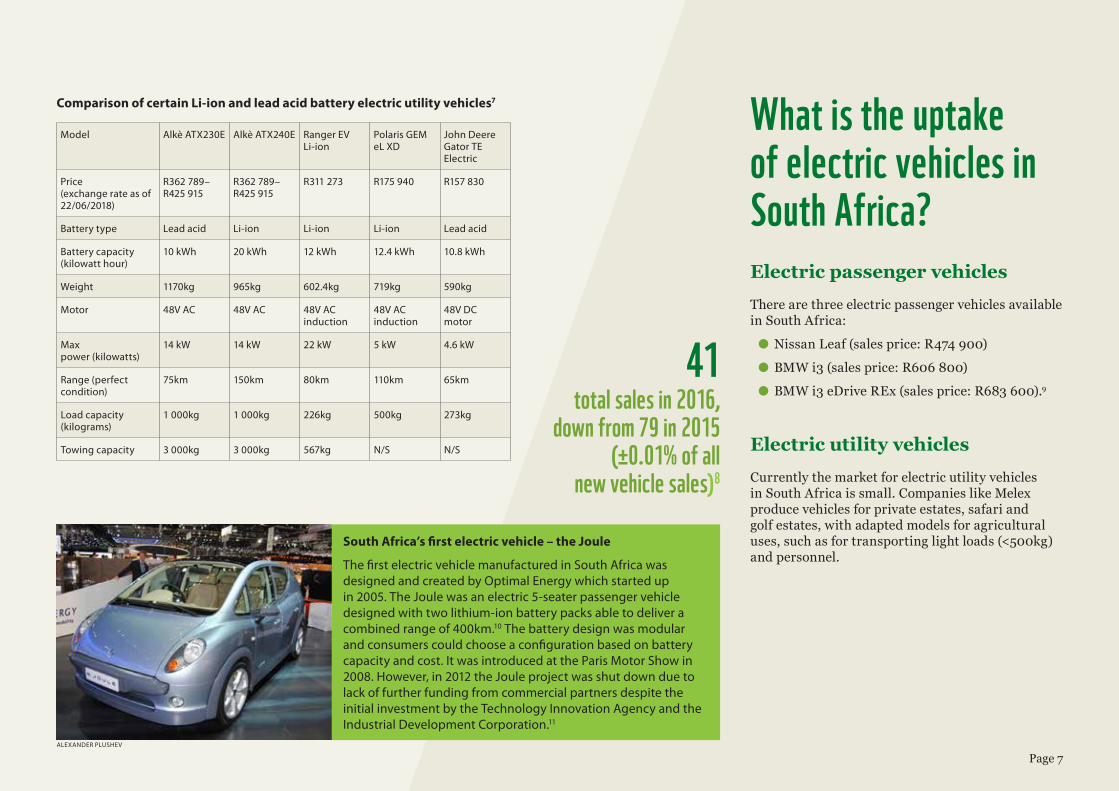
South Africa’s first electric vehicle – the Joule
The first electric vehicle manufactured in South Africa was designed and created by Optimal Energy which started up in 2005. The Joule was an electric 5-seater passenger vehicle designed with two lithium-ion battery packs able to deliver a combined range of 400km.10 The battery design was modular and consumers could choose a configuration based on battery capacity and cost. It was introduced at the Paris Motor Show in 2008. However, in 2012 the Joule project was shut down due to lack of further funding from commercial partners despite the initial investment by the Technology Innovation Agency and the Industrial Development Corporation.11
ALEXANDER PLUSHEV
Page 7
What is the potential for electric vehicles in agriculture in South Africa?The primary vehicle used in agriculture is a tractor, with most performing high-energy tasks using, for example plough disks and subsoilers. This leads to tractors being oversized for medium- and low-energy demand applications, resulting in unnecessarily high fuel consumption on lighter-duty tasks and underutilisation during other times.
The introduction of electrically-driven agricultural vehicles that can satisfy the demands of small and medium-size applications is desirable due to the reduction in running costs.
At present, while there are a few light electric agricultural vehicles in South Africa none possesses the capabilities to replace a small orchard tractor:
● The John Deere Gator is not suitable for a full range of light operations on farms, including sufficient load-carrying capacities.
● The Alkè vehicle has a maximum load capacity of 1.6 tonnes and a maximum towing capacity of 4.5 tonnes. While it is a powerful vehicle, it is more comparable with a bakkie than a tractor.
A locally manufactured electric tractor to replace smaller or orchard tractors could address this gap in the market.
South African policy and regulatory environment
● The South African National Energy Development Institute focuses on cleaner mobility, and supports the Electric Vehicle Industry Association.
● The uYilo e-Mobility Programme is funded by the Technology Innovation Agency. It supports research and innovation in the areas of renewable energy grids, battery testing in accredited in-house testing facilities and electric vehicle technology.
In terms of incentives and finance:
● The Department of Trade and Industry’s Capital Projects Feasibility Programme and their Automotive Investments Scheme support research into the market feasibility of products and the growth of the light motor vehicle automotive sector, respectively.
● The Employment Creation Fund of the same department aims to support projects that have a positive impact on job creation, green economy and/or developing the agricultural value chain.
● The Manufacturing Competitive Enhancement Programme of the Industrial Development Corporation provides working capital to firms.
There are times of the year where most of my tractors are underutilised.
Dave Gerber, Arundel Farm
Page 8
Standards
Currently South Africa has no specific regulations for electric agricultural tractors. An electric agricultural tractor must comply with the same standards as an agricultural tractor, as well as with the existing industrial standards with regards to its electrical system.
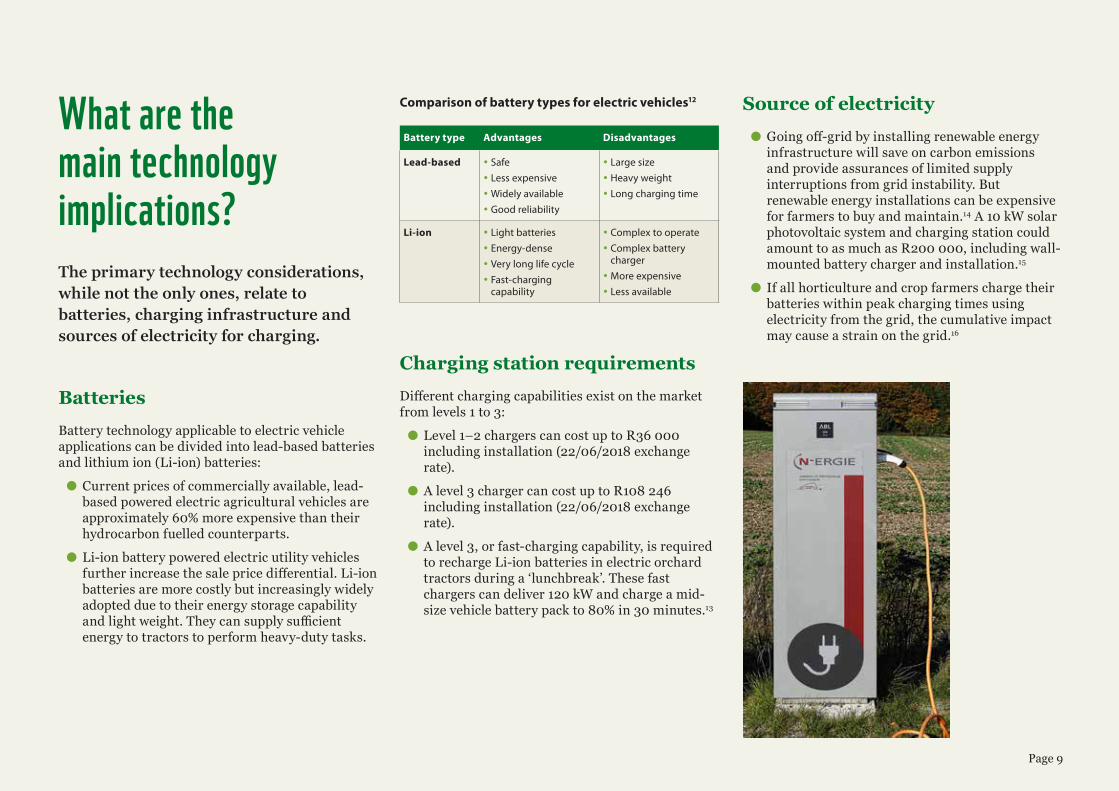
What are the main technology implications? The primary technology considerations, while not the only ones, relate to batteries, charging infrastructure and sources of electricity for charging.
BatteriesBattery technology applicable to electric vehicle applications can be divided into lead-based batteries and lithium ion (Li-ion) batteries:
● Current prices of commercially available, lead-based powered electric agricultural vehicles are approximately 60% more expensive than their hydrocarbon fuelled counterparts.
● Li-ion battery powered electric utility vehicles further increase the sale price differential. Li-ion batteries are more costly but increasingly widely adopted due to their energy storage capability and light weight. They can supply sufficient energy to tractors to perform heavy-duty tasks.
Comparison of battery types for electric vehicles12
Battery type Advantages Disadvantages
Lead-based y Safe y Less expensive yWidely available y Good reliability
y Large size y Heavy weight y Long charging time
Li-ion y Light batteries y Energy-dense y Very long life cycle y Fast-charging capability
y Complex to operate y Complex battery charger
y More expensive y Less available
Charging station requirements Different charging capabilities exist on the market from levels 1 to 3:
● Level 1–2 chargers can cost up to R36 000 including installation (22/06/2018 exchange rate).
● A level 3 charger can cost up to R108 246 including installation (22/06/2018 exchange rate).
● A level 3, or fast-charging capability, is required to recharge Li-ion batteries in electric orchard tractors during a ‘lunchbreak’. These fast chargers can deliver 120 kW and charge a mid-size vehicle battery pack to 80% in 30 minutes.13
Source of electricity ● Going off-grid by installing renewable energy infrastructure will save on carbon emissions and provide assurances of limited supply interruptions from grid instability. But renewable energy installations can be expensive for farmers to buy and maintain.14 A 10 kW solar photovoltaic system and charging station could amount to as much as R200 000, including wall-mounted battery charger and installation.15
● If all horticulture and crop farmers charge their batteries within peak charging times using electricity from the grid, the cumulative impact may cause a strain on the grid.16
Page 9
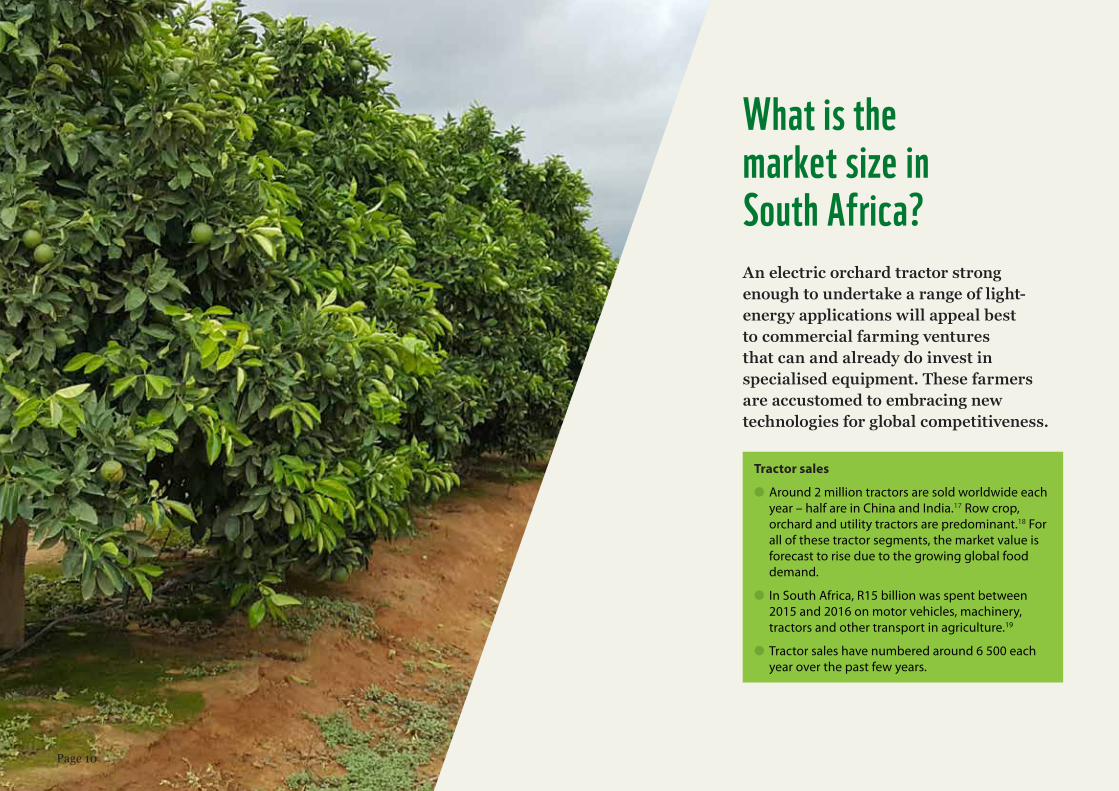
What is the market size in South Africa? An electric orchard tractor strong enough to undertake a range of light-energy applications will appeal best to commercial farming ventures that can and already do invest in specialised equipment. These farmers are accustomed to embracing new technologies for global competitiveness.
Tractor sales
● Around 2 million tractors are sold worldwide each year – half are in China and India.17 Row crop, orchard and utility tractors are predominant.18 For all of these tractor segments, the market value is forecast to rise due to the growing global food demand.
● In South Africa, R15 billion was spent between 2015 and 2016 on motor vehicles, machinery, tractors and other transport in agriculture.19
● Tractor sales have numbered around 6 500 each year over the past few years.
Page 10
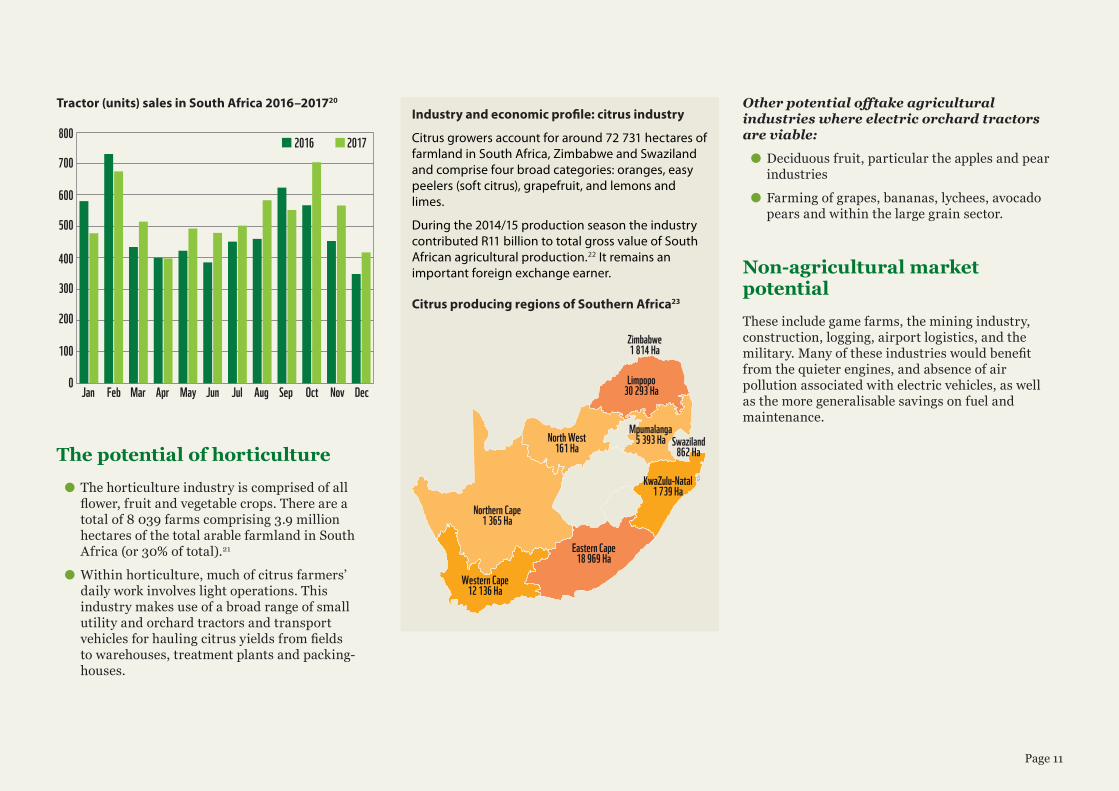
Tractor (units) sales in South Africa 2016–201720
2016 2017
0
100
200
300
400
500
600
700
800
DecNovOctSepAugJulJunMayAprMarFebJan
The potential of horticulture ● The horticulture industry is comprised of all flower, fruit and vegetable crops. There are a total of 8 039 farms comprising 3.9 million hectares of the total arable farmland in South Africa (or 30% of total).21
● Within horticulture, much of citrus farmers’ daily work involves light operations. This industry makes use of a broad range of small utility and orchard tractors and transport vehicles for hauling citrus yields from fields to warehouses, treatment plants and packing-houses.
Other potential offtake agricultural industries where electric orchard tractors are viable:
● Deciduous fruit, particular the apples and pear industries
● Farming of grapes, bananas, lychees, avocado pears and within the large grain sector.
Non-agricultural market potentialThese include game farms, the mining industry, construction, logging, airport logistics, and the military. Many of these industries would benefit from the quieter engines, and absence of air pollution associated with electric vehicles, as well as the more generalisable savings on fuel and maintenance.
Industry and economic profile: citrus industry
Citrus growers account for around 72 731 hectares of farmland in South Africa, Zimbabwe and Swaziland and comprise four broad categories: oranges, easy peelers (soft citrus), grapefruit, and lemons and limes.
During the 2014/15 production season the industry contributed R11 billion to total gross value of South African agricultural production.22 It remains an important foreign exchange earner.
Citrus producing regions of Southern Africa23
Limpopo30 293 Ha
Northern Cape1 365 Ha
North West161 Ha
KwaZulu-Natal1 739 Ha
Eastern Cape18 969 Ha
Western Cape12 136 Ha
Zimbabwe1 814 Ha
Mpumalanga5 393 Ha Swaziland
862 Ha
Page 11
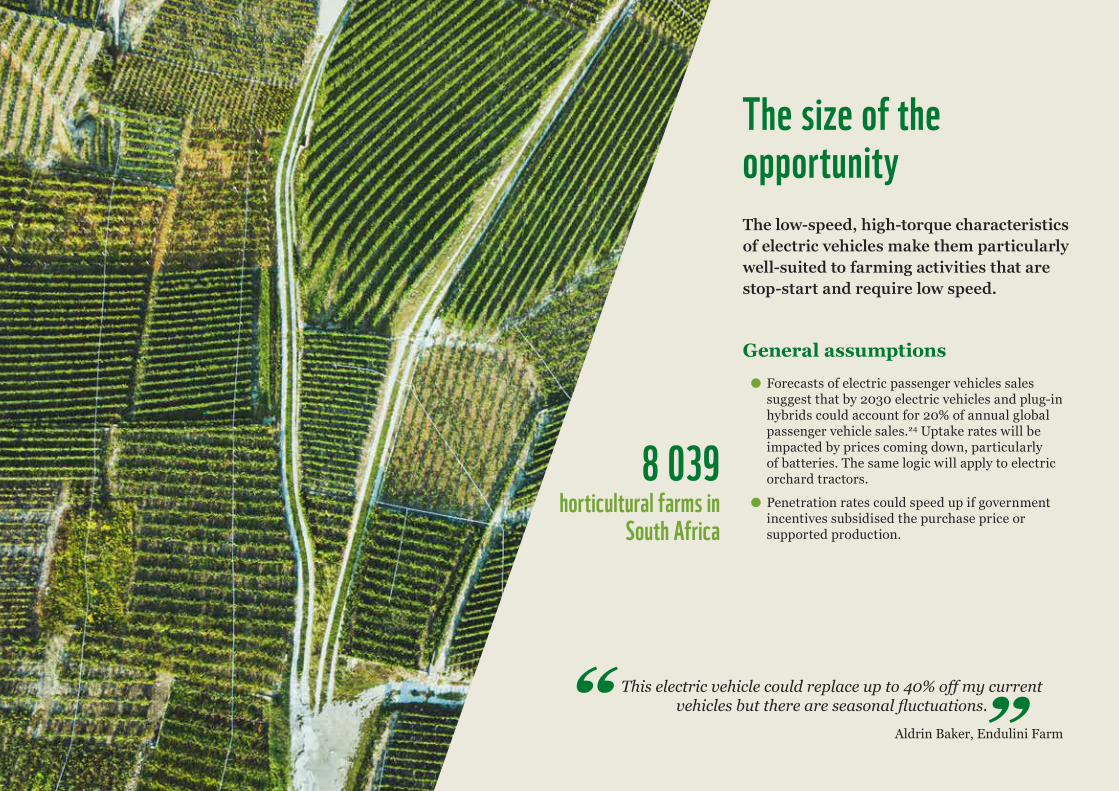
The size of the opportunityThe low-speed, high-torque characteristics of electric vehicles make them particularly well-suited to farming activities that are stop-start and require low speed.
General assumptions ● Forecasts of electric passenger vehicles sales suggest that by 2030 electric vehicles and plug-in hybrids could account for 20% of annual global passenger vehicle sales.24 Uptake rates will be impacted by prices coming down, particularly of batteries. The same logic will apply to electric orchard tractors.
● Penetration rates could speed up if government incentives subsidised the purchase price or supported production.
This electric vehicle could replace up to 40% off my current vehicles but there are seasonal fluctuations.
Aldrin Baker, Endulini Farm
8 039horticultural farms in
South Africa
Page 12
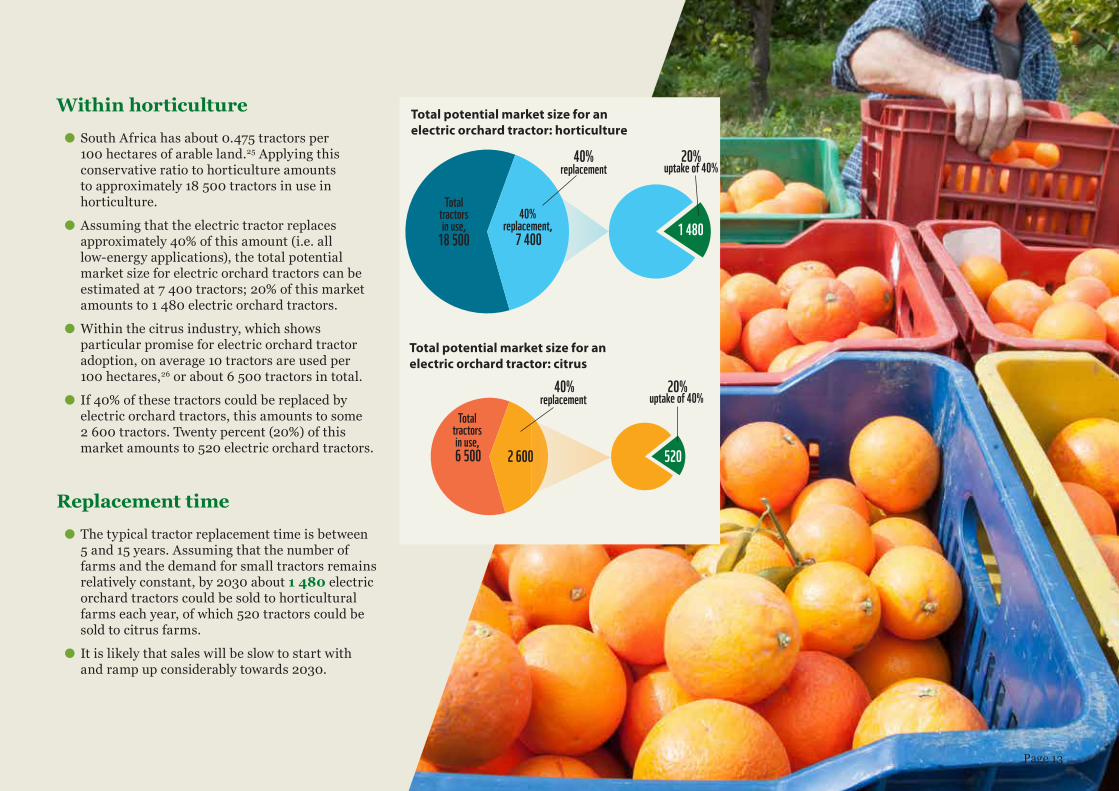
Within horticulture ● South Africa has about 0.475 tractors per 100 hectares of arable land.25 Applying this conservative ratio to horticulture amounts to approximately 18 500 tractors in use in horticulture.
● Assuming that the electric tractor replaces approximately 40% of this amount (i.e. all low-energy applications), the total potential market size for electric orchard tractors can be estimated at 7 400 tractors; 20% of this market amounts to 1 480 electric orchard tractors.
● Within the citrus industry, which shows particular promise for electric orchard tractor adoption, on average 10 tractors are used per 100 hectares,26 or about 6 500 tractors in total.
● If 40% of these tractors could be replaced by electric orchard tractors, this amounts to some 2 600 tractors. Twenty percent (20%) of this market amounts to 520 electric orchard tractors.
Replacement time ● The typical tractor replacement time is between 5 and 15 years. Assuming that the number of farms and the demand for small tractors remains relatively constant, by 2030 about 1 480 electric orchard tractors could be sold to horticultural farms each year, of which 520 tractors could be sold to citrus farms.
● It is likely that sales will be slow to start with and ramp up considerably towards 2030.
Total potential market size for an electric orchard tractor: horticulture
40%replacement
Total tractors in use, 6 500 2 600
20%uptake of 40%
520
Total tractors in use,
18 500 40%
replacement, 7 400 1 480
40%replacement
20%uptake of 40%
Total potential market size for an electric orchard tractor: citrus
Page 13
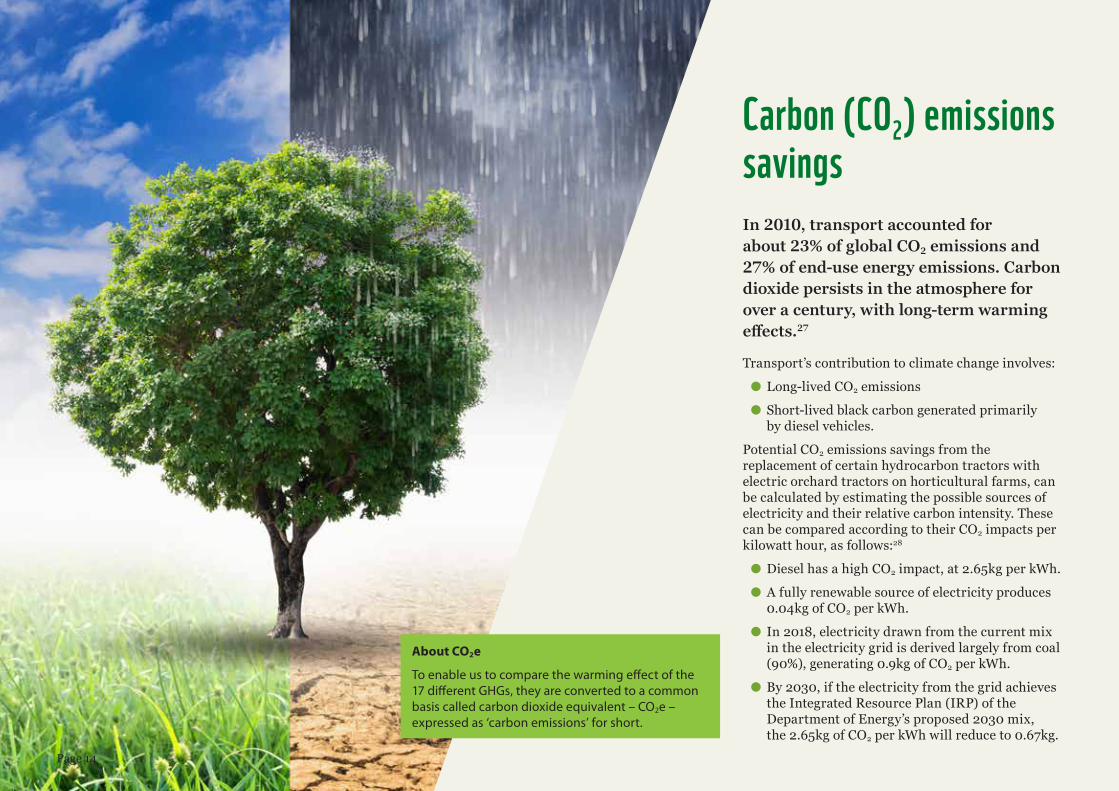
Carbon (CO2) emissions savingsIn 2010, transport accounted for about 23% of global CO2 emissions and 27% of end-use energy emissions. Carbon dioxide persists in the atmosphere for over a century, with long-term warming effects.27
Transport’s contribution to climate change involves:
● Long-lived CO2 emissions
● Short-lived black carbon generated primarily by diesel vehicles.
Potential CO2 emissions savings from the replacement of certain hydrocarbon tractors with electric orchard tractors on horticultural farms, can be calculated by estimating the possible sources of electricity and their relative carbon intensity. These can be compared according to their CO2 impacts per kilowatt hour, as follows:28
● Diesel has a high CO2 impact, at 2.65kg per kWh.
● A fully renewable source of electricity produces 0.04kg of CO2 per kWh.
● In 2018, electricity drawn from the current mix in the electricity grid is derived largely from coal (90%), generating 0.9kg of CO2 per kWh.
● By 2030, if the electricity from the grid achieves the Integrated Resource Plan (IRP) of the Department of Energy’s proposed 2030 mix, the 2.65kg of CO2 per kWh will reduce to 0.67kg.
About CO2e
To enable us to compare the warming effect of the 17 different GHGs, they are converted to a common basis called carbon dioxide equivalent – CO2e – expressed as ‘carbon emissions’ for short.
Page 14
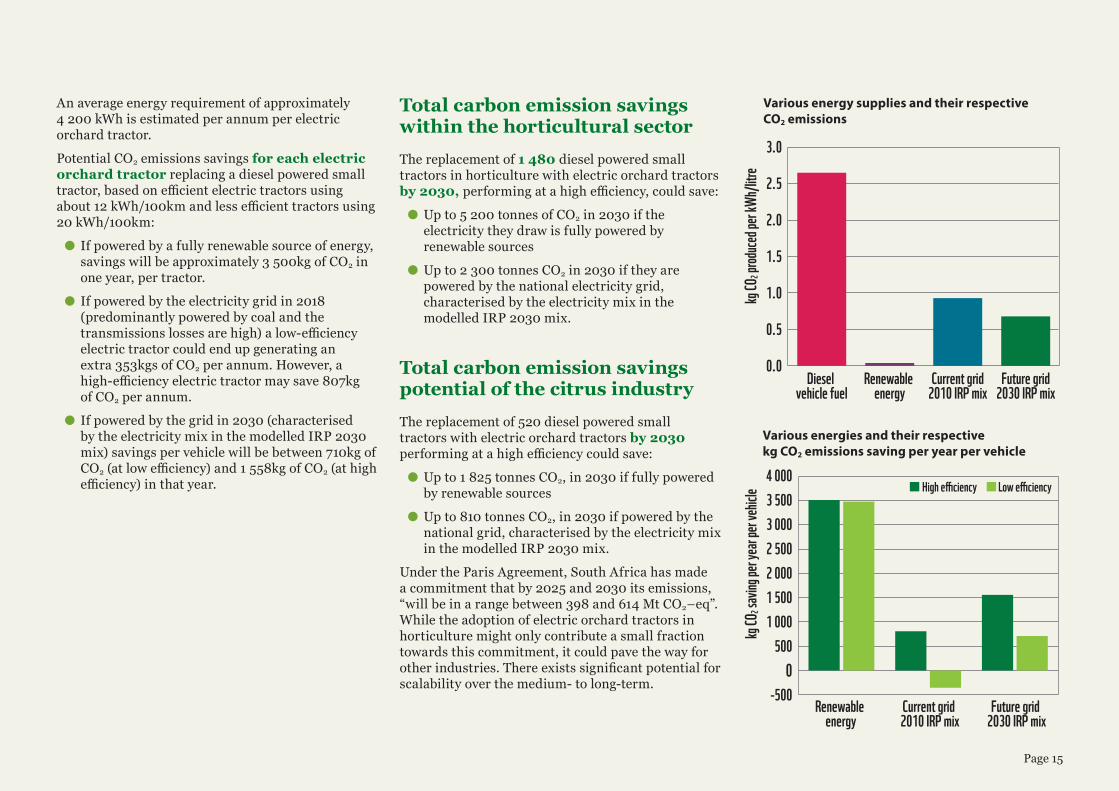
An average energy requirement of approximately 4 200 kWh is estimated per annum per electric orchard tractor.
Potential CO2 emissions savings for each electric orchard tractor replacing a diesel powered small tractor, based on efficient electric tractors using about 12 kWh/100km and less efficient tractors using 20 kWh/100km:
● If powered by a fully renewable source of energy, savings will be approximately 3 500kg of CO2 in one year, per tractor.
● If powered by the electricity grid in 2018 (predominantly powered by coal and the transmissions losses are high) a low-efficiency electric tractor could end up generating an extra 353kgs of CO2 per annum. However, a high-efficiency electric tractor may save 807kg of CO2 per annum.
● If powered by the grid in 2030 (characterised by the electricity mix in the modelled IRP 2030 mix) savings per vehicle will be between 710kg of CO2 (at low efficiency) and 1 558kg of CO2 (at high efficiency) in that year.
Total carbon emission savings within the horticultural sectorThe replacement of 1 480 diesel powered small tractors in horticulture with electric orchard tractors by 2030, performing at a high efficiency, could save:
● Up to 5 200 tonnes of CO2 in 2030 if the electricity they draw is fully powered by renewable sources
● Up to 2 300 tonnes CO2 in 2030 if they are powered by the national electricity grid, characterised by the electricity mix in the modelled IRP 2030 mix.
Total carbon emission savings potential of the citrus industryThe replacement of 520 diesel powered small tractors with electric orchard tractors by 2030 performing at a high efficiency could save:
● Up to 1 825 tonnes CO2, in 2030 if fully powered by renewable sources
● Up to 810 tonnes CO2, in 2030 if powered by the national grid, characterised by the electricity mix in the modelled IRP 2030 mix.
Under the Paris Agreement, South Africa has made a commitment that by 2025 and 2030 its emissions, “will be in a range between 398 and 614 Mt CO2–eq”. While the adoption of electric orchard tractors in horticulture might only contribute a small fraction towards this commitment, it could pave the way for other industries. There exists significant potential for scalability over the medium- to long-term.
0.0
0.5
1.0
1.5
2.0
2.5
3.0
Diesel vehicle fuel
kg CO
2 prod
uced p
er kW
h/litre
Future grid2030 IRP mix
Current grid2010 IRP mix
Renewable energy
-5000
5001 0001 5002 0002 5003 0003 5004 000
Future grid 2030 IRP mix
Current grid 2010 IRP mix
Renewable energy
kg CO
2 savin
g per
year p
er veh
icle High e�ciency Low e�ciency
Various energy supplies and their respective CO2 emissions
Various energies and their respective kg CO2 emissions saving per year per vehicle
Page 15
Socio-economic benefits
● Nearly all tractors currently sold in South Africa are imported, so there would be no direct impact on employment if these were replaced by imported foreign electric utility tractors.
● The development of a local electric orchard tractor, on the other hand, could create a number of manufacturing jobs. The direct job creation opportunity is estimated to grow from 17 employees in Year 1 (for 50 units) to 53 in Year 5, when 300 units are produced.
● Manufacturing to meet the potential demand of 1 481 electric orchard tractors in horticulture by 2030 could see a sizeable increase on this number. There would also possibly be an increase in servicing and in parts manufacturing if there is a large enough scale to create the opportunity to greater localisation of manufacturing of parts.
Barriers to the business caseCapital costs
● Initial costs of electric utility vehicle technologies are higher than those of hydrocarbon fuelled vehicles, particularly if they use Li-ion batteries.
Charging infrastructure and costs
● Charging infrastructure needs to supply the correct maximum voltage and to be situated in strategic central locations.
● Fast chargers are expensive.
Skills requirements and parts
● Skilled technicians need to service and maintain electric vehicles as they can be dangerous. At present these skills are not widespread.
● A sufficiently developed supplier base is also required to reliably provide parts. Without this local support, vehicle downtime could result, because components are flown in from elsewhere in the world.
Lack of demonstration and confidence in new technologies
● New technologies take some time to reach market acceptance. The risks to interruptions in farming operations are likely to be carefully assessed.
Risks associated with Li-ion battery technology
● Li-ion batteries are sensitive to vibration, heat, physical damage and operational abuse.
● Vehicle operators need to become familiar with safe operating principles to avoid dangerous safety incidents, such as battery fires.
● Regulators need to work with the recycling industry to develop the infrastructure for Li-ion battery recycling.
Page 16
Drivers of the business caseOverall cost of ownership29
Electric utility vehicles cost more to purchase but their operational costs are far lower, making them cheaper than hydrocarbon fuelled vehicles overall.
Benefits of electricity over diesel:
● The land rate (rural rate) for electrical energy is about R1.15/kWh versus R1.44 for diesel fuel kWh; and electricity prices are less volatile than fuel prices.
● Electricity has higher efficiencies, of at least 62%30 compared to approximately 30% for a diesel vehicle (hence the cost for an electric vehicle is less than R1.85/kWh and a diesel fuelled vehicle R4.80/kWh).
● The elimination of fuel consumption when idling.
Maintenance
● A diesel tractor has approximately 66 individual maintenance activities per year. An electric orchard tractor is expected to have only 28 individual maintenance activities per year. This is due to the reduction in moving parts in the drivetrain (no need to have a selectable gearbox nor differential).
● The effect is a savings of approximately R7 000 per year in maintenance.
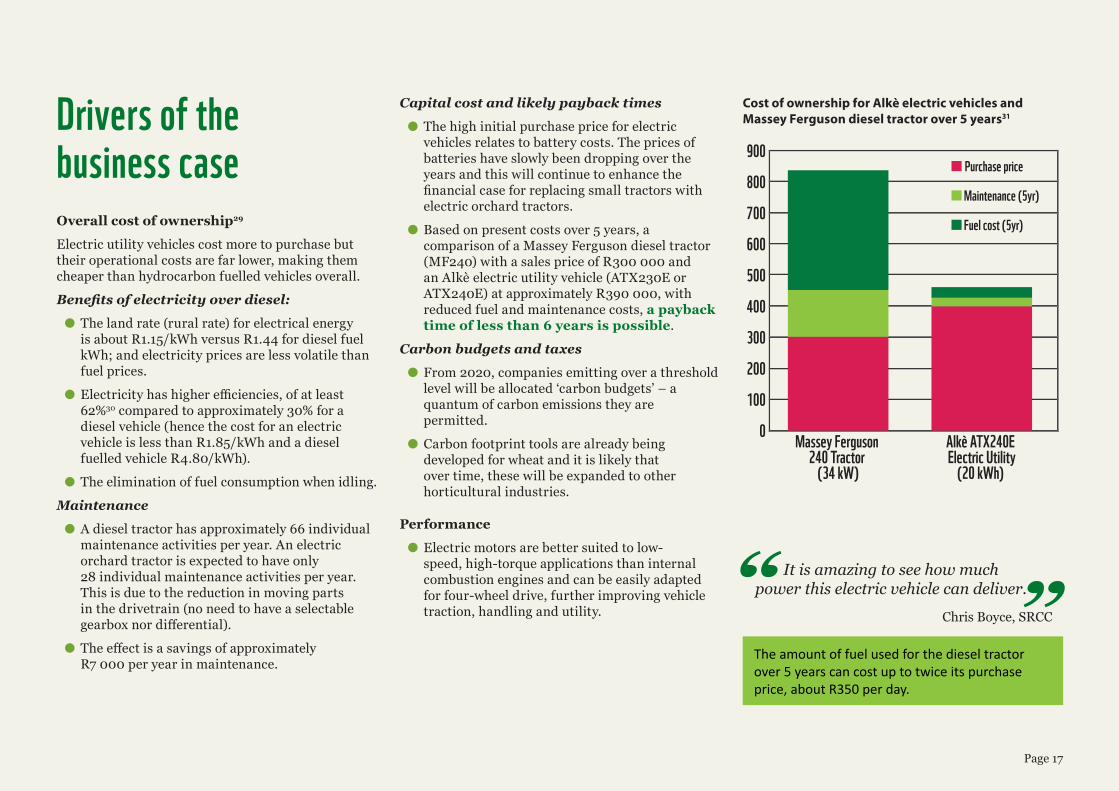
The amount of fuel used for the diesel tractor over 5 years can cost up to twice its purchase price, about R350 per day.
Capital cost and likely payback times
● The high initial purchase price for electric vehicles relates to battery costs. The prices of batteries have slowly been dropping over the years and this will continue to enhance the financial case for replacing small tractors with electric orchard tractors.
● Based on present costs over 5 years, a comparison of a Massey Ferguson diesel tractor (MF240) with a sales price of R300 000 and an Alkè electric utility vehicle (ATX230E or ATX240E) at approximately R390 000, with reduced fuel and maintenance costs, a payback time of less than 6 years is possible.
Carbon budgets and taxes
● From 2020, companies emitting over a threshold level will be allocated ‘carbon budgets’ – a quantum of carbon emissions they are permitted.
● Carbon footprint tools are already being developed for wheat and it is likely that over time, these will be expanded to other horticultural industries.
Performance
● Electric motors are better suited to low-speed, high-torque applications than internal combustion engines and can be easily adapted for four-wheel drive, further improving vehicle traction, handling and utility.
Cost of ownership for Alkè electric vehicles and Massey Ferguson diesel tractor over 5 years31
It is amazing to see how much power this electric vehicle can deliver.
Chris Boyce, SRCC
0
200
400
600
800
100
300
500
700
900
Alkè ATX240E Electric Utility
(20 kWh)
Massey Ferguson 240 Tractor
(34 kW)
Maintenance (5yr)
Purchase price
Fuel cost (5yr)
Page 17
Action pointsFarmers
● Farmers can support the adoption of the electric orchard tractor prototype for research and demonstration.
● They can participate in research and data provision to further build the case for the replacement of orchard tractors with electric orchard tractors.
Funders ● A vendor financing scheme could assist farmers with the purchase of electric orchard tractors and could be supported by a bank, or similar, linked to a line of concessional ‘green’ or ‘climate’ finance.
● The financing of further work on the local manufacture of an electric orchard tractor is critical to the viability of its localisation and the positive socio-economic impacts that could result.
Government ● Finalisation of the carbon tax and carbon budget regulations will provide a greater push towards electric vehicles.
● Finalisation and implementation of the Green Transport Strategy of the Department of Transport will provide regulatory support.
● Government should coordinate the recycling of batteries.
Page 18
Research houses/universities ● Further work is required to develop prototypes, and to include farmers in testing refinements, so as to begin local manufacture as soon as possible.
Specialist manufacturers or industrial engineering firms
● Such firms could become possible partners for the commercialisation of a locally manufactured electric orchard tractor.
Unions ● The development of a local manufacturing capability for electric orchard tractors could help create jobs and backward and forward linkages into parts manufacturing and servicing. Unions could support such an initiative.
Page 19
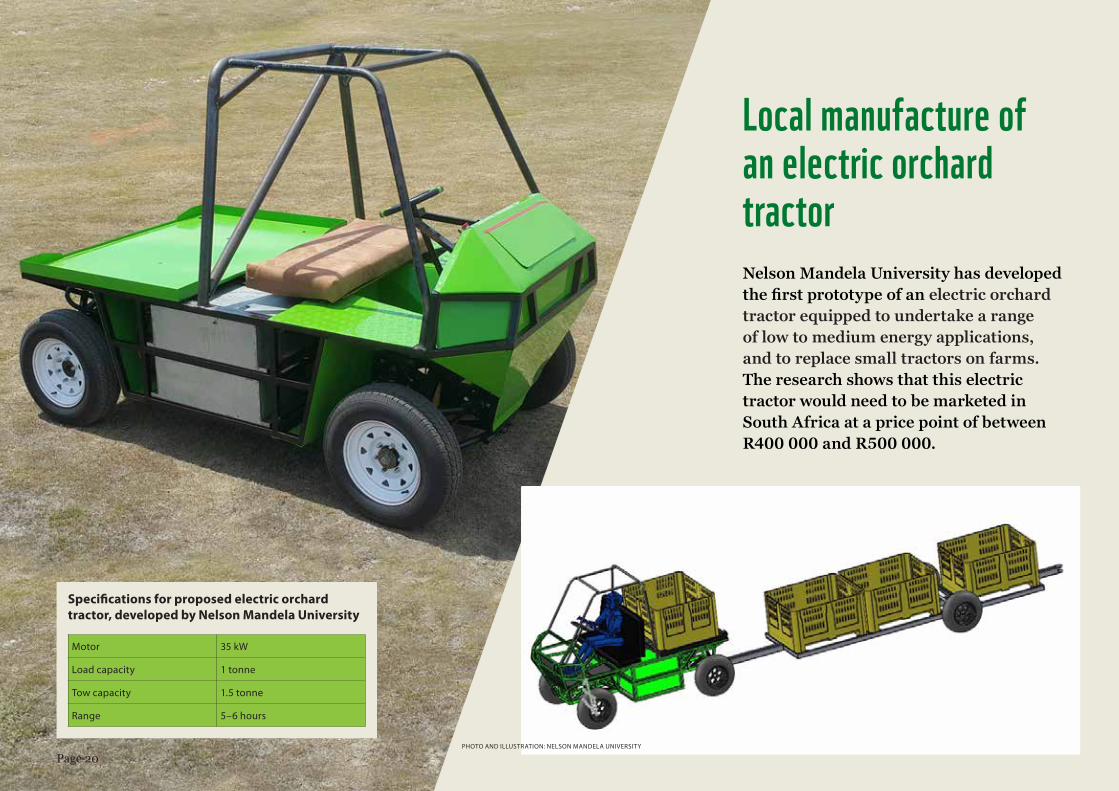
Local manufacture of an electric orchard tractor Nelson Mandela University has developed the first prototype of an electric orchard tractor equipped to undertake a range of low to medium energy applications, and to replace small tractors on farms. The research shows that this electric tractor would need to be marketed in South Africa at a price point of between R400 000 and R500 000.
Specifications for proposed electric orchard tractor, developed by Nelson Mandela University
Motor 35 kW
Load capacity 1 tonne
Tow capacity 1.5 tonne
Range 5–6 hours
PHOTO AND ILLUSTRATION: NELSON MANDELA UNIVERSITY
Page 20
CostingsPreliminary design work and calculations indicate:
● Manufacture of this electric tractor would start at 50 units per year, with sales predicted to increase to 300 tractors by Year 5, which equates to 4.7% of tractor sales in South Africa.
● The cost of components and materials for the vehicle are expected to be in the region of R270 000 (excluding labour).
● Initial overhead start-up expenses are estimated at about R16 million, consisting of facility hire, equipment purchases and other costs such as legalities, fees, renovations and installation. The profits generated, are predicted to pay back this initial investment within three years.
● The job creation opportunity increases from 17 employees in Year 1, to 53 in Year 5, when 300 units are produced annually.
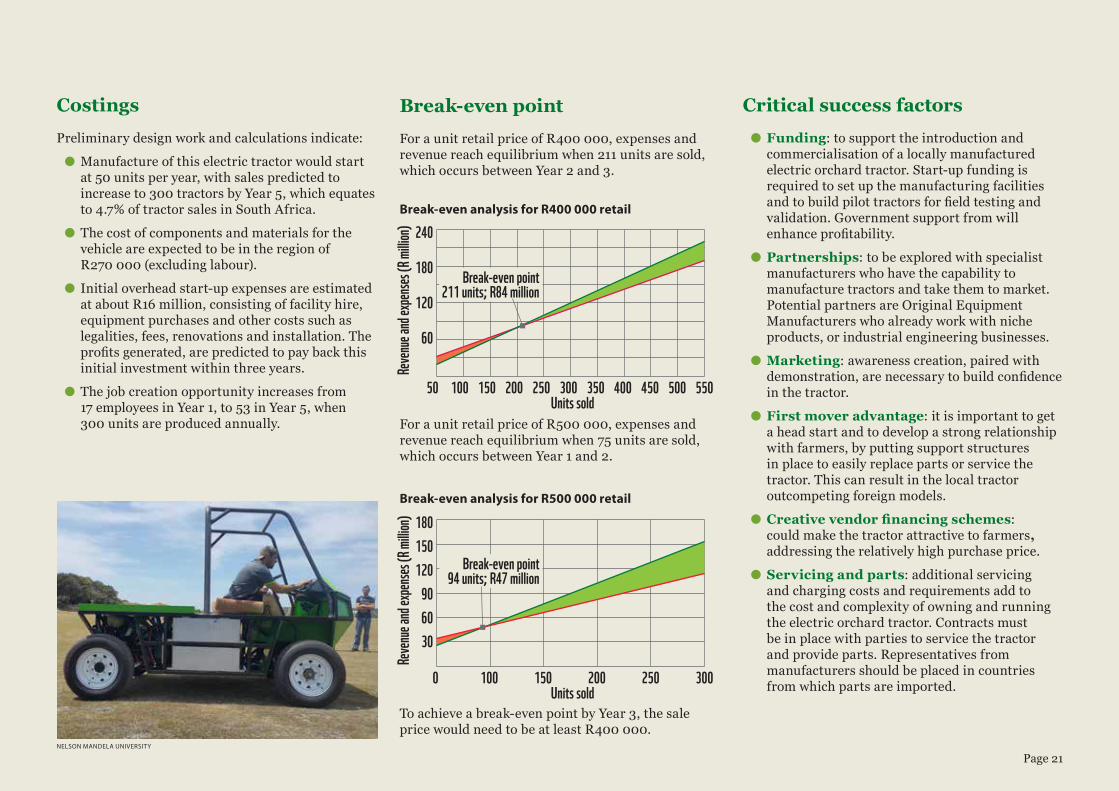
Break-even pointFor a unit retail price of R400 000, expenses and revenue reach equilibrium when 211 units are sold, which occurs between Year 2 and 3.
Break-even analysis for R400 000 retail
For a unit retail price of R500 000, expenses and revenue reach equilibrium when 75 units are sold, which occurs between Year 1 and 2.
Break-even analysis for R500 000 retail
To achieve a break-even point by Year 3, the sale price would need to be at least R400 000.
Critical success factors ● Funding: to support the introduction and commercialisation of a locally manufactured electric orchard tractor. Start-up funding is required to set up the manufacturing facilities and to build pilot tractors for field testing and validation. Government support from will enhance profitability.
● Partnerships: to be explored with specialist manufacturers who have the capability to manufacture tractors and take them to market. Potential partners are Original Equipment Manufacturers who already work with niche products, or industrial engineering businesses.
● Marketing: awareness creation, paired with demonstration, are necessary to build confidence in the tractor.
● First mover advantage: it is important to get a head start and to develop a strong relationship with farmers, by putting support structures in place to easily replace parts or service the tractor. This can result in the local tractor outcompeting foreign models.
● Creative vendor financing schemes: could make the tractor attractive to farmers, addressing the relatively high purchase price.
● Servicing and parts: additional servicing and charging costs and requirements add to the cost and complexity of owning and running the electric orchard tractor. Contracts must be in place with parties to service the tractor and provide parts. Representatives from manufacturers should be placed in countries from which parts are imported.
Reven
ue and
expe
nses (
R millio
n)
3002502001501000
60
120
30
90
150180
Units sold
Break-even point94 units; R47 million
Reven
ue and
expe
nses (
R millio
n)550450350250150 50040030020010050
60
120
180
240
Units sold
Break-even point211 units; R84 million
NELSON MANDELA UNIVERSITY
Page 21
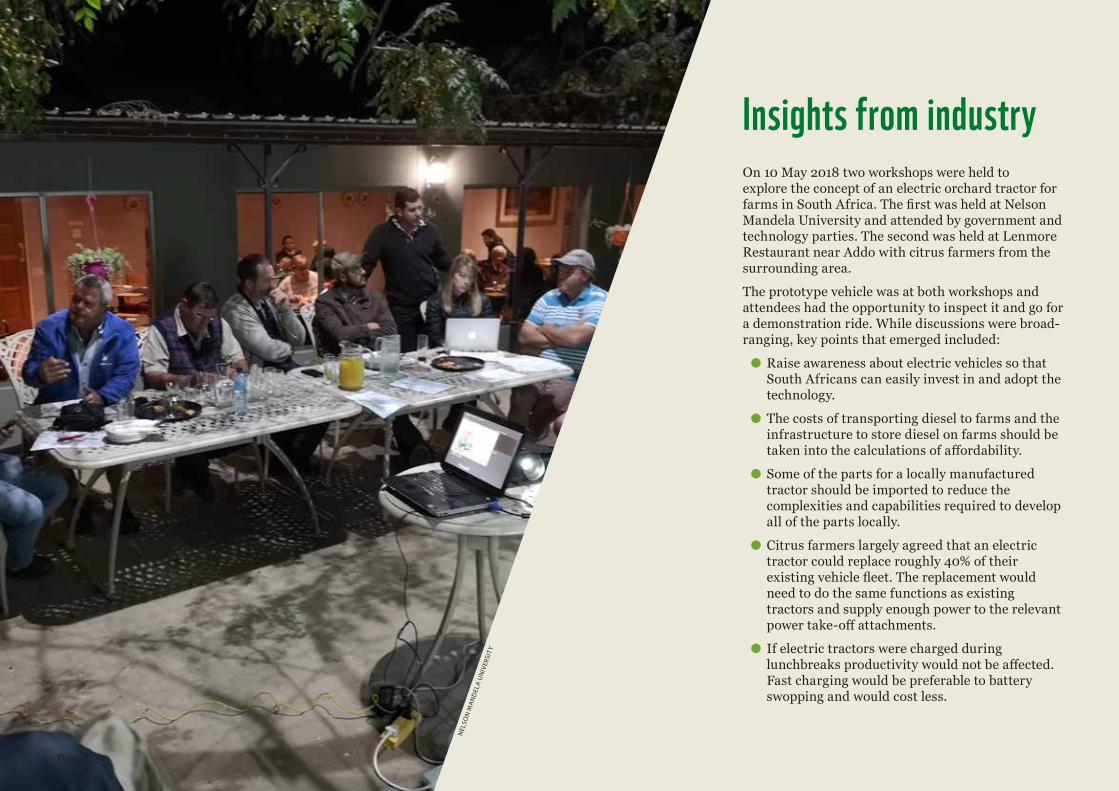
Insights from industryOn 10 May 2018 two workshops were held to explore the concept of an electric orchard tractor for farms in South Africa. The first was held at Nelson Mandela University and attended by government and technology parties. The second was held at Lenmore Restaurant near Addo with citrus farmers from the surrounding area.
The prototype vehicle was at both workshops and attendees had the opportunity to inspect it and go for a demonstration ride. While discussions were broad-ranging, key points that emerged included:
● Raise awareness about electric vehicles so that South Africans can easily invest in and adopt the technology.
● The costs of transporting diesel to farms and the infrastructure to store diesel on farms should be taken into the calculations of affordability.
● Some of the parts for a locally manufactured tractor should be imported to reduce the complexities and capabilities required to develop all of the parts locally.
● Citrus farmers largely agreed that an electric tractor could replace roughly 40% of their existing vehicle fleet. The replacement would need to do the same functions as existing tractors and supply enough power to the relevant power take-off attachments.
● If electric tractors were charged during lunchbreaks productivity would not be affected. Fast charging would be preferable to battery swopping and would cost less.
NEL
SON
MA
ND
ELA
UN
IVER
SITY
Page 22
● With improving technology, there are possible applications and opportunities for this electric tractor, for example, new static sprayers require less torque and could be done more readily by an electric tractor.
● Citrus farmers suggested improving the future models, including the adoption of narrower models specifically for orchard applications.
Endnotes1. Intergovernmental Panel on Climate Change, Fifth Assessment Report.
Chapter 8, Transport. Available online.2. Hao, H., Ou, X., Du, J., Wang, H. & Ouyang, M., 2014. China’s electric
vehicle subsidy scheme: Rationale and impacts. Energy Policy. 73(1):722–732.
3. C40 Fossil fuel streets. 2018. Available online.4. Frost & Sullivan, 2018. Global Electric Vehicle Market Outlook.
Available online.5. Lutsey, N., Grant, M., Wappelhorst, S. & Huan Zhou. 2018. Power
play: how governments are spurring the electric vehicle industry. International Council on Clean Transportation. Available online.
6. Author’s own research derived from various websites.7. Authors’ own research derived from various websites. 8. Bloom, C., 2017. http://africaelectriccar.blogspot.co.za/2017/.9. Staff writer, 2017. https://businesstech.co.za/news/motoring/181669/
how-much-it-costs-to-buy-and-own-an-electric-car-in-south-africa/.10. CARmagazine, 2012. Optimal Energy shutting down. Available online:
http://www.carmag.co.za/news_post/optimal-energy-shutting- down/.11. uyilo.org.za. 2013 [cited 15 March 2018]. Available online: http://uyilo.
org.za/.12. Authors own research.13. De-leon, S., 2017. Energy Storage Seminar, Protea Marine Hotel,
Summerstrand, Port Elizabeth, South Africa: Shmuel De-Leon Energy Ltd.
14. Agrico, 2017. AGRICO 4+. Available online: http://www.agrico.co.za/agrico-tractors/.
15. Kuschke, J.G.I., 2016. “Agriculture – Market Intelligence Report,” GreenCape.
16. The average total energy requirement for the electric vehicle on farms is approximated to 8 395. 45 kWh in one year (authors’ own calculations). If the electric vehicle is implemented on all horticultural farms in South Africa, the total energy increase on the grid can be calculated as being roughly 67.5 MWh in one year. With Eskom’s annual sales of electricity being 201 GWh for 2016 the electricity sales would need to increase by 0.034% to accommodate horticultural farms alone and by 0.084% to accommodate both grain and horticultural farms.
17. Breen, J., 2018. How many tractors are sold in the world and who buys the most? Available online: http://www.agriland.ie/farming-news/how-many-tractors-are-sold-in-the-world-and-who-buys-the-most/.
18. Global Wheeled Tractor Market Report, 2017-2021. Available online: https://www.prnewswire.com/news-releases/global-agricultural-tractor-market-report-2017-2021-300520325.html.
19. Stats SA, 2017. Agricultural Survey. Statistical release, p 1101. Pretoria, South Africa.
20. South African Agricultural Machinery Association (SAAMA). http://www.agfacts.co.za/.
21. Directorate Statistics and Economic Analysis, 2016. Abstract of Agricultural Statistics. Pretoria, South Africa: Department of Agriculture, Forestry and Fisheries.
22. Department of Agriculture, Forestry and Fisheries, 2016. A profile of the South African Citrus market value chain. Available online.
23. Citrus Growers Association. Available online at cga.co.za.24. Hensley, Knupfer & Pinner, 2018. Three surprising resource
implications from the rise of electric vehicles. McKinsey Quarterly. Available online.
25. The World Bank, 2004. Agricultural machinery, tractors per 100 sq.km of arable land. Available online.
26. Author’s interview with Gerber, D., Addo, 2018; and with Baker, A., Addo, 2018.
27. International Panel on Climate Change, 2014. Available online.28. Stroud, T., Freere, P., van Greunen, E., Serfontein, R & Smith. T.,
2018. Market survey electric agricultural vehicles, 22_5_2018. Nelson Mandela University.
29. Full battery replacement for electric vehicles is excluded from this comparison as the estimated life of new lithium ion batteries would last for the minimum lifespan of the vehicle itself future resale / retirement value and vehicle depreciation.
30. All-Electric Vehicles. Available online: www.fueleconomy.gov. 31. Alke and Massey Ferguson have been used as they both have higher
load capabilities than the John Deere Gator rendering them more suitable for the comparison.
Page 23
LAND USE: Conservation agriculture
TRANSPORT: Farm Torque: electric orchard tractors
ENERGY: Solar thermal technologies
WASTE: Surplus food from farms and �rms onto forks
INDUSTRY: Eco-blend cements for low-carbon construction
INDUSTRY: Cement sector: Life Cycle Optimisation Service
The WWF IKI climate-smart business series includes: Author team:
T. Stroud, P. Freere, E. van Greunen, R. Serfontein and T. Smith , Nelson Mandela UniversityMaterials development and editing team: Kate Rivett-Carnac, Barbara HuttonDesign: Farm Design, www.farmdesign.co.za Cover photograph: Nelson Mandela UniversityPhotos: Unless otherwise indicated, all photos by Shutterstock.comAvailable at: www.wwf.org.za/report/farm_torque_electric_orchard_tractorsCopyleft: If you would like to share copies of this paper, please do so in this printed or electronic PDF format. You are welcome to quote the information from the paper provided that you acknowledge the source: T. Stroud, P. Freere, E. van Greunen, R. Serfontein and T. Smith, 2018. Farm Torque: electric orchard tractors, WWF South Africa.For WWF: Saliem Fakir, Head: Policy and Futures Unit Telephone +27 (0)21 657 6600 e-mail [email protected]
WWF’s Policy and Futures Unit undertakes enquiry into the possibility of a new economy that advances a sustainable future. The unit convenes, investigates, demonstrates and articulates for policy-makers, industry and other players the importance of lateral and long term systemic thinking. The work of the unit is oriented towards solutions for the future of food, water, power and transport, against the backdrop of climate change, urbanisation and regional dynamics. The overarching aim is to promote and support a managed transition to a resilient future for South Africa’s people and environment. The organisation also focuses on natural resources in the areas of marine, freshwater, land, species and agriculture.
wwf.org.za
Why we are here
wwf.org.za/energy
To stop the degradation of the planet’s natural environment andto build a future in which humans live in harmony with nature.
© 1986 Panda Symbol WWF-World Wide Fund for Nature (Formerly World Wildlife Fund)® “WWF” is a WWF Registered Trademark. WWF, Avenue du Mont-Blanc, 1196 Gland, Switzerland – Tel. +41 22 364 9111 Fax +41 22 364 0332. For contact details and further information, please visit our international website at wwf.panda.org
The climate change mitigation debate in South Africa needs to move from improving efficiency within a projection of the existing economy, to innovation and options beyond the constraints of the current dispensation and structure of the economy. It may take step changes in the development path to achieve mitigation adequate to South Africa domestic and international commitments, and to maximise economic development and social wellbeing. Business models presently unconsidered may be waiting in the wings.
The ‘Low-carbon development frameworks in South Africa’ project seeks to deepen understanding of, and reveal opportunities for, transitions to a low-carbon economy. It facilitates and develops contributions at the intersection of climate change mitigation, economic development and socio-economic dimensions, across immediate, medium and long-term horizons.
Working variously with government, business and labour, the project reaches from providing input to emerging government mitigation policies and measures; through investigating the business and socio-economic case for selected mitigation initiatives which hold growth potential in energy, transport, industry, waste, and land use; to analysing potential future economic trajectories and the systemic opportunities offered by these.
The project is funded by the International Climate Initiative (IKI) of the Federal Ministry for the Environment (BMU) of Germany, and implemented by WWF South Africa.
Building a sustainable and equitable future. FOR NATURE. FOR YOU.