Embed Size (px)
Citation preview
F"
iI
TECHNICAL NOTES
NATIONAL ADVISORY COMMITTEE FOR AERONAUTICS
No. 976
CASE FI LECOPY
THE LIMITING USEFUL DEFLECTIONS OF
CORRUGATED METAL DIAPHRAGMS
By W. A. Wildhack and V. H. Goerke
National Bureau of Standards
Washington
December 1942


NATIONAL ADVISORY COMMITTEEFOR AERONAUTICS
TECHNICAL NOTE NO. 876
THE LIMITING USEFUL DEFLECTIONS OF
CORRUGATEDMETAL DIAPHRAGMS
By W. A. Wildhack and V. H. Goerke
SUMMARY
The limiting useful deflection of a diaphragm may bedefined as that deflection which is followed by an arbi-
"trarily chosen allowable limit of hysteresis, aftereffect,drift, or zero shift. Preliminary results reported pre-viously indicated that the limiting deflection is mainlydependent on the diameter, and the material, and onlyslightly dependent on the thickness of the diaphragm.
In order to investigate further the useful limits ofdiaphragm performance, me_sureme_It_ have been made on alarge number of corrugated diaphragms of similar shapesbut of various sizes and various metals. The materialsstudied include phosphor bronEe, beryllium copper,A-Nickel, B-Monel, K-Monel, and Inconel. The apparatusused in making the measurements is described.
Data were obtained on the relations between pres-sure and deflection, deflection and hysteresis, time anddrift under constant load, time and recovery after re-lease of load, and zero shift and deflection for the va-rious diaphragms. Many of the r_sults are presentedgraphically. The performances of the different materialsare compared and the characteristic constants for eachmaterial are deduced for use With design formulas.
The results are anaiy_ed to determine the correla-tion of the limiting deflections with the thicknesses anddiameters of the diaphragms and the elastic propertie_ ofthe materials used.
INTRODUCTION
Metal diaphragms are useful in measurement of pres-sures because of their ability to give definite deflections
f •

2 NACA Technical Note 17o_ 876
as a function of the appilied pressure. They fall short
of perfection because their strength decreases with in-
creasing sensitivity and because metals show deviations
from ideal elas:tic behavior, hereinafter referred to as
"elastic defects," such as drift, hysteresis, aftereffect,
and zero shift.
Because of their numerous applicalion.s in aircraft
pressure-measuring instruments, the National Advisory
Committee for Aeronautics has financiall7 supported an
investigation at the Nati0nal Bureau of Standards on the
properties and design of corrugated diaphragms.
It is apparent that, other things being eaual, the
diaphragm most generally useful is.the one wSth the
greatest sensitivity, that is, the greatest ratio of de-"
flection to load. For a given thickness and diameter,
flat diaphragms are initially more sensitive (that is,
the ratio of deflection _o slight applied pressures is
greater) than corrugated diaphragms. Corrugated dia- .
phragms are, however, almost univezsally used in pressure-
measuring instruments because their average, sensitivlty
over a large range of pressure is greater than that of
flat diaphragms of the same size, their zero-positlon
under no load is m0re stable, and a rather-wide range of
pressure-deflection relations may be obtained for a given
size of diaphrag$ by using different d_pths or shapes of
corrugation. In.:general, the corrugated diaphragms can
stand much larger deflections without permanent deforma-
tion. ....... '..... •
The theory of circular flat diaphragms, both with
clamped and with free edges, has been developed with some
success (references I to,7). ' An approximate formula in-
dicating the "general effects of change of corrugatfon out-
line has recently 'been derived (reference 8) b_t it has
not been possible to evolve satisfactory tkeoretical de-
sign formulas for corrugated diaphragms.
In the first phase of the investigation at this
Bureau, the results of which have been published in ref-
erence 9, generalized design formulaswere derived by
dimensional analysis of experimental data obtained from a
series of dimensionally similar diaphragms. 0nly one
corrugation outline was studied, and deflections were
limited to the linear range, 2 or 3 percent of the diam-
eter D. The materials used included beryllium copper,
phosphor bronze, and Z-Nickel,
_.

NAOA Technical Note No. 876
The work reported herein extends the previous work
to Several other materials and to higher deflections and
correlates the limiting useful deflections of diaphragms
of the various materials with the elastic defects ob-
served, with the elastic constants of the materials, and
with the thicknesses and diameters of the diaphragms.
FACTORS AFFECTING PERFORMANCE OF DIAPHRAGMS
Similar diaphragms made of different materials differ
in stiffness, as would be expected because of the differ-
ent elastic moduli, and also in the deflection which they
will stand without permanent deformation. The performance
of a diaphragm is determined by both geometrical and me-
chanical factors, such as size, shape, and method of hold-
ing the edges, and by the intrinsic elastic properties of
the materials of which it is made.
It is logical as well as convenient to separate, as
much as possible, the effects of variation of the mechan-
ical factors from those due to variation of elastic prop-
erties from one material to _no_her. In this investiga-
tion, the mechanical factors of unknown effect were held
fairly constant by using only one shape (the different
sizes were dimensionally similar) and by always clamping
the edges in the same manner. The thickness and the di-
ameter are, of course, geometrical variables; their gross
effects on stiffness have alread_ been studied in part.
The previous study was limited mainly to deflections of
less than 2 or 3 percent of the diameter. Over this
range, the pressure-deflection relationship is very
nearly linear (within 1 or 2 percent) for this shape.
Data have now been obtained on the pressure-deflection
characteristics up to t_e maximum useful deflections,
which for some diaphragms is nearly 8 percent of the di-
ameter. Knowledge'of the characteristics of one diaphragm
shape was thus extended. This knowledge is of some value
per se and may be helpful when it is possible to compare
the characteristics of diaphragms of several shapes and
thus obtain more general design formulas.
The maximum useful, or "limiting," deflection of a
diaphragm is a some_hat indefinite quantity. For in-
stance, a diaphragm may continue to deflect slowly under
a constant load to an undesirable extent or fail to return
immediately to its zero position upon r_lease of load,

4 NACA Technical Note_No. 875
even thoUgh'.it may:regain its-original position after asufficiently long time. ' For this reason, no single valueis to be taken_asthe limiting deflection of a diaphragmfor all _purposes. The useful limi_ts are to be defined interms.lof the elastic defects which beoome apparent underincre:asing loadsl These elastic defects include:
1, Hysteresis - the difference between the deflec-tions of_the diaphragm at a given load,..:for, decreasingand for increasing loads
2_ Drift _- the increase of deflection'width timeunder a constant load . .
3_. Aftereffect - the deflection-rem_ining _mmedi-at ely after removal of the loa-d,that i_, hysteresis atno load ....
4. Recovery - the decrease of af-tereffect with timeunder no load. (The term may also be applied to the timedecrease of hyst'e.res-is-.at a const._nt load b_t was notstudied in this. s.en_s.e_)
5. Zero shift - the permanent deformation, that i.s,_the difference in.._ero pos.itlon befo_re loading and suffi-ciently long after unloading for recovery to occur; orthe difference be.t,_een _ftereffect_i and recovery
Zero shi.ft.ap_ear_ .to..be a. fairl_ absolute _measureo.f_useful deflecti_on,/ that i.s, if e_ch lo:ading causespermanent d-eformation,i it is apparent tha_t the loa.dingscannot be Tepeated indefinitely.Even this criterion is,however, to be clo's'ely scrutinized. Many diaphragms willshcw some zero sl_ift after each of the first loadings.Afterward their performance (up to that load) becomesstabilized and they are said _o be seasoned. It ischar-.acteristic that imposition of a higher load will againcause a zero shift, which wil:l decrease with succeedingloadings and stabili.ty may again, be obtained. Heat treat-ment for stress relief will often rle_uce the number ofworkings necessary to attain stability, • There finallycome_ a point, however, at which the tota:l deformationincident to the working is so great that the characteris-tics of th.e diaphr.agm over the low-pressure range are en-tirely dlffer_nt from the. original. Alt.er, nat ively, thediaphragm may break during seas-oning before stability is
:.: attained.

NACA _echnical Note No. 876 5
As a practical definition, the useful limit may beconsidered to lie in the range where the elastic defectsbegin to increase sharply with increasing deflection.The determination of the course of these defects as func-tions of deflection, time, number of 1_Torkings, heat treat-ment, and material involves an almost impossible amount
of testing. The results obtained are therefore indica-tive rather than comprehensive, qualitative rather thanquantitative, and comparative rather than exact.
In many cases the useful limit may be only indirect-ly related to the limiting factors previousl Y mentioned.It may be more important to use only that part of therange in which the pressure-deflection characteristic, orsome other relation, is best suited to the particular ap-plication. It is the intent of this paper to presentdata in tables and in curves that will enable the user todetermine the practical limits for a particular purpose.
MATERIALS
A list of possible materials for diaphragms _ould bequite extensive, since the varying conditions of theiruse will include as desirable propertie_ many other fac-tors besides elastic behavior. Slack diaphragms of fabricor rubber have long been used to attain an approach tozero stiffness. Fiber or paper diaphragms serve for sonicpurposes. Quartz, glass, and plastics are possible mate-rials for elastic diaphragms although unknown as yet inpractice. Metal diaphragms are, of course, used in pres-sure-responsive devices for many applications, from sensi-tive barometric variometers which respond to a whisper tohigh-range indicators of explosionpressures. The choiceof metal iS often governed by chemical properties (espe-cially7 corrosion resistance), finish, appearance, and byprice, as much as by the mechanical or elastic proper-ties. In the final design, the more data there are avail-able. on mechanical and elastic properties, the better thechoice that can be made. The metals of which diaPhragmsare most commonly made are phosphor bronze, beryllium-copper alloys, nickel, nickel alloys, and.steel. Aluminumalloys have not had much application in this field. Thediaphragms are usually stamped or pressed, rarely spun,from sheet stock of uniform thickness.

6 NACA Technical Note _o. 876
In the present investigation, test_ have been madeon diaphragms of phosphor bronze, beryllium copper,A-Nickel, and the nickel alloys B-Monel, K-Monel, _ndInconel.
Chemical analyses were made of some of the materials.
The compositions are given in table I. Complete analyses
were not made on the nickel alloys; therefore, only nom-
inal compositions for th,se alloys are listed.
Hardness measurements wor_ made with a Knoop indenter
(reference 10) on many of the materials before and after
the working incident to formation and after heat treat-
ment, if any. The indentations were made on the top of
the diaphragm corrugations after the material had been
sufficiently polished to remove most of the oxide coat.
In general, there was no significant variation from one
corrugation to another. The _noop indentation numbers
are very roughly equivalent to Brineil numbers that micht
be obtained on thicker s_;ecin_ens of the same materials.
The results ar_ given in table II.
The hardness of the various materials is of impor-
tance as an indication of the attainment of the optSmum
physical properties. For maximum deflection a diaphracm
of a given material should be so formed _nd stress-
relieved that the diaphragm has the maximum possible hard-
Bess,
Phosphor _ronze
The phosphor bronze was obtained in strips 3 to 6
inches wide and of nominal thicknessa%0.002, 0.003, 0.004,
0.006, and 0.008 inch. The percentage of the various con-
stituents of the alloy as determined by chamical analysis
is included in table I.
Heat treatment,- The material as received had been
hardened by cold rolling and wa_ found to be too hard to
form satisfactorily in the die_ used. In order to soften
the material, the orocedure followed in Drevious work
(reference 9) was first used. This procedure consisted
in heating the diaphragm blanks, packed in carbon, for
1 hour at 425 ° C. After thi_ treatment, the material
could be satisfactorily formed. The elastic properties
of the diaphragms were found to be poor. The same period
of heating at 390 ° C necessitated formation in two stages,
NACA Technical Note No. 876 7
but performance was somewhat improved. A heat treatmentdescribed by Harrington and Thompson in reference ll _asthen tried, although the treatment had been developed fora phosphor bronze of somewhat different composition. The
blanks were heated in carbon as before but at 250 o C far100 hours. The diaphragms could then be formed, althoughwith some difficulty°
The performance of diaphragms m_de of the materialannealed at 425 o C could be stabilized at 2 percent D(center deflection = 2 percent of diam.) by considerableworklng or by heat treating at 300 ° C for 1 hour followedby several loadings. With the 100-hour, 250 ° C treatmentbefore forming, some improvement in the elastic proper-ties was apparent. After considerable working, stabilitycould be attained up to about 4 percent D. If a furtherheat treatment of 50 hour_ at 250° C following formationwa_ given, the performance could be stabilized by moderateworking *for deflections up to 5 percent D.
Although the heat treatment ap01ied was oossibly not
the best possible for the phosphor- bronze used in this
investigation, special studies of he_t treatment are be-
yond the scope of this work.
Hardness_- Hardness measurements _vere made on samples
of the sheet stock, on diaphragm blanks that had been
given the preliminary heat treatment (1 hr at 425 ° C, or
100 hr at 250 ° C), on formed diaphragms, and on diaphragms
after the stress-relief treatment (50 hr at 250 ° C). The
results are given in table II.
The heat treatment at 4250 C reduced the Knoopinden-
tation number to about half its original value, while the
250 o C heat treatment decreased the Knoop indentation num-
ber by less than 20 percent in most cases. Formation of
diaphragms of phosphor bronze that had been heat-treated100 hours at 250 C increased the hardness to a little
below its initial hardness. Other materials show an in-
crease of indentation number incident to formation up to
more than double that of the blank. The stress-relief
treatment (50 hr at 250 ° C) reduced the hardness to about
the same value as before the forming.
It is apparent that the 100-hour, 250 o C heat treat-
ment relieved the stresses with much less reduction in
hardness than did the 1-hour, 425 ° C treatment.

8 I_ACATechnical l_ote ]To. STC
B@ryllium Copper
The beryllium copper wa_ obtained in strip form 3 to6 inches wide and in thicknesses of 0.002, 0.003, 0.004,0_005, and 0.008 inch. A few di_ks l_ inches in diameterand 0.013 inch thick were also obtained. 0nl_" dead-solftmaterial was used, since material hardened by rollingcould not be easily formed to the sha_oe of the dies. Thecomposition as determined•by chemical analy,qi_ is includedin table Io '_
n_at treatment.- After the _i_a'_hr_gm_ were formed,
they were heated for I hour at 300 ° -C Thi_ treatment
gives good results, but more recent ad%_ice from the
Beryllium Corporation _a_ed o[ work _ with _prings •suggests
that a higher te_per_ture would perhaps be better for re-
ducing the drift under load. ResUlt_ of tests of a few
diaphragms of a digferent a]l_y _ (3er,vlco No, 2_, described
in reference 12), which _vere heated ToT 2 hours at 330° C,
are included in this r_nort.
The diap_ra_<ms in Lnis inve_-:_[_iation ,,_ere hehted in
air w{thout clamping. The discoloration due to the forma-
tion of a thin black oxide film during heating could be
easily removed by hydrochloric acid without appsrent
change in the performance of the diaphragms,
Hardness.- Meas_irements were made on samples of _'he
soft sheet stock as received, after heat. treatment , and ,
on the diaphragms, after heat treatme'nt • Th4" result, _ are
listed in table Ii. ..... "-i _ _ !A _"
The heat treatment increased the Knoop hardness num-
ber from 125 to about o35. The very small difference ofhardness between the heat-treated sheet sto_ck and the
heat-treated diaohr_gms indicates that th_ working inci-
dent to formation had little effect on the final hardness
of the _'orme d diachragms./
PreciDitation-hsrdenable alloys, such a_ beryllium ....
copper, have the advanta_e that the diaphragms can be
formed from the relatively soft material; wherea_ materi_
ale that depend for their final hardness on the hardness
of the blank and the work hardening incident to formation
must be formed from blanks of the msxi._um permi_sib!ehardness. " "

NACA Technical Note No. 876 9
Nickel and Nickel Alloys
The nickel and the nickel alloys were supplied
through the courtesy of The International Nickel Company,
Inc. which also heat-treated the diaphragms m_de of
K-Monel. Four materials were supplied: A-Nickel, B-_onel,
K-Monel, and Inconel. The materials were of one thickness,
0.006 inch, and were supplied in annealed soft and in the
rolled quarter-hard conditions. Data on chemical compo-
sition are included in table I.
Heat treatment.- Most of the diaphragms of A-Nickel
and B-kionel were given a stress-relief treatment after
formation, This treatment consisted in heating the dia-
phragms in carbon at _S0 ° C for 1 hour. Inconel was given
a stress-relief treatment at 425 ° C. A few of the dia-
phragms that had not been given the stress-relief treat-
ment were also tested.
After being formed, the diaphragms of K-M0nel were
heat-treated by the International _ickel Company for 16
hours at 580 ° C. (See reference 13.)
Hardness.- Measurements similar to those on the other
materials were made on alll of the nickel allOYs. The data
are recorded in table II.
The Knoop indentation number for A-Nickel was raised
from 80 to 170 during the process of format!on and stress
relief. The Knoop indentation numbers for these dila-
phragms were considerably higher than for the quarter-
hard sheet stock (Knoop indentation number 148). This
increase in hardn.ess indicates that the hardening incident
to formation was m0re than equivalent t 9 that obtained by
rolling ouarter-hard. Diaphragms could not be formed of
the quarter-hard material-beoause rupture 0¢curred in theearly stages Qf formation ....
The stress-relieved B-Monel diaphragms formed from
the soft material had a Knoop indentation number of 200,
the soft stock, a Knoop indentation number of 102. Dia-
phragms could not be successfully formed from the quarter-
hard stock B'Monel with a Knoop indentation number of 222.
Diaphragms of K-Monel were successfully formed of
the soft material and, by the use of light clamping
forces, of the ouarter-hard material. The Knoop indenta-
tion number of the soft K-},ionel was increased from 192 to

i0 NACA Technical l_ote No. 876
273 during formation, and to 3_4 by th_ precipitationhardening. Similarly, the indentation number of thequarter-hard material was increased from 215 to 335. Thefinal hardness of the K-._ionel diaphragms was about _aualto thnt of the beryllium coo_er.
The strip Inconel was the h_r_est of the nickel al-loyS, with a Knoop indentation number of 248 for the softmaterial. After formation sod _tress relief, it was aboutas hard ss K-Monel or beryllium copper.
MANUFACTUREOF THE Di -_ '_
The diaphragms.used in making the_e tests were made
by the method of hydraulic pressing. Dies of four sizes
were used, all hav'_i.._ dimensionally similar shapes, ss
_hown in figures i and 2. The depth of all of tke corru-
gations was 0.0167D, e×ceot the outer offsetting corruga-
tion, which was a 120 o arc of radius D/16 The effective
diameter_ D of the dia0hragms formed with these dies
were I_, _,° 2_, and 3 inche_. Th=. rim width wa_ one-
fourth inch for all sites. The outside die, meter w9_ the
same for all the dies; they could, therefore, be used in-
terchangeably with the s_me b_e.
The apparatus used for mnking th._ di_ohragms included
a hand-o_er:_ted hydr2ulic _res_ of 18 .tons Cap'acity; a
hydraulic pump, also hand oDer,sted; the dies; a basefor
the die; psper gaskets; &ental dam; and circulai metal
blanks. The ipress _a_ used to clamp the die and its base
and was _Is0_sed in the course of testing the diaphragms.
Figure 3 is a Rh0to_ra[ch of the press with the te_ting
apparatus. When the press w'_s used for making the dia-
phragms, the micrometer tip A, seen projecting below the
upper platen in figure _, coul< be screwed out of the way.
The hydraulic pump wee connected by i/B-inch copper tubing
to the base 5 (fig. 2). in operation, the clamping force
was made greater than the h_,draulic force exerted by the
pump in forming the diaphragm. The difference between
these two forces was the effective clamping force.
The die rested in its bane with the blank between
them. Paper gaskets were necessary to prevent leskage
between the blank and the base athighforming pressures.
The pressure fluid was conducted to the lower side of the
_lank _ through the hole in the die base shown in figure I.

NACA Technical Note No. 876 ii
Annular rings (1/32 in. thick) were laid in the ba_e tocenter the blank and the gasket. The die was automati-cally centered by the cylindrical projecting rim of thebase. Each die had vent holes (see figs. 1 and 2) toallow the air between the blank and the die to escape.
In the formation of Some of the diaphragms, the pro-cedure was as follows: The paper gasket and the blankwere placed on the pressure base. The die was placed ontop. The die and the pressur_ base were placed togetherin th_ press and clamped with a force sufficient to clampthe edge of the diaphragm with a pressure up to 10,000pounds per square inch in the presence of the hydraulicpressures (up to 9500 lb per sq in.), which were then ap-_lied. After the pres_ure_ were released, the formed dia-phragm was removed.
A few of the diaphragms were made with a thin rubbersheet (dental dam, 0.012 in. thick) between the blank andthe die; these diaphragms had characteristics differentfrom those of the fully formed diaphragms, kost of thefully formed diaphragms were made in two stages: firstthe rubber backing wa_ used and then the forlning was cam-pleted without the backing. This method gave a more uni-form thickness for the various corrugations. By this"two-stage" method, diaphragms could also be made ofharder or thinner materials than could be directly formedin one stage. The thickness of diaphragms formed by thismethod was usually 8 to i0 percent less than that of theblanks.
Another technique found useful in forming harder ma-terials was the use of clamping forces small enough to per-mit the edges of the blank to be pulled in and leave anarrower rim. In order to avoid too great dissymetry,the diaphragm ws_ partly formed (with about one-third thefull forming pressure), the die wa_ removed, and the
Opartly formed diaphragm was rotated l_0. The forming
operations were then completed. This technique minimized
the uneven pulling of the edges due to slight unevenness
of the gasket, the die, or the die base.
After heat treatment, some of the diaphragms were
equipped with reinforcing disks as a part of the regular
manufacturing process. The disks were of cop_er cr phos-
phor bronze 0.03 inch thick or nickel 0.015 inch thick,
After heat treatment of the diaphragms, the disks were
soldered on in the center of the convex _ide. Their diam-
eters were D/4, the same as that of the uncorrugated
central area.

12 NAOA Technical l[ote _$o. 876
The purpose of the d{sks was to stabilize the centralpart and to make the construction correspond to the prac-tical case in which an indicating mechanism, contacts, ormounting connections are fastened to the center of the dia-phragm.
The zero Shift of reinforced diaphragms was in _omecases somewhat larger than that of similar diaphragmswithout reinforcing disks. This defect was possibly dueto faulty soldering. Cadmium-zinc solder (melting point= 260 ° C) with zinc-chloride flux _eemed to give le_sserratic results than 50.50 lead-tin salder. Disks were,however, omitted for most of the hysteresis and drifttests to avoid effects extran.eous to the diaphragms them-selves. .-.
Inasmuch as the four differen_ si,zes were dimension-
ally similar and the main effects of Vsrlatlon of diameter
on the load-deflection chsracter!stlcs of diaphragms of
this shape had been determined in reference 9, not all of
the slzes were made in all materials for this study.
METHODS OF TESTING
The rims of the diaphragms were clamped by a hydrau-
lic press fur testing. The testing .apparatus may be seen
in figure 3. The steel pressure chamber B has foun an~
nulsr steps to fit the four different diameters. Steel
cylinders (such as C) of i/4-inch wall thickness, which
is the width of the rims of the diaphragms, were con-
structed with inside diameters equal to the diameters D
of t.he corrugated p:art of the diaphragms in o.rder to clamp
the edges-.
The diaphragm was placed on a greased paper gasket
on the annular step in the pressure chamber. _ The cylinder
C (fig. 3) wa_ seated on the rim of. the diaphragm, and the
assembly was centered on the lower platen of the press.
When the hydraulic pressure was applied to raise the
lowez .pl_ten,_ the cylinder cla, mped .the &iaphragm directly
under the micrometer A mounted, in a h ol_e through the upper
platen. The ol.amping force (about 5 tons) could be main-
tained by a hand pump and a pressure gage to. the constancy
required to keep errors due to variation of clamping force
to less than the sensitivity of the m-icrometer.

NACA Technical Note Ne_ 876 13
Air pressure measured by water or mercury manometersM could be applied to the diaphragm by means of a hand-operated air pump. For many tests it was not convenientto wait for pressure and temperature equilibrium to bereestablished after change of air pressure. A hydraulicmethod of loading was therefore adopted for much of thework. The space in the pressure chamber B below the dia-phragm was filled with water. A metal tube connects thepressure base through stopcocks CI, 02, C3, C4 shown infigure 4 to Water and mer.cury columns W and M. Thesemanometers are in parallel, the ranges being 140 centi-meters of water and 210 centimeters of mercury, respec-tively.
Pressure could be gradually varied by raising orlowering the reservoirs RI or R_, or it could be rapidlychanged by adjusting the pressure in either manometerwith the stopcocks C_ and C3 closed and then opening theappropriate stopcock. The stopcocks were opened slowlyenough to prevent overpres_ure due to surging. The ef-fective pressure on the diaphragm was not e_actly thatindicated by the manometer before opening the stopcock,because the deflection of the disphragm would cause achange in the lower mercury level. A correction for thischange was made by reading the positions of both theupper and the lo_er meniscus (when mercury w_s used) andallewing.,for the change in keight of the column of waterbetween the lower meniscus and, the 'diaphragm.
The accuracy of the pressure measurements was betterthan 0.5 millimeter on the manometers. The micrometer,held by an insulating bakelite bushing in the upper plat-en, was connected to a graduated wheel E, 12.5 inches indiameter, the rim of which was ruled with 500 divisions.The micrometer screw had 40 threads to the inch; ' each di-vision or unit on the wheel therefore corresponded to amovement of 5 X 10- 5 inches. Readings were estimated totenths of a wheel unit snd could be repeated with aboutthis precision. The accuracy of measurement is, of course,not _so great as the sensitivity indicated but, for meas-urements of drift or aftereffect, the sensitivity of themeasuring apparatus is more important than the absoluteaccuracy. An electric circuit was so arranged that, whenthe micrometer tip touched the di2phragm, current flowedin a galvanometer and moved a spot of light reflectedfrom the galvanometer mirror. Contact could thus be vis-ually determined. A voltage cf only l_ volts was used,

14 NACA Te_hnic_l No.te No. 876
and. the curr.ent, was. li.mi_ed bY a .0,5. meg_.hmr:e.sis.tance toavDid sparking, ..The.-micrometer was fitted_with a sma.l-1
rounde&-ti p .of. steel. The. surface of the diaphragm or
reinforcing disk was cleaned and polis.hed, o-ver the_ central
area wh.ere the micr.ometer tip touched.- .......
The •pressure chamber was so designed .that.the d_--
phragm-.could be. tested- with e.i.ther side up,..:Since the.
outline, i.s not symmetrifal-abo_t th_ ols..ne_ of the--.rim, .the
load-deflection characteristics would be..expected t0. bedifferent.ih"the two directions A few Of thc-diaohragms
were tested in both directions _but most of them were tested
with the presaure apolied to only the convex side.
Although the temoerature was not closely controlled
and tests were made throughout the range o:f room tempera-
tures from 20 ° to 30 ° C, the temperature variation during
any one te_t w_ _eldom a_ much a_ 1 °.
Pressure-Deflection Tests
The relationship between pressure and deflection .for
th_ variou_ siz_'s., thicknesses,., and kinis of diaphragms
was not the .....n_a.in .object of this investigation_ the laws
relating th_se variables having be_:n determined., in the
earlier study (ref_.rsnce 9). In Order to study the elas-
tic defects it is necessary ......todeflect the diaphragms,
and data on their pressure-deflection ch_aracterist_ics
must be obtained. New materials were being investigated,
and the old ones were being used to larger deflectionsthan in the earlier'work. A comparative study of the
pressure-deflection characteristics is, therefore, of
considerable interest.
When pressure-deflection data was obtained, the zero
reading wa_ first taken with n'o pressure applied. The
micrometer was then screwed up, a sm_ll pressure was ap,.
plied, and the micrometer w:as s.crewed do_vn to make con-
tact. The proces_ was repeated for successively higher
pressures, 'At .eaC h pressure the position of the micro-
meter wheel was noted for succesfive contacts made l0 to
20 seconds sparta, and the, reading was recorded when twosucces•_ive contacts occurred twice at the same wheel
position, that: i_, within 0.1 wheel unit (5 x l0 -G in.),
which was found to be 8 good indicat.ion that further
short-time drift would be negligible. From i to 3 min-
utes were usually required _t each pressure,

NACA Technical Note No. 876 15
The stepwise method of loading is similar to the mostgeneral conditions of usage of diaphragms. The deflec-tions obtained in this manner for a given pressur(_ arepresumably equivalent to those that would be obtained Sometime after sudden applications of the same total pressure.
Hysteresis Measurements
The diaphragms were loaded in the stepwise manner toa given maximum deflection and were held at this pressurefor at least one-half hour. The pressure was then reducedstepwise and readings of deflections were taken for eachpressure. Time was allowed at each step for short timedrift to disappear, that is, measurements were recordedwithin a few minutes after the pressure was obtained butonly when successive readings i0 to 20 seconds apartagreed within 5 x I0 _6 inch. This procedure required ito 3 minutes. The entire procedure was repeated for eachof a number of different maximum deflections.
The hysteresis ws_ defined s_ the difference betweenthe deflections for decreasing and for increasing loads.When a permanent deformation occurred for large loads, itwa_ subtracted from the sppar@nt hysteresis, because thedeformation presumably occurred at the maximum load.
Drift Measurements
When the diaphragm is slowly loaded, either in stepsor continuously, the deflection at any pressure is slight-ly greater than the deflection obtained immediately aftersudden application of the same pressure. Even after slowloading, further drift may occur when the pressure isheld constant, but a large part of the drift occurs simul-taneously with the slow loading and is not apparent assuch. Most pressure-measuring fnstruments are used withslow loading or its equivalent. Calibrations are normallymade for this condition, usually by stepwise loading andwaiting a short time at each load, just as was done inobtaining the load-deflection characteristics of the dia-phragm. Drift that occurs beyond this amount is sometimescalled long-time drift. The long-time drift differs fromthe short-time drift mainly in magnitude. Of course, ifthe diaphragm is overstressed, continuing deformation isto be expected. This deformation is referred to as "yield-ing" and the term "drift" is reserved for recoverable de-flections.

16 NA6A Technical Note No. 876
For diaphragms under normal use, the long-time driftduring a day or more, following the short-time drift thatoccurs within a few minutea, may be too amall to measureconveniently. The investigation of long-timedrift isimportant since in many pressure instruments (for example,altimeters), the diaphragms normally ar_ under mavimumload. There was not sufficient time to investigate long-time drift or to determine whether a large value of short-time drift indicates a large value of long-time drift.
For drift tests, sudden load_ were applied with theapparatus previously described. The first reading wasusually obtained within l0 seconds after the applicationof load, and further readinga were taken as frequently aspossible or necessary until equilibrium was apparentlyestablished.
Aftereffect, Recover_ and Zero Shift
After any loading test a diaphragm may not immedi-ately return to its original position. For slow unload-ing or for small load_, the no-load position is usuallyvery near the original position and total rFcovery occurswithin a few minute_. For sudden release of load theaftereffect is larger, and for large load_ it may decreasefor seversl days without entirely disappearing. Just whenthe decrease is assumed to have stopped is somewhat arbi-trary, because recove_ry might be gradual over a long-timeperiod, as for long-time drift. When no measurable changein reading occurred within 1 hour, however, the remainingdiscrepancy was assumed to be a permanent zero shift.
Measurement of aftereffect was made as part of thehysteresis tests, since the aftereffect is really hyster-
esis at zero lo_d. Recovery data were also obtained fol-lowing hysteresis tests to determine whether a_y oerman-ent zero shift had occurred. In most of such tPat_, theaftereffect was so small and recovery waa so rapid thatno significant data on the r_l_tion between recovery andtime were obtainable. In order to obtain the full meas-ure of aftereffect, measurements were taken followingsudden release of load in a manner analogous to that formeasuring drift after sudden application of load, Be-cause the micrometer had to be screwed down after the re-lease of the load, through a distance equal to the maxi-mum deflection, the time interval between the change ofload and the first reading was somewhat greater than fordrift measurements. This interval was usually about 20to 30 seconds.

NACA Technical Note No. 876 17
RESULTS
Pressure Deflection
In figure 5 are shown several pressure-deflectioncurves for diaphragms of reinforced beryllium copper.The general course of these curves is typical for dia-phragms of this shape, although stiffnesses are naturallydifferent for other materials. Some of these curves ex-tend over a greater range than is usable in practice; thediaphragms began to yield inelastically for deflectionsgre_ter than 7 to 8 percent of the diameter. Diaphragmsof other materials have smaller usable range_; but, ifthey could be deflected further without yielding, theywould presumably follow somewhat similar curves.
Before it will be possible to compare diaphragms ofdifferent materi3is and of different sizes to determineto what extent the character of the pressure-deflectioncurve is detprmined by _haoe fsctor_, it is necessary tosimplify the problem by combining some of the variables.
The method of dimensional analysis as discussed inreference 14 is usoful in this connection. It may be ap-plied as follows:
The deflection of a diaDhragm is influenced by thepressure applied, the diameter, the thickness, the shapeof corrugation outline, and the elastic constant_ of thematerial.
Let
X = deflection
D = diameter
t = thickness
P = applied pressure
E = Youngts modulus
F = plate modulus E/(1 - a_)
= Poissonts ratio

18 I[ACA _echnical Note No. 876 _
For all diaphragms of the same corrugation shape (dimen-sionally similar diaphragms)
x = f(D, t, P, E, a) (I)
The dimensionles_ ratios formed by combinations Of the
parameters arelalso related, so that
• x E " (2)D
Experimental observations on many diaphragms of the
given shape show that the pressure-deflection relation is
fairly linear over the range of deflections up to
X-- = 0.02. For this range of deflections and over theD . .
1000trange of = 2 to 4, the following equation holds for
D
all the diaphragms:
FX-2.25 X I0 s (t/D x I03) -1"5s (3)
PD
The absolute magnitude of the exponent increases beyond
each end of this range of 1000tD
The general curve developed as figure 9 in reference
9 for diaphragms of this shape over the range of X/D UD
to 0.02 is reproduced as figure 6. The data plotted were
determined from data for reinforced beryllium-copper dia,
phragms, loaded on the convex side. The effective values
of F for other materials can be so chosen that the
points fall on the curve. This durve defines the" stiff-
ness of the diaphragms P/X over the given range of de-
flections as a function of D, effective thickness t,
and the plate modulus of the material F. As long as the
pressure-deflection curve is linear, the averag_ stiff-
ness P/X is th_ same as the local, or instantaneous,
stiffness AP/AX. Beyond the range of linearity, it is
necessary to specify what definition of stiffness is used
in making comparisons. For example, at points A and B in
figure 5, the stiffness is the same by either definition;
at peint C the average stiffness OP/PC is much less than
the local stiffness AP/AX.

NACA Technical Note No. 876 19
Because the diaphragms had been found to behave sim-i larl_ when deflected eimilarlY , that is, to the sameX/D ratio within the limited range, it was consideredprobable that the similarity would hold for larger deflec-tions. In order to reduce the observations to a formadapted to test this assumption, the following procedurewas adopted_
The pressure-deflection data were plotted for a numberof diaphragms of different materials, sizes, and thickness-es. From the average stiffnesses of the diaphragms up to
X _ 0.02, values of F were determined that would make theDrepresentative points for the diaphragms fall on the curveof figure 6.
The various determinations of F for diaphragms ofthe same material were averaged to obtain the values listedin table III .....
Because the curve of figure £ relate_ to reinforced
diaphragms loaded on the conve_ _ide, the value_ of th_
modulus for other conditions derived from this curve are
only relative. The values of F derived for diaphragms
• supposedly alike sometimes vary by as much as 1,000,000
pounds per square inch. Predicticns based on the average
values listed will therefore probably not be much more
exact.
The plate modulus of reinforced beryllium copper
previously reported (reference 9) differ_ slightly from
the average given in tabl_ I17. Although the average in-
cludes meas.urements made on d.iaphragms of slightly differ-
ent chemical composition, no significant correla'tion with
comPosition is apparent. The computed modulus appearsnot to vary with diameter. Nominally identical diaphragms
sometimes differ in modulus by as much as 1,000,000 pounds
per square inch, which is also the average deviation from
"the mean for all the reinforced diaPhragms of this mate-
rial. The modulus for unreinforced beryllium-copper dia
phragms had a deviation from the mean of 700,000 pounds
per square inch. •
A few measurements on the other materials indicated
less deviation from the mean. There was no significant
difference of modulu_ between diaphragms formed of soft
and quarter-hard material. This may be due in part to
20 NACA Technical Note No. 876
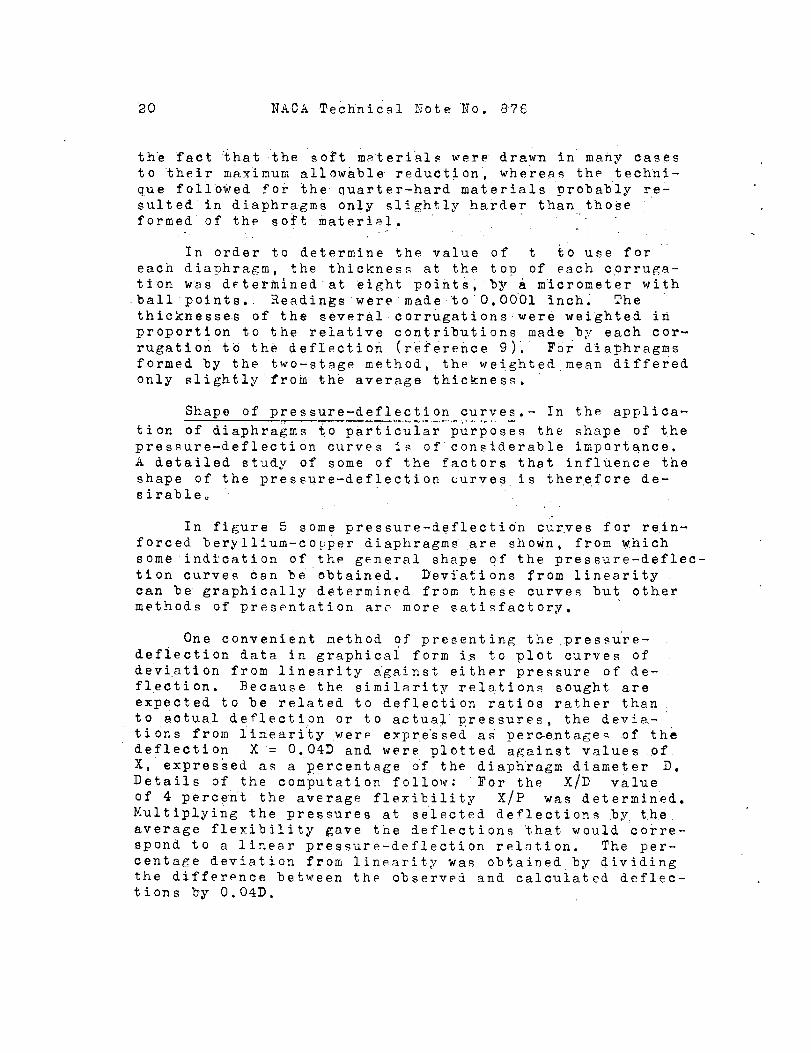
the fact that the soft m2terial_ were drawn in many casesto their maximum allowable reduction, whereas the techni-que followed for the quarter-hard materials probably re-sulted in diaphragms only slightly harder than thoseformed of the soft material.
In order to determine the value of t to use for "each diaphragm, the thickness at the top of each corruga-tion was d_ter_ined at eight points, by & micrometer withball points. Readings were made to 0.0001 Inch_ Thethicknesses of the several corrugations Were weighted inproportion to the relative contributions made by each cor-rugation to the deflection (reference 9). For diaphragmsformed by the two-stage method, the weighted mean differedonly slightly from the average thickness.
Shape of pressure-deflection curves.- In the applica-
tion of diaphragms to particular purposes the shape of the
pressure-deflecti0n curves is of considerable importance.
A detailed study of some of the factors that influence the
shape of the pressure-deflection curves is therefore de-sirableo
In figure 5 some pressure-deflecti0n curves for rein-
forced beryllium-copper diaphragms are shown, from _hich
some ind$cation of the general shape of the pressure-deflec-
tion curves can be obtained. Devfations from linearity
can be graphically determined from these curves but other
methods of presentation are more satisfactory.
One convenient method of presenting the pressure-
deflection data in graphical form is to plot curves of
deviation from linearity against either pressure of de-
flection. Because the similarity relation_ sought are
exPected to be related to deflection ratios rather than
to actual deflection or to actual pressures, the devia-
tions from linearity were expressed as percentages of the
deflection X = 0.04D and were plotted against values of
X, expressed a_ a percentage iof the diaphragm diameter D.
Details of the computation follow: For the X/D value
of 4 percent _ the average flexibility X/P was determined.
Multiplying the pressures at selected deflection_ by the
average flexibility gave the deflections %hat would corre-
spond to a linear pressure-deflection relation. The per-
centage deviation from linearity was obtained by dividingthe difference between the observed and calculated deflec-
tions by 0.04D.

NACA Technical Note No. 876 21
Three curves showing the deviation from linearity fordiaphragm of reinforced beryllium copper are presented infigure 7. Diaphragms of other materials follow more orless closely the curves for beryllium copper for the samevalues of t/D. Curve I is typical of diaphragms of low
t/D ratios. Diaphragms of thinner materials or largerdiameters, abnormally low t/D ratios, deviate more wide-ly from linearity and may deform suddenly at from _ to 5percent D. Diaphragms of the shape used for which th_ t/Dratio is approximately 2x lO -3 have characteristicallysmall deviations from linearity. Curve II shows devia-tions of less than 1 percent (of 4 percent D) in therange of deflections up to 4.6 percent D. The deviationfrom linearity when t/D is greater than 2 x lO -3 isshown by curve III. For larger values of t/D the ef-fect is still more pronounced.
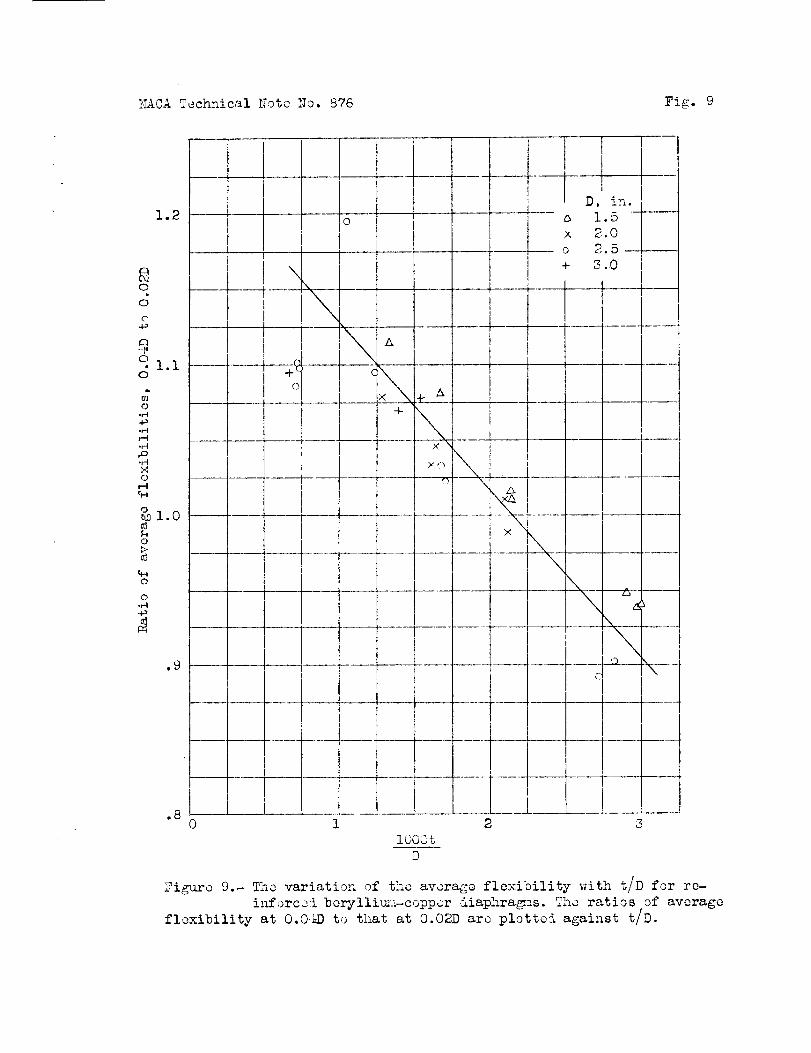
The average flexibilities of a number of diaphragmshave been computed. A few typical curve_ of 8verage flex-ibi!ities divided by the flexibility at X = 2 percent Dplotted against deflection as a percentage of D areshown in figure 8. Also in figure 9 the variation of ther_tios of the average flexibi!itie_ at X = O.04D to thatat _X = O.02D are shown. These data indicate that thisratio of flexibilitles varies linearly with the t/Dratio.
These curves as well as those in figure 7 show that,for diaphragms of the shape studied, the nearest approachto pressure-deflection linearity for moderate deflections(up to X = O.04D) is obtained with a ratio of t/D= 2 × 10 -3 . For t/D larger or smaller, the deviation
from linearity becomes _uite marked for deflections
greater than O.02D. Diaphragms with t/D < i x I0-3 may
have local flexibilitie_ over a short part of their range
approximately ten times the flexibility at X = O.OBD. At
slightly higher deflections (X = O.03D to O.04D, depend-
ing on t/D), a sudden deformation of the diaphragm occurs,
although no instability is apparent in the very flexible
range before deformation. The curves sho_n are for rein-
forced beryllium-copper diaphragms.
Plots simil_r to the one shown in figure 9 for un-
reinforced diaohragms of all the materials te_ted indi-
cated no significant variation among materials, For all
values of t/D > 1.6 x lO -3 the points showed _ood agree-
ment with the curve of figure 9 eycept that the cozres-
ponding points were shifted about 0.2 × lO -3 t/D to the
left.

22 NACA Technical Note No. 876
Unreinforced beryllium-copper diaphragms with t/Dratios below 1.6 x l0 -3 were found to have partly slackcenters and gave results that varied considerably fromone diaphragm to another.
Effect of variation of corrugation depth.- It should
be emphasized that the foregoing discussions apply to
only one diaphragm shape. Some interesting incidental
results were obtained from diaphragms fabricated for an
airspeed indicator, on the effect of changing the depth
of corrugation of 3-inch diaphragms. The depth of corru-
gation was varied by forming the diaphragm with one or
more thicknesses of dental dam between the blank and the
NBS No. I shape die. A number of diaphragms with ap-
proximately equal t/D ratio_ were formed from beryllium-
copper blanks 0.005 inch thick with corrugation depths
varying from the NBS No. i shape to l_ss than half the
usual depth. For these diaphragms t/D was approximately
1.5 x 10 -3 . The diaphragm with normal corrugations had
the usual flexibility curve for this t/D value. (The
curve was approximately like curve III fig. 8). A dia-!
phragm with a 20 percent reduction in.depth of corruga-
tion had a flexibility curve more nearly like curve IV.
A diaphragm with a corrugation depth of slightly less
than half the normal depth of corrugation had a flexibi-
lity curve corresponding to a much higher t/D value.
The deflection of this diaphragm showed a surprising lin-
earity with equivalent airspeed (the deflection was pro-
portional to the square root of the applied pressure).
Over the range 150 to 500 miles per hour, the maximum
deviation was about 8 miles per hour, when the pressure
was applied to the convex side, When the pressure was
applied to the concave side, the deviation from airspeed
linearity was about 8 miles per hour.
This example indicates the very important effect of
the corrugation depth on the pressure-deflection charac-
teristics of a diaphragm and the desirability of investi-
gating the performance of other shape_.
Hysteresis
Some observed-hysteresis curves are shown in figures
l0 and ll. The curves in figure l0 are for four differ-
ent diaphragms. The curves in figure ll are for the same
beryllium-copper diaphragm (curve III, fig. 10) for dif-
ferent maximum deflections. The aftereffect, that is,

NACA Technical Note No. 876 23
the hysteresis at zero pressure, was so small in these ex-periments that the hysteresis curve for all practical pur-poses terminates at zero on the ordinate scale.
In curve III of figure l0 is indicated a double max-imum, which appears again in figure ll. In general, thehysteresis data show less scatter for smaller total de-flections where the water column was used and the uncer-tainty in pressure measurement was therefore smaller. Thescatter shown is no larger than the errors in determina-tion of pressure. The curves in figures l0 and ll aretypical of all the materials tested for pressure appliedto either the convex or the concave side of the diaphragm.While the scatter of points is rather large in some in-stances, repeat test_ indicate that the several maximumsshown may be real. However, further investigation withmore sensitive apparatus is reauired befor_ any conclu-sions are justified.
Of special interest is the variation of the maximumhysteresis with maximum deflection_ The curves in figure12 show the maximum percentage hysteresis plotted againstthe maximum deflection evpres_ed _s percent_ge of D.The hump in the first part of the curve i_ significant.It would appear to indicate that, for the smallest per-centage hysteresis, a diaphragm should be chosen which,under the conditions of use, will be deflected to severalpercent of its diameter. The hump exists in similarcurves for diaphragms of each of the materials studiedand is therefore believed to be a rather general phenom-enon.
It would be highly desirable to determine whether an_nalogous hump occurs in the percentage-hysteresis curvefor diaphragms normally loaded, that is, for cycles ofvariation of loading with r_pect to a fixed load (notzero, as in the present study). This knowledge would beof great value in analyzing the performance of altimeters,for instance, in which an evacuated capsule is normallyunder its maximum load. Although no quantitative explana-tion of the cause of these humps is available, it hasbeen suggested that they may be due to local snap action.Whatever the ultimate explanation of the hysteresis ef-fects may be, the immediate end will be _erved by empir-ical comparisons. The curve_ in figure 12 show that thecurves for 1½-inch diaphragms differ somewhat from theothers in having wider humps.

24 NACA _echnical Note No. 876
In the upper chart of figure 13 the maximum percent-age hysteresis for various maximum deflections from 1 to4 percent D is plotted against the diameter of the dia-phragms. The height of the hump in the maximum percent-age-hysteresis curve vsrles somewhat with the dlaphragmdiameter. This variation is shown in figure 13 by thecurve marked "Maximum hysteresis." The deflections fol-lowed by the greatest maximum percentage hysteresis are _shown in the _ower chart of figure 13 for various diame-ters.
The curves iz figure 13 were plotted from averages_or a number of diaphragms of unreinforced beryllium cop-per_ Diaphragms of other materlal_ agree suite closely,provided that the percentage .D for which the average istaken is well within the pressure limits. There appearsto be a definite but nonlinear variation of maximum per-centage hysteresis with diaphragm diameter. For deflec-tions up to 4 percent D the percentag_ maximum hystere-sis for l_-inch diaphragms is aporoximately double thepercentage for 2_-inch diaphragms_ The maximum hysteresistends to approach a constant value as the _ diameter andthe maximum deflection increase.
If a diaphragm of the shape investigated is to beused in an instrument, a diaphragm of diameter greaterthan l_ inch should be used to keep hysteresis effects toa minimum. For example, with deflections of 2 percent Dthe maximum hysteresis is usually about 0.8 percent for a1½-inch diaphragm a_ compared withr 0.3 percent for a 3- _inch diaphragm.
For deflect i_ons up to about 3 percent D there areno significant differences in hysteresis among berylliumcopper, phosphor bronze, and K-Monel. As phosphor bronzeapproaches its deflection limit, around 4 to 5 percen_ D,there is a sharp increase in maximum percentage hysteresis.The minimum value of the maximum percentage hysteresis forberyllium copper is in the 6 to 7 percent D region. Theminimum is usually about 0.2 percent and may be as smallas O.1 percent. For phosphor bronze the minimum is usual-ly about 0.3 to 0.4 percent. K-Monel has a minimum hys-teresi_ at 4 to 5 percent D of about 0,3 percent.
It is desirable that a diaphragm be used wheneverpossible in the range where hysteresi_ effects are a min-imum, that is, about X = 3 _o 7 percent D. As pre-viously discussed, larger diameters should also be usedif the hysteresis effects are an important consideration.

NACA Technical Note No. 876 25
In general, the maximum-hysteresis curves show an in-crease in the region of the load limit. This increase isfairly sharp for phosphor bronze and the nickel alloys.For beryllium copper the increase in hysteresis is not sopronounced. This increase in the maximum hysteresis is anindication of maximum working range. A table of suggestedmaximum deflection limits for the various diaphragmstested, based onthese and other considerations, is givenintable IV.
Drift, AftereffeCt, Recovery, a:nd Zero Shift
Measurements of drift and recovery for loads suddenlyapplled or released show considerable variation from onediaphragm to another. This variation ma_ be•due in partto the fact that it is impossible, with the liauid man-ometers, to measure and maintain the pressure to the highsensitivity of•the micrometer (5 x l0 -6 in.) •. When agiven load is applied to the diaphragm, the pressure mustbe gradually increased to its final value 9ver a period
:as long as 2 to 6 seconds to prevent in overpressuresurge, If measurements are to be taken immediately afterapplication of _he load the effect of the time betweenthe application of: the l_ad and the first reading must be
considered. Howeger, some very definite indications 6f
the zagni:tude of the drift, observed largely on beryllium
copper, may be pointe'd 6ut.• . ,
Within • l0 seconds after the appiication 0f pressure
the :de_le::ction wa_s W:ithi:n about 1 percent of the final
deflection, fo:r a :final deflection of 5 percent D. At
the en.d oT th_ first mi:nute the' difference had fallen to
less than 0.2 percent. After about 20 minute_ the drift
becam.e so small that it could not be detected in the suc-
ceed&ng hour, The time of drift decrea_e_ for smaller de-
flecti0ns and increases c'onsiderably for large r• deflections,
: • .:
The reCovery curve is not, as might be expected, a
reversal of the drift curve; The deflection decreases
rapidly to a min&mum in about 20 to 30 seconds after the
release of the pressure. This minimum is usually about
the same as the final recovery point or in some cas*s iS
slightly negative. The deflection then increases to a
maximum (0,2 to 0.3 percent of the maximum deflection for
a maximum _eflection of 5 percent D) in about 50 to 60
seconds, and thereafter falls off more or less rapidly,
depending on the magnitude of the previous pressure load,

26 NACA Technical Note No. 876
to its final value. The time for complete recovery variesconsiderably for different diaphragms. After a deflectionof 5 percent D the recovery time may be as short as 5minutes for some diaphragms and as long _ 1 hour forothers. The average r_c0very take_ two to three times aslong as th_ previous drift under load.
For stepwise lo_ding the drift after i to 3 minutesat each step (10 to 20 steps in the loading cycle) wastoo small to be detected for deflections up to 5 percentD. Even for deflections up to 7 percent D th_ readingswere essentially constant after 3 to 6 minutes. For step-wise reduction in loading constancy of deflection was at-tained in approximately the same time, Complete recoveryat zero load took place within as little as 1 or 2 min-utes following loadings up to 5 percent D with stepwiseUnloading. For higher loading the recovery time rapidlyincreased. For deflections of 7 percent D or more therecovery of some diaphragms required some hours, althoughother diaphragms recovered within a few minutes.
The average residual deflection at zero load (after-effect) for berylllum-copper diaphragms 1 minute after aslow unloading from 5 percent D is 0nly 0.02 percent ofthe total deflection. At 7 percent D the aftereffect is0.04 percent 1 minute after the load was removed, Othermaterials show a sharper increase in aftereffect at higherdeflections. This point of _harp Increase of both after-effect and time of recovery roughly corresponds to thepoint at Which an excessively large number of loadingsare required to stabilize _he diaphragm (that is, to elim-inate the zer0 shift) and'may therefore be taken as a
fair indication of the useful limlt of deflection.
A beryllium-c0Pper diaPhragm would probably reauireseveral hundred 10adings at about 8.5 percent D tostabilize the zero for loadings up to 8 percent D. Tenloadings at about 6,5 percent D will usually stabilizethe zero for loadings up to 6 percent D_ and one or twoloadings at 5.5 percent D will stabilize a diaphragmfor loadings up to 5 percent D. Diaphragms of other ma-terials tested have lower deflectiqn limits and reauirerelatively larger numbers of loadings to attain stability.Within the deflection limits listed in table IV, the zeroshift for a stabilized diaphragm during normal use wa_ nogreater than the sensitivity of the micrometer (5 × l0 -6in.). For a 2-inch diaphragm of beryllium copper thisshift corresponds to les_ than 0.005 percent of the totaldeflections.

NACA Technical Note No. 87E 27
Based on these considerations of deflection and onconsiderations of hysteresis previously discussed, thesuggested limits of maximum deflection for diaphragms ofthe various materials formed to the shape investigatedand heat-treated as described are given in table IV. Thetabulated list is subject to certain restrictions listedin the discussion that follows.
Th,ere is no apparent dependence of the percent Ddeflection limit for beryllium copper on either thicknessor diameter when t/D exceeds 1.6 x l O-3. Below thisvalue of t/D the maximum deflection is strictly limitedby a snap deformation of one of the outer corrugations.The diaphragms perform satisfactorily up to their snapdeformation point. Where t/D is between 1.O × lO -3 and
0.7 x lO -3 the snap deformation point i_ in the range 3
to 4 percent D. For t/D = 1.6 x lO -3 the diaphragm de-
forms above the load limit as set by zero shift, 'slightly
above 8 percent D.
No measurements were made on thin diaphragms of other
materials, but they would presumably showy a like snap de-
formation. For many diaphragms this deformation point
would be above the deflection limits set by other consid-
erations.
The suggested deflection limit for beryllium copper
is listed aS 5 to 7 percent D. It should not be assumed
that variati6hs between diaphragms indicate this varia-
tion of deflectlonlimit but that the values of deflection
limit chosen on the basis of different considerations us-
ually fall within these limits. A deflection of 5 percent
D represents the defleotion from which recovery after re-
moval of load is very rapid. A deflection of 7 percent D
or higher represents the point above which excessive
elastic defects become apoarent.
A rough theoretical prediction of the comoarative
merits of the various materials in withstanding deflec-
tions may be obtained from the Knoop indendation number
and the elastic modulus.
Because the hardnes_ i_ an indication of the strength
of the material and because, for a given strain or given
deflection in diaphragms of the same diameter, the stress
will be proportional to the elastic modulus, the deflec-
tion limit of stressed diaphragms would be expected toincrease with the ratio of the hardness numbers to the

28 NACA Technical Note No. 876
elastic modulus_ The numerical values of this ratio,based on the. relative plate moduli (table II!) for unre-inforced diaphragms of the various materials, are listedin order in table IV for comparison with the ordering onthe.basis•of suggested deflection limits derived from theprevious considerations. The Kn0op indentation numbers(table If) used were obtained for diaphragms that hadbeen stress-relieved by heat treatment after forming.The sequence of the materials on this basis agrees ouite
we.lA with that based on. the experimental results, with
the possible exception of Inconel, which may possiblY not
have been properly heat-treated for stress relief.
A knowledge of the hardnesse_ of stress-relieved ma-
terials may thus permit a reasonable prediction of the
relative merits of many other uossible diaohragm materi-
als and, by interpolation between the experimental values
for the materials studied, may even allow a Quantitative
estimate of performance,
Design and Selection of Diaphragms
From the design charts and formulas given in refer-
ence 9, together with the data reported here that extend
the range of deflections considered, it is possible to
predict for a given diaphragm of the particular shape
studied, the shape of the pressure-deflection curve, the
s%iffness or flexibility, the useful load or deflection
limit, and the magnitude of the hysteresis,
The following procedure may be used to select dia-
phragms for a given application: A load-deflection curve
of suitable shape for the particular purpose is selected
from figures 7 and 8_ This curve determines a value of
t/D; the corresponding value of FX/PD is obtained from
figure 6. The diameter • D is then computed from this
value of FX/PD by substituting the desired sensitivity
X/P and the Plate modulus F of the material selected.
With the value of D, the value of t can be determined.
In practice, considerations of the available space may
limit the diameter D. The deflection X must be within
the deflectlonlimits but should be as large as possible
to keep hysteresis effects down to a minimum. The de-
sign may often be complicated by too many restrictions
on the variables. Compromise must therefore be made
among some of the desired features.

NACA _echnical Note No. 876 29
A numerical example may be helpful. Let us assume
that a pressure-deflection curve shape with a high degree
of- linearity is desired for use in a suction gage. _ Fig-
ure V indicates that a high degree of lin_arity reauires
t/D to be approximately 2.x 10 -3 . For this t/D ratio,
FX _ 7.8 x I0_ from_ figure 6. Assume that the desiredPD
X 0 01 in.sensitivity is - ' and that beryllium copper
P lb/sa in.
with a center reinforcement is to be used so that F =
19.4 x 10⁶ pounds per square inch for loading on the con-
vex side.
Then
7.8 x 10⁴ D = 19.4 x 106 x 10 -2
Or
D = 19.4 = 2,5 inches7.8
The required thickness is t = 2 x !0 -_ x 2.5 = 0.005
inch.
This diaphragm will have a nearly linear pressure-deflection curve within about i to 2 percent (see fig. 7)
to a deflection of 5 percent D or 0.125 inch, or 0.25
inch for a capsule of two diaphragms, which for the chosen
sensitivity would correspond to a pressure of 1 °I• o_ pounds
per square inch. Such a diaphragm, if properly seasoned,
can be deflected to at least 7 percent D without damage.
At 7 percent D the average flexibility 'wil_ be about 85
percenh,of the average flexibility at 2 percent D. (See
fig. 8.) The pressure required to deflect the single
diaphragm to this limit would be 7 x 2.5/0.85 = 20 pounds
per square inch. This diaphragm could thex be used in a
suction gage under full vacuum without injury.
For diaphragms formed by the t_o-stage method as de-
scribed in this report, the thickness of sheet stock
should be l0 percent greater than the desired .diaphragm
thickness. For single-stage formation the reduction in
thickness may be 15 to 20 percent when the edges are firm-
ly clamped; if the edges are ........... to draw, the reduc-
tion in thickness may be much less.

30 NACA Technical Note No. 876
If K-Monel had been chosen instead of the berylliumcopper used in the preceding example, the required diam-eter would have been 3.14 inchps for the reeuired sensi-tivity if the center were not reinforced and even largerif the center were reinforced. In such a ca_e it wouldusually be desirable to reduce the sensitivity require-
°ment or, as is customary, to use diaphragm capsules inorder to reduce the diameter to reasonable limits.
Although the data and the curves presented in thisreport are mainly for diaphragms loaded on the convexside, the design formulas may also be used with a fairdegree of approximation, for deflection in the other di-rection by using appropriate value_ of the modulus, pro-portional to those given in table III for beryllium cop-per.
National Bureau of Standards,Washington, D. C., September 1942.
ITEFERENCES
1. Griffith, A. A.: The Theory of Pressure Capsules.R. & M, No. 1136, British A.R.C., 1928,
2. Smlth, Stanley: 0n the Depression of th_ Centre ofa Thin Circular Disc of Steel under Normal Pres-sure. Trans. Roy. Soc. Canada, third ser., vol.XVI, sec. III, May 1922, pp, 217-225.
3. Nada$, A.: Elastische Platten. Julius Springer(Berlin), 1925.
Q
5.
Fedcrhofer, Karl: Uber die Bcrechnung der dGnnen
Xreisplatte mit Grosser Au sbiegung. Eiscnbau,
vol. 9, 1918, pp. 15D-166.
Way, Stewart: Bending of Circular Pl_tes with Large
Deflection. A_S.M.E. Trans., APM-56-12, vol. 56,
no. 8, Aug. 1934, pp. 627-636.

i_ACA Technic_l i_ote }_To._.76 31
•
•
•
•
i0.
II.
Ig.
13.
14.
Fcd:.rhefcr, K.: Zur Bcrechnung dor dgnnen Kreisnl_tto
mit grcsscr Ausbiegung. Forschung suf dem Gebieto
des In_cniour_,,escns, Ausg. ]3, _d. 7, Heft 3, M_y-
Juno 1936, pp. 148-15!.
_,rrt_, J.: _'ber die R_ndwcrtnufg_bc &or GlcichmNssig
be!_stctcn Ereisolattc _ f _ M }( }_d 16 Heft 5
0ct. 19_6, pp. 311-314.
_ Fo Sci.C .....ron, rnand: Etude des C_psulos kneroides.ot Tech. du Hinistorc dc L'Air, Pub. _Zo. 160, (P_ris),
1940.
_]ic!hack, .,. A. , end Goerko, ,. :=.. _o:'ru-_tcd___ Hot_l
Diaphragms for Aircraft Prcssurc-Mc_surin_:_ Instru-
-.c_+s. T IT _T 738 _ITACA 193 °
Xnoo_, Frederick, Peters, Ch_uncy G., _nd Emerson,
[q_ltcr B.: k Scnsitivc Pvr_mid_!-Di_mond Tool for
Indentation iic_urcmonts. Rcs. P_o.r 1720, _t.
2ur o ? Standards Jour Res , vol. 23..... no. l, July
1939, pp. J9-61.
Hnrrington, R. H. , _nd Thompson, R. G, ; The Precipi-
tation Ro?ction in Cold Rolled Phes-ohor Bronze.
Its Ezf'ccts on n_r,_ness, Ccnductivit_ , _nd Tensile
Prooortics Tr_ns Am Soc l.'ct_I s, vol 28 no 4
Dec. ].9%0, pp. 933-9_%8.
Bcrylliu:_ Corporntion o'" Pennsylvania, in zinccring
Dnta Shoots on Beryllium Copper Alloys, _crylco_i@95.
Staff Development _nd Research Di"ision of the Inter-
nnti_.nnl !:[ickcl Co.: The Hcnt Treatment of K-k'cncl
end Z-_[ickcl. Eo_t Trcntinc _nd _orging, vol 25,
Dec. 1939, pp. 593-597.
Buckin_hcm, E.: ::ode1 Exporiment_ _nd the Forms of
Zmpiric_l E_u%tions. A.S.[[.E. Trnns., vol. 37,
1915, po. $63 _'_


IIACA Technic_l _Tote No. 876 32
TABLE I
CHEMICALANALYSES OF MATERIALS USED
Mate-\._i a1Ei e-_
men_-
Cu
Hi
Cr
P
Be
Co
Fe
Sn
Pb
Mn
Si
C
S
A1
Zn
Ti
MgCb
Phosphor IBerylliumbronze copper
I F
A-Nickel B-Monel !K-Menel llnconel
(nominal)
Chemical
95
.18- .29
97.3
.26
2.0-2.3
< .01
•03-. 13
< .01
< .01
0-.02
composition
O. 04
98.99
.58
.13
(percent)
.21
.02
.02
J
32.2
.41
.07
1.03
.04
.02
......... .005
0-.06 I................
I 0-.24 ................
---------i ......... t..........
30.3
64.81
.41
.33
.34
.26
.22
.005
2.75
.47
< .01
.I0
0.14
78.96
13.46
.53
6.30
,21
.17
.21
.015


_ecnnlcal hote Ko. 876 38
TA3LE I I
n_.,_SS OF DIAPHRAGM ,,_T/_RI_TS
t_lick-
!iOSS
(i=.)
Sheet
stock as
received
}_:_o___op indentation nu2_bers (reference !0)
Diaphragsn blar_ or After Formed and
strip, heat formation Lest treatedtreated
__ Pho snhor bronze
0.00_!
•003.004
•d00
•008
z52179
!9s
2O0
22
150(100 hr, 250°C) %Could not
122(100 hr, 250°C) 9 be formed
zo5( 1 hr, 425°0) 1zYY(zoohr, 250°C)1!8( 1 hr, h-,25°C) #
150(I00 hr, 250°0) i
196(!00 b.r, fi5OsC) ; 211 z92([:o -_r, 2>o° c)
0.002
.co4
.co5
.00S
.008 12 xJ
0. 006 ] Soft, 80
•_f8 ( Quarter-hard, !4d
0.006 Soft, 102
•006 ( '%u,'_r t, er-il:_rd, ,voq
336(i Lr, 700°8).1, __:s.(1 hr, }:o<s); 735(z ha_, po-c)t .717(1 !-r, S'O °_'i ',*7(a ?-:-, bo_c)I
_--_ iOi_ ._,1.
1"-,-
i
_ouid netb be formed
<<_ Could not
%e forr.:edJ
ppo(l hr, p_O C)
545(i iu-, XO0°C)
327(1 hr, 300°C)324(1 n._,', }00°C)
}_4(I hr, _00°C)
iTc(z kr, 3XOOC)
200(! _r, x_O:_C)
I-0. 006 , [#,oft, 192
.006 ,L hat&, 21_jI
273 I 724(i6 hr,580CC)
.......... i 535(lo# hr,5gO°C)
o.oo6 ! So£t, 2bs_,,' U'Qm,rter-
, k,'trd c__'mo
t
_[i_'COil el
,,o_°C).......... I 732(Z hr, _s_,: 744(1 :-z, 429_C)
............
i


ITACA Technical Note No. 876 Z_
TABLE III
VALUES OF RELATIVE PLATE MODULUS F FOR
DIAPHRAGM MATERIALS
Pressure on convex side Pressure on concave side
Materi_lNot reinforced Reinforced _ot reinforced Reinforced
(Ib/sq in.) (lb/so in.) (ib/sq in.) (Ib/sq in.)
15.1 × lOPhosphor
bronze
Beryllium
copperA-_ickel
B_onel
K-Monel
Inconel
17.0
a31-722.2
24.526.4
19.4xI0 _ 13.g×lO s 16.7 XlOe
aAt 1.5 percent D.
TABLE IV
RELATIVE ORDER OF DIAPHRAGM MATERIALS ON
THE BASIS OF DEFLECTIO}T LIMITS AITD RATIOS OF
INDE!_TTATIO!_ NUMBER TO MODULUS
Material
B eryl Iitun
copperK-Me n el
Pho spho r
bronze
Inconel
B-Men el
A-i_i ckcl
Suggested deflection limits
for diaphra_ums
(percent D)
5 to7
4to5
4to _-
3 to 3]-_ I
2
Ratio of l<noop indentation
mumber to relative
mcdulus
197 x IO -s
!35
127
12S
9o54


NACA Technical Note No. 876 Fig. !
l! So_
"" 1 - 8....D_ ,........_,,,
2 q
4 I 7D
8
-___ 31 j2 i
%h___7'
I
JIE
J
, Drill32i
,'" iI deep
._,..2
8
1_34
_2
t
J
i
_ ti. 1----] "- °-" _
I
Q ......................
!1
3!2 !
I
!-
Figure i.- Cross-sectional outline of die and pressure base used in
forming diaphragms. The four dies used had geometrically
similar outlines, differing only in the values of D, which were1 1
I_, 2, 2_, and 3 inches.


0
N.A.C.A. Technical Note _e. 8;'6 Ylg. 2
o
@I
io
o
o
o


N.A.C.A. Technical Note No. _;'_ Yi£. 3
/
!iiii!!ii!
ii!!iii!ii!i
The dtaphra_e were
clamped in the preo-
uure chamber B, by
the cylinder C,
when the lower plat-
Qn wae r&ieod. The
preeeurem were meae-
ured by the manome-
ter 4. The defloc.
tione were meaoured
by the micrometer £,
which was turned by
the graduated wheel
Figure 3.- View of the pre88 u_ed in n_kir_ and teettng the diaphra_ne.with testing ap_aratue,


_TACA Technical Note No. 876
Water colt_uq, W\
L_
Rubber
tubing
i
\
I
I''_.J
I /
To
press arcch_#o or
J
I
_7 .I
i
Fig. 4
,ri
i Mercury column, IXI
\ _2 /
II Nitrometor
I I tubing .
I
1 '' t
I I
I II
• 2 o_ ", I
Flexure 4.- Sketch of _glraulic loading
columns used to apply and
measure pressures. With stopcock C!
closed, water pressures up to 140 conti-i
motors can be applio_. With stopcock C3 t
closed, mercury pressures up to 210 /centimeters can bo applied. Pressures
can be applied either suddenly or slowly.


NACATechnical Note }_o. 876 Fig. 5
.18
.16
.14
.12
-4
.I0
O-H_oOO
.080
A
.06
.O4
.02
t=2.0xlO -3
D=3.0
/D=._VxI0 -3
Deformed 9=3.0
I I t/D=l.5xl(
0 lO 20
/
/
t=4. ixlO -3
..... D=I. 5
t/D=2.9xlO -3
i
Figure 5.- Pross_zre-doflcction curves for several reinforced beryllium-
copper diaphra&_ns. The dotted lines arc extensions of the
straight lines through the X = 0.02D points.


N.A.C.A. Technical Note No,876 Fig. 6
42OO
I00
80
6O
2O
L
FX i0
PD
8
1
0.8
0.60.3 0.4 0.6 0.8 1 2 4 6 8 !'3
lO00t
D
Figure 6.- Ths pressure-deflection data on beryllium-copper diaphraKms plotted to showthe relation between the dimensionless ratios FX/PD and _/O. The effective
value of F (approximately E/I - 6 _) was taken as 18.9x10⁶ pounds per sc_uare inch. (I0 _
mm _g). The points marked with open circles represent different diaphragms. Those
marked with crosses, triangles, or solid dots represent the series of measurements on
three different diaphragms after successive etchings.


f
NACA Tecl_uical Note !lo. 876m I
I
.... i .....
Jt
, \i
'
i
° _
H _1__l--IZ'_r-I .... __....
II III A_
L
!
.--I-.....-I
/
il ....
N
i 1.....
/ i I
r'l
....... _"Z" __Q
.i_ t-.-t.... _ _'_II
, 4-_
I
iiI
I I
%uooaod 'uoT%_TAoC
Fig. 7
i I _A j
tO
'DO
©
4_
0
PD r-_
A
I
l
I-----I
GO
I
r-I
0
I


_,ll> •}TA<JATechnical Note _To 876

I_[ACATechnical Note No. 876 Fig. 9
1.2
O
O
O
N
91.1O
O
.H
.H
_4O
,-4
O
_l.0_3
O
a3
O
O
-H
.9
.8
---t
I
\
o
O
!
_'N A
- %
____1__. +
I
+ A
tI D, in.
w-- £_ I.D
I x _o
+ 3.0
0 I _ S
lOOGt
D
Figure 9.- The variation of the average flexibility _vith t/D for re-
inforcci beryllium-copper &iaphra_ns. The ratios of average
flexibility at O.O&D to that at O.02D arc plottcl against t/D.


NACATechnical Note No. 876 Fig. I0
u_!D-4
I l I IO O
O r"q O t-.-It-I t--t
14 N_ _ O
_--ILO HOO •• _ • .k"0
II IIII 11 11 II
A
4-_ .4_
o\
(Dtq
O
O
P-_-- 0"J ....
o
o
0
!c
I l ! ,; !O O
0 r-I 0 ,-I,--t
_4 _414 1,4
0 1>" r'-
II I1II II II 11
A A
, , t
t I o
//°0
Ot'o
_IC__ot
_ _o ° °• •
o >
ol
I
×0
/
/
/
/ fX o
It
t't .....
I °XI
HI--.I
t.---0f
f
o' 0 ,u
¢-,
.r4
,-I,-t
e0
-Q.__
0oQ
t
!
? ii
o 0 o,.-q to
•u_. 's_s0_o%SZH
o
I--4
to
o,7
,-4C_
..o
oo
o
O
o,-4.4m£)9,-4
_DCl
" o ........ ,-q
"O ' H_ H
jO" I I--4
o"
0 0 002 ,-I
/ [-9


NACA Technical Note No. 876
30 x I0-5--_ .....t C--
t /f-"
.r't
o__ I / .,/o
0 .2 .4
\I \
>
i \i
.6 .8 1.0
Deflection, percent D
Fig. III
I lt = 4.5 x 10 -3
-D=l.5
t/D = 3.0 x 10 -3
I ----I-....i
II
111i ......
l
._d
1.4
5O
40
"_ 30
0
h
0
_ 2o
lO
I ×1
i____
, I\13 4 5
Deflection, percent D
I
I0 1 2 5 7
Figure ll.- Hysteresis curves for a bery!lium copper !iaphra_nu for vari-
ous maxL.-um deflections. _eso curves are for the same
_iaphra_. as that of curve III of fi_urc 10.


i_ACAT_chnical Note iTo. 876I
i
# I i
Phosphor bronze
?:, _-_--'--?..
Fig. 12
I I I_ t = 8.1 x 10 -3___
D=2.5
t/D = 2.--ix 10-3
!{'i
2 ......... D = 2.c_t/D = S.0
I I t='7.ot/D = 3.I
9., , I ..... i
, I 4----[....4
2
0
i
!Ii
itL
I " I I i
B cryllit_u copper
, II
l i
fI
t = 8.0 x lh-3
x !',_ -3
I .....t
x 1_ -3
x I0 -3
!
i tt = 4.5 x 10 -3
-- D=l.5
t/D = 3.0 x 10 -3
I
,- I _-_---F--t---j---
t
t=6.8
- D 2.5
t/D 2.'7
i '
x I0-S
x 10 -3--_-i 1' t
i iI
0 1 2
, t
I
I j i i iI
3 ,_- 5 6
t = 12.1 x i0-3 i
D=l.5 _--t/D = 8.1 x 10 -3
1 ' ,i i
'7
Maximum deflection, percent D
Figaro 12.- The maximurz percentage hysteresis obtained from curves in
fi<_._ureslO and ll and others plotted against the maxiru_.] ie-
flcctions cx_ressel as percentages of the diaphragm di_]otcr.


NACATecln_ical Note No. 8762.6
2.0
td
P-i
0
P_
r/l
<.1 1,2%
o
.4
h HO O
o
_', O
O p_
00
0
-22;
I
Ii
I
i
\_q
r_.
Maxinu_:l hysteresis 1X = .Ol D --_ ....... $........._'
" .02 " ! I
I
" ._4 " I
Fig. 13
..... I
i -
iI1.5
I "_ i I
1" I
t i !
2 2.5 3
Di_.:etor, in.
Figure 13.- The variation of the pcrcenta_e r._axi_m_ hysteresis for vari-
ous &eflections v¢ith the diaphra#L7 &isunetcr is sho%vn in the
upper group of curves. The curve marked r_axin_.% ID,storcsis is for do-
floctlons that are follo_vol by the {Troatost pcrconta_o hysteresis. Those
deflections, as percentages of D, are shown in the lower chart for vari-
ous iia_.oters.