Embed Size (px)
Citation preview

Page: 18
Case study 1: Improving evaluation through practitioner participation The IDS Impact and Learning team (ILT) is responsible for supporting IDS‟s Knowledge Services (KS) department to undertake planning, evaluation and learning. ILT is always looking for new and creative approaches to make planning, evaluation and learning more engaging and effective and also for ways to embed these processes in the everyday activities of KS staff and their partners. In 2010, members of ILT developed a process called Facilitated Self Evaluation (FSE) with the following three objectives:
To improve colleagues‟ understanding and experience undertaking evaluation
To improve the quality of project evaluations within the department
To improve the value that these evaluations deliver for people „working on the ground‟
FSE is a process for undertaking participatory evaluation of products delivered in partnership. The whole evaluation process is facilitated by an independent person and is carried out by a practitioner team with first-hand experience delivering the project being evaluated. It results in evidence-based evaluative judgments that can lead to quick improvements in project delivery.
Specifically, the FSE process is built on three concepts.
Facilitated – an evaluation expert supports the project team to undertake every stage of the evaluation. The facilitator‟s role is to advise on appropriate tools and approaches that will increase the rigour of the evaluation design, data collection and analysis. In particular, the facilitator supports the team to use critical questioning approaches to challenge each other to remain true to the evidence (mitigating bias), to use evaluative thinking approaches to push analysis to a deeper level (maximising the depth of insights) and to remain focused on the evaluation questions (mitigating scope creep). It is helpful for the facilitator to have some understanding of the project and the particular field, but not essential.
Self – a practitioner team with firsthand experience delivering the product or project under scrutiny has primary ownership for the evaluation and carries out all the activities in every phase of the evaluation process (design, data collection, analysis and reporting). The team has the deepest understanding of their project history, rationale, assumptions and information needs, and an evaluation designed and undertaken by its members will have greatest relevance to and impact on their work. The team usually consists of six to 10 people who can commit five to 15 days throughout the FSE. A mixed practitioner team made up of staff members from both sides of a project partnership and from varied roles and levels of authority helps bring different perspectives to the evaluation and an element of challenge that can mitigate bias and „group think‟.
Evaluation – the FSE process is fundamentally about making evidence-based judgments. FSE assumes that project teams undertake a multitude of review activities every year (for strategic review, reporting to donors, future planning etc) but that many of these processes rely solely on one source of evidence (e.g. the practitioner team‟s observations), lack research rigour and are framed to serve a particular agenda (e.g. to justify continuation of funding). When undertaking FSE, teams can test and triangulate their personal experiences of delivering a project with evidence gathered through rigorous design, collection and analysis methods, so increasing the validity of their own experiential conclusions. An evaluation undertaken using an FSE approach should stand up to scrutiny by an independent reviewer.
In practice, the full FSE process takes 12-16 weeks. During that time, a facilitator will guide a practitioner team through at least two face-to-face workshops: an inception workshop, to set out the evaluation design, and an analysis workshop, to bring together all of the data that has been collected and to draw some evaluation conclusions. There will be a period of data collection, which could include surveys, interviews, gathering website statistics etc. Finally, the facilitator will set the team on the path towards reporting its findings. FSE takes courage and commitment from a practitioner team. Members need to commit the necessary time to the process and be open-minded about discovering successes and failures within their work.
You can read more about FSE in the forthcoming In Brief Practice Paper.
For more on FSE, see Stage 8: Learning from M&E.

Page: 19
Case study 2: Outcomes mapping The IDS Impact and Learning team (ILT) is responsible for supporting IDS‟s Knowledge Services (KS) department There are relatively few examples where particular approaches have specifically been applied to information literacy interventions. However, in 2012, a project funded by IDS and facilitated by the Department of Information Studies at Loughborough University, involving the University of Botswana, the University of Zambia and Mzuzu University in Malawi, used an Outcomes Mapping approach to M&E to help identify current activities, future aspirations and activities, and challenges associated with developing information literate, critical thinking, independent learners.
Outcome Mapping is a participative M&E approach which places particular emphasis on the „journey‟, i.e. the process, and the changes and the relationships formed during that process (see Stage 1: Case study 3: An institutional approach to assessing information literacy in southern Africa) .

Page: 20
STAGE 1 ASSESSING NEEDS
Key Questions: Assessing your trainee’s needs
What do potential trainees know and understand now? What are they able to actually do now?
What attitudes do trainees possess? Do they value information literacy, and understand its role in achieving their social, occupational or educational goals?
What do potential trainees need to know, understand and be able to do to fulfil their roles and tasks?
What organisational goals are you hoping the training will address?
What must be achieved to meet trainees’ needs, and the organisation’s or wider community’s goals?
What is the most effective way of reaching potential trainees?
What has already been done or achieved? What information literacy training interventions have already taken place?
You may feel you have a good understanding of your training cohort‟s information literacy knowledge, skills and attitudes. Even so, it is good practice to test your assumptions.
To do so, you need to capture current information about your training cohorts‟ information literacy capabilities and their perceptions of their competencies and skills. As you do this, you need too to consider the competencies you would expect to see in the cohort by referring to the information literacy standards, models and frameworks relevant to them (see Box 3: IL Standards, Models and Frameworks). In determining what is known and what is unknown in your trainees, and comparing it with what you might expect at different competency levels outlined in the relevant standards, you can better design your training intervention to address the skill and competency gaps (i.e. the unknowns) and so meet your trainees‟ training needs.
Identifying information literacy training needs starts with a broad identification of the individuals or groups who may need such training. For example, undergraduate students in their final year may need training in referencing systems, or junior researchers may need techniques for scanning articles quickly to determine relevancy to their research.
You need to consider:
1. The roles of these potential trainees and what they need to know and understand to meet their objectives in these roles. This means you need to understand the contexts in which they operate. Understanding roles and goals helps the trainer to understand the type and level of training required. For example, the trainee may need access to health information but have little experience in accessing information or may not be digitally literate. The context may pose limitations too, such as a lack of access to the internet. This may influence the information literacy training, e.g. placing more emphasis on discussion and how information can be shared within the community or by connecting with other organisations. Understanding context helps to ensure that training is effective and enables the trainer to communicate with trainees and show how new knowledge can help them achieve their goals or complete their tasks (whether these are personal or professional or community-driven).
2. How these potential trainees currently perform and report on their performance in their roles. This may be through self-reporting, peer or line-manager appraisal or some other means.
3. The current attitudes, values and perceptions of these potential trainees to lifelong learning skills, information-seeking behaviours and critical-thinking skills. How broad is their conception of information literacy? Do they think of it as a library-orientation skill only (e.g. using e-journal databases), or do they recognise that it can improve their research and problem-solving activities, as well as help them become more active citizens and promote social inclusion?

Page: 21
Top Tip
Always assess needs on a case-by-case basis. Even apparently similar stakeholders (for example researchers) will operate in a specific context and so may anticipate different learning outcomes.
Gathering data
To find answers to all these questions, you need to gather data on your target individuals and groups. Data gathering tends to be either through traditional survey-based approach, where trainers elicit data from their potential trainees using needs-analysis surveys, interviews etc or, alternatively or in combination, highly participative approaches can be used, generally via discussion and workshops in which the participants reflect on and define their needs. The latter are usually facilitated and various techniques can be applied, such as cause-and-effect diagrams, identification of situations where information is needed, barriers and „helps‟ etc. These methods are described in more detail below.
Survey-based approaches, often quantitative, are relatively quick to apply and data are easily analysed. Participative approaches, tend to be more complex, requiring genuine engagement with the audience and involving discussion and negotiation. They tend to result in qualitative data that may be harder to analyse. However, techniques where simple, participative techniques are used to gather data, such as flip charts or stickies are very effective and cheap, plus data can be quickly captured and stored using photographs. Participative approaches tend to require more commitment from the participants but tend to result in greater engagement.
In either participative or survey-based approaches, data gathered can be either quantitative or qualitative. Quantitative tends to focus of the presence of certain characteristics, the „what‟ and the „how‟, for example knowledge of sources of information, the usage of sources of information, and the techniques people use to gather, manage or communicate information. Quantitative data tends to be associated with statistical analyses that imply the group is representative of a larger community. However, the term quantitative is also associated with any data that is made up of numbers. The two are not necessarily the same.
This quantitative approach tends to be effective when the trainer has a reasonable understanding of the information literacy that may be appropriate for the audience but wants to get an overview of peoples‟ information behaviour so that training can be tailored. This can also be useful for evaluating the impact of the training and the changes that have taken place as a consequence of the training.
Qualitative data are data that are relevant to a group of people that is not statistically able to be generalised. They also tends to be made up of words. Qualitative data tend to be useful when one is exploring a situation and the variables are not known. For example, data may be in the form of statements by trainees about their perception of their need for information and the difficulties they encounter accessing information. Qualitative data enable a better understanding of „why‟ they do what they do and their values or interpretations of situations.
Qualitative data are often gathered through interviews and focus group/discussions. These methods can be structured using methods, such as grounded theory or Outcome Mapping. The latter provides a framework that enables people to participate and define their vision, mission, learning outcomes and progress indicators.
Methods you could consider using include:
Needs analysis surveys/diagnostic tools. These could be simple yes/no questionnaires or more complex, graded questions in which people assess themselves on, for example, a five-point scale. The latter could include questions about their perceived competence on various tasks, such as finding and using information. Surveys that assess people‟s knowledge before an intervention tend to be called pre-diagnostic tests because they can be followed by post-diagnostic tests that can indicate changes in competencies as a result of training. Such tests often include questions that assess people‟s knowledge of and usage of sources of information, or specific techniques to search for or process and communicate information, or knowledge of ethical issues associated with the use of information. In other words what they do or don‟t do and knowledge that they have or don‟t have. Data tend to be gathered through closed questions (yes/no, or numeric scales) that enable quantitative data to be gathered. However, open questions can be included and provide qualitative data where the respondent can explain why they have answered in the way that they have.
As well as assessing needs, programmes based on pre-assessments of trainees‟ current capabilities and contexts are more likely to be tailored to those needs. Pre-assessments can also help you make an explicit link between the learning concepts and trainees‟ real-world problems.

Page: 22
Importantly, a pre-training diagnostic or test can be used as a „control‟ at the end of a training intervention to assess impact by measuring the distance travelled. In M&E, distance travelled is a valuable tool for measuring the outcomes of interventions. When used in a training context, the distance travelled refers to the progress a trainee makes towards achieving a learning outcome as a result of participating in a training intervention. For more on this see Stage 5: Establishing a baseline.
There are a number of validated instruments you can use to evaluate your trainees‟ information literacy competence. These include: Project SAILS and the iSkills information literacy tests.
Top Tip
All methods used to gather data should be tested (‘piloted’) before they are applied to make sure questions make sense to the respondents and the data gathered helps inform the training.
Interviews. These can be face-to-face or virtual (e.g. by telephone). Interviews can lead to both quantitative and qualitative data. Generally the data are qualitative and provide an insight into people‟s current situations. For example, people may be asked about their role and the tasks they perform and how information helps them. Barriers can be identified, for example the accessibility of sources, a lack of information competencies etc. One method is to use the critical incident technique whereby people are asked to reflect on situations where they needed information, such as needing to get health information to help care for a partner or academic research to write a policy-brief. Once identified, interviewees are asked to explore what led up to the situation, i.e. what created the need; how they sought information, i.e. indicating their information-seeking behaviour and identifying „helps‟ and „hindrances‟; and how they applied the information, i.e. helping to understand their needs better and their ability to make use of the information. Task analysis is another common interview technique where tasks are associated with roles or a situation, such as sharing information in the workplace. This provides information about current practice and can elicit current obstacles, such as who they should share information with, why and how; how they should store and manage information etc.
Focus/discussion groups. These discussions with small groups of potential trainees or other stakeholders can be informal but must be well facilitated. These can be captured on video, audio recording, flip chart and Post-it notes. This method can be used in a participative fashion where people reflect on their information needs and how they seek and use information. In this case, the facilitator enables the conversation, using various tools such as flip charts or Post-it notes or cause-and-effect diagrams. The latter can be used, for example, to highlight particular problems (their cause and effect) in a community, such as a lack of information security, and then the diagram used to reflect on the kind of information they need to resolve the situation and the capabilities they need to access and use the information.
Focus/discussion groups are also good for discussing and enabling reflection of current practice and attitudes. For example, a team may use this method to reflect on their information practices, for example, how they manage and store their information. This can highlight different practices in the team and help identify good practice and consensus on necessary changes in behaviour and the need for training.
Group sessions are also important post-training to enable reflection on what has been learned. This leads to deeper learning and can also generate ideas for how training can be improved.
Observations. Prior to training, if possible, observation should be conducted in the place where trainees interact with information. This helps the trainer orientate themselves to the trainees and their information environment. Common practices and issues can be identified. This enables the trainer to make sure their training relates to the needs of trainees, in terms of level, and that relevant examples can be used which helps motivate the trainees. It also indicates to the trainees that the trainer is serious about understanding their needs.
Observation during training enables the trainer to identify problems that individuals are experiencing and deal with them quickly and sensitively and also helps to gauge whether the training is pitched at the right level. Evidence can also be rapidly gathered about the skills and knowledge of trainees as they go about undertaking a task or set of tasks.
The significance of self-perception using surveys

Page: 23
Capturing a trainee‟s perception of their own skills, knowledge or confidence in a particular information literacy skill (e.g. using e-databases) is a useful method for establishing training needs. Also, (see Stage 1: Assessing needs) and setting a baseline. However, research shows that people often over-estimate their capabilities1. One explanation for this could be a desire to present a certain image of their capabilities. Another could be that people cannot identify what is unknown until they are shown the gaps in their current knowledge, skills and even attitudes. Realising we didn‟t know something can have a marked effect on our confidence levels and it is not uncommon for training beneficiaries to re-assess their knowledge, skills and attitudes once they have participated in a training intervention.
Using a survey questionnaire to establish the limits of what is known can be a difficult task. Take, for instance, someone who scores themselves three out of five (where one is low and five is high) on a question that asks them to assess their skill in using mind-maps to develop a search strategy. Initially, you might consider their self-assessment score as indicating a reasonable degree of competency. But on its own, this score can be misleading. For instance, it doesn‟t tell you what the trainee knows about mind-maps or how they use them. It does though provide a measure of their self-assessment – which is valuable when setting a baseline.
In practice you can use a combination of diagnostic test and self-assessment type questions to check trainees understand the concepts, as well as measure their confidence in being able to apply these skills.
Case study 3: An institutional approach to assessing information literacy needs in southern Africa At IDS we have adopted Outcome Orientation as an approach to planning, monitoring, evaluation and learning. This focuses on outcomes in terms of the changes in behaviour we would „expect, like or love to see‟. We use it to think about the kinds of changes we are trying to achieve through our activities as well as identifying observable changes in behaviour. Put simply, we design our activities by first asking the question, “What will be different and for whom?” before asking, “What am I going to do?”
We applied this approach in an information literacy needs assessment activity undertaken by IDS and Loughborough University with three southern African higher education institutions, one in Botswana, one in Malawi and one in Zambia. We conducted 27 lengthy, one-on-one interviews with stakeholders at the institutions in Malawi and Zambia, using an interview script to ensure a comparative and consistent approach. As we were unable to do the same in Botswana, we held a participatory workshop there to complement the activities in Malawi and Zambia. This consisted of a three-day planning event with 18 key stakeholder groups. Equivalent representatives in all three institutions were invited to take part in the study and included vice chancellors, faculty directors, and library, technical and administration staff.
The entire assessment proved a reflective and thought-provoking exercise. It enabled key stakeholders to comment on what had already been achieved (i.e. their successes), as well as the challenges (as they saw them) and ways these could be addressed (i.e. the opportunities). It also highlighted where they would like to go, either at an individual, organisational, national, regional or international level.
The discussions resulted in a list of recommendations for activities and partnerships to help all three institutions move forward and address their information literacy capacity building needs. You can read more about this in our paper, „An institutional strategy for developing information literate, critical-thinking independent learners within higher education in Africa‟, available: http://bit.ly/13kyPmO 2
1 Dawes, J. (2007). Do data characteristics change according to the number of scale points used? An experiment using
5-point, 7-point and 10-point scales. International Journal of Market Research. 50 (1)
2 Hepworth, M and Duvigneau, S. (2012). Building Research Capacity: Enabling Critical Thinking Through Information
Literacy in Higher Education in Africa. Available: http://opendocs.ids.ac.uk/opendocs/bitstream/handle/123456789/2301/BuildingResearchCapacityR1.pdf?sequence=1. Last accessed 23 Feb 2013.

Page: 24
Case study 4: Using stakeholder interviews to develop an information literacy national curriculum in Zimbabwe In a needs analysis activity in Zimbabwe, IDS conducted one-on-one and group interviews with different stakeholder groups interested in developing a national curriculum for teaching information literacy using a learner-centred and enquiry-based approach in Zimbabwean universities. We interviewed key stakeholders at the Research Council of Zimbabwe, Zimbabwe University Library Consortium (ZULC) and the Zimbabwe Library Association (ZimLA) to identify why they wanted to adopt a pedagogical approach. We also interviewed potential recipients of the training to find out their current knowledge, skills and attitudes, as well as those of the people they work with (e.g. the students).
During all of these discussions, we gathered evidence about what had already been achieved and what difference the training might make. In other words, we asked, “What will be different and for whom?” and, “Why is this important in your particular context”? From these discussions, we developed a needs assessment survey which the training cohort was asked to complete. The survey helped to validate the information gathered during the face-to-face discussions and enable us to set the training intervention‟s learning objectives and outcomes.
In actual fact, the training outcomes were a combination of the outcomes elicited from the needs assessment activities as well as those identified by the funder of this exercise (DFID). The outcomes were expressed as changes in knowledge, skills and attitudes as a result of taking part in the learning intervention and were grouped as follows: those we would expect to see (normally immediately after the intervention), those we would like to see in the following three months, and those we would love to see (longer-term goals that may or may not happen, their being contingent on other factors).
Flowchart 1: assessing your trainees‟ needs

Page: 25
STAGE 2 PROGRAMME STRATEGY & OBJECTIVES
Key Questions: Determining your strategy and objectives
What are you trying to achieve with your training?
How will you know if it is working?
What changes will you see if the training has been successful?
What outcomes are you hoping to observe in knowledge, behaviours and skills?
Have all the stakeholders contributed to development of the objectives/outcomes?
Are the objectives/outcomes specific, measurable, achievable, relevant and time-bound?
If you strategically plan your project you will know what you are trying to achieve and have a rational argument for your approach in getting there. Strategic planning is necessary for delivering a good project and also for doing a good evaluation.
Clearly identifying what you are trying to achieve, from your own perspective and that of your audience, is essential. Once this has been defined then a number of techniques can be used to identify the nature of the intervention, specific objectives and outcomes, and ways to identify progress and change.
Pulling it all together
A framework in information literacy training M&E is a way of describing your intervention and showing how you expect your actions will lead to the desired outcomes and impact. It is a plan of the methods you will use to gather the monitoring data, but it can also make it easier to define your objectives. Two common M&E frameworks in international development are Logical Frameworks and Theory of Change (TOC). Both of these can help you to think about and articulate the objectives of your training (as well as its outputs, outcomes and impact). These are generic M&E frameworks and should not be confused with the conceptual frameworks (see Towards information literacy indicators, R Catts & J Lau) for information literacy.
The Logical Framework approach
A Logical Framework (also known as a logframe) is “a tool to help designers of projects think logically about what the project is trying to achieve (purpose), what things the project needs to do to bring that about (outputs) and what needs to be done to produce these outputs (activities).” (Department For International Development) 3
Logframes are usually developed in consultation with stakeholders and provide project staff, donors, the project beneficiaries and other stakeholders with a simple summary of a project strategy. A logframe can form the basis of donor-funding applications, when it is used throughout the project‟s lifecycle to track progress and adapt to changing situations. In an information literacy setting, a logframe can be used to articulate how an organisation aims to meet regional or national objectives. For example, an African higher education institution (see Table 1 : Types of Information Contained in a Logframe) could use a logframe to articulate how their information literacy programme will contribute to the Africa 2020 (http://mariemejamme.com/africa/) goals. Their higher-level goal would be to “invest in human capital and bring about a sustainable future for Africa”. This could be achieved through developing an information literacy programme aimed at students and other related activities. The indicators for measuring whether they had achieved their goal might include an increase in female student academic achievement (as a result of attending the information literacy training programme). The sources of information they
would gather would be test data and final end-year results (see table below for more examples).
3 BOND. (2003). Logical Framework Analysis. Available: http://www.gdrc.org/ngo/logical-fa.pdf . Last accessed 23 Feb
2013.
Page: 26
Top Tip
Each donor uses different terminology in their logical frameworks. Familiarise yourself with the variations in terminology before you start to complete your logframe
A logframe includes a narrative about:
The broad development impact the project or intervention will contribute to society or individuals (goal)
The expected benefits/outcomes at the end of the project or intervention (purpose/objective)
The tangible products and services the project or intervention delivers (also known as immediate objectives or outputs and results)
The activities that need to be carried out to achieve the immediate objectives (activities)
Each project description will include details of how progress and change will be measured (verifiable indicators), the type of information or methods used to plan and monitor progress, and a record of the factors outside the project management‟s control that may impact on project feasibility (i.e. assumptions). Table 1 shows the type of information usually contained within a logframe
Theory of Change
A logframe is a simple summary of the project strategy that helps you to plan and monitor your project‟s outputs and outcomes. But how do you demonstrate the long-term goals of your programme or project? Theory of Change (TOC) is another strategic tool that can help you clearly articulate the long-term changes at an organisational, programme and project level.
TOCs are normally articulated in a diagrammatic form although there are endless variations in style, form and content. TOCs show graphically how change happens in relation to a number of themes, the pathways an organisation might take in relation to these themes and a means by which the impact of the pathways and the assumptions made about how change happens can be tested4.
When you deliver your information literacy training you should link your training objectives (and outcomes) to the goals, objectives and activities highlighted in your strategic framework. You should also take careful account of the measures you need to provide to demonstrate that you have achieved your project goals. When you design your training intervention you should translate the framework or organisation‟s strategic goals into the learning and training objectives/outcomes.
4Ontrac, The newsletter of INTRAC: Theory of Change: What‟s it all about [downloaded 01/02/13] http://www.capacity.org/capacity/export/sites/capacity/documents/topic-readings/ONTRAC-51-Theory-of-Change.pdf

Page: 27
Project Description Indicators Source/Means of Verification Risks & Assumptions
GOAL - Sustainable improvements in society or well-being of people (impact)
How the Goal is to be measured, including quantity, quality, time
How the information is to be collected, when and by whom
Information
literacy example
To develop creative and
innovative thinking skills to build a more sustainable Africa workforce
X number (e.g. 20) employers
stating that new student recruits have better employment skills
Interviews with employers
Surveys of employers
The environment is stable and students can
find employment.
A demand exists for creative and innovative talent.
Employers are willing and able to communicate the changes in creative, innovative thinking student profile
OBJECTIVE(S) – Changes in behaviour or improvements in access or quality of resources (outcome)
How the Purpose is to be measured including quantity, quality, time. How you will know that intended change has occurred
As above
Information
literacy example
To increase the use of research knowledge by students
X number of current and relevant citations in research papers
X increase in the use of e-journal databases
Report with analysis of examples
Self evaluation reports
Regular interviews conducted with students and staff
Surveys of students and staff
e.g. Assess threats and vulnerabilities of a region, outside beneficiaries’ control
If the Purpose is achieved, the assumptions external factors that need to be in place or
must hold true to achieve the Goal
The increase in research knowledge and skills will lead to critical and innovative thinking skills.

Page: 28
RESULTS – Tangible and immediate products or services as a consequence of completed activities
How the Results are to be measured including quantity, quality, time?
As above If the Results are achieved, the assumptions that must hold true to achieve the Purpose
Information
literacy example
A credit-bearing information literacy programme
X students successfully pass the programme
X students achieve x results in their test scores
Test results
Assignments
Attitudes to the value of the library will improve along with creative and innovative thinking skills
Students are able to see the link between critical lifelong learning and building innovative thinking skills
ACTIVITIES – Tasks that have to be undertaken to deliver results through mobilising inputs
Input and Resources needed to carry out each task
If Activities are completed, the assumptions that must hold true to deliver the results
Information literacy example
In year 1, information literacy module (on critical thinking skills) is developed
The module is developed in collaboration with academic staff and contextualised to different disciplines
Library and academic staff are able to teach critical thinking skills
Table 1: Types of Information Contained in a Logframe

Page: 29
The training objectives/outcomes
An objective is what you will achieve or learn by the end of a training intervention. Objectives are often linked to the training outcomes, which are expressed as what you will be able to do with the new skills and knowledge. Effective M&E is impossible without the identification of clear objectives that relate to outputs, outcomes and impact (see Box 5: Outcomes, Outputs and Impact).
Definition
Making your objectives / outcomes SMART
Ask yourself if each of your objectives/outcomes is:
Specific Do you have a clear statement of what the trainers and trainees will do or learn during the training intervention?
Measureable How will change be detected and what are the baselines (if any) against which it will be measured?
Achievable Have you ensured that trainers and trainees have the resources and the capacity to achieve the objective?
Relevant Is the objective relevant to the trainees‟ role or the role they perform in their organisations?
Time-bound Has the objective been designed with a view to how long the training takes place and the subsequent effects of the training persist?
If your objective can demonstrate each of these attributes, it is SMART. It is not SMART if any one of them is missing.
It is worth bearing in mind that these different attributes are also interdependent. For example, an objective will not be measurable if it is not relevant to a learner who cannot achieve a specific skill in the time available to them.
Box 7: SMART Objectives
Considerations when setting your objectives (and outcomes)
All training interventions occur within particular contexts – individual, organisational and community or social. The relationship between these contexts is important, and so defining objectives should always be a joint exercise. Trainers, trainees and other stakeholders in the training intervention should all have their needs, interests and concerns considered. For example, the objectives of university-based information literacy training interventions might have to be matched against broader institutional objectives, policies and strategies. Or, the objectives of trainers working for NGOs might have to reflect the priorities of funders or donors, or the ability of the community to advocate for resources. For more on consulting with stakeholders, see Stage 3: Identifying challenges.
Your objectives should also be SMART (see Box 7: SMART Objectives). A SMART objective for an information literacy training intervention might, for example, be: „By the end of the training intervention (time-bound and achievable), learners will be able to critique the tools and strategies (specific) they currently use (relevant) to find scholarly information (measurable).‟
Top Tip
When considering what objectives the training should meet, consider individuals’ personal objectives as well as their organisation’s objectives. You should also consider the objectives of any other stakeholders, such as funders, and the wider community.

Page: 30
Thinking through outcomes and impact
Outcomes focus on how the skills and knowledge will be applied. Some possible outcomes for information literacy training include:
Changes in knowledge and skills. This is where M&E captures precisely what has been learned through the training intervention: the knowledge, understanding and skills that have been acquired, developed or enhanced. These data should be gathered immediately after your training and we go into more detail about this in Stage 5 of our M&E journey. For example, this could include the ability to use a mind-map to help define information needs and identify search terms.
Changes in confidence and behaviour. M&E here seeks to capture the extent to which trainees‟ approach to the handling of information has evolved as a result of what they have learned. Our research in the course of developing this toolkit suggests that relatively few attempts have been made so far to gather evidence on such changes. We discuss how it has been achieved so far, however, in Stage 6 of the M&E journey.
Changes in performance and practice. This is the extent to which trainees are doing things differently as a result of what they have learned. M&E here seeks to answer questions such as how trainees have applied their knowledge, skills and newly-acquired confidence to enable them to work more effectively, whether it be as students, academics, community organisers etc. For example, this could include evidence of using a range of sources shown by relevant references in a report. The answers to such questions can be complex, particularly if the impact can be measured only in the longer term. However, they serve as a basis for considering the broader impact of information literacy training interventions on organisations and wider society. We provide a case study in Stage 5 and which explores the use of using diagnostic tests pre-, during and immediately after training, and three months later.
Some possible impacts for information literacy training include:
Impact on an organisation Training is likely (although not invariably so) to take place within organisations such as schools, universities or local libraries, or at the behest of organisations such as donors or funders which commission third parties, e.g. NGOs, to undertake the training. These organisations have a right to expect that information literacy training will have an impact by helping them meet their overarching priorities. For example, this could include acceptance of publications by refereed journals or an increased in the success of bids for funding.
Impact on the wider community The impact on the wider community of your training intervention may be particularly challenging to identify. The boundaries of your target sector or community may be ill-defined, your timescales for impact long and your SMART objectives/outcomes difficult to define, let alone to measure. Nevertheless, the Centurion workshop demonstrated there was significant interest in deriving community outcomes, and therefore in applying M&E to a broader, societal context.
If you need to evaluate impact on the community, you should consider the context in which your training intervention is taking place For instance, where a specific organisation is involved in outreach to the wider community, what current training interventions do they provide and are there gaps in provision? One example of outreach to community is what role does a university library play in preparing students for the transition to higher education? Does it work with teachers and students to prepare students for tertiary education and has this led to a larger number of students being accepted?
Revisiting a community where an information literacy intervention has taken place could seek evidence of increased use of information technology and successful advocacy for resources, such as the provision of local health facilities, based on effective use of available information.

Page: 31
Case study 5: How GDNet applied Theory of Change Figure 3 illustrates the Theory of Change developed by the Global Development Network (GDNet). Developing a Theory of Change can help you to explore and collect evidence about the pathway which leads from the specifics of what is taught and learned during a training intervention to what trainees do in practice. The easiest way to „read‟ a Theory of Change is from left to right, though they are actually developed from right to left in a workshop setting.
Figure 3: GDNet’s Theory of Change
Case study 6: How IDS incorporated feedback loops in its Theory of Change
Figure 4 illustrates the Theory of Change IDS created for its Knowledge Services team. This one is rather more complicated, with some feedback loops embedded.

Page: 32
Figure 4: IDS Knowledge Services Theory of Change (Downie, 2008). http://www.ids.ac.uk/files/From_Access_to_Action_Downie_2008.pdf
Flowchart 2: determining your strategy and objectives

Page: 33
STAGE 3 IDENTIFYING CHALLENGES
Key Questions: Addressing your M&E challenges
Who stands to benefit from your training, apart from the trainees? Is there anyone who may be affected negatively?
Who can significantly influence the success of the project?
What challenges might you encounter during your M&E activities?
How are you going to minimise the risks of encountering these challenges?
What risks are there and how can they be managed?
As you embark upon your M&E journey, you need to think about the challenges you may encounter. Challenges come in many forms. Considering them in advance will help you manage them, and plan to minimise the risks they present. Challenges can include people and the physical and emotional environment.
Challenges from people
Very often the most significant challenges to any intervention are rooted in people rather than practicalities. In particular, individuals who stand to gain or lose from your intervention, or who can influence it, i.e. your stakeholders, can determine the success or failure of your M&E journey.
Your stakeholders should have been consulted when you set your objectives (Stage 2 of the M&E journey), but it is also worth considering whether you should collect some data from them, how you should communicate with them and whether they should be involved in learning processes.
Identifying and involving stakeholders in the entire M&E cycle, to at least some degree, brings a number of benefits:
It ensures they understand and are committed to the M&E process
It helps ensure the relevant questions are being asked
It increases the chance that findings and recommendations are listened to and used
It ensures that participants are willing to provide data and perceive the process as a useful one
It may help ease the load on the trainer if stakeholders help with data collection and analysis
It ensures that M&E is embedded in the whole organisation and will continue even if a trainer leaves
For these reasons, it is worth doing a stakeholder analysis as one of your earliest activities on your M&E journey. It will help you determine the extent to which you should consult your stakeholders at each stage of the journey.
Top Tip
Communicating identified risks to stakeholders early on in your M&E journey flags up potential problems to those who need to be aware of them and may result in help to overcome them.

Page: 34
Challenges in M&E may arise from a variety of others sources too – and at all stages of the M&E cycle. In the table below we have described some challenges you may face in terms of questions, and grouped them into the different stages of the M&E journey at which they might occur.
The solutions to the questions will be highly specific to your own context, but failure to address them early on in your M&E journey may store up problems for later. Consider using a problem-analysis tree to break down the problem into manageable parts. This will help to prioritise various factors, define solutions and agree actions.
Decisions
1. Assessing needs Who defines how wide a lens you should take on needs assessment? Is everyone involved willing to admit to individual and/or organisational needs? Do stakeholders accept the necessity to do a needs assessment, with the consequent resource and time costs?
2. Programme strategy and objectives Are stakeholders agreed on the programme strategy? Have stakeholders embraced the need for evaluation, with the consequent resource and time costs? Are stakeholders agreed on the purpose of the evaluation and the evaluation questions?
3. Identifying challenges Have you done a risk assessment for your M&E process, identifying big and small issues which could derail it, and have you developed strategies to address them?
4. Designing M&E Do stakeholders understand the implications of the choice of your M&E methods, in terms of skills, resources, cost and the kinds of data which will be generated? Have individuals with appropriate skills and time been identified to implement the M&E? Have logistics been considered, including scheduling, transport, data collection and data entry? Are the participants, i.e. the trainees, sufficiently engaged with the exercise? Do all the stakeholders appreciate the value of the training? Do they consider their needs have been adequately considered? Do they see training, including the M&E, as threatening or enabling?
5. Establishing a baseline Have you built in baseline evaluation? Have you planned your M&E so that you can establish the baseline early, before the intervention has actually started? (Otherwise, your participants may have already improved, and you may not detect any further changes.)
6. M&E during and after training Have you designed your M&E so that it is only minimally disruptive during the training process? Do all the trainers understand the point of doing M&E and have they committed to it? Have you communicated your M&E process to participants and engaged them in it?
7. Data analysis Have you piloted your data analysis early so that you can identify any issues, e.g. in terms of skills, knowledge or software?
8. Learning from M&E Have stakeholders committed to doing something
Page: 35
with the M&E results? Have they accepted that the report is just the beginning of their effort?
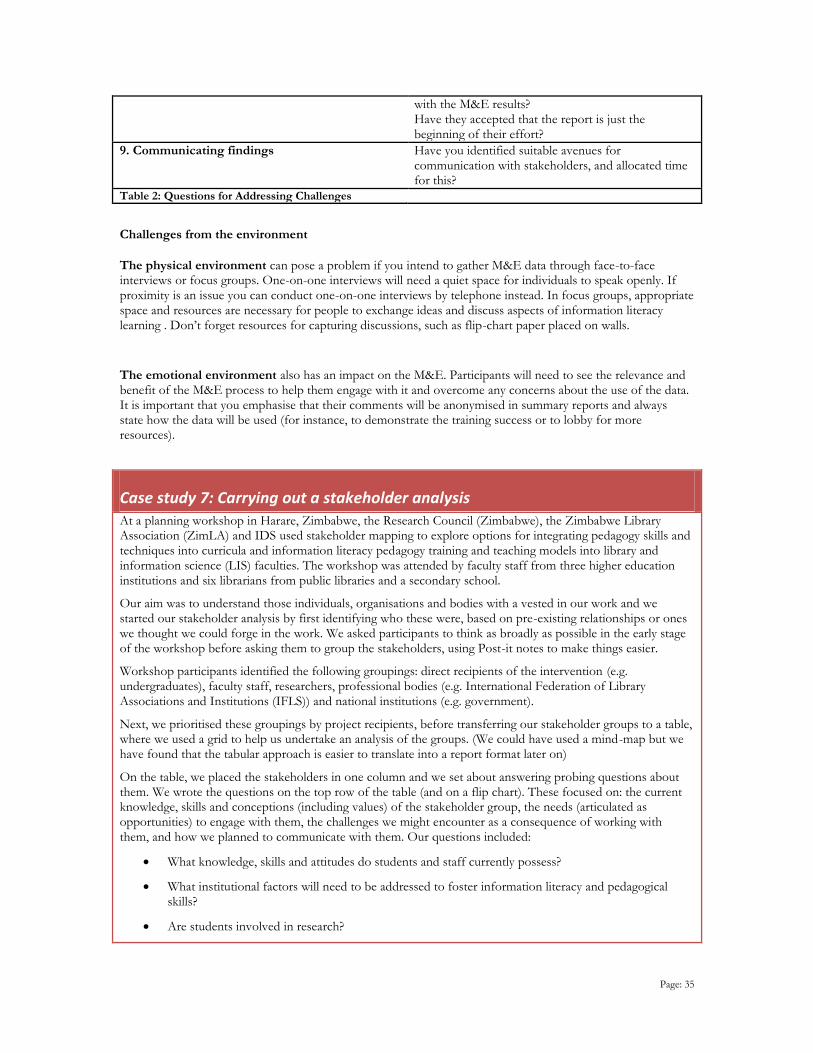
9. Communicating findings Have you identified suitable avenues for communication with stakeholders, and allocated time for this?
Table 2: Questions for Addressing Challenges
Challenges from the environment
The physical environment can pose a problem if you intend to gather M&E data through face-to-face interviews or focus groups. One-on-one interviews will need a quiet space for individuals to speak openly. If proximity is an issue you can conduct one-on-one interviews by telephone instead. In focus groups, appropriate space and resources are necessary for people to exchange ideas and discuss aspects of information literacy learning . Don‟t forget resources for capturing discussions, such as flip-chart paper placed on walls.
The emotional environment also has an impact on the M&E. Participants will need to see the relevance and benefit of the M&E process to help them engage with it and overcome any concerns about the use of the data. It is important that you emphasise that their comments will be anonymised in summary reports and always state how the data will be used (for instance, to demonstrate the training success or to lobby for more resources).
Case study 7: Carrying out a stakeholder analysis At a planning workshop in Harare, Zimbabwe, the Research Council (Zimbabwe), the Zimbabwe Library Association (ZimLA) and IDS used stakeholder mapping to explore options for integrating pedagogy skills and techniques into curricula and information literacy pedagogy training and teaching models into library and information science (LIS) faculties. The workshop was attended by faculty staff from three higher education institutions and six librarians from public libraries and a secondary school.
Our aim was to understand those individuals, organisations and bodies with a vested in our work and we started our stakeholder analysis by first identifying who these were, based on pre-existing relationships or ones we thought we could forge in the work. We asked participants to think as broadly as possible in the early stage of the workshop before asking them to group the stakeholders, using Post-it notes to make things easier.
Workshop participants identified the following groupings: direct recipients of the intervention (e.g. undergraduates), faculty staff, researchers, professional bodies (e.g. International Federation of Library Associations and Institutions (IFLS)) and national institutions (e.g. government).
Next, we prioritised these groupings by project recipients, before transferring our stakeholder groups to a table, where we used a grid to help us undertake an analysis of the groups. (We could have used a mind-map but we have found that the tabular approach is easier to translate into a report format later on)
On the table, we placed the stakeholders in one column and we set about answering probing questions about them. We wrote the questions on the top row of the table (and on a flip chart). These focused on: the current knowledge, skills and conceptions (including values) of the stakeholder group, the needs (articulated as opportunities) to engage with them, the challenges we might encounter as a consequence of working with them, and how we planned to communicate with them. Our questions included:
What knowledge, skills and attitudes do students and staff currently possess?
What institutional factors will need to be addressed to foster information literacy and pedagogical skills?
Are students involved in research?

Page: 36
What has already been achieved in building capacity to teach information literacy using pedagogical approaches?
Who has a vested interest in outcomes?
What challenges might we face?
What knowledge, skills and attitudes are needed to take this work forward?
This mapping helped us to:
Identify what we knew about our stakeholders
Identify the gaps in our knowledge
Focus on the best approaches for engaging with stakeholders
The analysis enabled us to pinpoint those stakeholders who could influence the outcome of our work, i.e. those it was critical we considered from the outset. This meant we could plan ways in which we could update them with our progress. It also enabled us to identify those stakeholder groups who were less likely to see the value of our work immediately, so we could plan activities that helped us to build confidence in our approaches.
Finally, the analysis helped us to identify possible risks and think through mitigation strategies. For example, the group discussed how to take forward key activities without funding and also took account of forthcoming events that would provide a suitable platform to talk about the project.
This stakeholder analysis, like others that we carry out, was used during the planning process to understand our target audiences but it also served as a baseline to test our observations and develop high-level project plans, a communication strategy and a risk log.

Page: 37
Figure 5: Stakeholder Analysis from Research Council, ZimLA and IDS Workshop
Flowchart 3:addressing your m&e challenges

Page: 38
STAGE 4 DESIGNING M&E
Key Questions: Designing your M&E
What methods will enable you to establish whether you are achieving your objectives and outcomes?
What methods are appropriate to use throughout your intervention?
How will you ensure consistency and comparability between the data gathered?
What questions do you need to ask and what evidence are you looking for?
Might you need to use a combination of methods, depending on the range of outcomes you desire?
Do you have the skills and resources necessary to implement your chosen method(s)?
Once you have defined your objectives (and any outcomes you anticipate) then you are ready to design the detail of your M&E process, sometimes called a data collection framework.
The chief function of an M&E data collection framework is to serve as a plan of the methods you will use to gather your monitoring data. There is a range of methods you can use and developing a data collection framework will ensure you capture data that are consistent and comparable throughout your M&E journey. It will also highlight the resources you need to capture and analyse the data.
First though you need to answer some fundamental questions about the evaluation questions you are trying to answer.
Qualitative versus quantitative methods?
The decision as to whether to consider qualitative or quantitative methods is often at the crux of M&E design. It will determine the quality and richness of the information you gather, as well as the depth and breadth of it. We considered the differences between qualitative and quantitative data in some detail in Stage 1 of the M&E journey. You will recall:
Qualitiative methods help you to describe, explain and understand a process, or explore a variety of positions. They are often associated with feelings, thoughts or perceptions, and can reveal responses that add a richer, more compelling dimension to the data collected.
Quantitative methods help you to say how much or how many, and to make comparisons between two groups or test a hypothesis. They are often associated with numerical data or data that can be converted into numerical form.
Consider a field of maize ready for harvesting. Quantitative methods to evaluate the quality of the maize may involve weighing the maize or calculating the average yield per square metre. Qualitative methods may involve a botanical drawing of an ear of maize, a discussion of its colour, flavour and smell, or an examination of the way in which it reacts to the weather. In short, quantitative methods enable us to describe the harvest; qualitative methods help us to understand better what maize is actually like.
In reality, quantitative and qualitative approaches are often used together. This is referred to as triangulation‟ or mixed methods. Triangulation offers the advantages of both, while minimising the disadvantages of using them

Page: 39
singularly (see Table 3: Qualitative vs Quantitive Methods). It is important to be clear what questions you are trying to answer with each approach.
Qualitative Quantitative
Ad
van
tag
es
Exploratory, and permits answers to arise that you hadn‟t considered the possibility of
May feel more respectful (asking people to tell their own stories rather than imposing a story, e.g. via a questionnaire)
May feel more participatory for both trainers and participants
Provides rich, „textured‟ data which can feel more compelling
The only way in which „how much/how many/how strong‟ etc. questions can be answered
Analysis and interpretation may be easier than with qualitative methods
May seem more compelling (but good qualitative methods can be equally compelling)
Allows you to track subtle changes, including changes across time
Dis
ad
van
tag
es
May be perceived as less robust than
quantitative methods (though this can be
mitigated by conducting, analysing and
reporting the research to the highest
standards5)
May seem deceptively easy to conduct, e.g.
interviews. Care must be taken to avoid
„demand characteristics‟ (i.e. indicating to
participants what the „right‟ answer is),
closed and leading questioning etc
It can be easy to neglect consideration of
how transcription analysis will be
conducted. A good analysis will take
approximately 3 times the length of the
original data collection session (e.g. a 1-
hour interview may take 3-5 hours to
analyse)
„Garbage in-garbage out‟. Quantitative
methods are only as good as the
instruments used to collect the data
When people or events are represented by
numbers, the narrative may be
oversimplified
Not useful if the samples are small
Difficult to tell whether you are actually
asking the right questions
Participants can be anxious, e.g. about
what will happen to data about them
May feel more like an exam for participants
Heavily dependent on literacy
Table 3: Qualitative vs Quantitative Methods
Thoughts and feelings versus behaviour?
Most trainers in information literacy training interventions want, ultimately, to change the behaviour of trainees. However, that can be a very long-term goal. In the short term, we often use a change in trainees‟ self-assessment of their knowledge, skills and attitudes as an indicator that we may eventually achieve a change in their behaviour.
However, although, it is easier to examine changes in thinking in the short term, we shouldn‟t forget that small changes in behaviour may be still be detectable. For example, an intervention aimed at increasing the use of
5 * Spencer, L., Ritchie, J., Lewis, J. and Dillon, L. (2003). Quality in Qualitative Evaluation: A framework for
assessing research evidence..Available: http://resources.civilservice.gov.uk/wp-content/uploads/2011/09/a_quality_framework_tcm6-7314.pdf . Last accessed 23 Feb 2013
Page: 40
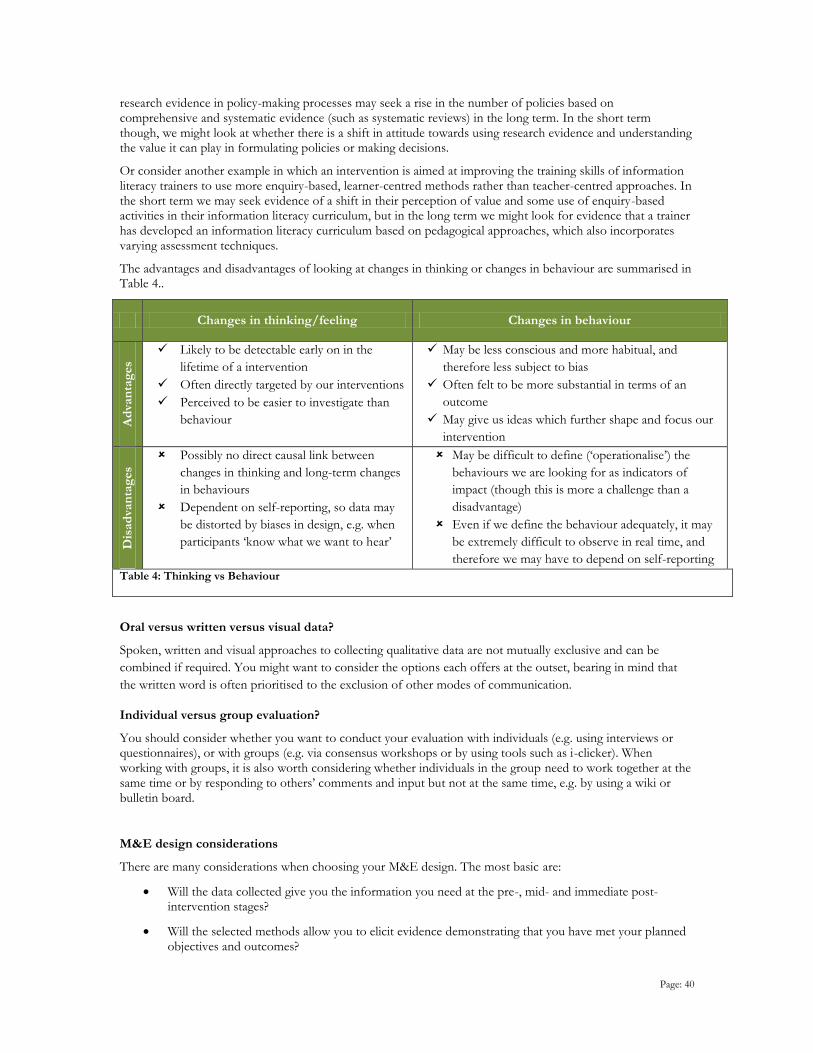
research evidence in policy-making processes may seek a rise in the number of policies based on comprehensive and systematic evidence (such as systematic reviews) in the long term. In the short term though, we might look at whether there is a shift in attitude towards using research evidence and understanding the value it can play in formulating policies or making decisions.
Or consider another example in which an intervention is aimed at improving the training skills of information literacy trainers to use more enquiry-based, learner-centred methods rather than teacher-centred approaches. In the short term we may seek evidence of a shift in their perception of value and some use of enquiry-based activities in their information literacy curriculum, but in the long term we might look for evidence that a trainer has developed an information literacy curriculum based on pedagogical approaches, which also incorporates varying assessment techniques.
The advantages and disadvantages of looking at changes in thinking or changes in behaviour are summarised in Table 4..
Changes in thinking/feeling Changes in behaviour
Ad
van
tag
es
Likely to be detectable early on in the
lifetime of a intervention
Often directly targeted by our interventions
Perceived to be easier to investigate than
behaviour
May be less conscious and more habitual, and
therefore less subject to bias
Often felt to be more substantial in terms of an
outcome
May give us ideas which further shape and focus our
intervention
Dis
ad
van
tag
es
Possibly no direct causal link between
changes in thinking and long-term changes
in behaviours
Dependent on self-reporting, so data may
be distorted by biases in design, e.g. when
participants „know what we want to hear‟
May be difficult to define („operationalise‟) the
behaviours we are looking for as indicators of
impact (though this is more a challenge than a
disadvantage)
Even if we define the behaviour adequately, it may
be extremely difficult to observe in real time, and
therefore we may have to depend on self-reporting
Table 4: Thinking vs Behaviour
Oral versus written versus visual data?
Spoken, written and visual approaches to collecting qualitative data are not mutually exclusive and can be
combined if required. You might want to consider the options each offers at the outset, bearing in mind that
the written word is often prioritised to the exclusion of other modes of communication.
Individual versus group evaluation?
You should consider whether you want to conduct your evaluation with individuals (e.g. using interviews or questionnaires), or with groups (e.g. via consensus workshops or by using tools such as i-clicker). When working with groups, it is also worth considering whether individuals in the group need to work together at the same time or by responding to others‟ comments and input but not at the same time, e.g. by using a wiki or bulletin board.
M&E design considerations
There are many considerations when choosing your M&E design. The most basic are:
Will the data collected give you the information you need at the pre-, mid- and immediate post-intervention stages?
Will the selected methods allow you to elicit evidence demonstrating that you have met your planned objectives and outcomes?

Page: 41
Do you have the capacity to implement the methods you have found appropriate?
Other considerations include:
Working in order
You need to make your choices of methods, tools and technologies (see Box 6: Approaches, Methods, Tools and Technologies) in the right order. Identify the most appropriate method for capturing your monitoring data before choosing your tools or technologies – which should then facilitate the data collection. Taking the time to consider the amount of effort or cost involved in collecting and analysing the data upfront can result in significant savings in the long run. Your choice of technology will also highlight any logistical issues you have to consider when preparing your evaluation.
Ease of comparison
It is critical that you choose methods and tools that are consistent and comparable if you are to elicit results that are robust and meaningful. For example, when you design your pre- intervention survey you should plan to ask the same questions in the post-intervention survey(s) as comparing them can enable you to demonstrate the impact of the intervention as well as highlight changes in knowledge, skills and attitudes. Another useful tip for measuring the quantitative changes in knowledge, skills and attitudes is to measure the distance travelled. See Stage 5: Establishing a baseline for a description of this useful tool.
Flexibility and inclusivity
Trainees may have a variety of intellectual and physical capacities. You need to define methods which take account of these. For example, individuals who have a hearing impairment may find a focus group stressful, but may respond well to an individual interview. Incorporating non-verbal and non-literacy based methods where literacy cannot be assumed will help participants feel included and able to respond. Choose methods that will highlight information about gender, current capacities, language preferences and learning needs or disabilities at
the pre-intervention stage and monitor throughout the M&E journey.
Resource requirements
As well as the amount of effort required to undertake your M&E data gathering and analyses, you need to consider time and cost implications. For example, methods that allow a number of people to respond at the same time are generally faster in terms of data collection time. However, be careful that economising at this stage doesn‟t shift the effort to the data analysis stage. This is a classic problem in conducting focus groups, where large amounts of qualitative data can be gathered very quickly, but they are much more time consuming and complicated to transcribe and analyse than data from one-to-one interviews.
Consider too that though data collection technology can be expensive, especially at the set-up stage, it can enormously reduce data collection and analysis time. It is worth asking whether participants already have access to particular technologies, e.g. mobile phones. It may also be possible to request donations or free licences from commercial providers.
However, be aware that while working within your resources, you need to collect sufficient data to subject them to powerful statistical testing when you undertake your data analysis (in Stage 7 of the M&E journey). You should bear this in mind when designing your sample size.

Page: 42
Triangulation
Triangulation is the technical term for applying mixed methods. Essentially, it maps data from one method to data gathered from other data sources, including those captured through a different research method. In information literacy interventions, we can collect data from a variety of information sources, including surveys, tests, assessment rubrics, reflective journals, focus group discussions and individual interviews. If we map data derived from quantitative data sources, e.g. surveys, with data captured using qualitative methods, e.g. individual reflective journals, it can help us to eliminate bias (in our data analysis) and cross-check our observations about patterns of behaviour. The ultimate goal is to increase the validity of our conclusions.
For example, one method you might use at the pre-training stage for an intervention with university students is to conduct one-on-one interviews with faculty staff to gauge perceptions of their students‟ training needs. You could triangulate this information by inviting the students to complete a pre-training survey, in addition to observing their behaviours during the training itself. Comparing all the data obtained from the survey and observations will enable you to test (and possibly confirm) the assumptions made by the faculty staff. Triangulation can corroborate or back up your findings and observations. However, on occasion, it can provide contrasting evidence and lead us to divergent conclusions. For instance, if statistical data contained within two post-training surveys contrasted with observations of the training cohort‟s skills and behaviours. One explanation of this may be that a lack of comparability between the survey questions in the two survey capture forms led to a misleading and biased analysis.
Triangulation can be particularly important if you want to draw comparisons between different groups. Qualitative methods on their own may give inaccurate data in these situations as the variety across individuals in a group may mask small group differences. Including a quantitative element can overcome this.
Pilot tools
Response bias can creep into both M&E design and data collection stages. Bias built into the design of quantitative tools (e.g. a survey or test) can be detected through careful piloting and pilot analyses. Reword any systematic biases and discriminating questions you find to remove bias from the response.
Bias is harder to detect in qualitative research (e.g. interviews) as it can arise through the interaction between the trainer and trainee. To guard against it, carefully consider the design of your interview protocols and select tools that apply good practice in interviewing and facilitation techniques. By referring to the appropriate information literacy standards, models and frameworks (see Part 1, Box x: Information literacy standards, models and frameworks) you will be able to design your interview protocol on the attributes and competency levels defined in these documents.
It is important also to pilot your methods to check they are understood by trainers and trainees. For example, a dummy run with your questionnaire will ensure that trainees can actually do it. If, for example, all the questionnaires come back with only a few questions completed it may be that some questions are too long or over complicated. If, on the other hand, people fail to complete just the last page, it may be that you need to insert a simple „please turn over‟ on the second last page.
As well as doing a dummy run of your data collection method, it is good practice to do a dummy run of the data entry and analysis you plan to ensure that your data are „making sense‟. You can use the dummy data collected from piloting your methods for this.

Page: 43
Top Tip
Be clear about your objectives (and outcomes). The better they are defined, the easier it will be to
choose your methods
Choose methods that are flexible and inclusive
When examining the cost of a method, look across the entire method pathway, from design to
data analysis
Ensure when choosing triangulation (mixed methods) that you are clear how the different ‘stories’
will be pulled together
Wherever possible, pilot your methods first, ideally right through to data entry and data analysis
stages
Case study 8: Checking for survey consistency before and after a workshop We used triangulation to consider the consistency of answers we received within a post-event survey we carried out with participants in a Zimbabwe Pedagogy of Trainers Workshop, as well as between this survey and one we carried out with participants before the workshop itself.
The workshop was aimed at senior librarians who provide training in information literacy in three institutions and it aimed to build their capacity to deliver information literacy training using enquiry-based, learner-centred approaches. Following the event, we wanted to discover what participants had learned about M&E, so we started our post-workshop survey by asking an open-ended question: “What, if anything, have you learned about M&E as a result of the workshop?”
Sixteen out of 20 respondents emphasised that they had learned that M&E is a continuous process in that it is not enough to carry out assessment merely after a workshop, but that there needs to be a baseline.
We then asked the multiple-choice question: “As a result of the workshop, do you now consider M&E as being:
a. “Less important than I considered it previously.” b. “Only as important to me as before.” c. “More important to me as a result of workshop.”
Options „a‟ and „b‟ both attracted no respondents, with 100% of participants choosing „c‟.
Our immediate – and pleasing – conclusion from these questions was that M&E was more important to our participants as a result of the workshop. However, the purpose of triangulation is to spot internal consistency in the answers given throughout a survey (or interviews or focus groups etc). In the above two questions it would have been an internal inconsistency if all respondents gave resounding answers to the first question of what they learned about M&E but then claimed, on the second question, not to consider M&E more important as a result of the workshop than before. We concluded then that our responses were indeed consistent.
Our next M&E survey question was also open-ended, asking participants what, on M&E, would they do differently in their own courses as a result of this workshop. Sixteen out of 20 said they would carry out pre-course training assessment/analysis.
This response too was entirely consistent with our first question. It seemed that the thing participants claimed most to have learned was just the thing they would like to change on their courses. A more general question later in the survey asked participants about the key highlights they took away from the training. Again, there

Page: 44
was a huge emphasis on continuous M&E.
But we also wanted to compare responses between pre- and post-workshop surveys, so again we used triangulation. In the pre-workshop survey, we asked: “How do you assess the training needs of the participants on your training courses?” Only 23% of respondents said they always carried out pre-diagnostic tests or assignments (i.e. assessing current levels of knowledge and/or need to establish a baseline).
Given this, any course emphasising the importance of pre-course training should expect a favourable response in a post-workshop survey asking whether participants now consider M&E more important . This is exactly what we got with our response of 100% to the first question in our post-workshop survey. Triangulation helped again to assure us of the consistency of our results.
Flowchart 4: Designing your M&E

Page: 45
STAGE 5 ESTABLISHING A BASELINE Key Questions: Establishing a baseline
What is the current status of trainees’ knowledge and skills?
What are their beliefs and attitudes?
What do you know about trainees’ context now? What are the individual and organisational, goals now?
What is the current information landscape like?
What do trainees need to do now?
What would trainees like to do/know in the future?
To be able to evaluate the difference your training makes, you need to assess the current knowledge and understanding that trainees bring with them. That is, you need to establish a baseline.
Setting a baseline is important because it also allows you to make judgments about the content you need to cover in your learning intervention and establish the intervention‟s learning objectives and outcomes. It gives you the opportunity to test a participant‟s perception of their pre-existing capabilities, their attitudes, and their knowledge of concepts that will be introduced on the training course.
Establishing a baseline may involve you assessing individuals‟6:
Skills, knowledge and attitudes
Confidence levels
Behaviours
For any mid- and post-training comparisons to be meaningful, you also need to establish the gaps between where trainees are before your training intervention and where they and their organisations would like them to be after it.
Establishing a baseline may also involve an investigation of the policy and practice of the organisations in which the individuals operate, as well as behaviours within the wider community.
You will already have defined your objectives, so it should be clear what you need to evaluate to establish a baseline. However, here are some possible topics you may wish to interrogate:
Trainees‟ knowledge of the information landscape, i.e. the information resources available to them, such as paper and electronic sources, as well as people and places that could help them to become informed
Trainees‟ ability to define their information needs and use the information landscape, e.g. their knowledge of how information retrieval systems work and how best to use them; and how to use the data, information or knowledge that they gather. (This would include their critical ability, their information-processing ability and their ability to manage the information, such as storing, organising and sharing the information they gather.)
Trainees‟ ability to evaluate information resources critically
Trainees‟ knowledge of the political and ethical issues surrounding access and use of information
This is not a comprehensive list and the topics you choose will depend on the needs of your trainees, the training agenda and the surrounding context of the trainees. . There are several models and frameworks that can help you identify the competencies required in a specific context or discipline (see Part 1: Information literacy standards, models and frameworks).
6 Garcia-Quismondo, M. (July, 2010). Evaluation of Information Literacy Programmes in Higher Education:
Strategies and Tools. RUSC. 7 (2)

Page: 46
Effectively carried out, such assessments help you build a picture of what trainees currently know, understand and do. This serves not only to establish the baseline against which progress following the training can be charted but also as a basis for the design of their training.
Case study 9: Using questionnaires as a diagnostic, to determine distance travelled and to measure progress The IDS Information Capabilities programme uses a range of methods to gather data about information literacy skills and behaviours. In particular, we use questionnaires to test our assumptions about what is known and what is unknown by using a combination of self-assessment and diagnostic (test) questions. The information literacy questions are based on the competency levels defined in SCONULs 7 pillars.
Our questionnaires are invaluable. The responses allow us to capture evidence of trainees‟ pre-training capabilities and so set a baseline. We then use this data to measure the distance travelled (i.e. the progress) after the learning intervention has taken place. We also follow up three months after training to establish how the trainees are applying what they have learned in their professional or educational tasks.
In our questionnaires we ask questions that introduce the concepts we plan to use in our training interventions. For example, in our questionnaire before a training intervention about pedagogical approaches we undertook with trainees before a workshop for senior information literacy trainers in Zimbabwe, we wanted to know participants‟ prior experience or knowledge of pedagogical approaches. We invited respondents to assess how they would rate their skills (so assessing their self-perception of their skill), whether they could pick the right definition of it (assessing their knowledge) and whether they valued the approach we were taking (assessing their attitude).
We use a variety of question types. In the same pre-assessment training survey, we asked the prospective trainees to rate their skills in facilitation or training using a Lickert scale of one to five. We used this smaller scale rather than, say, a scale of one to 10, because we find it is easier for people to measure their competencies against. We defined the numerical values to remove any ambiguity about the ranking, explaining: “Rate your response from 1 to 5 (where 1 is low and 5 is a high score).”
Our other question types in this intervention tested trainees‟ prior knowledge by asking them to select the right answer from a list of answers, all of which were plausible. For example we provided an example of a training method and asked the respondent to identify whether it was a learner-centred or teacher-centred approach. For example: “At the beginning of each session, Precious asks students to rate their skills in a new topic.” This is an example of a learner-centred training approach.
This kind of multiple choice question type also allows us to capture data about trainees‟ attitudes and behaviours. For example, we used the following question to test how trainees would react in situations where a high-achiever is dominating the training session: “What strategy would you use with the high-achieving participants in a class/seminar/training workshop?” In this question we wanted to see if the trainer favoured more inclusive strategies (e.g. by thanking them for their contribution and inviting others to respond), or would stimulate the high-achiever by providing them with more work, or would reprimand the student and ask them to leave.
We developed our pre-, immediate post- and three-monthly follow-up questionnaires for this intervention at the same time to ensure the data were consistent and comparative. Before using the questionnaire, we verified each question by checking it would give us the outcome we were looking for. We asked ourselves: What kinds of response are we hoping to get from this question? Is the question vague? Is it valid? We reviewed and rewrote questions for which our responses were unclear before piloting the survey questionnaire with a focus group and an M&E expert.
Flowchart 5: Establishing a baseline

Page: 47
STAGE 6 M&E DURING (AND IMMEDIATELY AFTER) TRAINING
Key Questions: M&E During and Post Training
During training:
Is everyone learning: To what extent do your trainees understand the concepts? Do you need to elaborate further? Can they complete their activity independently or do they need help?
How do your trainees feel about their learning experience? Do you need to adjust your training style to achieve the learning objectives/outcomes?
Do trainees feel confident about their new skills and knowledge?
Do you need to revisit any concepts in the next session?
Post training:
What is the current level of knowledge and skills of trainees compared with the baseline?
What is the immediate indication of training impact on the lives of the trainees?
M&E undertaken during information literacy training interventions offers you an immediate means of finding out about trainees‟ experiences. It falls into one of two categories: assessment FOR learning (formative assessment) and assessment OF learning (summative assessment).
Definition
Types of assessment
Formative assessment occurs while training is being designed, developed and delivered. It includes methods such as pre-training surveys and in-class observations. As a form of assessment, it is regarded as more significant and informative than summative assessment (see below) as it provides both the trainer and the trainee with evidence of the breadth and depth of the learning taking place.
Summative assessment normally takes place at the end of a learning intervention, although it can be undertaken over the course of weeks or months. It focuses on targets, progress and impact, and allows judgments to be made about the extent to which the learning intervention‟s objectives have been achieved. As such, it aims to set out what the trainee can actually do, focusing on the final result or outcome. As a form of assessment, this type of data is usually of interest to funders, institutional and departmental managers.
Box 7: Types of Assessment
The methods you use may be quantitative or qualitative, and may range from questioning to quizzes to hands-on activities. You need to understand the differences between formative and summative methods and when to apply them if they are to improve the quality of your trainees‟ learning (See Box 7: Types of Assessment ).
You should also note that there may be some overlap between M&E undertaken towards the end of training interventions and that which takes place soon afterwards.

Page: 48
Assessing progress during training
Formative assessment – or assessment carried out during a learning intervention – brings with it many benefits. It can:
Inform you of the extent to which your trainees have grasped new concepts, skills or attitudes
Highlight what is not clear and what needs further elaboration, providing you with evidence about how your learning intervention should be immediately adjusted
Offer trainees an adaptable trainer who responds to feedback and confirms their achievements …
… so enabling them to learn to recognise what they themselves need to do to improve, thus promoting critical and independent ownership of their development
Below are some formative assessment methods you might want to consider, though the list is not exhaustive. A good trainer will use a range of methods and tools to assess the progress trainees are making:
Focused conversations or a private diary/reflective journal cover Objective, Reflective, Interpretive and Decisional information (also known as ORID). It is a useful structured, debriefing process for trainers and trainees based on the Kolb7 experiential learning cycle. Its purpose is to enable participants to objectively observe, reflect on an event or experience, interpret the experience and make decisions about how this will change their practice or behaviours in the future. It is a flexible process that can be used in groups and/or as a framework for building confidence.
Top Tip
The reflective nature of ORID and focused conversations may seem awkward or be uncomfortable for some trainees. Overcome this by modelling the process first.
Trainer’s tip: “ORID, or focused conversations, are useful for documenting or establishing which bits of your training need tweaking. Ideally, as a facilitator, you should be well practised in this method if you intend to use it. I’d recommend reading The Art of Focused Conversation: 100 ways to access group wisdom in the workplace by R. Brian Stanfield, and The Art of Focused Conversations for Schools: Over 100 ways to guide clear thinking and promote learning by Jo Nelson. If you don’t fully know what you’re doing it can be difficult to keep an ORID conversation on track.”
Mood Monitors (or mood boards) are excellent visual tools for capturing instant and anonymous feedback on training. They are an effective way of gathering evidence on points that need further elaboration or clarification as well as gauging how trainees feel. You should explain how to use your mood monitor at the beginning of a training intervention and encourage participants to post comments throughout it, as well as to conclude the day or session with an overall comment. You can use comments posted at the end of the day or session to highlight areas that need revisiting and make immediate, essential changes to the programme. Mood monitors can be used in conjunction with the ORID focused discussion by asking participants to write their response on sticky notes and post them on the smiley face (for high points), and sad face (for low points).
7 Book reference: Stanfield, R.B. (2000). The Art of Focused Conversation. Toronto: News Society Publishers
Page: 49
Top Tip
Before you begin your training, identify a space where participants can ‘park’ comments anonymously. A single flip-chart sheet is all that is required. It could comprise four sections:
A smiley face to indicate ‘I feel happy about …’
A sad face for ‘I am not happy about …’
A question-mark for points requiring clarification or further elaboration
An exclamation mark for requests for more information
Don’t forget to supply Post-it notes and pens close by.
Quizzes/Questionnaires are a quick method of assessing your trainees‟ ability to grasp new concepts and of identifying gaps in their knowledge. Examples include the use of coloured cards, thumb signals and instant-response devices such as i-clicker and understoodit8. However, you should consider the question and answer format carefully. To be most effective ask questions that probe comprehension of the learning concepts. Also, ensure that all multiple-choice responses offered are plausible.
Trainer’s tip: “A really good method for formative assessment during training is the use of i-clickers. You can use these to set up questions covering anything you want to evaluate, from skills to attitudes. Participants answer the questions using the clicker and the results are displayed instantly, which helps you, the trainer, decide what to do next.”
Trainer’s tip: “I’ve found that with careful consideration of the type and structure of questions asked, the i-clicker method serves as a useful recap of trained issues, allowing me to decide whether to move the training on or not. The downside of the method is it’s costly because you need electricity and batteries – and, of course, to buy the clickers themselves.”
Demonstrations/Presentations Asking your trainees to summarise or demonstrate key learning concepts in a two-minute presentation will help you identify any gaps in knowledge or skills that need to be addressed or revisited. This approach is flexible and has the additional benefit of encouraging greater participation in the intervention. Encouraging trainees to express their perspectives and articulate concepts in their own words will promote deeper learning and improve their ability to recall the facts for longer.
Top Tip
If you plan to ask trainees to give demonstrations or presentations, introduce this approach at the beginning of your training intervention. This sets the expectation that they will be sharing their views.
8 www.understoodit.com (see Glossary: Live polling)

Page: 50
Trainer’s tip: “When I train staff, one of the first things I do is ask them whether they’d be willing to share their views and understanding of the subject we’re going to cover, and if they are we make this part of the ground rules for the training. This means that later I can ask individuals to summarise, in two minutes, the issues that have been discussed. That’s a good way for me to establish levels of understanding – which I can then use to guide my pace, as well as to identify any gaps in learning that I need to go on and address.”
Assessment rubrics can guide your observations and serve as a method of standardising feedback to your trainees. A simple rubric would measure your trainees‟ ability to demonstrate the competencies set out in the learning objectives, rating it from one to five, where one is low and five is high. You could also use this information formally, in a summative assessment, as a record of what went well and what needs improvement.
Top Tip
When monitoring the progress of an activity, link your observations to the learning objectives. If you are walking around observing, capture your observations on a record sheet using a simple rating scale from one to five (e.g. one equals ‘needs assistance’ to five equals ‘working independently’).
Probing questions For this, you should familiarise yourself with different questioning techniques and understand how to elicit information effectively. The type of questions that promote an informative exchange are open (probing) questions. These ask the respondent to provide reflective and detailed answers and offer another strategy for finding out more information and checking trainees‟ understanding of the learning concepts. For probing questions to be effective, you also need active listening skills.
Trainer’s tip “Simple questions and answers are a useful, low-skill method to assess learners’ levels of understanding and ensure their performance will be improved after the session.”
Top Tip
Ask What? Why? How? and Describe questions. This minimises the possibility of your receiving a simple yes/no answer. Remember to give the trainee plenty of time to respond before probing their responses, decisions or opinions further. If necessary, give them thinking time before asking them to respond to your question.
Practicals/Group Activities A short practical or activity is an excellent way in which you can assess knowledge and skill levels. Monitoring and recording the progress observed will help you identify and prioritise those needing assistance as well as track group or individual performance. In larger groups, you can ask participants to make peer assessments using an assessment rubric. Feedback given during the training is formative, though if the assessment is recorded the information can feed into summative assessments at the end of the intervention.

Page: 51
Trainer’s tip: “I like to give participants a topic to discuss, brainstorm or present. This kind of group work gives me collective input from the group as a whole and helps me to assess whether or not participants are grasping the concepts we’ve been discussing. I can then decide whether to re-emphasise certain points or go on to the next item.
Trainer’s tip: “You need though, with group work, to first consider the personalities of all the learners in a group. Some people, introverts, don’t like speaking and this can sometimes prove a barrier if you want to use this method for assessing impact.”
Trainer’s tip: “When I use quick-practice activities with my students to recap what’s been learned, I always go around the room to see how the activity is being carried out. There’s often at least one student who finds him or herself lost and doesn’t understand what to do, so being confident enough to monitor the activity is very important.
Trainer’s tip: “You also need to ensure you allow sufficient time for the activity and you have the resources you need – for example, you may need a computer lab if you’re asking students to search an online database. Despite these challenges, it’s a useful technique to assess understanding levels, particularly for skills-based training.”
Assessing progress at the end of training (Post-training Assessments)
Summative assessment – or assessment at the end of a training intervention – can:
Assist in validating the efforts invested in a training intervention
Meet any demands for accountability
Demonstrate value for money (in terms of efficiency and effectiveness in the case of funders)
Help trainees practise work or job-related activities in a safe and supportive learning environment
Summative assessments usually include practical, written or multiple-choice tests and assignments. You need to be familiar with a range of summative assessment methods and tools and think creatively if you are to transform this assessments process from the predictable to the inspirational.
Examples include:
Case-study assignments (rather than written assignments)
Reflective journals
Role-playing or hypothetical exercises
Portfolios of evidence
Diagnostic tests e.g. Project SAILS or your own instrument
Summative assessment needs to clearly relate to the objectives of your training intervention by being able to demonstrate whether these objectives (whether individual, organisational or community-led) have been achieved. Assessment needs to be individual, fair, challenging and supportive. Although this is a tough challenge for busy trainers, you can use assessment rubrics and feedback sheets as a way of providing comparative and consistent feedback.
Normally, after your training intervention is finished you will re-test or survey your trainees to assess the changes in competency (knowledge, skills, attitudes and values) in addition to measuring the success of the training intervention. Use the same questions from your pre-training diagnostic or survey to assist with the comparability of results and draw conclusions about the impact of the training intervention.
Post-training assessments usually take place immediately after or within one week of the training intervention ending. If you ask your trainees to complete a post-training assessment after a week you risk the chance that your trainees may forget to include all the benefits accrued during the training.

Page: 52
Reflective journals Reflective journals can be structured as in ORID (see above) but may also be flexible in format. They may contain a collection of thoughts, observations and decisions built up over a period of time, and include images, mind-maps and diagrams as a way of recording facts, opinions and emerging perspectives on a specific topic. You can also use reflective journals to stimulate discussions and capture changes in attitude over time.
Trainer’s logs As a trainer, you may also find it useful to build a reflective journal (see above) to reflect on your training experience and capture notes on how the training intervention can be improved or refined.
Trainer’s tip: “By keeping your own trainer’s log you can easily analyse information later for review purposes and go on to fill in the skills and confidence gaps in your trainees that you pinpoint. To keep a log you do, though, have to have very good awareness levels of doing the training itself, as well as writing. You also need to know before you start how to keep a log and how the information will be used so that you’re recording the right information. It’s worth remembering that such logs can also help to pinpoint your own skills gaps.”
Case study 10: A flexible approach to formative assessment Participants from 11 organisations working across sub-Saharan Africa who work specifically with policy makers and influencers were invited to attend an International Network for the Availability of Scientific Publications (INASP) and IDS training workshop to build their pedagogical skills. In a session on the principles of constructivism and how this teaching and learning theory is applied to information literacy training, we used a range of formative assessment techniques to check whether participants understood the key concepts. These included a daily mood monitor, thumbs-up and thumbs-down signals and questioning techniques.
However, although some of these techniques were planned and written into the lesson plan, we also introduced formative assessment methods in response to observations of the trainees‟ behaviours. For example, if the trainees looked confused or unsure about something we said, we asked them probing questions to understand/diagnose their mis-understanding.
In this way, together we explored the gap in their understanding by questioning the concepts and drawing links to their own working experience(s).
Flowchart 6: M&E during and immediately after training

Page: 53
STAGE 7 DATA ANALYSIS
Key Questions: Analysing your data
Have you piloted data entry and analysis before embarking on data gathering?
Have you ensured your sample size is appropriate for your intended analysis?
Who will be responsible for data entry?
Will the same person or people be responsible for the data analysis?
Have you checked and re-checked that your data is entered correctly?
Have you measures in place to ensure you are transparent in your analysis of qualitative data?
Data analysis, broadly speaking, involves the detailed breakdown and examination of numbers and text. (For convenience we can include other forms of non-numeric data, e.g. photographs, under the „text‟ banner.) You should by now have plenty of M&E data gathered before, during and immediately after your information literacy intervention and be ready for this analysis.
Your data is likely to be in a wealth of different forms. For example, it may be in written statements, in video testimonials and diaries, or in responses to survey questionnaires and tests. Organising and managing this data can be very time consuming and labour intensive. This is one reason why you need to have properly piloted your data gathering, data entry and data analysis early on (See Stage 4: Designing M&E). Mistakes can be costly.
Data entry can be a simple matter of typing responses from a questionnaire into a spreadsheet program such as Microsoft Excel. Alternatively, it may be a more time-consuming process of transcribing recorded interviews or written diaries. Do devote some time to checking your data to ensure they have been accurately entered. Again, this could avoid costly mistakes which only become evident further down the line.
You can check your quantitative data by using basic tools in your spreadsheet program to ensure there are no „illegal‟ entries (i.e. data transferred inaccurately from the original data source). This is called data cleaning. You can also take 10% of the data and cross-check it, re-entering it where you find substantial errors. (In commercial research, this is called „double entering‟ and is done routinely as a way of minimising errors.)
Similarly, for qualitative data listen once more to 10% of your recorded interviews and check the accuracy of your transcription. Judging the consistency, authority and credibility of results are other ways of evaluating qualitative data.
Once you have checked your data, you are ready for your data analysis. This should be conducted in the light of your original questions. The more carefully you have articulated what you are trying to evaluate, the easier your analysis will be. As so often in the M&E of your information literacy training intervention, success will come down to how well you defined your objectives (see Stage 2: Programme strategy and objectives).
Using statistics for quantitative data analysis
Quantitative data can be subjected to descriptive statistics and/or inferential statistics. Descriptive statistics provide simple summaries of large amounts of information. They tend to quantify the extent of a phenomenon, for example how many people used a particular information source. They may include the use of statistical tools, such as frequency tables, cross tabulations („crosstabs‟) and measures of central tendency, e.g. means. Descriptive statistics can be informative and give you a sense of the direction as to where your findings are going. Sometimes, though, the sample size isn‟t big enough. To make the strongest claims, you may wish to consider using inferential statistics.

Page: 54
Inferential statistics enable you to make judgments about the patterns you detect. Are they just a consequence of random variation or are they significant? The term significant in this context means more than „important‟. It means the likelihood (probability, in statistical terms) that the observed relationship (e.g. between variables) or difference (e.g. between means) in a sample did not occur by pure chance. The lower this probability (which we call the p value), the more likely it is that we have found a real difference. The reason we need to apply significance testing is that it can uncover easy-to-make but wrong conclusions. For example, we may observe a pattern of improvement over time in trainees but significance testing may reveal this pattern is actually due to just one person being particularly enthusiastic.
To be able to conduct inferential statistics, the sample size (the number of people who responded to e.g. your survey) needs to be large enough to be able to detect true differences. The minimum sample size can be calculated in advance by a statistician (or you can do a power calculation yourself). Generally, running inferential statistics on a sample smaller than 30 is unlikely to yield any definite conclusions.
The simplest form of significance testing is the t-test (see Box 9: The T-Test). This is suitable for checking whether two groups (e.g. a trained and an untrained group) are significantly different. It can also be used for doing before and after comparisons, for example, to see how much a group improved from their starting point by comparing their scores at baseline and post-training.
More complex questions require more complex statistics. For example, if you want to examine the relationship between the amount of time spent in class and test scores, you could test whether a correlation exists between amount of time and test scores. If you are conducting an exploratory analysis to examine whether any particular features of your intervention predict success, you could conduct a factor analysis.
It is unlikely you will need specialised statistical software (e.g. SPSS) for any of this. Microsoft Excel offers a number of powerful data analysis tools. However, you may need to download and install the free Data Analysis Toolpak for Excel if you plan to run inferential statistical analyses. Bear in mind though, you can still do very valuable work on your M&E with descriptive statistics. You just need to be cautious about your conclusions.
Finding patterns for qualitative data analysis
Qualitative data analysis is a rigorous, often-time consuming activity, whereby the researcher determines whether there are patterns in the data. To facilitate this, verbal data is generally transcribed verbatim (or, at the very least, summarised with detailed notes) and subjected to a systematic analysis. While conducting the analysis, qualitative researchers consciously „bracket‟ their views and do not let them impose on the data. This is difficult. However, researchers are usually advised to document the process and make notes about the decisions they take.
Systematic analysis generally involves coding the data. This can be done using pre-defined frameworks, such as UNESCOs information literacy indicators (a deductive approach) or gradually identifying patters and evolving codes as appropriate from the data (an inductive approach). This is done repeatedly until all elements are coded. In some cases coding is checked using a collaborator.
Furthermore qualitative researchers sometimes take their findings back to the participants to see whether the analysis is „authentic‟ and credible. Qualitative data tends to uncover reasons why certain things occur and is particularly good for investigating people‟s perceptions of a particular situation.
Qualitative data analysis can be done with nothing more than a pen and paper. However, it is well worth using qualitative data analysis software. This does not do the analysis for you (no more than Microsoft Word writes a report for you), but it does provide a convenient way of „tagging‟, sorting and retrieving text. Some researchers compromise by importing their text into a spreadsheet program such as Excel (usually one paragraph per cell) and then „coding‟ this data by using the next column to categorise comments by theme. It is even possible to take a similar approach using the Table function in Word.
Though there are a wide variety of qualitative data analysis approaches, e.g. conversation analysis, content analysis, discourse analysis, narrative analysis etc, the most straightforward, and most common, is thematic analysis. Thematic analysis emphasises pinpointing, examining and recording patterns within data. See Box 8: Carrying Out Thematic Analysis

Page: 55
Guidance
Carrying out thematic analysis
The following is a description of the steps taken to undertake a deductive approach. However, it should be noted that a combination of techniques can be applied. Themes may be applied to the text. But within themes new themes may be identified that were not predicted.
Establish the themes you are interested in. This will be a combination of your original evaluation
questions, plus unexpected themes that emerge from reading through your transcripts.
Create a code book. This is a list of the themes, with their definitions. It will help you remember your
own logic when you come to writing your report, and also help if the analysis is being conducted by
more than one person.
Apply the codes to the text. You can do this either by highlighting and annotating manually, or by
selecting text and attaching a code if using qualitative data analysis software.
Gather all text relating to a particular code. You can sort a Word or spreadsheet table, but if you are
highlighting on paper you will need to do some rewriting/typing.
Summarise the text. Pay particular attention to contradictions and the variety of positions.
Revise your summary. Do this until you feel you have captured the meaning of the responses in a way
that enables you to communicate it swiftly in your report.
Box 8: Carrying Out Thematic Analysis
Whether you use qualitative or quantitative data or a combination to present your M&E findings is likely to be influenced by the stakeholders. Despite organisations and funders showing an increased interest and acceptance of qualitative data and emphasis on process, changes in attitude and relationships etc. they may still have a preference for quantitative data. As information literacy is a competency-based generic skill it is important that your evaluation assesses the skills and knowledge (quantitative) acquired through the programme as well as improvements to attitudes and values (qualitative). These changes should be captured at the individual and organisational levels and incorporated into an evaluation of results9.
9 Evaluation of Information literacy programmes in higher education: strategies and tools, M Garcia-Quismondo, July 2010

Page: 56
Case study 11: Using distance travelled At IDS we use the distance travelled technique to assess the progress made in achieving our desired training outcomes. We used it, for example, in a pedagogy of senior information literacy trainers workshop held with participants who work in universities in Zimbabwe.
Table 5 shows some of the key attributes covered in this training intervention. The three columns represent two different surveys: the first, the pre-training course survey (Column A); the second and third are two questions posed in the immediate post-course survey (Columns B and C) in which participants scored their skills prior to training retrospectively (Column B); and in the third, the participants scored their new skills after receiving the training (Column C). Note, all three surveys measured the same attributes and, for each survey, these were scored using the same five-point scale in which one was the lowest level of attainment and five the highest.
Column A Column B Column C
Pre-training needs survey
(1)
Immediate post-training survey
(2)
Immediate post-training survey
(2)
Attribute
Retrospective prior knowledge
assessment New
competencies
Using mind-maps to develop search strategies 3.15 2.35 4
Using internet search engines to look for information (e.g. Google, Google Scholar) 4.76 4.37 4.7
Writing Boolean search phrases using concept tables 3.45 3.15 4.25
Evaluating search results 4.15 4 4.7
Narrowing/filtering search results 4.2 3.85 4.6
Using electronic library resources to find information 4.81 4.35 4.8
Explaining to someone else copyright and licensing laws of online journals 3.9 3.5 4.25
Promoting use of e-resources in my organisation 4.62 3.8 4.8
Promoting use of e-resources in other organisations 3.3 3 4.35
Lecturing 4.14 3.05 4.1
Facilitating 4.05 2.55 4.2
Training 4.15 2.9 4.37
Averages 4.05666667 3.40583333 4.426666667
Table 5: Skills self-assessment scores from three surveys and their averages
When you analyse the results you can notice the difference between the lowest average scores in column one (pre-training) and column two (re-assessment of prior knowledge). The participants lowest average score was 4.05 (81%) prior to training but dropped to 3.4 out of five (68%) after the training. Given that both of these scores were asking for the participants‟ skills scores before training had taken place, what explains this disparity? The data demonstrates two explanations that we first came across in Stage 1: Assessing your trainees’ needs: