Embed Size (px)
Citation preview
Case Study:
Opportunities to
Improve Energy
Efficiency in Three
Federal Data Centers
Prepared for the U.S. Department of Energy’s
Federal Energy Management Program
Prepared By Lawrence Berkeley National
Laboratory
Rod Mahdavi, P.E. LEED AP
May 2014
2
Contacts
Rod Mahdavi
Lawrence Berkeley National Laboratory
1 Cyclotron Road
Berkeley, CA 94720
Phone: (510) 495-2259
E-mail: [email protected]
For more information on the Federal Energy Management Program, please contact:
William Lintner
Federal Energy Management Program
U.S. Department of Energy EE-2L
1000 Independence Ave., S.W.
Washington, D.C. 20585-0121
Phone: (202) 586-3120
E-mail: [email protected]
3
Abbreviations and Acronyms
BMS Building Management System
BTU British Thermal Unit
CRAH Control Room Air Handler
DC Data Center
EEM Energy Efficiency Measure
Genset Standby Generator
GHG Greenhouse gas
IT Information Technology
kW Kilowatt
LBNL Lawrence Berkeley National Laboratory
MWh Megawatt-hours
PDU Protocol Data Unit
PUE Power Usage Effectiveness
UPS Uninterruptable Power Supply
4
Contents
Executive Summary .................................................................................................................................... 5
Introduction ................................................................................................................................................. 6
Assessment Process .................................................................................................................................. 7
Observations ............................................................................................................................................... 7
Analysis........................................................................................................................................................ 9
Challenges ................................................................................................................................................... 9
Energy Efficiency Measures for the Federal Data Centers ..................................................................... 9
Forecasted Results ..................................................................................................................................... 9
Lessons Learned ....................................................................................................................................... 11
Next Steps and Recommendations ......................................................................................................... 11
List of Figures
Figure 1. Power Usage in the Data Centers .............................................................................................. 6
Figure 2. DC1 Hot Aisle Containment ....................................................................................................... 7
Figure 3. DC3 Openings in Racks Figure 4. DC3 PDU Open Skirts .............................................. 8
Figure 5. Air Recirculation Under the Racks Figure 6. DC2 Lighting, and Perforated Tiles ..... 8
Figure 7. Data Center EEMs ..................................................................................................................... 10
Figure 8. Power Usage Savings Based on Implementation of EEMs .................................................. 11
Figure 9. Electricity Flows in Data Centers ............................................................................................ 12
List of Tables
Table 1. Data Centers Potential Energy, GHG, and Cost Savings ......................................................... 5
Table 2. Summary of Power, Losses, Current and Potential PUE ......................................................... 6
5
Executive Summary
Lawrence Berkeley National Laboratory (LBNL) evaluated three data centers for potential
energy efficiency improvements during the summer of 2012. Geographic location, facility
layouts, data center spatial configuration, Information Technology (IT) power supply and
demands, mechanical, and electrical and cooling system equipment varied among the three sites.
The data centers also contained a variety of new and old infrastructure support equipment;
dynamic, growing IT platforms; and, thousands of computing, storage, and data transport servers
and devices.
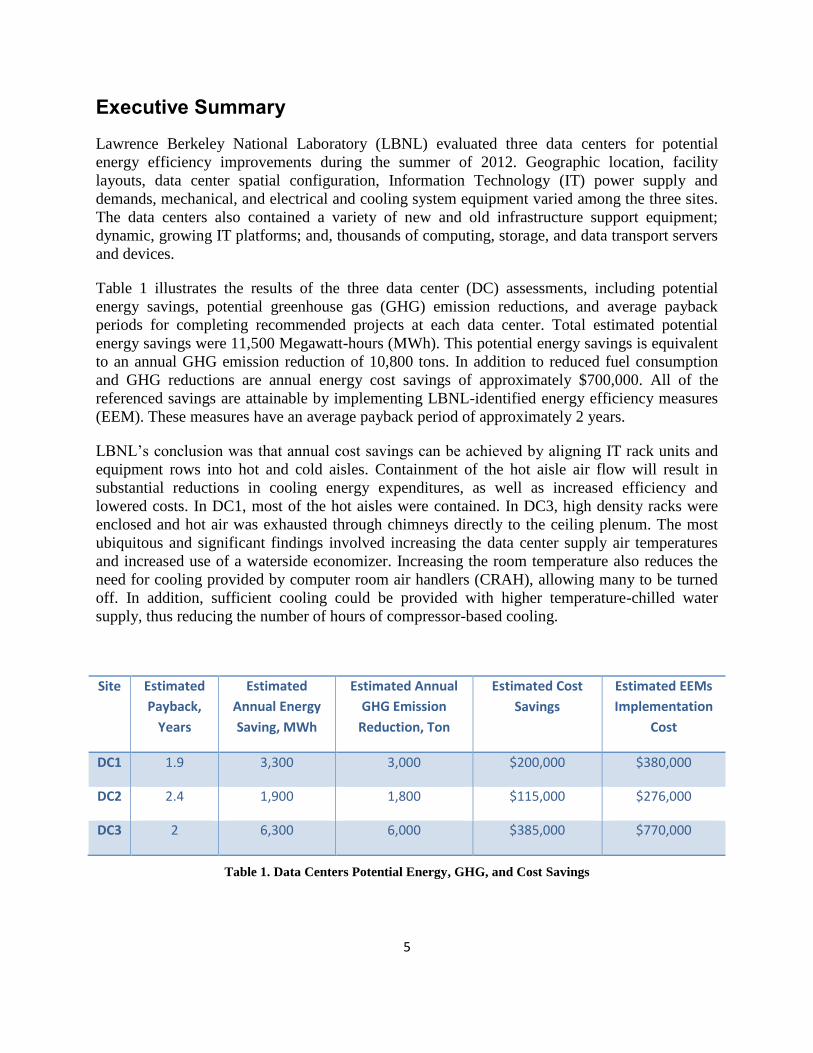
Table 1 illustrates the results of the three data center (DC) assessments, including potential
energy savings, potential greenhouse gas (GHG) emission reductions, and average payback
periods for completing recommended projects at each data center. Total estimated potential
energy savings were 11,500 Megawatt-hours (MWh). This potential energy savings is equivalent
to an annual GHG emission reduction of 10,800 tons. In addition to reduced fuel consumption
and GHG reductions are annual energy cost savings of approximately $700,000. All of the
referenced savings are attainable by implementing LBNL-identified energy efficiency measures
(EEM). These measures have an average payback period of approximately 2 years.
LBNL’s conclusion was that annual cost savings can be achieved by aligning IT rack units and
equipment rows into hot and cold aisles. Containment of the hot aisle air flow will result in
substantial reductions in cooling energy expenditures, as well as increased efficiency and
lowered costs. In DC1, most of the hot aisles were contained. In DC3, high density racks were
enclosed and hot air was exhausted through chimneys directly to the ceiling plenum. The most
ubiquitous and significant findings involved increasing the data center supply air temperatures
and increased use of a waterside economizer. Increasing the room temperature also reduces the
need for cooling provided by computer room air handlers (CRAH), allowing many to be turned
off. In addition, sufficient cooling could be provided with higher temperature-chilled water
supply, thus reducing the number of hours of compressor-based cooling.
Site Estimated
Payback,
Years
Estimated
Annual Energy
Saving, MWh
Estimated Annual
GHG Emission
Reduction, Ton
Estimated Cost
Savings
Estimated EEMs
Implementation
Cost
DC1 1.9 3,300 3,000 $200,000 $380,000
DC2 2.4 1,900 1,800 $115,000 $276,000
DC3 2 6,300 6,000 $385,000 $770,000
Table 1. Data Centers Potential Energy, GHG, and Cost Savings
6
Introduction
The Office of Energy Efficiency and Renewable Energy tasked Lawrence Berkeley National
Laboratory (LBNL) to provide measurements of energy usage, and total building energy
consumption. LBNL also evaluated data center and IT systems and devices, and building systems
that automate and regulate energy management and affect energy consumption. Included in the
task was a request for recommendations to monitor and improve energy consumption, balance
and optimize equipment, and to develop a plan to avoid energy and cost savings erosion over
time. This case study includes the results of 3 data center assessments, lessons learned, and
recommended EEMs. Table 2 identifies IT equipment power density, end-use power breakdown,
and power usage effectiveness (PUE) for the 3 data centers during the evaluation period. The
potential PUE as the result of implementation of the recommended energy efficiency measures is
also illustrated.
Sites Current IT
Load W/
sqft
Current
IT Load
kW
Elec
Dist.
Loss
kW
Cooling
Load kW
Fan
Load
kW
Other
Users
kW
Total
DC kW
Current
PUE
Potential
PUE
DC1 33 1,100 160 411 174 142 1,987 1.80 1.45
DC2 50 420 87 192 90 80 870 2.07 1.55
DC3 62 1,824 356 525 330 210 3,245 1.78 1.38
Table 2. Summary of Power, Losses, Current and Potential PUE
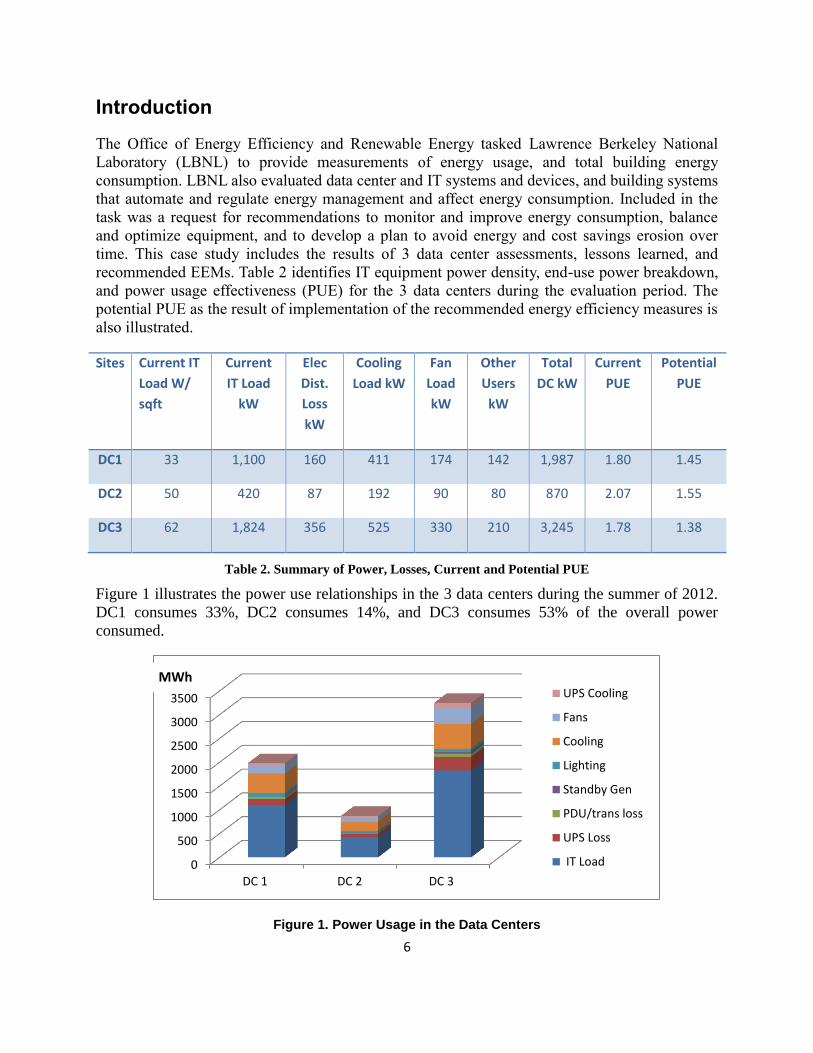
Figure 1 illustrates the power use relationships in the 3 data centers during the summer of 2012.
DC1 consumes 33%, DC2 consumes 14%, and DC3 consumes 53% of the overall power
consumed.
Figure 1. Power Usage in the Data Centers
0
500
1000
1500
2000
2500
3000
3500
DC 1 DC 2 DC 3
UPS Cooling
Fans
Cooling
Lighting
Standby Gen
PDU/trans loss
UPS Loss
IT Load
MWh
7
Assessment Process
LBNL used a portable wireless monitoring kit to baseline the environmental conditions
(temperature, humidity, airflow ranges) in the data centers. For those data centers where the
monitoring kit was used, the following environmental sensors and points of measurement are
described:
Temperature sensors were installed at all CRAHs air supply and return. No intrusive sampling of
devices occurred inside racks. Exterior placements were made on the front of IT racks (top,
middle, and bottom), on the back of the rack (top and middle), and in the sub-floor space.
Humidity was also measured by the same thermal nodes. Pressure sensors were installed to
measure sub-floor pressure. Power measurements were also obtained from equipment display
such as switch gear, uninterruptable power supply units (UPS), and power distribution units.
Power measurements were also taken from selected electrical panel locations using power
logging devices. In some cases that a direct power measurement was not possible, power usage
was conservatively estimated to calculate PUE. Loss in the electrical power chain was either
measured or estimated while considering efficiency of the UPS units based on their load factor.
Lighting power usage was calculated by counting the fixtures. Determining the cooling power
measurement, including chiller power usage, was a challenge. Assessors used BTU and power
meters. However, if direct power measurements or readings from the control panels were not
available, then calculations based on theoretical plant efficiency were applied. While use of
specifications for CRAHs with constant speed fans provided sufficient information, it was more
advantageous to have building management system (BMS) log reports as was the case for DC3.
Observations
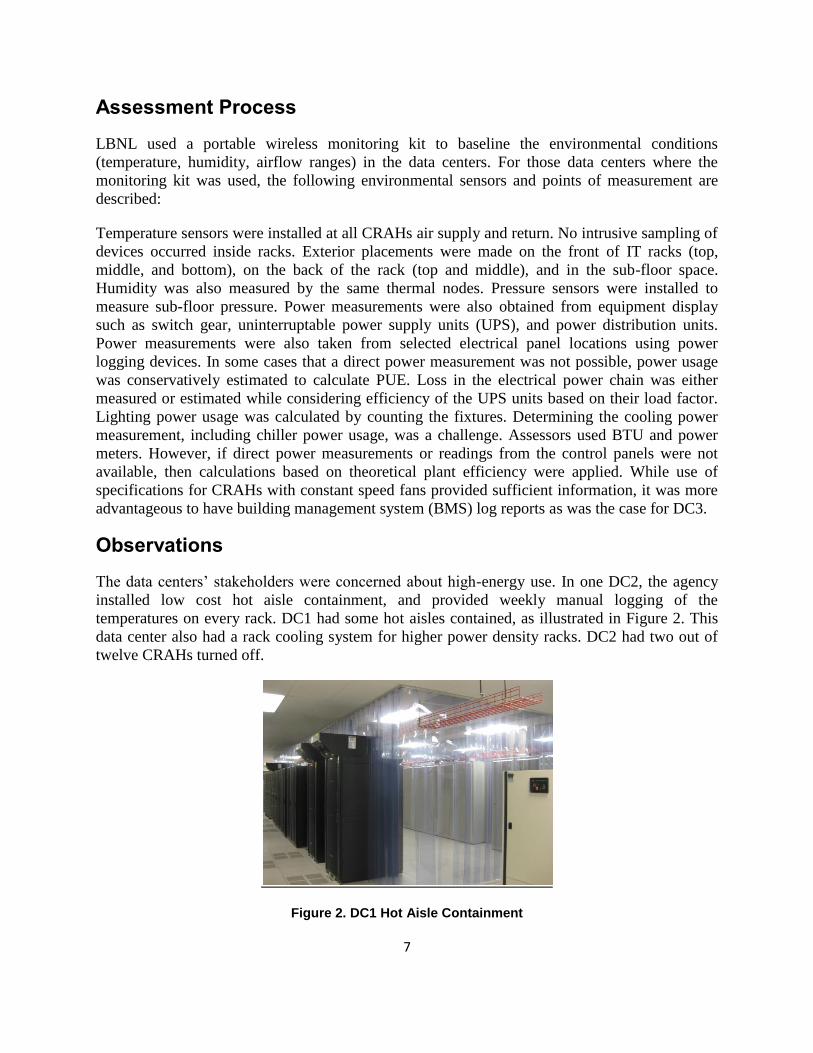
The data centers’ stakeholders were concerned about high-energy use. In one DC2, the agency
installed low cost hot aisle containment, and provided weekly manual logging of the
temperatures on every rack. DC1 had some hot aisles contained, as illustrated in Figure 2. This
data center also had a rack cooling system for higher power density racks. DC2 had two out of
twelve CRAHs turned off.
Figure 2. DC1 Hot Aisle Containment
8
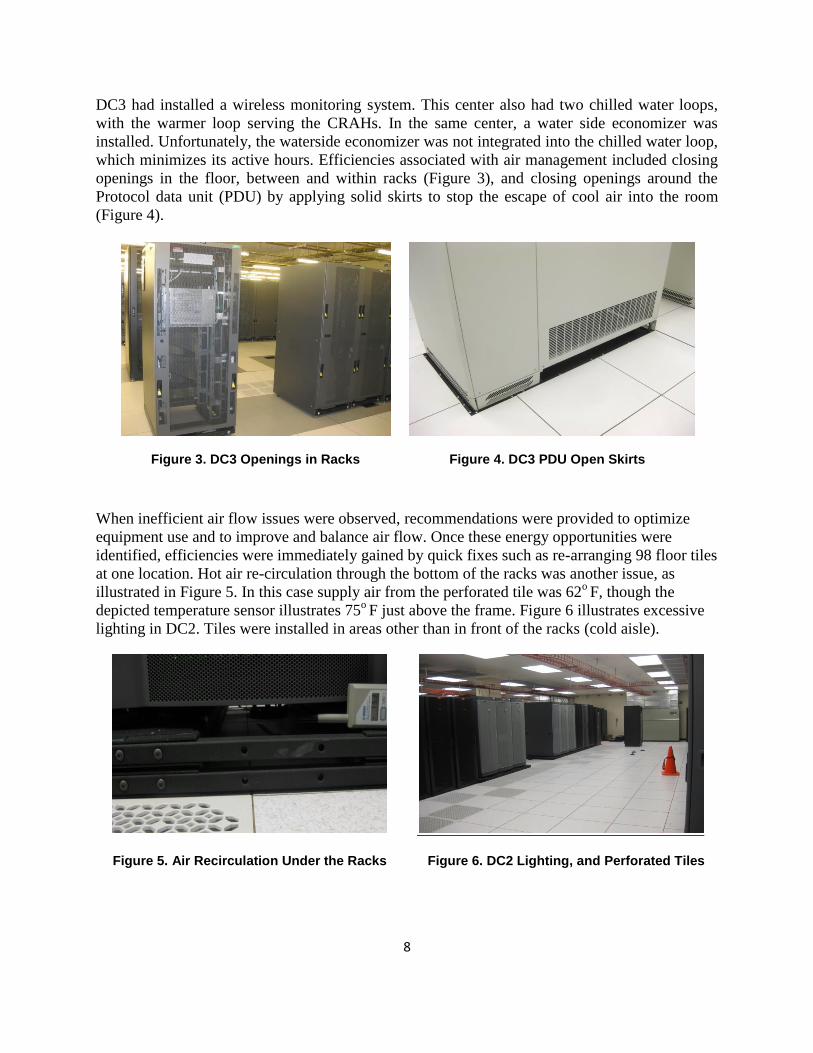
DC3 had installed a wireless monitoring system. This center also had two chilled water loops,
with the warmer loop serving the CRAHs. In the same center, a water side economizer was
installed. Unfortunately, the waterside economizer was not integrated into the chilled water loop,
which minimizes its active hours. Efficiencies associated with air management included closing
openings in the floor, between and within racks (Figure 3), and closing openings around the
Protocol data unit (PDU) by applying solid skirts to stop the escape of cool air into the room
(Figure 4).
Figure 3. DC3 Openings in Racks Figure 4. DC3 PDU Open Skirts
When inefficient air flow issues were observed, recommendations were provided to optimize
equipment use and to improve and balance air flow. Once these energy opportunities were
identified, efficiencies were immediately gained by quick fixes such as re-arranging 98 floor tiles
at one location. Hot air re-circulation through the bottom of the racks was another issue, as
illustrated in Figure 5. In this case supply air from the perforated tile was 62o F, though the
depicted temperature sensor illustrates 75o F just above the frame. Figure 6 illustrates excessive
lighting in DC2. Tiles were installed in areas other than in front of the racks (cold aisle).
Figure 5. Air Recirculation Under the Racks Figure 6. DC2 Lighting, and Perforated Tiles
9
Analysis
The collected data included empirical measurements of recirculation and by-pass air mixing, and
cooling system efficiency. The assessment established the data center’s baseline energy
utilization, identified relevant EEMs and potential energy savings benefits. Operational
procedures were also examined, actions were taken during the assessment, and their impacts
observed in real time. For instance, in DC3, 35% of the CRAHs were turned off with no impact
on the operations. No considerable change in IT equipment air intake temperatures were
observed by turning off the CRAH units. Actual annual saving (associated with turning off the
CRAHs) was 1,300 MWh or $75,000 annually.
Challenges
Site and data center observations occurred during a two-week period. The LBNL assessment
team was initially challenged by security requirements and restricted site access. These
challenges existed because LBNL assessors did not have appropriate security clearances.
However, with the assistance of Site Security personnel, access was not a major impediment to
evaluating infrastructure or the data center. Widespread cooperation and the use of security
escorts resulted in dynamic understandings and daily progress. A second challenge involved the
potential risk of disrupting mission critical activities. Eventually, working with the host and as a
team these obstacles subsided.
Energy Efficiency Measures for the Federal Data Centers
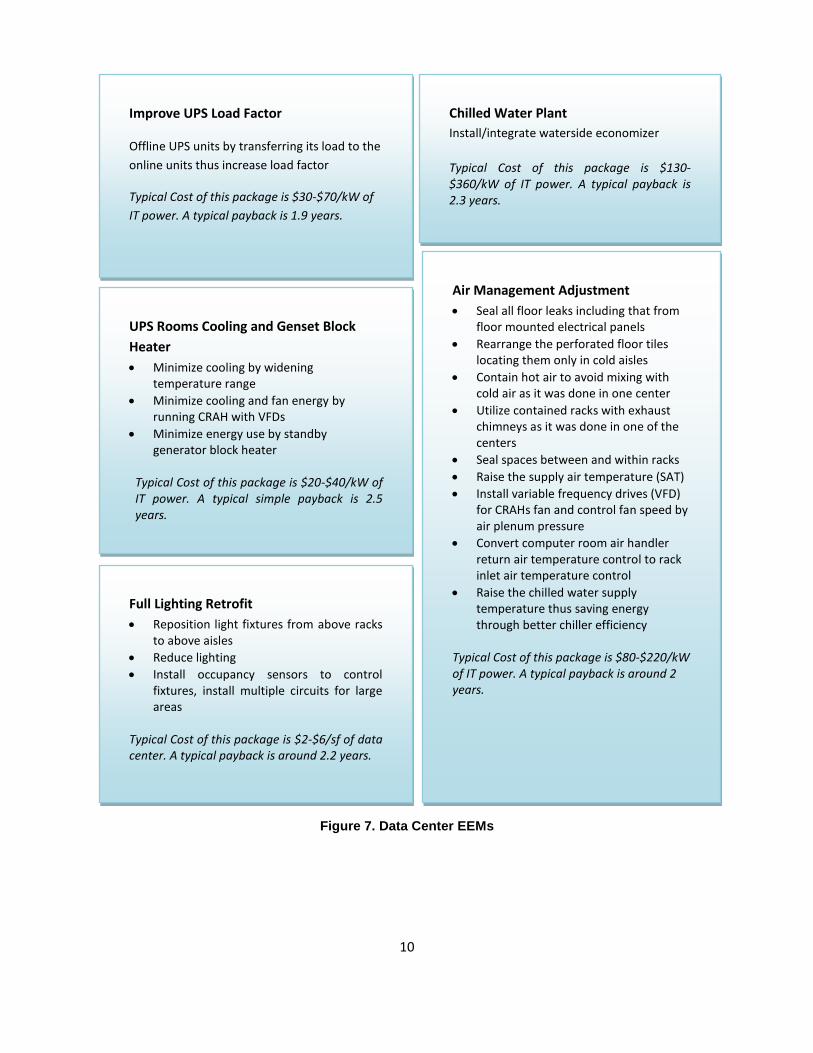
Several EEMs were both common and applicable at each data center. These efficiency measures
along with their rough cost estimates are described generally in Figure 7 (next page).
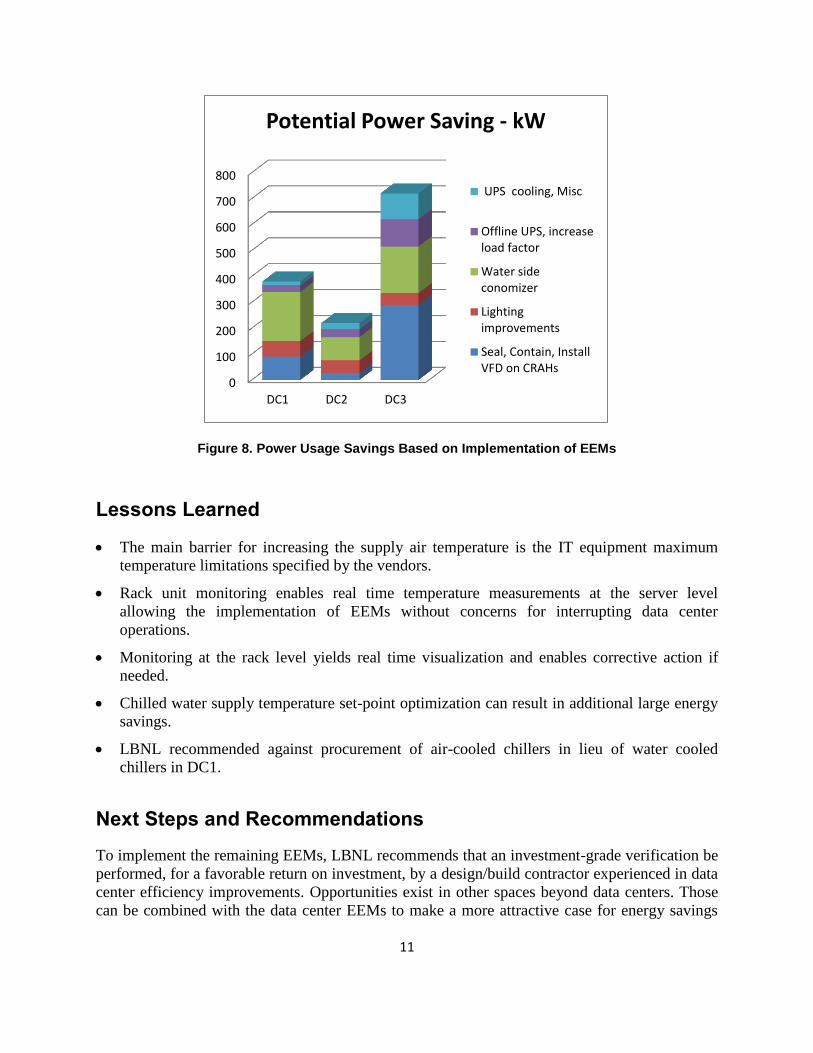
Estimated Savings for 3 data Centers
Figure 8 illustrates estimated power savings achievable in the 3 data centers if the recommended
EEMs are fully implemented. The waterside economizer will have the most beneficial impact in
DC1 and DC2 while fan power savings can be optimized in DC3. Although the total savings are
proportional to the data center IT load or data center square feet, different levels of impact are
associated with each specific EEM.
10
Figure 7. Data Center EEMs
Improve UPS Load Factor
Offline UPS units by transferring its load to the
online units thus increase load factor
Typical Cost of this package is $30-$70/kW of
IT power. A typical payback is 1.9 years.
Chilled Water Plant
Install/integrate waterside economizer
Typical Cost of this package is $130-$360/kW of IT power. A typical payback is 2.3 years.
UPS Rooms Cooling and Genset Block
Heater
Minimize cooling by widening temperature range
Minimize cooling and fan energy by running CRAH with VFDs
Minimize energy use by standby generator block heater
Typical Cost of this package is $20-$40/kW of IT power. A typical simple payback is 2.5 years.
Air Management Adjustment
Seal all floor leaks including that from floor mounted electrical panels
Rearrange the perforated floor tiles locating them only in cold aisles
Contain hot air to avoid mixing with cold air as it was done in one center
Utilize contained racks with exhaust chimneys as it was done in one of the centers
Seal spaces between and within racks
Raise the supply air temperature (SAT)
Install variable frequency drives (VFD) for CRAHs fan and control fan speed by air plenum pressure
Convert computer room air handler return air temperature control to rack inlet air temperature control
Raise the chilled water supply temperature thus saving energy through better chiller efficiency
Typical Cost of this package is $80-$220/kW of IT power. A typical payback is around 2 years.
Full Lighting Retrofit
Reposition light fixtures from above racks to above aisles
Reduce lighting
Install occupancy sensors to control fixtures, install multiple circuits for large areas
Typical Cost of this package is $2-$6/sf of data center. A typical payback is around 2.2 years.
11
Figure 8. Power Usage Savings Based on Implementation of EEMs
Lessons Learned
The main barrier for increasing the supply air temperature is the IT equipment maximum
temperature limitations specified by the vendors.
Rack unit monitoring enables real time temperature measurements at the server level
allowing the implementation of EEMs without concerns for interrupting data center
operations.
Monitoring at the rack level yields real time visualization and enables corrective action if
needed.
Chilled water supply temperature set-point optimization can result in additional large energy
savings.
LBNL recommended against procurement of air-cooled chillers in lieu of water cooled
chillers in DC1.
Next Steps and Recommendations
To implement the remaining EEMs, LBNL recommends that an investment-grade verification be
performed, for a favorable return on investment, by a design/build contractor experienced in data
center efficiency improvements. Opportunities exist in other spaces beyond data centers. Those
can be combined with the data center EEMs to make a more attractive case for energy savings
0
100
200
300
400
500
600
700
800
DC1 DC2 DC3
Potential Power Saving - kW
UPS cooling, Misc
Offline UPS, increaseload factor
Water sideconomizer
Lightingimprovements
Seal, Contain, InstallVFD on CRAHs
12
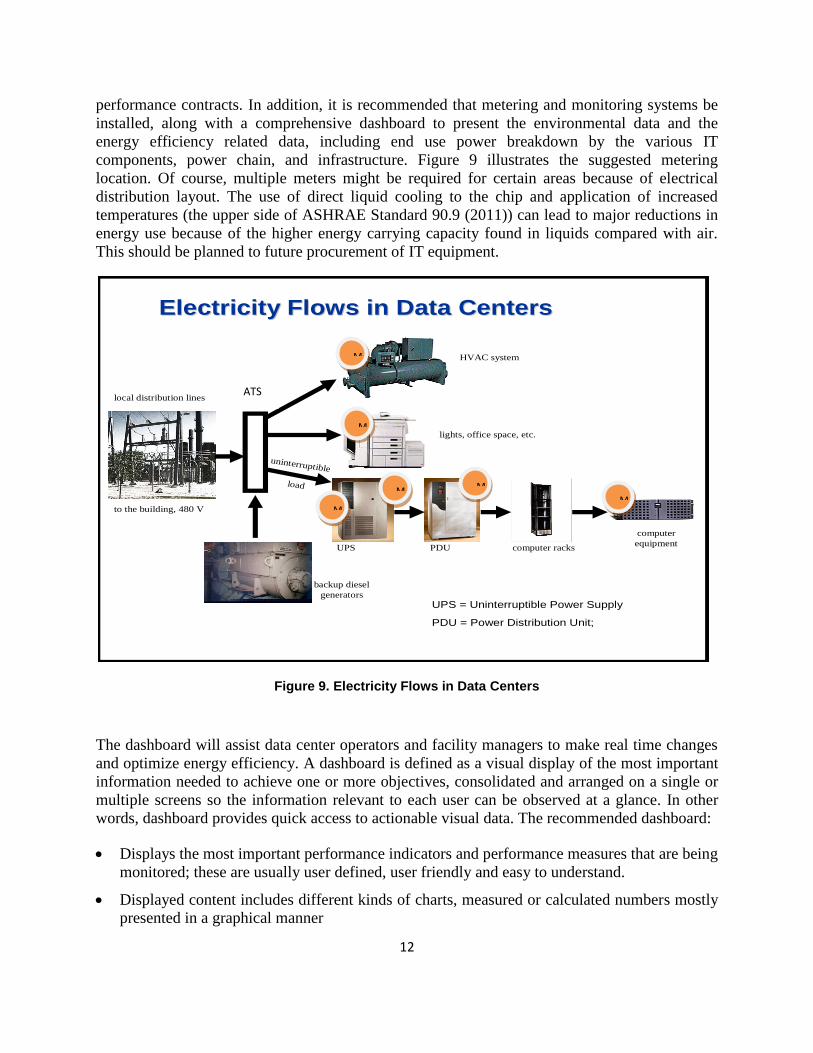
performance contracts. In addition, it is recommended that metering and monitoring systems be
installed, along with a comprehensive dashboard to present the environmental data and the
energy efficiency related data, including end use power breakdown by the various IT
components, power chain, and infrastructure. Figure 9 illustrates the suggested metering
location. Of course, multiple meters might be required for certain areas because of electrical
distribution layout. The use of direct liquid cooling to the chip and application of increased
temperatures (the upper side of ASHRAE Standard 90.9 (2011)) can lead to major reductions in
energy use because of the higher energy carrying capacity found in liquids compared with air.
This should be planned to future procurement of IT equipment.
Figure 9. Electricity Flows in Data Centers
The dashboard will assist data center operators and facility managers to make real time changes
and optimize energy efficiency. A dashboard is defined as a visual display of the most important
information needed to achieve one or more objectives, consolidated and arranged on a single or
multiple screens so the information relevant to each user can be observed at a glance. In other
words, dashboard provides quick access to actionable visual data. The recommended dashboard:
Displays the most important performance indicators and performance measures that are being
monitored; these are usually user defined, user friendly and easy to understand.
Displayed content includes different kinds of charts, measured or calculated numbers mostly
presented in a graphical manner
local distribution lines
to the building, 480 V
HVAC system
lights, office space, etc.
UPS PDU computer racks
backup diesel
generators
Electricity Flows in Data CentersElectricity Flows in Data Centers
computer
equipment
uninterruptible
load
UPS = Uninterruptible Power Supply
PDU = Power Distribution Unit;
M
M
M
M
M
M
ATS
13
Provides information for all stakeholders.
Supports interactivity – filtering, drilling down, or customizing screens to meet the needs of
stakeholders.
Stores data and generates reports on various aspects of energy, as needed or defined by the
stakeholders.
LBNL also recommends that future purchases of IT equipment and cooling systems include a
preference for water cooled systems. If air cooled systems are procured, at a minimum, the IT
equipment should be capable of operating at more than a 900F supply air intake temperature
(ASHRAE class A2). Regardless of cooling options, the servers should be powered at a high
voltage (480V is preferred), and equipped with variable speed server fans controlled by the
server core temperature. For new data centers use of direct current in lieu of alternate power is
recommended since the power loss due to multiple conversions and inversions are avoided.
14
Printed with a renewable-source ink on paper containing at
least 50% wastepaper, including 10% post consumer waste.
DOE/EE--1075 ▪ May 2014