Embed Size (px)
Citation preview
Case Study:
Development of a Quality Management System
for Hydrological Services of the
National Institute of Water and Atmospheric Research Ltd
Prepared by:
John Fenwick NIWA, Christchurch, New Zealand
February, 2016

Page 2 of 39
1 New Zealand’s NHS - NIWA ..................................................................................................5
2 Brief History of Quality Management in NIWA ......................................................................6
3 Formal quality assurance - the provisions of ISO 9001 ...........................................................7
3.1 Scope .................................................................................................................................... 7
3.2 Normative reference............................................................................................................ 7
3.3 Terms and definitions .......................................................................................................... 7
3.4 Context of the organisation ................................................................................................. 7 3.4.1 Understanding the organisation and its context .................................................. 7 3.4.2 Understanding the needs and expectations of interested parties ...................... 7
Table 3-1: Typical needs and expectations of “interested parties”. ..................................... 8
Figure 1: Categories of stakeholders and possible strategies to use for each. ................... 8 3.4.3 Determining the scope of the quality management system ................................ 9 3.4.4 Quality management system and its processes ................................................... 9
3.5 Leadership ............................................................................................................................ 9 3.5.1 Leadership and commitment ............................................................................... 9 3.5.2 Quality policy ........................................................................................................ 9 3.5.3 Organisational roles, responsibilities and authorities .......................................... 9
3.6 Planning for the quality management system ..................................................................... 9 3.6.1 Actions to address risks and opportunities .......................................................... 9 3.6.2 Quality objectives and planning to achieve them ................................................ 9 3.6.3 Planning of changes ............................................................................................10
3.7 Support ..............................................................................................................................10 3.7.1 Resources ...........................................................................................................10 3.7.2 Competence .......................................................................................................10 3.7.3 Awareness ..........................................................................................................10 3.7.4 Communication ..................................................................................................10 3.7.5 Documented information ...................................................................................10
3.8 Operation ...........................................................................................................................11 3.8.1 Operational planning and control ......................................................................11 3.8.2 Determination of requirements for products and services ...............................11 3.8.3 Design and development of products and services ...........................................11 3.8.4 Control of externally provided products and services .......................................11 3.8.5 Production and service provision .......................................................................11 3.8.6 Release of products and services .......................................................................12 3.8.7 Control of nonconforming process outputs, products and services ..................12
3.9 Performance evaluation ....................................................................................................12 3.9.1 Monitoring, measurement, analysis and evaluation..........................................12 3.9.2 Internal audits ....................................................................................................12

Page 3 of 39
3.9.3 Management Review .........................................................................................12
3.10 Improvement .....................................................................................................................13
4 Implementation of the ISO 9001 framework ....................................................................... 14
4.1 Quality policy, strategy and organisation ..........................................................................14
4.2 Responsibilities ..................................................................................................................14
4.3 Data standards and targets ................................................................................................15
4.4 Equipment calibration and maintenance ..........................................................................16 4.4.1 Accuracy .............................................................................................................16 4.4.2 Uncertainty .........................................................................................................16 4.4.3 Traceability .........................................................................................................16 4.4.4 Equipment calibration procedures .....................................................................17
4.5 Procedures for data collection, data capture and initial processing .................................19 4.5.1 Data collection procedures ................................................................................19 4.5.2 Data capture and initial processing ....................................................................19 4.5.3 Local procedures ................................................................................................19
4.6 Data processing and interpretation ...................................................................................20 4.6.1 Procedures for quality control of data ...............................................................20
4.7 Document control ..............................................................................................................20 4.7.1 Document approvals and issue ..........................................................................20 4.7.2 Document reviews ..............................................................................................20 4.7.3 Tracking changes and modifications ..................................................................20 4.7.4 Manuals ..............................................................................................................21 4.7.5 Maintaining records ...........................................................................................21 4.7.6 Responsibilities ...................................................................................................21
Table 4-1: Location and retention of quality management records. ....................22
4.8 Non-conformances and corrective actions ........................................................................24 4.8.1 The processes: ....................................................................................................24 4.8.2 Preventive actions and improvements ..............................................................24
4.9 Storage of original data records ........................................................................................25
4.10 Internal audits ....................................................................................................................25
4.11 Monitoring training needs .................................................................................................26
4.12 Reporting on performance ................................................................................................26
Table 4-2: Regular reports on performance. ..............................................................28
4.13 Management review ..........................................................................................................28
4.14 Archiving and dissemination of data .................................................................................29 4.14.1 Archiving .............................................................................................................29 4.14.2 Providing data to users .......................................................................................29 4.14.3 External sources of data .....................................................................................30

Page 4 of 39
4.14.4 Hydrological product computations and dissemination ....................................30
5 Challenges and learnings from achieving ISO 9001 Certification .......................................... 31
6 Contact and access to documentation ................................................................................ 33
7 References ......................................................................................................................... 34
8 Appendix A: Examples of forms used .................................................................................. 35
Equipment calibration form .........................................................................................................35
Internal audit - data processing practice .....................................................................................36
Example of issue tracking using JIRA ............................................................................................39

Page 5 of 39
1 New Zealand’s NHS - NIWA New Zealand has one national institute and a number of regional agencies that together perform the functions of a national hydrological service. This situation has evolved from the devolution of water resource management to local government agencies over several decades and particularly since key legislation (the Resource Management Act) in 1991.
New Zealand’s hydrological data collection began in the early 1900s, when lake levels began to be monitored for hydro-electric potential. From the 1930s, associated rivers and those of regional importance (relating to flooding and irrigation potential) also began to be monitored regularly. In response to river control and soil conservation legislation, three “Hydraulic Survey” teams were set up in 1949. As part of a government ministry (Ministry of Works and Development), these grew into as many as 16 regional “Hydrological Survey” offices during the 1960s through to the 1980s.
In the mid- to late- 1980s, political emphasis on market forces and deregulation of the economy saw the introduction of “user pays” philosophies to water resource monitoring and the supply of data to users (Pearson, 1998; Mosley, 1987). During a period of rationalisation of government departments, the “Hydrological Survey” became the “Water Resources Survey” as part of an existing Department of Scientific and Industrial Research. One (forward-thinking) response to the uncertainty in the political and economic landscape was to enhance the credentials of the agency by implementing a formal quality assurance programme. ISO 9000 was the emergent standard at the time and although it appeared to be designed for manufacturing industries, its claim to cover service industries was successfully tested. The implementation process involved a massive effort in examining and upgrading data archives, reducing data backlogs and standardising documented procedures.
In July 1992, the National Institute of Water and Atmospheric Research Ltd (NIWA) was established, one of ten Crown Research Institutes. Their mandates from government included being able to obtain funding, additional to specific contract funding from government, from other agencies and the private sector by way of research and consulting contracts in the open marketplace.
For the Water Resources Survey (subsequently re-named as an “Environmental Information” group within NIWA), its funding evolved into a mix of a Crown (government) contract for a national hydrometric reference network and a national hydrometric archive (includes data from other agencies), contracts for networks operated by the energy companies (hydro-power) and a range of short and long term contracts with regional and local councils, irrigation companies, Pacific Island agencies and others. The formal quality management system has been key in providing assurance of meeting World Meteorological Organisation (WMO) and other relevant standards over a wide range of work.

Page 6 of 39
2 Brief History of Quality Management in NIWA While a fledgling agency in the 1950s and 1960s, the Hydrological Survey teams were managed by a Head Office group notably led by Cornelius Toebes, a Dutch hydrologist. Toebes documented and published two volumes of standard operating procedures (Toebes, 1963) and oversaw the compilation of an extended range of numbered “Provisional Procedures”. This body of work provided a strong basis for standardising hydrological methodologies throughout New Zealand.
A further strong basis for standardising hydrological data quality and its archiving was provided by the in-house development of the Time Dependent Data (“Tideda”) software in the early 1970s and subsequent decades. Initially written to run on an IBM mainframe, it evolved into DOS versions running on 64-bit (Altos) micro-computers through to Windows versions still in use today.
Before 1970, the quality of data gathered depended on the calibre of field party staff, since there was no formal quality assurance programme and so no practical means of examining the data. Senior staff responsible for data collection recognised their inability to provide "inspectorial" quality control and substituted for it the recruitment of intelligent and motivated staff who received comprehensive training with regular refresher courses. The practices taught were drawn from the best available worldwide.
In the period 1970-1982, tools were developed that enabled detailed examination of collected data. Because of the rapid development of computer tools and the shortage of people with expertise in using them, it was impractical to run a formal quality assurance programme. Field party staff informally used the available data processing tools and relied on infrequent feedback from users to point out shortcomings. Data quality was dependent on this feedback. In 1983, the Research Director for the National Water and Soil Conservation Authority (NWASCA) initiated a formal quality assurance programme for all hydrological survey works. This initiative led to regular feedback on data quality, and the setting of standards and a more formal means of maintaining accountability for work done. It also led to a realisation that a fresh look at hydrometry in New Zealand was required, to ensure that new technology was being used to best effect and that the efforts of the various agencies were complementary. (Mosley & McKerchar, 1989).
As related above, formal quality management was introduced partly as a response to government agency rationalisation and down-sizing in the late 1980s and early 1990s. With technology changes and the geographic spread of the 15 offices at the time, there remained a large amount of work required to standardise the technical procedures and add the range of quality-assuring elements needed for the formal management system. Two staff members were assigned to this work for over one year, and subsequently carried out programmes of internal auditing, data quality checking, non-conformance monitoring and corrective action, etc. In accordance with a more holistic approach to quality assurance, much of this work has been integrated into other management tasks. Currently, a part-time quality manager oversees the key performance indicators and carries out (with a degree of delegation) internal audits, calibration and improvement initiatives.

Page 7 of 39
3 Formal quality assurance - the provisions of ISO 9001 The provisions of ISO 9001 (updated for the 2014 draft revision) are summarised below, interpreted for the NIWA context. (The clause numbering from the Standard is used.) This summary is provided to enhance general understanding for those who are interested, but is not complete or definitive; any further clarification should be sought from the standard itself.
The standard received a significant overhaul with the 2015 revision. The reasons behind the changes have been described as needs to:
• Provide a common format and language that is aligned between related standards (ISO 14001, 18001, etc.)
• Decrease the emphasis on documentation • Increase the emphasis on achieving value for the organization and its customers • Increase emphasis on risk management to achieve objectives
The following numbering relates to the standard, ISO9001:2015.
3.1 Scope
3.2 Normative reference
3.3 Terms and definitions
These three clauses as above relate to the standard itself; i.e. its scope, normative reference, terms and definitions; so need no further explanation here. They are listed here so that the numbering of the following clauses, minus the first number 3, relate to the numbering of the Standard.
3.4 Context of the organisation
3.4.1 Understanding the organisation and its context
We need to periodically review our goals and our plans on how to achieve them in the context of the political, economic and market trends and forces. This therefore includes external and internal issues that are relevant, and that affects our ability to achieve the intended outcomes of our production and hence our management system.
(In a small organisation, this could start with a periodic review of a mission statement and a SWOT [strengths, weaknesses, opportunities and threats] analysis.)
3.4.2 Understanding the needs and expectations of interested parties
This is the concept of “stakeholders”, and these range from clients, employees, regulators and owners. Owners obviously include the government and public of New Zealand, not forgetting the range of interest groups and the indigenous people.
One tool is to determine what the likely expectations are and ensure that they are covered in documents such NIWA’s Statement of Corporate Intent.

Page 8 of 39
Table 3-1: Typical needs and expectations of “interested parties”.
Interested party Needs and expectations
Customers Quality, price, & delivery of products and services
Owners/Shareholders Reputation and competence
Sustained profitability
Transparency
People in the organisation Job satisfaction
Good work environment
Job security
Recognition and reward
Suppliers & partners Mutual benefit and continuity
Society and public of NZ Ethical behaviour
Reputation and competence
Transparency
Environmental protection
Another approach is to categorise the various stakeholders as in the matrix below (Zirguezi, unknown), as a guide to what strategy to use for each of them.
Figure 1: Categories of stakeholders and possible strategies to use for each.

Page 9 of 39
3.4.3 Determining the scope of the quality management system
The scope of our system is documented briefly in the current certificate from Telarc. However we are required to document which products and services are covered by the system, and provide justification for any instance where one or more provisions of the standard cannot be applied. Needs and expectations of stakeholders are to be taken into account.
3.4.4 Quality management system and its processes
This is the requirement to maintain and continually improve a system which needs to include, amongst other things, processes to assure and measure performance, assignment of responsibilities and resources, evaluation and improvement of processes and identification of risks and opportunities. Procedures and records will need to be documented to have confidence that processes are being adequately carried out. (This is essentially the old requirement for a quality manual plus more.)
3.5 Leadership
3.5.1 Leadership and commitment
Senior management has to be responsible for implementing a customer focus and demonstrating that customer needs are determined, understood and met.
3.5.2 Quality policy
We need a stated policy on management of quality, and objectives that a quality system should fulfil. Management at executive level needs to be involved in setting these, and ensuring that they are relevant to NIWA’s goals and clients’ needs. The policy should be widely understood and the means to implement it should be in place.
3.5.3 Organisational roles, responsibilities and authorities
Senior management needs to ensure that roles, responsibilities and authorities relating to the system are assigned, communicated and understood within NIWA. Responsibilities and authorities will include ensuring that the system operates as intended and continues to do so as changes are implemented, and regular reporting on outputs and needs for improvements.
3.6 Planning for the quality management system
3.6.1 Actions to address risks and opportunities
In the context of our business environment and stakeholders’ needs, planning of the system needs to address risks and opportunities while seeking continual improvements and monitoring the effectiveness of the actions taken.
3.6.2 Quality objectives and planning to achieve them
Objectives of the quality system need to be periodically be determined and reviewed, taking into account such things as consistency with policy, enhancement of customer satisfaction and the need to monitor, evaluate and communicate them

Page 10 of 39
3.6.3 Planning of changes
Changes to the quality system, whether for improvement or to manage other issues, need to be planned and consider the purpose of the change and any unintended or potential consequences as well as availability of resources and changes to responsibilities and authorities.
3.7 Support
3.7.1 Resources
The necessary resources for the complete operation of the quality system, including people and infrastructure, equipment and knowledge, need to be assessed and provided. This extends to the overall environment, such as the corporate culture and social and physical aspects.
The resources provided need to be maintained as suitable for monitoring and measuring the quality of the products. Measurement traceability, as required, needs to be maintained along with an adequate programme of calibration and identification of relevant instrumentation.
Organisational knowledge necessary for the operation of processes should be identified, maintained and sought from various sources as necessary.
3.7.2 Competence
The competencies required for the range of tasks affecting quality shall be identified and documented. The levels of experience and training required and the evidence of such attainment by the relevant people shall also be documented.
3.7.3 Awareness
The people carrying out the work need to be aware of, as a minimum, the quality policy and objectives, their contributions to the quality of the products and the effectiveness of the quality system, and the implications of not conforming to its requirements.
3.7.4 Communication
Communications related to product quality and the quality system will be planned as to the extent of what will be communicated, when and to whom, and by what means. (This can be particularly important with instances of non-conformances and client liaison.)
3.7.5 Documented information
The quality system will need to include documented information as required by the Standard and that as determined by NIWA as necessary for the effectiveness of the overall system. There also needs to be a means to ensure that all critical documents, drawings, procedures, forms, data, etc., (whether on paper or electronic form) are “controlled”; i.e., are available to all who need them and that everyone has the latest versions to work with. This will involve approvals, issues, reviews and tracking of changes.
Aspects such as distribution, access, storage, retrieval, retention and disposal should also be addressed.

Page 11 of 39
3.8 Operation
3.8.1 Operational planning and control
Planning and control of all aspects of the operating the quality system, including for risks and opportunities, should be part of normal operations.
3.8.2 Determination of requirements for products and services
There is a need to implement and maintain processes for determining the requirements for products and services. Some of this information will be available through routine customer communication (enquiries, order handling, complaints and other feedback) but other stakeholders, regulatory aspects and NIWA itself may provide additional inputs.
Reviews of product requirements need to be undertaken periodically, according to the nature of the various forms of contracts and the extent of documented requirements provided by customers. In some cases these will be upon review of proposals; in other cases they may be raised at management reviews.
3.8.3 Design and development of products and services
The process of product design needs to be planned and documented to ensure that the clients’/users’ requirements are met. The steps should include design input (primarily functional, but including standards and regulatory requirements), controls (including verification and validation), output (acceptance criteria), tracking of changes, and documentation/records.
3.8.4 Control of externally provided products and services
Externally provided products (and services) shall not be allowed to affect NIWA’s ability to consistently deliver conforming products to clients and we need to have controls in place to monitor supplier performance, their product where applicable, their competence, their verification activities, their interactions with our clients (if any), and their overall quality management.
The extent to which we do the above will depend on the potential of the external product’s quality to impact on NIWA’s own product delivery and our perceived effectiveness of the controls applied by the external supplier.
3.8.5 Production and service provision
The process of carrying out our work activities, including any post-delivery services, needs some control by means of: suitable work instructions and standards; equipment being suitable in terms of accuracy and precision; adequate working environments; appropriate handling and storage; suitable data checking and integrity; and, where relevant, identification of the status of data or other products. We should identify any outputs which cannot be readily checked or verified, and designate them accordingly.
Items that are the property of customers shall be adequately identified as such and suitably handled in respect to maintenance, protection from damage, and intellectual property rights.

Page 12 of 39
Where we have an obligation to provide support subsequent to delivery (e.g. with a warranty) such arrangements should be planned and documented in advance, and form part of the contract.
Any changes to planned methodology shall be documented and include a review of the changes, the person authorising the changes and any necessary actions.
3.8.6 Release of products and services
Products shall only be released to clients once the required verification processes have been completed. (For some products this will be peer review and management approval.)
3.8.7 Control of nonconforming process outputs, products and services
Products that do not conform to requirements/standards are to be identified as such and controlled to prevent unintended use or delivery.
Such product should be reviewed and dealt with so that it is not used in ignorance of its status. The review should consider how it can be used and with what provisos, and also identify the root cause of the non-conformance to ascertain how it could be prevented in future.
3.9 Performance evaluation
3.9.1 Monitoring, measurement, analysis and evaluation
To evaluate performance, we need to identify what parts of our processes and products need monitoring. The methodology, frequency and scope need to be defined and the results analysed and reported periodically to the appropriate people. As well as the products, the analysis should evaluate the effectiveness of the quality system, the performance of external providers, the technologies we use and provide management information relating to how well we continue to meet customer requirements.
3.9.2 Internal audits
We need to undertake a planned internal audit programme to determine whether the system conforms to our own stated requirements, the requirements of the Standard, and whether it is effectively implemented and maintained.
Any required actions that are identified should be implemented without delay, and documented evidence of the programme and outcomes needs to be compiled and maintained.
3.9.3 Management Review
Senior management is to review the quality system at planned intervals to ensure its continuing suitability and effectiveness. The review shall take into consideration the actions from previous reviews and internal audits, analysed data on non-conformance monitoring and their outcomes, customer satisfaction data, strategic issues relating to the business, adequacy of resources applied, and new opportunities for improvement.

Page 13 of 39
3.10 Improvement
We must continually improve the effectiveness of the system, take action to eliminate causes of non-conformances, and implement preventive actions to eliminate potential problems.
There are three main areas for improvement; improving our products to cover known and predicted requirements; improving our processes to prevent nonconformities; improving the quality system to assist with the previous two.
We need a systematic means to record and analyse root causes of non-conformances and to record suggested improvements.
Page 14 of 39
4 Implementation of the ISO 9001 framework While the previous chapter has provided an outline of the standard itself, this chapter addresses how we implement it.
4.1 Quality policy, strategy and organisation
All operational work in NIWA, including on-going internal projects, is operated under the project management system as per the NIWA Project Management Manual on the intranet. Thus tasks are defined largely within the project documents. Accordingly, job descriptions are not often referred to, but those of all staff with responsibility for aspects of quality management should include the generic objectives and tasks as listed in an appendix of the Quality Manual. These relate to the implementation of NIWA’s quality goals and policies within all branches and other areas of our work covered by the system.
Although much of our work has some elements of quality assurance built-in, there are other elements which are not at this stage inherent and need to be undertaken as tasks of a QA Manager. These are carried out, partly as an overhead project and partly within the main projects to which they relate, by assigned staff, mainly the QA Project Manager.
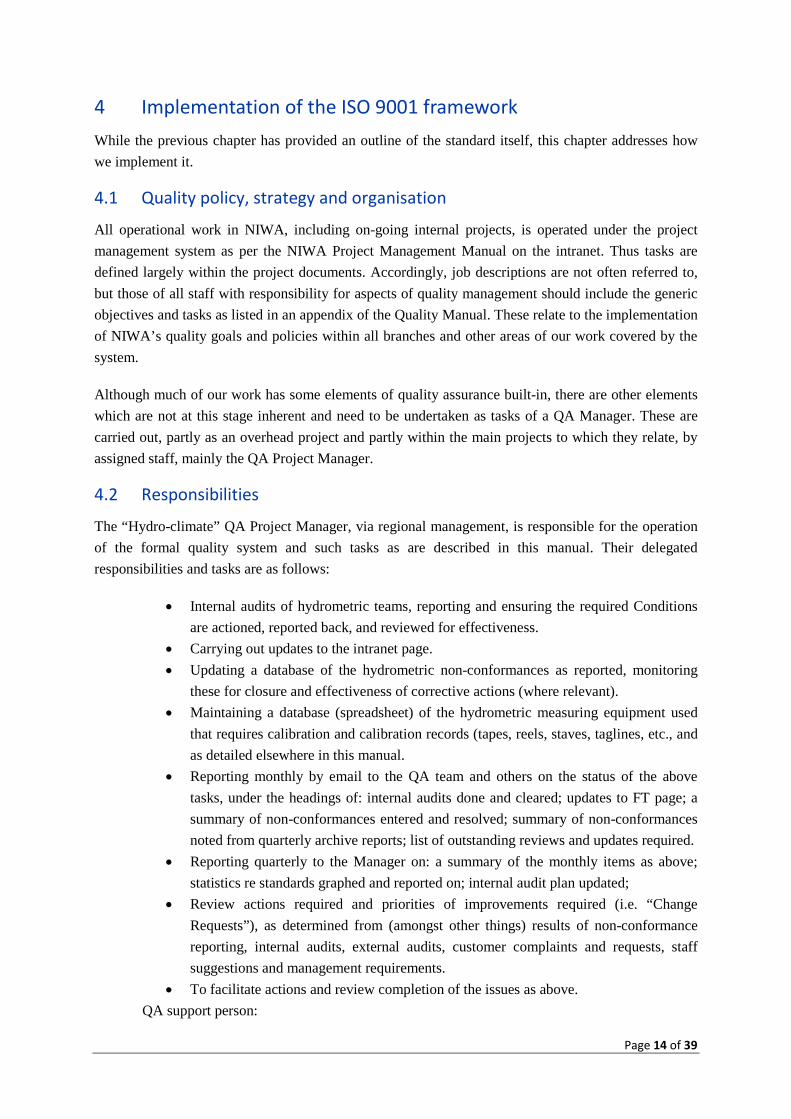
4.2 Responsibilities
The “Hydro-climate” QA Project Manager, via regional management, is responsible for the operation of the formal quality system and such tasks as are described in this manual. Their delegated responsibilities and tasks are as follows:
• Internal audits of hydrometric teams, reporting and ensuring the required Conditions are actioned, reported back, and reviewed for effectiveness.
• Carrying out updates to the intranet page. • Updating a database of the hydrometric non-conformances as reported, monitoring
these for closure and effectiveness of corrective actions (where relevant). • Maintaining a database (spreadsheet) of the hydrometric measuring equipment used
that requires calibration and calibration records (tapes, reels, staves, taglines, etc., and as detailed elsewhere in this manual.
• Reporting monthly by email to the QA team and others on the status of the above tasks, under the headings of: internal audits done and cleared; updates to FT page; a summary of non-conformances entered and resolved; summary of non-conformances noted from quarterly archive reports; list of outstanding reviews and updates required.
• Reporting quarterly to the Manager on: a summary of the monthly items as above; statistics re standards graphed and reported on; internal audit plan updated;
• Review actions required and priorities of improvements required (i.e. “Change Requests”), as determined from (amongst other things) results of non-conformance reporting, internal audits, external audits, customer complaints and requests, staff suggestions and management requirements.
• To facilitate actions and review completion of the issues as above. QA support person:

Page 15 of 39
• To receive Issues and non-conformance reports in JIRA (and by any other means) and either: forward them (“Assign” in JIRA) to the appropriate person for further action; or resolve and record them in JIRA. The threshold for needing to record in JIRA is to do so if they cannot be resolved more or less immediately over the phone, or if there is likely to be a recurrence of the problem and preventive action is required.
Programme Manager
• To monitor the issues and problems being reported within the EIEM projects and EI team with respect to data handling and transmission, assist staff in analysing root causes and developing corrective actions, and to engage in any other issue as necessary to increase effectiveness and efficiency.
Group Manager, Instruments
• To monitor the issues and problems being reported within Instrument Systems, facilitate them being reported, add them to the non-conformance register, carry out and assist staff in analysing root causes and developing corrective actions, facilitate or carry out these actions, and to engage in any other issue as necessary to increase effectiveness and efficiency.
4.3 Data standards and targets The data standards adopted in the areas of hydrological and climatological monitoring (see the relevant appendix to the Quality Manual) are based on the appropriate ISO standards, WMO Guides, and other internationally accepted standards. They have been adopted after wide consultation with data users and clients. Standards are not regularly reviewed, because the long-term nature of hydrological information requires stability. However, ISO, WMO and other relevant standards are monitored, and our standards may be adjusted to maintain consistency, where NIWA management and clients deem it to be appropriate.
Water-level, flow and other data on the Hydrometric Archive varies in its quality, particularly prior to 1991. In that year, “data standards” in terms of stage uncertainty, rating curve error limits, missed record, etc. were introduced. The nature of flow measurements means that these standards may not be met all the time, but the rationale is that the instrumentation and methods shall be targeted to meet these standards. Exceptions, such as over flood peaks (increasing stage uncertainty due to surge, etc.) and missing record (due to, say, vandalism) should be limited to short periods which will be within the “allowed” 5% of time.
Since 1991, through focussing on the need to meet these standards, data quality has improved so that they are met most of the time. Instances where they are not met are “flagged” by the presence of a comment in the database. The general test as to whether standards are met and/or a comment is required is: Can a user, given that they have read the standard and the comments, safely assume that the data meets the statement of standards and then use it accordingly?

Page 16 of 39
4.4 Equipment calibration and maintenance Most of our work involves quantitative measurement and using measuring equipment of some description. With the possible exception of purely comparative work, the validity of measurements is always dependent on the measuring equipment being and staying within acceptable calibration limits.
Calibration can itself be an exacting science. Even the ubiquitous measuring tape is subject to errors of reading, parallax, expansion and contraction due to temperature, registration, stretch and effects of “wear and tear” while in use, and most of these issues and more again in the manufacturing process.
4.4.1 Accuracy
When selecting instruments/equipment for data collection, we must first decide what “accuracy” is acceptable and whether it meets the scientific design and the clients’ needs. Accuracy is a general term covering resolution, detection limits, bias, interferences, hysteresis, aliasing, random and systematic errors, etc., most of which can be expressed in terms of uncertainty. Many of these may be of little consequence with, say, our tape measuring the length of a live fish, but will require careful analysis for some other measurements. A proper laboratory calibration should quote instrument uncertainty, but this may only be part of the equation as far as data uncertainty is concerned.
4.4.2 Uncertainty
When reporting the result of a measurement of a physical quantity, it is necessary that some quantitative indication of the likely errors be given so that users can assess its reliability. The concept of uncertainty as a quantifiable attribute is relatively new in the history of measurement, although error and error analysis have long been used.
In general, uncertainty will be comprised of many components. Some of these may be evaluated from the statistical distribution of the results of series of measurements and can be characterised by experimental standard deviations. The other components, which also can be characterised by standard deviations, are evaluated from assumed probability distributions based on experience or other information.
When we calibrate our instruments then, the uncertainty needs to be stated so that the instrument user and the user of the data will understand the level of doubt that is reasonable to apply to measurements and thus the limitations of the data. The issue is of particular importance when a given instrument is used as a calibration reference for another.
4.4.3 Traceability
Traceability is concerned with the uncertainty in the measuring equipment that provides the values we calibrate our instruments to. Certified measurement laboratories will have all their measuring apparatus calibrated against instruments which in turn are traceable to national standards (and them to international standards). We have some apparatus that is traceably calibrated on a regular basis (e.g. tapes and balances). Clocks can be calibrated relatively simply against the “Talking Clock” (NZ) or other web-based services. (See http://www.msl.irl.cri.nz/services/time-and-frequency).

Page 17 of 39
4.4.4 Equipment calibration procedures
For data collection within the quality system, measuring apparatus is generally calibrated by the QA Project Manager in conjunction with internal audits. For calibration checks carried out for other purposes, the Form CAL is to be used. Tolerances are specified, and equipment is rejected for service if the results fall outside them.
Fortunately, most hydrometric stations can use a standard range of equipment, for which the resolution and uncertainty can be quoted on a “group” basis, as long as installations and ancillary equipment are standard.
Requirements for hydrometric equipment are:
• Recording instrument serial numbers will be recorded on field log sheets, be transferred to local and national databases when required, and will be entered on all relevant Instrument Systems receipt, purchase, servicing, and dispatch records.
• Recording instruments and their sensors will be checked periodically against manual readings. For example, at each visit, water-level recorders will be checked against a staff gauge reading which will be recorded in the logbook. Similarly, raingauges will normally have a check gauge to provide periodic total catches as a check.
• Instruments for hydrometric, ambient air quality and climatological stations shall either be of an approved type (for which uncertainties have been calculated as above), or uncertainties shall be calculated and recorded in a data comment (and the project file) that these will meet the user’s/client’s needs.
• Hydrometric measuring equipment (tapes, taglines, sounding reels, timers, raingauge measures, etc.) will be calibrated using traceably calibrated equipment, maintained for this purpose, by the QA Project Manager or a suitable delegate. Procedures are given in the Hydrometric Field Manual.
• Standard reference test equipment is maintained and controlled by the QA Project Manager and by the IS Project Director, for use in their respective areas of calibration. Control includes maintaining a register of equipment details and location and a file of calibration certificates, etc. Where possible, these standard reference gauges are calibrated at registered laboratories to traceable international standards. Re-calibration is undertaken every ten years.
• Recording instruments and their sensors will be checked periodically against manual readings. For example, at each visit, water-level recorders will be checked against a staff gauge reading which will be recorded in the logbook. Similarly, raingauges will normally have a check gauge to provide periodic total catches as a check. These types of checks are embodied in all procedures in the Hydrologists’ Field Manual, Air Quality Procedures Manual and Climate Manual.

Page 18 of 39
• All calibration results shall be recorded on appropriate forms (both electronic and paper), filed as described in the relevant instructions, and kept for a minimum of ten years.
Details of procedures for all the above requirements are given in the Hydrologists’ Field Manual (Chapters 6 and 7), the Air Quality Procedures Manual and the Climate Manual.

Page 19 of 39
4.5 Procedures for data collection, data capture and initial processing
4.5.1 Data collection procedures
Hydrometric work instructions are documented in a series of controlled manuals (listed in a Register of Manuals).
The procedures are generally consistent with the provisions of relevant ISO standards (ISO, 1983; Handbook 16, Measurement of open channel flow and the numerous updates of this collection of standards), World Meteorological Organisation standards and procedures, and the United States Geological Survey's Techniques in Water Resources Investigations. To maintain the instructions and procedures in a current and up to date form (and prevent outdated or erroneous versions continuing in use and/or circulation), they are controlled.
Therefore, all operations covered by the quality assurance system must use the procedures in these manuals. Any exceptions shall be with the approval of the Project Director for that project, and shall be documented and include data comments (on the Hydrometric Archive if applicable). If a commercial project, the client must be made aware in writing that the standard procedures are not being used, the data is outside standards (if applicable), and that the work may not be subject to the rigour and benefits of our certified quality system. Failure to do this is in breach of our right to use the certification logo and status granted by Telarc SAI Ltd and may also imply contractual standards on which we may not deliver.
4.5.2 Data capture and initial processing
There are some general principles that we need to follow, including
• Taking steps to guard against loss of data through having independent backups from the first step of data collection. This means having at least two copies of the raw data before the initial copy is deleted or over-written.
• Guarding against the possibility of errors in file handling, editing or file corruption, so that at all stages there is at least one copy of the original file which will be able to be reverted to if necessary.
• The use of well-understood, standardised procedures for editing and data processing, which must be traceable and recorded adequately so that someone else can understand what has been done. These processes are well-defined and use standard forms as listed in the Form Register
4.5.3 Local procedures
The various manuals (see Register of Manuals) have procedures for data collection, capture, processing and archiving which follow the above principles. Any areas not covered by these manuals will need appropriate procedures documented (e.g. in a local procedures manual) so that people understand what they need to do to ensure data integrity from the first stages of collection through to archiving.

Page 20 of 39
4.6 Data processing and interpretation The Hydrometric Data Processing Manual defines the procedures for hydrometric and automatic rainfall QC checking, including checking manual readings on log pages, providing a “paper trail” of evidence of processing, and the process of annual data reviews. Occasionally processing routines may be written for client projects (e.g., in PSIM, Excel or Aquarius), and these will be subject to the rigour and investigation of peer review of the reports provided.
Preferably before data collection begins, the location and method of archiving should be decided. Normally, archiving shall include not only the final but the original, unprocessed file. The complete process shall be done according to defined procedures which will give assurance that the data is correctly identified, processed according to defined and understood procedures, and in its most useful form for future checking and use. Section 14 of this manual provides more detail on principles and requirements.
Generally, hydrometric data shall be filed on the Hydrological Database (HDB). The only justifications for exceptions will be that the data is of low value in the present and future, such that security and potential use do not warrant the cost of archiving.
The HDB Manual sets out the requirements and procedures for operation of that archive.
4.6.1 Procedures for quality control of data
We have integrated quality assurance and quality control with standard procedures and management tasks. Therefore these are not detailed separately.
4.7 Document control We need a means to ensure that all critical documents, drawings, procedures, forms, data, etc., (whether on paper or electronic form) are “controlled”; i.e., are available to all who need them and that everyone has the latest versions to work with. This will involve approvals, issues, reviews and tracking of changes. Information contained in many of these documents and files need to be retained for future reference, and must be stored so that they continue to be legible, readily identifiable and retrievable.
4.7.1 Document approvals and issue
The approval and supply of quality system documentation, management and operational instruction manuals, are authorised by the EI Manager. Normally these responsibilities are delegated to appropriate staff as detailed in the Register of Manuals.
4.7.2 Document reviews
All internal documents that embody procedures, methods, and technical requirements, etc., shall be peer reviewed as is normal practice for reports, etc. Again the Register of Manuals gives details.
4.7.3 Tracking changes and modifications
The integrity of documents within the quality system is monitored and controlled by:
• including all technical procedures in the manuals

Page 21 of 39
• having a footer on each page of a manual giving the manual name, page number and date of adoption (usually in the same format as this manual)
• giving each form a number (usually 2-3 letters) together with the date it is to be used from (e.g., “Form xxx 230312” in the top right-hand corner)
• recording, in registers, all drawings, forms, product changes, etc.
4.7.4 Manuals
Broadly these documents will be in two forms:
a) Electronic manuals For all manuals that are available via intranet or local network, only the electronic version shall be regarded as current and definitive. All printed versions shall be regarded as potentially out of date (a warning shall be provided in the footer or header). Only authorised persons (as noted in this section) will have intranet access or otherwise be able to change the files.
Manuals/documents available on shared network drives will be in the form of .pdf documents with editing access protected. Only authorised persons will be able to alter them. However, where warranted, some documents will also have a Word file version of the same name in the directory. This will be able to be changed and updated by users as they find the need for this to happen. The files will have Tools/Track Changes/Highlight changes enabled to show what has been done. Periodically, according to the need, these changes will be reviewed and updated to the .pdf file as applicable.
b) Paper-based manuals and documents These will always be regarded as uncontrolled and therefore out of date. They should only be printed and used for short-term purposes.
4.7.5 Maintaining records
When many of the aforementioned documents are used, records are created. For various reasons, many are required to be kept for set or indefinite periods into the future so that they can be consulted or checked to verify information, or prove that certain things happened. NIWA’s record management policy is pertinent to how and why we do this, as is the Public Records Act 2005 and other legislation. Some of the records we keep (notably data) are not the property of NIWA; instead we act as the custodian for the client or the nation.
The main requirements are that many of our records need to remain legible, readily identifiable and retrievable. Table 6.2 details the records that need to be controlled for – amongst other things – the operation of the quality system.
4.7.6 Responsibilities
The QA Project Manager normally maintains the registers for forms for the hydrometric projects, the Climate Database and Instrument Systems. The Air Quality QA Project Manager carries this out for the Air Quality Procedures Manual and associated forms.

Page 22 of 39
Table 4-1: Location and retention of quality management records. Record Format Storage location Storage
retention period
Archive location
Archive retention
period
Disposal authorisation
by Management review meetings minutes
Word Network - QA folder 10 yr - - QA PL
Staff qualifications Paper Personal file, HR section indefinite HR Manager Staff training, skills record & experience
Paper Form TTR (training record) QA PL & copy to PF
indefinite - - QA PL
Staff training Spreadsheets Intranet – H&S pages. Some also in CHRIS 21 database & backups
indefinite - - HR Manager
Customer satisfaction surveys
Paper report Network - QA folder 10 yr - - QA PL
Calibration of field equipment
Excel Network - QA folder indefinite - - QA PL
Calibration of instruments
Excel Network - IS QA folder indefinite - - QA PL
Internal audit reports Word Network - QA folder indefinite - - QA PL Recording station log pages
Paper Field team secure cabinets 2 years + Recall archive
Permanent Programme manager
Data processing plots and evidence of processing
Paper Field team secure cabinets 2 years + Recall archive
Permanent Programme manager
Gauging cards Cards, TDGauge files
Field team secure cabinets and Field team network drives
indefinite Recall & archive
Permanent Programme manager
Annual data review reports and audit forms
Pdf files SIMS & Field team network drives indefinite SIMS Indefinite but may be superseded
Programme manager
Non-conformance reports & actions field teams
Jira & emails Network - QA folder indefinite - - QA PL

Page 23 of 39
Supplier evaluations & rankings
Database entries
Quanta & Oracle indefinite Backup tapes
- QA PL
Instrument tracking & identification
Database entries
Instrument Tracking system indefinite Backup tapes
- QA PL
IS Problem Reports Word and Excel Network - QA folder indefinite Backup tapes
- QA PL
Miscellaneous Quality Records
Word and Excel Network - QA folder indefinite Backup tapes
- QA PL
Product Change Records (PCR)
Word and Excel Network - IS QA folder indefinite Backup tapes
- QA PL
External Calibrations - Reference and Test Instruments
Excel and Paper
Network - QA folder indefinite Backup tapes
- QA PL
Design and Development Specifications, review and verification
Word, Excel, PDF
Network - IS QA folder indefinite Backup tapes
- QA PL

Page 24 of 39
4.8 Non-conformances and corrective actions When products, including data, do not meet their intended standards, three things need to happen, not necessarily in this order:
(a) The product or data should be re-worked within standard practices to meet the standard or tagged (e.g. Tideda Comments or quality grades) to identify to the user and others that the standard has not been met.
(b) The cause should be investigated with a view to avoiding a recurrence.
(c) The instance together with its root cause (if known) should be recorded in order to quantify the associated costs, with a view to possibly applying resources to achieve a more “global” solution. The instance and the state of its preventive action should be communicated to others in NIWA whose work may be affected by a recurrence.
4.8.1 The processes:
• For any problem or incident from any cause which has wasted significant resources and/or has the potential to cause further problems if not corrected, a non-conformance report is required. This is generated in the in-house issue/workflow software application (JIRA).
• Examples of non-conformances are failure of newly-received items, significant errors in data, errors in work instructions/procedures; failure of factory acceptance tests; loss of record or any failure of instruments, lost computer files, all insurance claims. They can also be generated when improvement or cost-saving opportunities are identified.
• All Issues created for the above purposes will automatically be assigned to the EI Support Technician. He will assign the issue to the appropriate person and monitor progress. Other interested parties will also be copied in. Corrective action is then carried out by the assigned person if possible, details noted on the JIRA form, and sent as a wider communication if appropriate (possibly on the in-house list server).
• Customer complaints are recorded as for non-conformances but marked for immediate action by Project Directors as appropriate.
• Issues will be closed by the assignee after resolution has been obtained, and it has been tested or reviewed for effectiveness if possible.
• Analysis of statistics, root causes and outcomes will be analysed periodically by the assigned project leaders/directors and reported at management reviews.
4.8.2 Preventive actions and improvements
Many non-conformances can be guarded against, given the forethought and resources to put remedies in place in anticipation. However only some of the possible combinations of eventualities are worth applying resources to eliminate completely; and it is the purpose of the non-conformance reporting to identify which ones. Once this has been done, a range of preventive actions are possible, such as:

Page 25 of 39
• Improve procedures and perhaps software to make them more intuitive and foolproof.
• Add extra monitoring equipment, perhaps as a backup, upgrade instrumentation.
• Provide training, more resources for the work and/or find better ways of carrying it out.
As well as improving the standard of service or product, we continually look to reducing the resources required in the longer-term. The non-conformance reporting system can assist with both aspects by helping to identify the needs and provide facts for decision-making.
4.9 Storage of original data records Hydrometric and climate data in their original form are kept indefinitely. This includes charts, logbooks, notebooks, level books, paper tapes, magnetic tapes, diskettes, etc., which are to be stored at all times in reasonably secure (intruder, fire and water resistant) facilities. It also includes documentation (in whatever form) that constitutes the evidence of processing and explains the parameters used in that processing prior to its archiving. The indexing and cataloguing of these records is done by the team responsible for its acquisition and processing.
All original records, whether in written form (gauging cards, survey books, etc.), or electronically recorded (telemetry and solid-state) are to be kept in a safe environment against damage and loss (including theft) at all times. Fire-proof storage with a minimum two-hour fire rating is required. All data not in use or not being processed are to be held here at all times. The door to these areas must be kept closed, and locked as appropriate
Where the original data is in the form of a data file on electronic media, copies of the unaltered but identifiable files must be stored on the local server which are backed up, automatically and daily to another office location.
Original records acquired in electronic form are copied in unmodified (except for identification/format issues), to computer file, and transferred to specific directories on the Hydrometric and Climate Databases.
4.10 Internal audits At least once every three years, and on a rotating programme, internal audits of the technical and QA processes at each team shall be undertaken by the QA PL or other assigned staff, usually with assistance from another team member. A summary of audits carried out and those scheduled for the next two years is maintained as a spreadsheet on the QA shared network folder. If issues arise such as customer complaints or data quality problems, etc., additional audits may be carried out as and when appropriate.
The procedure will be in accordance with accepted good auditing practice. Data collection operations will be audited against the Hydrologists’ Field Manual, the Climate Manual, etc., (as current on the intranet) and data processing operations will be audited against the manuals for Data Processing, Compiling Flow Ratings, etc.

Page 26 of 39
The general procedure will be to conduct entry and exit meetings with the staff involved, and to collect information using the Forms BI, DI, EI AI and AIR as appropriate and as guides and checklists. For each team, a report will be compiled that uses the general format given on Form IAR. This will list action points (as Conditions, Recommendations and Notes) and be submitted to the Team Manager, the team’s Group Manager, and relevant Project Directors. The action points will also state a date that action as agreed will be reported back as completed. The auditor will check that these actions are carried out and review them for effectiveness, reporting the outcomes to the next management review meeting.
The internal audit must be seen as a valuable opportunity to have an open discussion and review of the quality and effectiveness of the teams’ work programmes, the general procedures and systems, and be carried out with the principal aim of facilitating improvements for the benefit of both the clients and the staff involved.
4.11 Monitoring training needs
Training sufficient to understand the processes and measurement methods is obviously vital to the process of data collection. For many measurements, understanding of the parameters and measurement principles must be achieved by formal qualifications, on-job training, and reading of scientific articles, instrument manuals, papers, etc. This is normal and expected in the science field, where enquiry and striving for understanding are part of the job.
The training needs of all NIWA staff are assessed annually, as part of the normal personal performance assessment procedures, and when changes in duties, or quality audits, or other information indicate that a training need may exist. Such training needs are provided for as soon as practicable, depending on the availability of appropriate training opportunities and workload. Approval and funding is normally required from management.
Training records (including both technical and safety topics) are maintained and are available via the intranet. In addition, the QA Project Manager and relevant Group Managers take the opportunities provided by internal audits and performance reviews respectively to facilitate updates to this database, keep an overview of training needs, and assist in arranging required training.
4.12 Reporting on performance
In accordance with the principle of having a factual approach to decision-making, we need to measure our performance with quality-related parameters. This is essential to knowing where best to apply resources, and whether we are making progress with improving quality.
For data collection, statistics are collected on a variety of parameters including proportion of missed record, scatter of measurements from established or assumed relationships, theoretical uncertainty of measurements and statistical uncertainty of many parameters.
Reporting of performance of data collection is carried out using data from:
• The HDB quarterly report on the state of the archived data

Page 27 of 39
• Issue tracking in Jira, on the Hydrometric, QA Change Requests and Customer complaint components.
• Outcomes from internal and external audits, as tracked and resolved in Jira as above.
• Progress on ADRs, as tracked by the HDB Manager and summarised in the Monthly QA reports.
Each quarter, at the end of each March, June, September and December, a quarterly report containing a summary of the above topics for the previous 3 months will be produced by the 15th of the following month. This will also contain management reporting items from the Regional Management reports plus information from the teams, IS and EI which is useful to share across the forum. Other reporting is detailed in Table 4.2.

Page 28 of 39
Table 4-2: Regular reports on performance. Quality report By For When Frequency Purpose
Quarterly Report on the State of Archived Data
Databank Field Team Leaders and Project Directors
Quarterly Summarise data quality and updatedness; identify variances
Quarterly Quality Assurance Report
Project manager QA
EI Management and line managers
Quarterly Summarise achievement of standards in Branches’ data collection
Annual Report on Archived Data Databanks Field team Leaders and Project Directors
Annual Summarises data quality and timeliness; identify variances
Annual Data Review Field teams EI Management Some clients
Annual Illustrate data quality, identify variances
Water-level/flow Station Inspection
Field teams Teams / ADR auditors / clients
Biennial Indicate compliance to standard field practices, identify discrepancies and remedies
Automatic Rainfall and Climate Station Inspection
Field teams Project manager, Climate and QA
Biennial Indicate compliance to standard field practices, identify discrepancies and remedies
Manual Rainfall Station Inspection
Field teams Project manager, Climate
Four-yearly Indicate compliance to standard field practices, identify discrepancies and remedies
Internal Audit report QA project manager (assisted by senior staff?)
Regional Manager and Project Directors
Annual-biennial
Ensure adherence to field and office practices, identify training needs, etc
Assessment of Field Practice Field teams Project manager QA
Occasional, when required or for trainees.
Ensure adherence to field and office practices, identify training needs, etc
Management Review QA Project manager and PMs
Regional Manager GM (Opns)
Annual or when meetings permit
Indicate effectiveness of QA system and review achievement of objectives, particularly standards of data quality
Comparative Discharge Measurement (including ADCP “regattas”)
Field teams (& collaborators)
Project Manager, QA
Biennial - triennial
Demonstrate adherence to field practices and standards, particularly equipment calibration accuracies
4.13 Management review
The aim of a regular management review is to assess how well the various parts of our system and procedures are serving us in maintaining and improving the quality of our outputs, namely customer satisfaction, data effectiveness and accuracy, overall efficiency, job satisfaction, and communication, etc. Where required for each group, these reviews will be carried out annually, normally before and in conjunction with the capex and performance assessment rounds.

Page 29 of 39
For the hydrometric programmes, a management review will be held during the period October to February each year, in order to provide input to business and strategic plans. It will be convened by the QA Project Manager, with the attendance of representative members of the teams plus, when possible, the Hydrometric Programme Manager, EI Manager and Chief Scientist EI.
A standard agenda (in the QA network folder) is to be used as a guideline for the topics to be reviewed. Brief minutes should include action points with responsibilities and timelines allocated.
4.14 Archiving and dissemination of data
4.14.1 Archiving
At the end of initial data processing, the new data have been imported, checked, edited if necessary and stored in working directories or in an “update” file on the local server. Once the checking and verifying is complete, the files are passed on to or picked up by the Database Manager for updating to the Hydrometric Database. The steps in this process are:
• The data are assembled in a designated transfer directory on the server or shared directory designated for this purpose. No other batches shall be contained in that directory.
• Register pages are filled in for all the data batches with all columns filled in and signed off.
• The data supervisor checks the register pages and batch listing for completeness, and that the filed end of batch data (e.g., time and stage) follows on to new updated batch. Checks are made for continuity of time series (absence of gaps), continuity of values and apparent interpolations between the batches.
• All batches without apparent errors are updated to the Hydrometric Database, and any that have apparent errors or anomalies will be returned to the data processor.
• The Database Manager receives the files, updates them, and returns the form and a copy of the updated archive to the data supervisor.
4.14.2 Providing data to users
Data collected by NIWA ranges from being confidential to the client or project that funds it, to being freely available to the public. With most hydrometric data being filed on the Hydrometric Database for reasons of integrity, security and back-up, there are obviously strict procedures in place to achieve these requirements.
The process of providing data to users must follow these steps:
a) Availability – do we have it?
b) The form of the data required – summaries, data points, etc.?
c) Authorisation – Are we permitted to supply that user - who must we/they ask, and what is the procedure? (Permission is required in writing).
d) Conditions of supply - including data quality and source provisos, if relevant.
e) Cost and price.

Page 30 of 39
Data requests and provision shall be summarised on the Quarterly Data Request Report.
4.14.3 External sources of data Both the Hydrometric Archive and the Climate Database contain data collected by other agencies and voluntary observers, for which we have little control on its initial quality. In all cases its source is to be identified, and users are to be made aware that the data fall outside our normal standards of accuracy and will not have the normal assurance of our quality system. The tools to identify and inform staff and users include:
• Comments attached to the data on the Hydrometric Archive, as to the data’s source • Similar data quality comments on the Climate Database (CLIDB) • Grades (quality codes) assigned to the data in accordance with the National Environmental
Monitoring Standards (NEMS) • Fields and/or codes on flow gauging files indicating which agency carried out the gauging.
4.14.4 Hydrological product computations and dissemination
See either the Tideda Manual or the Aquarius user guides for guidance on the processes and techniques available.
Dissemination of computed data summaries to users requires the same steps and provisos as for providing data. However if any interpretation or significant computation is involved, then the information should be provided in the form of a peer reviewed report (with the requirement for management approval on release).

Page 31 of 39
5 Challenges and learnings from achieving ISO 9001 Certification
A number of challenges were faced during the implementation of firstly, a quality system starting in 1987 and a subsequent objective, in 1990, to achieve ISO 9002 certification within 18 months. These are briefly described below, along with the lessons learnt.
• Coming as it did during a time of significant changes in the country’s economic situation and government agency reform, there were perceptions by some that it was too much, too soon.
• There was a perception that it was an unwarranted absorption of scarce resources that could otherwise be used to shore up reduced funding for the hydrological network
• Many staff did not initially accept that ISO 9002, which had the appearance of being designed for manufacturing enterprises, could be applied to an industry where the product was data. It took a reasonable amount of training and discussion before most people understood how the standard was being applied to their work. A summary of the standard in (hopefully) plain language as it applies to NIWA (its genesis is in section 3 of this document) was written to assist with this issue.
• The cost of having a certified programme gets questioned from time to time, at most levels of the organisation. The cost of not having the programme - cost, in other words, of not having assurance that the data are reliable - is difficult to define. One answer is that many of our clients, notably the energy companies, have their own certified quality programmes and it makes it much easier for them to engage us and to have conversations over data quality. It is now an expectation of the market that we are in.
• The development and subsequent maintenance of documentation absorbed significant resources. Initially, almost all documentation was paper-based (that was the era) but as email, a wide-area network and then an intranet became available, access and document control was simplified significantly by having almost every document electronic and available on the organisation’s intranet (including certain servers and a wiki) or specific folders with appropriate access.
• Staff involvement in process and document development provides ownership that enhances its adoption and usefulness. It continues to be an on-going challenge to encourage wide involvement; the remedy tends to be to pass out updating and improvement tasks as widely as possible.
• Internal (and external) audits were initially seen by a few people as intrusive and a signal that they were not trusted to carry out their work properly. Dealing with this was crucial with staff in 16 geographically spread offices that had enjoyed a degree of autonomy in the details of how their work was carried out. However their value was realised once people could see that follow-up actions (by themselves and also by others) could realise improvements.

Page 32 of 39
• External auditors tended to need some time to understand our business, and this led to some staff questioning their worth. Staff turnover at Telarc did not help; however we were generally impressed as to how quickly they could identify key issues, and this issue reduced over time.
• Encouraging people to document non-conformances has been an on-going challenge. Ensuring the culture has a “no-blame” to admitting to errors or finding root causes is very important. People are more inclined to call someone on the phone to discuss instrument or other issues than they are to document it enough for corrective action or improvements. Having a means of doing this via an issue-tracking application on the intranet has helped the communication and clearance rates. It has also made the process and outcomes more visible, which in turn have encouraged wider reporting.
During the development of the QMS, many staff had little appreciation of what their data were actually used for. Under pressure of reduced funding and competitive contracts for some work, it was important that they could communicate effectively with data users and network stakeholders, who were becoming even more interested in the “confident usability” of their data. Having documented standards and regular reporting on achievement of those standards gave staff the information and vocabulary to be able to effectively communicate on data quality issues.
Implementation of the quality management system has been very beneficial to the data gathering groups in NIWA, overall at little cost. However it is sometimes difficult to separate the benefits of the system from effects due to a simultaneous change in other components of the management system and new, more efficient, technologies. However the system has definitely led to an improvement in all metrics of data quality (timeliness, lost data, uncertainties, rating curve and flow gauging verification, etc.).

Page 33 of 39
6 Contact and access to documentation
This case study material provides examples of NIWA’s quality management system and documentation that is intended for internal use, and may not suit other organisations for a variety of reasons. For the purposes of making this document more readable, it has been shortened and some detail omitted. It is hoped that it may be useful to other NHSs as they consider how to develop and improve their own management systems.
It is recognised that most agencies will be significantly different in a number of areas, and we do not have the expectation that a somewhat “organic” management system can be copied from one agency to another. We also recognise that there is considerable merit in an organisation developing as much of its system with its own resources so that it will have the best enduring “fit” into its own unique culture.
Because of this, we are cautious about providing our full suite of documentation and methodologies, but will be open to providing advice and appropriate documents and other resources to our colleagues in agencies where we expect that they can benefit from them.
Information about NIWA and some information on our hydrometric systems are available on our website, at www.niwa.co.nz
The contact for specific information and advice can be obtained from
Charles Pearson,
Manager, Environmental Information,
NIWA,
P O Box 8602, Christchurch 8011
New Zealand

Page 34 of 39
7 References
ISO (International Standards Organization) (1983) ISO Standards Handbook 16. Measurement of liquid flow in open channels. ISO Central Secretariat, Geneva, Switzerland.
Pearson, C. P. (1998) Changes to New Zealand's national hydrometric network in the 1990s. Journal of Hydrology. (NZ) 37(1), 1-17.
Mosley, M. P., 1987; Marketing Hydrology. Journal of Hydrology (NZ) 26(2): 153 - 160
Mosley, M.P.: McKerchar, A.I. 1989; Quality assurance programme for hydrometric data in New Zealand. Hydrological Sciences Journal 34(2); 185-202.
Toebes, C.: 1963. Applied Hydrology, volumes 1 and 2. Technical Correspondence School, N.Z. Dept. of Education, Wellington, New Zealand.

Page 35 of 39
8 Appendix A: Examples of forms used
Equipment calibration form

Page 36 of 39
Internal audit - data processing practice
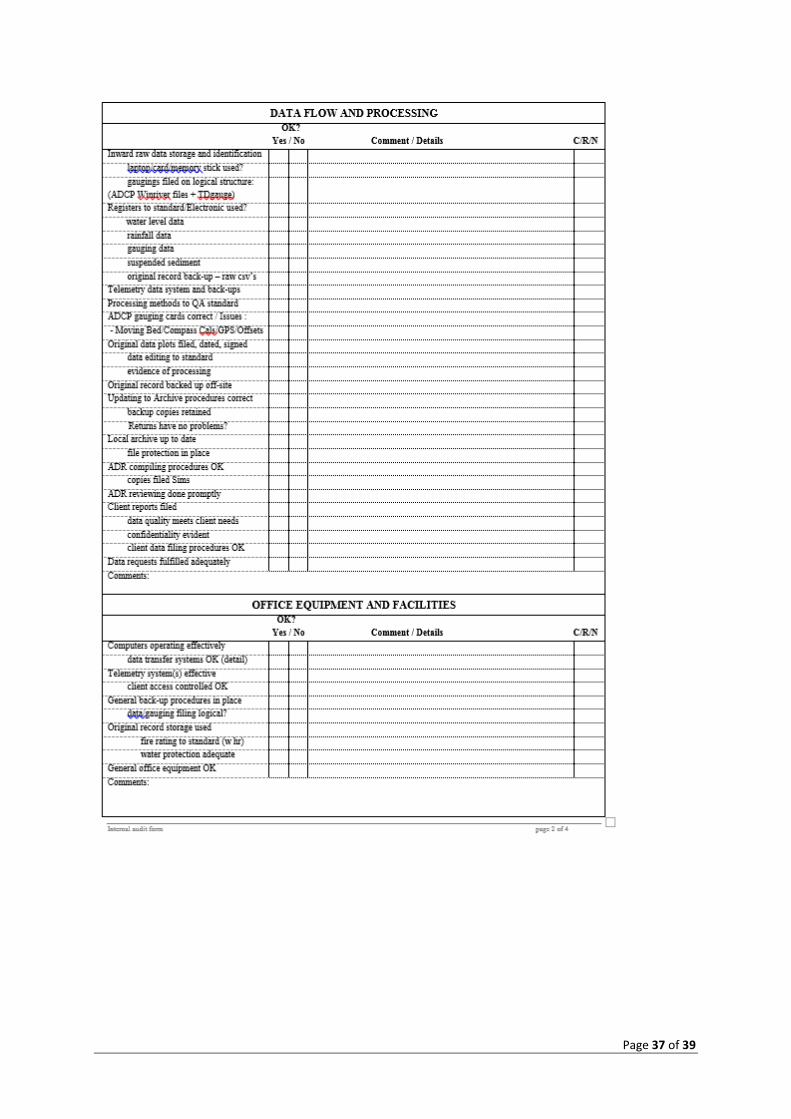
Page 37 of 39

Page 38 of 39

Page 39 of 39
Example of issue tracking using JIRA