Embed Size (px)
DESCRIPTION
case_1
Citation preview
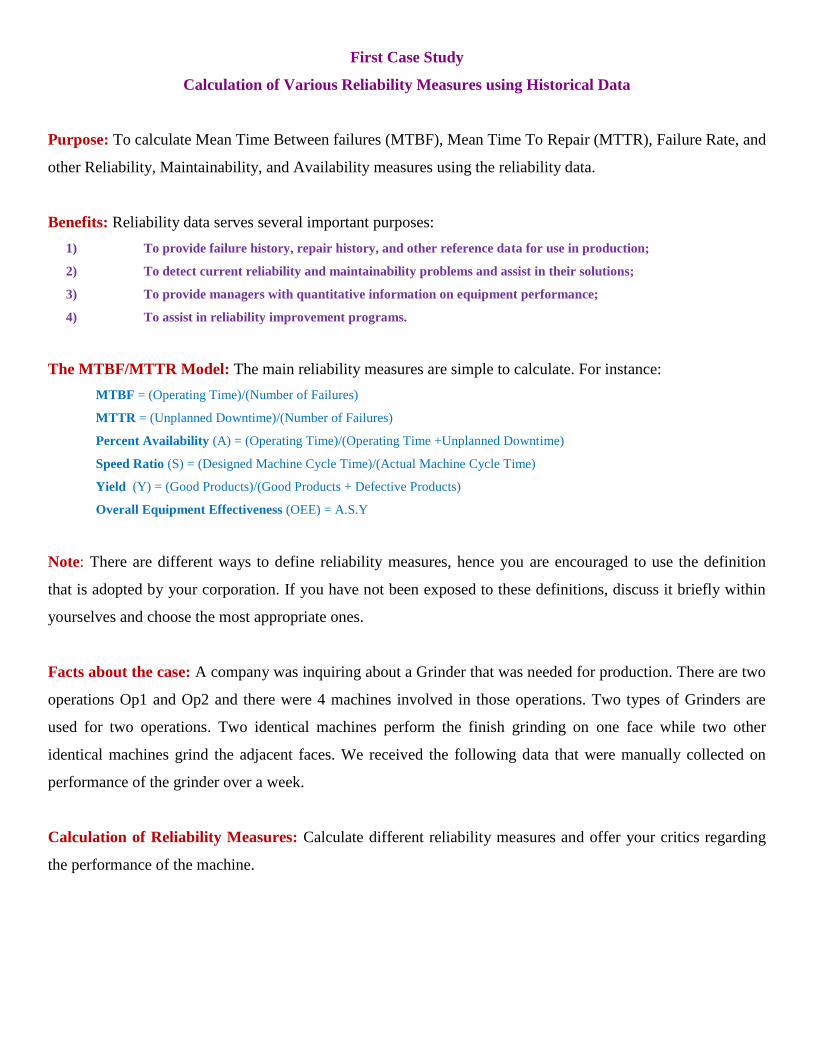
First Case Study
Calculation of Various Reliability Measures using Historical Data
Purpose: To calculate Mean Time Between failures (MTBF), Mean Time To Repair (MTTR), Failure Rate, and
other Reliability, Maintainability, and Availability measures using the reliability data.
Benefits: Reliability data serves several important purposes:
1) To provide failure history, repair history, and other reference data for use in production;
2) To detect current reliability and maintainability problems and assist in their solutions;
3) To provide managers with quantitative information on equipment performance;
4) To assist in reliability improvement programs.
The MTBF/MTTR Model: The main reliability measures are simple to calculate. For instance:
MTBF = (Operating Time)/(Number of Failures)
MTTR = (Unplanned Downtime)/(Number of Failures)
Percent Availability (A) = (Operating Time)/(Operating Time +Unplanned Downtime)
Speed Ratio (S) = (Designed Machine Cycle Time)/(Actual Machine Cycle Time)
Yield (Y) = (Good Products)/(Good Products + Defective Products)
Overall Equipment Effectiveness (OEE) = A.S.Y
Note: There are different ways to define reliability measures, hence you are encouraged to use the definition
that is adopted by your corporation. If you have not been exposed to these definitions, discuss it briefly within
yourselves and choose the most appropriate ones.
Facts about the case: A company was inquiring about a Grinder that was needed for production. There are two
operations Op1 and Op2 and there were 4 machines involved in those operations. Two types of Grinders are
used for two operations. Two identical machines perform the finish grinding on one face while two other
identical machines grind the adjacent faces. We received the following data that were manually collected on
performance of the grinder over a week.
Calculation of Reliability Measures: Calculate different reliability measures and offer your critics regarding
the performance of the machine.
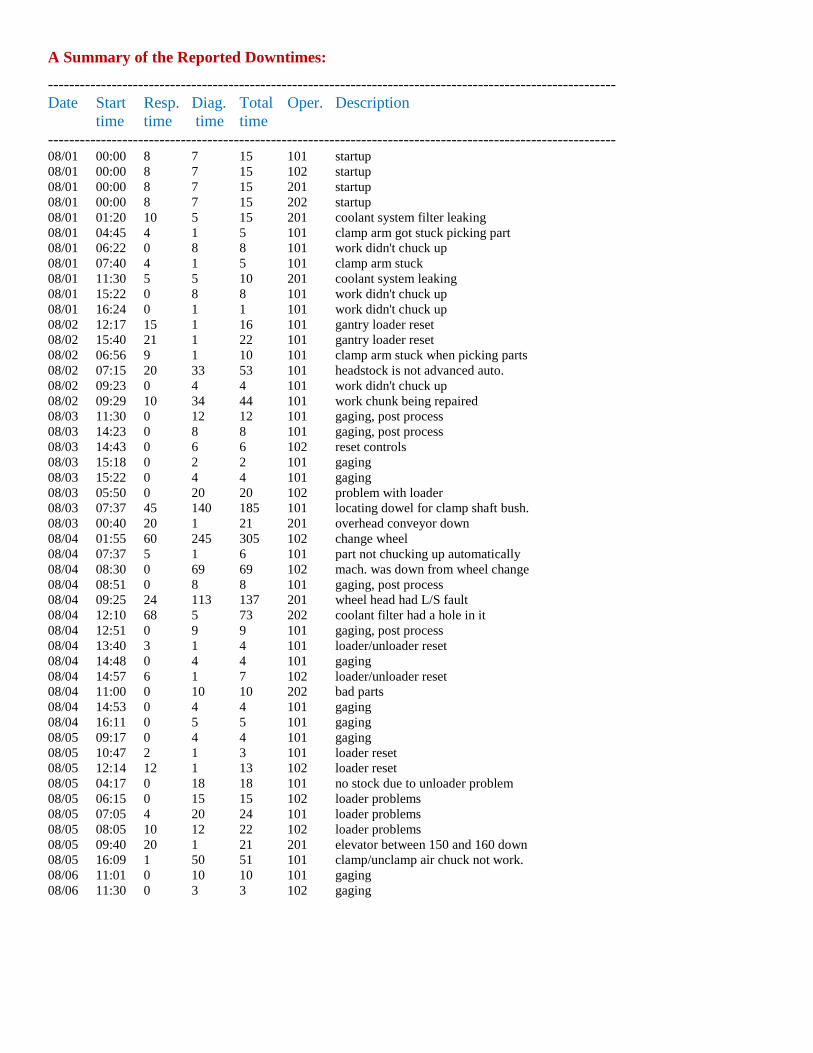
A Summary of the Reported Downtimes:
-----------------------------------------------------------------------------------------------------------
Date Start Resp. Diag. Total Oper. Description
time time time time
----------------------------------------------------------------------------------------------------------- 08/01 00:00 8 7 15 101 startup
08/01 00:00 8 7 15 102 startup
08/01 00:00 8 7 15 201 startup
08/01 00:00 8 7 15 202 startup
08/01 01:20 10 5 15 201 coolant system filter leaking
08/01 04:45 4 1 5 101 clamp arm got stuck picking part
08/01 06:22 0 8 8 101 work didn't chuck up
08/01 07:40 4 1 5 101 clamp arm stuck
08/01 11:30 5 5 10 201 coolant system leaking
08/01 15:22 0 8 8 101 work didn't chuck up
08/01 16:24 0 1 1 101 work didn't chuck up
08/02 12:17 15 1 16 101 gantry loader reset
08/02 15:40 21 1 22 101 gantry loader reset
08/02 06:56 9 1 10 101 clamp arm stuck when picking parts
08/02 07:15 20 33 53 101 headstock is not advanced auto.
08/02 09:23 0 4 4 101 work didn't chuck up
08/02 09:29 10 34 44 101 work chunk being repaired
08/03 11:30 0 12 12 101 gaging, post process
08/03 14:23 0 8 8 101 gaging, post process
08/03 14:43 0 6 6 102 reset controls
08/03 15:18 0 2 2 101 gaging
08/03 15:22 0 4 4 101 gaging
08/03 05:50 0 20 20 102 problem with loader
08/03 07:37 45 140 185 101 locating dowel for clamp shaft bush.
08/03 00:40 20 1 21 201 overhead conveyor down
08/04 01:55 60 245 305 102 change wheel
08/04 07:37 5 1 6 101 part not chucking up automatically
08/04 08:30 0 69 69 102 mach. was down from wheel change
08/04 08:51 0 8 8 101 gaging, post process
08/04 09:25 24 113 137 201 wheel head had L/S fault
08/04 12:10 68 5 73 202 coolant filter had a hole in it
08/04 12:51 0 9 9 101 gaging, post process
08/04 13:40 3 1 4 101 loader/unloader reset
08/04 14:48 0 4 4 101 gaging
08/04 14:57 6 1 7 102 loader/unloader reset
08/04 11:00 0 10 10 202 bad parts
08/04 14:53 0 4 4 101 gaging
08/04 16:11 0 5 5 101 gaging
08/05 09:17 0 4 4 101 gaging
08/05 10:47 2 1 3 101 loader reset
08/05 12:14 12 1 13 102 loader reset
08/05 04:17 0 18 18 101 no stock due to unloader problem
08/05 06:15 0 15 15 102 loader problems
08/05 07:05 4 20 24 101 loader problems
08/05 08:05 10 12 22 102 loader problems
08/05 09:40 20 1 21 201 elevator between 150 and 160 down
08/05 16:09 1 50 51 101 clamp/unclamp air chuck not work.
08/06 11:01 0 10 10 101 gaging
08/06 11:30 0 3 3 102 gaging

Second Case Study
Practice of Performing FMEA on a Product
This case study will be an open ended project in which you are asked to get into groups of 3 to 4 participants
and select one of the following components, subsystem, or system that your group is familiar with. Then
conduct a brainstorming session aimed at performing all aspects of FMEA on the selected part. Your team can
pick any of the following products for the purpose of conducting Design FMEA.
a) A coffee maker
b) A toaster
c) A cell phone
d) A headphone
e) A bicycle
Your product can be a cheap one with very simple and unsophisticated design or a fancy one with lots of
features, but your grade depends on the complexity of the design. If you prefer you can contact me with a
proposal as to the product of your choice, and upon my approval, you may proceed with FMEA of your own
product.
You are expected to provide me with:
1) A detailed FMEA analysis, covering as much of the steps as practically possible.
2) Some photos of the product showing major components
3) A list of all the pertinent components.
4) Summary of your recommendations.
The group is responsible for performing a detailed FMEA analysis for the part and presenting their findings
along with a description of the recommended actions to the class. The format of the report and the presentation
is as follows: 1) Each team will submit their findings in one report. The report should be typed or printed in a FMEA form.
2) A leader in each team will have 10 minutes to present the case and respond to the critics.
In what follows, few examples of FMEA is depicted.


Failure Mode and Effect Analysis
Page: 1
Date: 8 Nov 2014
Project: Simple Flashlight Example
Function/System: Flashlight
Phase/Mode: Normal Operation Reference Drawing:FL164578-1
Assembly Name: Flashlight Assembly RD: 1
Ref
DesName & Function FMI Failure Mode Local Effect Next Higher Effect
Sev
.End Effect
Detection Method
Compensating
Provisions
Remarks
Failure Cause RD Item Causing
1 Flashlight
- No Data
FAAA constant flashlight output 1 constant flashlight output Comp / Prov:
None
Det. Method:
None
Remarks:
None
Stuck closed 1A2 Switch
FAAB flashlight output dim 3 flashlight output dim Comp / Prov:
None
Det. Method:
None
Remarks:
None
dim light 1A1 Bulb
poor contact 1A3 Contact
low power 1A4 Battery
FAAC flashlight sometimes will
not turn on
3 flashlight sometimes will
not turn on
Comp / Prov:
None
Det. Method:
None
Remarks:
None
intermittent 1A2 Switch
intermittent 1A3 Contact
FAAD no flashlight output 2 no flashlight output Comp / Prov:
None
Det. Method:
None
Remarks:
None
no light 1A1 Bulb
Stuck open 1A2 Switch
no contact 1A3 Contact
no power 1A4 Battery
Page: 2
Date: 8 Nov 2014
Project: Simple Flashlight Example
Function/System: Flashlight
Phase/Mode: Normal Operation Reference Drawing:FL164578-1
Assembly Name: Flashlight Assembly RD: 1
Ref
DesName & Function FMI Failure Mode Local Effect Next Higher Effect
Sev
.End Effect
Detection Method
Compensating
Provisions
Remarks
Failure Cause RD Item Causing
1A1 Bulb
- Provides the light
source for the flashlight
FAAA dim light flashlight output dim 3 flashlight output dim Comp / Prov:
None
Det. Method:
None
Remarks:
None
FAAB no light no flashlight output 2 no flashlight output Comp / Prov:
None
Det. Method:
None
Remarks:
None
1A2 Switch
- Turns flashlight on or
off
FAAA intermittent flashlight sometimes will
not turn on
3 flashlight sometimes will
not turn on
Comp / Prov:
None
Det. Method:
None
Remarks:
None
FAAB Stuck closed constant flashlight output 1 constant flashlight output Comp / Prov:
None
Det. Method:
None
Remarks:
None
FAAC Stuck open no flashlight output 2 no flashlight output Comp / Prov:
None
Det. Method:
None
Remarks:
None
1A3 Contact
- No Data
FAAA intermittent flashlight sometimes will
not turn on
3 flashlight sometimes will
not turn on
Comp / Prov:
None
Det. Method:
None
Remarks:
None
FAAB no contact no flashlight output 2 no flashlight output Comp / Prov:
None
Det. Method:
None
Remarks:
None
FAAC poor contact flashlight output dim 3 flashlight output dim Comp / Prov:
None
Det. Method:
None
Remarks:
None
1A4 Battery
- Provides the power
source for the flashlight
FAAA low power flashlight output dim 3 flashlight output dim Comp / Prov:
None
Det. Method:
None
Remarks:
None
FAAB no power no flashlight output 2 no flashlight output Comp / Prov:
None
Det. Method:
None
Remarks:
None

Third Case Study: Application of Life Cycle Cost
Purpose: To calculate the life cycle cost (LCC) for two different proposals, and to show the impact of Mean
Time Between Failures (MTBF) and Mean Time To Repair (MTTR) on the overall cost of a piece of
equipment.
Benefits: The LCC Technique helps utilize manufacturing machinery characteristics in life cycle cost
comparisons. The "Guideline" showed that an additional initial cost could save greater amount of cost at the
operation and support stages of that machinery. In light of that issue, LCC goals are to:
1) Consider the big picture: "Pay me now or pay me later",
2) Highlight the impacts of R&M on support cost,
3) Low purchase price does not always imply best deal,
4) More expenditure does not always imply more reliability,
5) Helps consider the competing suppliers on an equal basis.
The LCC Model: LCC Cost = Acquisition Cost + Ownership Cost
where:
Acquisition Costs = Purchase Price + Installation Cost + Training/ Documentation Cost + Transportation Cost
and
Ownership Costs = Operations Costs + Maintenance Costs + Future Cost of Money
Each of these Costs may consist\ of more basic costs. For instance:
Purchase Price = Cost of Design + Cost of Build + Acceptance Testing + Initial Spares;
Operations Costs = Machine Operators + Inventory Management + Consumable/ Expendable;
Maintenance Costs = Preventive Maintenance + Predictive M. + Corrective (Unscheduled M.).
Each of those Costs may consist of more detailed costs. For instance:
Consumable Costs = Tooling Cost + Lubricant Cost + Coolant Cost + Machine Electricity Cost
Preventive/Predictive Maintenance Costs =
Maintenance Labor Cost + Materials Cost + Logistics Support Cost
Corrective Maintenance =
Maintenance Labor Cost + Cost of Failed items/Spare + Logistics Support Cost
+ Lost Productivity Cost

Facts About The Case: A company was in the process of ordering a Grinder, described in the previous case
study. The division had two sources, hereon named Source #1 and Source #2. A study was initiated to
determine which source was offering a better option for purchase .
The following requirements were imposed by the process and had to be considered in our analysis:
Production machinery life 10 years
Production quantity required 1,400,000 parts/year
Machinery operating hours per month 532 hours
Estimated maintenance cost per hour 34 $/hr
Inventory carrying cost (in percent per year) 17%
Cost of crisis downtime per hour 200 $/hr
Floor and foundation cost per square foot $100 $/SqFt
Electricity cost per KWHr 0.0301 $/KWHr
Shipping cost per pound 0.32 $/Lbs
Initial dollar year of study 1995
Annual Inflation ratio 2%
Annual Interest rate of money 8%
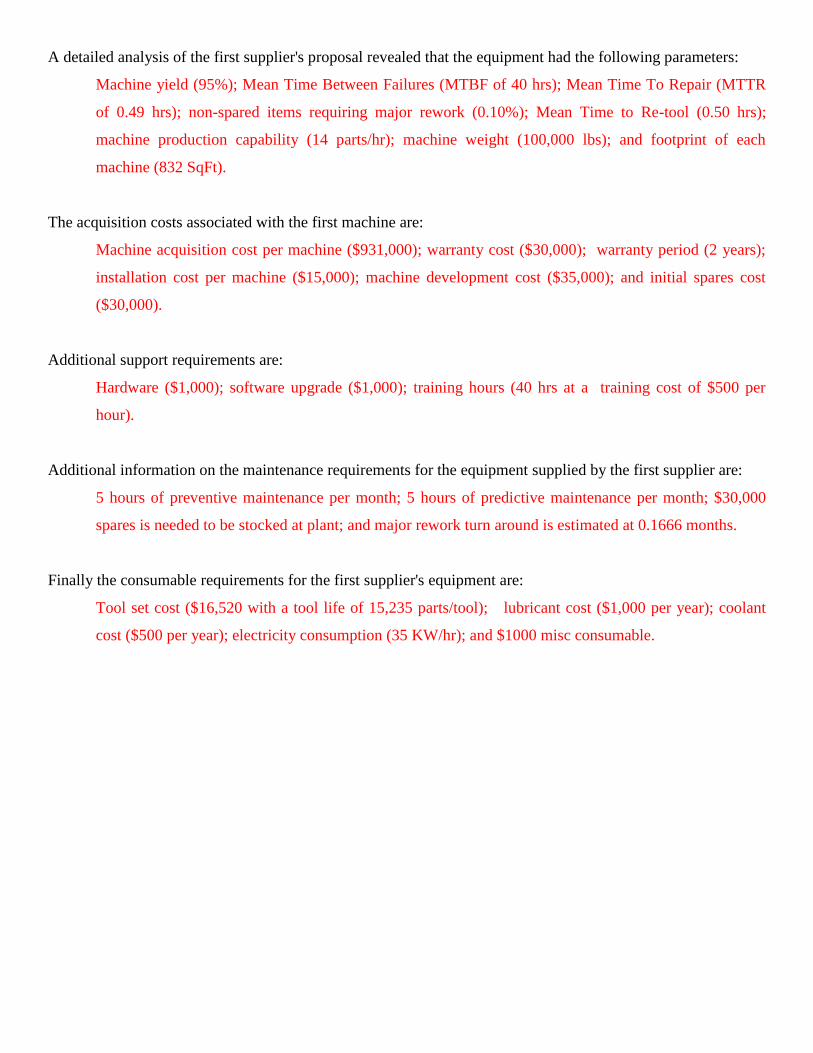
A detailed analysis of the first supplier's proposal revealed that the equipment had the following parameters:
Machine yield (95%); Mean Time Between Failures (MTBF of 40 hrs); Mean Time To Repair (MTTR
of 0.49 hrs); non-spared items requiring major rework (0.10%); Mean Time to Re-tool (0.50 hrs);
machine production capability (14 parts/hr); machine weight (100,000 lbs); and footprint of each
machine (832 SqFt).
The acquisition costs associated with the first machine are:
Machine acquisition cost per machine ($931,000); warranty cost ($30,000); warranty period (2 years);
installation cost per machine ($15,000); machine development cost ($35,000); and initial spares cost
($30,000).
Additional support requirements are:
Hardware ($1,000); software upgrade ($1,000); training hours (40 hrs at a training cost of $500 per
hour).
Additional information on the maintenance requirements for the equipment supplied by the first supplier are:
5 hours of preventive maintenance per month; 5 hours of predictive maintenance per month; $30,000
spares is needed to be stocked at plant; and major rework turn around is estimated at 0.1666 months.
Finally the consumable requirements for the first supplier's equipment are:
Tool set cost ($16,520 with a tool life of 15,235 parts/tool); lubricant cost ($1,000 per year); coolant
cost ($500 per year); electricity consumption (35 KW/hr); and $1000 misc consumable.

Similar analysis of the second supplier's proposal showed the following specification:
Machine yield (90%); MTBF of 100 hrs; MTTR of 0.59 hrs; non-spared items requiring major rework
(0.10%); Mean Time to Re-tool (0.50 hrs); machine production capability (12.2 parts/hr); machine
weight (100,000 lbs); and footprint of each machine (832 SqFt).
The acquisition costs associated with the second machine are:
Machine acquisition cost per machine ($710,000); warranty cost ($20,000); warranty period (2 years);
installation cost per machine ($10,000); machine development cost ($20,000); and initial spares cost
($40,000).
Additional support requirements are:
Hardware ($1,000); software upgrade ($1,000); training hours (40 hrs at a training cost of $600 per
hour).
Additional information on the maintenance requirements for the equipment supplied by the second supplier are:
5 hours of preventive maintenance per month; 5 hours of predictive maintenance per month; $40,000
spares is needed to be stocked at plant; and major rework turn around is estimated at 1 months.
Finally the consumable requirements for the second supplier's equipment are:
Tool set cost ($7,090 with a tool life of 5,454 parts/tool); lubricant cost ($1,000 per year); coolant cost
($500 per year); electricity consumption (25 KW/hr); and $1000 misc consumable.
Selection Process: Select the better proposal. Your decision should be based on an overall cost
analysis of the two proposals, and should show the difference in the overall cost of the two
proposals over the life of the equipment.
Hint: As you perhaps know, the only costs that may affect your decisions are the ones that are different. Hence,
for sake of time, you are encouraged to focus on the differences in cost between competing suppliers and ignore
those components that are identical.

Fourth Case Study: Application of Life Testing
Life Testing of Valves for two Suppliers
Date: May 11, 2015
We performed a life test on 40 vlaves that were provided to us from a local company. 20 of these valves were manufactured
by the company, here called Supplier A, and the other 20 were provided by the competition, here called Supplier B.
You are asked to perform a detailed analysis of the data and provide a comprehensive report.
Valve number refers to the location of the valve on the test equipment. There were four rows (A, B, C, D) of testing,
each equiped with five columns (1-5) of air nozzles, on either side (Right and Left).
Current Cycle Count: 50,000,000
Valve
Number
Count
when
Turned On
Count when
Turned Off
Under Test
Cumulative
Cycles of
Operation
Test
Complete
Total Cycles
to Failure
Valve
ManufacturerApparent Failure Mode
A1L 0 28,263,000 28,263,000 Supplier A Failure to shift, excessive leakage
A1R 0 10,614,677 10,614,677 Supplier B Excessive leakage
A2L 0 10,614,677 10,614,677 Supplier B Excessive leakage
A2R 0 18,568,000 18,568,000 Supplier A Excessive leakage
A3L 0 9,235,045 9,235,045 Supplier B Failure to shift
A3R 0 34,719,000 34,719,000 Supplier A Excessive leakage
A4L 0 2,224,025 2,224,025 Supplier B Failure to shift
A4R 0 24,890,000 24,890,000 Supplier A Excessive leakage
A5L 0 5,314,000 5,314,000 Supplier A Excessive leakage
A5R 0 2,224,025 2,224,025 Supplier B Failure to shift
B1L 7,583,315 42,416,685 Supplier A
B1R 9,430,000 10,614,677 1,184,677 Supplier B Excessive leakage, leakage out body of valve
B2L 10,614,677 34,719,000 24,104,323 Supplier A Leakage out body of valve
B2R 9,235,045 19,796,000 10,560,955 Supplier B Failure to shift
B3L 10,614,677 13,604,591 2,989,914 Supplier A Excessive leakage
B3R 2,774,000 9,430,000 6,656,000 Supplier B Failure to shift
B4L 2,774,000 13,181,000 10,407,000 Supplier B Leakage out body of valve, failure to shift
B4R 2,774,000 2,774,000 0 Supplier A Failure to shift
B5L 10,614,677 13,935,400 3,320,723 Supplier B Failure to shift
B5R 13,604,000 37,328,000 23,724,000 Supplier A Excessive leakage
C1L 13,635,250 17,640,000 4,004,750 Supplier B Failure to shift
C1R 13,935,400 16,603,000 2,667,600 Supplier A Excessive leakage
C2L 16,674,000 20,301,000 3,627,000 Supplier A Excessive leakage
C2R 18,568,000 30,761,000 12,193,000 Supplier B Failure to shift, excessive leakage
C3L 18,568,000 20,301,000 1,733,000 Supplier A Excessive leakage
C3R 19,796,000 23,181,000 3,385,000 Supplier B Failure to shift
C4L 20,378,000 20,378,000 0 Supplier A Excessive leakage at startup
C4R 20,378,000 22,729,000 2,351,000 Supplier B Excessive leakage
C5L 20,378,000 29,622,000 Supplier A
C5R 23,460,000 24,890,000 1,430,000 Supplier B Excessive leakage
D1L 23,460,000 40,830,000 17,370,000 Supplier B Excessive leakage
D1R 25,317,000 45,291,000 19,974,000 Supplier A Excessive leakage
D2L 25,738,000 40,128,000 14,390,000 Supplier B Failure to shift
D2R 25,317,000 25,707,000 390,000 Supplier A Excessive leakage
D3L 30,826,000 19,174,000 Supplier A
D3R 29,087,000 37,918,000 8,831,000 Supplier B Leakage out of valve body
D4L 34,719,000 49,201,000 14,482,000 Supplier B Excessive leakage
D4R 34,719,000 34,719,000 0 Supplier A Excessive leakage before startup
D5L 34,719,000 15,281,000 Supplier B
D5R 37,413,000 46,534,000 9,121,000 Supplier A Excessive leakage