Embed Size (px)
Citation preview

CASEIN-PHENOLIC INTERACTIONS
IN FOOD
By
Shuting, Zhou
Department of Food Science and Agricultural Chemistry
Macdonald Campus, McGill University
Montreal, Quebec
A Thesis submitted to McGill University in partial fulfillment of
the requirements of the degree of Master of Science

I
ABSTRACT
Protein-phenolic interactions are common in foods with reported effects on
nutritional and functional properties of foods. The objectives of this research were to
investigate the casein-phenolic acid interactions in a model system and in chocolate as
a processed food product. Casein-phenolic acid interactions were induced by heat
incubation of casein with protocatechuic acid or p-coumaric acid at 55 ℃ (pH 7, 2 h);
caseins were isolated from milk chocolate and white chocolate by precipitating
caseins at its isoelectric point (pH 4.6). Casein-phenolic complexes were identified
using polyacrylamide gel electrophoresis (Native- and SDS-PAGE) and
reversed-phase high performance liquid chromatography (RP-HPLC). Degree of
hydrolysis of casein-phenolic complexes was investigated using tryptic hydrolysis;
sodium dodecyl sulfate gel electrophoresis (SDS-PAGE) and reversed-phase high
performance liquid chromatography (RP-HPLC) were used to identify the
hydrolysates of casein-phenolic complexes.
Total phenolic contents of original and defatted milk chocolate and casein
isolated from milk chocolate (1.905, 1.644 and 1.018 mg/g respectively) were higher
than those of original and defatted white chocolate and casein isolated from white
chocolate (1.678, 0.723 and 0.000 mg/g respectively) respectively. Native- and
SDS-PAGE results revealed that casein-phenolic interactions were induced by heat
incubation and occurred during the processing of milk chocolate; minor changes in the
migration of casein fractions and aggregation of casein subunits were observed after
heat incubation of casein with protocatechuic acid and in casein isolated from milk

II
chocolate; there is no observed change with Native- and SDS-PAGE
electropherograms after casein incubated with p-coumaric acid and in casein isolated
from white chocolate. In vitro hydrolysis of casein control (C), casein-protocatechuic
acid complex (CPA), casein-p-coumaric acid complex (CCA), casein isolated from
milk chocolate (CMC) and casein isolated from white chocolate (CWC) by trypsin
showed degree of hydrolysis of 19.3 %, 18.6 %, 17.7 %, 10.4 % and 17.8 %
respectively; SDS-PAGE revealed that the three major casein fractions α-, β- and
κ-caseins in casein control, casein-protocatechuic acid complex, casein-p-coumaric
acid complex and casein isolated from milk chocolate and white chocolate were
hydrolyzed. Both protocatechuic acid and p-coumaric acid affected the peptide
profiles of casein hydrolysates; the peptide profile of casein isolated from milk
chocolate was affected by phenolic compounds.

III
RÉSUMÉ
Les interactions protéine-phénols sont courantes dans les aliments. Les études
rapportent que ces interactions affectent les propriétés nutritionnelles et fonctionnelles
des aliments. Les objectifs de cette recherche étaient d'étudier les interactions
caséine-acides phénols dans un système modèle et dans un produit transformé à base
de chocolat. Les interactions caséine-acides phénols ont été induites par la chaleur
suite à une incubation de la caséine avec de l'acide protocatéchique ou de l'acide
p-coumarique à 55 ℃ (pH 7, 2 h); les caséines ont été isolés du chocolat au lait et
chocolat blanc en précipitant les caséines à son point isoélectrique (pH 4,6). Les
complexes à base de caséine-phénolique ont été identifiés par électrophorèse en gel de
polyacrylamide (non dénaturante et SDS-PAGE) et par la chromatographie en phase
liquide à haute performance en phase inversée (CLHP-PI). Le degré d'hydrolyse des
complexes caséine-phénoliques a été étudié par hydrolyse tryptique; l'électrophorèse
en gel de polyacrylamide contenant du laurylsulfate de sodium (SDS-PAGE) et la
chromatographie en phase liquide à haute performance en phase inversée (CLHP-PI)
ont servi à identifier les hydrolysats des complexes à base de caséine-phénolique.
Le contenu en phénols totaux du chocolat au lait d'origine et sans gras et de la
caséine isolée de chocolat au lait (1,905, 1,644 et 1,018 mg / g respectivement) était
plus élevé que celui du chocolat blanc original et sans gras et de la caséine isolée de
chocolat blanc (1.678, 0.723 et 0,000 mg / g respectivement), respectivement. Les
résultats de la chromatographie non dénaturante et SDS-PAGE ont révélé que les
interactions caséine-phénols ont été induites par une incubation à la chaleur et sont

IV
survenues pendant le procédé du chocolat au lait; des changements mineurs dans la
migration des fractions de caséine et de l'agrégation de sous-unités de caséine ont été
observés après une incubation à la chaleur de la caséine avec de l'acide
protocatéchique et dans la caséine isolée de chocolat au lait; il n'y a pas de
changement observé avec les électrophérogrammes non dénaturante et SDS-PAGE
après que la caséine ait été incubée avec de l'acide p-coumarique ni avec la caséine
isolée à partir de chocolat blanc. L’hydrolyse in vitro de la caséine de contrôle (C), du
complexe caséine-acide protocatéchique (CPA), du complexe caséine-acide
p-coumarique (CCA), de la caséine isolée du chocolat au lait (CMC) et de la caséine
isolée du chocolat blanc (CWC) par la trypsine ont montré un degré d'hydrolyse de
19,3%, 18,6%, 17,7%, 10,4% et 17,8% respectivement; SDS-PAGE a révélé que les
trois principales fractions de caséine α-, β- et κ-caséine dans la caséine contrôle, le
complexe caséine-acide protocatéchique, le complexe caséine-acide p-coumarique et
la caséine isolée du chocolat au lait et du chocolat blanc ont été hydrolysées. L'acide
protocatéchique et l'acide p-coumarique ont affecté le profil en peptides de la caséine;
le profil en peptides de la caséine isolée de chocolat au lait a été affecté par les
composés phénoliques.

V
ACKNOWLEDGEMENTS
Firstly, I would like to show my sincere gratitude to my great supervisor, Dr.
Inteaz Alli, for giving me this great opportunity to study under him and his instructive
guidance, encouragement and support on my thesis. Without his patience and
professional assistance, this work could not have been accomplished smoothly. I really
appreciate the time he spent with me sharing his knowledge, experience and treasure
the invaluable friendship between us.
I would like to thank Dr. Frederick R. Van de Voort for being a great advisor in
the first semester and offering countless help and suggestions.
I would like to thank Dr. Selim Kermasha and Dr. Salwa Karboune for kindly
allowing me to use their laboratory facilities and helpful advice for my studies.
I would like to thank our department secretaries, Leslie Ann LaDuke and Diane
Chan-Hum, and laboratory coordinator, Eby Noroozi for their friendship and support.
I would like to thank my colleagues, Dr. Anwer Ayad, Lotthida Inthanavong,
Jessica Couto, Soo Seo, Feng Tian and Prabhjot Singh for their friendship. And a
special thank to Yu-Wei Chang, my dear friend and colleague, for being a great mentor
during my studies.
Words will never be enough to thank my beloved parents for making my dream
of studying abroad come true. Without their moral and financial support, I will not be
able to study in one of the greatest universities in the world, McGill University. I
sincerely appreciate their love and encouragement. Thank you very much, my dear
dad and mom.

VI
TABLE OF CONTENTS
Page
ABSTRACT I
RÉSUMÉ III
ACKNOWLEDGEMENTS V
TABLE OF CONTENTS VI
LIST OF TABLES XI
LIST OF FIGURES XII
LIST OF ABBREVIATIONS XV
CHAPTER 1
INTRODUCTION 1
CHAPTER 2
LITERATURE REVIEW
2.1 Protein-Phenolic Interactions 3
2.1.1 Naturally Occurring Protein-Phenolic Interactions 3
2.1.2 Thermally Induced Protein-Phenolic Interactions 4
2.2 Mechanism of Protein-Phenolic Interactions 5
2.2.1 Protein-Phenolic Complexation and Precipitation 5
2.2.2 Crosslinking of Protein and Phenolic compounds 6
2.3 Conditions that Affect Protein-Phenolic Interactions 11
2.3.1 Temperature 11
2.3.2 pH 11
2.3.3 Types of Proteins 13
2.3.4 Protein Concentration 13

VII
2.3.5 Types of Phenolic Compounds 14
2.3.6 Other Factors 14
2.4 Effect of Protein-Phenolic Interactions on Properties of Protein 15
2.4.1 Effect on Protein Structure 15
2.4.2 Effect on Thermal Stability of Proteins 16
2.4.3 Effect on Solubility of Proteins 16
2.4.4 Effect on Functional Properties of Proteins 17
2.4.5 Effect on Nutritional Properties of Proteins 17
2.4.6 Effect on Protein Hydrolysis 18
2.5 Food Proteins 19
2.5.1 Casein 19
2.6 Phenolic Compounds 20
2.6.1 Phenolic Compounds in Cocoa Bean 21
2.6.2 Protocatechuic Acid and p-Coumaric Acid 22
CHAPTER 3
FORMATION AND IDENTIFICATION OF CASEIN-PHENOLIC COMPLEX
3.1 Justification 24
3.2 Materials and Methods 25
3.2.1 Materials 25
3.2.2 Induction of Casein-Phenolic Interactions 25
3.2.2.1 Preparation of Casein and Phenolic Solutions 25
3.2.2.2 Preparation of Solutions of Casein-Phenolic Interactions 25
3.2.3 PolyAcrylamide Gel Electrophoresis (PAGE) 28
3.2.3.1 Native-PAGE 28
3.2.3.2 Sodium Dodecyl Sulfate-PAGE (SDS-PAGE) 29
3.2.4 Reversed Phase-High Performance Liquid Chromatography (RP-HPLC) 30
3.3 Results and Discussion 31
3.3.1 PAGE Identification of Native Caseins 31

VIII
3.3.1.1 Native Polyacrylamide Gel Electrophoresis (Native-PAGE) 31
3.3.1.2 Sodium Dodecyl Sulfate Polyacrylamide Gel
Electrophoresis (SDS-PAGE) 33
3.3.2 Reversed Phase-High Performance Liquid Chromatography
(RP-HPLC) Identification of Native Caseins 37
3.4 Conclusion 40
CHAPTER 4
TRYPTIC HYDROLYSIS OF CASEIN-PHENOLIC COMPLEXES
4.1 Justification 41
4.2 Materials and Methods 42
4.2.1 Materials 42
4.2.2 Tryptic Hydrolysis of Casein-Phenolic Complexes 42
4.2.3 Determination of Degree of Hydrolysis 42
4.2.4 SDS-PAGE of Hydrolysates of Casein-Phenolic Complexes 43
4.2.5 RP-HPLC 44
4.3 Results and Discussion 44
4.3.1 Degree of Hydrolysis 44
4.3.2 Electrophoresis of Casein Hydrolysates 45
4.3.3 RP-HPLC of Casein Hydrolysates 48
4.4 Conclusion 49
CHAPTER 5
INVESTIGATION OF CASEIN-PHENOLIC INTERACTIONS IN
CHOCOLATE
5.1 Justification 51
5.2 Materials and Methods 52

IX
5.2.1 Materials 52
5.2.2 Defatting of Chocolate 52
5.2.3 Casein Extraction from Chocolate 52
5.2.4 Determination of Total Phenolic Content 53
5.2.4.1 Extractioin of Phenolic Compounds 53
5.2.4.2 Determination of Total Phenolic Content 53
5.2.4.3 Reversed Phase-High Performance Liquid Chromatography
(RP-HPLC) 53
5.2.5 Identification of Caseins Isolated from Chocolate Samples 54
5.2.5.1 Native- and Sodium Dodecyl Sulphate-Polyacrylamide
Gel Electrophoresis (Native- and SDS-PAGE) 54
5.2.5.2 Reversed Phase-High Performance Liquid Chromatography
(RP-HPLC) 54
5.2.6 Tryptic Hydrolysis of Caseins Isolated from Chocolate Samples 54
5.2.6.1 Tryptic Hydrolysis 54
5.2.6.2 Determination of Degree of Hydrolysis 55
5.2.6.3 SDS-PAGE Identification of Hydrolysates of Caseins
Isolated from Chocolate 55
5.2.6.4 RP-HPLC 55
5.3 Results and Discussion 55
5.3.1 Total Phenolic Contents of Chocolate and Extracted Caseins 55
5.3.2 RP-HPLC of Phenolic Compounds 57
5.3.3 Identification of Caseins Isolated from Chocolate 59
5.3.3.1 Native-Polyacrylamide Gel Electrophoresis (Native-PAGE) 59
5.3.3.2 Sodium Dodecyl Sulphate-Polyacrylamide Gel
Electrophoresis (SDS-PAGE) 61
5.3.3.3 Reversed Phase-High Performance Liquid Chromatography
(RP-HPLC) 63
5.3.4 Biological Properties of Caseins Isolated from Chocolate 65
5.3.4.1 Degree of Hydrolysis 65

X
5.3.4.2 SDS-PAGE Identification of Hydrolysates of Caseins
Isolated from Chocolate 67
5.3.4.3 RP-HPLC 69
5.4 Conclusion 69
CHAPTER 6
GENERAL CONCLUSIONS
6.1 Conclusions 71
REFERENCES 73
XI
LIST OF TABLES
Table 3.1: Migration distance (Native-PAGE) of casein control
(C),casein-protocatechuic acid complex (CPA) and
casein-p-coumaric acid complex (CCA) 33
Table 3.2: The molecular weights of casein subunits of casein control
(C), casein-protocatechuic acid complex (CPA) and
casein-p-coumaric acid complex (CCA) estimated by
SDS-PAGE 36
Table 5.1: Total phenolic content of chocolate and extracted caseins 56
Table 5.2: Migration distance (Native-PAGE) of casein standard
(CSTD), casein control (C), casein isolated from milk
chocolate (CMC) and casein isolated from white chocolate
(CWC) 61

XII
LIST OF FIGURES
CHAPTER 2
Figure 2.1: An example of a tannin molecule 4
Figure 2.2: Cross-linking mechanism of the protein-phenolic interactions
at different ratios 8
Figure 2.3: Three phases in the cross-linking mechanism of the protein-
phenolic interaction 9
Figure 2.4: Mechanisms of protein-phenolic interaction 10
Figure 2.5: Molecular structure of protocatechuic acid 22
Figure 2.6: Molecular structure of p-coumaric acid 23
CHAPTER 3
Figure 3.1: Scheme for preparation of casein-phenolic complexes 27
Figure 3.2: 8% Native-PAGE electropherogram of caseins incubated at
55 ℃ (pH 7, 2 h). STD: Standard protein markers; (1) C:
casein control (incubated without phenolic); (2) CPA:
casein-protocatechuic acid complex; (3) CCA: casein-p-
coumaric acid complex; (4) PA: protocatechuic acid control
(incubated without casein); (5) CA: p-coumaric acid control
(incubated without casein) 32
Figure 3.3: 12.5% SDS-PAGE electropherogram of casein standards.
STD:Standard protein markers; (1) casein standard (no
incubation); (2) casein control (incubated without phenolic);
(3) α-casein standard; (4) β-casein standard; (5) κ-casein
standard; (6) casein standard (mixture of α-, β- and κ-casein
standards) 35
Figure 3.4: 12.5% SDS-PAGE electropherogram of caseins incubated at
55 ℃ (pH 7, 2 h). STD: Standard protein markers; (1) C:
casein control (incubated without phenolic); (2) CPA:
casein-protocatechuic acid complex; (3) CCA: casein-p-
coumaric acid complex; (4) PA: protocatechuic acid control
(incubated without casein); (5) CA: p-coumaric acid control
(incubated without casein) 36

XIII
Figure 3.5: RP-HPLC chromatograms of (A) casein standard (no
incubation), (B) casein control (incubated without phenolic).
1: κ-casein, 2: α-casein, 3: β-casein 38
Figure 3.6: RP-HPLC chromatograms of (A) casein-protocatechuic acid
complex, 1: protocatechuic acid, 2: casein; (B) casein-p-
coumaric acid complex, 1: p-coumaric acid, 2: α-casein, 3: β-
casein 39
CHAPTER 4
Figure 4.1: Degree of hydrolysis of (A) casein control, (B) casein-
protocatechuic acid complex and (C) casein-p-coumaric acid
complex 46
Figure 4.2: 12.5% SDS-PAGE electropherogram of caseins incubated at
55 ℃ (pH 7, 2 h) and casein hydrolysates. STD: Standard
protein markers; (1) CSTD: casein standard (no incubation);
(2) C: casein control (incubated without phenolic); (3) CH:
hydrolysate of casein control; (4) CPA: casein-protocatechuic
acid; (5) CPAH: hydrolysate of casein-protocatechuic acid
complex; (6) CCA: casein-p-coumaric acid; (7) CCAH:
hydrolysate of casein-p-coumaric acid complex; (8) trypsin 47
Figure 4.3: RP-HPLC chromatograms of (A) CH: hydrolysate of casein
control, (B) CPAH: hydrolysate of casein-protocatechuic acid
complex and (C) CCAH: hydrolysate of casein-p-coumaric
acid complex. 51
CHAPTER 5
Figure 5.1: RP-HPLC chromatogram of mixture of phenolic compound
standards; 1: protocatechuic acid; 2: gallic acid; 3: caffeic
acid; 4: p-coumaric acid; 5: 4-hydroxybenzoic acid; 6:
syringic acid; 7: cinnamic acid 58
Figure 5.2: RP-HPLC chromatogram of phenolic compounds of (A)
original milk chocolate, (B) defatted milk chocolate and (C)
casein isolated from milk chocolate 58
Figure 5.3: RP-HPLC chromatogram of phenolic compounds of (A)
original white chocolate, (B) defatted white chocolate 58
Figure 5.4: 8% Native-PAGE electropherogram of caseins isolated from

XIV
milk chocolate and white chocolate. STD: Standard protein
markers; (1) CSTD: casein standard (no incubation); (2) C:
casein control (incubated without phenolic); (3) CMC: casein
isolated from milk chocolate; (4) CWC: casein isolated from
white chocolate 60
Figure 5.5: 12.5% SDS-PAGE electropherogram of caseins isolated
from milk chocolate and white chocolate. STD: Standard
protein markers; (1) CSTD: casein standard (no incubation);
(2) C: casein control (incubated without phenolic); (3) CWC:
casein isolated from white chocolate; (4) CMC: casein
isolated from milk chocolate 62
Figure 5.6: RP-HPLC chromatograms of (A) casein control, 1: κ-casein,
2: α-casein, 3: β-casein; (B) casein isolated from milk
chocolate, 1: κ-casein, 2: α-casein, 3: β-casein; (C) casein
isolated from white chocolate, 1: κ-casein, 2: β-casein 64
Figure 5.7: Degree of hydrolysis of (A) casein control, (B) casein
isolated from milk chocolate and (C) casein isolated from
white chocolate 66
Figure 5.8: 12.5% SDS-PAGE electropherogram of caseins isolated from
chocolate and its hydrolysates. STD: Standard protein
markers; (1) CSTD: casein standard (no incubation); (2) C:
casein control (incubated without phenolic); (3) CH:
hydrolysate of casein control; (4) CMC: casein isolated from
milk chocolate; (5) CMCH: hydrolysate of casein isolated
from milk chocolate; (6) CWC: casein isolated from white
chocolate; (7) CWCH: hydrolysate of casein isolated from
white chocolate 68
Figure 5.9: RP-HPLC chromatogram of (A) hydrolysate of casein control,
(B) hydrolysate of casein isolated from milk chocolate and
(C) hydrolysate of casein isolated from white chocolate 70
XV
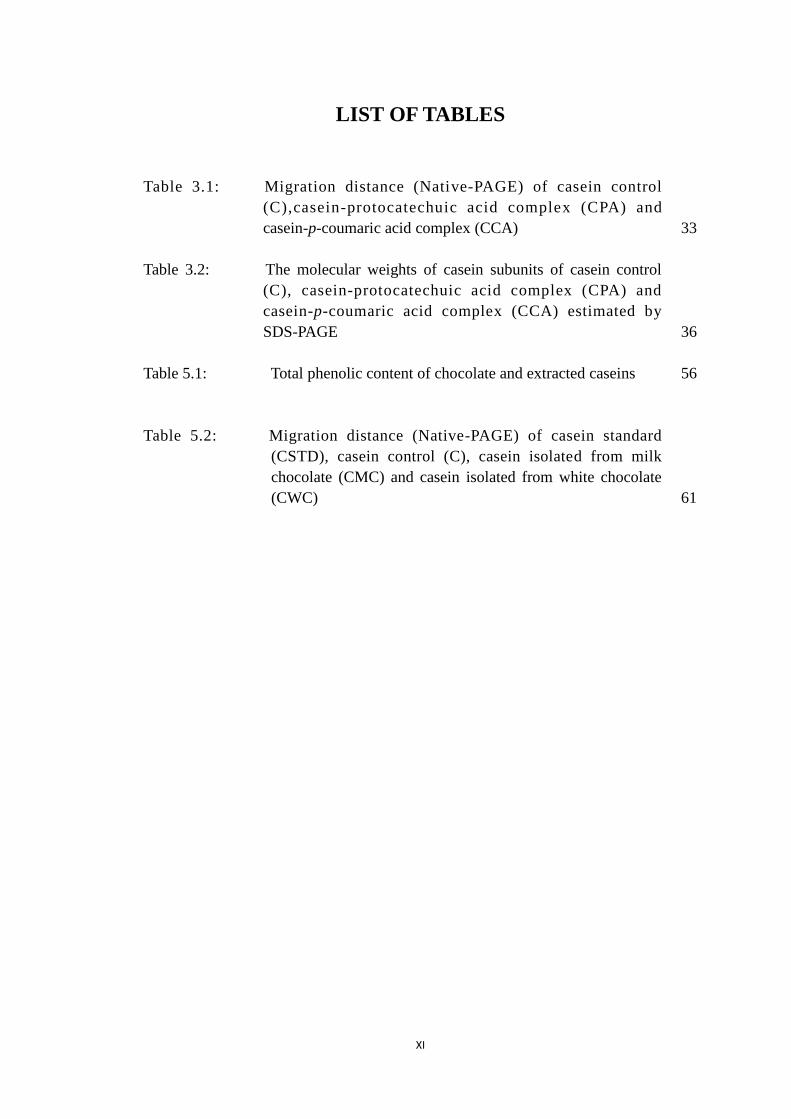
LIST OF ABBREVIATIONS
C
CA
CH
Casein Control
p-Coumaric Acid Control
Hydrolysate of Casein Control
CSTD
CCA
CCAH
CMC
CMCH
CPA
CPAH
CWC
CWCH
Da
DH
kDa
MW
PA
PAGE
RP-HPLC
Rt
SDS-PAGE
Casein Standard
Casein-p-Coumaric Acid Complex
Hydrolysate of Casein-p-Coumaric Acid Complex
Casein Isolated from Milk Chocolate
Hydrolysate of Casein Isolated from Milk Chocolate
Casein-Protocatechuic Acid Complex
Hydrolysate of Casein-Protocatechuic Acid Complex
Casein Isolated from White Chocolate
Hydrolysate of Casein Isolated from White Chocolate
Dalton
Degree of Hydrolysis
Kilo Dalton
Molecular Weight
Protocatechuic Acid Control
Polyacrylamide Gel Electrophoresis
Reverse Phase High Performance Liquid Chromatography
Retention Time
Sodium Dodecyl Sulfate-Polyacrylamide Gel Electrophoresis

1
CHAPTER 1
INTRODUCTION
Protein-phenolic interactions are common in foods. These interactions can affect
nutritional and functional properties of foods. The exact type of protein-phenolic
interactions is affected by properties of both the proteins and the phenolic compounds.
Food proteins are essential nutrients, in addition, the quality and sensory
properties of foods can depend on characteristics of food proteins which are important
functional ingredients in foods (Fennema, 1996; Potter and Hotchkiss, 1995). Casein,
which accounts for 80% of milk protein, is one of the principal functional food
proteins (Fox, 2001; Marchesseau et al., 2002; Phadungath, 2005). It is present as
large protein complexes incorporating milk salts (Marchesseau et al., 2002). Milk
casein is in the form of colloidally dispersed particles (calcium caseinate) which are
known as micelles (Marchesseau et al., 2002; Phadungath, 2005). Caseins are
heterogeneous proteins whose main types are αs1-casein (38%), αs2-casein (10%),
β-casein (36%) and κ-casein (13%) (Fox, 2001; Tuckey, 1963).
Among minor food components, phenolics or polyphenols have received
considerable attention recently because of their physiological functions such as
antioxidant, antimutagenic, anti-inflammatory, antiatherogenic effects and antitumour
activities (Ortega et al., 2008; Tanaka et al., 1993). It has been proven that many
phenolic compounds play important roles in preventing some human diseases, such as
osteoporosis, certain kinds of cancers and cardiovascular diseases (Morton et al.,
2000). Black tea, green tea, red wine and cocoa are good sources of phenolics as they

2
are rich in phenolic phytochemicals (Lee et al., 2003). Protocatechuic acid is a
polyphenolic compound that can be found in many foods such as olives, flaxseed,
cocoa and white grape wine. It presents in the form of white to off-white crystalline
powder and has been reported to have several physiological functions including
antioxidant, antibacterial activity, antimutagenic activity, antitumour activity and
anticancer effects (Yin et al., 2009). Coumaric acids, hydroxyl derivatives of cinnamic
acid, are another important group of phenolic compounds (Ferguson et al., 2005;
Kikugawa et al., 1983).
Though there has been some information for casein-phenolic interactions, the
investigation of the interactions of casein-protocatechuic acid and casein-p-coumaric
acid and the biological properties of caseins after interactions are limited. This
information is important for understanding the properties and characteristics of casein
as a food ingredient.
The overall objective of this research is to study the protein-phenolic acid
interactions in food. The specific objectives are to (1) induce casein-phenolic
interactions by heat incubation, (2) identify casein-phenolic complexes by using
electrophoresis and reversed-phase high performance liquid chromatography
(RP-HPLC), (3) study the tryptic hydrolysis of casein-phenolic complexes, (4)
investigate casein-phenolic interactions in foods by extracting casein from milk
chocolate.

3
CHAPTER 2
LITERATURE REVIEW
2.1 Protein-Phenolic Interactions
2.1.1 Naturally Occurring Protein-Phenolic Interactions
Food astringency is associated with protein-phenolic acid interactions. (Haslam,
1974). The cross-linking between the natural polyphenolic compounds in fruits and
salivary proteins and glycoproteins in the mouth results in reduction of lubricant
activity causing the astringency sensation (Goldstein and Swain, 1963; Haslam, 1974).
Tannins are recognized as the most common astringent (Goldstein and Swain,
1963); however, not all tannins have astringent activity (Barnell and Barnell, 1945;
Goldstein and Swain, 1963; Roux and Paulus, 1962). Tannins which have the
astringent property are called ―active‖ tannins and can inhibit the binding activity of
enzymes such as diastase, β-glucosidase and pectinase (Barnell and Barnell, 1945;
Goldstein and Swain, 1965; Porter and Schwartz, 1962). High molecular weight
(higher than 500) phenolic compounds have the ability to interact with proteins and
form strong complexes depending on concentration, pH and molecular weight. The
highest astringent activity lies in tannins having intermediate molecular weight
(Goldstein and Swain, 1963). Phenolic compounds of small molecular size do not
form strong cross-links while highly polymerized phenolic compounds are insoluble
or too large to affect astringent activity (Goldstein and Swain, 1963).

4
Figure 2.1: An example of a tannin molecule
2.1.2 Thermally Induced Protein-Phenolic Interactions
Several studies have shown that protein-phenolic interactions can be thermally
induced. Interactions between caffeic acid and milk proteins reveal that the major
binding force for protein-phenolic complexes is hydrophobic bonding (O'Connell and
Fox, 1999); the interactions are temperature dependent with little interactions at 4 ℃
(O'Connell and Fox, 1999).
The non-covalent interaction between chlorogenic acid and BSA showed that
when the temperature was increased from 5 ℃ to 60 ℃, the amount of chlorogenic
acid bound by per molecule of BSA reduced; the denaturation enthalpy and
temperature of BSA were affected by the chlorogenic acid (Prigent et al., 2003).
Caffeic acid increased the heat stability of milk at 140 ℃ and the apparent activation
energy of heat-induced coagulation of milk (O'Connell and Fox, 1999).
In dried peas, superoxide dismutase (SOD) fractions showed heat-stable
antioxidant activity and the heat-stable antioxidant constituent associated with the

5
SOD activity contained phenolic compounds which formed complexes with the SOD
protein (Nice and Robinson, 1993); furthermore, the phenolic compounds increased
the thermal stability of SOD through protein-phenolic interaction during heating (Tsai
and She, 2006).
2.2 Mechanism of Protein-Phenolic Interactions
Protein-phenolic interactions are complex reactions with biological and chemical
applications including astringency sensation, leather tanning, haze formation of
beverages as well as decrease in protein digestibility (Emmambux, 2004; Haslam,
1989). It has been suggested that there are two different mechanisms for
protein-phenolic interactions (Emmambux, 2004). The first mechanism includes two
stages, which are (ⅰ) formation of protein-phenolic complexes and (ⅱ) precipitation
of the complex afterwards (Haslam, 1989). The second mechanism involves
cross-linking reactions (Emmambux, 2004).
2.2.1 Protein-Phenolic Complexation and Precipitation
The protein-phenolic interactions can be either reversible or irreversible (Ali,
2002; Haslam, 1989). Non-covalent forces and covalent bonds are involved in the
reversible and irreversible complexation respectively (Ali, 2002; Emmambux, 2004;
Haslam, 1989). The interaction between BSA and chlorogenic acid is reversible
(Prigent et al., 2003). Non-covalent forces involve solvation, desolvation forces,
hydrophobic interactions as well as hydrogen bonding (Haslam et al., 1999).

6
Depending on the phenolic to protein ratio, interactions can be either multisite (several
phenolic molecules bound to one protein molecule) or multidentate (one phenolic
molecule bound to several protein molecules or several binding sites). Non-covalent
protein-phenolic interactions are due to hydrophobic association and stabilization by
hydrogen bonding (Prigent et al., 2003).
Irreversible protein-phenolic acid complexation usually occurs autocatalytically
with the presence of oxygen or polyphenoloxidases (Haslam et al., 1999; Mole and
Waterman, 1987); this is associated with the enzymatic browning phenomenon of
fruits as well as tanning of leather making. The end products of irreversible
complexation are covalently linked polyphenol-protein complexes that form once the
reactive intermediates react with the nucleophilic groups of proteins. o-Quinones are
typical reactive intermediates which can be formed through the oxidation of phenolic
compounds in the presence of polyphenol oxidase, metal ions or can be autocatalyzed
in mildly basic media. Nucleophilic groups include amino group and sulfhydryl group
within protein molecules (Emmambux, 2004; Haslam, 1989).
2.2.2 Crosslinking of Protein and Phenolic compounds
Depending on the phenolic compound to protein ratio, there are three proposed
models for cross-linking mechanism (Figure 2.2). When the amount of protein is
higher than that of phenolic compound (Figure 2.2 b), each phenolic molecule acts as
a bridge between two protein molecules so that small protein aggregates as well as
dimers are formed. When the amount of phenolic compound is higher than that of

7
protein (Figure 2.2 c), the bridging ability of the phenolic compounds is low and
formation of small aggregates may still occur since the binding sites of protein are
taken with little chance for the phenolic compound to find an available binding site.
The cross-linking mechanism was proposed by Siebert et al (1996) who found that the
formation of haze increased with increased concentration of tannic acid at constant
gelatin concentration.
Charlton et al. (2002) and Emmambux (2004) reported that the cross-linking
mechanism of the phenolic-protein interaction involves three distinct phases (Figure
2.3). The first phase involves the formation of soluble aggregates that are the
complexes of one polypeptide and several phenolic compounds (Figure 2.3 a); this
bonding is reversible and is due to hydrophobic interaction. Because both the
polypeptide and the phenolic compound have more than one binding sites, the second
stage occurs with further addition of phenolic compound (Figure 2.3 b). The phenolic
compound that is already bound to one peptide interacts with other phenolic
compounds or other peptides through intermolecular bridges and the end-products at
the second stage are polyphenol-coated peptide dimers. The protein-phenolic
complexes are insoluble which leads to the precipitation in the third stage (Figure 2.3
c).

8
Figure 2.2: Cross-linking mechanism of the protein-phenolic interactions at
different ratios (Siebert et al., 1996)
Phenolic compound
Protein molecule with fixed number of phenolic binding sites
[ Phenolic ] = [ Protein ]
[ Phenolic ] < [ Protein ]
[ Phenolic ] > [ Protein ]

9
Figure 2.3: Three phases in the cross-linking mechanism of the protein-phenolic
interaction (Charlton et al., 2002)
The protein-phenolic interaction is proposed to be a surface phenomenon (Figure
2.4). Because phenolic compounds are multidens, they can bind at different binding
points of protein surface (Haslam, 1989). When the amount of protein is low (Figure
2.4 a), protein begins to aggregate and precipitate because a mono-layer (which makes
the protein become less hydrophilic) is formed around the protein surface by phenolic
compound. When the amount of protein is high (Figure 2.4 b), the phenolic-protein
complexes and the cross-linking form the hydrophobic surface layer and protein

10
molecules precipitate. If the amount of simple phenolic molecules in solution is
enough to lead the direction of the interaction to form the protein-phenolic complexes
as well as a hydrophobic layer of simple phenolic compounds around the surface of
protein, simple phenolic compounds can also precipitate proteins (Figure 2.4 c).
Normally the low water solubility of simple phenolic compounds limits their capacity
to precipitate proteins; because they can compete against polyphenols for binding sites
of protein, simple phenolic compounds of high water solubility are considered to
modify protein-phenolic complexation process (Haslam, 1989; Spencer et al., 1988).
Figure 2.4: Mechanisms of protein-phenolic interaction (Haslam, 1989; Spencer
et al., 1988)
phenolic
compound
phenolic
compound
simple phenolic compound
11
2.3 Conditions that Affect Protein-Phenolic Interactions
There are many parameters which affect the protein-phenolic interactions; these
include the temperature, pH value, types and concentration of proteins, types of
phenolic compounds and so on.
2.3.1 Temperature
Temperature can interfere with hydrogen bonding as well as cause the formation
of hydrophobic bonding and therefore, it is an important parameter that affects the
protein-phenolic interactions (Sastry and Rao, 1990). Temperature had a significant
effect on the binding effect between 11S protein (polyphenol-free) of sunflower seed
and chlorogenic acid; the binding effect largely decreased with the increase in
temperature from 30 ℃ to 45 ℃ and it completely disappeared at 55 ℃. Temperature
affected both the maximum amount of binding points and the binding affinity (Sastry
and Rao, 1990). The heat stability of SOD protein increased after interacting with
phenolic compounds due to the increase of SOD activation energy caused by the
binding of phenolic compound with protein; the binding effect was higher with
increasing temperature (Tsai and She, 2006). The binding reactions at different
temperatures (5, 25, 60 ℃) showed that the amount of chlorogenic acid bound by BSA
(per molecule) was lower at higher temperature (Prigent et al., 2003).
2.3.2 pH
Another factor that affects protein-phenolic interactions is pH (Spencer et al.,

12
1988). Unlike the temperature, pH affected only the amount of binding but not the
binding affinity based on the interaction between 11S protein of sunflower seed and
chlorogenic acid; lower pH led to stronger binding because the dissociation of protein
led to more binding sites at lower pH (Sastry and Rao, 1990). The interactions
between chlorogenic acid and several proteins (BSA, lysozyme as well as
α-lactalbumin) at pH≤7 were non-covalent and the amount of chlorogenic acid bound
by BSA (per molecule) was somewhat higher at lower pH (Prigent et al., 2003). With
the increase in pH, the covalent interaction between lysozyme and chlorogenic acid
was stronger because more radicals or quinones were formed by the autoxidation of
chlorogenic acid at higher pH. The reactive radicals and quinones subsequently
interacted covalently with proteins (Prigent et al., 2003). Higher amount of BSA was
precipitated in the presence of tannins at pH 3.5 than pH 4.8 (Naczk et al., 1996).
The optimum pH for obtaining the maximum precipitation of tannin-protein
complex was studied by using several proteins (BSA, fetuin, gelatin, lysozyme and
pepsin) and canola tannin (Naczk et al., 1996). It was suggested that the optimal pH
varies for different proteins and normally it is or close to the isoelectric point of the
protein (Hagerman and Butler, 1981; Spencer et al., 1988). For protein precipitation
by canola tannins, the optimal pH was 0.3 to 3.1 pH units lower than the isoelectric
points of the proteins (Naczk et al., 1996). For precipitation of calfskin gelatin by
tannic acid, the optimum pH was 4.7 to 4.8 which was slightly lower than the
isoelectric point of gelatin (Buren and Robinson, 1969).

13
2.3.3 Types of Proteins
Protein-phenolic interaction is affected by the types of proteins. The binding
affinity of chlorogenic acid to BSA was higher than to lysozyme and α-lactalbumin
(Prigent et al., 2003). The difference in binding affinity among proteins is due to
several factors, such as the different hydrophobicity of proteins (BSA > α-lactalbumin >
lysozyme), different isoelectric point of proteins and the difference in the amino acid
composition of proteins (Prigent et al., 2003). The higher molecular weight gelatin
showed stronger interaction with tannin (Buren and Robinson, 1969) compared to
proteins or polypeptides of lower molecular weight (Hagerman and Butler, 1981). The
affinities for tannin by proteins rich in proline were higher and proteins of loose
conformation had higher affinities than those of tightly coiled molecular structure
(Hagerman and Butler, 1981).
2.3.4 Protein Concentration
The amount of protein present in the solution affects the protein-phenolic
interactions; when concentration of BSA was low, the difference of protein
precipitation between 0.5 mg/ml of BSA and 1.0 mg/ml of BSA was not statistically
significant while when the concentration of BSA was higher than 1.0 mg/ml,
significantly lower protein precipitation effect was obtained from higher
concentrations of BSA (Naczk et al., 1996). At a reactant ratio (grams of tannin/grams
of gelatin) of 0.25, the amount of gelatin precipitated by tannin was highest and it
reduced with higher concentration of gelatin (Buren and Robinson, 1969).

14
2.3.5 Types of Phenolic Compounds
Different types of phenolic compounds affect protein-phenolic interactions.
Stronger binding effect with gelatin was obtained from phenolic compounds of higher
molecular weight (Buren and Robinson, 1969; Rossi and Singleton, 1966). For
complexation of tannin and gelatin, the number of potential hydrogen bond of a tannin
molecule contributing to the binding with each single peptide chain was very
important; there was less possibility for tannin to form crosslinks with other peptide
chains when the degree of hydrogen bonding on one chain was higher (Buren and
Robinson, 1969). Among several low molecular weight phenolic compounds
including p-coumaric acid, p-hydroxybenzoic acid, cinnamic acids (protocatechuic
acid and caffeic acid) and catechin, the 3,4-dihydroxy benzoic and cinnamic acids had
the strongest binding affinity for BSA while there was no significant interaction
between p-hydroxybenzoic acid and BSA (Bartolome et al., 2000). Though both
quercetin and quercetin 3-O-β-D-glucopyranoside are flavonoids, their binding
affinities with BSA were different since stronger interaction was found between BSA
and quercetin (Martini et al., 2008). For increasing the heat stability of SOD in peas,
hydroxycinnamic acids including ferulic acid, coumaric acid and caffeic acid were
found to have better effect than hydroxybenzoic acid; coumaric acid was found to be
superior for enhancing the antioxidant activity of SOD and showed the strongest
binding ability with pea protein (Tsai and She, 2006).
2.3.6 Other Factors

15
Other factors that affect the protein-phenolic interactions include salt
concentration and addition of certain reagents. The binding strength of chlorogenic
acid to sunflower 11S protein reduced with increase in NaCl concentration; the
concentration of NaCl lowers the amount of binding points instead of affecting the
binding affinity because salts of high concentration can inhibit the dissociation of
oligomeric proteins (Sastry and Rao, 1990). Some reagents, such as Na2SO3 (a
reducing agent), even at low concentration can affect the protein-phenolic interactions;
in 0.01 M Na2SO3, the binding between chlorogenic acid and 11S protein disappeared
completely (Sastry and Rao, 1990).
2.4 Effect of Protein-Phenolic Interactions on Properties of Protein
2.4.1 Effect on Protein Structure
An increase of 680 to 690 Da in molecular weight of α-lactalbumin and lysozyme
was reported after incubating with chlorogenic acid at pH 7.0; the phenomenon was
due to the covalently interaction between proteins and quinones formed by heat
oxidation of phenolic compounds (Prigent et al., 2003). Quinones can also be formed
by phenolic compounds with the presence of polyphenol oxidase (PPO) and
peroxidase (POD) and can subsequently interact with amino, thioether, phenolic,
sulfhydral, indole and imidasole groups of proteins, resulting in protein cross-linking
(Matheis and Whitaker, 1984). The interactions between soy proteins and several
phenolics (chlorogenic acid, caffeic acid, gallic acid and so on) caused the formation
of fractions of high molecular weight as well (Rawel et al., 2002).

16
2.4.2 Effect on Thermal Stability of Proteins
The thermal stability of SOD was higher after its interaction with phenolic
compounds and higher temperature led to higher binding effect; however, heating also
resulted in disruption of the protein-phenolic complex (Tsai and She, 2006). The
denaturation temperature and the denaturation enthalpy of BSA increased by 6 ℃ and
about 700 kJ/mol respectively after incubating with chlorogenic acid; this was due to
the stronger binding of chlorogenic acid with the native BSA than with the denatured
BSA (Prigent et al., 2003). A slight decrease (1 ℃) was found in the denaturation
temperature of lysozyme after interacting with chlorogenic acid; this was due to the
higher binding effect between chlorogenic acid and unfolded lysozyme and the
enhanced destabilization and unfolding of lysozyme. On the other hand, the
denaturation temperature and denaturation enthalpy of α-lactalbumin and the
denaturation enthalpy of lysozyme were not affected by chlorogenic acid (Prigent et
al., 2003). A shift in isoelectric points of soy protein to more acidic pH values was
found after incubating with different kinds of phenolic compounds (Kroll et al., 2001;
Rawel et al., 2002).
2.4.3 Effect on Solubility of Proteins
Protein solubility can be affected by the presence of phenolic compounds. It was
reported that at pH≥8.0, there was a decrease in the solubility of lysozyme (pI
10.5-11.3) with the presence of chlorogenic acid; this was due to the oxidation of
chlorogenic acid into quinones in basic solution (Prigent et al., 2003). A reduction of

17
solubility was also found in lysozyme and myoglobin after reacting with phenolic
compounds (Kroll et al., 2001).
2.4.4 Effect on Functional Properties of Proteins
It has been reported that SOD activity was higher after incubating with phenolic
compounds, and hydroxycinnamic acids had higher effect than hydroxybenzoic acid
on SOD activity; this was due to the resonance structure of hydroxycinnamic acids
having the capability to favor the stability of SOD during incubation (Tsai and She,
2006). The antioxidant capacity of peas increased after interacting with phenolic
compounds and coumaric acid gave the highest antioxidant activity to peas compared
to gallic acid, catechin, ferulic acid and caffeic acid (Tsai and She, 2006). The increase
in antioxidant activity in peas was resulted from the protein-phenolic interaction in
peas which stabilized the protein (mainly SOD) and provided the antioxidant capacity
for the protein during heating (Nice and Robinson, 1993; Tsai and She, 2006).
2.4.5 Effect on Nutritional Properties of Proteins
The nutritional properties of proteins can be affected by the protein-phenolic
interactions in the presence of PPO and POD; susceptibility of protein to enzymatic
hydrolysis can decrease as a result of protein complex formation in the presence of
phenolic compounds (Matheis and Whitaker, 1984).
Interactions of casein with several phenolics including caffeic acid,
isochlorogenic acid and phenolic compounds in red clover leaves have been examined;

18
the biological value (BV), available lysine content as well as digestibility of casein
decreased with the presence of phenolics and PPO and lower biological value was also
found in casein with the presence of PPO and p-coumaric (Horigome and Kandatsu,
1968; Matheis and Whitaker, 1984). The content of lysine, tyrosine, histidine,
tryptophan and methionine in casein decreased after interacting with PPO-oxidized
caffeic acid (Kroll et al., 2001). Reduction of lysine, cysteine and tryptophan was
found in soy proteins after interacting with different phenolic compounds (Kroll et al.,
2001; Rawel et al., 2002). Lower net protein ratio (NPR), net protein utilization (NPU)
and digestibility wa found in casein incubated with autoxidized (at alkaline pH 10)
caffeic acid but only lower net protein ratio was found in casein incubated with
PPO-oxidized caffeic acid. After combining with caffeoquinone formed from
oxidation of caffeic acid with PPO, lysine in goat’s milk casein could not be absorbed
by rat, which indicated that the lysine-caffeoquinone interactions impaired the
nutritional properties of casein (Hurrell and Finot, 1982; Matheis and Whitaker, 1984).
2.4.6 Effect on Protein Hydrolysis
The tryptic and peptic hydrolysis of BSA after incubating with catechol in the
presence of PPO has been studied; it was found that the digestibility of BSA by
trypsin significantly decreased while the effect on pepsin digestibility was not
observed and the amounts of several amino acids (e.g. lysine, histidine, cystine,
tryptophan and methionine) in incubated BSA were reduced (Matheis and Whitaker,
1984; Wehr, 1973). After incubation with chlorogenic acid in the presence of PPO, a
19
protein virus in potato transformed more slowly and less completely to subunits of
smaller molecular weight by trypsin treatment (Matheis and Whitaker, 1984; Pierpoint
et al., 1977).
2.5 Food Proteins
Food proteins are the major nutritive and functional ingredients of generally
complex multicomponent food systems such as dairy products, baked goods,
confectionery products and convenience foods (Chopra, 2010; Semenova et al., 2002).
In multicomponent food systems such as dairy products, confectionery products and
baked goods, protein molecules influence and are influenced by other proteins or other
non-protein molecules around them (Schultz and Anglemier, 1964), which leads to the
generation of various functional properties of proteins including emulsification,
foaming and gelation (Chopra, 2010; Palzkill, 2002; Tolstoguzov, 1991).
2.5.1 Casein
Casein, which accounts for 80% of milk protein, is one of the most important
food proteins (Fox, 2001; Marchesseau et al., 2002; Phadungath, 2005). It has been
used as a food ingredient since the 1960s and became a highly valuable product
consequently (Fox, 2001). The most important applications of caseins in fabricated
foods are cheese analogues, synthetic whipping creams, cream liqueurs, fabricated
meats, some cereal products and as an emulsifier in coffee whiteners (Fox, 2001).
Casein is present in milk as large protein complexes. About 80 to 95% of the

20
milk casein is in the form of colloidally dispersed particles (calcium caseinate) known
as micelles which contain 94% of protein and 6% of colloidal calcium phosphate
(comprised of calcium, magnesium, phosphate and citrate) (Davies and Law, 1980;
Tuckey, 1963). Caseins are heterogeneous proteins whose main types are αs1-casein
(38%), αs2-casein (10%), β-casein (36%) and κ-casein (13%) (Davies and Law, 1980),
which are relatively small phosphoproteins with molecular weights of 19 kDa to 25
kDa and are strongly hydrophobic with β-casein being the strongest and αs2-casein
being the weakest (Fox, 2001).
Since the structures of caseins are not random coils of completely flexible chains,
caseins can not be rapidly hydrolyzed as some other food proteins (Phadungath, 2005;
Swaisgood, 1993); however, several bioactive peptides have been found in the
hydrolysates of caseins, which include phosphopeptides, caseinomorphines as well as
bactericidal peptides and they can be considered as nutraceuticals (Swaisgood, 1993).
The regions between hydrophobic and polar domains are flexible, and the structure of
β-casein is particularly open and flexible in the region between the N-terminal polar
domain and the C-terminal hydrophobic domain (Fox and McSweeney, 1998;
Phadungath, 2005; Swaisgood, 1993).
2.6 Phenolic Compounds
Among minor food components, phenolics or polyphenols have received
considerable attention recently because of their physiological functions such as
antioxidant, antimutagenic, anti-inflammatory, antiatherogenic effects and antitumour

21
activities (Ortega et al., 2008; Tanaka et al., 1993). Black tea, green tea, red wine and
cocoa are good sources of phenolics as they are rich in phenolic phytochemicals (Lee
et al., 2003).
2.6.1 Phenolic Compounds in Cocoa Bean
In some countries including Indonesia, Ghana, Ivory Coast, Malaysia as well as
Nigeria, cocoa is an important commercial crop (Othman et al., 2007). Cocoa bean
and its products including cocoa liquor, cocoa powder, and dark chocolate are good
food sources of phenolic compounds (Ortega et al., 2008; Othman et al., 2007). It has
been proven that cocoa contains higher levels of total phenolics compared to black tea,
green tea and red wine and its relative total antioxidant capacity is higher than that of
red wine, green tea and black tea; this suggests that cocoa is more beneficial to health
than teas and red wine in terms of its higher antioxidant capacity (Lee et al., 2003).
The phenolic content of cocoa beans is about 12 – 18% (dry weight basis). It has been
reported that the phenolic compounds in cocoa bean have a potential candidate to
combat free radicals and the consumption of cocoa or chocolate reduced the risk of
cardiovascular disease (Othman et al., 2007).
The phenolic compounds present in cocoa have been classified into four groups:
procyanidins, alkaloids, phenolic acids and flavones (Ortega et al., 2008). Those
phenolic acids found in cocoa include hydroxybenzoic acid, vanillic acid, caffeic acid,
syringic acid, ferulic acid, vanillin, coumaric acid, cinnamic acid, chlorogenic acid as
well as protocatechuic acid (Ortega et al., 2008).

22
2.6.2 Protocatechuic Acid and p-Coumaric Acid
Protocatechuic acid is a polyphenolic compound that can be found in many foods
such as olives, flaxseed, cocoa and white grape wine. It is present in the form of white
to off-white crystalline powder and has a molar mass of about 154 g/mol and a
melting point of 200 to 202 ℃ (Liu et al., 2005; Yin et al., 2009). It has several
physiological functions including antioxidant, antibacterial activity, antimutagenic
activity, antitumour activity and anticancer effects (Othman et al., 2007; Yin et al.,
2009).
Figure 2.5: Molecular structure of protocatechuic acid
Coumaric acids which are hydroxyl derivatives of cinnamic acid are another
important group of phenolic compounds. o-Coumaric acid, m-coumaric acid, and
p-coumaric acid are three different isomers of coumaric acids with p-coumaric acid
being the most abundant isomer in nature (Ferguson et al., 2005; Kikugawa et al.,
1983). p-Coumaric acid is present in the form of crystalline solid with a molar mass of
about 164 g/mol and a melting point of 210 to 213 ℃. It is one of the major
components of lignocellulose and can be found in various edible plants such as
peanuts, tomatoes, carrots, cocoa beans as well as garlic. It has been reported to have

23
antioxidative activity and is believed to reduce the risk of stomach cancer (Ferguson et
al., 2005; Kikugawa et al., 1983).
Figure 2.6: Molecular structure of p-coumaric acid

24
CHAPTER 3
FORMATION AND IDENTIFICATION OF
CASEIN-PHENOLIC COMPLEX
3.1 Justification
Casein, as one of the most important food proteins, is used as ingredients in many
food products. Among phenolic compounds known to occur in plants, protocatechuic
acid and p-coumaric acid are found in cocoa, flaxseed and green tea. This chapter
addresses the following objectives: (1) to induce interactions between casein and the
above phenolic compounds by heat incubation and (2) to identify casein-phenolic
complexes by using native and sodium dodecyl sulfate gel electrophoresis (Native-
and SDS-PAGE) and reversed-phase high performance liquid chromatography
(RP-HPLC).

25
3.2 Materials and Methods
3.2.1 Materials
Commercial whole casein from bovine milk (Technical Grade) (product C7078),
protocatechuic acid (3,4-Dihydroxybenzoic acid) (product 37580) and p-coumaric
acid (product C9008) were purchased from SIGMA-ALDRICH, Co. (St. Louis, MO,
USA). Commercial bovine α-casein (product C6780), β-casein (product C6905) and
κ-casein (product C0406) were purchased from SIGMA-ALDRICH, Co. (St. Louis,
MO, USA).
3.2.2 Induction of Casein-Phenolic Interactions
3.2.2.1 Preparation of Casein and Phenolic Solutions
5 mg/ml casein solution was prepared by dissolving 25 mg casein in 5 ml
phosphate buffer (pH 7) in 15 ml centrifuge tube. Phenolic solutions (1 mg/ml) were
prepared by dissolving 5 mg protocatechuic acid and p-coumaric acid in 5 ml
phosphate buffer (pH 7) in 15 ml centrifuge tube separately.
3.2.2.2 Preparation of Solutions of Casein-Phenolic Interactions
Casein-phenolic interactions were induced using the procedure reported by Ali
(2002) with modifications (Figure 3.1). Casein-phenolic solution mixtures containing
1 ml casein solution (5 mg/ml casein) and 1 ml protocatechuic acid solution (1 mg/ml
protocatechuic acid) or 1 ml p-coumaric acid solution (1 mg/ml p-coumaric acid) were
prepared in 15 ml centrifuge tube; the ratio of casein to phenolic acid in the solutions

26
was 5:1. Casein control solution (2.5 mg/ml casein) was prepared by mixing 1 ml
casein solution with 1 ml phosphate buffer (pH 7) in 15 ml centrifuge tube. Phenolic
control solutions (0.5 mg/ml phenolics) were prepared by mixing 1 ml protocatechuic
acid solution or 1 ml p-coumaric acid solution with 1 ml phosphate buffer (pH 7) in 15
ml centrifuge tube. The above solutions were heated in a water bath at 55 ℃ for 2 h
then cooled to room temperature. Casein standard solution (2.5 mg/ml casein) was
prepared by mixing 1 ml casein solution with 1 ml phosphate buffer (pH 7) in 15 ml
centrifuge tube without incubation.

27
1 ml
Casein
(5 mg/ml)
+ + + +
1 ml 1 ml 1 ml 1 ml
Protocatechuic Acid p-coumaric Acid Phosphate Buffer Phosphate Buffer
(1 mg/ml) (1 mg/ml) (pH 7) (pH 7)
Incubation at 55 ℃ for 2 h No Incubation
Casein-protocatechuic Casein-p-coumaric Casein Casein
acid Complex acid Complex Control Standard
Figure 3.1: Scheme for preparation of casein-phenolic complexes
28
3.2.3 PolyAcrylamide Gel Electrophoresis (PAGE)
3.2.3.1 Native-PAGE
Native-PAGE was carried out according to the method reported by Ornstein and
Davis (1964) with some modifications. 4% acrylamide staking gel (distilled water, 30%
degassed Acrylamide/Bis, 0.5 M Tris-HCl pH 6.8, 10% APS and TEMED) and 8%
resolving gel (distilled water, 30% degassed Arylamide/Bis, 1.5 M Tris-HCl pH 8.8,
10% APS and TEMED) were selected to perform with a Mini-PROTEAN 3 Cell unit
(Bio-Rad, Hercules, CA). Sample solutions were prepared by dissolving 600 μl casein
standard, casein control, phenolic controls, casein-phenolic complexes (obtained from
Section 3.2.2.2) in 300 μl sample buffer (distilled water, 0.5 M Tris-HCl pH 6.8,
glycerol and 0.5% bromophenol blue) separately. A quantity (10-15 μl) of sample
solutions was injected into each individual sample well. The commercial available
high molecular weight calibration kit (Amersham Bioscience, UK) was used to inject
into the first sample well and the five standard protein markers were thyroglobulin
(669,000 Da), ferritin (440,000 Da), catalase (232,000 Da), lactate dehydroxygenase
(140,000 Da) and albumin (67,000 Da). Gels were run at constant current (7.5 mA/gel)
for approximately 1.5 h. After electrophoresis, gels were fixed for about 10 min in
fixing solution (distilled water: methanol: acetic acid/7: 2: 1) followed by stained for 1
h with Coomassie Brilliant Blue R-350 (0.1% w/v in a mixture of 30% methanol and
20% acetic acid solution). Destaining of gels was done by frequently replacing the
fixing solution until the protein bands were clearly visible.
29
3.2.3.2 Sodium Dodecyl Sulfate-PAGE (SDS-PAGE)
Sodium dodecyl sulfate polyacrylamide gel electrophoresis (SDS-PAGE) was
performed following the method reported by Laemmli (1970) with some
modifications. A Mini-PROTEAN 3 Cell unit (Bio-Rad, Hercules, CA) was used with
a acrylamide stacking gel of 4% (distilled water, 30% degassed Acrylamide/Bis, 0.5 M
Tris-HCl pH 6.8, 10% SDS, 10% APS and TEMED) as well as a resolving gel of 12.5%
(distilled water, 30% degassed Acrylamide/Bis, 1.5 M Tris-HCl pH 8.8, 10% SDS, 10%
APS and TEMED). Sample solutions were prepared by dissolving 250 μl casein
standard, casein control, phenolic controls, casein-phenolic complexes (obtained from
Section 3.2.2.2) in 250 μl sample buffer (distilled water, 0.5 M Tris-HCl pH 6.8,
glycerol, 10% SDS, 0.5% bromophenol blue and β–mercaptoethanol) respectively
followed by heat treatment at 95 ℃ for 5 min. A quantity of sample solutions (10-20
μl) was injected into each individual sample well. Broad molecular weight standard kit
(Bio-Rad, Hercules, CA) was purchased to use and was injected into the first sample
well. The standard protein markers were myosin (200,000 Da), β-galactosidase
(116,250 Da), phosphorylase b (97,400 Da), serum albumin (66.200 Da), ovalbumin
(45,000 Da), carbonic anhydrase (31,000 Da), trypsin inhibitor (21,500 Da), lysozyme
(14,400 Da) and aprotinin (6,500 Da). The molecular weights of the standard proteins
and the migration distance of them were used to make a standard curve to estimate the
molecular weights of protein samples. Electrophoresis of gels was carried out at
constant voltage (120 V) for approximately 1.5 h. A mixture of methanol (20% v/v)
and acetic acid (10% v/v) was used to fix gels for 10 min after electrophoresis. The

30
gels were stained by Coomassie Brilliant Blue R-350 (0.1% w/v in a mixture of 30%
methanol and 20% acetic acid solution) followed by destained by replacing the fixing
solution several times until the protein bands were clearly visible.
3.2.4 Reversed Phase-High Performance Liquid Chromatography
(RP-HPLC)
RP-HPLC was performed following the protocol reported by Alli et al. (1993)
with a few modifications to monitor the profiles of casein-phenolic complexes. The
system used for performing RP-HPLC was a Beckman model liquid chromatography
system (Beckman, CA, USA) equipped with a Programmable Solvent Module (Model
126) for completing the delivery of solvents and a Programmable detector module
(Model 166) for detecting the absorbance of the eluted fractions. Samples were
prepared by mixing 200 μl casein standard, casein control, phenolic controls,
casein-phenolic complexes (obtained from Section 3.2.2.2) with 800 μl sample buffer
(0.1% trifluoroacetic acid (TFA) in 10% acetonitrile solution) and then filtered
through a acetate membrane filter (0.45 μm, GE Water & Process Technologies, CA).
Solvent A and B were used to generate a gradient elution system with solvent A
composing of 0.1% trifluoroacetic acid (TFA) in deionized water and solvent B
composing of 0.1% trifluoroacetic acid (TFA) in acetonitrile/deionized water (7: 3)
with filtration through nylon membrane filter (0.20 μm, Millipore, Ireland). Samples
(100 μl) were injected into the system by a manual injector through a 100 μl loop
(Life Science, USA). Separation of fractions was done through a guard column

31
(RP-HPLC Guard Column 4.6 × 50 mm, J T. Baker, USA) followed by an Eclipse
XDB C18 reversed phase column (5 μm, 4.6 × 250 mm; Agilent, USA). The fractions
of samples were eluted at a constant flow rate of 0.5 ml/min with the following
two-solvent gradient system: starting at 10% solvent B and increasing to 70% in 30
min, followed by holding at 70% solvent B for 20 min, and returning to 10% solvent
B in 10 min. Fractions eluted from the system were detected at 220 nm and were
collected and stored at 4 ℃ for further use after being concentrated through the Freeze
Dry/Shell Freeze System (LABCONCO®, USA). Chromatographic data were
analyzed by the Gold System (Beckman, version V810, USA) and transferred from
print format (PRN) to Microsoft Excel©
worksheet.
3.3 Results and Discussion
3.3.1 PAGE Identification of Native Caseins
3.3.1.1 Native Polyacrylamide Gel Electrophoresis (Native-PAGE)
Figure 3.2 shows the native-PAGE electropherogram of casein control,
casein-protocatechuic acid, casein-p-coumaric acid, protocatechuic acid control and
p-coumaric acid control after incubation at 55 ℃ (pH 7, 2 h). As expected, the
phenolic compounds did not show any staining on the electropherogram (Figure 3.2,
lanes 4 and 5). Three major bands (Ⅰ, Ⅱ, Ⅲ) were observed from casein and casein
incubated with protocatechuic acid and p-coumaric acid. The bands of
casein-protocatechuic acid showed relatively lower migration than casein control and
casein-p-coumaric acid while there was no difference in the migration distance of

32
bands between casein-p-coumaric acid and casein control (Table 3.1).
kDa STD 1 2 3 4 5
Figure 3.2: 8% Native-PAGE electropherogram of caseins incubated at 55 ℃ (pH
7, 2 h). STD: Standard protein markers; (1) C: casein control (incubated without
phenolic); (2) CPA: casein-protocatechuic acid complex; (3) CCA:
casein-p-coumaric acid complex; (4) PA: protocatechuic acid control (incubated
without casein); (5) CA: p-coumaric acid control (incubated without casein)
669— 440— 232— 140— 67—
Ⅰ
Ⅱ
Ⅲ
Ⅰ
Ⅱ
Ⅲ
Ⅰ
Ⅱ
Ⅲ

33
Table 3.1: Migration distance (Native-PAGE) of casein control (C),
casein-protocatechuic acid complex (CPA) and casein-p-coumaric acid complex
(CCA)
Migration Distance (cm)
Ⅰ 0.20
C Ⅱ 1.85
Ⅲ 3.25
Ⅰ 0.15
CPA Ⅱ 1.80
Ⅲ 3.15
Ⅰ 0.20
CCA Ⅱ 1.85
Ⅲ 3.25
Note: Migration distance was measured as the distance between the beginning of
the resolving gel and the centre of the stained bands (Cheung and Albers, 1979).
Results are from duplicate electropherograms.
3.3.1.2 Sodium Dodecyl Sulfate Polyacrylamide Gel Electrophoresis
(SDS-PAGE)
Figure 3.3 shows the SDS-PAGE electropherogram of casein standard, casein
control, α-, β- and κ-casein standards. The molecular weights (MW) of α-, β-, and
κ-caseins calculated from the electropherogram are 32.0 kDa, 30.1 kDa and 28.2 kDa
respectively, which are close to those mentioned in the literacture (23.6 kDa, 24.0 kDa
and 19.0 kDa separately) (Jimenez-Flores et al., 1987; Molina, 2006; Stewart et al.,
1984).
Figure 3.4 shows the SDS-PAGE electropherogram of casein control,
casein-protocatechuic acid, casein-p-coumaric acid, protocatechuic acid control and
p-coumaric acid control after incubation at 55 ℃ (pH 7, 2 h). As expected, the

34
phenolic controls did not show any staining (Figure 3.4, lanes 4 and 5). The MW of
major protein bands obtained from SDS-PAGE are showed in Table 3.2. Three major
bands (A, B, C) were observed from casein and casein incubated with protocatechuic
acid and p-coumaric acid, which can be regarded as α-, β-, and κ-caseins according to
the electropherogram of casein standards on Figure 3.3. Casein-protocatechuic acid
complex (Figure 3.4, lane 2) showed loss of band intensities in α-, β-, and κ-casein
bands (Figure 3.4, lane 2 A, B, C) and appearance of one slower migration band
(Figure 3.4, lane 2 A1), which is probably aggregation band of casein and its MW
calculated from the electropherogram is 129.8 kDa. The aggregation band was absent
in casein control and casein-p-coumaric acid complex (Figure 3.4, lanes 1 and 3),
which indicates that the protocatechuic acid caused aggregation of casein subunits by
protein-phenolic interactions while p-coumaric acid did not cause aggregation. Two
protein bands with molecular weights ranging between 45 kDa and 66.2 kDa observed
only from casein-protocatechuic acid complex on the electropherogram (Figure 3.4,
lane 2 A2, A3), which suggests the changes of caseins after interaction with
protocatechuic acid.

35
kDa STD 1 2 3 4 5 6
Figure 3.3: 12.5% SDS-PAGE electropherogram of casein standards. STD:
Standard protein markers; (1) casein standard (no incubation); (2) casein control
(incubated without phenolic); (3) α-casein standard; (4) β-casein standard; (5)
κ-casein standard; (6) casein standard (mixture of α-, β- and κ-casein standards)
200 — 116.25— 97.4 — 66.2 — 45 — 31 — 21.5 — 14.4 — 6.5 —
α-casein
κ-casein
β-casein

36
kDa STD 1 2 3 4 5
Figure 3.4: 12.5% SDS-PAGE electropherogram of caseins incubated at 55 ℃
(pH 7, 2 h). STD: Standard protein markers; (1) C: casein control (incubated
without phenolic); (2) CPA: casein-protocatechuic acid complex; (3) CCA:
casein-p-coumaric acid complex; (4) PA: protocatechuic acid control (incubated
without casein); (5) CA: p-coumaric acid control (incubated without casein)
Table 3.2: The molecular weights of casein subunits of casein control (C),
casein-protocatechuic acid complex (CPA) and casein-p-coumaric acid complex
(CCA) estimated by SDS-PAGE
Results are from duplicate electropherograms.
MW (kDa) estimated from SDS-PAGE
C CPA CCA
α-casein (A) 35.5 (A) 35.5 (A) 35.5
β-casein (B) 32.0 (B) 32.0 (B) 32.0
κ-casein (C) 30.1 (C) 30.1 (C) 30.1
Other fractions (A1) 129.8, (A2) 61.1,
(A3) 55.9
200 — 116.25— 97.4 — 66.2 — 45 — 31 — 21.5 — 14.4 — 6.5 —
A
B
C
A1
A2
A3
A
B C
A
B
C
β-casein
aggregation band
α-casein
κ-casein

37
3.3.2 Reversed Phase-High Performance Liquid Chromatography
(RP-HPLC) Identification of Native Caseins
Figure 3.5 shows the RP-HPLC chromatograms for casein standard (A) and
casein control (B). The three major peaks (peaks 1, 2, 3) can be assigned as the κ-, α-
and β-casein fractions respectively according to the previous research (Molina, 2006).
Figure 3.6 shows the RP-HPLC chromatograms for casein-protocatechuic acid
complex (A) and casein-p-coumaric acid complex (B). The first peak on the
chromatograms of casein-protocatechuic acid complex (Figure 3.6 A1) and
casein-p-coumaric acid complex (Figure 3.6 B1) can be regarded as protocatechuic
acid fraction and p-coumaric acid fraction respectively according to their retention
times. Peak 2 of casein-protocatechuic acid complex (Figure 3.6 A2) can be regarded
as casein fraction, and peaks 2 and 3 of casein-p-coumaric acid complex (Figure 3.6
B2, B3) can be regarded as α-casein and β-casein according to their retention times.
Compared to the RP-HPLC chromatogram of casein control (Figure 3.5 B), the casein
profile of casein-protocatechuic acid (Figure 3.6 A3) did not show the separation of α-
and β-caseins which could be related to protein-protocatechuic acid interaction.

38
Figure 3.5: RP-HPLC chromatograms of (A) casein standard (no incubation),
(B) casein control (incubated without phenolic). 1: κ-casein, 2: α-casein, 3:
β-casein
0.0
0.2
0.4
5 10 15 20 25 30 35 40Retention Time (min)
Ab
sorb
ance (2
20
nm
)
1
2
3
0.0
0.2
0.4
5 10 15 20 25 30 35 40Retention Time (min)
1
2
3
Ab
sorb
ance (2
20
nm
)
A B
B

39
Figure 3.6: RP-HPLC chromatograms of (A) casein-protocatechuic acid
complex, 1: protocatechuic acid, 2: casein; (B) casein-p-coumaric acid complex,
1: p-coumaric acid, 2: α-casein, 3: β-casein
0.0
0.2
0.4
0.6
0.8
1.0
1.2
5 10 15 20 25 30 35 40
Retention Time (min)
Ab
sorb
ance (2
20
nm
)
A
0.0
0.2
0.4
0.6
0.8
1.0
1.2
1.4
1.6
1.8
20 22 24 26 28 30 32 34 36 38 40
Retention Time (min)
Ab
sorb
ance (2
20
nm
)
1
2
1
2 3
B
0.0
0.2
0.4
27 29 31 33 35 37
0.0
0.2
0.4
27 29 31 33 35 37
2
2 3

40
3.4 Conclusion
Native- and SDS-PAGE results indicated minor changes in the migration of
caseins after heat incubation of casein with protocatechuic acid; no effect on migration
distance was observed in casein incubated with p-coumaric acid. RP-HPLC of casein
showed that the α- and β-casein factions could not be separated after the heat
incubation of casein with protocatechuic acid. These results suggest heat induced
chemical interactions occurred between the casein and protocatechuic acid.

41
CHAPTER 4
TRYPTIC HYDROLYSIS OF
CASEIN-PHENOLIC COMPLEXES
4.1 Justification
In this chapter, tryptic hydrolysis was performed to investigate the biological
effects of phenolic acids complexation on casein; the degree of hydrolysis was
determined by o-phthaldialdehyde (OPA) method. Sodium dodecyl sulfate gel
electrophoresis (SDS-PAGE) was used to confirm protein hydrolysis and
reversed-phase high performance liquid chromatography (RP-HPLC) was used to
monitor the peptide profiles of the hydrolysates.

42
4.2 Materials and Methods
4.2.1 Materials
Trypsin Type IX-S from porcine pancreas (EC 3.4.21.4, 13700 units/mg, 14800
units/mg protein) was purchased from SIGMA-ALDRICH, Co. (St. Louis, MO,
USA).
4.2.2 Tryptic Hydrolysis of Casein-Phenolic Complexes
Tryptic hydrolysis of casein-phenolic complexes (Section 3.2.2.2) was performed
to simulate the conditions of human digestive system using the methods described by
Adebiyi et al. (2008) and Antila et al. (1991) with modifications. Trypsin solution was
made immediately before use by dissolving 2.5 mg trypsin in 1 ml phosphate buffer
(pH 8.0). Casein control and casein-phenolic complexes (2.5 mg casein/ml) were
adjusted to pH 8.0 with 1N NaOH solution. 250 μl trypsin solution was added into 5
ml casein control, casein-protocatechuic acid and casein-p-coumaric acid complexes
solutions (trypsin to casein ratio of 1:20) followed by mixing thoroughly. The
mixtures were incubated (water bath at 37 ℃, 3h) and the reaction was stopped by
heating in boiling water for 10 min. A portion (50 μl) was taken from each
enzyme-substrate mixture 30 min intervals during the reaction for measurement of
degree of hydrolysis.
4.2.3 Determination of Degree of Hydrolysis
The degree of hydrolysis of the hydrolysates (obtained from Section 4.2.2) was

43
determined by using the o-phthaldialdehyde (OPA) method described by Adebiyi et al.
(2008) and Church et al. (1983) with modifications. The OPA reagent was made
immediately before use from the following reagents and diluting to a final volume of
50 ml with distilled water: 25 ml, 100 mM sodium tetraborate; 2.5 ml, 20% SDS
(w/w), 40 mg OPA (dissolved in 1 ml of methanol) and 100 μl β-mercaptoethanol. 2.0
ml OPA reagent was added into a cuvette to adjust the spectrophotometer to 0 at 340
nm. 50 μl hydrolysates (obtained from Section 5.2.2 and containing about 35 μg
casein) was added directly into the cuvette containing 2.0 ml OPA reagent. The
solution was mixed briefly and incubated for 2 min at ambient temperature. The
absorbance was read at 340 nm (UV/visible spectrophotometer, Ultrospec 2100 pro;
GE, Canada). The degree of hydrolysis was calculated (based on percentage) by using
the following equation:
DH = (Mw×ΔA340nm)/(d×ε×P)×100,
where Mw is the averaged molecular weight of amino acids (120), ΔA340nm is the
absorbance of OPA at 340 nm, d is the dilution factor (1/41), ε is the extinction
coefficient for OPA at 340 nm (6000 M-1
cm-1
) and P is protein concentration presented
in mg/ml.
4.2.4 SDS-PAGE of Hydrolysates of Casein-phenolic Complexes
Hydrolysates (400 μl) of casein control and casein-phenolic complexes (obtained
from Section 5.2.2) were added to 50 μl sample buffer and subjected to 12.5%
SDS-PAGE as described in Section 3.2.3.2.

44
4.2.5 RP-HPLC
Hydrolysates (200 μl) of casein control and casein-phenolic complexes (obtained
from tryptic hydrolysis in Section 5.2.2) were added into 100 μl sample buffer and
subjected to RP-HPLC as described in Section 3.2.4.
4.3 Results and Discussion
4.3.1 Degree of Hydrolysis
Figure 4.1 shows the degree of hydrolysis of casein control (A),
casein-protocatechuic acid complex (B) and casein-p-coumaric acid complex (C). The
highest DH of casein control, casein-protocatechuic acid complex and
casein-p-coumaric acid complex were 19.3 ± 0.8 %, 18.6 ± 0.2 %, and 17.7 ±
0.4 % respectively; it is similar to that reported by Adamson and Reynolds (1997) who
got a DH of 21 % after 130 min of tryptic hydrolysis of casein. DH of casein control
increased during the first 30 min then increased gradually to a maximum of 19.3 % at
150 min. DH of casein-protocatechuic acid complex increased to 15.1 % after 30 min
then increased gradually to a maximum of 18.6 % at 180 min. The DH of the
casein-p-coumaric acid complex was lower during the first 60 min then increased
gradually during the 180 min hydrolysis period. Casein can not be hydrolyzed rapidly
since the it is not random coil of completely flexible chain as the other proteins
(Swaisgood, 1993). The DH profiles of the casein control and the
casein-protocatechuic acid complex were similar but with a lower DH maximum for
casein-protocatechuic acid complex; the DH profile of casein-p-coumaric acid

45
complex was different from that of casein control suggesting an initial lowering effect
of p-coumaric acid on tryptic hydrolysis of casein; this may due to the cross-linking of
casein subunits in the presence of phenolic compounds which reduces the
susceptibility to tryptic hydrolysis of casein (Matheis and Whitaker, 1984) and it is
comparable to the study reported by Wehr (1973) who found that the tryptic
digestibility of bovine serum albumin (BSA) decreased significantly after incubating
with polyphenol oxidase (PPO) and catechol.
4.3.2 Electrophoresis of casein hydrolysates
Figure 4.2 shows the SDS-PAGE electropherograms of casein standard, casein
control, casein-protocatechuic acid complex, casein-p-coumaric acid complex and
their tryptic hydrolysates. Compared to unhydrolyzed casein, casein-protocatechuic
acid complex and casein-p-coumaric acid complex (Figure 4.2, lanes 1, 2, 4 and 6),
the α-, β- and κ-casein bands disappeared and were converted into subunits of lower
molecular weight on the SDS-PAGE electropherograms of the hydrolyzed casein,
casein-protocatechuic acid complex and casein-p-coumaric acid complex (Figure 4.2,
lanes 3, 5 and 7), confirming the tryptic hydrolysis of casein control,
casein-protocatechuic acid complex and casein-p-coumaric acid complex but the
hydrolysis of casein may not be completely. Native casein resists complete digestion
without decomposition (Bican, 1983) and β-casein is the most flexible one since it is
particularly open (Swaisgood, 1993). Peptides of low molecular weights are released

46
Figure 4.1: Degree of hydrolysis of (A) casein control, (B) casein-protocatechuic
acid complex and (C) casein-p-coumaric acid complex
0
5
10
15
20
0 30 60 90 120 150 180
DH
(%
)
Time (min)
0
5
10
15
20
0 30 60 90 120 150 180
DH
(%
)
Time (min)
0
5
10
15
20
0 30 60 90 120 150 180
DH
(%
)
Time (min)
A
B
C
C

47
kDa STD 1 2 3 4 5 6 7 8
Figure 4.2: 12.5% SDS-PAGE electropherogram of caseins incubated at 55 ℃
(pH 7, 2 h) and casein hydrolysates. STD: Standard protein markers; (1) CSTD:
casein standard (no incubation); (2) C: casein control (incubated without
phenolic); (3) CH: hydrolysate of casein control; (4) CPA: casein-protocatechuic
acid; (5) CPAH: hydrolysate of casein-protocatechuic acid complex; (6) CCA:
casein-p-coumaric acid; (7) CCAH: hydrolysate of casein-p-coumaric acid
complex; (8) trypsin
200 — 116.25 — 97.4 — 66.2 — 45 — 31 — 21.5 — 14.4 — 6.5 —
aggregation band
α-casein
κ-casein β-casein

48
from casein micelles resulting in decrease in the MW of casein micelles after the
tryptic hydrolysis (Rui et al., 2007).
4.3.3 RP-HPLC of Casein Hydrolysates
Figure 4.3 shows the RP-HPLC chromatograms of hydrolysates of casein control,
casein-protocatechuic acid complex and casein-p-coumaric acid complex. Compared
to the chromatogram of casein control (Figure 3.5 B), several peaks showed up on the
chromatogram of hydrolysate of casein control (Figure 4.3 A) in the retention time
area from 20 min to 35 min, which can be assigned as the peptides obtained after the
tryptic hydrolysis of casein; this is due to the release of peptides with different elution
resulting from the accessibility of native casein to tryptic hydrolysis (Bican, 1983).
The retention times of peaks 1 to 12 (Figure 4.3 Ⅱ) of hydrolysate of
casein-protocatechuic acid complex (Figure 4.3 B) showed no difference compared to
the peptide profiles of casein control (Figure 4.3 A); however, the retention times of
peaks of casein-protocatechuic acid complex in the Rt range 15 min to 24 min (Figure
4.3 Ⅰ) were different from those of casein control. Two peaks with retention times of
6.8 min and 9.9 min which were absent from the chromatogram of the hydrolysate of
casein control (Figure 4.3 A) appeared on the chromatogram of hydrolysate of
casein-protocatechuic acid complex (Figure 4.3 B).
The RP-HPLC chromatograms of the hydrolysates of casein control (Figure 4.3
A), casein-protocatechuic acid complex (Figure 4.3 B) and casein-p-coumaric acid
complex (Figure 4.3 C) were similar in the region of peaks 1 to 12 (Rt range 24 min to
49
35 min) (Figure 4.3 Ⅱ); the retention times of peptides obtained after tryptic
hydrolysis of casein-p-coumaric acid complex (Figure 4.3 C) in the region of Rt 15
min to 24 min (Figure 4.3 Ⅰ) were different from those of casein control (Figure 4.3
A). Three peaks with retention times of 20.0 min, 22.0 min and 23.2 min were absent
from the chromatogram of hydrolysate of casein control (Figure 4.3 A) but were
observed on the chromatogram of hydrolysate of casein- p-coumaric acid complex
(Figure 4.3 C). Phenolic compounds have been reported to decrease the digestibility of
proteins by acting as an enzyme inhibitor (Suman et al., 1992) and decrease the
amount of certain amino acids in the hydrolysates (Hurrell and Finot, 1982).
4.4 Conclusion
The degree of hydrolysis of casein was affected slightly by p-coumaric acid.
SDS-PAGE confirmed that the three major casein fractions α-, β- and κ-caseins in
casein control, casein-protocatechuic acid complex as well as casein-p-coumaric acid
complex were hydrolyzed by trypsin. RP-HPLC results showed that both
protocatechuic acid and p-coumaric acid affected the peptide profiles of casein
hydrolysates.

50
Figure 4.3: RP-HPLC chromatograms of (A) CH: hydrolysate of casein control, (B) CPAH: hydrolysate of casein-protocatechuic acid
complex and (C) CCAH: hydrolysate of casein-p-coumaric acid complex.
0
0.2
0.4
0.6
0.8
1
1.2
1.4
1.6
1.8
5 10 15 20 25 30 35 40
Abso
rban
ce (220 n
m)
Retention Time (min)
(B) ——
(A) ——
(C) ——
1 2
3
4 5
6
7
8
9 10
11
12
Rt from 15 min to 24 min
(Ⅰ)
Rt from 24 min to 35 min
(Ⅱ)
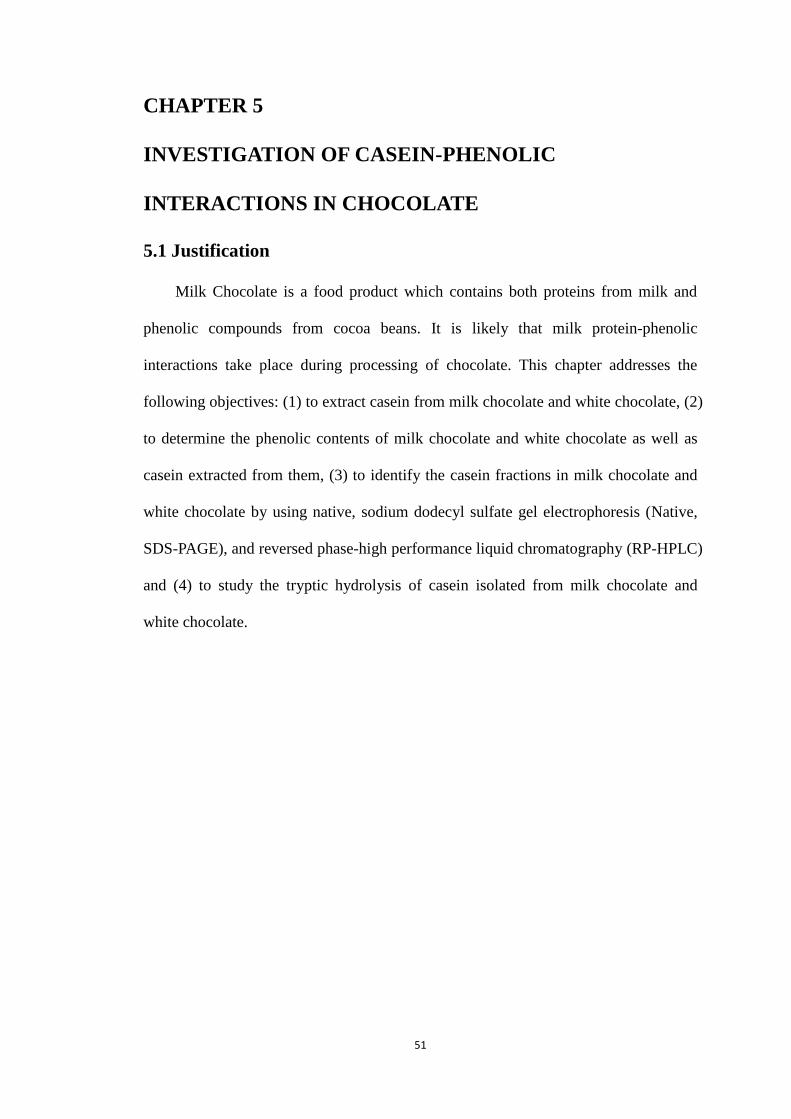
51
CHAPTER 5
INVESTIGATION OF CASEIN-PHENOLIC
INTERACTIONS IN CHOCOLATE
5.1 Justification
Milk Chocolate is a food product which contains both proteins from milk and
phenolic compounds from cocoa beans. It is likely that milk protein-phenolic
interactions take place during processing of chocolate. This chapter addresses the
following objectives: (1) to extract casein from milk chocolate and white chocolate, (2)
to determine the phenolic contents of milk chocolate and white chocolate as well as
casein extracted from them, (3) to identify the casein fractions in milk chocolate and
white chocolate by using native, sodium dodecyl sulfate gel electrophoresis (Native,
SDS-PAGE), and reversed phase-high performance liquid chromatography (RP-HPLC)
and (4) to study the tryptic hydrolysis of casein isolated from milk chocolate and
white chocolate.

52
5.2 Materials and Methods
5.2.1 Materials
Samples of milk chocolate and white chocolate were obtained as gifts from two
Montreal area food companies. Casein standard, casein control and casein-phenolic
complexes were obtained as described in Section 3.2.2.2.
5.2.2 Defatting of Chocolate
The chocolate samples were defatted using the Soxhlet extraction method
following the procedure described by Helrich (1990) with modifications. 50 g
chocolate was melted using a water bath at 50 ℃. 10 g liquid chocolate sample was
added into a clean thimble and placed in the Soxhlet reservoir. A few boiling chips and
100 ml petroleum ether were added into the distillation flask. The Soxhlet apparatus
(including distillation flask, Soxhlet reservoir, condenser) was assembled and the fat
extraction was performed for 8 h. The defatted chocolate samples were air dried in a
fume hood.
5.2.3 Casein Extraction from Chocolate
Casein was isolated from milk chocolate and white chocolate using the procedure
described by Veloso et al. (2002) and Molina (2006) with modifications. Defatted
chocolate obtained from Section 5.2.2 were ground using a mortar and pestle. 10 g
defatted chocolate powder was reconstituted with 100 ml distilled water and adjusted
to pH 4.6 (1 M HCl) to precipitate the casein. The mixture was allowed to stand for 1
h with continuous stirring then centrifuged (8000×g, 25 min) and the supernatant was
discarded. The residue was washed with acetone followed by centrifugation (8000×g,
25 min). The casein was air dried and stored at 4 ℃ for further analysis.

53
5.2.4 Determination of Total Phenolic Content
5.2.4.1 Extraction of Phenolic Compounds
Phenolic compounds in original chocolate, defatted chocolate samples and
caseins isolated from chocolate were extracted using methanol extraction method
(Alu'datt, 2006; Ruth et al., 2001). The samples were ground using a mortar and pestle.
1 g powder sample was added into 25 ml 100% methanol. The mixture was allowed to
stand for 1 h with continuous stirring and then centrifuged (8000×g, 25 min). The
residue was discarded and the supernatant was used for determination of total phenolic
content.
5.2.4.2 Determination of Total Phenolic Content
Total phenolic content of phenolic extract of the chocolate samples as well as
caseins isolated from chocolate samples (obtained from Section 5.2.4.1) was
determined by using Folin-Ciocalteu spectrophotometric method (Alu'datt, 2006; Hoff
and Singleton, 1977). A standard curve was made by plotting the concentrations of a
serial of gallic acid solutions (prepared by using the 1 mg/ml gallic acid stock solution)
versus the absorbance. 10 ml of each phenolic extract was diluted to 50 ml with
distilled water and 1 ml of diluted phenolic extract was taken for analysis. 7.5 ml
distilled water and 0.5 ml Folin-Ciocalteu reagent were added into the 1 ml diluted
phenolic extract and 1 ml of 5% sodium carbonate (Na2CO3) was added 4 min later.
The solutions were mixed and incubated at room temperature for 1 h and the
absorbance was measured at 725 nm.
5.2.4.3 Reversed Phase-High Performance Liquid Chromatography
(RP-HPLC)

54
Each phenolic extract (obtained from Section 5.2.5.1) (200 μl) was added into
100 μl sample buffer separately and 200 μl of each phenolic standard (1 mg/ml in
methanol) was added into 800 μl sample buffer separately. The phenolic extracts as
well as the phenolic standards were subjected to RP-HPLC as described in Section
3.2.4.
5.2.5 Identification of Caseins Isolated from Chocolate Samples
5.2.5.1 Native- and Sodium Dodecyl Sulphate-Polyacrylamide Gel
Electrophoresis (Native- and SDS-PAGE)
Caseins isolated from chocolate samples (obtained from Section 5.2.3) were
subjected to Native- PAGE (Section 3.2.3.1) and SDS-PAGE (Section 3.2.3.2).
5.2.5.2 Reversed Phase-High Performance Liquid Chromatography
(RP-HPLC)
Caseins isolated from chocolate samples (obtained from Section 5.2.3) were
added into 1 ml sample buffer separately and were subjected to RP-HPLC
identification as described in Section 3.2.4.
5.2.6 Tryptic Hydrolysis of Caseins Isolated from Chocolate Samples
5.2.6.1 Tryptic Hydrolysis
Tryptic hydrolysis of caseins isolated from chocolate samples (obtained from
Section 5.2.3) was performed to simulate the conditions of human digestive system
(Section 4.2.2).

55
5.2.6.2 Determination of Degree of Hydrolysis
The degree of hydrolysis of the hydrolysates (obtained from Section 5.2.8.1) was
determined by using the o-phthaldialdehyde (OPA) method (Section 4.2.3).
5.2.6.3 SDS-PAGE Identification of Hydrolysates of Caseins Isolated
from Chocolate
Hydrolysates (400 μl) of caseins from milk chocolate and white chocolate
(obtained as described in Section 5.2.8.1 after tryptic hydrolysis for 3 h) were added to
50 μl sample buffer and were subjected to 12.5% SDS-PAGE (Section 3.2.3.2).
5.2.6.4 RP-HPLC
Hydrolysates (200 μl) of caseins from milk chocolate and white chocolate
(obtained as described in Section 5.2.8.1 after tryptic hydrolysis for 3 h) were added
into 100 μl sample buffer and were subjected to RP-HPLC (Section 3.2.4).
5.3 Results and Discussion
5.3.1 Total Phenolic Contents of Chocolate and Extracted Caseins
Total phenolic contents of chocolate samples as well as extracted caseins are
summarized in Table 5.1. Total phenolic contents of original milk chocolate and
original white chocolate are 1.905 ± 0.03 mg/g and 1.678 ± 0.06 mg/g
respectively; this is similar to those reported by Meng et al. (2009) who got the total
phenolic contents of 1.605 ± 0.07 mg/g and 1.264 ± 0.08 mg/g for milk chocolate
and white chocolate respectively and results for total phenolic content varied from
different commercial chocolate samples. Total phenolic contents of original milk

56
chocolate and white chocolate are higher than the defatted chocolate and the caseins
isolated from the chocolate; this suggests that the some fat soluble phenolic
compounds was removed after the defatting process. The phenolic compounds in the
cocoa butter can interact with other white chocolate ingredients during the processing
of white chocolate so that some phenolic compounds can remain in the defatted white
chocolate (Pimentel et al., 2010). Total phenolic content of original white chocolate is
much lower than that of original milk chocolate; this is similar to the results from the
previous research (Grassi et al., 2004; Meng et al., 2009) and is due to white chocolate
containing only cocoa butter but no cocoa liquor (Meng et al., 2009). No phenolic acid
was detected in the casein isolated from white chocolate; this suggests that for white
chocolate, the phenolic compounds are associated mainly with the cocoa butter.
Table 5.1: Total phenolic content of chocolate and extracted caseins
Sample Phenolic Content (mg/g as Gallic Acid)
Original Milk Chocolate 1.905 ± 0.03
Original White Chocolate 1.678 ± 0.06
Defatted Milk Chocolate 1.644 ± 0.02
Defatted White Chocolate 0.723 ± 0.05
Casein Extracted from
Milk Chocolate
1.018 ± 0.02
Casein Extracted from
White Chocolate
0.000 ± 0.00
Note: Results are from triplicate measurements.

57
5.3.2 RP-HPLC of Phenolic Compounds
Figure 5.1 shows RP-HPLC chromatogram of mixture of phenolic compounds
standard. Figure 5.2 shows RP-HPLC chromatogram of phenolic compounds of
original and defatted milk chocolate and casein isolated from milk chocolate. The
chromatogram of phenolic compounds of original milk chocolate (Figure 5.2 A) was
similar to that obtained from defatted milk chocolate (Figure 5.2 B) with p-coumaric
acid (Rt 19.9 min), 4-hydroxybenzoic acid (Rt 20.5 min) and cinnamic acid (Rt 30.1
min) being identified from both original and defatted milk chocolate according to the
retention times of phenolic standards; these results are similar to previous research on
phenolic compounds identified in cocoa beans (Ortega et al., 2008). The
chromatogram of phenolic compounds of casein isolated from milk chocolate (Figure
5.2 C) was different from that of original and defatted milk chocolate; however,
caffeic acid (Rt 18.4 min), p-coumaric acid (Rt 19.7 min) and cinnamic acid (Rt 30.6
min) were identified, which suggests the phenolic compounds were bound to casein
during the processing of chocolate. Figure 5.3 shows RP-HPLC chromatogram of
phenolic compounds of original and defatted white chocolate. The chromatogram of
phenolic compounds of original white chocolate (Figure 5.3 A) was similar to that
obtained from defatted white chocolate (Figure 5.3 B) with caffeic acid (Rt 18.7 min),
p-coumaric acid (Rt 19.7 min) and cinnamic acid (Rt 30.6 min) being identified from
both original and defatted white chocolate according to the retention times of phenolic
standards; this suggests that some phenolic compounds of cocoa beans are fat soluble
and are associated with the cocoa butter component.

58
Figure 5.1: RP-HPLC chromatogram of mixture of phenolic compound
standards; 1: protocatechuic acid; 2: gallic acid; 3: caffeic acid; 4: p-coumaric
acid; 5: 4-hydroxybenzoic acid; 6: syringic acid; 7: cinnamic acid
Figure 5.2: RP-HPLC chromatogram of phenolic compounds of (A) original milk
chocolate, (B) defatted milk chocolate and (C) casein isolated from milk chocolate
Figure 5.3: RP-HPLC chromatogram of phenolic compounds of (A) original
white chocolate, (B) defatted white chocolate
0.00
0.40
0.80
1.20
1.60
2.00
5 10 15 20 25 30 35
Abso
rban
ce (280 n
m)
Retention Time (min)
-0.01
0.04
5 10 15 20 25 30 35
Ab
sorb
ance (2
80
nm
)
Retention Time (min)
-0.01
0.03
5 10 15 20 25 30 35
Ab
sorb
ance (2
80
nm
)
Retention Time (min)
1 2 3
4 6 7
5
— (B)
— (A) (C) —
— (B)
— (A)
3 4
5
7
7
3
4

59
5.3.3 Identification of Caseins Isolated from Chocolate
5.3.3.1 Native-Polyacrylamide Gel Electrophoresis (Native-PAGE)
Figure 5.4 shows the native-PAGE electropherogram of casein standard, casein
control, caseins isolated from milk chocolate and white chocolate. Migration distances
of the major bands are shown in Table 5.2. Two bands with migration distances of
0.08 cm and 0.50 cm were obtained from casein isolated from milk chocolate (Figure
5.4, lane 3 A1, A2) and two bands with migration distances of 0.08 cm and 0.60 cm
were obtained from casein isolate isolated white chocolate (Figure 5.4, lane 4 A1, A2);
this is different from casein standard and casein control and suggests that other
compounds in milk chocolate and white chocolate are bound to casein fractions. The
migration distance of the third major band of casein isolated from white chocolate
(Figure 5.4, lane 4 B) is the same as that of casein standard and casein control while
the protein band with migration distance of 5.65 cm (Figure 5.4, lane 4 C) showed a
lower migration than that of casein standard and casein control. Both the third and
fourth bands with migration distances of 3.20 cm and 5.70 cm of casein isolated from
milk chocolate, showed lower migration than those of casein standard and casein
control. The difference between casein isolated from chocolate and casein control can
be related to the effect of binding interactions between casein and phenolic
compounds in chocolate (Natsume et al., 2000). Since total phenolic content of casein
isolated from milk chocolate is higher than that from white chocolate, the effect from
the casein-phenolic interactions is greater in casein isolated from milk chocolate.

60
kDa STD 1 2 3 4
Figure 5.4: 8% Native-PAGE electropherogram of caseins isolated from milk
chocolate and white chocolate. STD: Standard protein markers; (1) CSTD:
casein standard (no incubation); (2) C: casein control (incubated without
phenolic); (3) CMC: casein isolated from milk chocolate; (4) CWC: casein
isolated from white chocolate
669— 440— 232— 140— 67—
A
B
C
A
B
C
A1
A2
B
C
A1
A2
B
C

61
Table 5.2: Migration distance (Native-PAGE) of casein standard (CSTD), casein
control (C), casein isolated from milk chocolate (CMC) and casein isolated from
white chocolate (CWC)
Migration Distance (cm)
A 0.08
CSTD B 3.40
C 6.00
A 0.30
C B 3.40
C 6.00
A1 0.08
A2 0.50
CMC B 3.20
C 5.70
A1 0.08
A2 0.60
CWC B 3.40
C 5.65
Note: Migration distance was measured as the distance between the beginning of
the resolving gel and the centre of the stained bands (Cheung and Albers, 1979).
And the results are from duplicate electropherograms.
5.3.3.2 Sodium Dodecyl Sulphate-Polyacrylamide Gel Electrophoresis
(SDS-PAGE)
Figure 5.5 shows the SDS-PAGE electropherogram of casein standard, casein
control and caseins isolated from milk chocolate and white chocolate. The migration
of α-, β- and κ-casein bands was similar among casein standard, casein control and
caseins isolated from milk chocolate and white chocolate, suggesting that the phenolic
compounds in chocolate did not result in any significant change in the molecular
weights of α, β, κ-casein subunits. The protein profile of casein isolated from white

62
chocolate (Figure 5.5, lane 3) is similar to those of casein standard (Figure 5.5, lane 1)
and casein control (Figure 5.5, lane 2), while one lower migration band with relatively
large molecular weight was obtained in casein extracted from milk chocolate (Figure
5.5, lane 4); this suggests some aggregation interactions between casein and phenolic
compounds in milk chocolate.
kDa STD 1 2 3 4
Figure 5.5: 12.5% SDS-PAGE electropherogram of caseins isolated from milk
chocolate and white chocolate. STD: Standard protein markers; (1) CSTD:
casein standard (no incubation); (2) C: casein control (incubated without
phenolic); (3) CWC: casein isolated from white chocolate; (4) CMC: casein
isolated from milk chocolate
200 — 116.25— 97.4 — 66.2 — 45 — 31 —
α-casein
κ-casein
β-casein
aggregation band

63
5.3.3.3 Reversed Phase-High Performance Liquid Chromatography
(RP-HPLC)
Figure 5.6 shows the RP-HPLC chromatograms for casein control (A), casein
isolated from milk chocolate (B) and casein isolated from white chocolate (C). Three
peaks were obtained from the chromatogram of casein isolated from milk chocolate
(Figure 5.6, B 1, 2, 3) with retention times being 29.9 min (B1), 30.6 min (B2) and
31.6 min (B3); these are comparable to peaks from casein control (Figure 5.6 A) with
similar retention times and can be assigned as the κ-, α- and β-casein fractions
respectively according to the previous research (Molina, 2006). Two peaks were
observed from the chromatogram of casein isolated from white chocolate (Figure 5.6,
C 1, 2) with retention times being 29.8 min (C1) and 32.5 min (C2), which can be
assigned as the κ-casein fraction and β-casein fraction respectively. The α-casein
fraction of casein isolated from white chocolate was not separated, which is probably
due to the interactions between α-casein and phenolic compounds in white chocolate
since the phenolic compounds are hydrophilic (Miller et al., 2006; Pimentel et al.,
2010) and α-casein has the lowest hydrophobicity compared to κ- and β-caseins (Fox
and McSweeney, 1998). The hydrophobic interactions between the amino acid side
chains can be affected by the phenolic compounds (Han et al., 2011).
64
Figure 5.6: RP-HPLC chromatograms of (A) casein control, 1: κ-casein, 2:
α-casein, 3: β-casein; (B) casein isolated from milk chocolate, 1: κ-casein, 2:
α-casein, 3: β-casein; (C) casein isolated from white chocolate, 1: κ-casein, 2:
β-casein
0.0
0.2
0.4
20 25 30 35 40Retention Time (min)
1
2
3
Ab
sorb
ance (2
20
nm
)0.0
0.2
0.4
20 25 30 35 40Retention Time (min)
Ab
sorb
ance (2
20
nm
)
0.0
0.6
1.2
1.8
20 25 30 35 40
Retention Time (min)
Ab
sorb
ance (2
20
nm
)
2
1
3
A
B
2
1
B
C
1
2

65
5.3.4 Biological Properties of Caseins Isolated from Chocolate
5.3.4.1 Degree of Hydrolysis
Figure 5.7 shows the degree of hydrolysis of casein control (A), casein isolated
from milk chocolate (B) and casein isolated from white chocolate (C). The highest DH
of casein control, casein isolated from milk chocolate and casein isolated from white
chocolate were 19.3 ± 0.8 %, 10.4 ± 0.4 %, and 17.8 ± 0.6 % respectively.
Compared to the DH profile of casein control (Figure 5.7 A), DH of casein isolated
from milk chocolate was lower (Figure 5.7 B) while that of casein isolated from white
chocolate was similar (Figure 5.7 C). DH of casein isolated from milk chocolate
increased slowly from 4.5 % to a maximum of 10.4 % at 180 min while DH of casein
control increased gradually from 6.9 % to a maximum of 19.3 % at 150 min, which
suggests an inhibitory effect of phenolic compounds in milk chocolate on tryptic
hydrolysis of casein. DH of casein isolated from white chocolate increased from 4.0 %
to 11.9 % in the first 30 min and increased gradually to a maximum of 17.8 % which
is close to that of casein control at 180 min, which indicates that there is no effect on
tryptic hydrolysis of casein isolated from white chocolate which contained no
phenolic acid (Table 5.1).

66
Figure 5.7: Degree of hydrolysis of (A) casein control, (B) casein isolated from
milk chocolate and (C) casein isolated from white chocolate
0
5
10
15
20
0 30 60 90 120 150 180
DH
(%
)
Time (min)
0
5
10
15
20
0 30 60 90 120 150 180
DH
(%
)
Time (min)
0
5
10
15
20
0 30 60 90 120 150 180
DH
(%
)
Time (min)
A
B
B
C
67
5.3.4.2 SDS-PAGE Identification of Hydrolysates of Caseins Isolated
from Chocolate
Figure 5.8 shows the SDS-PAGE electropherogram of casein standard, casein
control, hydrolysate of casein control, caseins isolated from milk chocolate and white
chocolate and hydrolysates of casein isolated from milk chocolate and white chocolate.
Compared to casein standard, casein control and caseins isolated from milk chocolate
and white chocolate (Figure 5.8, lanes 1, 2, 4 and 6), the α-, β- and κ-casein bands
disappeared on the SDS-PAGE electropherogram of hydrolysates of casein control
and hydrolysates of caseins isolated from milk chocolate and white chocolate (Figure
5.8, lanes 3, 5 and 7), which confirmed the tryptic hydrolysis of casein control and
caseins isolated from milk chocolate and white chocolate.

68
kDa STD 1 2 3 4 5 6 7
Figure 5.8: 12.5% SDS-PAGE electropherogram of casein isolated from chocolate
and its hydrolysate. STD: Standard protein markers; (1) CSTD: casein standard
(no incubation); (2) C: casein control (incubated without phenolic); (3) CH:
hydrolysate of casein control; (4) CMC: casein isolated from milk chocolate; (5)
CMCH: hydrolysate of casein isolated from milk chocolate; (6) CWC: casein
isolated from white chocolate; (7) CWCH: hydrolysate of casein isolated from
white chocolate
200 — 116.25— 97.4 — 66.2 —
45 — 31 — 21.5 — 14.4 — 6.5 —
α-casein
κ-casein
β-casein
aggregation band
69
5.3.4.3 RP-HPLC
Figure 5.9 shows the RP-HPLC chromatogram of hydrolysate of casein control,
casein isolated from milk chocolate and white chocolate. The retention times of
peptides obtained after tryptic hydrolysis of casein control were located in the 20 min
to 35 min Rt range (Figure 5.9 A), and those of casein isolated from milk chocolate
and white chocolate were located in the 24 min to 35 min Rt range (Figure 5.9 B) and
in the 22 min to 37 min Rt range (Figure 5.9 C) respectively. Compared to the
chromatogram of hydrolysate of casein control (Figure 5.9 A), the peptide profile of
hydrolysate of casein isolated from milk chocolate (Figure 5.9 B) was different; this
suggests an effect of casein-phenolic interactions on tryptic hydrolysis of casein
isolated from milk chocolate.
5.4 Conclusion
The total phenolic contents of non-defatted and defatted milk chocolate as well as
casein isolated from milk chocolate were higher than those of original and defatted
white chocolate as well as casein isolated from white chocolate respectively. The
degree of hydrolysis of casein isolated from milk chocolate is lower than that from
white chocolate suggesting an effect on tryptic hydrolysis of casein from
casein-phenolic interactions in milk chocolate. SDS-PAGE confirmed that the three
major casein fractions α-, β- and κ-caseins in caseins isolated from milk and white
chocolate were hydrolyzed by trypsin and RP-HPLC results show that the phenolic
compounds in milk chocolate affected the tryptic hydrolysis of casein.

70
Figure 5.9: RP-HPLC chromatogram of (A) hydrolysate of casein control, (B) hydrolysate of casein isolated from milk chocolate and (C)
hydrolysate of casein isolated from white chocolate
0.0
0.2
0.4
0.6
15 20 25 30 35 40Retention Time (min)
Ab
sorb
ance (2
20
nm
)
(A) ——
—— (C)
—— (B)

71
CHAPTER 6
GENERAL CONCLUSIONS
6.1 Conclusions
Protein-phenolic interactions can have physiological functions as well as affect the
nutritional and functional properties of proteins; this research studied the casein-phenolic
interactions by heat incubation using a model system and in chocolate as a processed food
product.
Native- and SDS-PAGE results revealed that casein-phenolic interactions were
induced by heat incubation and protocatechuic acid showed greater interaction with
casein than p-coumaric acid. Minor changes in the migration of casein fractions and
aggregation of casein were observed after heat incubation of casein with protocatechuic
acid while there is no observed change after casein incubation with p-coumaric acid.
Tryptic hydrolysis revealed that the degree of hydrolysis of casein was affected by
p-coumaric acid and SDS-PAGE confirmed that the three major casein fractions α-, β-
and κ-caseins in casein control, casein-protocatechuic acid complex as well as
casein-p-coumaric acid complex were hydrolyzed.
From RP-HPLC analysis, retention times of α-, β- and κ-caseins were affected by
phenolic compounds after incubation; α- and β-casein fractions could not be separated
after the heat incubation of casein with protocatechuic acid. Both protocatechuic acid and
p-coumaric acid affected the peptide profiles of casein hydrolysates.
Total phenolic contents of non-defatted and defatted milk chocolate and casein

72
isolated from milk chocolate (1.905, 1.644 and 1.018 mg/g respectively) were higher than
those of non-defatted and defatted white chocolate and casein isolated from white
chocolate (1.678, 0.723 and 0.000 mg/g respectively) respectively. The degree of
hydrolysis of casein isolated from milk chocolate (10.4 %) was lower than that of casein
isolated from white chocolate (17.8 %) and casein control (19.3 %) suggesting an effect
on tryptic hydrolysis of casein from casein-phenolic interactions in milk chocolate.
SDS-PAGE confirmed that the three major casein fractions α-, β- and κ-caseins in caseins
isolated from milk and white chocolate were hydrolyzed by trypsin and RP-HPLC results
showed the peptide profile of casein was affected by phenolic compounds in milk
chocolate.

73
REFERENCES
Adamson, Nicholas J. and Eric C. Reynolds 1997. Relationship between degree of casein
hydrolysis and phosphopeptide release. Journal of Dairy Research 64: 505-514.
Adebiyi, Abayomi P., Ayobamitale O. Adebiyi, Tomohisa Ogawa and Koji Muramoto
2008. Purification and characterisation of antioxidative peptides from unfractionated rice
bran protein hydrolysates. International Journal of Food Science and Technology 43:
35-43.
Ali, Haroon 2002. Protein-phenolic interactions in food. Food Science and Agicultural
Chemistry, McGill University.
Alli, Inteaz, Bernard F. Gibbs, Monika K. Okoniewska, Yasuo Konishi and France Dumas
1993. Identification and characterization of phaseolin polypeptides in a crystalline protein
isolated from white kidney beans (Phaseolus vulgaris). J. Agric. Food Chem. 41:
1830-1834.
Alu'datt, Muhammad Hussein 2006. Phenolic compounds in oil-bearing plants and their
interactions with oilseed protein isolates. Department of Food Science and Agricultural
Chemistry, McGill University.
Antila, P., I. Paakkari, A. Jarvinen, M. J. Mattila, M. Laukkanen, A. Pihlanto-Leppala, P.
Mantsala and J. Hellman 1991. Opioid peptides derived from in-vitro proteolysis of
bovine whey proteins. International Dairy Journal 1: 215-229.
Barnell, H. R. and E. Barnell 1945. The distribution of tannins within the banana and the
changes in their condition and amount during ripening. Annals of Botany IX(33): 77-99.
Bartolome, B., I. Estrella and M. T. Hernandez 2000. Interaction of low molecular weight
phenolics with proteins (BSA). Food Chemistry and Toxicology 65: 617-621.
Bican, P. 1983. High performance liquid chromatography of casein peptides. Journal of
Dairy Science 66: 2195-2197.
Buren, J. P. Van and W. B. Robinson 1969. Formation of complexes between protein and
tannic acid. Journal of Agricultural and Food Chemistry 17 (4): 772-777.
Charlton, Adrian J., Nicola J. Baxter, M. Lokman Khan and Arthur J. G. Moir 2002.
Polyphenol/peptide binding and precipitation. Journal of Agricultural and Food Chemistry
74
50: 1593-1601.
Cheung, Marian C. and John J. Albers 1979. Distribution of cholesterol and
apolipoprotein A-Ⅰ and A-Ⅱ in human high density lipoprotein subfractions separated
by CsCl equilibrium gradient centrifugation: evidence for HDL subpopulations with
differing A-Ⅰ/A-Ⅱ molar ratios. Journal of Lipid Research 20: 200-207.
Chopra, Harish Kumar 2010. Food chemistry. Oxford: Alpha Science International Ltd.
Church, Frank C., Harold E. Swaisgood, David H. Porter and George L. Catignani 1983.
Spectrophotometric assay using o-phthaldialdehyde for determination of proteolysis in
milk and isolated milk proteins. Journal of Dairy Science 66: 1219-1227.
Davies, D. Thomas and Andrew J. R. Law 1980. Content and composition of protein in
creamery milks in southwest Scotland. The Journal of Dairy Research 47: 83-90.
Davis, Baruch J. 1964. Disc electrophoresis 2, method and application to human serum
Proteins. Annals New York Academy of Sciences 121: 404-427.
Emmambux, Mohammad Naushad 2004. Tannin binding of kafirin and its effects on
kafirin films. Department of Food Science, University of Pretoria.
Fennema, Owen R. 1996. Food chemistry. New York: Marcel Dekker, Inc.
Ferguson, Lynnette R., Shuo-tun Zhu and Philip J. Harris 2005. Antioxidant and
antigenotoxic effects of plant cell wall hydroxycinnamic acids in cultured HT-29 cells.
Molecular Nutrition & Food Research 49: 585-593.
Fox, P F 2001. Milk proteins as food ingredients. International Journal of Dairy
Technology 54: 41-55.
Fox, P. F. and P. L. H. McSweeney 1998. Dairy chemistry and biochemistry. New York:
Blackie Academic & Professional.
Goldstein, Judith L. and T. Swain 1963. Changes in tannins in ripening fruits.
Phytochemistry 2: 371-383.
Goldstein, Judith L. and T. Swain 1965. The inhibition of enzymes by tannins.
Phytochemistry 4: 185-192.
Grassi, D., C. Lippi, S. Necozione, G. Desideri and C. Ferri 2004. Short-term

75
adminstration of dark chocolate is followed by a significant increase in insulin sensitivity
and a decrease in blood pressure in healthy persons. American Journal of Clinical
Nutrition 81: 611-614.
Hagerman, Ann E. and Larry G. Butler 1981. The specificity of proanthocyanidin-protein
interactions. The Journal of Biological Chemistry 256: 4494-4497.
Han, Jaejoon, Michel Britten, Daniel St-Gelais, Claude P. Champagne, Patrick Fustier,
Stephane Salmieri and Monique Lacroix 2011. Effect of polyphenolic ingredients on
physical characteristics of cheese. Food Research International 44: 494-497.
Haslam, E., M. P. Williamson, N. J. Baxter and A. J. Charlton 1999. Astringency and
polyphenol protein interactions. Recent Advances in Phytochemistry 33: 289.
Haslam, Edwin 1989. Plant polyphenols: vegetable tannins revisited. Cambridge:
Cambridge University Press.
Haslam, Edwin 1974. Polyphenol-protein interations. Biochemical Journal 139: 285-288.
Helrich, Kenneth 1990. Official methods of analysis of the association of official
analytical chemists. Arlington: The Association of Official Analytical Chemists, Inc.
Hoff, J. E. and K. I. Singleton 1977. A method for determination of tannins in foods by
means of immobilized protein. Journal of Food Science 42: 1566-1569.
Horigome, T. and M. Kandatsu 1968. Biological value of proteins allowed to react with
phenolic compounds in presence of o-diphenol oxidase. Agricultural and Biological
Chemistry 32: 1093-1102.
Hurrell, R. F. and P. A. Finot 1982. Protein-polyphenol reactions 1. Nutritional and
metabolic consequences of the reaction between oxidized caffeic acid and the lysine
residues of casein. The British Journal of Nutrition 47: 191-211.
Jimenez-Flores, Rafael, Young C. Kang and Tom Richardson 1987. Cloning and sequence
analysis of bovine beta-casein cDNA. Biochemical and Biophysical Research
Communications 142: 617-621.
Kikugawa, Kiyomi, Tomoko Hakamada, Makiko Hasunuma and Tsutao Kurechi 1983.
Reaction of p-hydroxycinnamic acid derivatives with nitrite and its relevance to
nitrosamine formation. Journal of Agricultural and Food Chemistry 31: 780-785.

76
Kroll, J., H. M. Rawel, S. Rohn and D. Czajka 2001. Interactions of glycinin with plant
phenols - Influence on chemical properties and proteolytic degradation of the proteins.
Molecular Nutrition & Food Research 45: 388-389.
Laemmli, U. K. 1970. Cleavage of structural proteins during the assembly of the head of
bacteriophage T4. Nature 227: 680-685.
Lee, Ki Won, Young Jun Kim, Hyong Joo Lee and Chang Yong Lee 2003. Cocoa has
more phenolic phytochemicals and a higher antioxidant capacity than teas and red wine.
Journal of Agricultural and Food Chemistry 51: 7292-7295.
Liu, Keh-sen, Shyh-ming Tsao and Mei-chin Yin 2005. In vitro antibacterial activity of
roselle calyx and protocatechuic acid. Phytotherapy Research 19: 942-945.
Marchesseau, S., J-C. Mani, P. Martineau, F. Roquet, J-L. Cuq and M. Pugniere 2002.
Casein interactions studied by the surface plasmon resonance technique. J. Dairy Sci. 85:
2711-2721.
Martini, Silvia, Claudia Bonechi and Claudio Rossi 2008. Interaction of quercetin and its
conjugate quercetin 3-o-β-D-glucopyranoside with albumin as determined by NMR
relaxation data. Journal of Natural Products 71 (2): 175-178.
Matheis, Gunter and John R. Whitaker 1984. Modification of proteins by polyphenol
oxidase and peroxidase and their products. Journal of Food Biochemistry 8: 137-162.
Meng, Cheng Chia, Abbe Maleyki Mhd Jalil and Amin Ismail 2009. Phenolic and
theobromine contents of commercial dark, milk and white chocolates on the Malaysian
market. Molecules 14: 200-209.
Miller, K. B., D. A. Stuart, N. L. Smith, C. Y. Lee, N. L. Mchale and J. A. Flanagan 2006.
Antioxidant activity and polyphenol and procyanidin contents of selected commercially
available cocoa-containing and chocolate products in the United States. Journal of
Agricultural and Food Chemistry 54: 4062-4068.
Mole, S. and P. G. Waterman 1987. Tannic acid and proteolytic enzymes: enzyme
inhibition or substrate deprivation. Phytochemistry 26: 99.
Molina, Aline C. Tezcucano 2006. Effects of enzymatic dephosphorylation on properties
of bovine casein Department of Food Science and Agricultural Chemistry, McGill
University.
77
Morton, Lincoln W, Rima Abu-Amsha Caccetta, Ian B Puddey and Kevin D Croft 2000.
Chemistry and biological effects of dietary phenolic compounds: relevance to
cardiovascular disease. Clinical and Experimental Pharmacology and Physiology 27:
152-159.
Naczk, M., D. Oickle, D. Pink and F. Shahidi 1996. Protein precipitating capacity of
crude canola tannins: effect of pH, tannin, and protein concentrations. Journal of
Agricultural and Food Chemistry 44: 2144-2148.
Natsume, M., N. Osakabe, M. Yamagishi, T. Takizawa, T. Nakamura, H. Miytake, T.
Hatano and T. Yoshida 2000. Analyses of polyphenols in cocoa liquor, cocoa, and
chocolate by normal-phase and reversed-phase HPLC. Biosci. Biotechnol. Biochem 64:
2581-2587.
Nice, D. J. and D. S. Robinson 1993. Co-purification of a heat-stable antioxidant with the
superoxide dismutase activity from dried peas. Food Chemistry 48: 353-357.
O'Connell, J. E. and P. F. Fox 1999. Proposed mechanism for the effect of polyphenols on
the heat stability of milk. International Dairy Journal 9: 523-536.
Ornstein, Leonard 1964. Disc electrophoresis 1, background and theory. Annals New
York Academy of Sciences 121: 321-351.
Ortega, Nadia, Maria-Paz Romero, Alba Macia, Jordi Reguant, Neus Angles, Jose-Ramon
Morello and Maria-Jose Motilva 2008. Obtention and characterization of phenolic
extracts from different cocoa sources. Journal of Agricultural and Food Chemistry 56:
9621-9627.
Othman, Azizah, Amin Ismail, Nawalyah Abdul Ghani and Ilham Adenan 2007.
Antioxidant capacity and phenolic content of cocoa beans. Food Chemistry 100:
1523-1530.
Palzkill, Timothy 2002. Proteomics. Boston: KLUWER ACADEMIC PUBLISHERS.
Phadungath, Chanokphat 2005. Casein micelle structure: a concise review. J. Sci. Technol.
27: 201-212.
Pierpoint, W. S., R. J. Ireland and J. M. Carpenter 1977. Modification of proteins during
the oxidation of leaf phenols: Reaction of potato virus X with chlorogenoquinone.
Phytochemistry 16: 29-34.
Pimentel, Fernanda Araujo, Julio Alberto Nitzke, Claudia Blauth Klipel and Erna Vogt de

78
Jong 2010. Chocolate and red wine - A comparison between flavonoids content. Food
Chemistry 120: 109-112.
Porter, William L. and Joseph H. Schwartz 1962. Isolation and description of the
pectinase-inhibiting tannins of grape leaves. Journal of Food Science 27: 416-418.
Potter, Norman N. and Joseph H. Hotchkiss 1995. Food science. New York: Chapman &
Hall.
Prigent, Stephanie V. E., Harry Gruppen, Antonie J. W. G. Visser, Gerrit A. Van
Koningsveld, Govardus A. H. De Jong and Alfons G. J. Voragen 2003. Effects of
non-covalent interactions with 5-o-caffeoylquinic acid (chlorogenic acid) on the heat
denaturation and solubility of globular proteins. Journal of Agricultural and Food
Chemistry 51: 5088-5095.
Rawel, Harshadrai M., Dorte Czajka, Sascha Rohn and Jurgen Kroll 2002. Interactions of
different phenolic acids and flavonoids with soy proteins. International Journal of
Biological Macromolecules 30: 137-150.
Rossi, Joseph A. and Vernon L. Singleton 1966. Flavor effects and adsorptive properties
of purified fractions of grape-seed phenols. American Journal of Enology and Viticulture
17: 240-246.
Roux, D. G. and E. Paulus 1962. Condensed tannins 12. polymeric leuco-fisetinidin
tannins from the heartwood of acacia mearnsil. Biochemical Journal 82: 320-324.
Rui, Liu, Qi Wei, Su Rongxin, Zhang Yubin, Jin Fengmin and He Zhimin 2007.
Dissolution and enzymatic hydrolysis of casein micelles studied by dynamic light
scattering. Front. Chem. Eng. China 1: 123-127.
Ruth, Saskia M. Van, Emad S. Shaker and Patrick A. Morrissey 2001. Influence of
methanolic extracts of soybean seeds and soybean oil on lipid oxidation in linseed oil.
Food Chemistry 75: 177-184.
Sastry, M. C. Shamanthaka and M. S. Narasinga Rao 1990. Binding of chlorogenic acid
by the isolated polyphenol-free 11S protein of sunflower (helianthus annuus) seed.
Agricultural and Food Chemistry 38 (12): 2103-2110.
Schultz, H. W. and A. F. Anglemier 1964. Symposium on foods: proteins and their
reactions. Westport, Connecticut: THE AVI PUBLISHING COMPANY, INC.

79
Semenova, Maria G., Anna S. Antipova and Larisa E. Belyakova 2002. Food protein
interactions in sugar solutions. Current Opinion in Colloid & Interface Science 7:
438-444.
Siebert, Karl J., Nataliia V. Troukhanova and Penelope Y. Lynn 1996. Nature of
polyphenol-protein interactions. Journal of Agricultural and Food Chemistry 44: 80-85.
Spencer, Catriona M., Ya Cai, Russell Martin and Simon H. Gaffney 1988. Polyphenol
complexation-some thoughts and observations. Phytochemistry 27: 2397-2409.
Stewart, A.F., I.M. Willis and A.G. Mackinlay 1984. Nucleotide sequences of bovine
alpha S1- and kappa-casein cDNAs. Nucleic Acids Res 12: 3895-3907.
Suman, C N, P Vincent Monteiro, Geeta Ramachandra and L Sudharshana 1992. In-vitro
enzymic hydrolysis of the storage proteins of Japanese barnyard millet (Echinochloa
frumentacea). J. Sci. Food Agric 58: 505-509.
Swaisgood, Harold E. 1993. Symposium: Genetic perspectives on milk proteins:
Comparative studies and nomenclature. Journal of Dairy Science 76: 3054-3061.
Tanaka, Takuji, Toshihiro Kojima, Toshihiko Kawamori, Naoki Yoshimi and Hideki Mori
1993. Chemoprevention of diethylnitrosamine-induced hepatocarcinogenesis by a simple
phenolic acid protocatechuic acid in rats. CANCER RESEARCH 53: 2775-2779.
Tolstoguzov, V. B. 1991. Functional properties of food proteins and role of
protein-polysaccharide interaction. Food Hydrocolloids 4: 429-468.
Tsai, Pi-Jen and Chen-Hue She 2006. Significance of phenol-protein interactions in
modifying the antioxidant capacity of peas. Journal of Agricultural and Food Chemistry
54: 8491-8494.
Tuckey, S. L. 1963. Properties of casein important in making cottage cheese. In Properties
of casein important in making cottage cheese, Cottage Cheese and Sour Cream, 324-326.
University of Illinois.
Veloso, Ana C.A., Natercia Terxeira and Isabel M.P.L.V.O. Ferreira 2002. Separation and
quantification of the major casein fractions by reverse-phase high-performance liquid
chromatography and urea-polyacrylamide gel electrophoresis Detection of milk
adulterations. Journal of Chromatography A 967: 209-218.
Wehr, H. M. 1973. Reactions with phenols and quinones: evaluation of amino acid

80
modification and protein digestibility, Oregon State University.
Yin, Mei-Chin, Chun-Che Lin, Hsi-Chin Wu, Shih-Ming Tsao and Cheng-Kuang Hsu
2009. Apoptotic effects of protocatechuic acid in human breast, lung, liver, cervix, and
prostate cancer cells: Potential mechanisms of action. Journal of Agricultural and Food
Chemistry 57: 6468-6473.