Embed Size (px)
Citation preview

Cash to growthPivot pointAn EMEA research report September 2014 GO

Contents
Growth is back on the agenda. While challenging conditions remain for some, a renewed sense of
confidence is driving others. So how are these businesses planning to turn their cash into growth?
Deloitte understands the need to get to grips with the actual investment intentions of companies
both large and small. Business and policy decision makers alike face a challenge to get an inside
track on the key issues such as: Has market volatility and uncertainty driven a propensity to grow
cash surpluses? Is the plan to use cash on the balance sheets or leverage the ultra-low interest
rates to fund these plans? Which markets will be targeted to drive growth? Which are the best
strategies to optimise capital expenditure into revenues? Can business enhance its competitive
edge to win in an increasingly global marketplace?
This research provides the perspective of 271 C-level executives of businesses based in 14 countries
within the EMEA region. Among the key findings is a clear push to move past the gloom and
doom of the recession towards a future characterised by growth and optimism. The challenge for
these businesses is how to turn their intentions into actions, in an increasingly competitive global
environment. As Deloitte DTTL’s Global & EMEA Clients & Industries Leader, Pascal Pincemin,
states “this report provides an innovative way of combining bespoke data with the insight from
specialists across the Deloitte network that have first-hand experience of both their country- and
industry-specific challenges”.
I hope you find this report useful as you develop your future business strategy moving forward.
To the many business leaders who took the time to respond to our survey, thank you for your time
and invaluable input. We look forward to continuing this important strategic conversation with you.
Chris GentlePartner, Head of EMEA and UK Research
Welcome
Using this report
In each chapter you will find:
• a summary of the key insights across all respondents internationally
• an interactive infographic which allows you to view the major findings
by company size and industry
• an analysis of the data based on some of the key challenges identified.
1. Executive summary
2. Where is EMEA today?
3. Cash piles
4. Priorities
5. Drivers
6. Markets
7. Investment story
8. 2020
9. Regional variations
10. Recommendations
11. Respondents’ profile10
11
9
8
7
6
5
4
2
3
1
3Major businesses across the EMEA region look set for a new
era of growth. Armed with a potent mixture of surplus cash and
market opportunities, the vast majority of these businesses have reached
a ‘pivot point’. While this is encouraging, given the gloomy economic
period that the region has endured since the financial crisis, it remains
uncertain whether these companies have the confidence to invest their
surplus cash in growth opportunities.
Deloitte estimates that listed companies across EMEA have
around €1 trillion in liquid assets, with 17 per cent holding
75 per cent of the cash pile. Since the financial crisis the build-up of cash
has continued. The survey, carried out among C-level executives across
the region, has uncovered what these companies plan to do. While some
are focusing on strengthening their balance sheet or returning cash to
shareholders – reflecting the more cautious attitude of businesses since
the financial crisis – others have a more optimistic view of what is to come.
Executives in six out of ten businesses showed optimism by identifying
investments as their main priority over the next 12 months. This is very
good news as business investment is key in countering the potential
negative impact of high government and household debt. This sense of
optimism is furthered by the fact that, of those prioritising investment,
55 per cent identified “growth” as their primary focus. Next is
innovation with around a fifth focusing on improving their products and
processes. And, nearly a quarter, aim to boost maintenance of existing
business infrastructure and assets.
1
Businesses across the region have committed to a three-pronged
approach to turn their surplus cash into growth. First, is expansion
into new markets – beyond the BRICs. Companies are looking to
combine mature western markets with fast growing eastern ones
to balance their portfolio. Second, companies are focusing on new
technologies, recognising that competiveness is crucial. Third, and
perhaps most surprisingly, is staff training and development. Executives
have recognised that poor productivity levels can be improved by
investing in their staff.
It is clear from our research that companies are committed to investment
and growth both over the next 12 months and through 2017. What is
also encouraging is the resurgence of five-year plans: more than
90 per cent of those surveyed identified corporate aspirations
and ambitions looking to 2020. The key question that remains is
whether focusing on turning cash to growth will be sufficient for EMEA –
based firms to win in increasingly competitive global markets. The answer
is not clear as this brighter growth outlook may be masking a longer tem
warning around EMEA’s competitiveness, given that 41 European firms
have left the Global Fortune 500 over the past four years.
Due to the risk and uncertainty that characterise the new market
environment, we are putting forward five recommendations aimed
at optimising growth strategies. These recommendations range
from the appointment of a Chief Growth Officer to the reassessment of
risk awareness and management procedures currently in place. At the
foundation of these recommendations is the premise that businesses
need subject matter expertise to be competitive and grow.
Executive summary Please download the Cash to Growth: Pivot point
infographic for a graphical representation of the report >
7
6
5
4
2
3
1
10
11
9
8
9
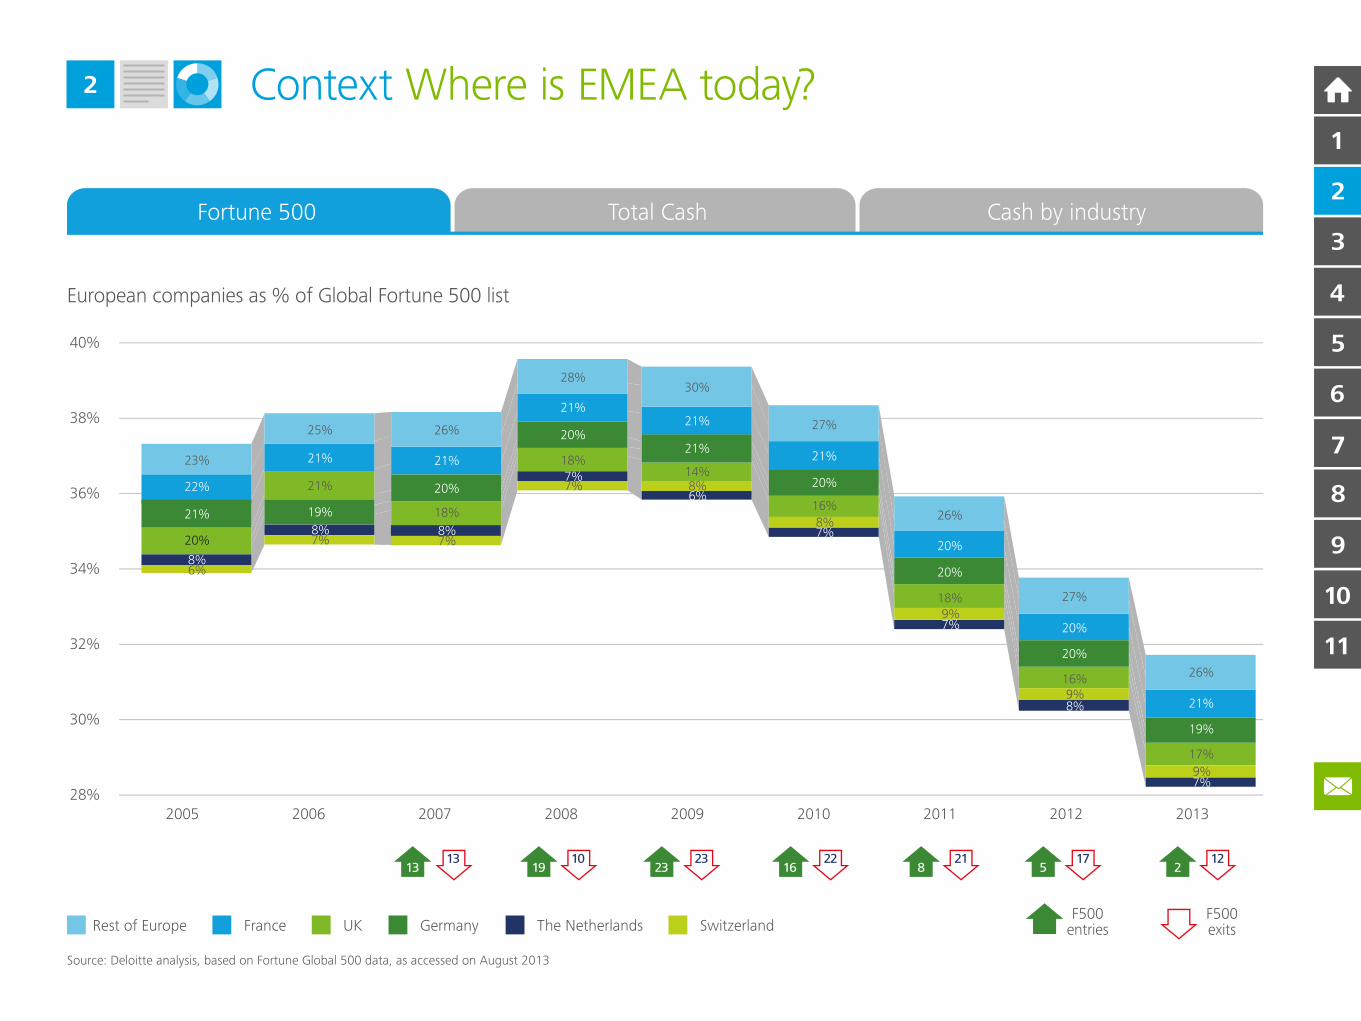
Fit for the future
The historical importance of Europe’s contribution to the global economy
has never been questioned: just consider the financial markets in the
City of London, the fashion houses of Paris and Milan or the car giants
of Germany. Today, as the balance of power in the global economy
shifts to the west and the east so, too, are major global businesses. In
little over a decade Silicon Valley has given birth to some of the world’s
largest businesses. Meanwhile, Asia has produced a host of world class
companies in sectors ranging from electronics to aviation. What the last
four years have brought is an acceleration of this process with significant
implications for the EMEA region. For instance, a net balance of 41
European companies has exited the Global Fortune 500 since 2010.1
These businesses have lost their place in the global elite due to falling
revenues, so the question becomes whether EMEA businesses are fit
enough to meet the competitive challenges globalisation has brought.
Enhancing business competitiveness will, over the longer term, be critical
to generating wealth across the region.
Building balance sheets
This year’s meeting of the World Economic Forum in Davos was
dominated by a debate on unspent corporate cash. Since 2000, the
world’s largest companies have generated more cash than they could
spend. What set the agenda at Davos was not just the fact that
these cash reserves had reached $2.8 trillion, but that a third of those
companies hold over 80 per cent of the cash.2
Context Where is EMEA today?2
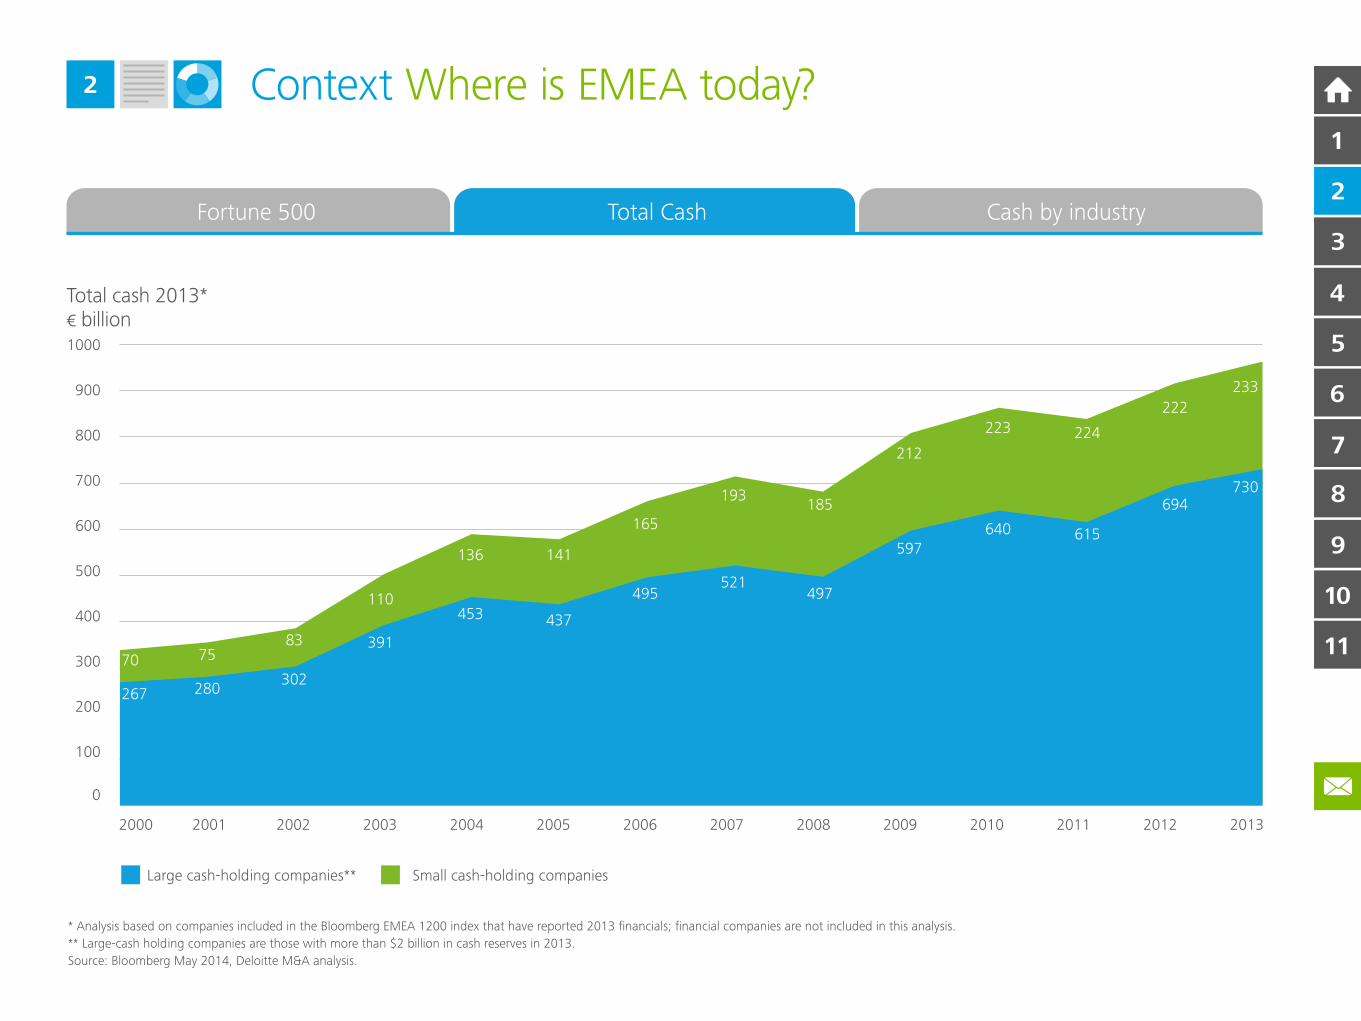
The topic that gripped Davos originated from research conducted by
Deloitte LLP. Here we have repeated this analysis for public companies
in EMEA showing that they held close to €1 trillion in surplus cash
at the end of 2013. Again, these cash piles are unevenly distributed.
Our analysis found that just 17 per cent of the companies account for
over75 per cent of the total cash reserves in EMEA. This suggests that
much of the business investment ‘firepower’ lies with the few rather than
the many.
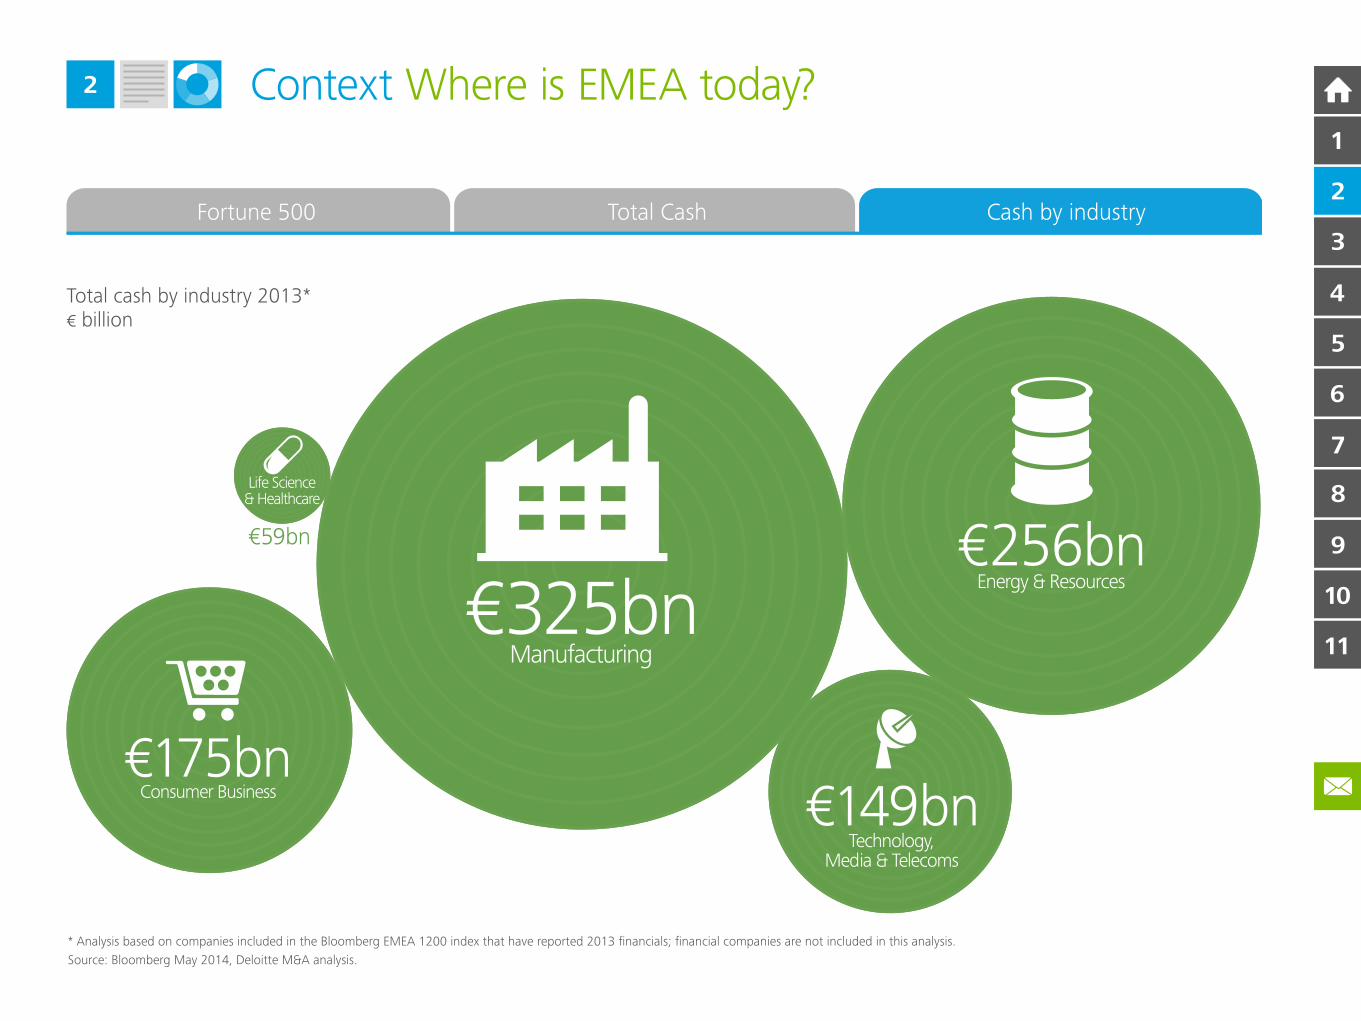
Workshop of the world?
The EMEA region has a diverse and well balanced economy. Each sector
has a different set of advantages, challenges and planning horizons.
Given such diversity it would be wrong to expect all sectors to show
similar behaviours in terms of their balance sheet. What is striking is that
EMEA manufacturing companies hold nearly one-third of cash surpluses
among listed firms. Clearly, they have the financial might to drive
significant investment programmes. The energy and resources sector also
holds a large surplus, but here the reasoning is attributed to their long
planning horizons. Interestingly, companies in the life sciences sector
have the lowest surpluses, although represented by a small number of
large pharmaceutical companies based in Switzerland and the UK.
1 Deloitte LLP analysis, 2014.
2 “ Huge cash pile puts global recovery in the hands of the few”, Financial Times, 21 January 2014.
7
6
5
4
2
3
1
10
11
9
8
Context Where is EMEA today?
28%
30%
32%
34%
36%
38%
40%
201320122011201020092008200720062005
European companies as % of Global Fortune 500 list
Fortune 500 Total Cash Cash by industry
Rest of Europe France UK Germany The Netherlands Switzerland
21%
20%
20%
6%8%
22%
21%
7%8%
21%
19% 18%
7%8%
21%
20%
18%
7%7% 14%
8%
21%
21%
16%
8%7%
21%
20%
18%
26%
9%7%
20%
20%
16%
27%
9%8%
20%
20%
17%
26%
9%7%
21%
19%
23%
25%
21%
26%
28%30%
27%
6%
212213
1319
1023
2316 8 5
172
12
Source: Deloitte analysis, based on Fortune Global 500 data, as accessed on August 2013
F500entries
F500exits
2
Fortune 500
7
6
5
4
2
3
1
10
11
9
8
Context Where is EMEA today?2
0
100
200
300
400
500
600
700
800
900
1000
20132012201120102009200820072006200520042003200220012000
Fortune 500 Total Cash Cash by industry
Large cash-holding companies**
267 280302
Total cash 2013*€ billion
391
453 437
495521
497
597640 615
694730
70 7583
110
136 141
165
193185
212
223 224
222
233
Small cash-holding companies
* Analysis based on companies included in the Bloomberg EMEA 1200 index that have reported 2013 financials; financial companies are not included in this analysis.
** Large-cash holding companies are those with more than $2 billion in cash reserves in 2013.
Source: Bloomberg May 2014, Deloitte M&A analysis.
Total cash
10
11
9
8
7
6
5
4
2
3
1
6
7
Context Where is EMEA today?2
Fortune 500 Total Cash Cash by industry
Total cash by industry 2013*€ billion
* Analysis based on companies included in the Bloomberg EMEA 1200 index that have reported 2013 financials; financial companies are not included in this analysis.
Source: Bloomberg May 2014, Deloitte M&A analysis.
€256bnEnergy & Resources
€59bn
Life Science& Healthcare
€149bnTechnology,
Media & Telecoms
€325bnManufacturing
€175bnConsumer Business
Cash by industry
10
11
9
8
7
6
5
4
2
3
1
Cash piles 3
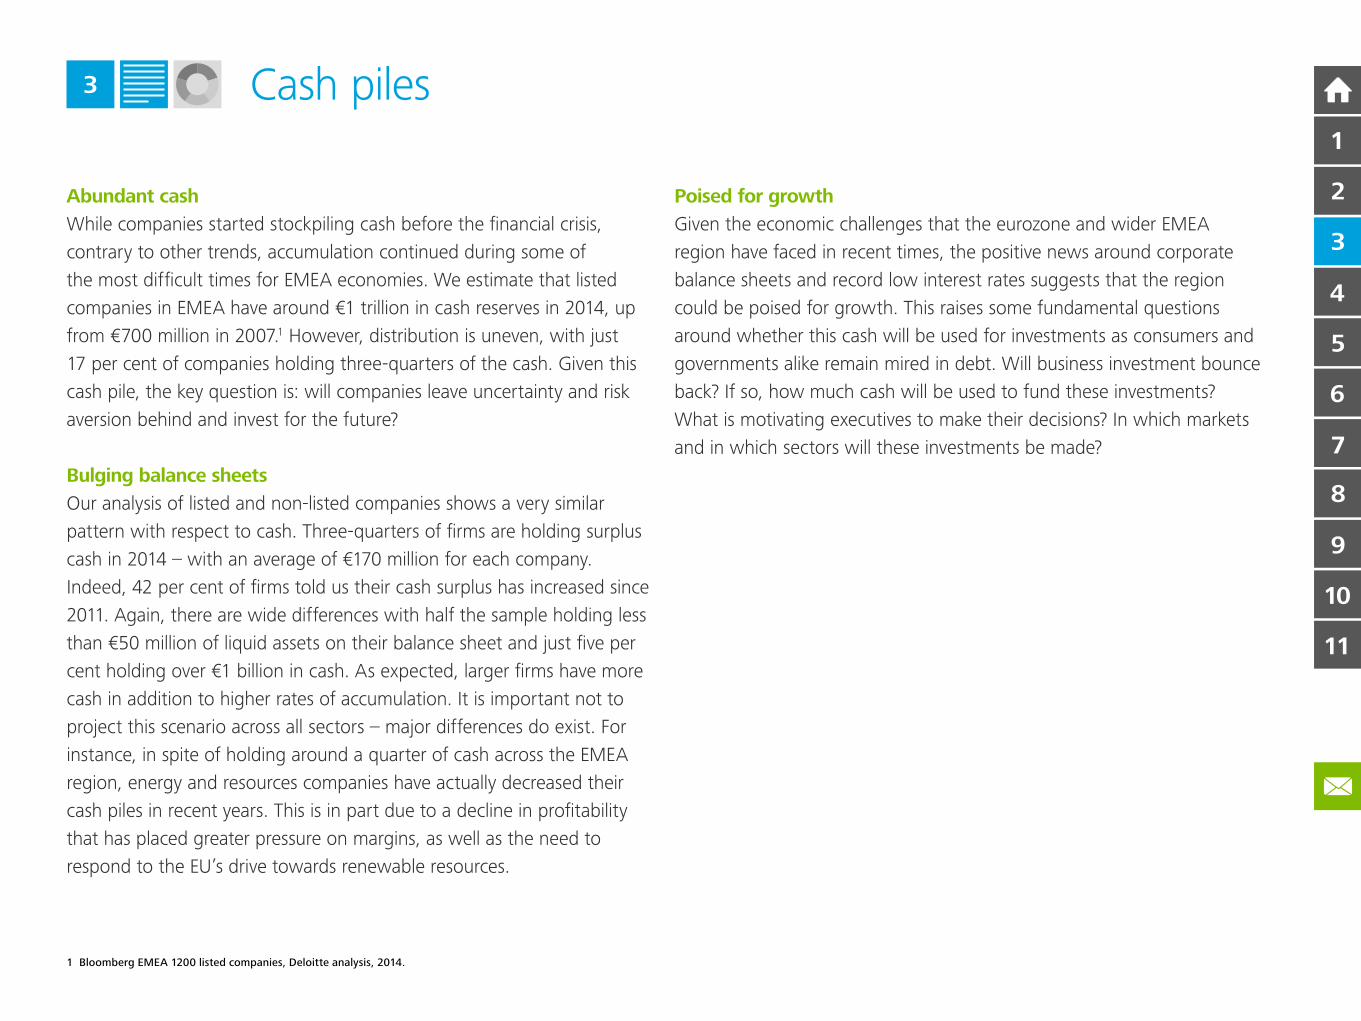
Abundant cash
While companies started stockpiling cash before the financial crisis,
contrary to other trends, accumulation continued during some of
the most difficult times for EMEA economies. We estimate that listed
companies in EMEA have around €1 trillion in cash reserves in 2014, up
from €700 million in 2007.1 However, distribution is uneven, with just
17 per cent of companies holding three-quarters of the cash. Given this
cash pile, the key question is: will companies leave uncertainty and risk
aversion behind and invest for the future?
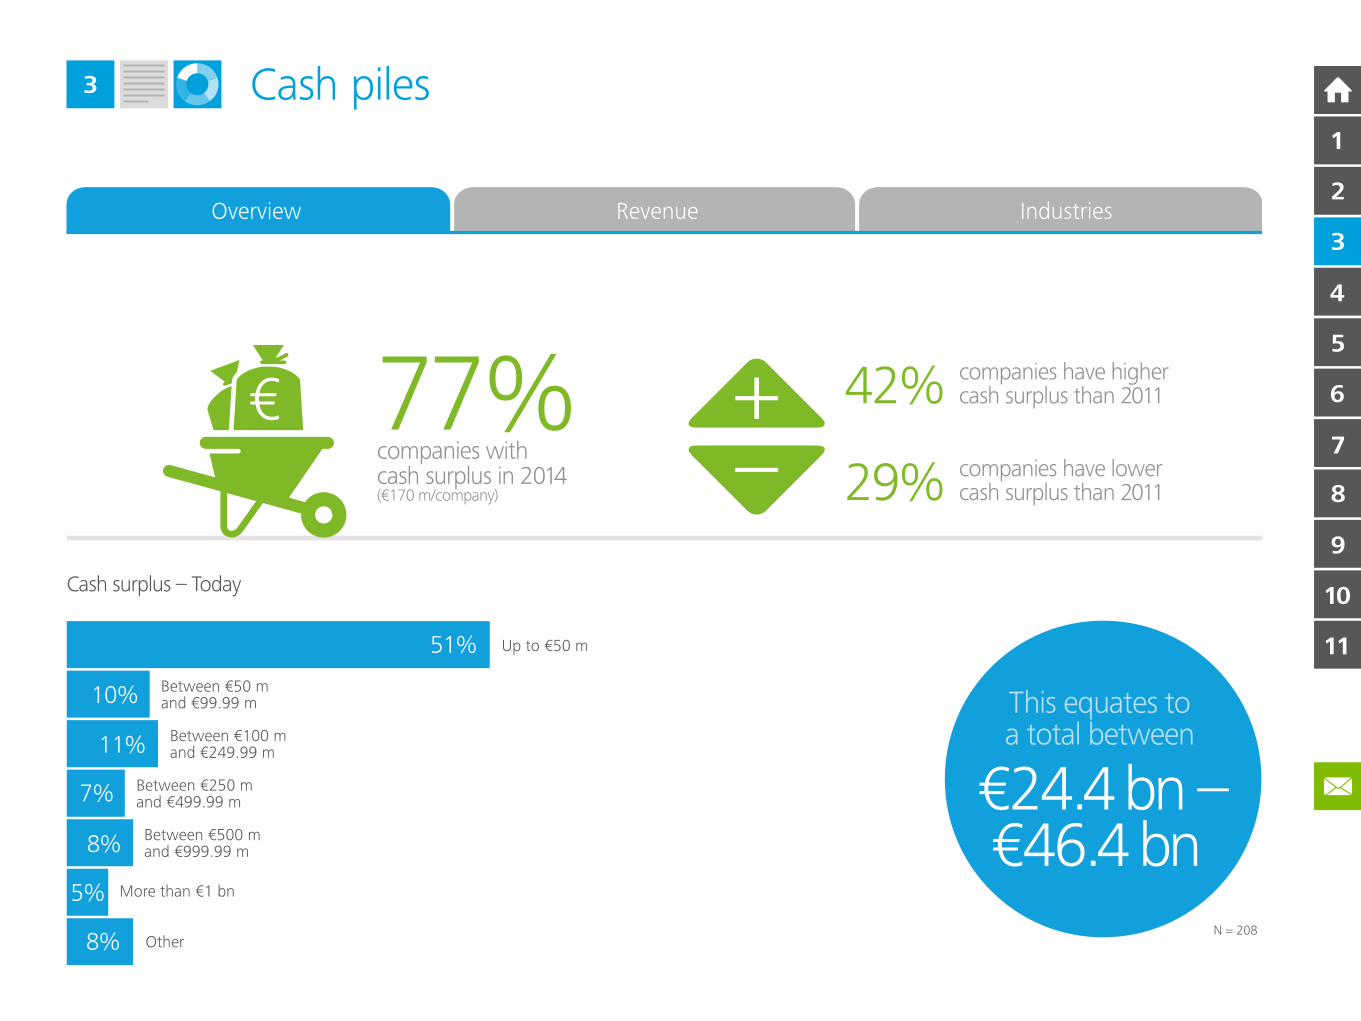
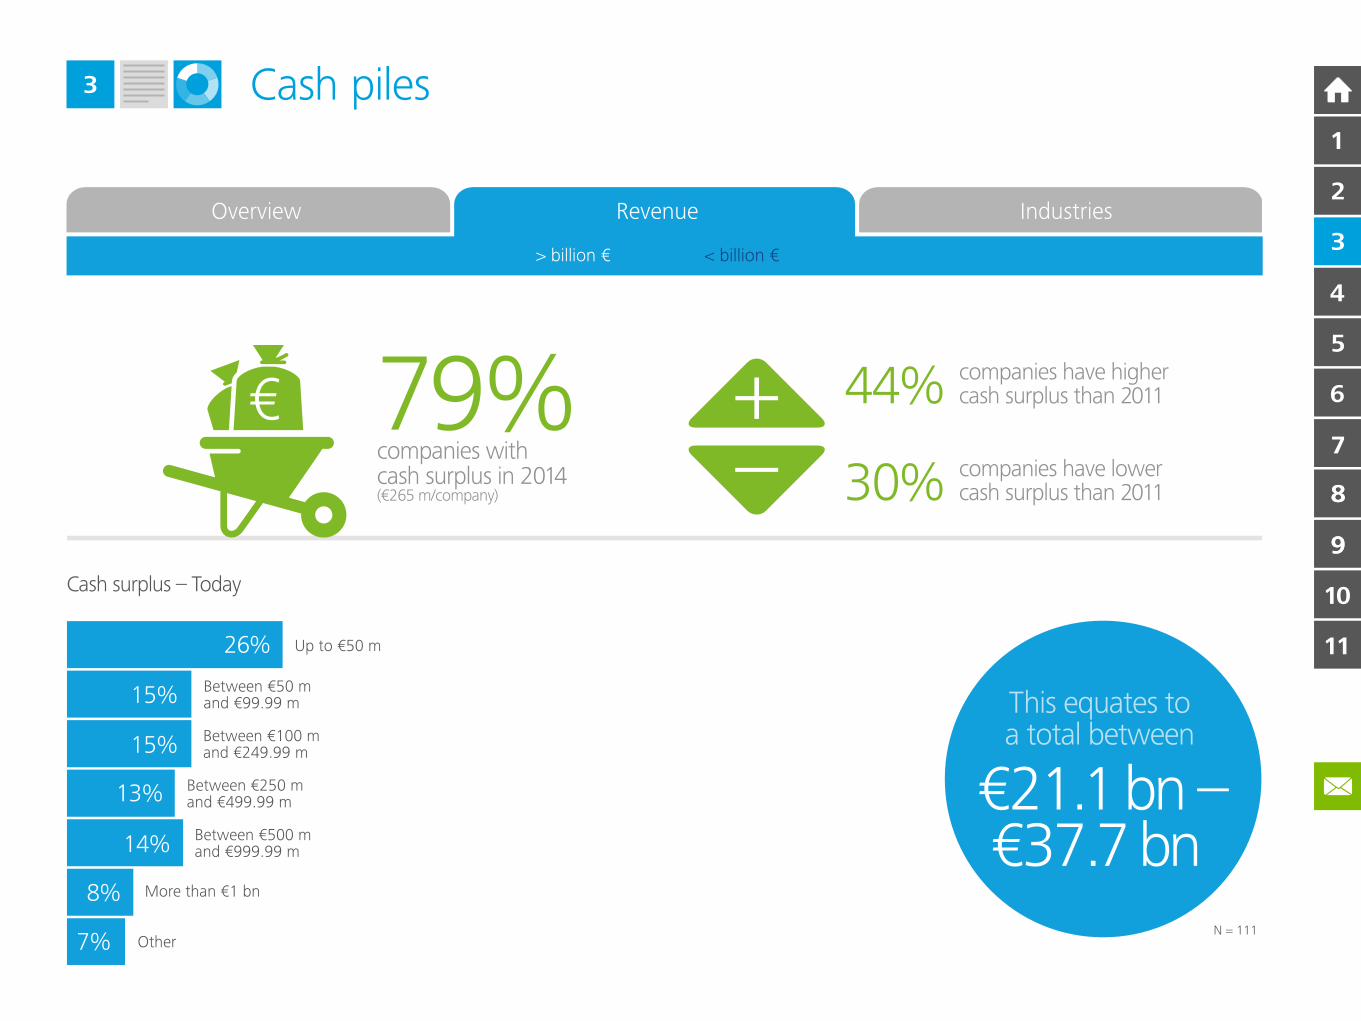
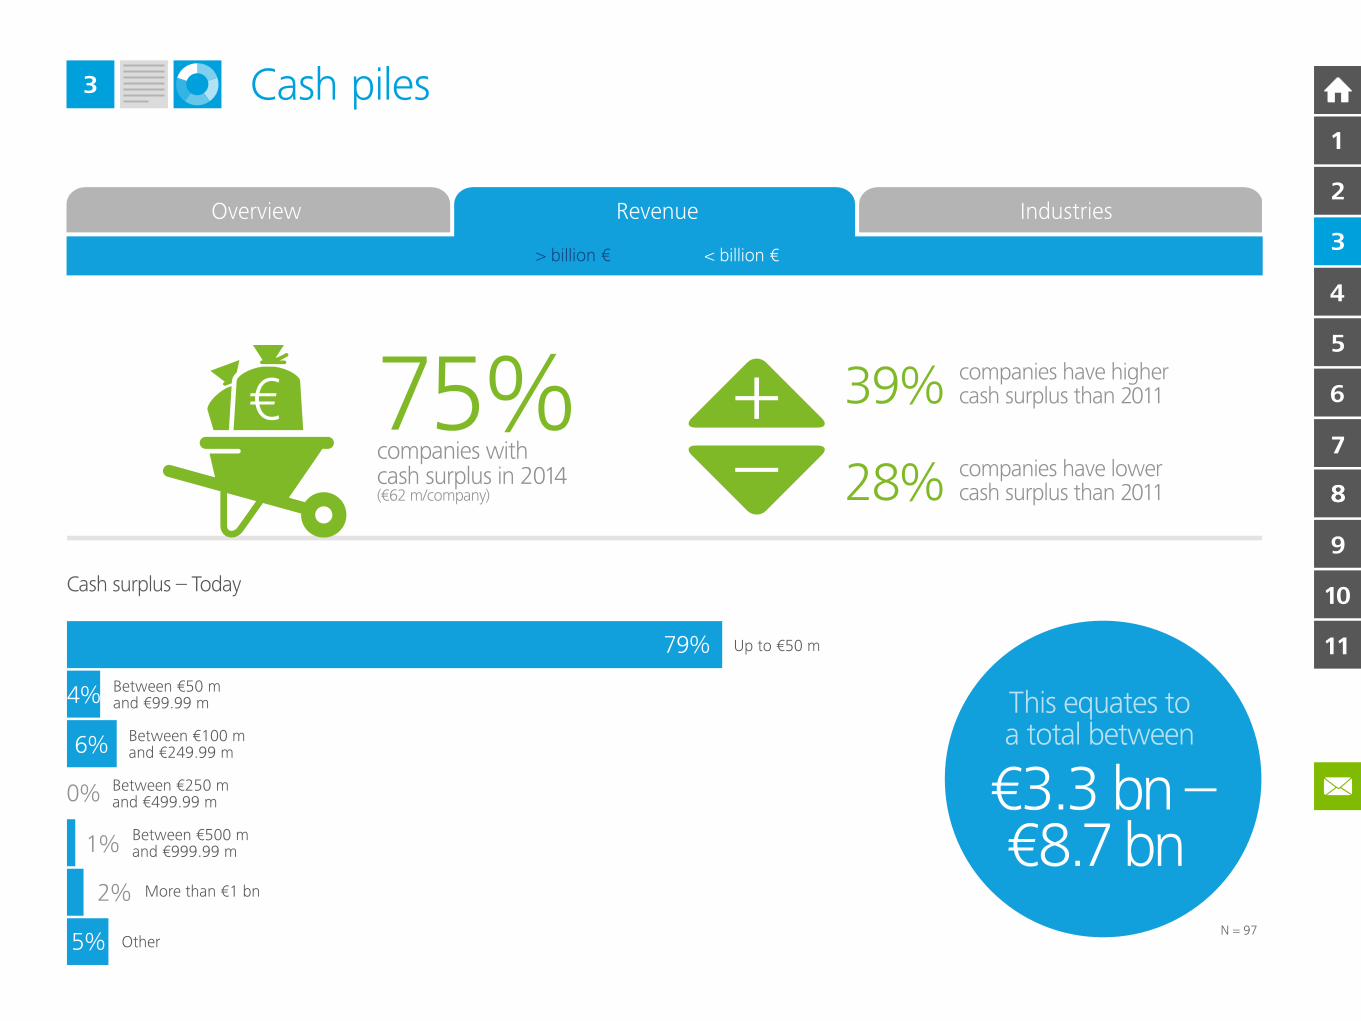
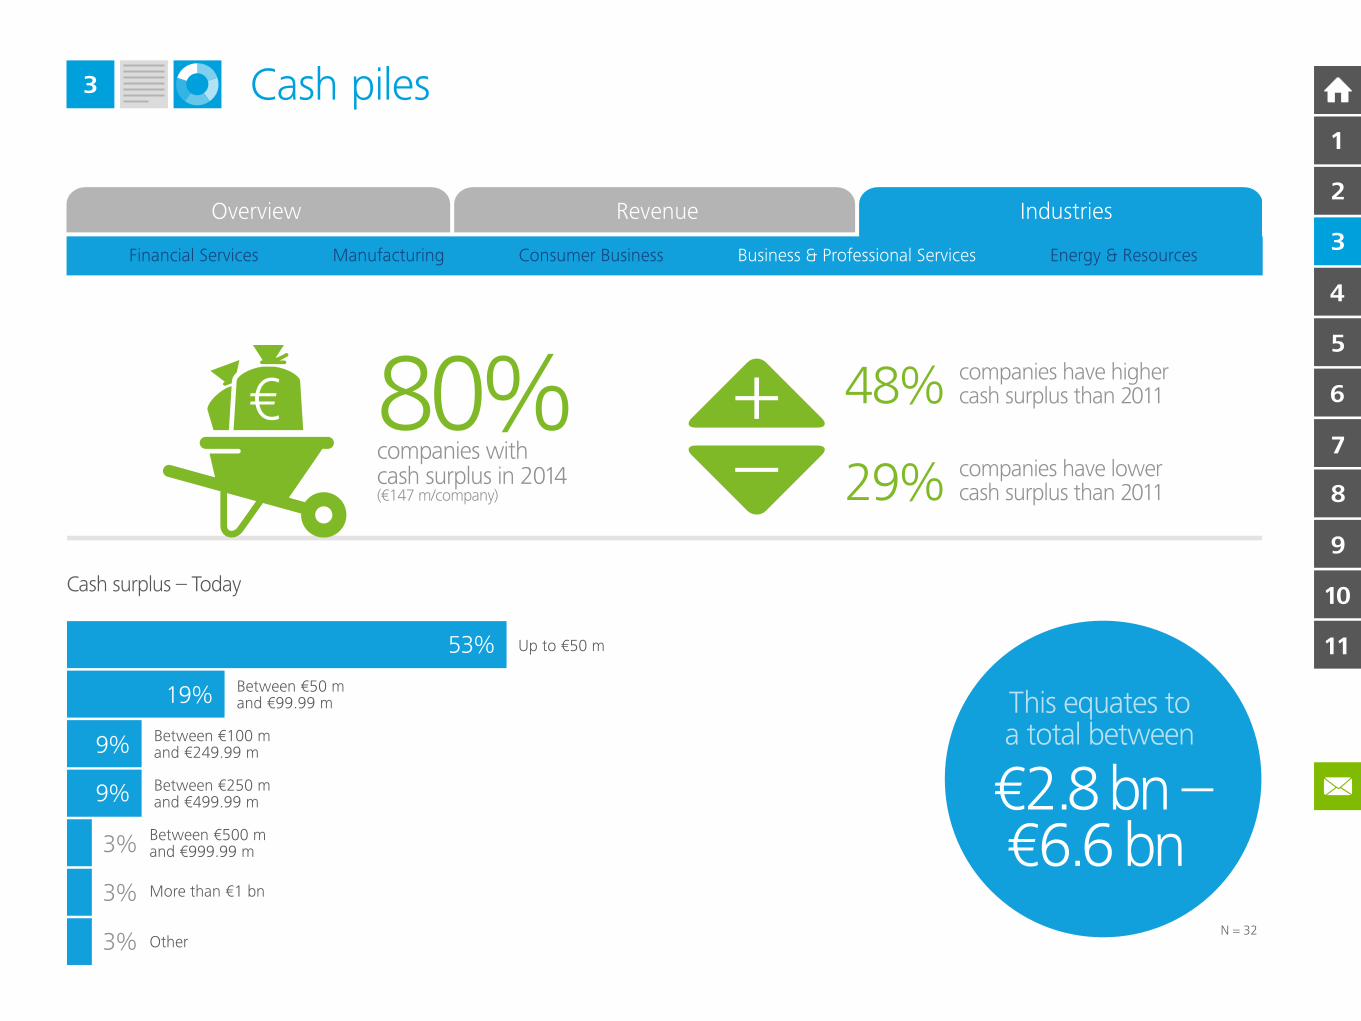
Bulging balance sheets
Our analysis of listed and non-listed companies shows a very similar
pattern with respect to cash. Three-quarters of firms are holding surplus
cash in 2014 – with an average of €170 million for each company.
Indeed, 42 per cent of firms told us their cash surplus has increased since
2011. Again, there are wide differences with half the sample holding less
than €50 million of liquid assets on their balance sheet and just five per
cent holding over €1 billion in cash. As expected, larger firms have more
cash in addition to higher rates of accumulation. It is important not to
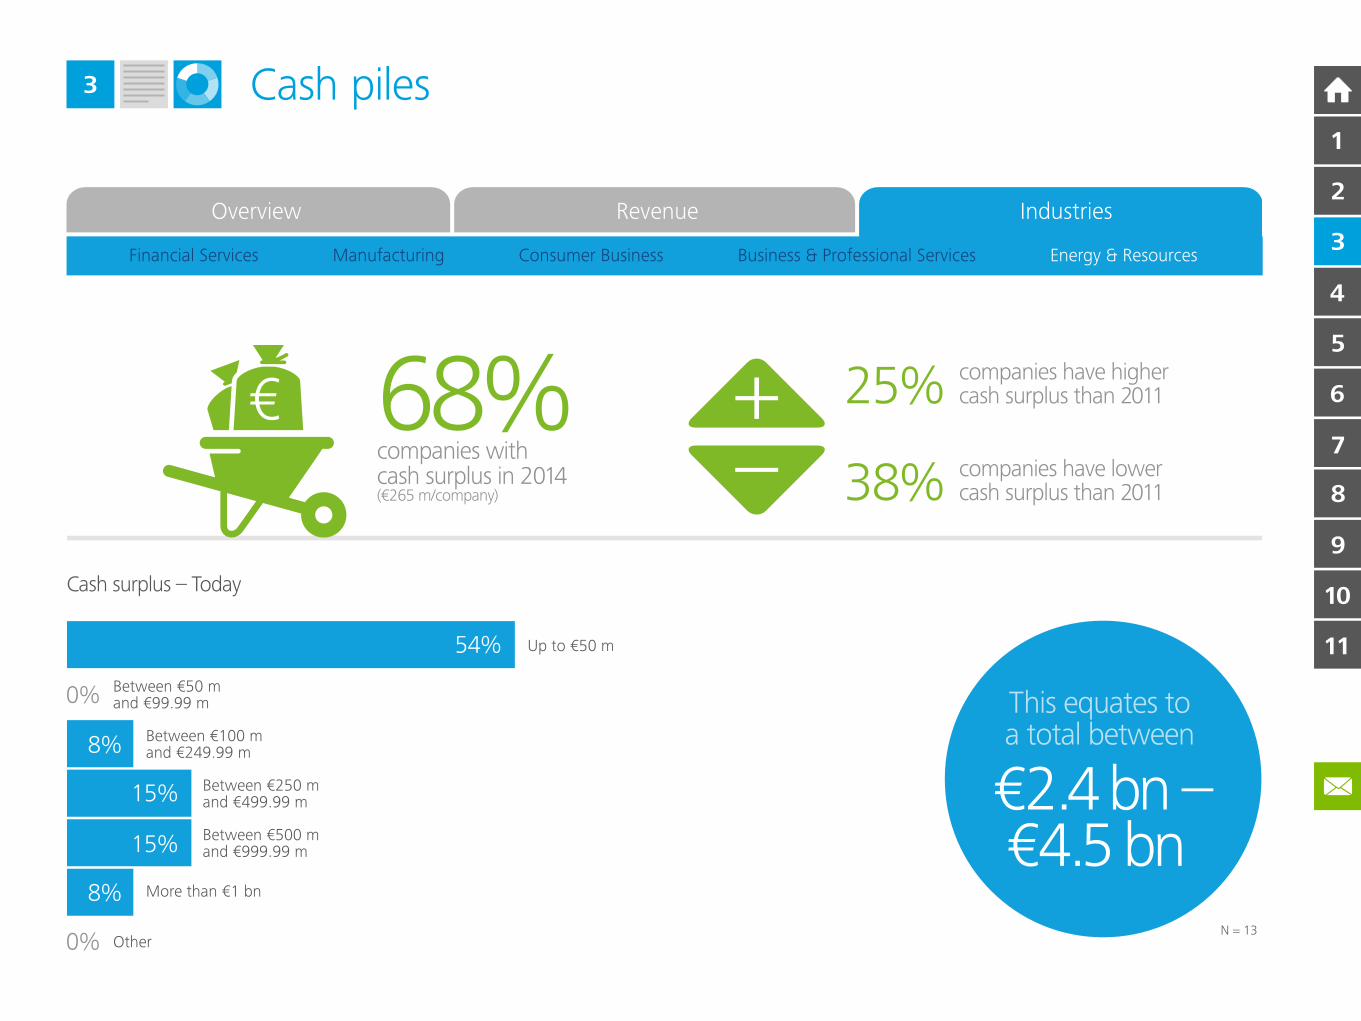
project this scenario across all sectors – major differences do exist. For
instance, in spite of holding around a quarter of cash across the EMEA
region, energy and resources companies have actually decreased their
cash piles in recent years. This is in part due to a decline in profitability
that has placed greater pressure on margins, as well as the need to
respond to the EU’s drive towards renewable resources.
Poised for growth
Given the economic challenges that the eurozone and wider EMEA
region have faced in recent times, the positive news around corporate
balance sheets and record low interest rates suggests that the region
could be poised for growth. This raises some fundamental questions
around whether this cash will be used for investments as consumers and
governments alike remain mired in debt. Will business investment bounce
back? If so, how much cash will be used to fund these investments?
What is motivating executives to make their decisions? In which markets
and in which sectors will these investments be made?
1 Bloomberg EMEA 1200 listed companies, Deloitte analysis, 2014.
10
11
9
8
7
6
5
4
2
3
1
Cash piles 3
Cash Overview
10
11
9
8
7
6
5
4
2
3
1
Cash piles 3
Cash > billion €
> billion € < billion €
10
11
9
8
9
8
7
6
5
4
2
3
1
Cash piles 3
Cash < billion €
> billion € < billion €
10
11
9
88
7
6
5
4
2
3
1
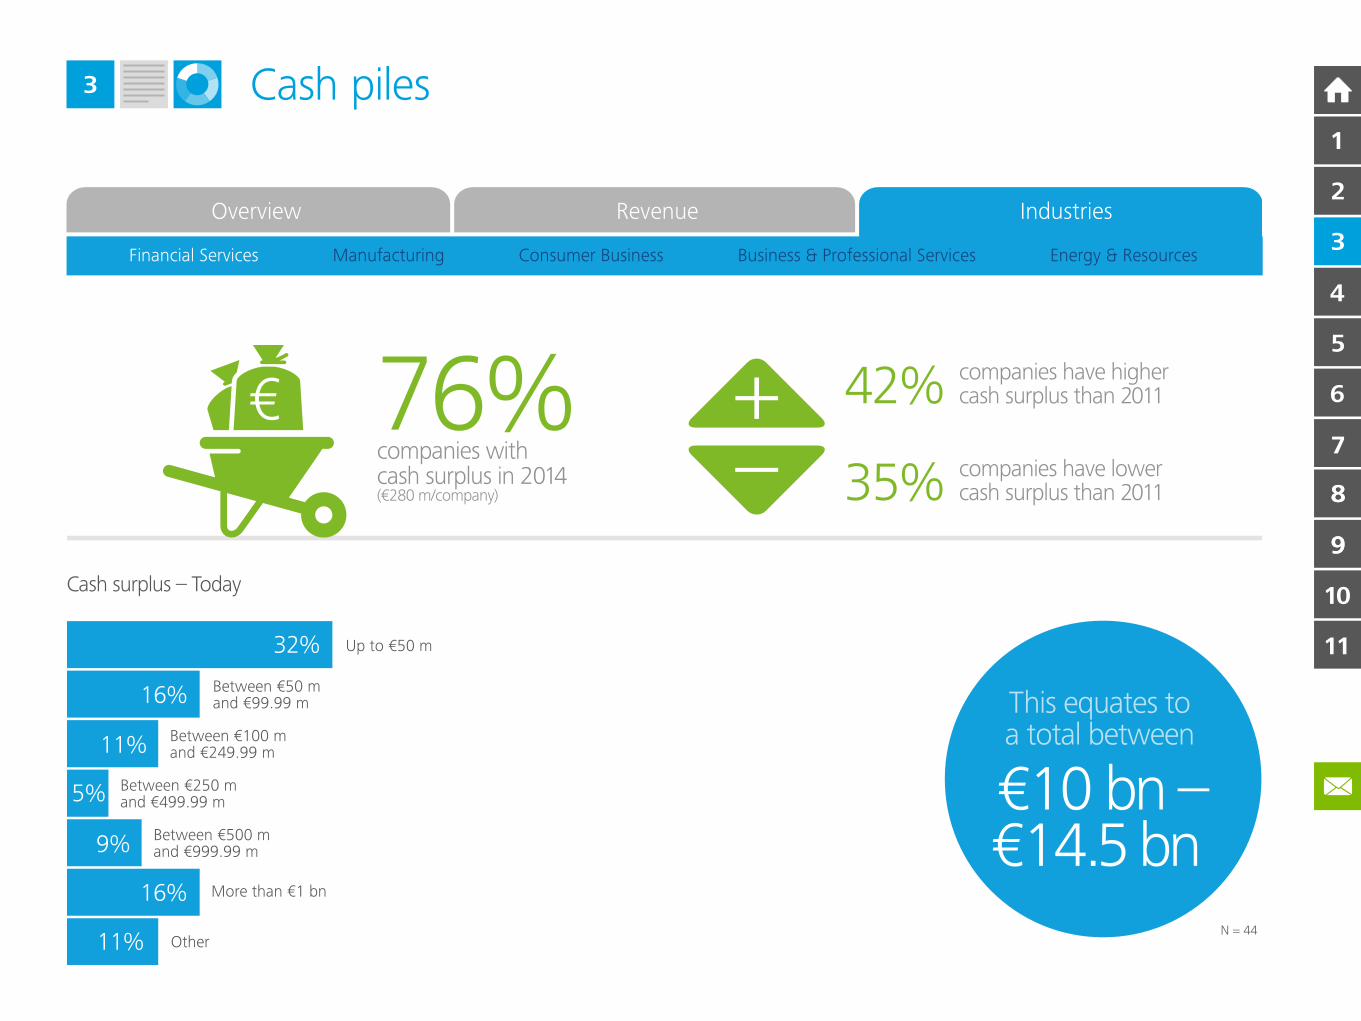
Cash piles 3
Cash Financial Services
10
11
9
8
9
8
7
6
5
4
2
3
1
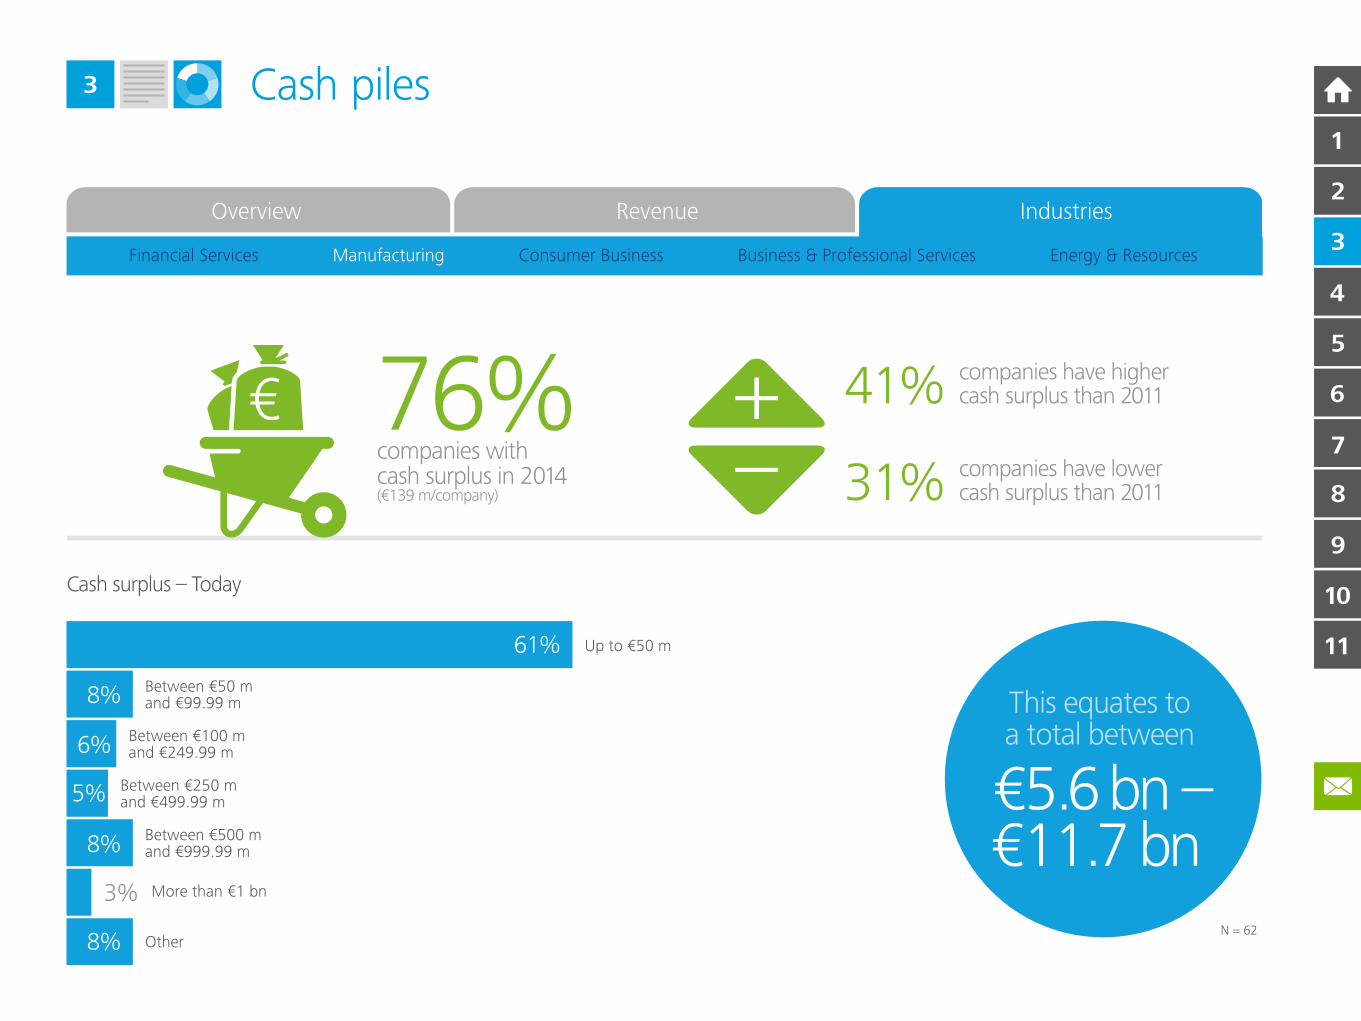
Cash piles 3
Cash Manufacturing
10
11
9
8
7
6
5
4
2
3
1
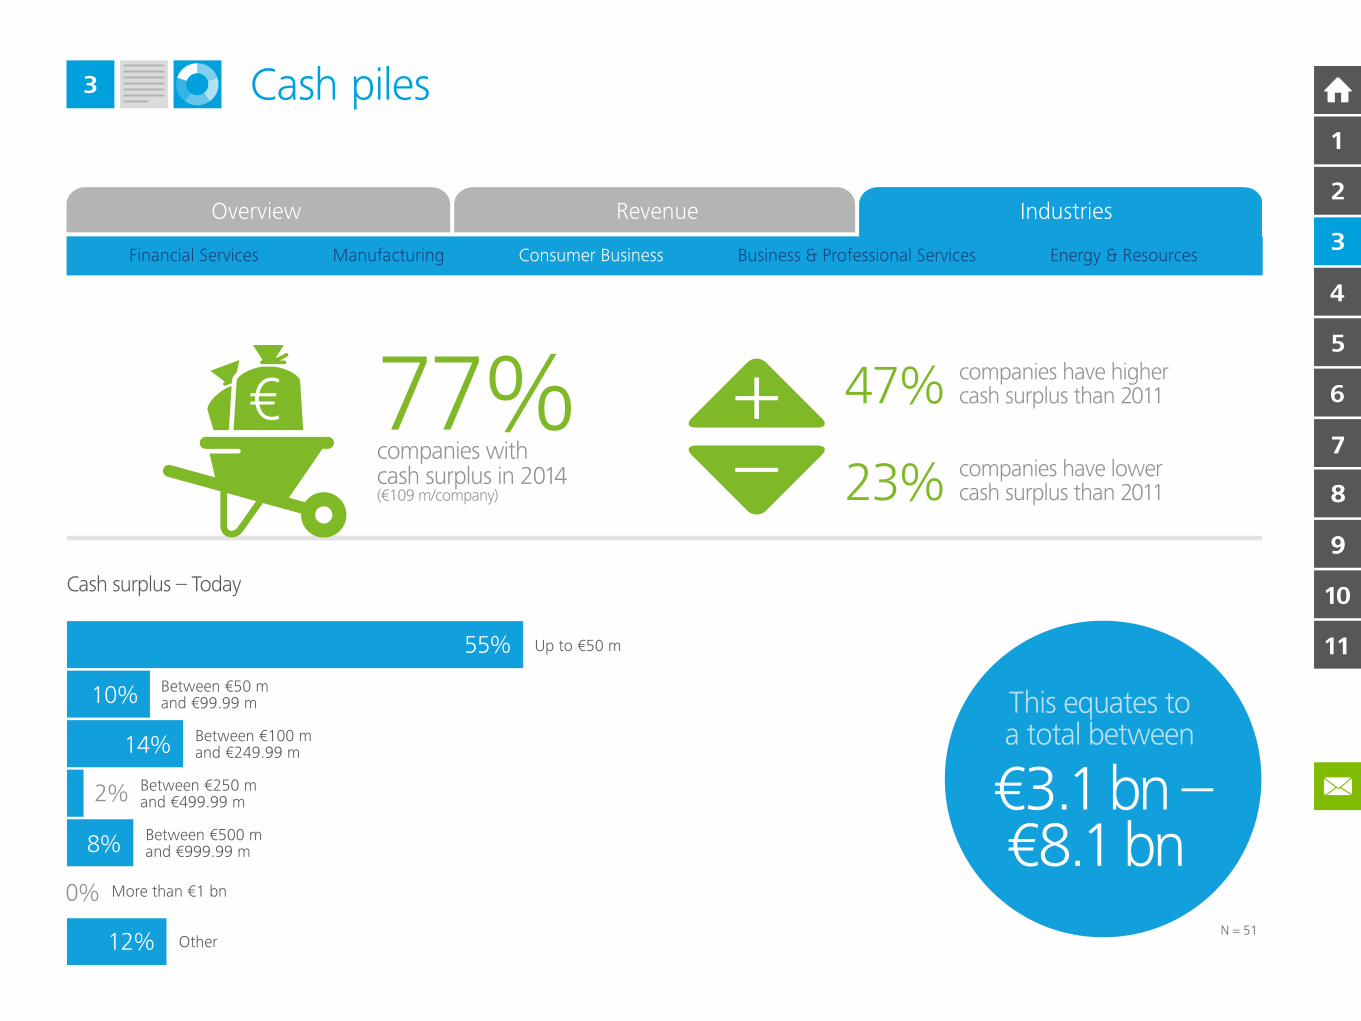
Cash piles 3
Cash Consumer Business
10
11
9
8
9
8
7
6
5
4
2
3
1
Cash piles 3
Cash Business & Professional Services
10
11
9
8
7
6
5
4
2
3
1
Cash piles 3
Cash Energy & Resources
10
11
9
8
7
6
5
4
2
3
1
Priorities4
Rising risk appetite
Policymakers continue to struggle to understand the dynamics of the
economy following the financial and eurozone crises. Their solutions
tend to focus on macroeconomic indicators, while the best solutions
may well rest with corporate decision-makers. Volatility and uncertainty
lower risk appetite among industry chiefs leading them to protect their
balance sheet with cash. However, a ‘pivot point’ in this cycle appears to
have been reached, with a third of firms making investment their priority
over the next 12 months. A further 26 per cent are hedging their bets by
combining investment with returning cash to shareholders. By contrast,
40 per cent plan to prioritise strengthening their balance sheets.
A thoughtful recovery appears to be underway.
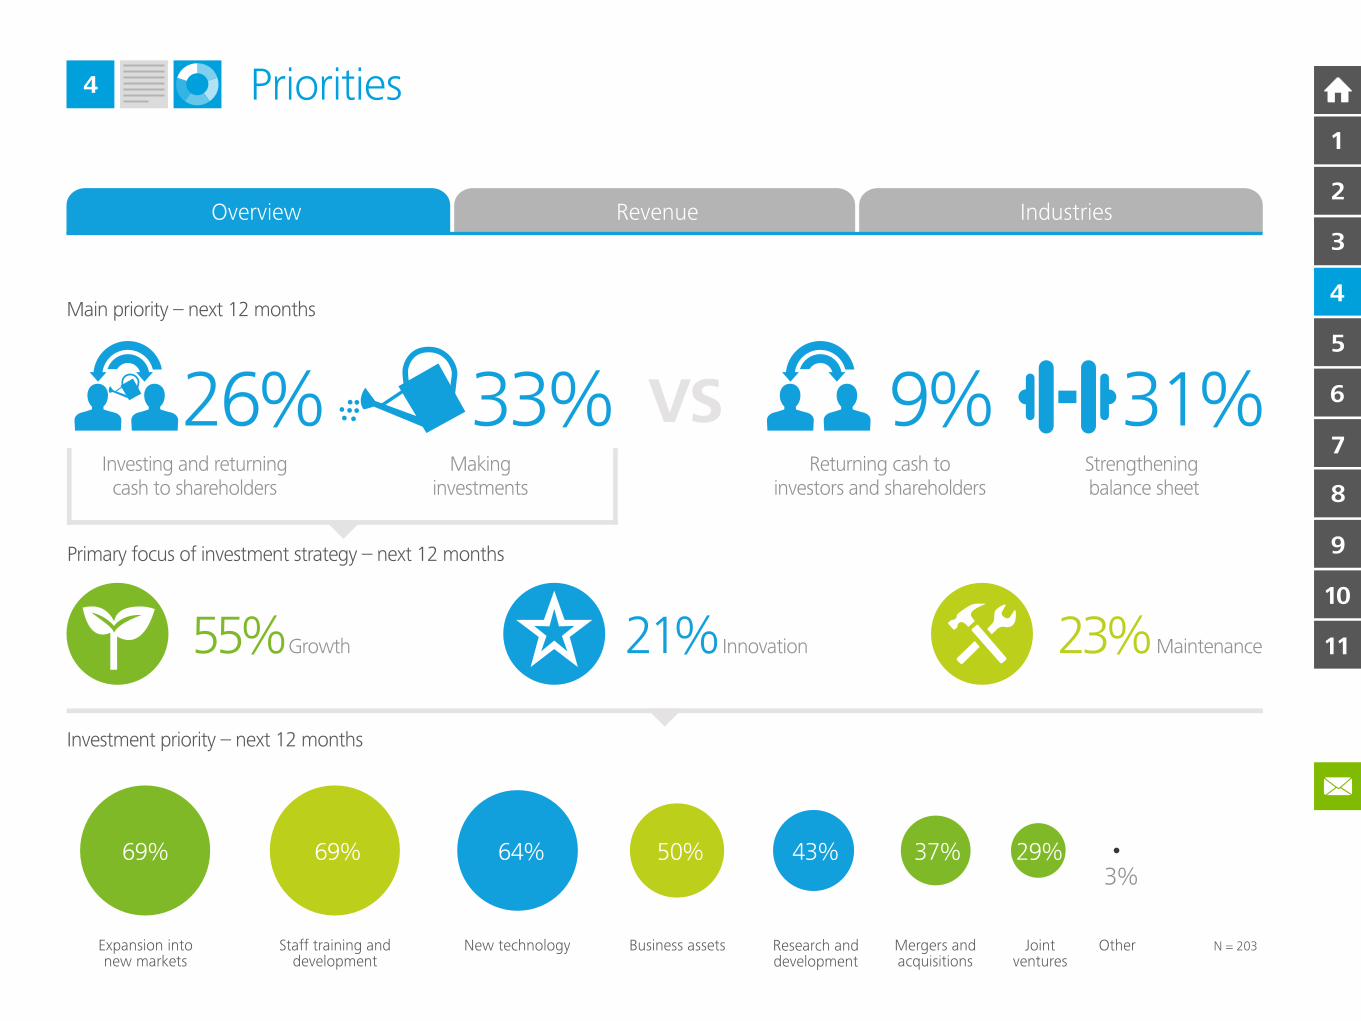
Growth and innovation back on the agenda
Any investment decision is a choice between maintaining existing
assets or investing for growth. Over the next 12 months both growth
and innovation are firmly back on the agenda. Over half of the firms
interviewed identified growth as their top priority, with over 20 per
cent focused on innovation. Interestingly, this focus on growth appears
to be relatively consistent across different industries and between large
and medium-sized companies. The sectors exhibiting the lowest growth
priority are consumer business and business and professional services.
Both these industries place more of an emphasis on maintenance rather
than innovation. Energy and resources companies face very different
conditions, both in terms of longer planning horizons and fierce
international competition, particularly from BRIC multinationals.
Consequently, over half of energy and resources companies make
investment a priority – with over two-thirds focused on growth,
the highest level among all industries.
Talent and new markets key to growth
Much was made of the so-called ‘war for talent’ 15 years ago. However,
since then the key business priority has shifted away from talent towards
focusing on innovation and overall expansion as a result, businesses
have lost sight of the key impact human capital can have. Today, as an
aging workforce is faced with the challenge of increasing productivity
to enhance competitiveness, the focus is shifting back to human capital.
Indeed, senior executives participating in our research made staff training
and development a top investment priority over the next 12 months.
In the financial services, manufacturing and energy sectors people are
the number one investment priority. Firms now appear to hope that by
investing heavily in their workforce, they will enhance productivity and
in turn grow. This is a major shift for business. Allied to investment in
people is expansion into new markets. EMEA businesses recognise the
importance of diversifying their markets, especially since the financial
crisis, and unsurprisingly close to half expect the majority of their
revenues to come from outside their home market.
10
11
9
8
7
6
5
4
2
3
1
Priorities4
Overview Revenue Industries
Main priority – next 12 months
Primary focus of investment strategy – next 12 months
55%Growth 21% Innovation 23%Maintenance
Investment priority – next 12 months
N = 203
69% 69% 64% 50% 43% 37% 29%3%
Expansion intonew markets
Staff training anddevelopment
New technology Business assets Research anddevelopment
Mergers andacquisitions
Jointventures
Other
26%Investing and returningcash to shareholders
Returning cash toinvestors and shareholders
33%Making
investments
VSStrengthening balance sheet
9% 31%
10
11
9
8
7
6
5
4
2
3
1
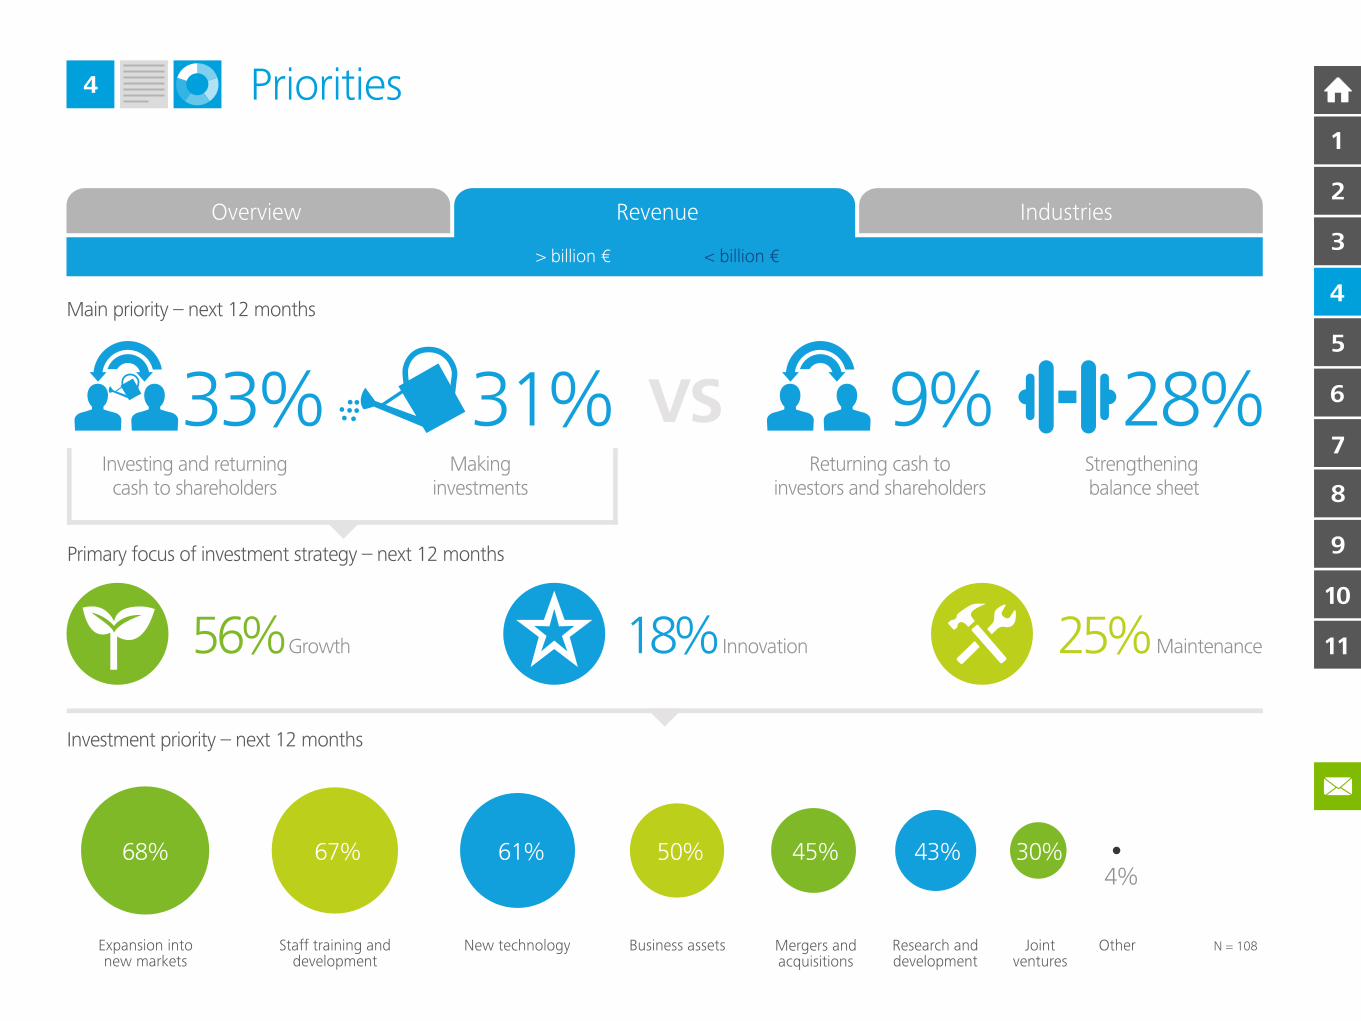
Priorities4
Overview Revenue Industries
Main priority – next 12 months
Primary focus of investment strategy – next 12 months
56%Growth 25%Maintenance
Investment priority – next 12 months
N = 108
18% Innovation
68% 67% 61% 50% 45% 43% 30%4%
Expansion intonew markets
Staff training anddevelopment
New technology Business assets Mergers andacquisitions
Research anddevelopment
Jointventures
Other
33%Investing and returningcash to shareholders
Returning cash toinvestors and shareholders
31%Making
investments
VSStrengthening balance sheet
9% 28%
> billion € < billion €
10
11
9
8
7
6
5
4
2
3
1
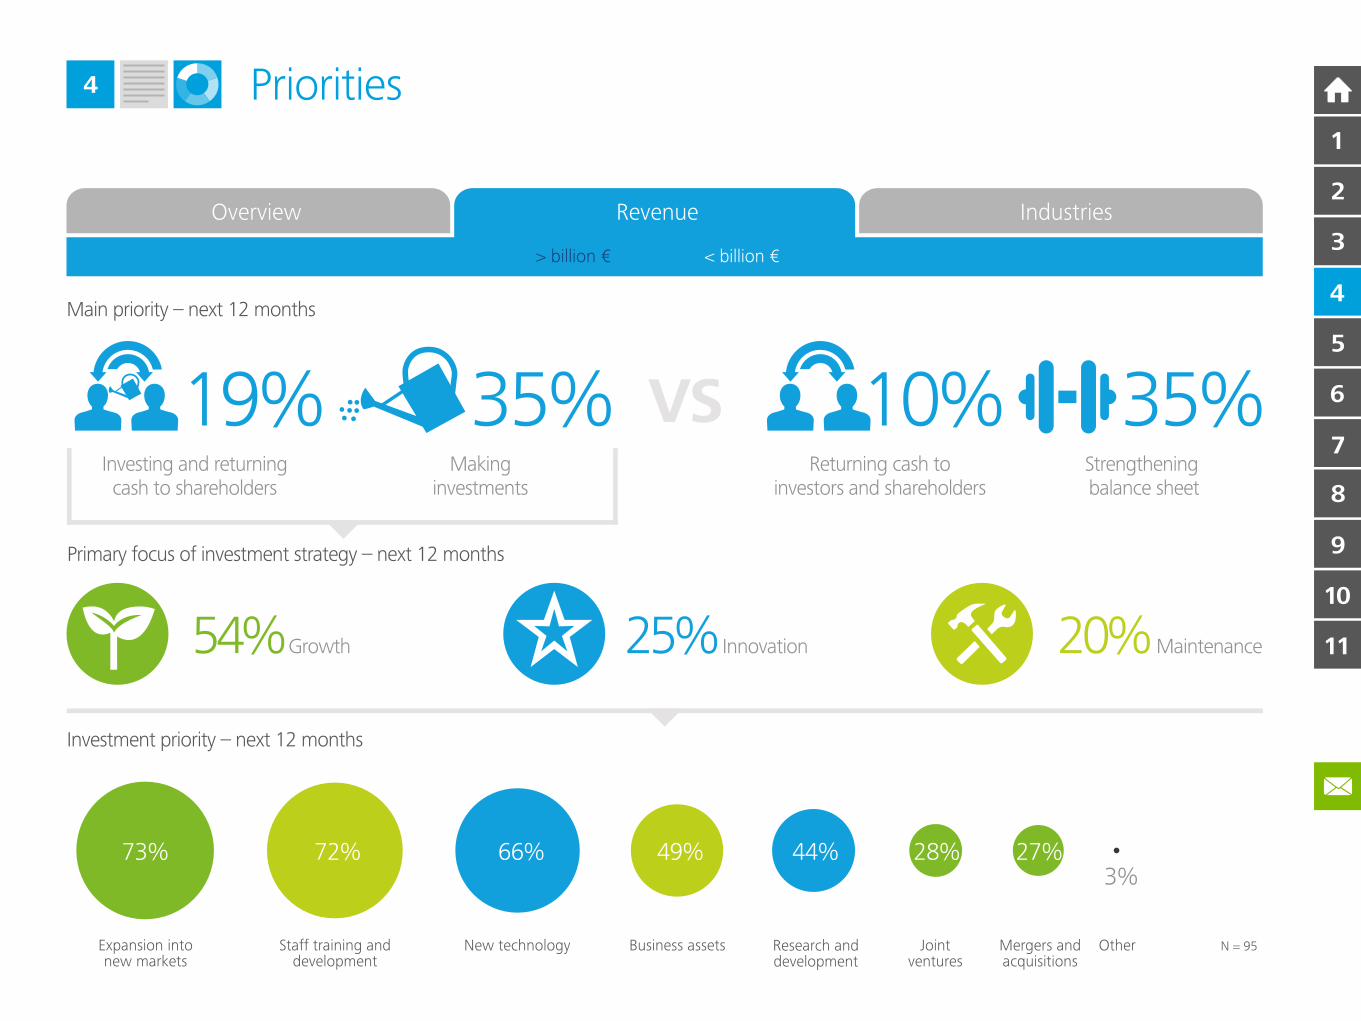
Priorities4
Overview Revenue Industries
Main priority – next 12 months
Primary focus of investment strategy – next 12 months
54%Growth 20%Maintenance
Investment priority – next 12 months
N = 95
25% Innovation
73% 72% 66% 49% 44% 28% 27%3%
Expansion intonew markets
Staff training anddevelopment
New technology Business assets Research anddevelopment
Jointventures
Mergers andacquisitions
Other
19%Investing and returningcash to shareholders
Returning cash toinvestors and shareholders
35%Making
investments
VSStrengthening balance sheet
35%10%
> billion € < billion €
10
11
9
8
7
6
5
4
2
3
1
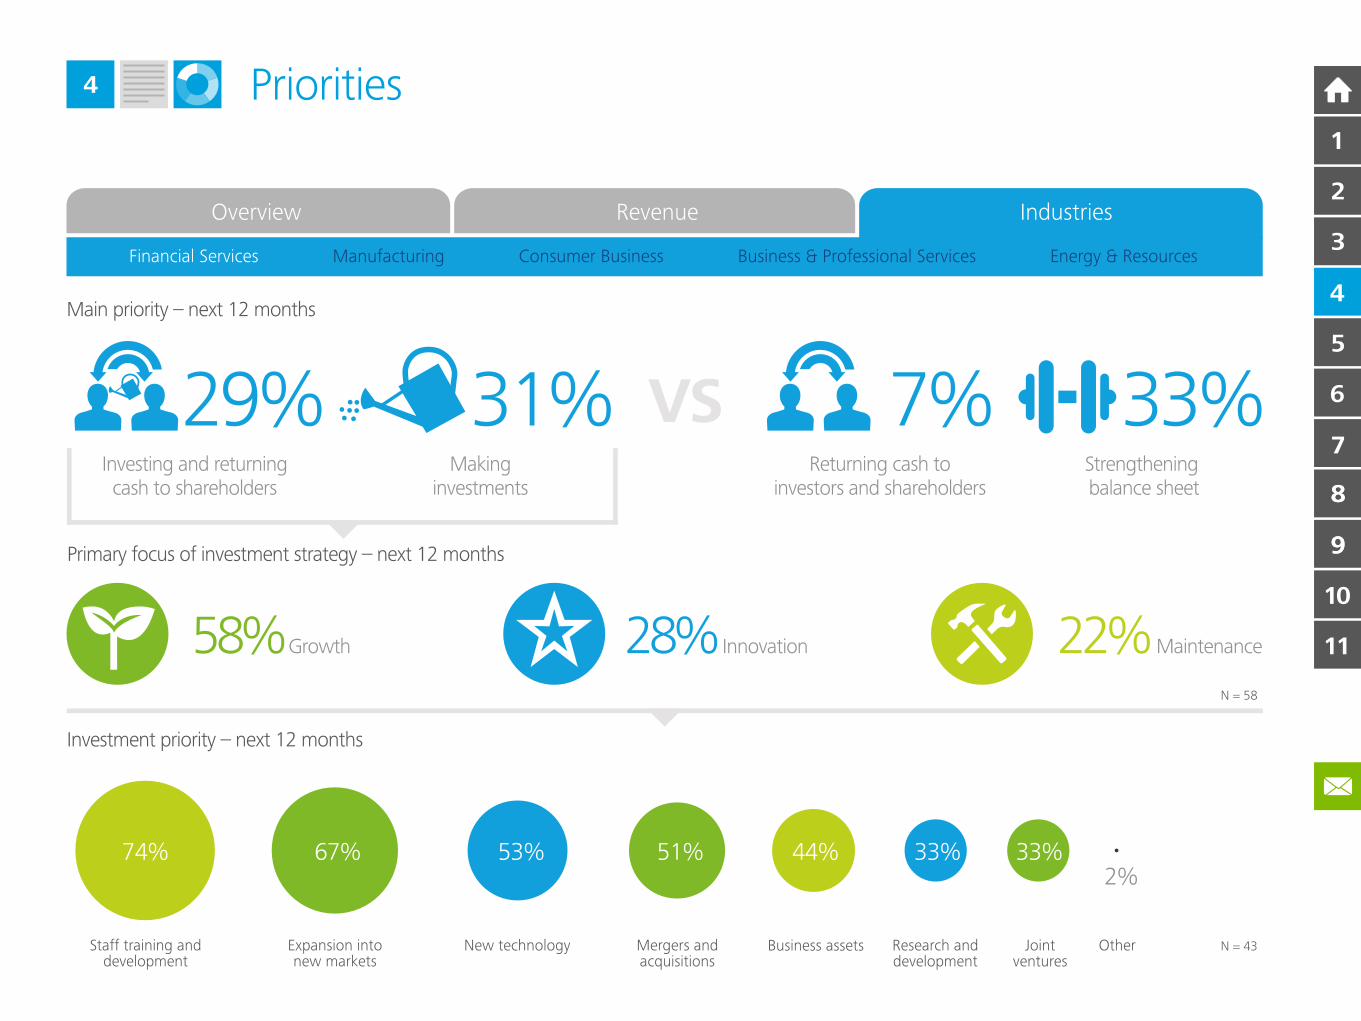
Priorities4
Overview Revenue Industries
Financial Services Manufacturing Consumer Business Business & Professional Services Energy & Resources
Main priority – next 12 months
Primary focus of investment strategy – next 12 months
58%Growth 22%Maintenance
Investment priority – next 12 months
N = 43
N = 58
28% Innovation
74% 67% 53% 51% 44% 33% 33%2%
Staff training anddevelopment
Expansion intonew markets
New technology Mergers andacquisitions
Business assets Research anddevelopment
Jointventures
Other
29%Investing and returningcash to shareholders
Returning cash toinvestors and shareholders
31%Making
investments
VSStrengthening balance sheet
7% 33%
10
11
9
8
9
8
7
6
5
4
2
3
1
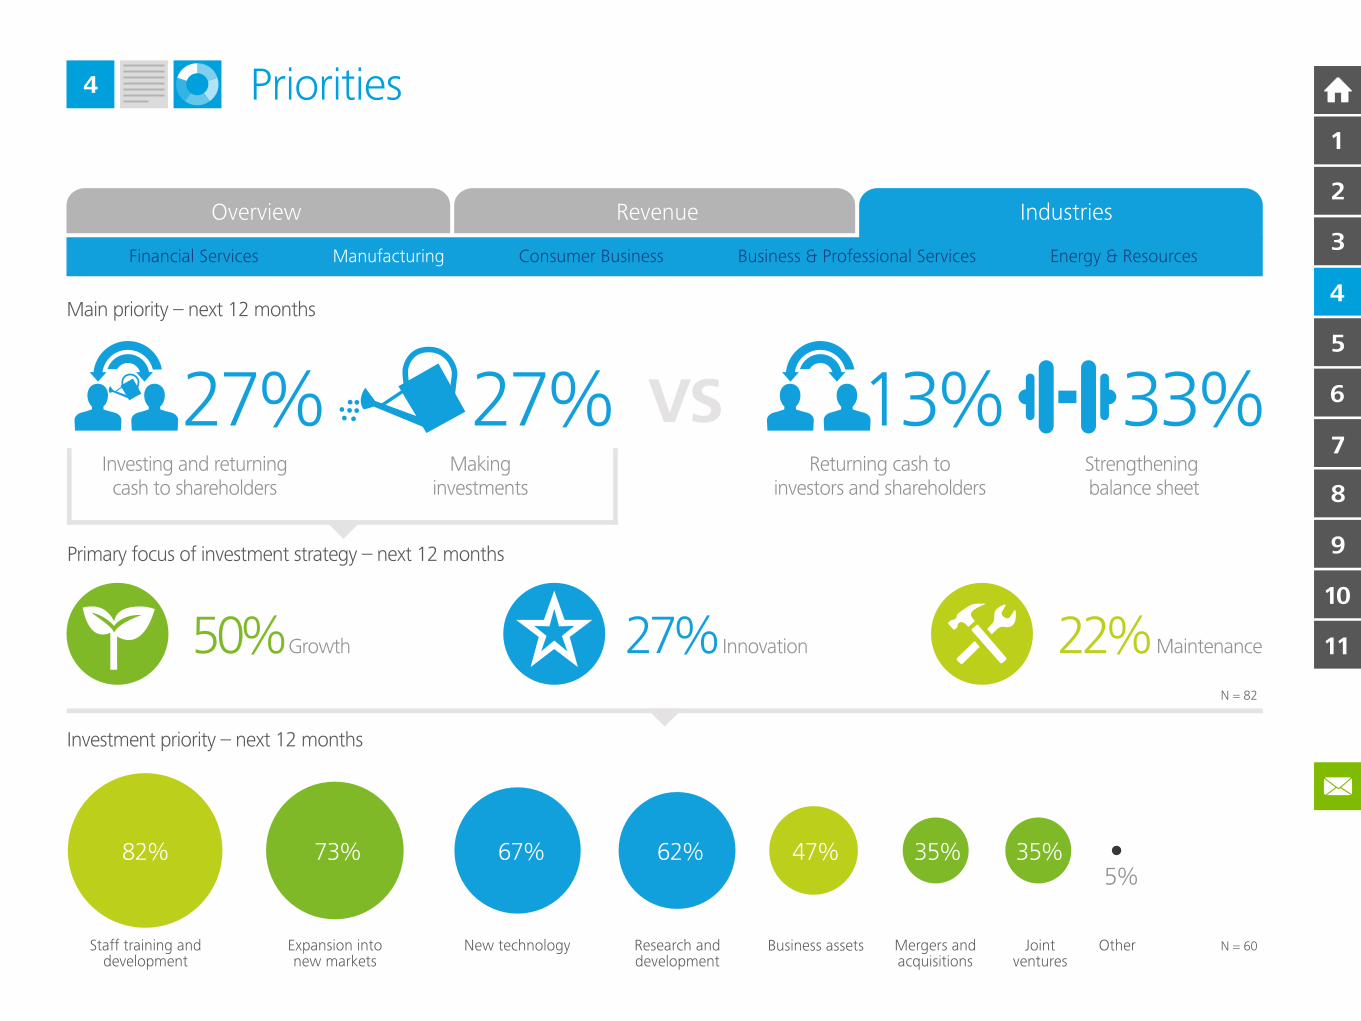
Priorities4
Overview Revenue Industries
Financial Services Manufacturing Consumer Business Business & Professional Services Energy & Resources
Main priority – next 12 months
Primary focus of investment strategy – next 12 months
50%Growth 22%Maintenance
Investment priority – next 12 months
82% 73% 67% 62% 47% 35% 35%5%
Staff training anddevelopment
Expansion intonew markets
New technology Research anddevelopment
Business assets Mergers andacquisitions
Jointventures
Other N = 60
27% Innovation
27%Investing and returningcash to shareholders
Returning cash toinvestors and shareholders
27%Making
investments
VSStrengthening balance sheet
13% 33%
N = 82
10
11
9
8
7
6
5
4
2
3
1
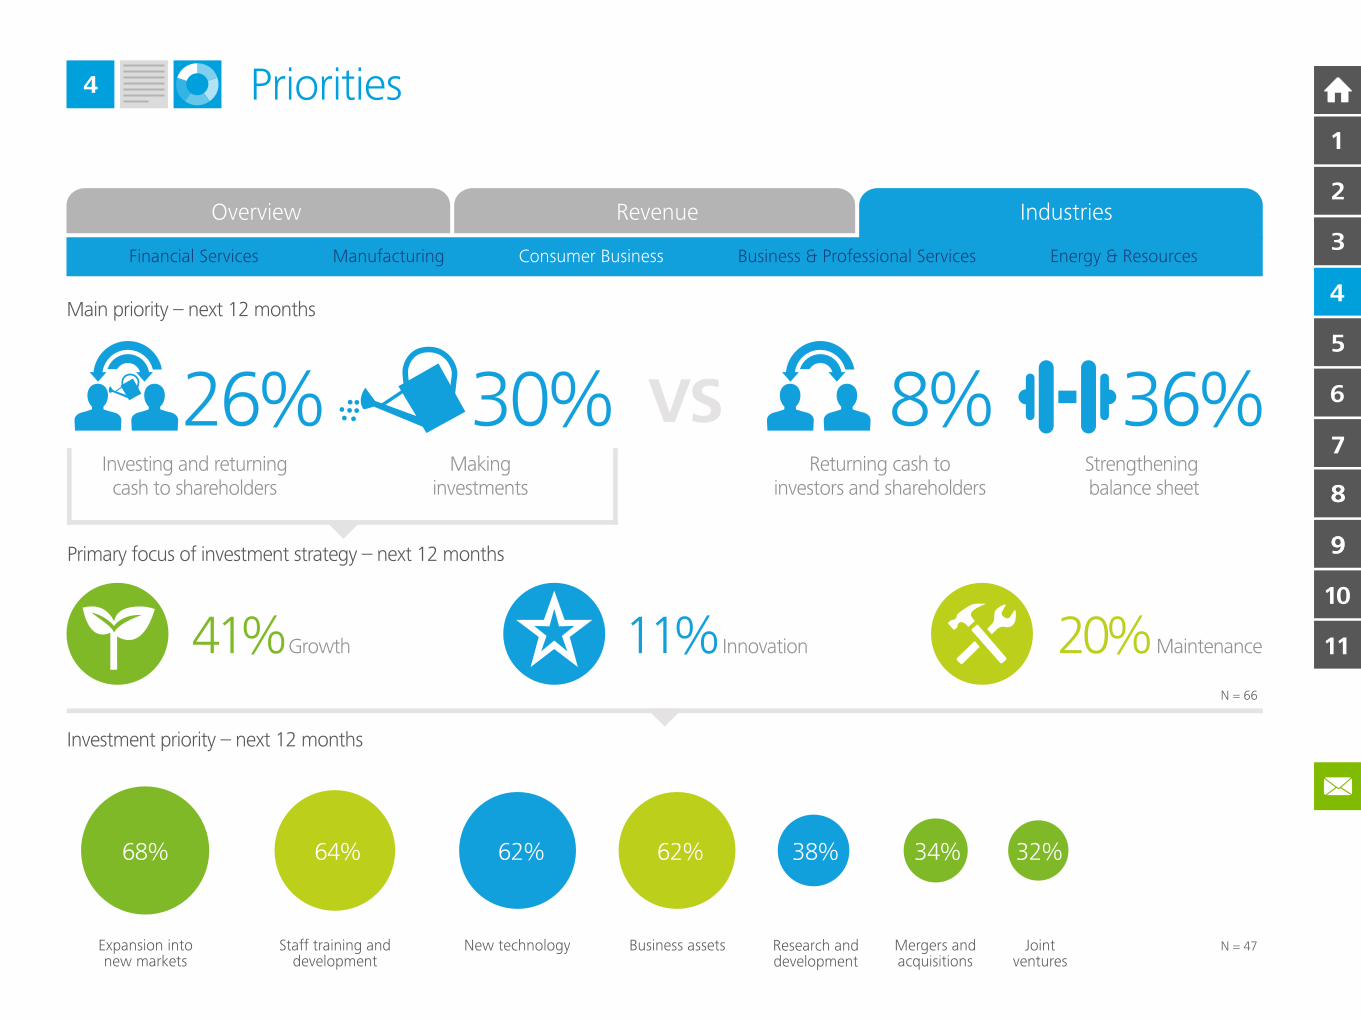
Priorities4
Overview Revenue Industries
Financial Services Manufacturing Consumer Business Business & Professional Services Energy & Resources
Main priority – next 12 months
Primary focus of investment strategy – next 12 months
41%Growth 20%Maintenance
Investment priority – next 12 months
N = 47
11% Innovation
68% 64% 62% 62% 38% 34% 32%
Expansion intonew markets
Staff training anddevelopment
New technology Business assets Research anddevelopment
Mergers andacquisitions
Jointventures
26%Investing and returningcash to shareholders
Returning cash toinvestors and shareholders
30%Making
investments
VSStrengthening balance sheet
8% 36%
N = 66
10
11
9
8
9
8
7
6
5
4
2
3
1
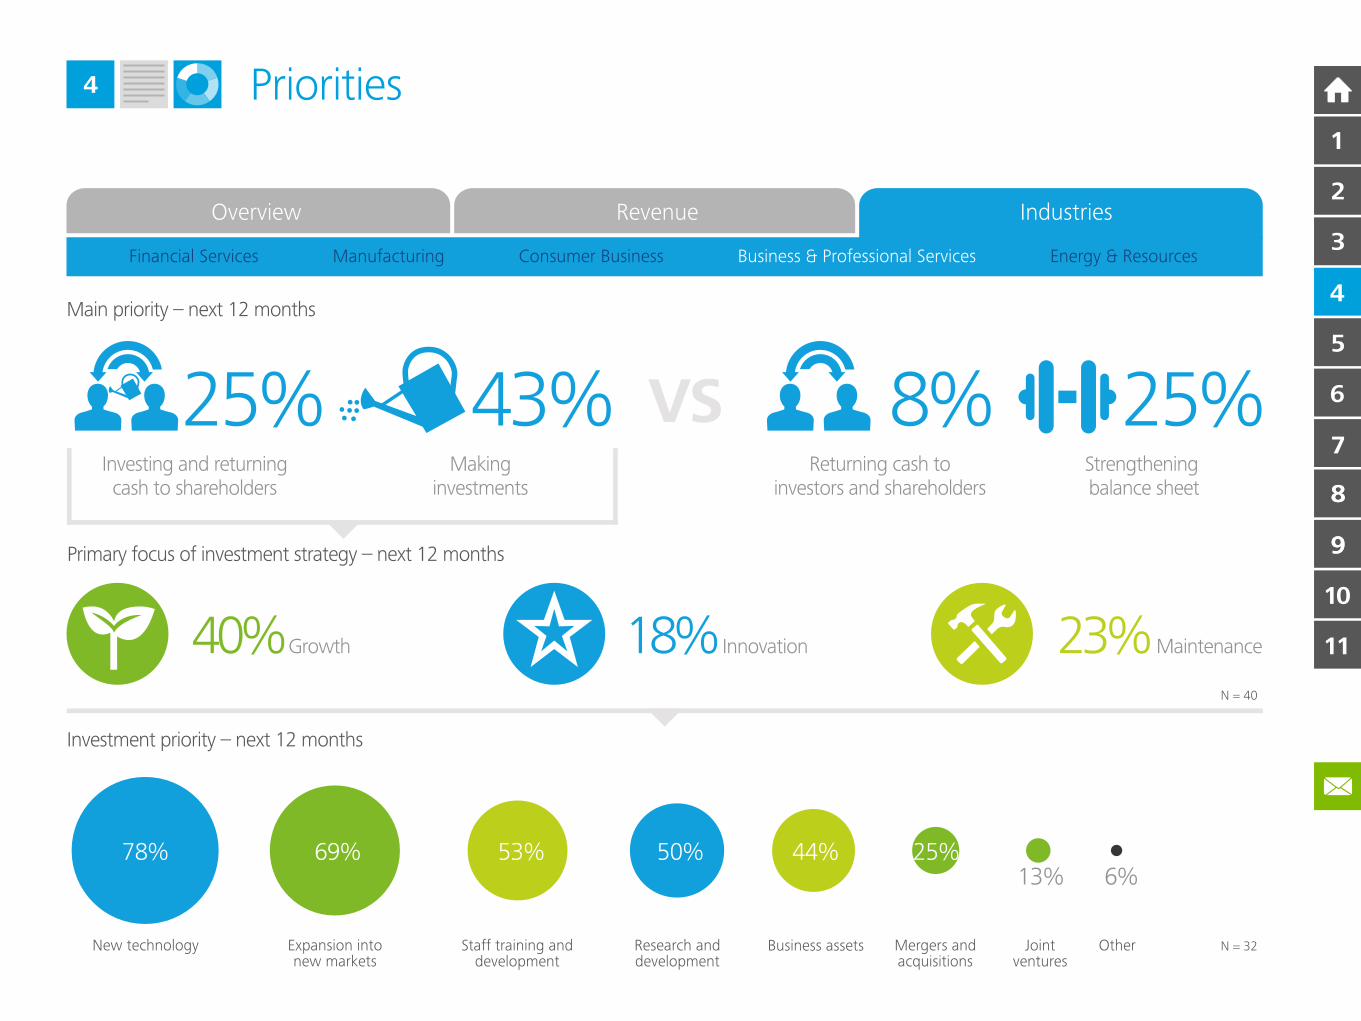
Priorities4
Overview Revenue Industries
Financial Services Manufacturing Consumer Business Business & Professional Services Energy & Resources
Main priority – next 12 months
Primary focus of investment strategy – next 12 months
25%Investing and returningcash to shareholders
Returning cash toinvestors and shareholders
43%Making
investments
VSStrengthening balance sheet
40%Growth 23%Maintenance
Investment priority – next 12 months
78% 69% 53% 50% 44% 25%13% 6%
New technology Expansion intonew markets
Staff training anddevelopment
Research anddevelopment
Business assets Mergers andacquisitions
Jointventures
Other N = 32
8%
18% Innovation
25%
N = 40
10
11
9
8
9
8
7
6
5
4
2
3
1
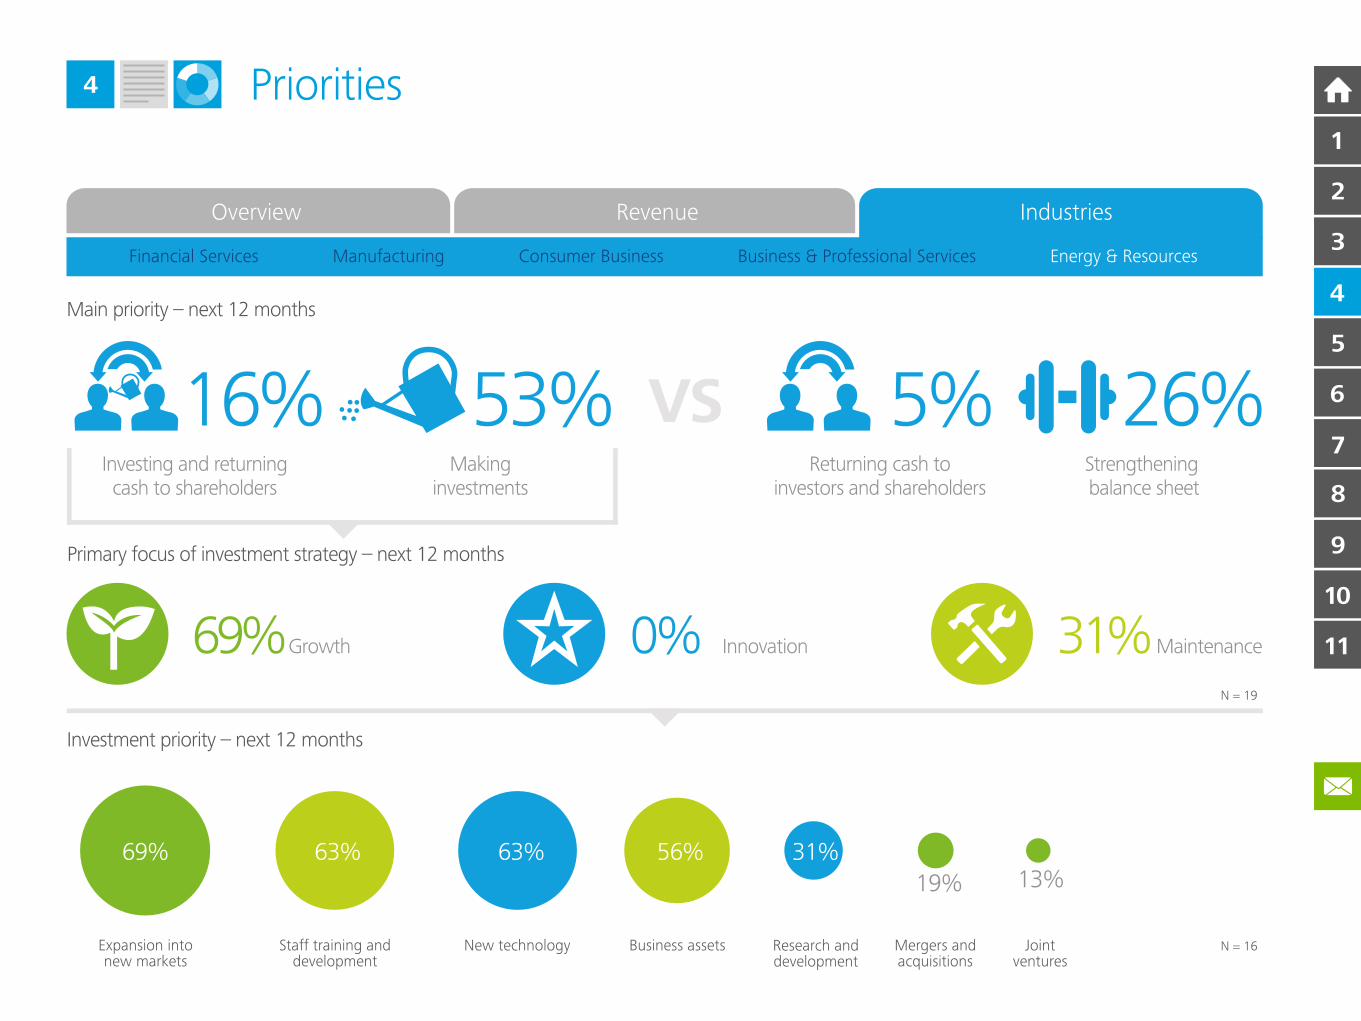
Priorities4
Overview Revenue Industries
Financial Services Manufacturing Consumer Business Business & Professional Services Energy & Resources
Main priority – next 12 months
Primary focus of investment strategy – next 12 months
69%Growth 31%Maintenance
Investment priority – next 12 months
N = 16
69% 63% 63% 56% 31%
19% 13%
Expansion intonew markets
Staff training anddevelopment
New technology Business assets Research anddevelopment
Mergers andacquisitions
Jointventures
16%Investing and returningcash to shareholders
Returning cash toinvestors and shareholders
53%Making
investments
VSStrengthening balance sheet
5% 26%
0% Innovation
N = 19
10
11
9
8
7
6
5
4
2
3
1
5
The investment equation
In our view the factors underpinning a firm’s decision to spend are
complex, but can be illustrated by what we term the investment equation.1
This equation is comprised of four variables. The first is external drivers.
Which include capital accessibility, sentiment towards growth and
regulatory factors. The second is ambition and this is based on the risk
appetite of executives that in turn determines investment decisions. This
includes their desire to build the business from a national champion into
a regional leader and then ultimately into an international company.
Corporate capabilities make up the third variable in the equation. These
include cash surpluses, current balance sheet performance and operational
activities. Finally, comes expectations, which is a critical variable. It scales
up or down the potential level of investment based on the executive’s
assessment of the national and global economic landscape.
Together these four variables illustrate the holistic nature of the investment
decision. The equation suggests that senior executives are increasingly
inclined to wait for each of the variables to be aligned positively before
releasing the funds. The length of tenure of the executive is also important:
nearly half of our respondents have held their position for more than six
years. It is clear that these decision-makers are in a position to capitalise on
their market and industry knowledge as they have directly experienced the
‘roller coaster’ of the financial crisis.
Growth genie out of the bottle
The evidence from our research suggests that the growth agenda is firmly
on the board table.
This is likely to be the result of the positive alignment of the variables
outlined in the investment equation above. For example, external drivers
such as increased competitive pressure, external demand and rising
economic confidence score highly. Ambition is also prominent, with
specific market opportunities and pressure from investors and the board
identified as pushing the growth agenda. Allied to this is a greater supply
of capital, due to the high levels of cash reserves and record low interest
rates. These trends are largely repeated across industry sectors.
Should government incentives be scrapped?
Two key points emerge from our analysis. First, there is a strong message
to policymakers: executives continually rank government incentives
as having the least impact on their investment decisions. In spite of
much debate around which are the best policies to trigger investment
decisions our analysis suggests that these do not play a major role.
What is important to our sample is stability; a number of executives
noted the positive benefits of a degree of certainty within the regulatory
environment.
The second point is based on the differences between larger and
smaller businesses in our sample. Not surprisingly bigger businesses
place significant weight on specific (international) market opportunities.
Smaller firms are more balanced in their responses. A re-evaluation of
government incentives to align them better to companies’ needs could
yield a further boost in investment. To achieve this goal, a nuanced
strategy has to be applied which is directly linked to the size and the
sector of the company in question.
Drivers
1 “Launch pad for growth: How UK businesses are planning to increase investment”, Deloitte LLP, March 2014.
See also: http://www.deloitte.com/assets/Dcom-UnitedKingdom/Local%20Assets/Documents/Market%20insights/UK%20Futures/uk-uk-futures-big-business-launch-pad-for-growth-2014.pdf
10
11
9
8
9
8
7
6
5
4
2
3
1
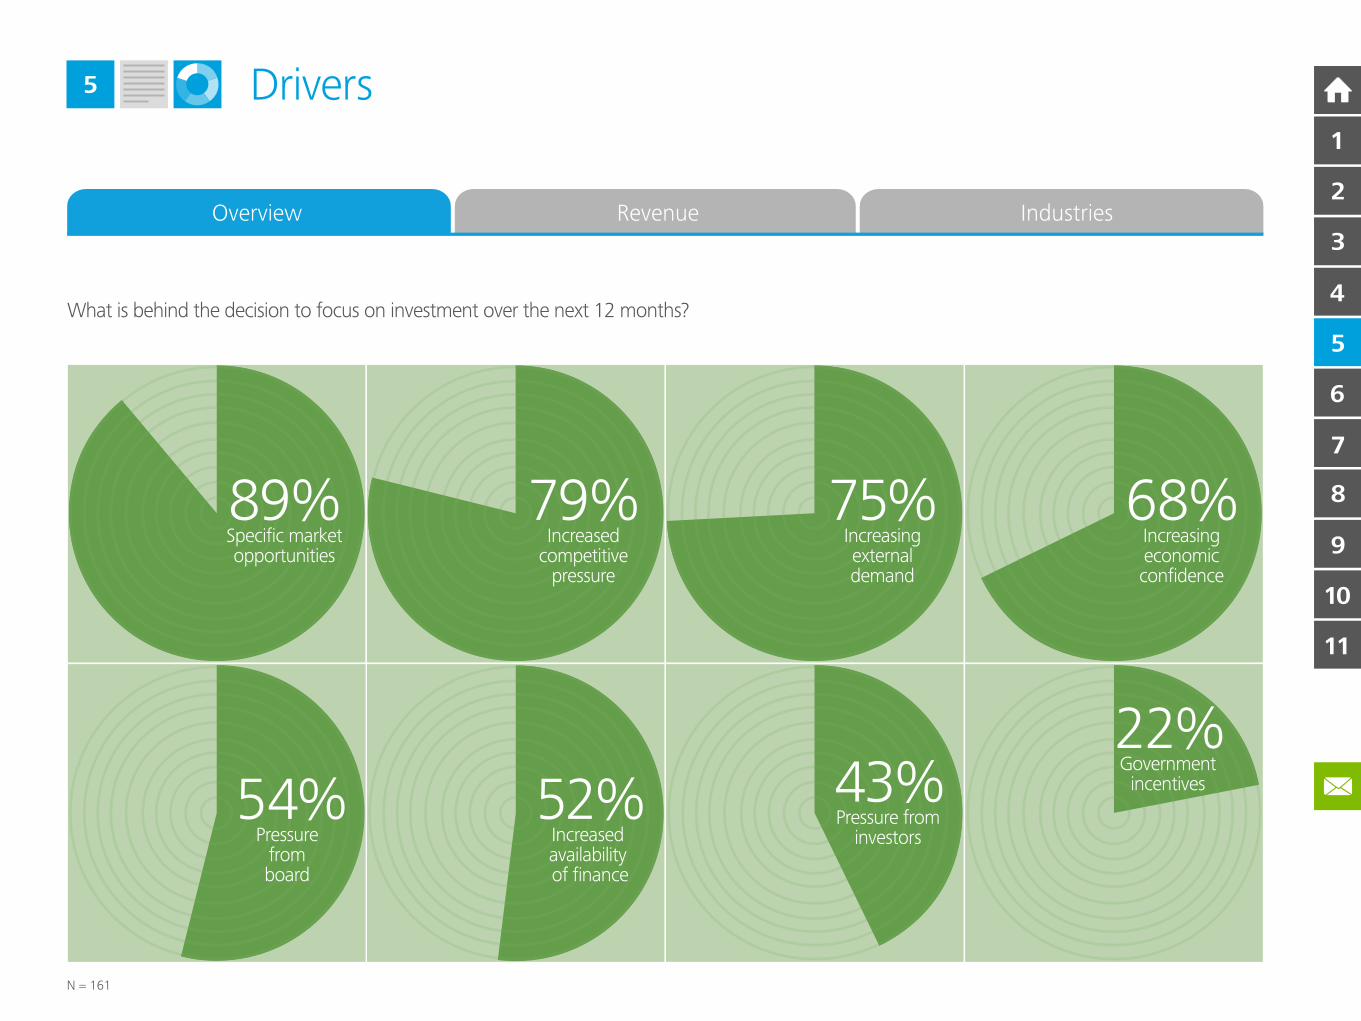
Drivers5
N = 161
89%Specific marketopportunities
79%Increased
competitivepressure
75%Increasingexternaldemand
68%Increasingeconomicconfidence
52%Increased availability of finance
43%Pressure from
investors
22%Government
incentives54%Pressure
fromboard
What is behind the decision to focus on investment over the next 12 months?
Overview Revenue Industries
10
11
9
8
7
6
5
4
2
3
1
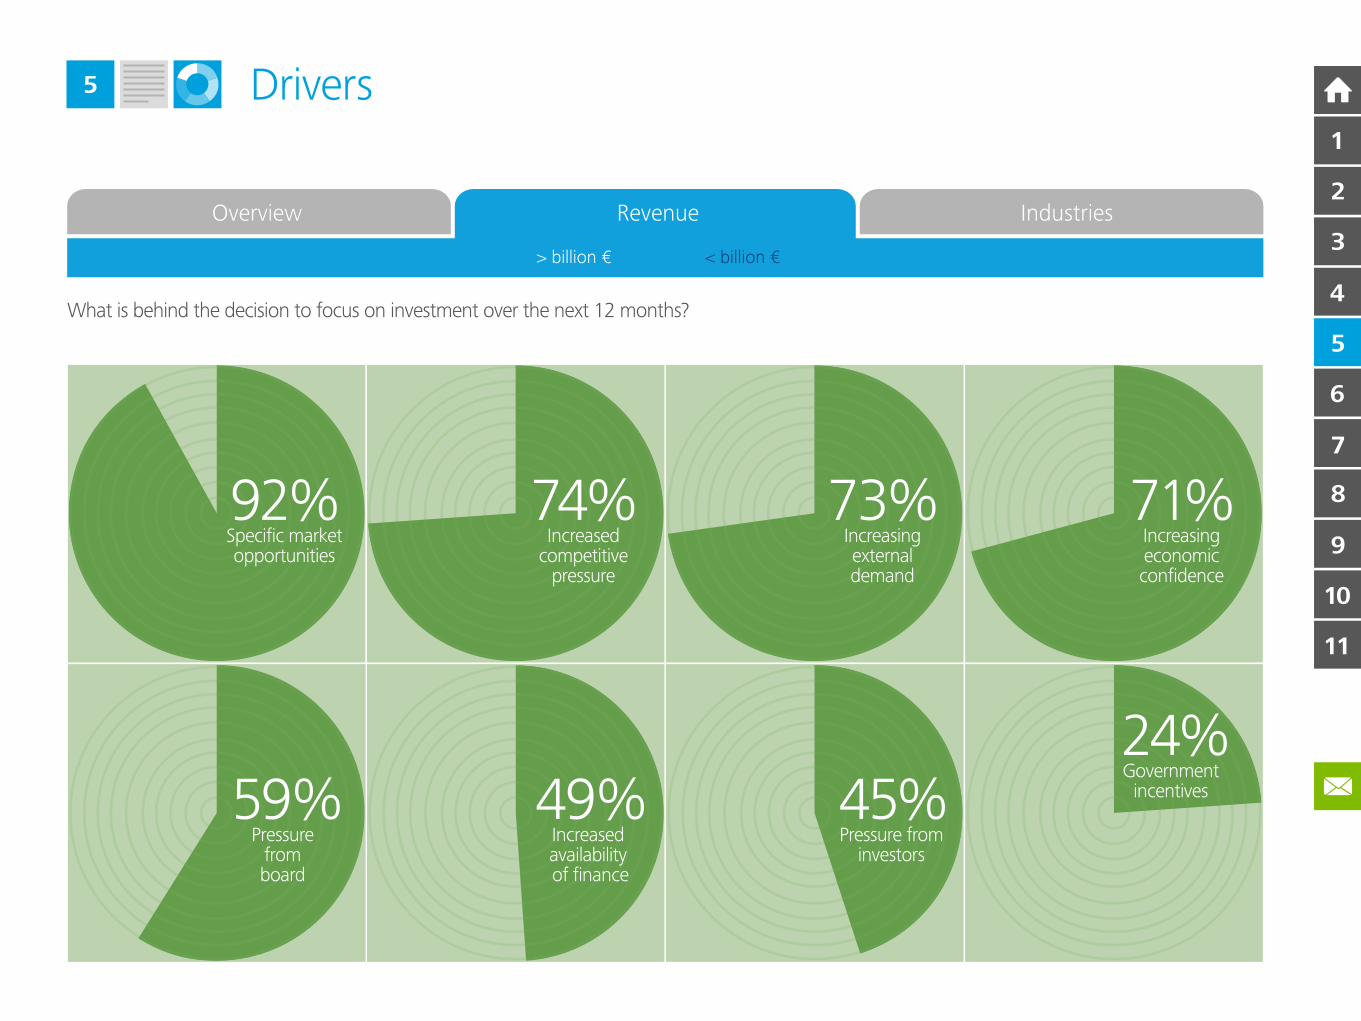
Drivers5
92%Specific marketopportunities
74%Increased
competitivepressure
73%Increasingexternaldemand
71%Increasingeconomicconfidence
49%Increased availability of finance
45%Pressure from
investors
24%Government
incentives59%Pressure
fromboard
What is behind the decision to focus on investment over the next 12 months?
Overview Revenue Industries
> billion € < billion €
10
11
9
8
7
6
5
4
2
3
1
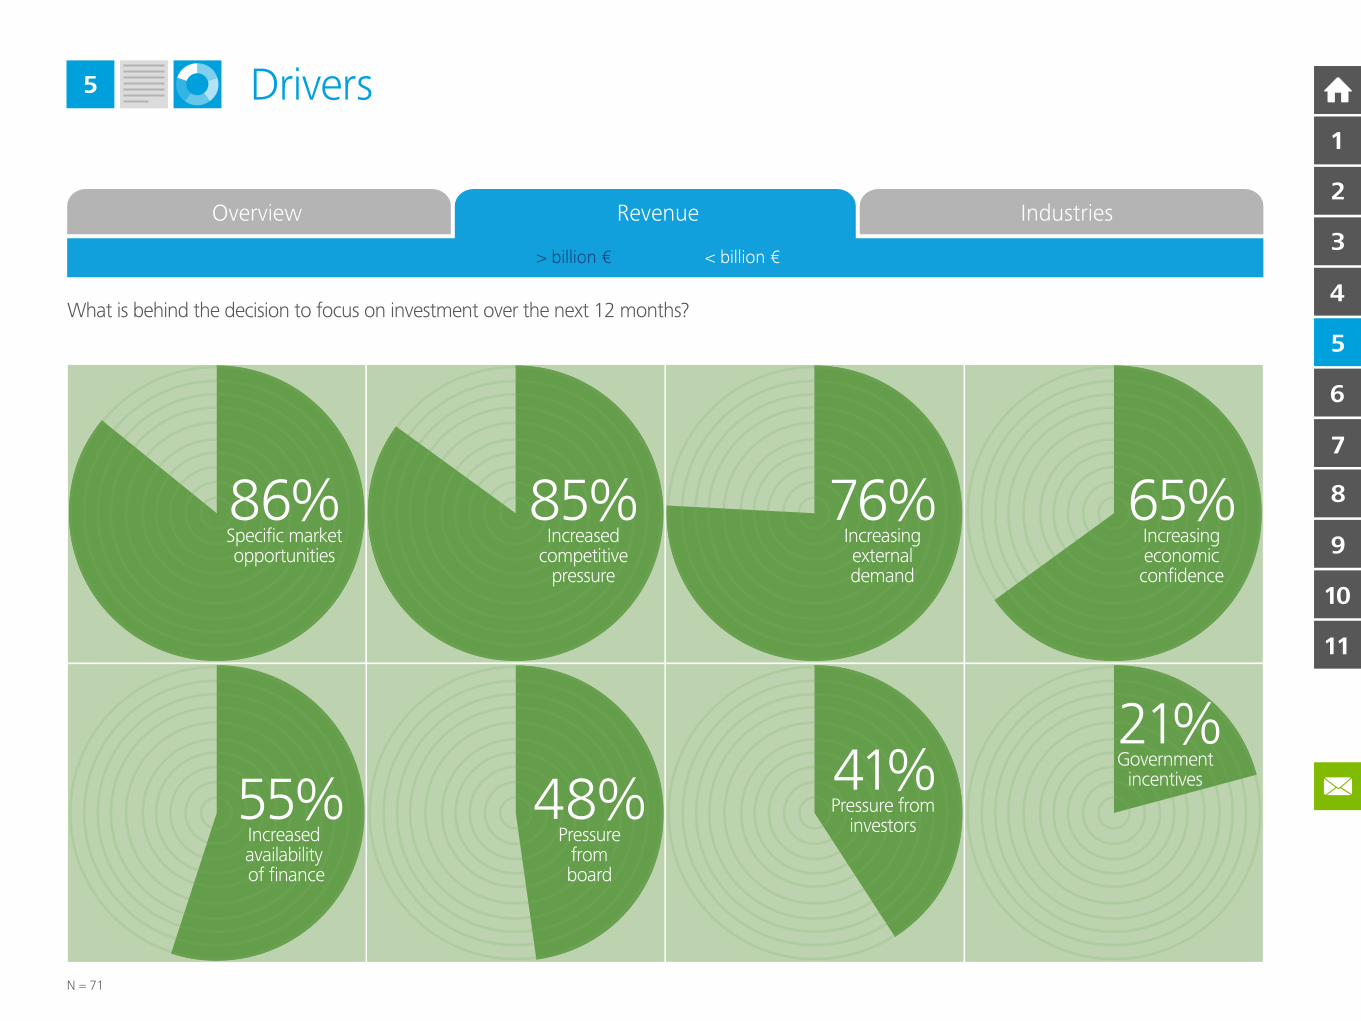
Drivers5
N = 71
86%Specific marketopportunities
85%Increased
competitivepressure
76%Increasingexternaldemand
65%Increasingeconomicconfidence
48%Pressure
fromboard
41%Pressure from
investors
21%Government
incentives
55%Increased availability of finance
What is behind the decision to focus on investment over the next 12 months?
Overview Revenue Industries
> billion € < billion €
10
11
9
8
7
6
5
4
2
3
1
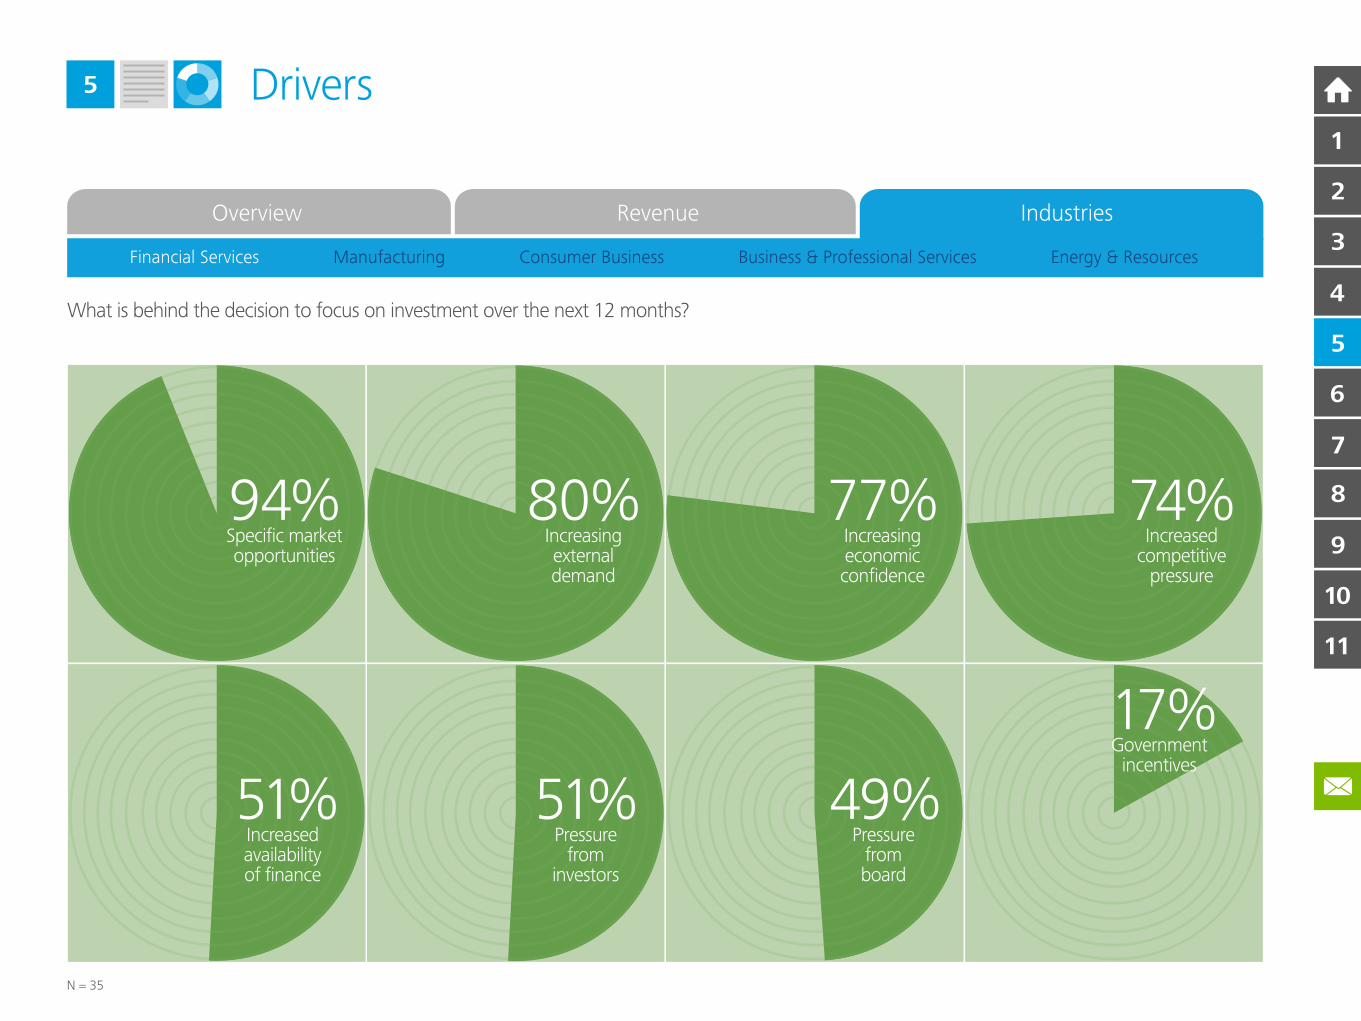
Drivers5
Overview Revenue Industries
N = 35
94%Specific marketopportunities
80%Increasingexternaldemand
77%Increasingeconomicconfidence
74%Increased
competitivepressure
17%Government
incentives
51%Pressure
frominvestors
49%Pressure
fromboard
51%Increasedavailabilityof finance
What is behind the decision to focus on investment over the next 12 months?
Financial Services Manufacturing Consumer Business Business & Professional Services Energy & Resources
10
11
9
8
7
6
5
4
2
3
1
Drivers5
Overview Revenue Industries
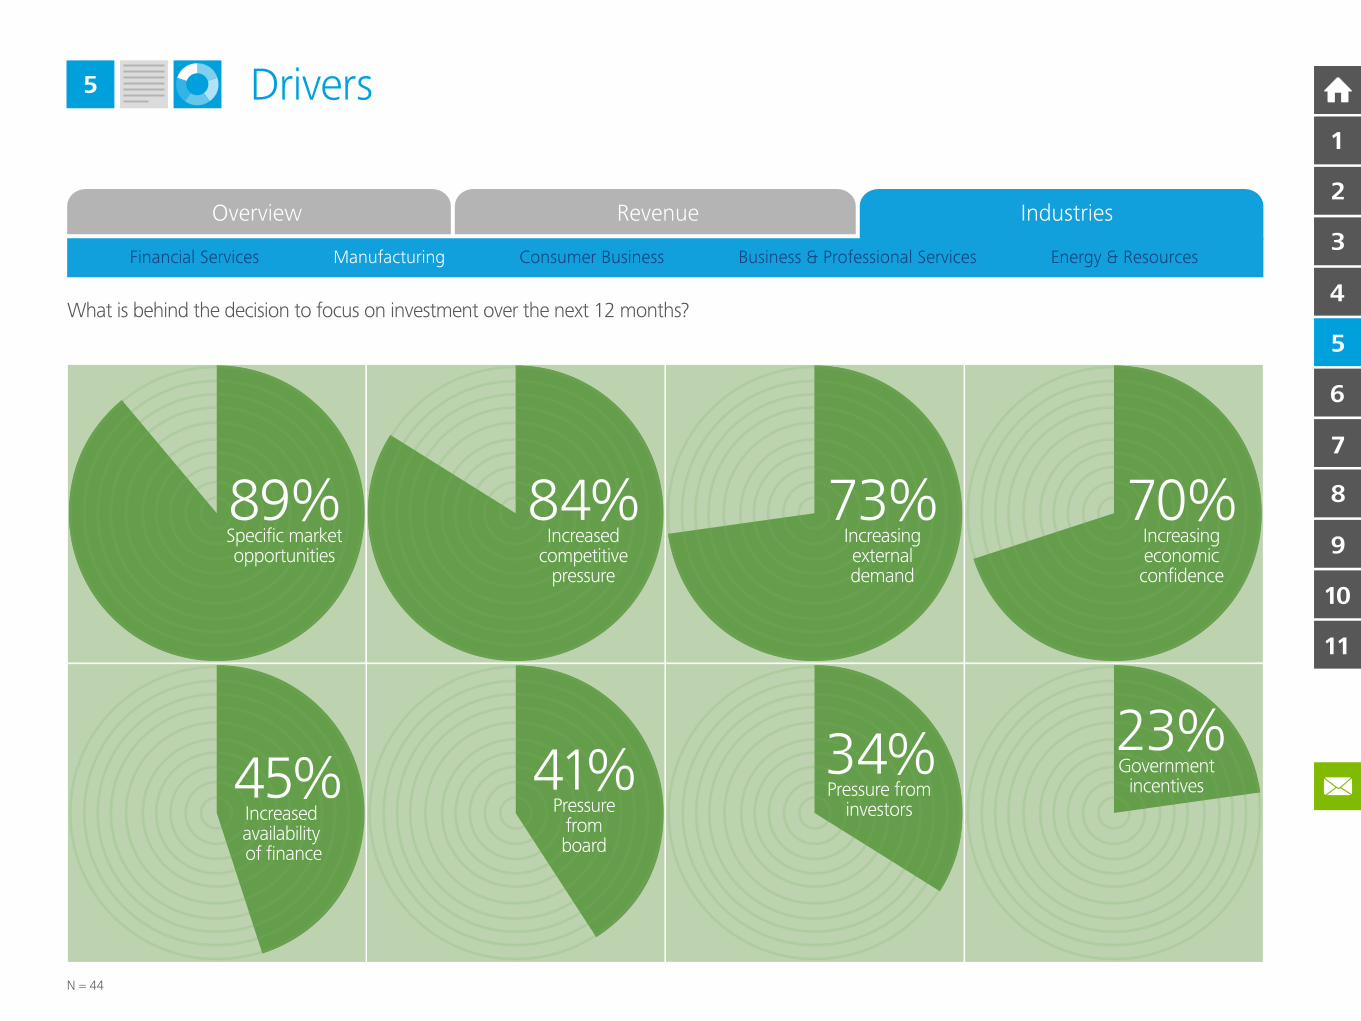
N = 44
89%Specific marketopportunities
84%Increased
competitivepressure
73%Increasingexternaldemand
70%Increasingeconomicconfidence
41%Pressure
fromboard
34%Pressure from
investors
23%Government
incentives45%Increased availability of finance
What is behind the decision to focus on investment over the next 12 months?
Financial Services Manufacturing Consumer Business Business & Professional Services Energy & Resources
10
11
9
8
7
6
5
4
2
3
1
Drivers5
Overview Revenue Industries
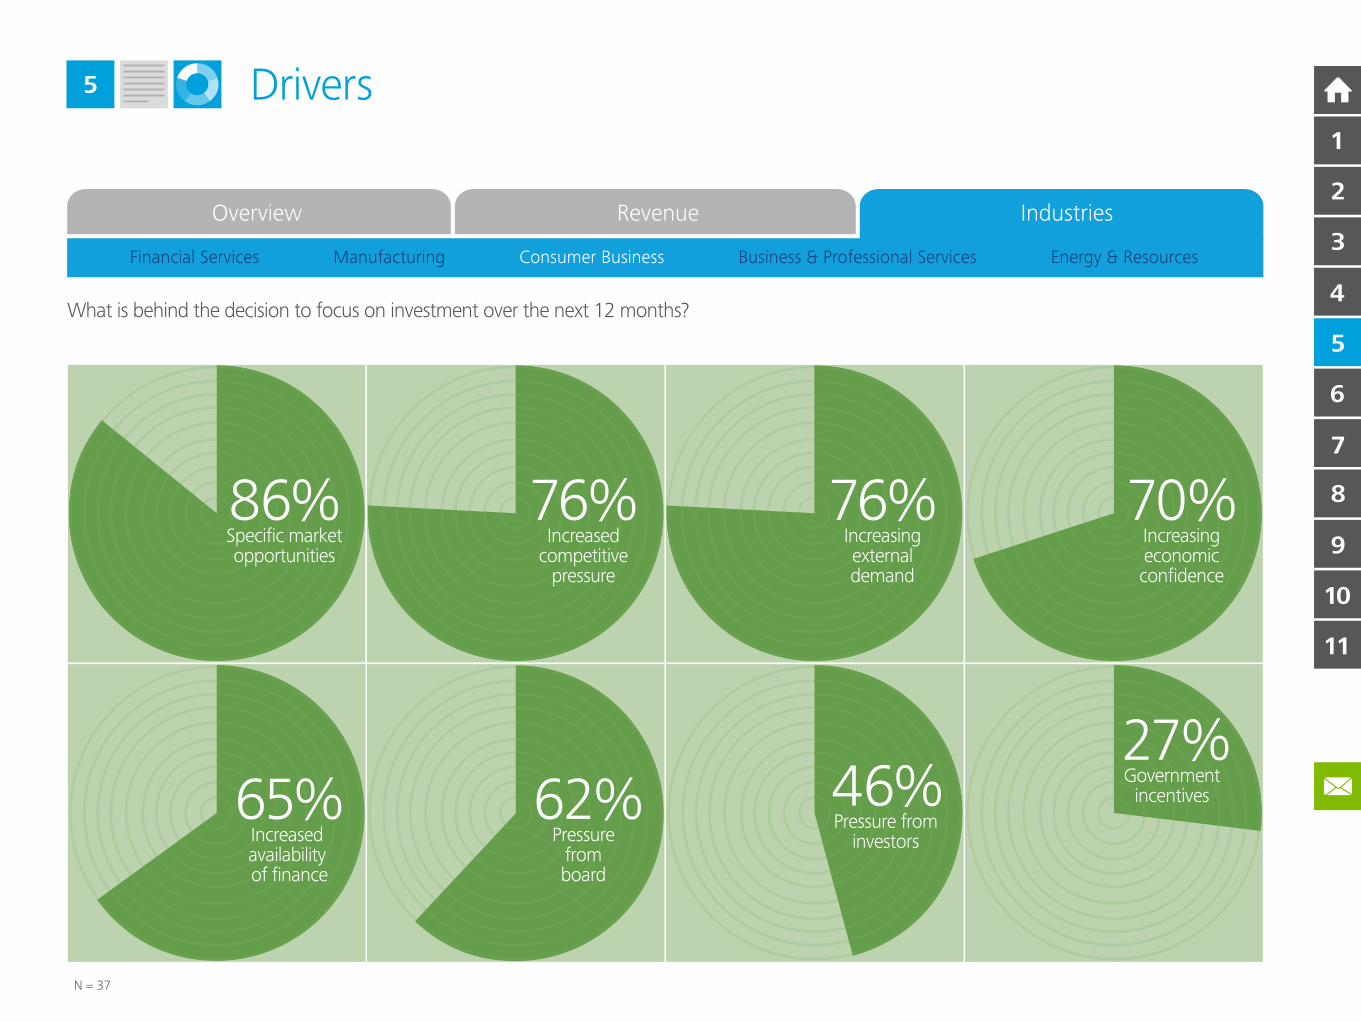
N = 37
86%Specific marketopportunities
76%Increased
competitivepressure
76%Increasingexternaldemand
70%Increasingeconomicconfidence
62%Increased availability of finance
46%Pressure from
investors
27%Government
incentives65%Pressure
fromboard
What is behind the decision to focus on investment over the next 12 months?
Financial Services Manufacturing Consumer Business Business & Professional Services Energy & Resources
10
11
9
8
7
6
5
4
2
3
1
Drivers5
Overview Revenue Industries
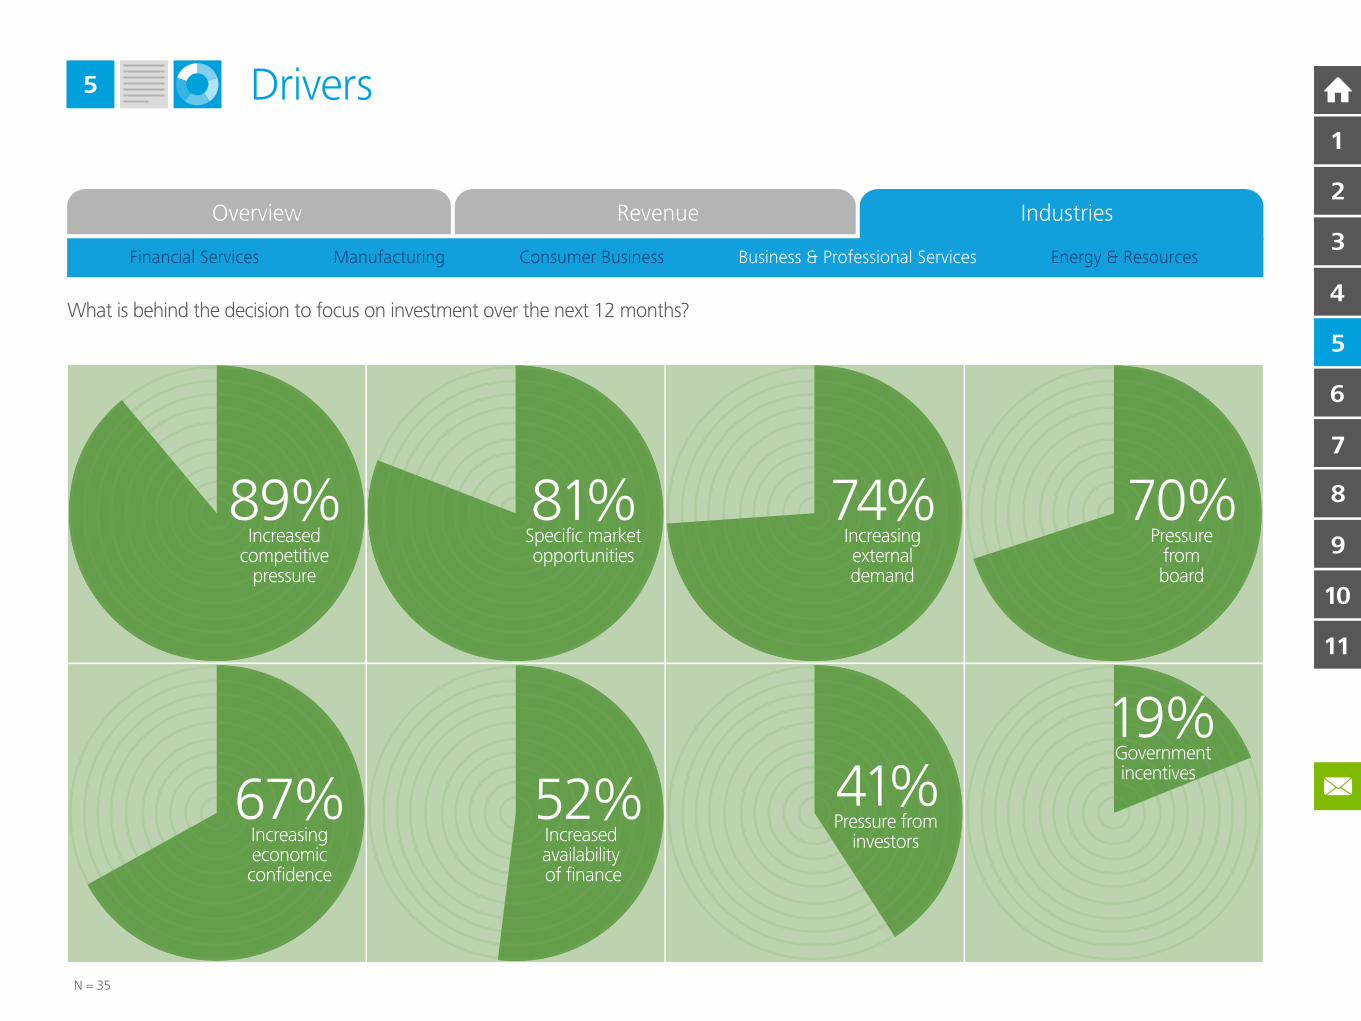
N = 35
89%Increased
competitivepressure
81%Specific marketopportunities
74%Increasingexternaldemand
70%Pressure
fromboard
52%Increasingeconomicconfidence
41%Pressure from
investors
19%Governmentincentives
67%Increased availability of finance
What is behind the decision to focus on investment over the next 12 months?
Financial Services Manufacturing Consumer Business Business & Professional Services Energy & Resources
10
11
9
8
7
6
5
4
2
3
1
Drivers5
Overview Revenue Industries
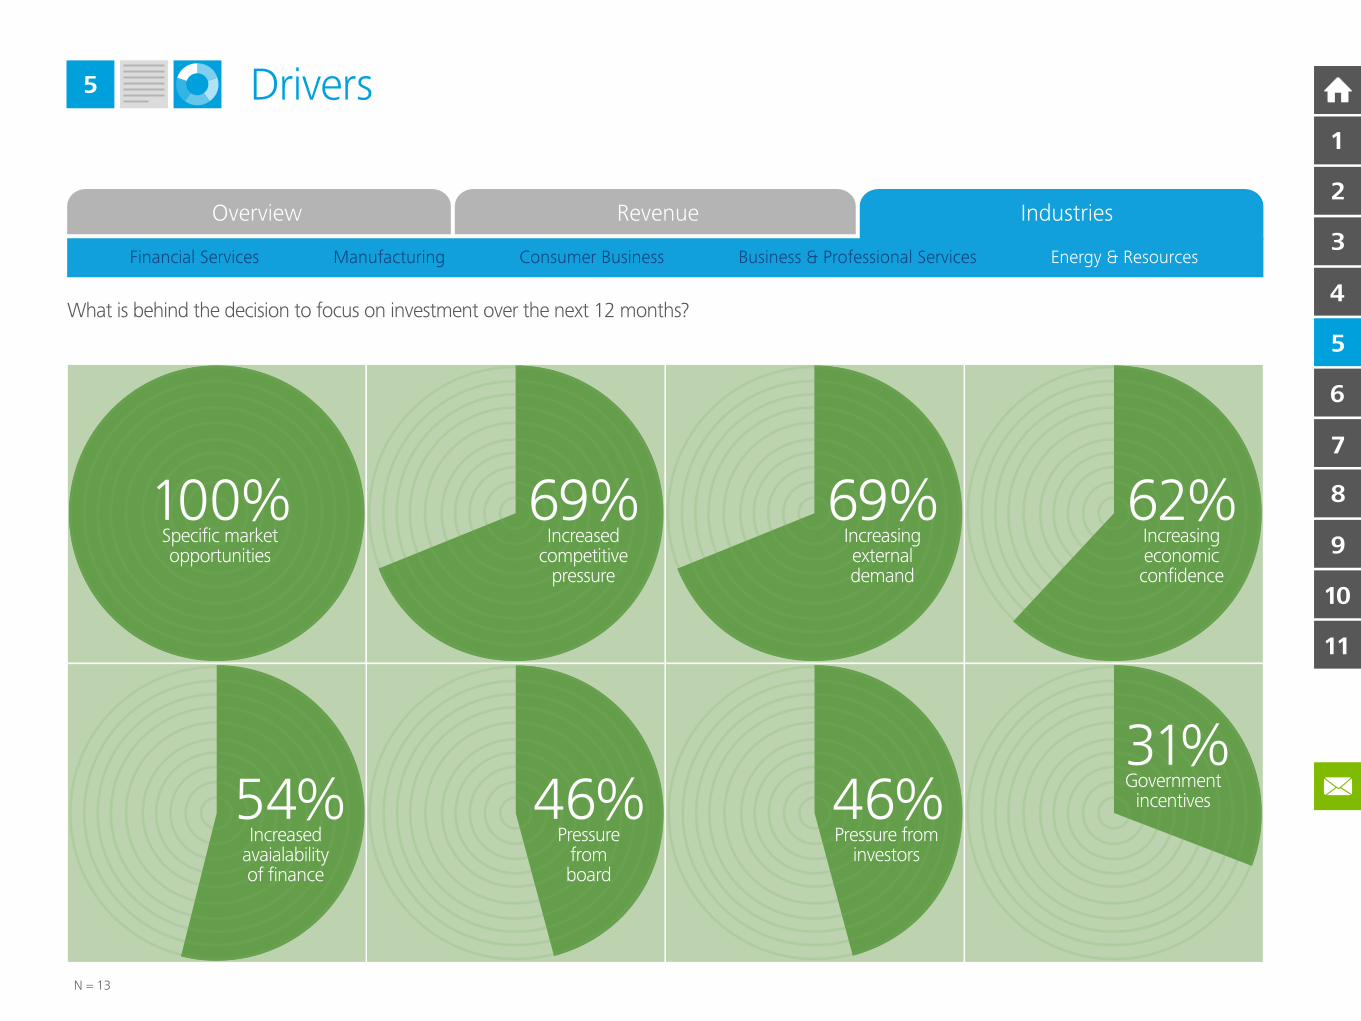
N = 13
100%Specific marketopportunities
69%Increased
competitivepressure
69%Increasingexternaldemand
62%Increasingeconomicconfidence
46%Pressure
fromboard
46%Pressure from
investors
31%Government
incentives54%Increased
avaialabilityof finance
What is behind the decision to focus on investment over the next 12 months?
Financial Services Manufacturing Consumer Business Business & Professional Services Energy & Resources
10
11
9
8
7
6
5
4
2
3
1
5
Markets6
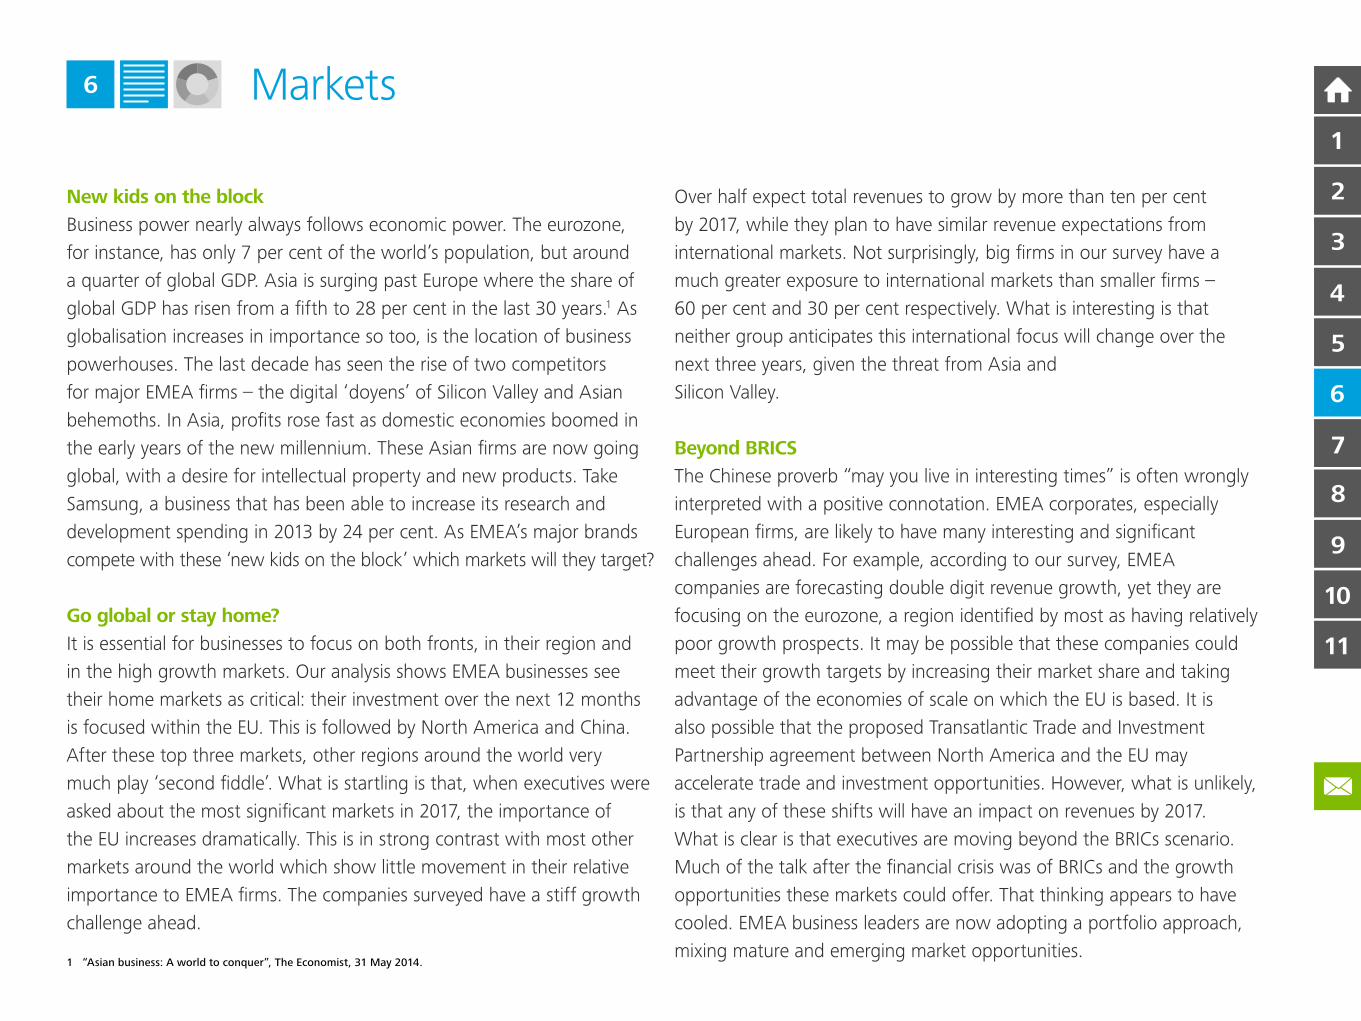
New kids on the block
Business power nearly always follows economic power. The eurozone,
for instance, has only 7 per cent of the world’s population, but around
a quarter of global GDP. Asia is surging past Europe where the share of
global GDP has risen from a fifth to 28 per cent in the last 30 years.1 As
globalisation increases in importance so too, is the location of business
powerhouses. The last decade has seen the rise of two competitors
for major EMEA firms – the digital ‘doyens’ of Silicon Valley and Asian
behemoths. In Asia, profits rose fast as domestic economies boomed in
the early years of the new millennium. These Asian firms are now going
global, with a desire for intellectual property and new products. Take
Samsung, a business that has been able to increase its research and
development spending in 2013 by 24 per cent. As EMEA’s major brands
compete with these ‘new kids on the block’ which markets will they target?
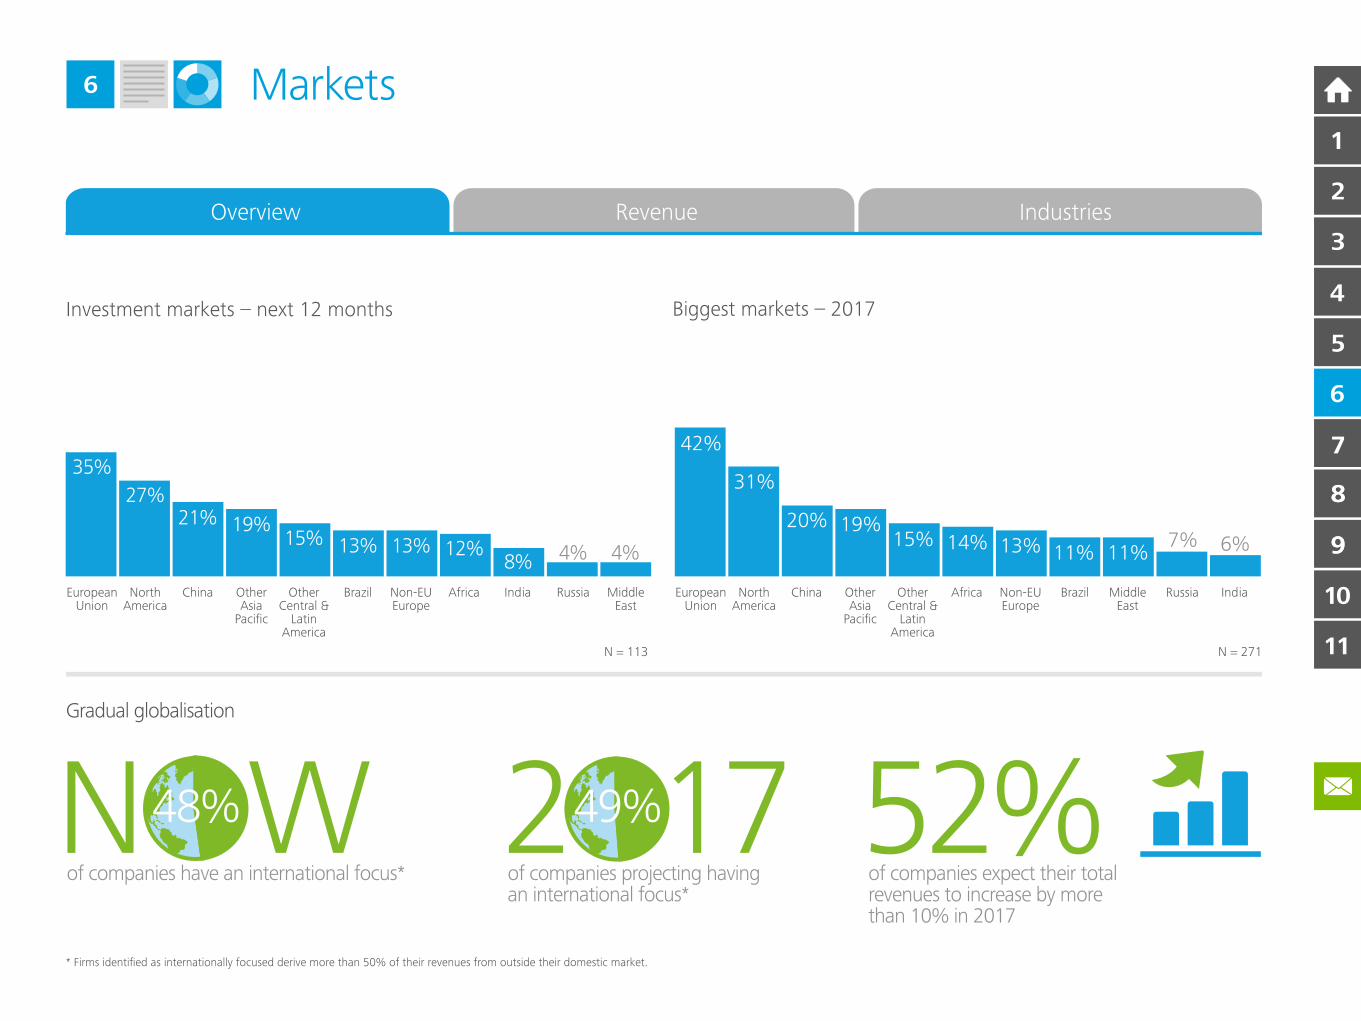
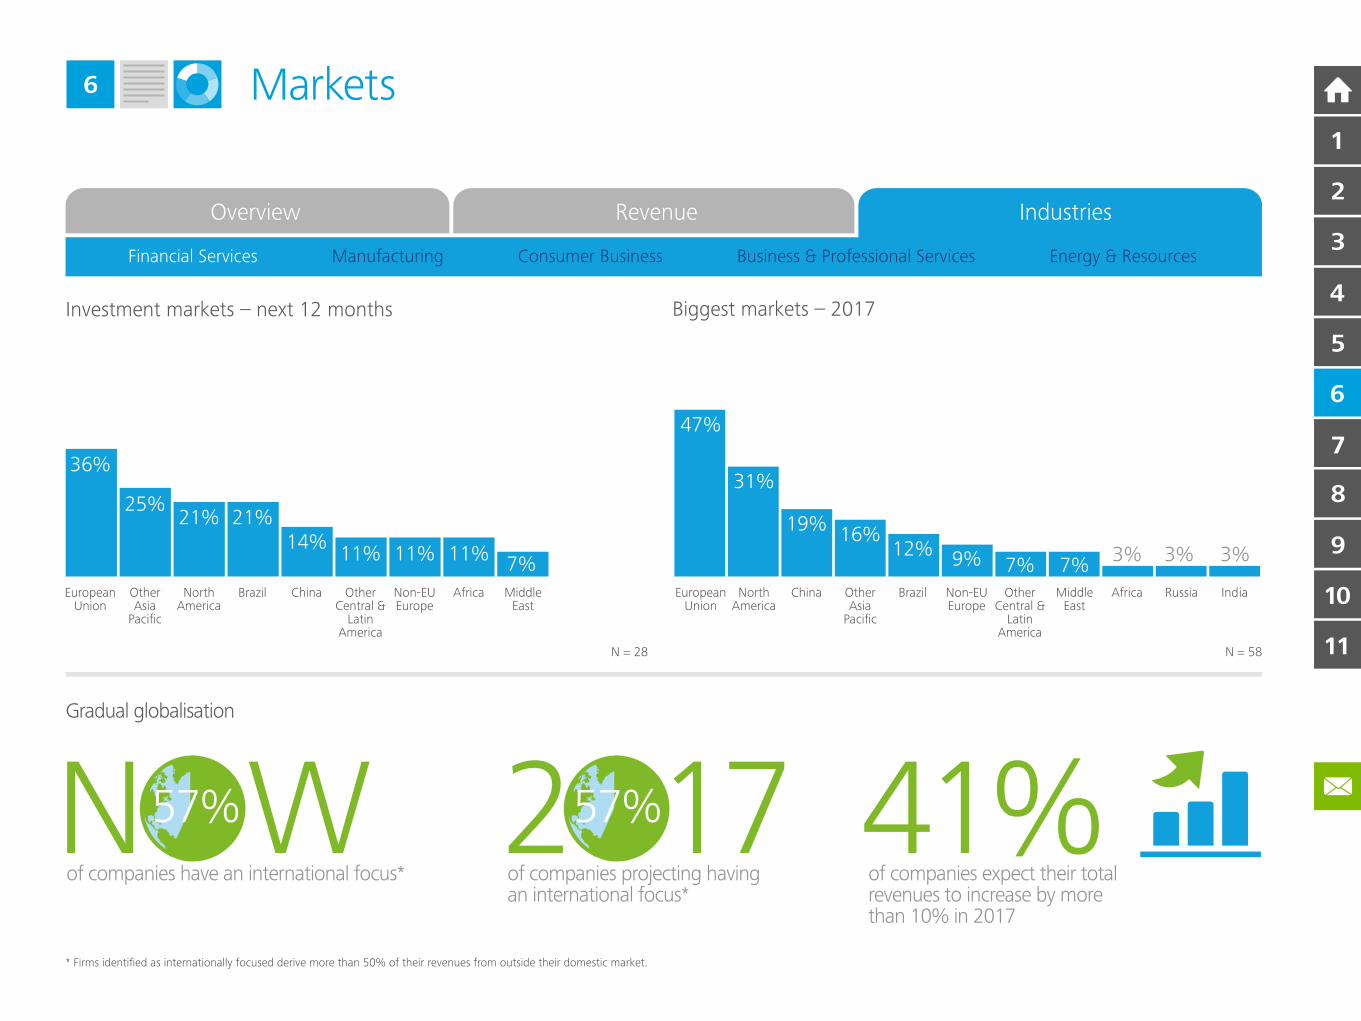
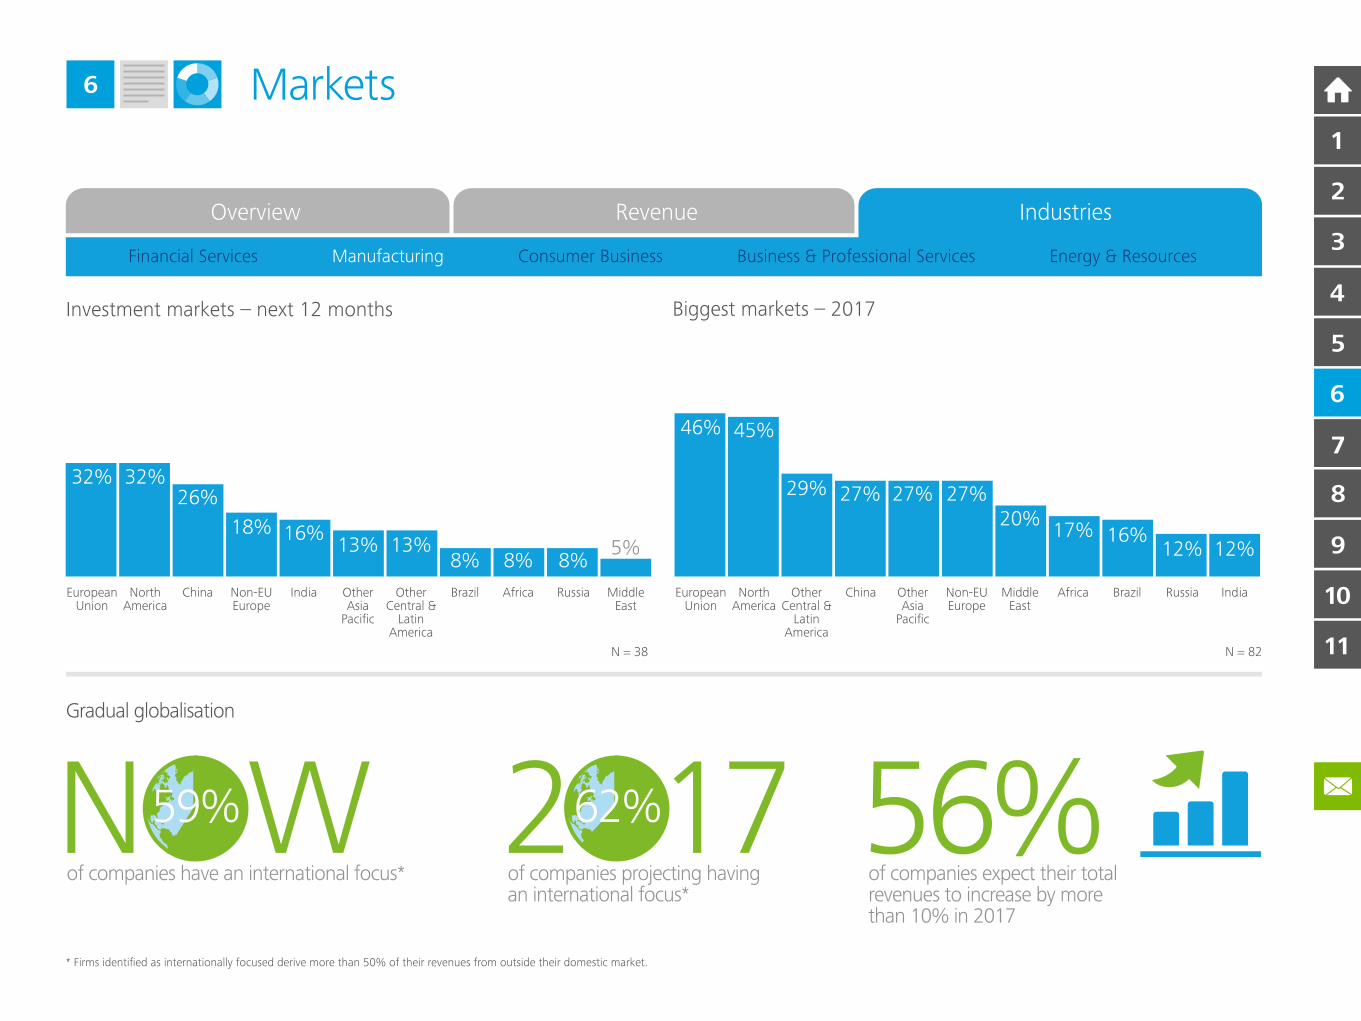
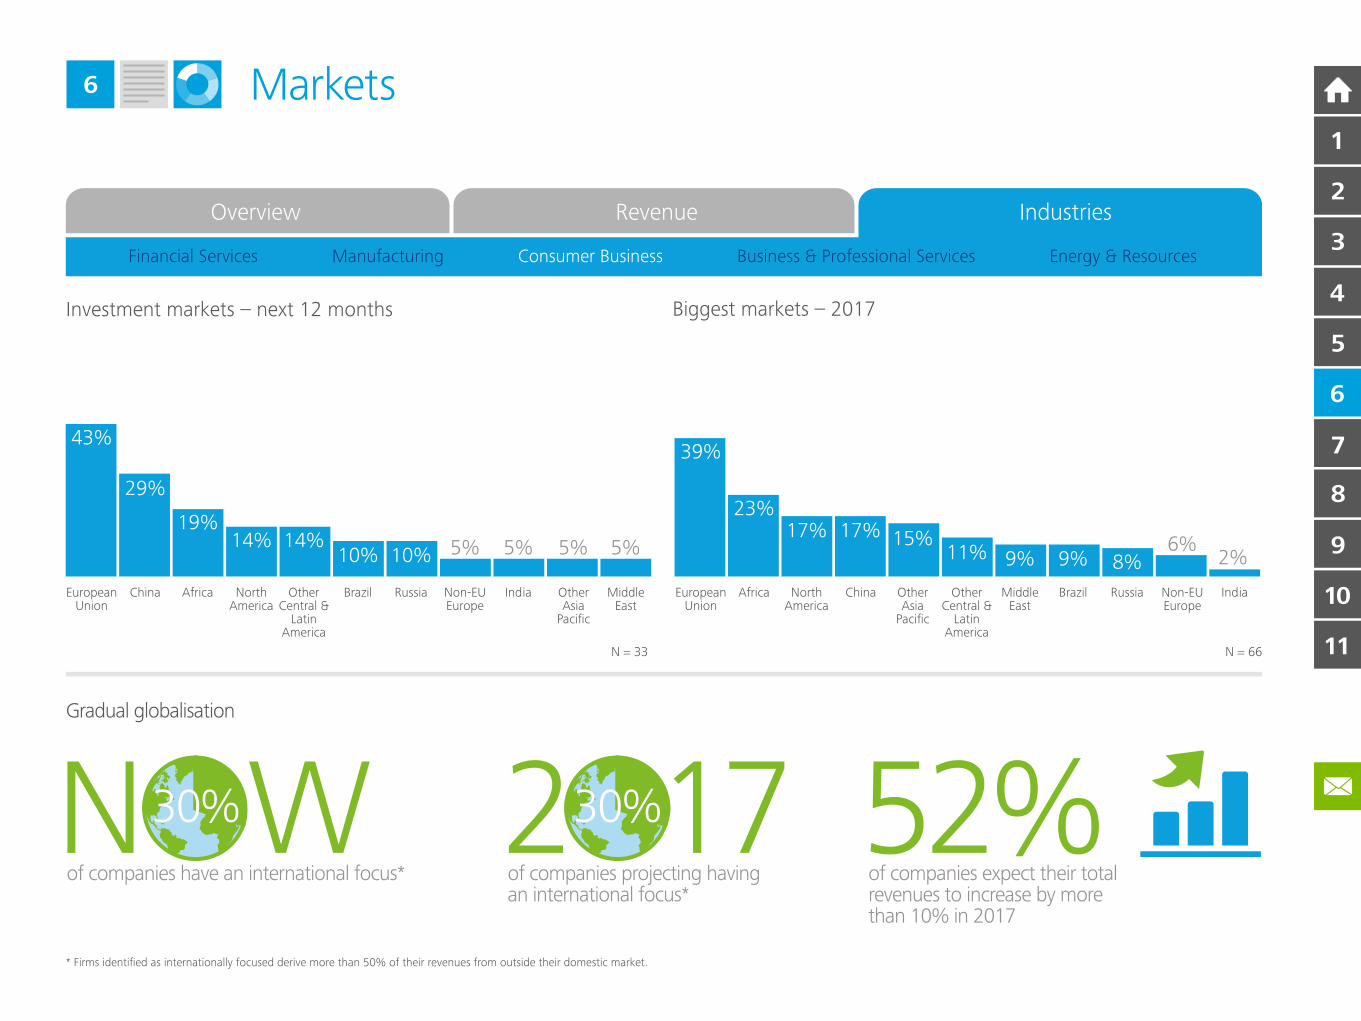
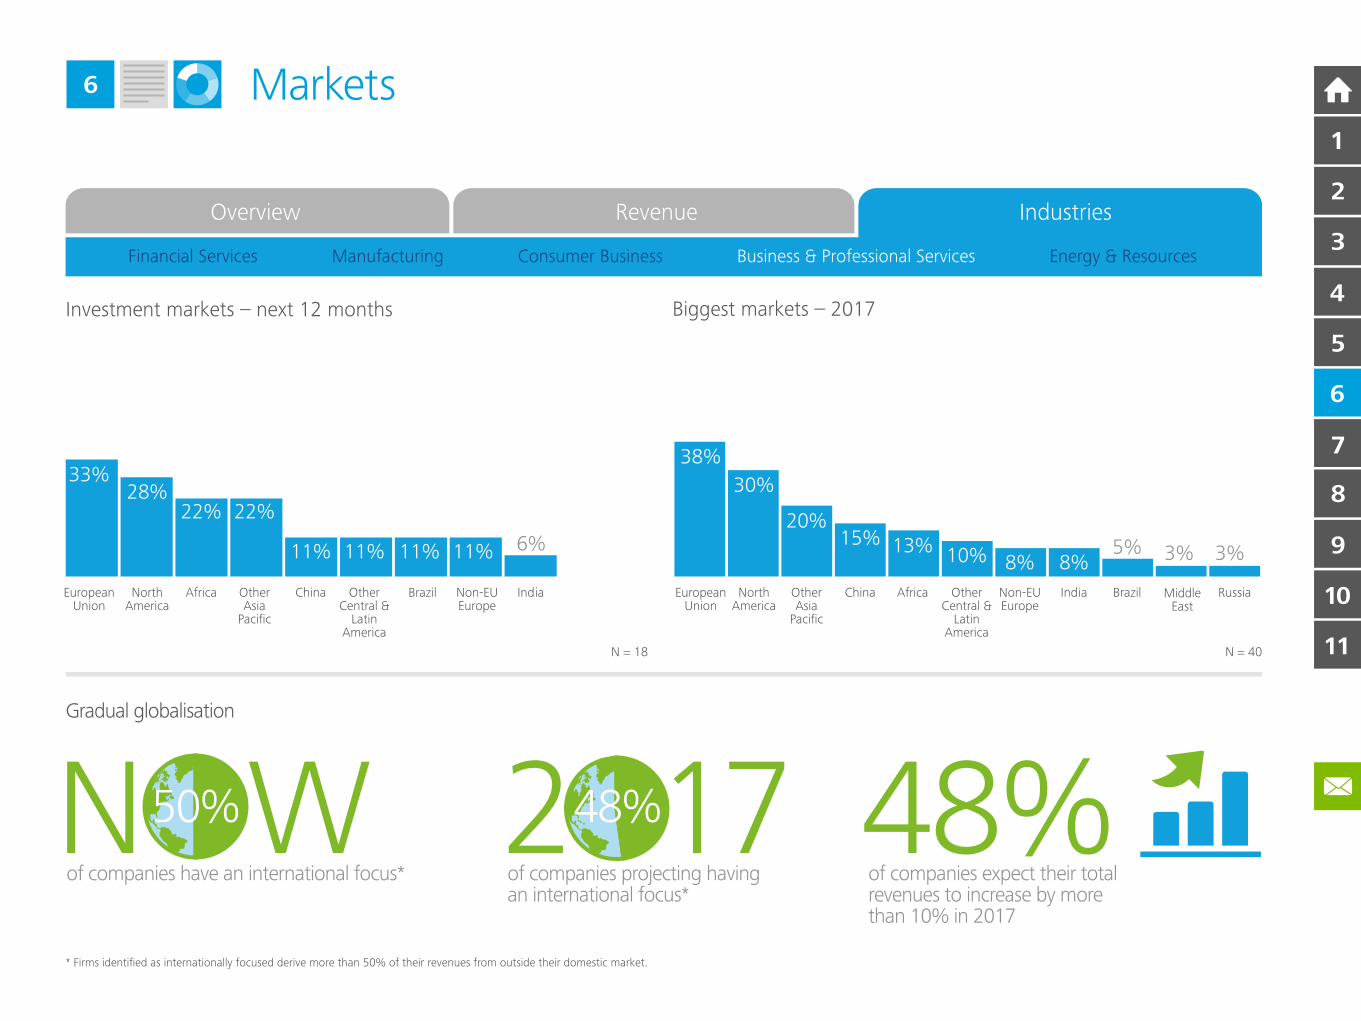
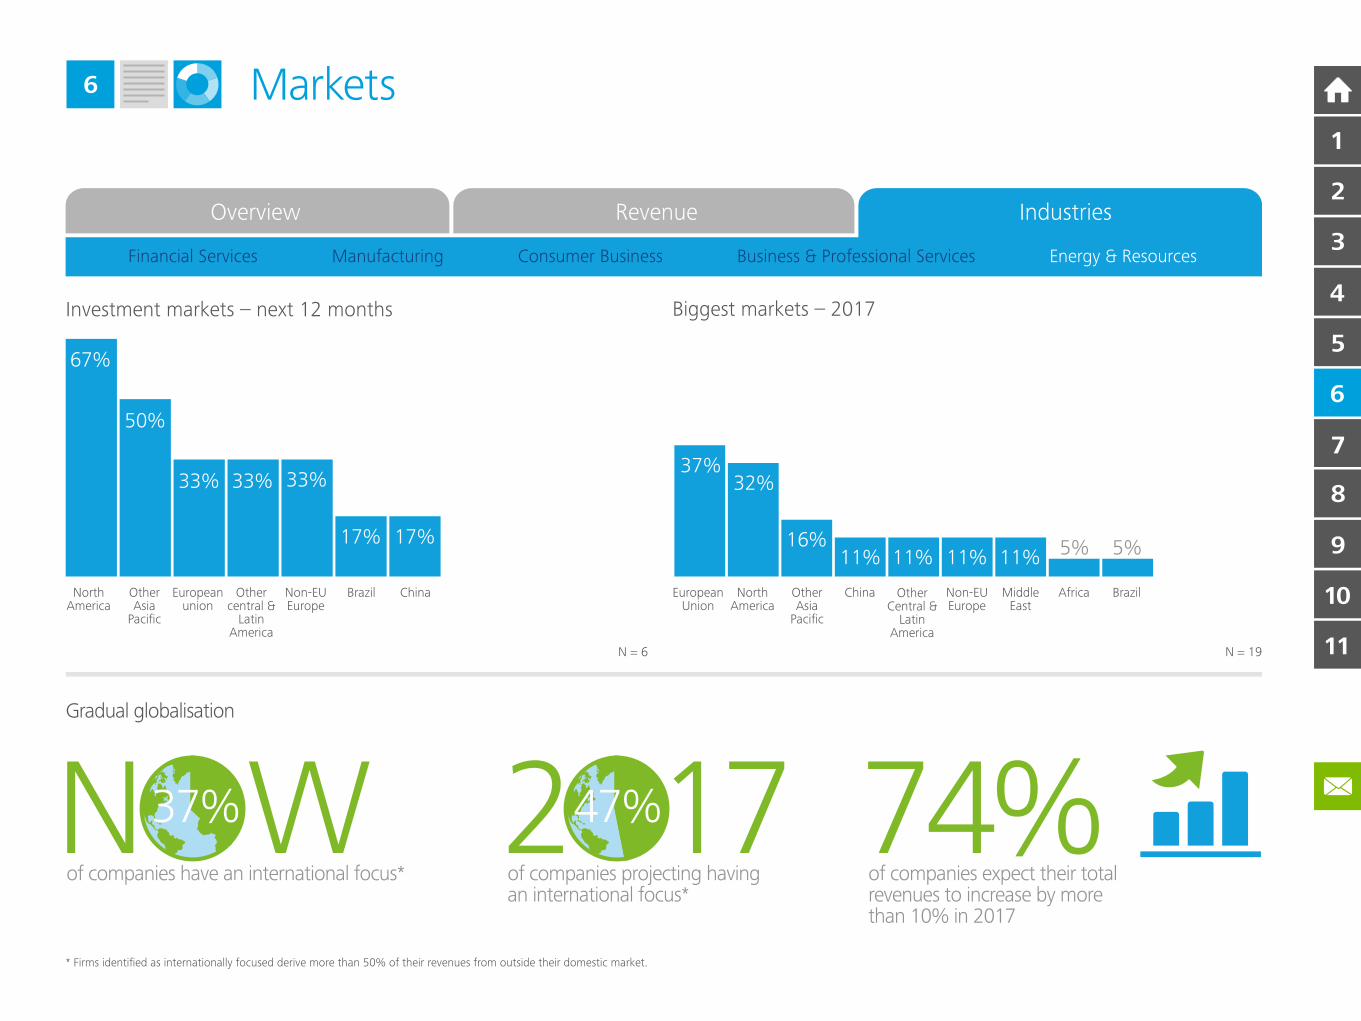
Go global or stay home?
It is essential for businesses to focus on both fronts, in their region and
in the high growth markets. Our analysis shows EMEA businesses see
their home markets as critical: their investment over the next 12 months
is focused within the EU. This is followed by North America and China.
After these top three markets, other regions around the world very
much play ‘second fiddle’. What is startling is that, when executives were
asked about the most significant markets in 2017, the importance of
the EU increases dramatically. This is in strong contrast with most other
markets around the world which show little movement in their relative
importance to EMEA firms. The companies surveyed have a stiff growth
challenge ahead.
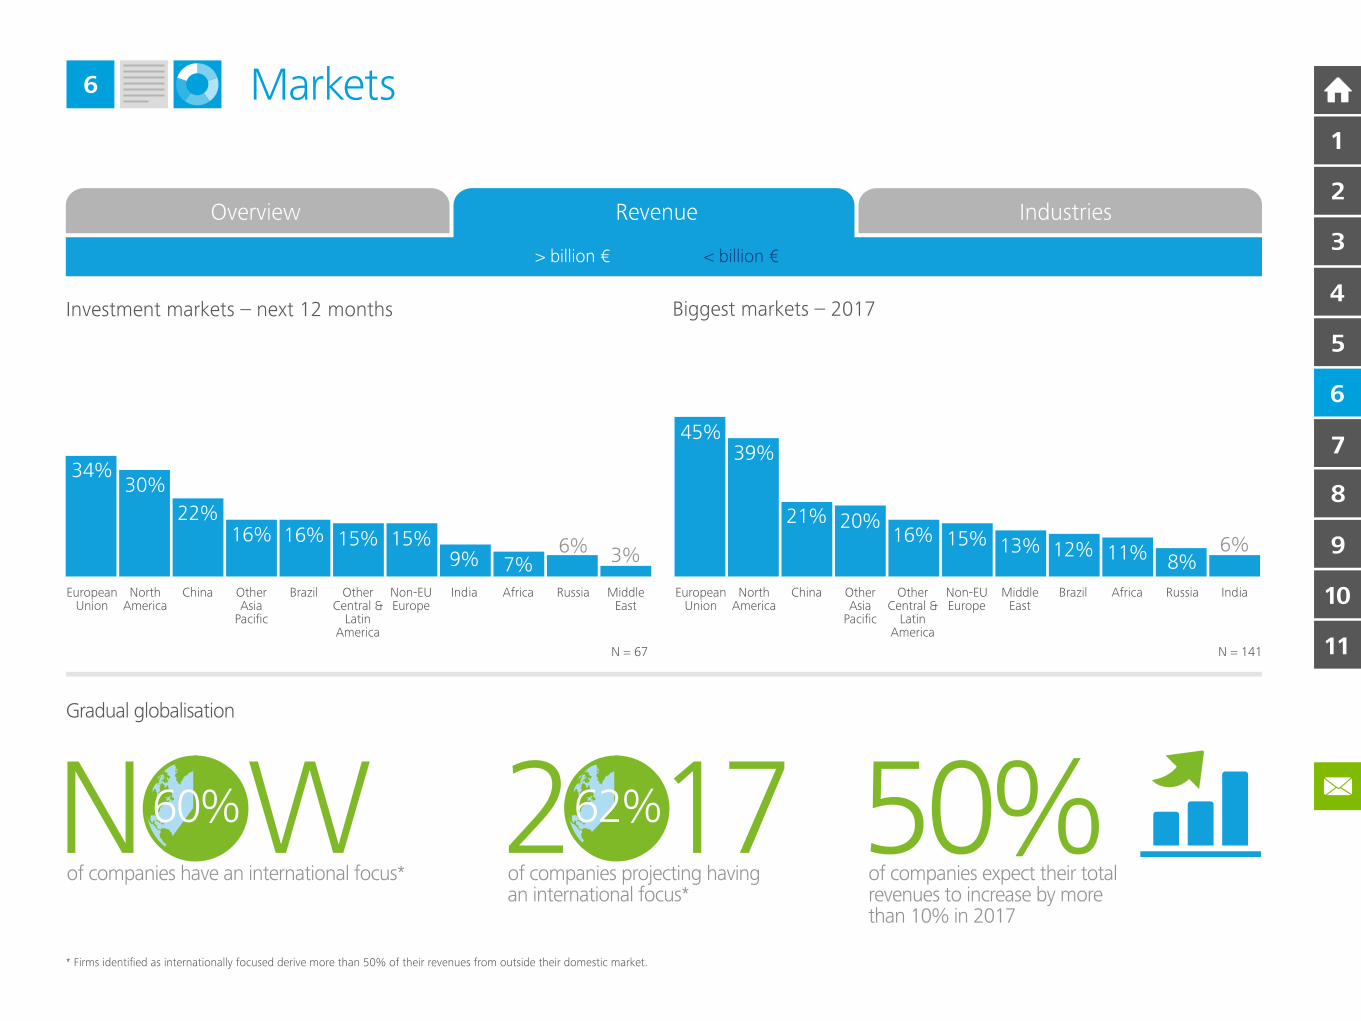
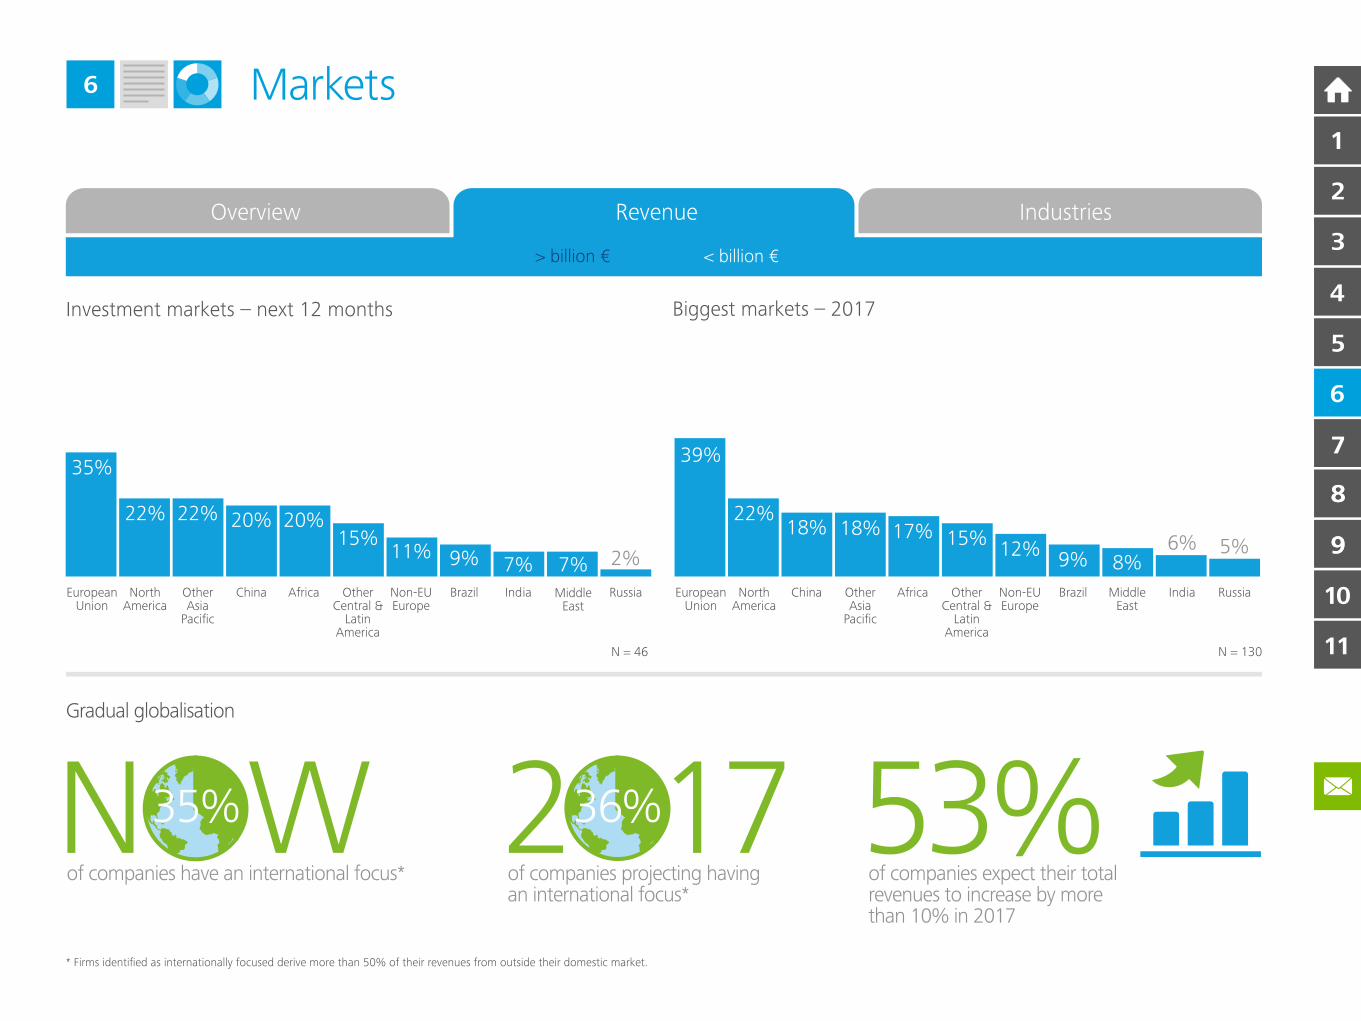
Over half expect total revenues to grow by more than ten per cent
by 2017, while they plan to have similar revenue expectations from
international markets. Not surprisingly, big firms in our survey have a
much greater exposure to international markets than smaller firms –
60 per cent and 30 per cent respectively. What is interesting is that
neither group anticipates this international focus will change over the
next three years, given the threat from Asia and
Silicon Valley.
Beyond BRICS
The Chinese proverb “may you live in interesting times” is often wrongly
interpreted with a positive connotation. EMEA corporates, especially
European firms, are likely to have many interesting and significant
challenges ahead. For example, according to our survey, EMEA
companies are forecasting double digit revenue growth, yet they are
focusing on the eurozone, a region identified by most as having relatively
poor growth prospects. It may be possible that these companies could
meet their growth targets by increasing their market share and taking
advantage of the economies of scale on which the EU is based. It is
also possible that the proposed Transatlantic Trade and Investment
Partnership agreement between North America and the EU may
accelerate trade and investment opportunities. However, what is unlikely,
is that any of these shifts will have an impact on revenues by 2017.
What is clear is that executives are moving beyond the BRICs scenario.
Much of the talk after the financial crisis was of BRICs and the growth
opportunities these markets could offer. That thinking appears to have
cooled. EMEA business leaders are now adopting a portfolio approach,
mixing mature and emerging market opportunities.1 “Asian business: A world to conquer”, The Economist, 31 May 2014.
10
11
9
8
7
6
5
4
2
3
1
3
4
Markets6
10
11
9
8
9
8
7
6
5
4
2
3
1
3
4
Markets6
> billion € < billion €
10
11
9
8
7
6
5
4
2
3
1
3
4
Markets6
RussiaIndiaMiddleEast
BrazilNon-EUEurope
OtherCentral &
LatinAmerica
AfricaOtherAsia
Pacific
ChinaNorthAmerica
EuropeanUnion
> billion € < billion €
10
11
9
8
9
8
7
6
5
4
2
3
1
3
4
Markets6
10
11
9
8
7
6
5
4
2
3
1
3
4
Markets6
10
11
9
8
7
6
5
4
2
3
1
3
4
Markets6
10
11
9
8
7
6
5
4
2
3
1
3
4
Markets6
10
11
9
8
7
6
5
4
2
3
1
3
4
Markets6
47%
10
11
9
8
7
6
5
4
2
3
1
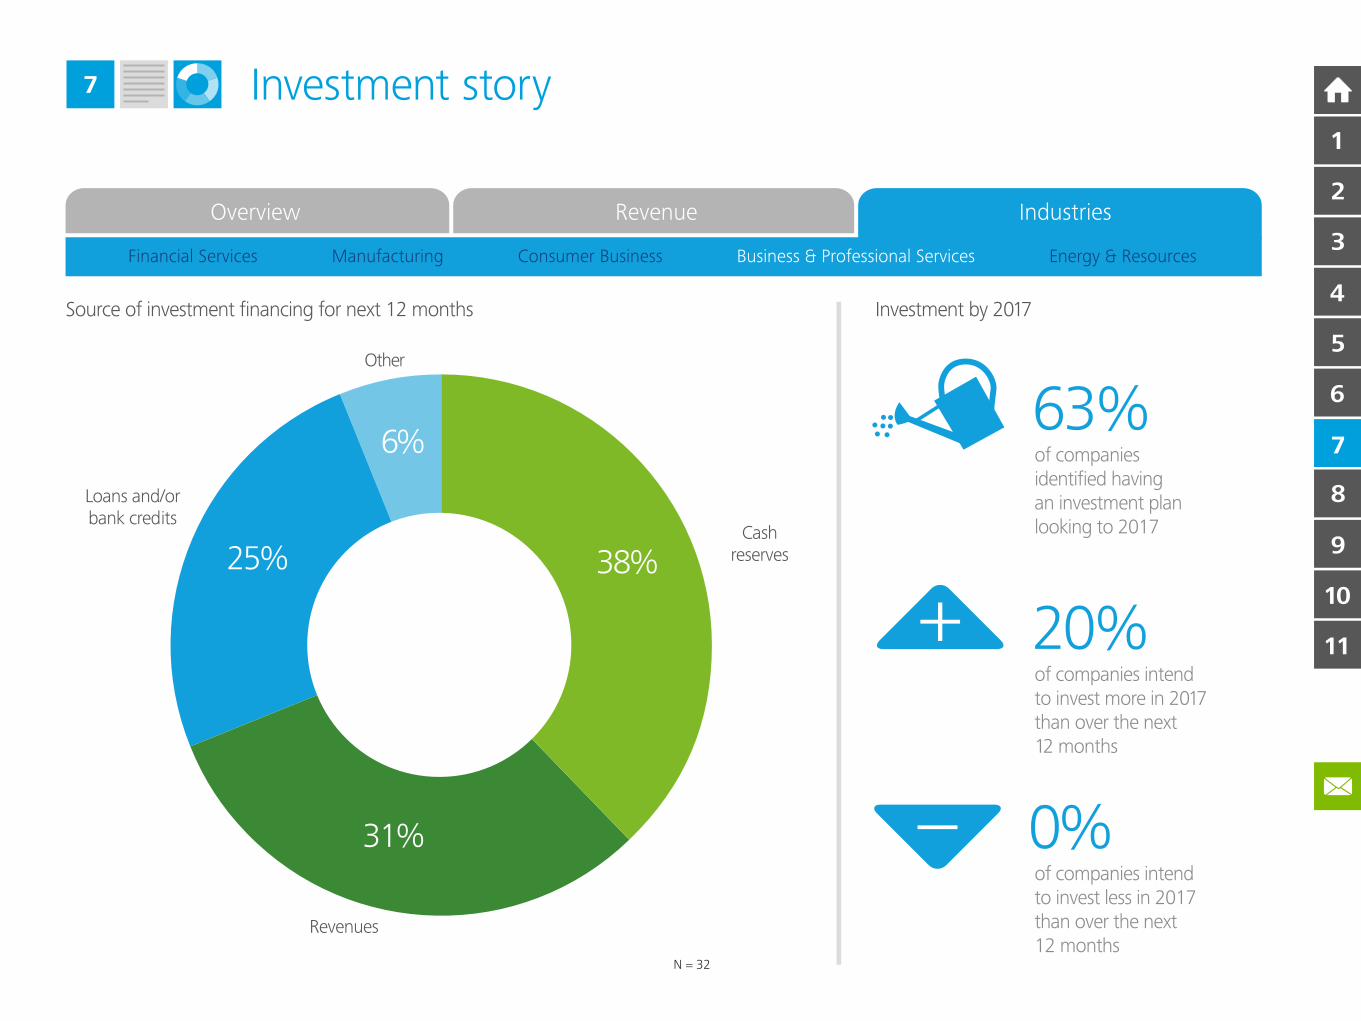
9
Investment story7
Balancing the books
Perhaps unfairly, corporates have been criticised in some quarters for
hoarding cash, rather than making investments. As our research shows,
the distribution of cash surpluses across the EMEA region is uneven –
with 17 per cent of companies owning 75 per cent of the $1 trillion total.
The cost of borrowing has recently fallen again across Europe.1 So credit
is cheap and available. However, companies – both listed and non-listed,
large and small – have built up cash reserves in recent years. With growth
back on the agenda, the key question remains: will cash flow, cash piles
or credit be used to fund these much need business investments?
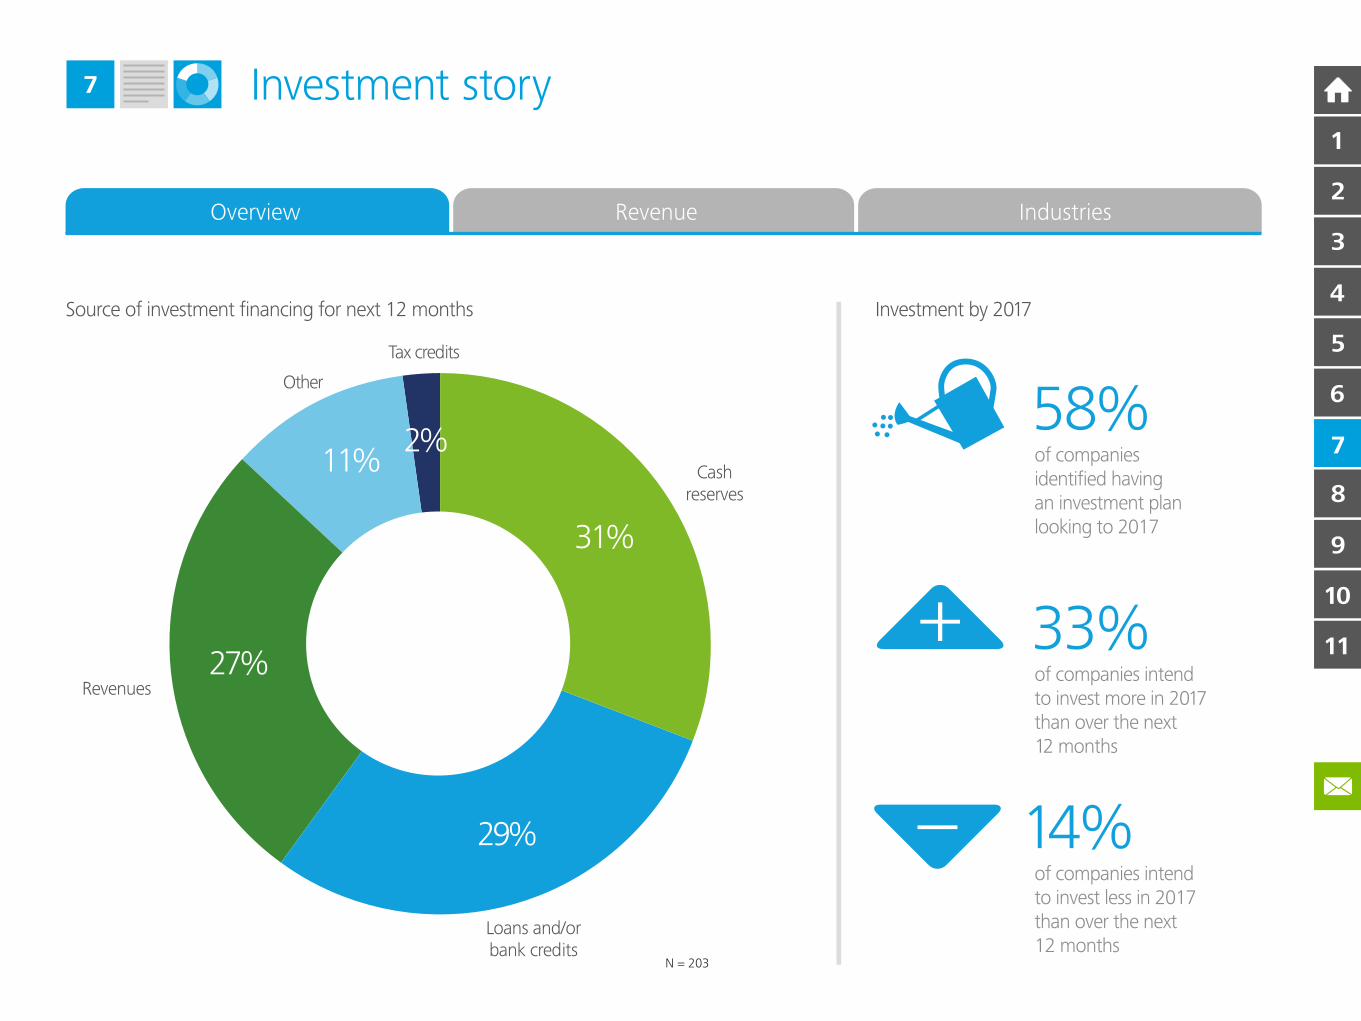
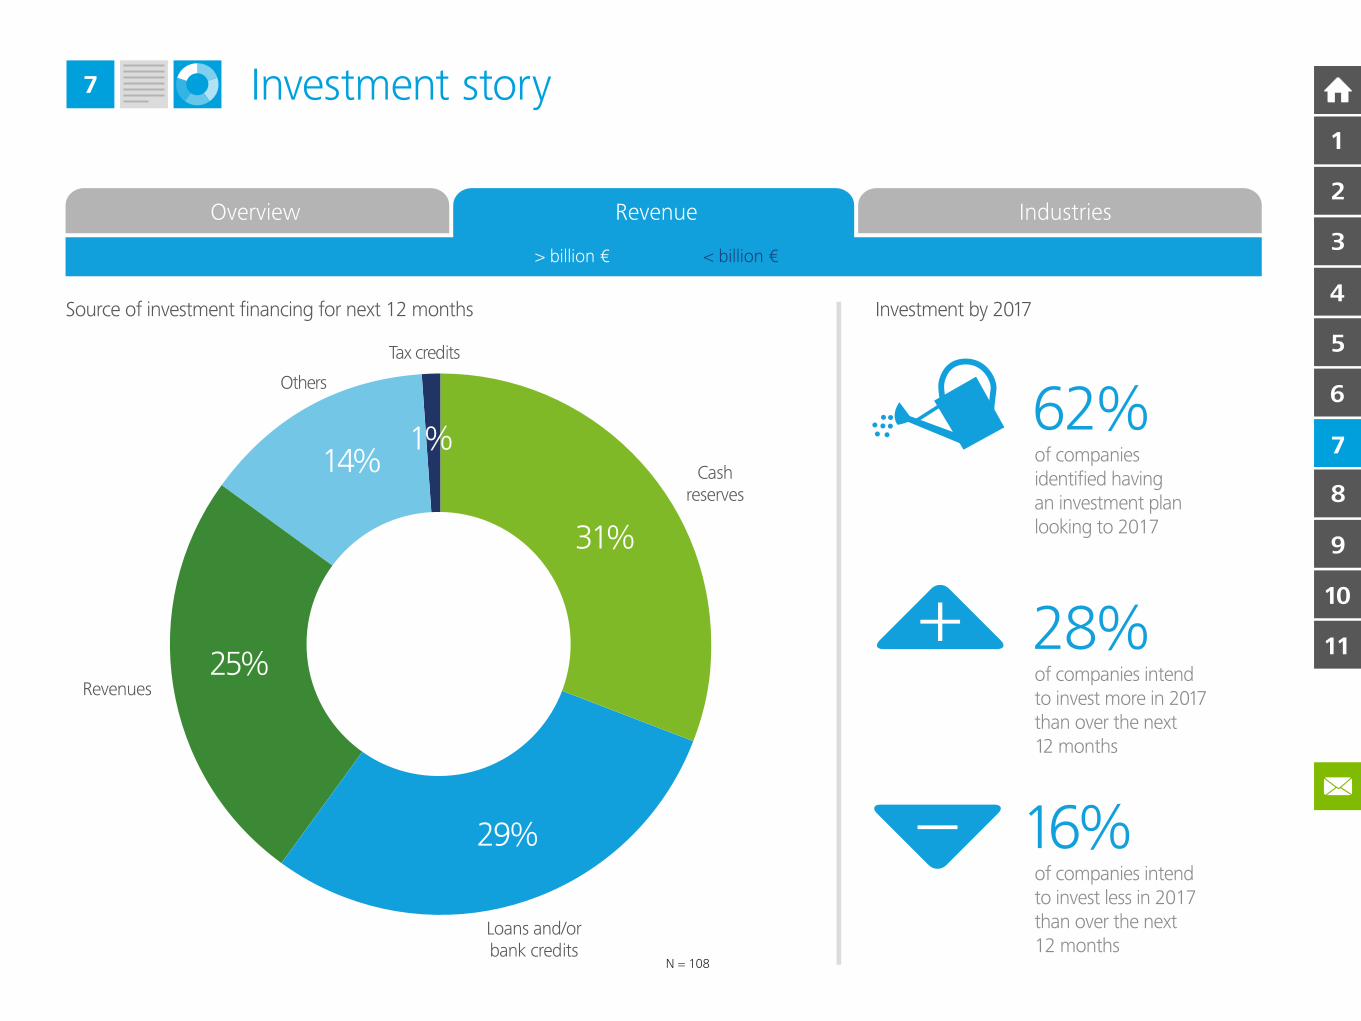
Cash is king
What is emerging across the region is a thoughtful recovery which is
characterised by modest investments rather than spending sprees on
corporate assets or other more reckless behaviours. Evidence from our
analysis shows that cash reserves are the favoured source of funding for
business investment over the next 12 months. Echoing the nature of
the recovery, heads of finance also plan to use bank credit and revenues
to fund future growth initiatives. This balanced picture is repeated
across industries with the exception of those operating in energy and
resources. For these, bank loans are the main source of funding at
44 per cent – backed by the €250 billion these companies have on their
balance sheets. This can be explained by the 20+ year investment horizon
required to build the infrastructure that supports the energy industry. All
other forms of finance are cited by respondents as being below 20 per cent.
Sunny outlook ahead?
Given the length and depth of the recession a sustained period of
growth is required to put standards of living back on track. The health
of the public sector and consumer finances suggests that the corporate
sector offers the best option to achieve growth. Again, the 271 senior
executives polled in our survey provided answers that offer cause for
some optimism. Nearly 60 per cent have investment plans projected
through 2017. Perhaps most encouraging is that a third plan to have
higher investment budgets in 2017 compared to the next 12 months.
Only 14 per cent report a decline in their investment budget over this
same period. Manufacturing companies appear most bullish with
40 per cent reporting higher budgets in 2017 and less than one in
ten planning to reduce budgets. Energy firms are the least aggressive,
reporting lower investment budgets for 2017 due to the cost-cutting
measures currently being implemented.
1 “ECB unveils radical moves to fight deflation and lift economy”, Financial Times, 5 June 2014.
10
11
9
8
7
6
5
4
2
3
1
9
Investment story7
Source of investment financing for next 12 months
33%of companies intendto invest more in 2017than over the next 12 months
14%of companies intendto invest less in 2017than over the next12 months
58%of companiesidentified having an investment planlooking to 2017
Tax credits
Other
Revenues
Cashreserves
Loans and/orbank credits
31%
29%
27%
11%2%
N = 203
Overview Revenue Industries
Investment by 2017
10
11
9
8
7
6
5
4
2
3
1
9
Investment story7
Source of investment financing for next 12 months
Overview Revenue Industries
28%of companies intendto invest more in 2017than over the next 12 months
16%of companies intendto invest less in 2017than over the next12 months
62%of companiesidentified having an investment planlooking to 2017
N = 108
Tax credits
Others
Revenues
Loans and/orbank credits
Cashreserves
Loans and/orbank credits
31%
29%
25%
14%1%
> billion € < billion €
Investment by 2017
10
11
9
8
7
6
5
4
2
3
1
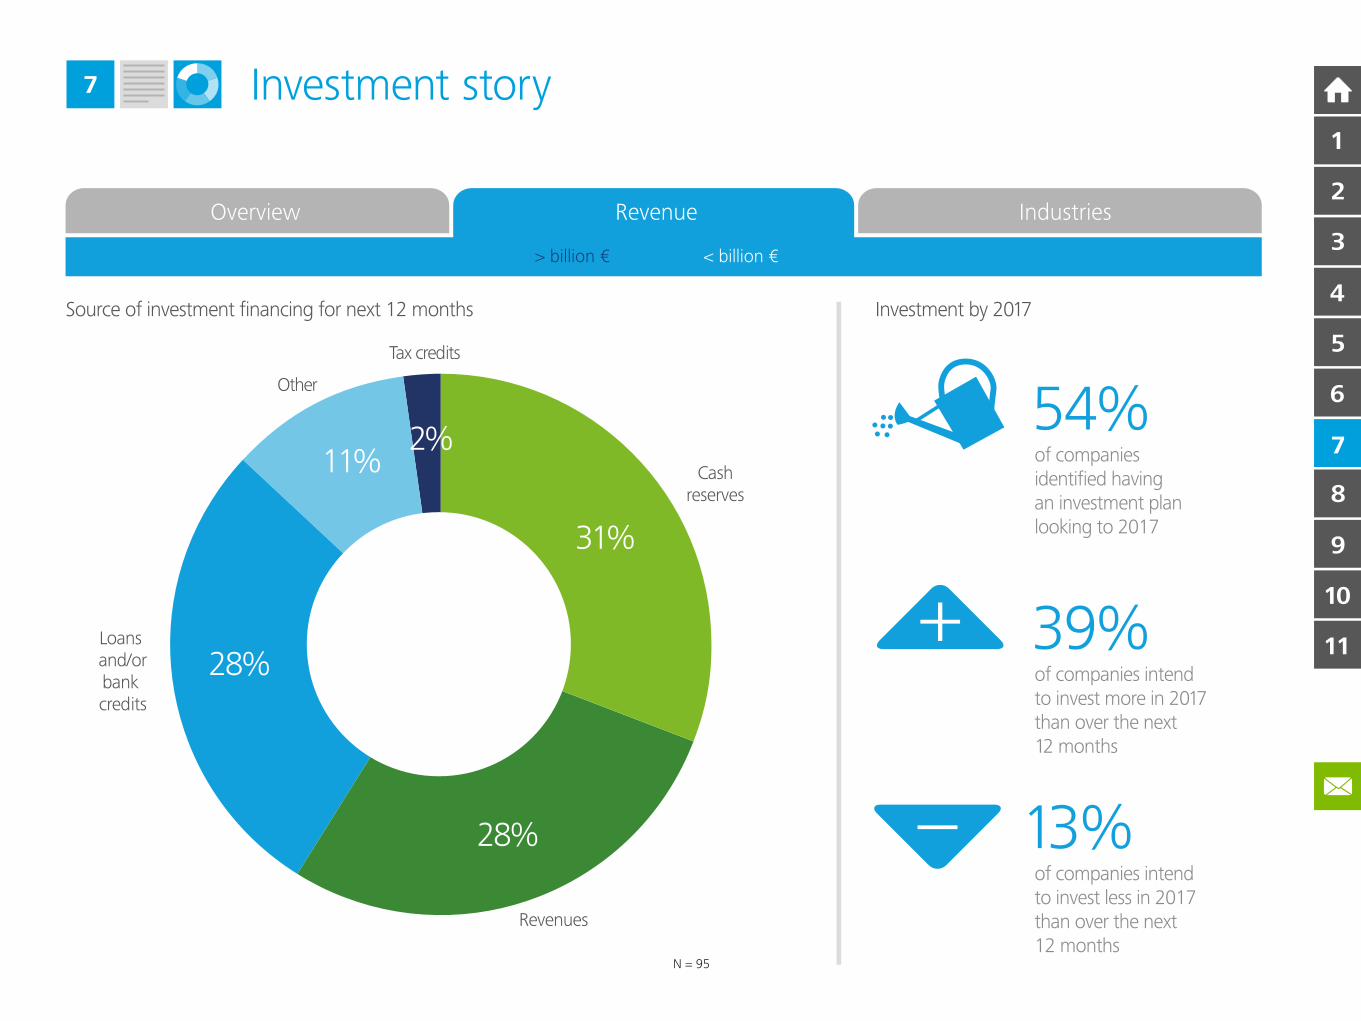
9
Investment story7
Source of investment financing for next 12 months
Overview Revenue Industries
39%of companies intendto invest more in 2017than over the next 12 months
13%of companies intendto invest less in 2017than over the next12 months
54%of companiesidentified having an investment planlooking to 2017
N = 95
Tax credits
Other
Revenues
Loans and/orbank credits
Cashreserves
Loans and/orbank credits
31%
28%
28%
11%2%
> billion € < billion €
Investment by 2017
10
11
9
8
7
6
5
4
2
3
1
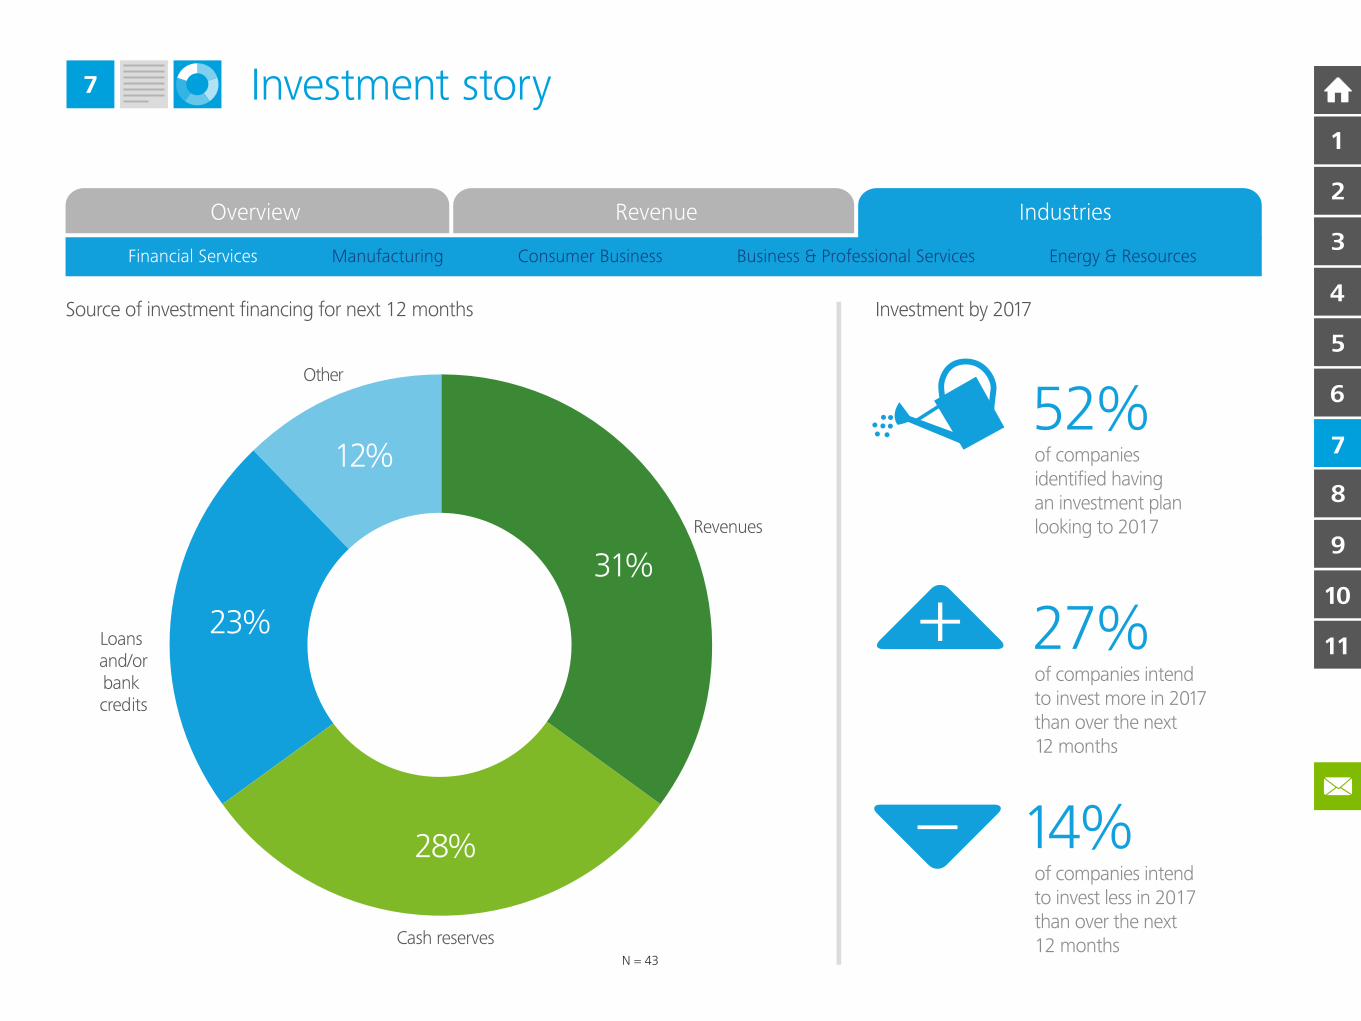
9
Investment story7
Overview Revenue Industries
Financial Services Manufacturing Consumer Business Business & Professional Services Energy & Resources
Source of investment financing for next 12 months
27%of companies intendto invest more in 2017than over the next 12 months
14%of companies intendto invest less in 2017than over the next12 months
52%of companiesidentified having an investment planlooking to 2017
N = 43
Other
Revenues
Loans and/orbank credits
Cash reserves
Loans and/orbank credits
31%
28%
23%
12%
Investment by 2017
10
11
9
8
7
6
5
4
2
3
1
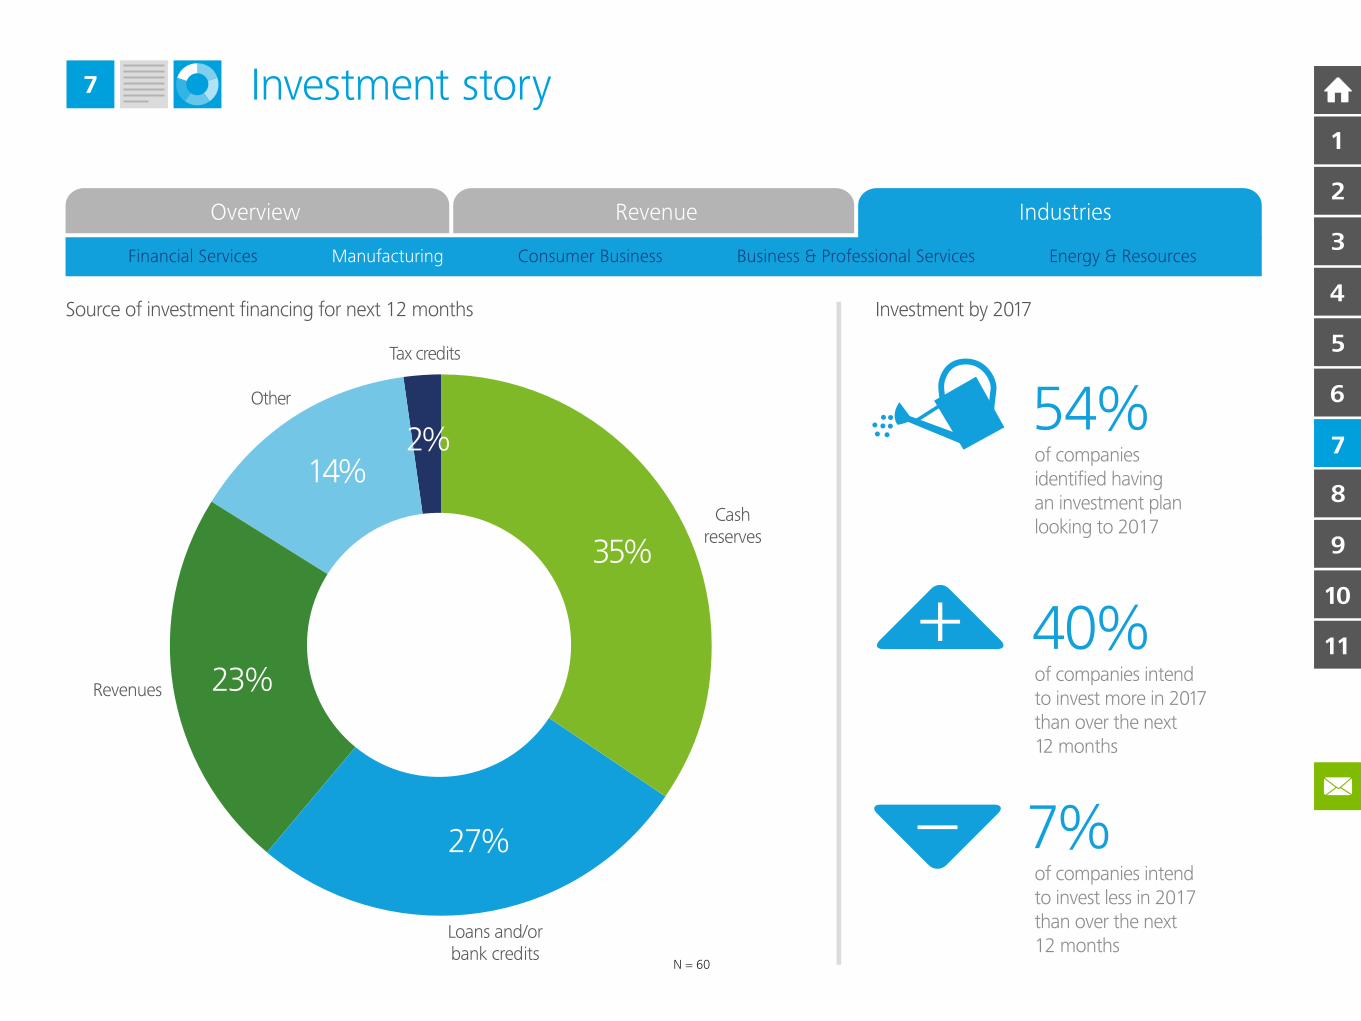
9
Investment story7
Overview Revenue Industries
Financial Services Manufacturing Consumer Business Business & Professional Services Energy & Resources
Source of investment financing for next 12 months
40%of companies intendto invest more in 2017than over the next 12 months
7%of companies intendto invest less in 2017than over the next12 months
54%of companiesidentified having an investment planlooking to 2017
N = 60
Tax credits
Other
Revenues
Loans and/orbank credits
Cashreserves
Loans and/orbank credits
35%
27%
23%
14%2%
Investment by 2017
10
11
9
8
7
6
5
4
2
3
1
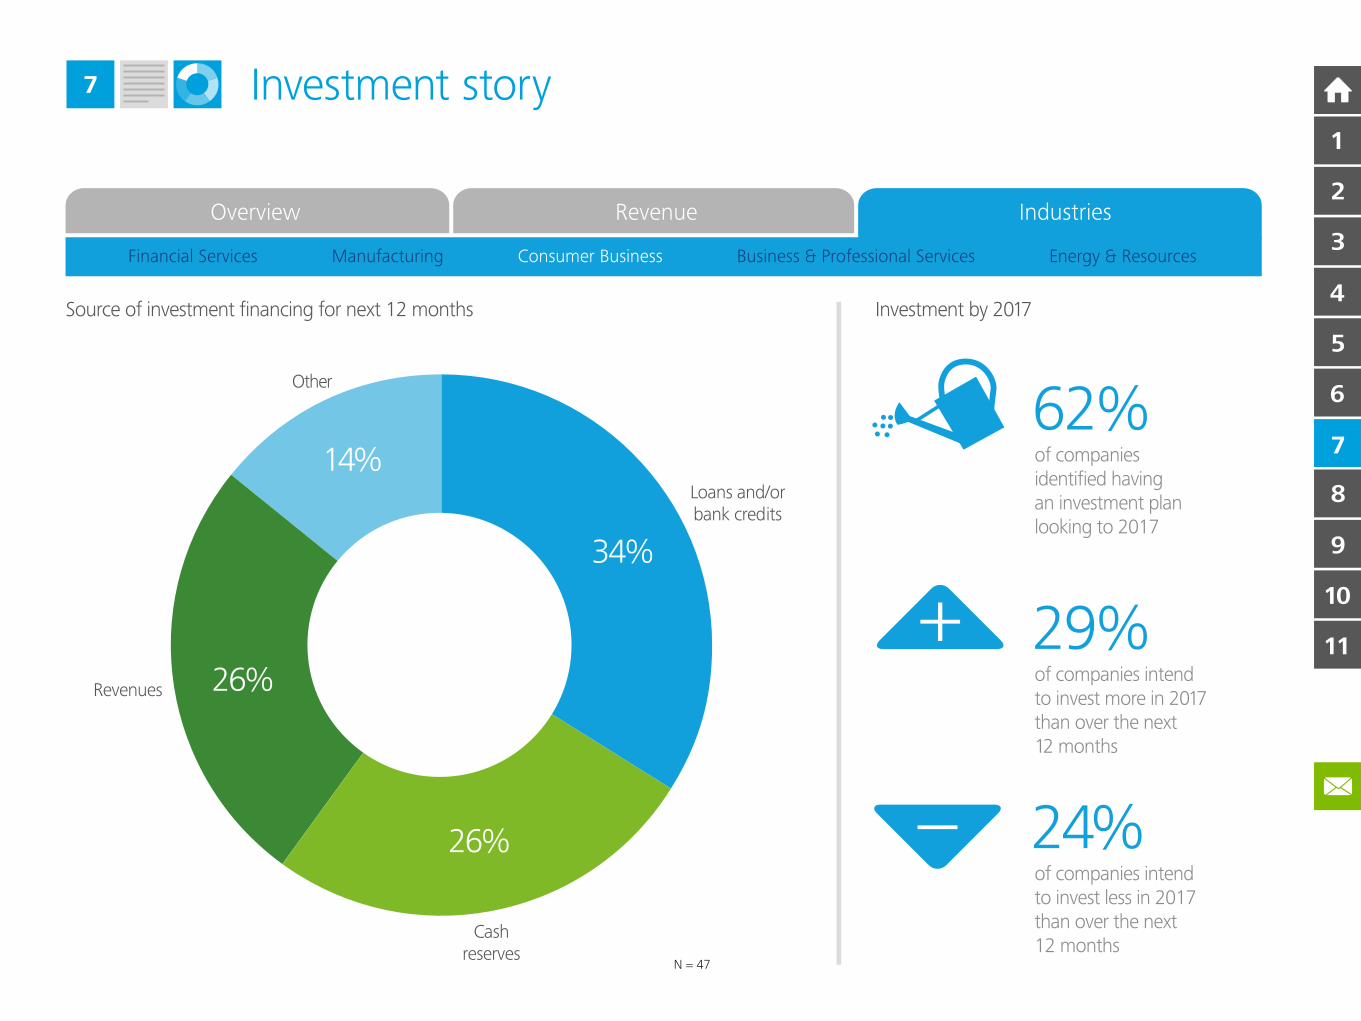
9
Investment story7
Overview Revenue Industries
Financial Services Manufacturing Consumer Business Business & Professional Services Energy & Resources
Source of investment financing for next 12 months
29%of companies intendto invest more in 2017than over the next 12 months
24%of companies intendto invest less in 2017than over the next12 months
62%of companiesidentified having an investment planlooking to 2017
N = 47
Other
Revenues
Loans and/orbank credits
Cashreserves
Loans and/orbank credits
34%
26%
26%
14%
Investment by 2017
10
11
9
8
7
6
5
4
2
3
1
9
Investment story7
Overview Revenue Industries
Financial Services Manufacturing Consumer Business Business & Professional Services Energy & Resources
Investment by 2017Source of investment financing for next 12 months
20%of companies intendto invest more in 2017than over the next 12 months
0%of companies intendto invest less in 2017than over the next12 months
63%of companiesidentified having an investment planlooking to 2017
N = 32
Other
Revenues
Loans and/orbank credits
Loans and/orbank credits
Cashreserves38%
31%
25%
6%
10
11
9
8
7
6
5
4
2
3
1
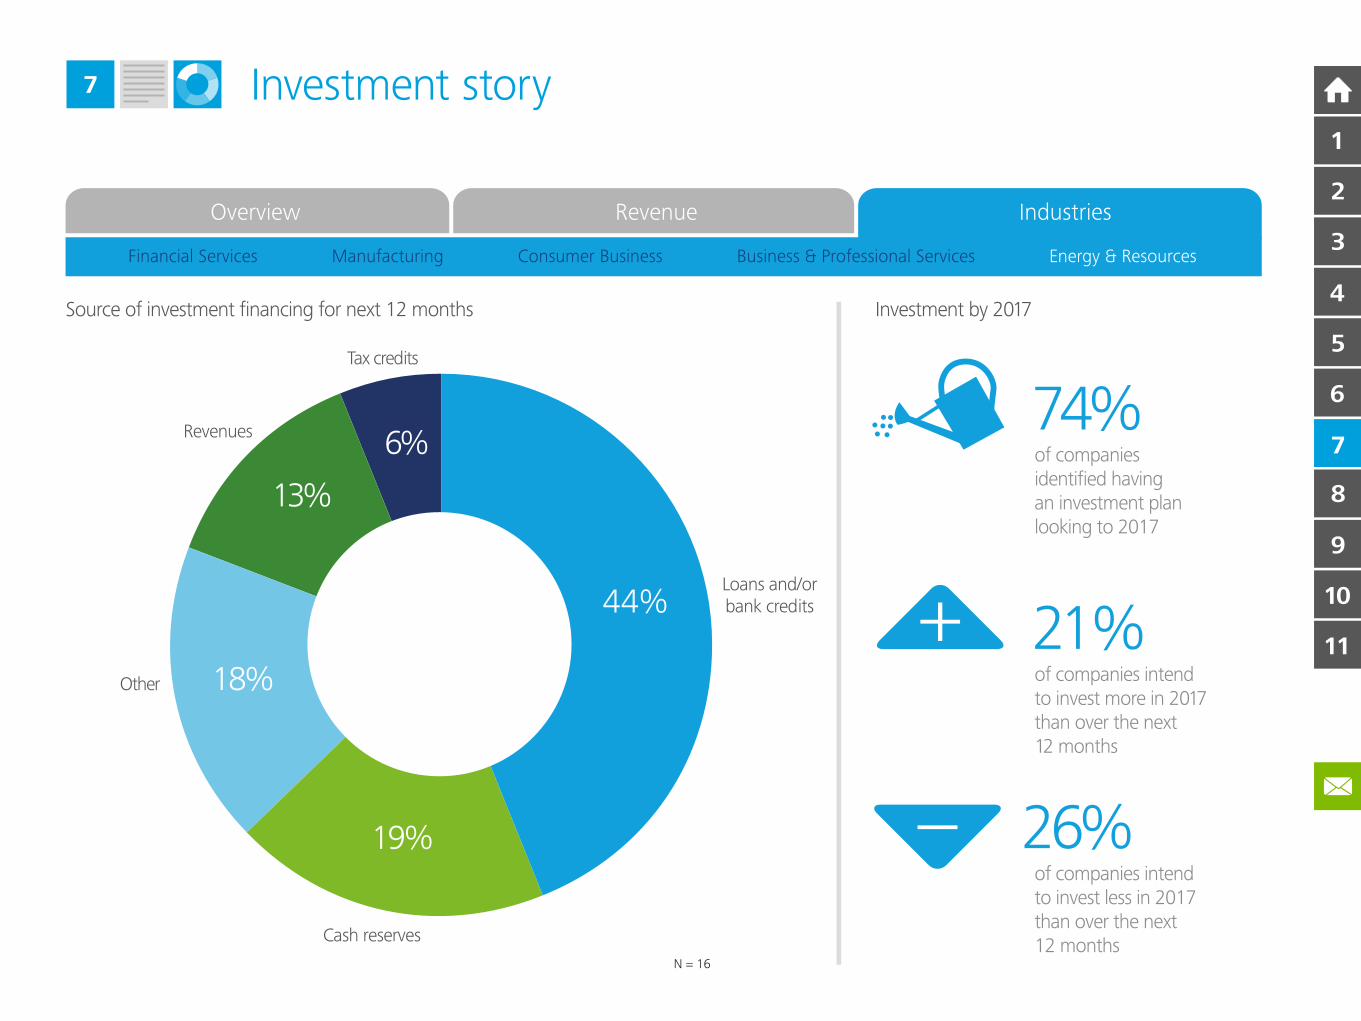
9
Investment story7
Overview Revenue Industries
Financial Services Manufacturing Consumer Business Business & Professional Services Energy & Resources
Source of investment financing for next 12 months
21%of companies intendto invest more in 2017than over the next 12 months
26%of companies intendto invest less in 2017than over the next12 months
74%of companiesidentified having an investment planlooking to 2017
N = 16
Tax credits
Other
Revenues
Loans and/orbank credits
Cash reserves
Loans and/orbank credits44%
19%
18%
13%
6%
Investment by 2017
10
11
9
8
7
6
5
4
2
3
1
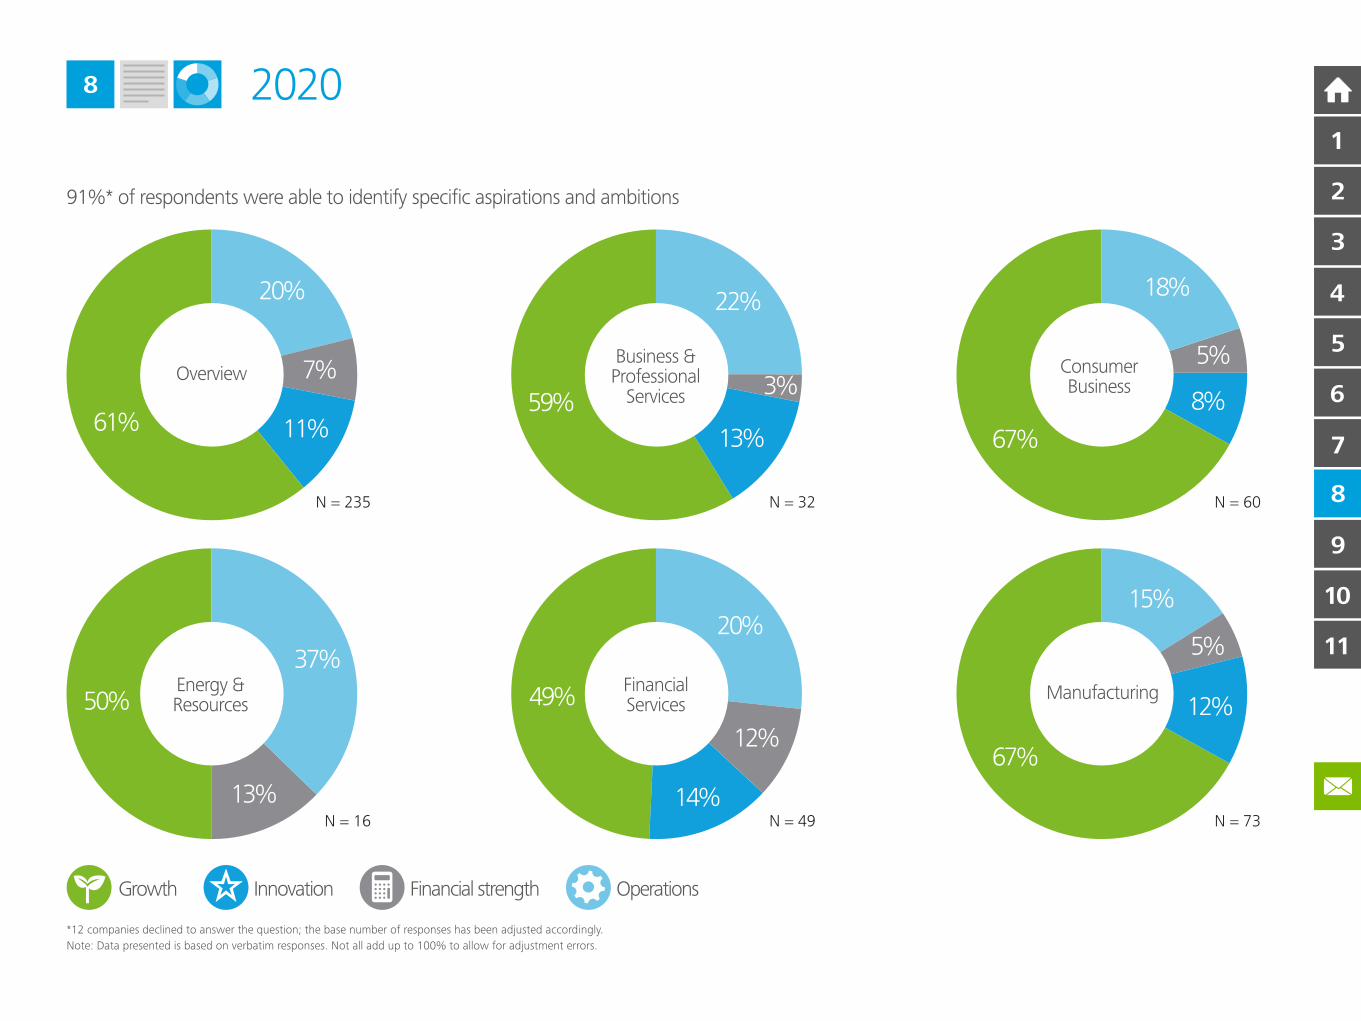
32020 Vision
Looming on the horizon is 2020 – only five years away. A five-year plan
used to be commonplace in most corporate boardrooms. However,
during the last 20 years market volatility and uncertainty have made it
much more challenging to create concrete five-year plans. But to succeed
in global markets, companies need to commit to invest for the longer
term. It is encouraging that nearly 60 per cent of the firms in our survey
have a stated strategy for 2020 and nearly nine in ten have identified
specific aspirations and ambitions for the future.
Succeeding in the market
Understanding the key drivers of change is critical for businesses to
succeed. We have grouped the possible investment ‘triggers’ into
four categories:
• Growth, including mergers and acquisitions, and market entry
• Innovation strategies, including research and development,
and diversification
• Financial strength, comprising balance sheet issues, cost and margin
improvement
• Operations, including quality, brand, risk and process
improvement initiatives.
8
Growth comes out very strongly, topping the list in every sector.
Overall, over 60 per cent of firms in EMEA anticipate that growth will
be their prime focus in 2020. The next most important aspiration is
operational capabilities. Around a fifth of those polled will focus on
this area, although this jumps to nearly 40 per cent for energy and
resources companies. Finally, both innovation and financial strength
are key priorities for EMEA businesses looking to 2020, a sign that
competitiveness will be the focal point of boardroom discussions in
the future.
2020
7
6
5
4
2
3
1
10
11
9
8
3
8 2020
*12 companies declined to answer the question; the base number of responses has been adjusted accordingly.
Note: Data presented is based on verbatim responses. Not all add up to 100% to allow for adjustment errors.
91%* of respondents were able to identify specific aspirations and ambitions
Growth Innovation Financial strength Operations
3%
N = 32
59%
13%
3%
22%
Business &Professional
Services
N = 60
67%
8%
5%
18%
ConsumerBusiness
N = 49
49%
14%
12%
20%
FinancialServices
N = 16
50%
13%
37%Energy &Resources
N = 73
67%
15%
5%
12%Manufacturing
61% 11%
7%
20%
N = 235
Overview
7
6
5
4
2
3
1
10
11
9
8
South Africa
Finland
The Netherlands
Norway
Spain
Switzerland
Luxembourg
Italy
Germany
France
UK
Austria
Denmark
Belgium
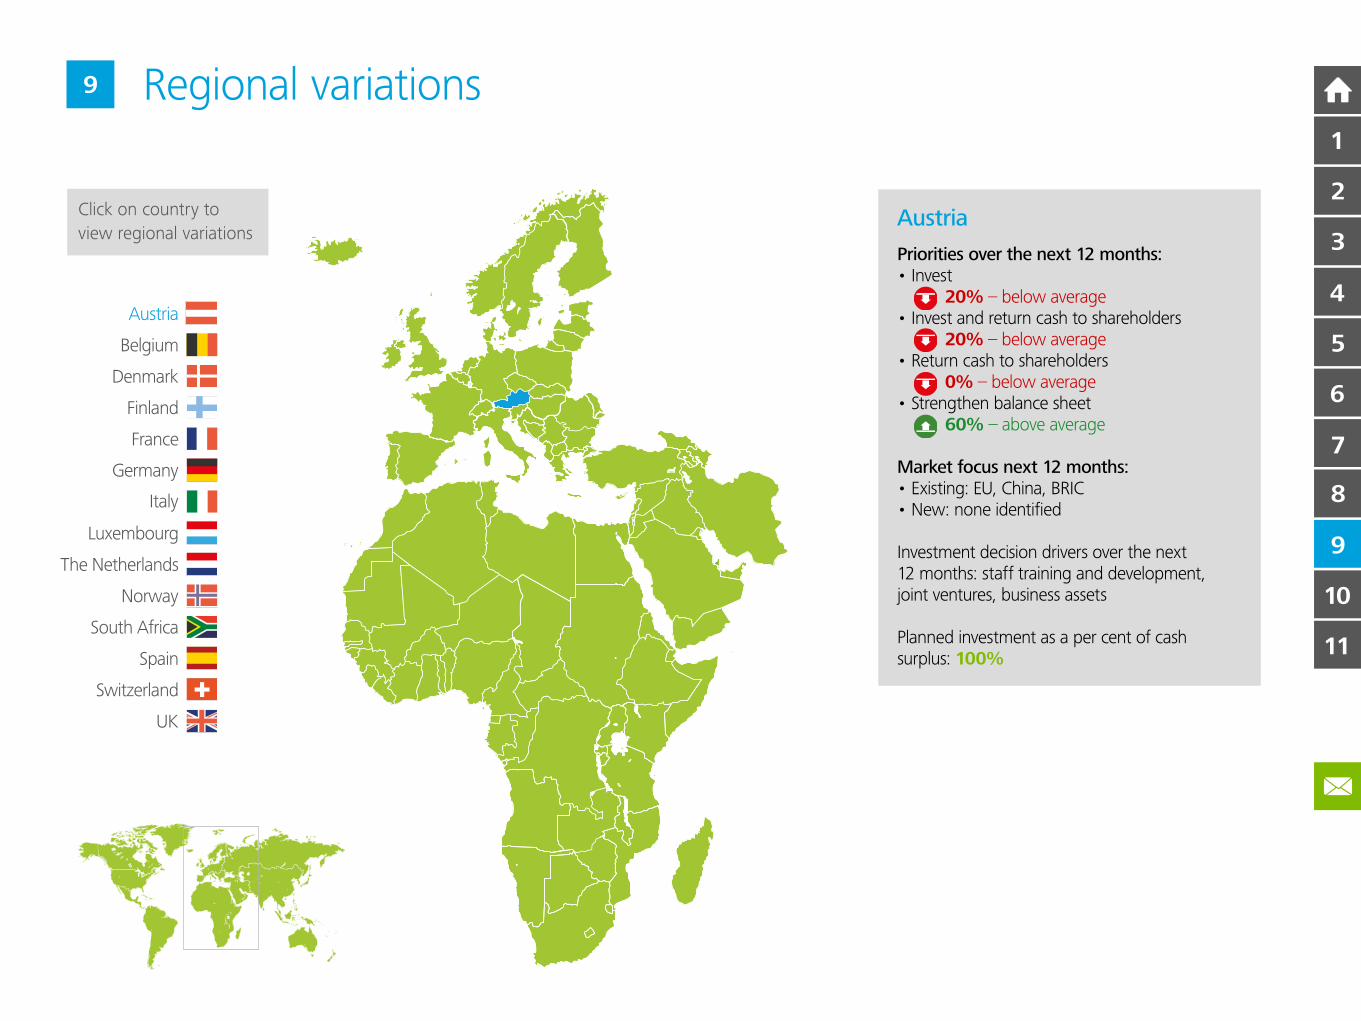
Regional variations
Austria
Priorities over the next 12 months:• Invest 20% – below average
• Invest and return cash to shareholders 20% – below average
• Return cash to shareholders 0% – below average
• Strengthen balance sheet 60% – above average
Market focus next 12 months:• Existing: EU, China, BRIC• New: none identified
Investment decision drivers over the next 12 months: staff training and development, joint ventures, business assets
Planned investment as a per cent of cash surplus: 100%
9
Click on country to
view regional variations
7
6
5
4
2
3
1
10
11
9
8
South Africa
Finland
The Netherlands
Norway
Spain
Switzerland
Luxembourg
Italy
Germany
France
UK
Austria
Denmark
Belgium
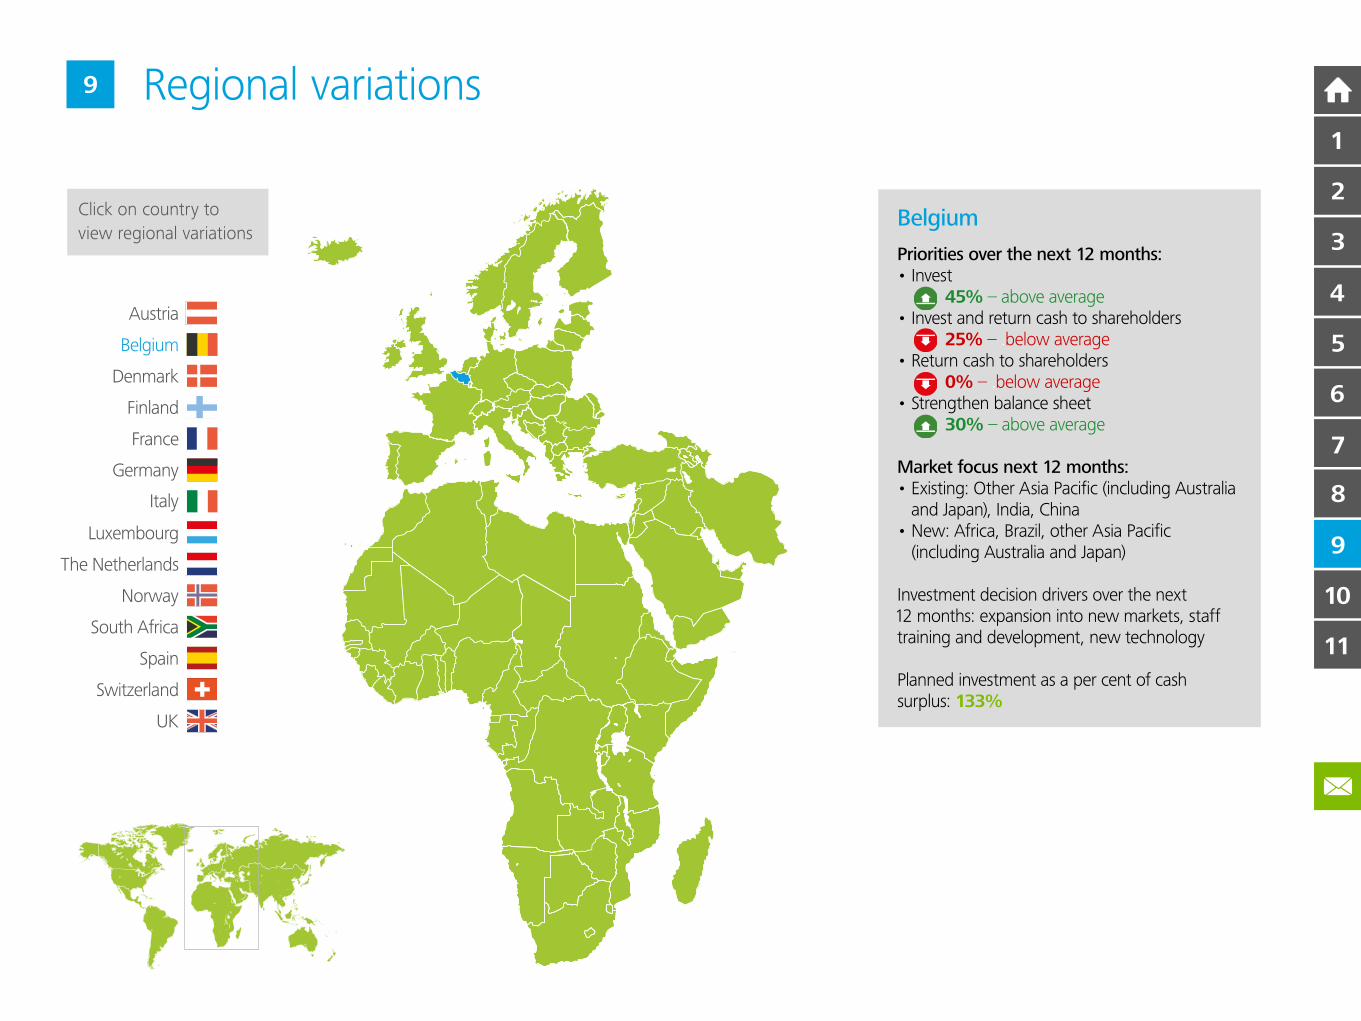
Regional variations
Belgium
Priorities over the next 12 months:• Invest 45% – above average
• Invest and return cash to shareholders 25% – .below average
• Return cash to shareholders 0% – .below average
• Strengthen balance sheet 30% – above average
Market focus next 12 months:• Existing: Other Asia Pacific (including Australia
and Japan), India, China • New: Africa, Brazil, other Asia Pacific
(including Australia and Japan)
Investment decision drivers over the next .12 months: expansion into new markets, staff training and development, new technology
Planned investment as a per cent of cash surplus: 133%
Click on country to
view regional variations
9
7
6
5
4
2
3
1
10
11
9
8

South Africa
Finland
The Netherlands
Norway
Spain
Switzerland
Luxembourg
Italy
Germany
France
UK
Austria
Denmark
Belgium
Regional variations
Denmark
Priorities over the next 12 months:• Invest 20% – below average
• Invest and return cash to shareholders 60% – .above average
• Return cash to shareholders 0% – .below average
• Strengthen balance sheet 20% – below average
Market focus next 12 months:• Existing: EU, non-EU Europe • New: Africa, China
Investment decision drivers over the next .12 months: expansion into new markets, staff training and development, new technology and research and development
Planned investment as a per cent of cash surplus: 67%
Click on country to
view regional variations
9
7
6
5
4
2
3
1
10
11
9
8
South Africa
Finland
The Netherlands
Norway
Spain
Switzerland
Luxembourg
Italy
Germany
France
UK
Austria
Denmark
Belgium
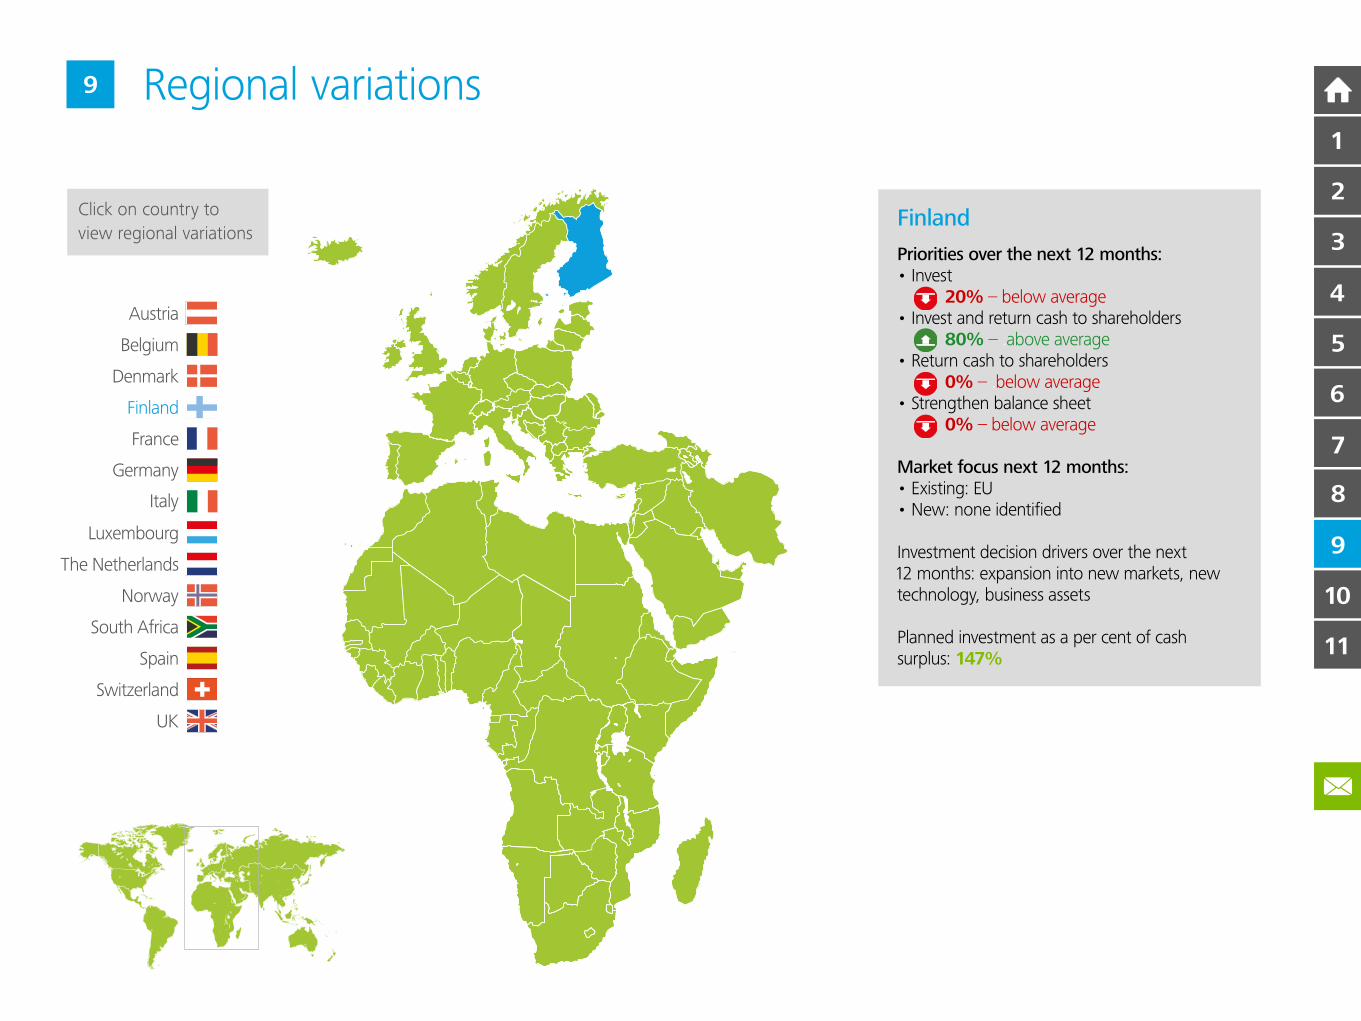
Regional variations
Finland
Priorities over the next 12 months:• Invest 20% – below average
• Invest and return cash to shareholders 80% – .above average
• Return cash to shareholders 0% – .below average
• Strengthen balance sheet 0% – below average
Market focus next 12 months:• Existing: EU • New: none identified
Investment decision drivers over the next .12 months: expansion into new markets, new technology, business assets
Planned investment as a per cent of cash surplus: 147%
Click on country to
view regional variations
9
7
6
5
4
2
3
1
10
11
9
8
South Africa
Finland
The Netherlands
Norway
Spain
Switzerland
Luxembourg
Italy
Germany
France
UK
Austria
Denmark
Belgium
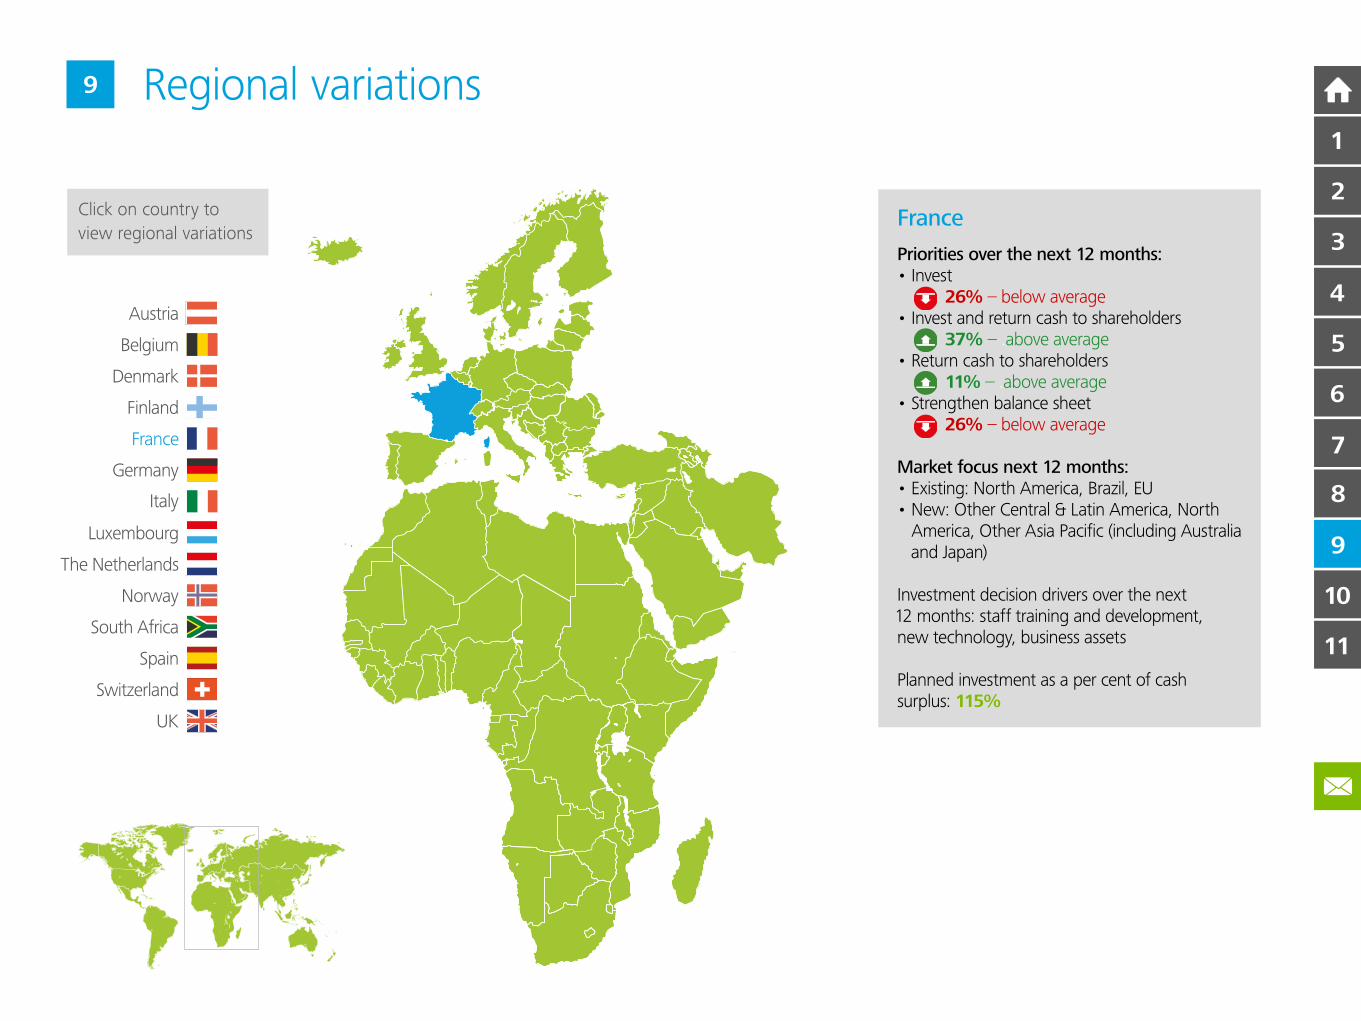
Regional variations
France
Priorities over the next 12 months:• Invest 26% – below average
• Invest and return cash to shareholders 37% – .above average
• Return cash to shareholders 11% – .above average
• Strengthen balance sheet 26% – below average
Market focus next 12 months:• Existing: North America, Brazil, EU • New: Other Central & Latin America, North .America, Other Asia Pacific (including Australia .and Japan)
Investment decision drivers over the next .12 months: staff training and development, new technology, business assets
Planned investment as a per cent of cash surplus: 115%
Click on country to
view regional variations
9
7
6
5
4
2
3
1
10
11
9
8
South Africa
Finland
The Netherlands
Norway
Spain
Switzerland
Luxembourg
Italy
Germany
France
UK
Austria
Denmark
Belgium
Regional variations
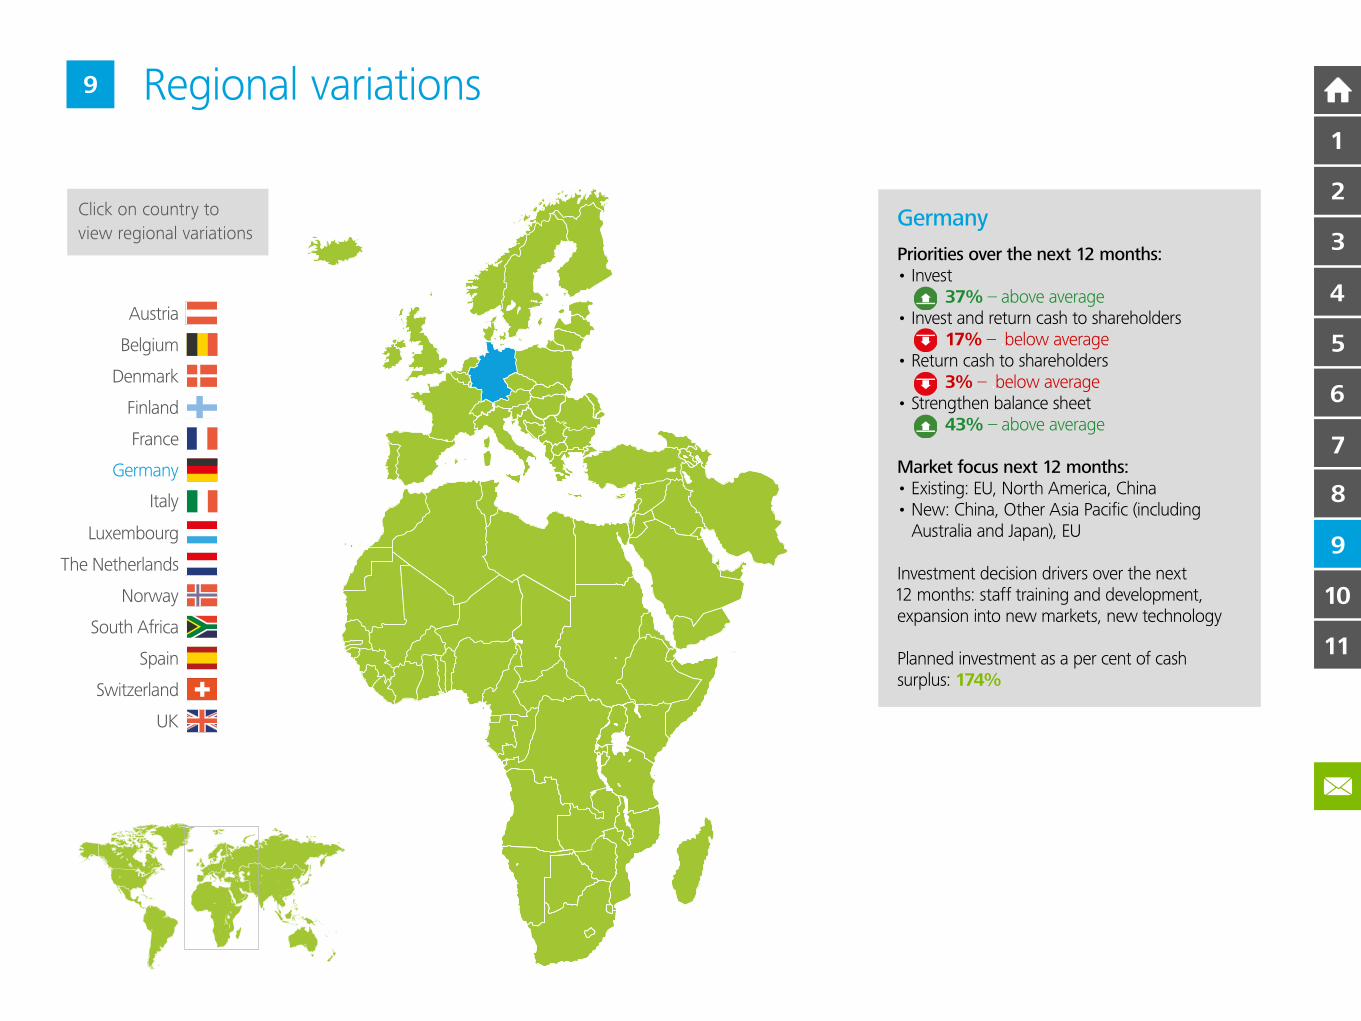
Germany
Priorities over the next 12 months:• Invest 37% – above average
• Invest and return cash to shareholders 17% – .below average
• Return cash to shareholders 3% – .below average
• Strengthen balance sheet 43% – above average
Market focus next 12 months:• Existing: EU, North America, China • New: China, Other Asia Pacific (including .Australia and Japan), EU
Investment decision drivers over the next .12 months: staff training and development, expansion into new markets, new technology
Planned investment as a per cent of cash surplus: 174%
Click on country to
view regional variations
9
7
6
5
4
2
3
1
10
11
9
8
South Africa
Finland
The Netherlands
Norway
Spain
Switzerland
Luxembourg
Italy
Germany
France
UK
Austria
Denmark
Belgium
Regional variations
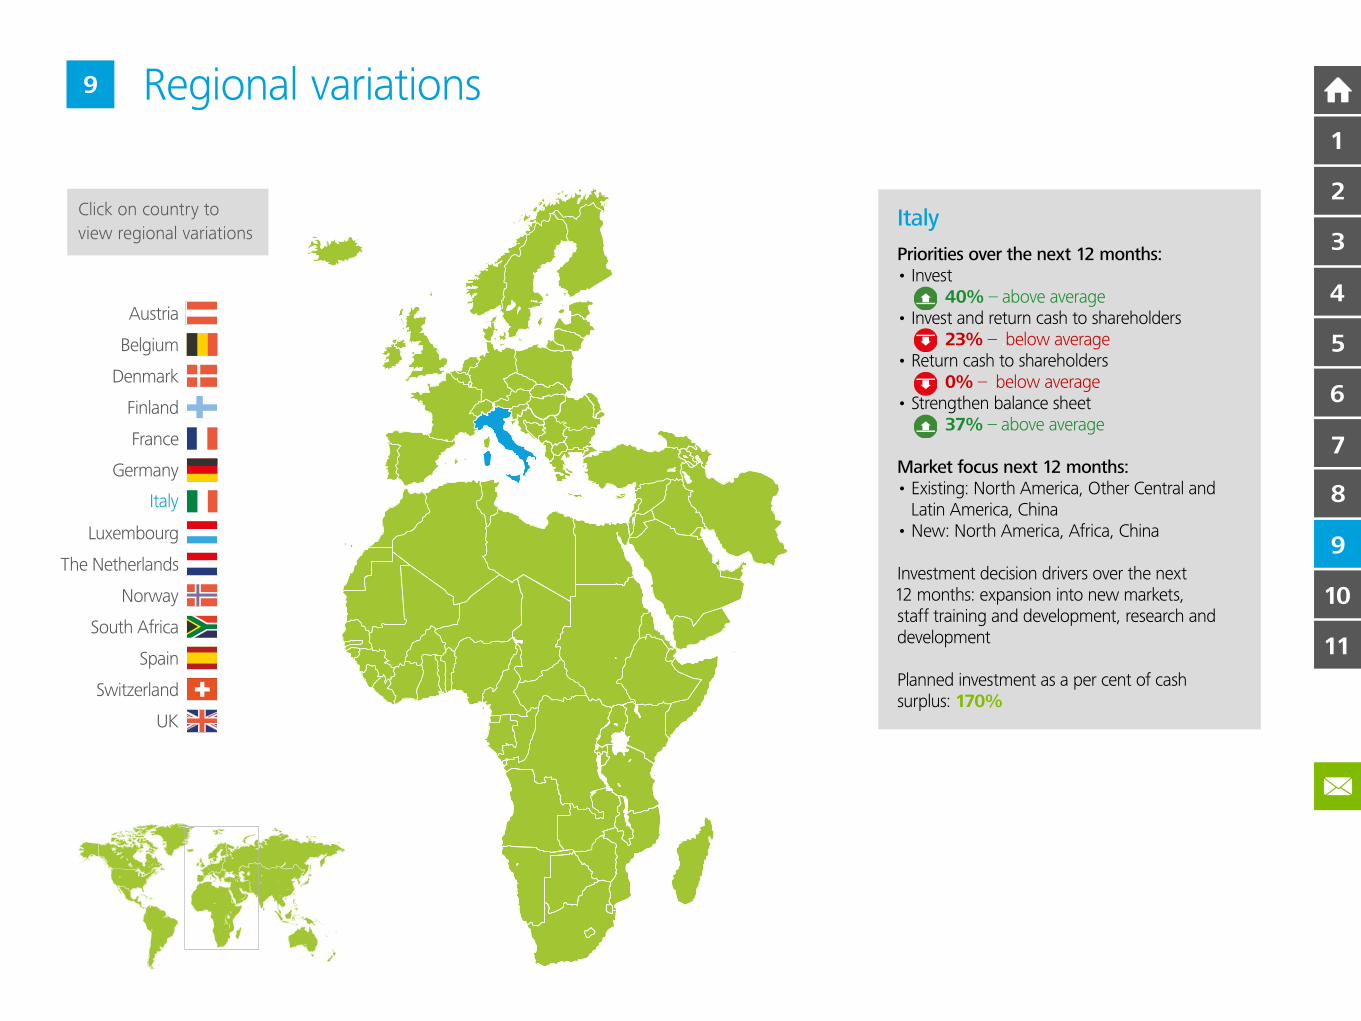
Italy
Priorities over the next 12 months:• Invest 40% – above average
• Invest and return cash to shareholders 23% – .below average
• Return cash to shareholders 0% – .below average
• Strengthen balance sheet 37% – above average
Market focus next 12 months:• Existing: North America, Other Central and .Latin America, China
• New: North America, Africa, China
Investment decision drivers over the next .12 months: expansion into new markets, staff training and development, research and development
Planned investment as a per cent of cash surplus: 170%
Click on country to
view regional variations
9
7
6
5
4
2
3
1
10
11
9
8
South Africa
Finland
The Netherlands
Norway
Spain
Switzerland
Luxembourg
Italy
Germany
France
UK
Austria
Denmark
Belgium
Regional variations
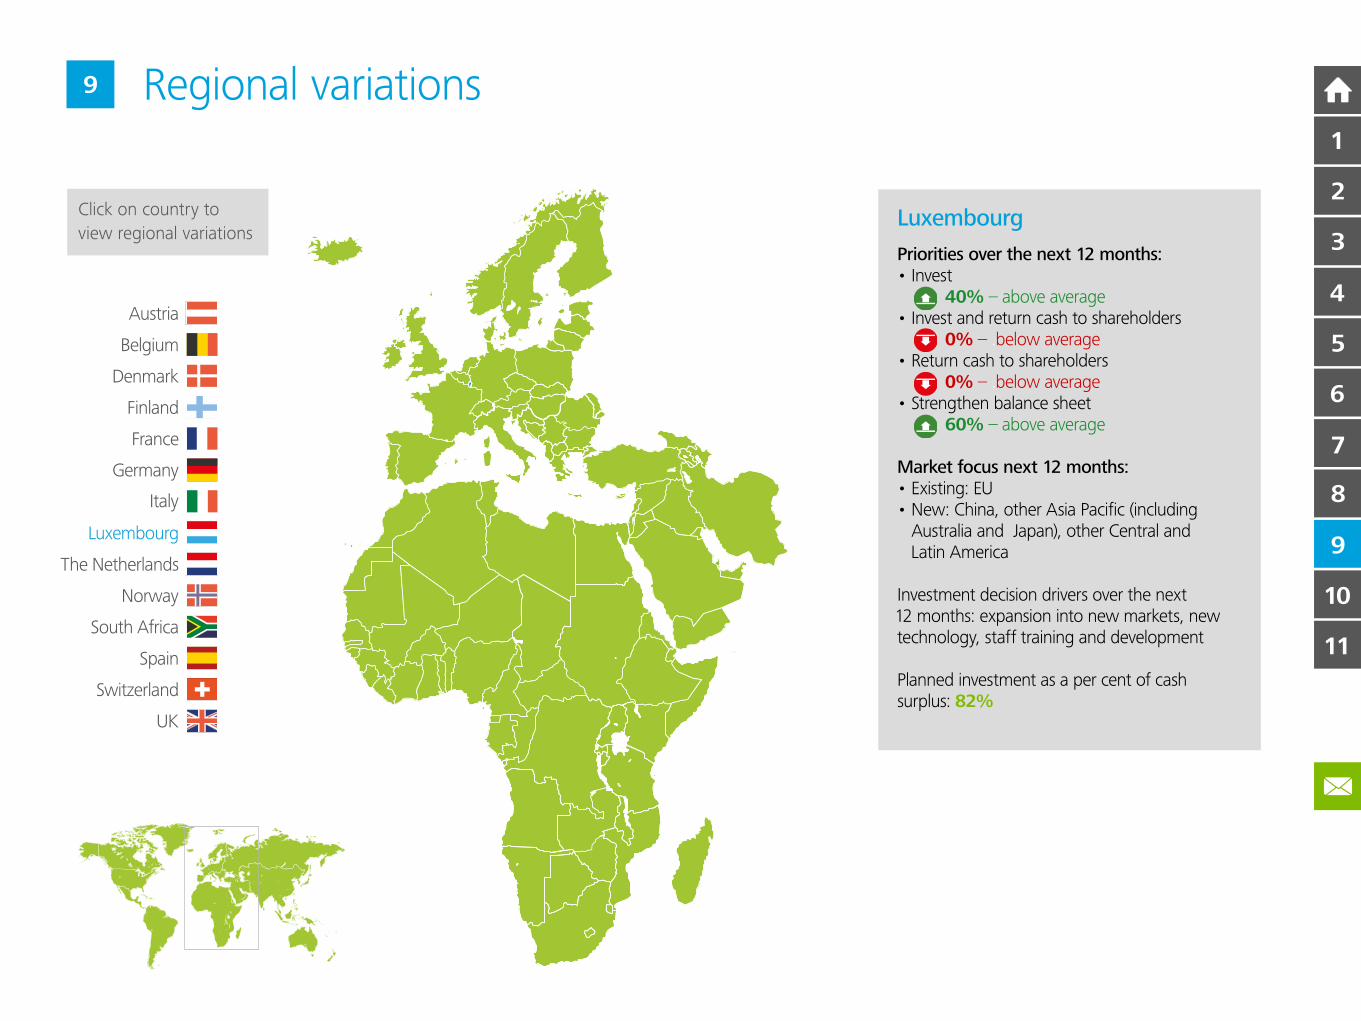
Luxembourg
Priorities over the next 12 months:• Invest 40% – above average
• Invest and return cash to shareholders 0% – .below average
• Return cash to shareholders 0% – .below average
• Strengthen balance sheet 60% – above average
Market focus next 12 months:• Existing: EU• New: China, other Asia Pacific (including .Australia and .Japan), other Central and .Latin America.
Investment decision drivers over the next .12 months: expansion into new markets, new technology, staff training and development
Planned investment as a per cent of cash surplus: 82%
Click on country to
view regional variations
9
7
6
5
4
2
3
1
10
11
9
8
South Africa
Finland
The Netherlands
Norway
Spain
Switzerland
Luxembourg
Italy
Germany
France
UK
Austria
Denmark
Belgium
Regional variations
Click on country to
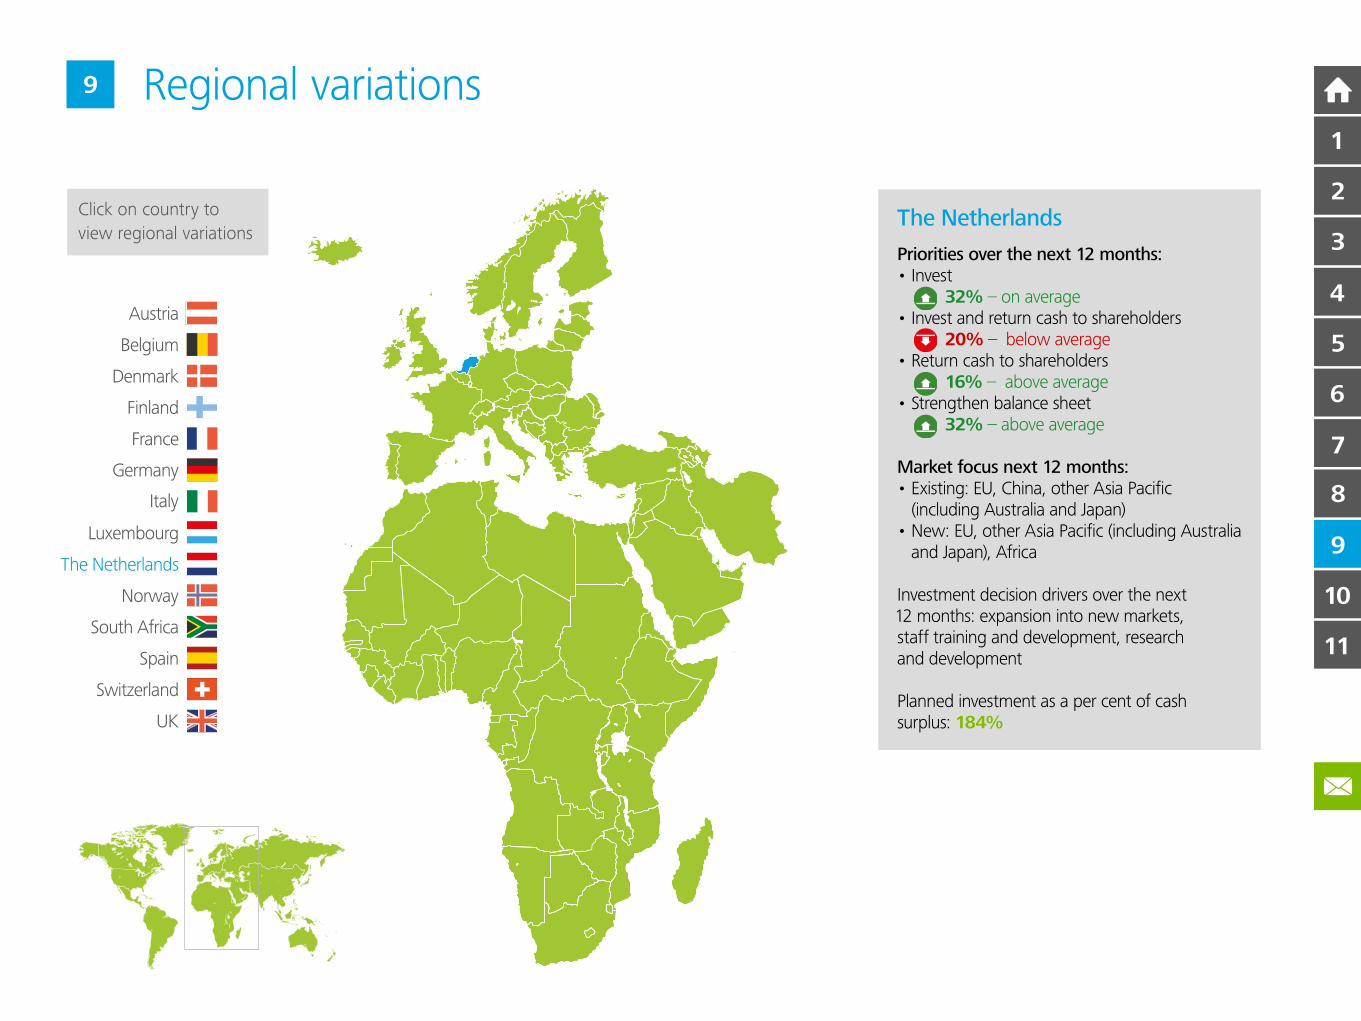
view regional variationsThe Netherlands
Priorities over the next 12 months:• Invest 32% – on average
• Invest and return cash to shareholders 20% – .below average
• Return cash to shareholders 16% – .above average
• Strengthen balance sheet 32% – above average
Market focus next 12 months:• Existing: EU, China, other Asia Pacific
(including Australia and Japan) • New: EU, other Asia Pacific (including Australia
and Japan), Africa
Investment decision drivers over the next .12 months: expansion into new markets, staff training and development, research and development
Planned investment as a per cent of cash surplus: 184%
9
7
6
5
4
2
3
1
10
11
9
8
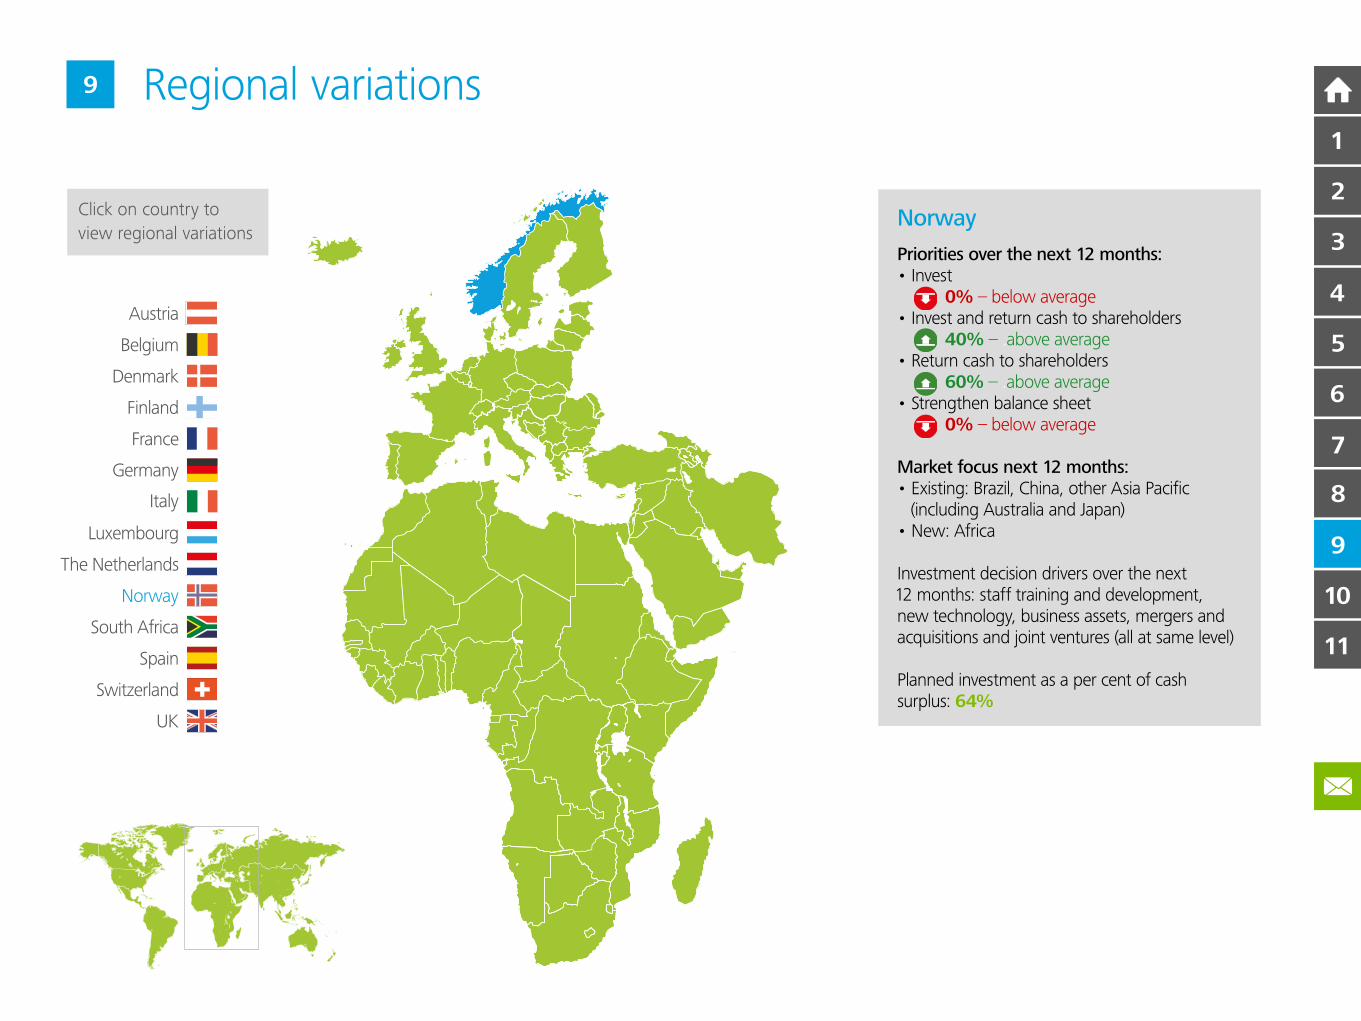
Norway
Priorities over the next 12 months:• Invest 0% – below average
• Invest and return cash to shareholders 40% – .above average
• Return cash to shareholders 60% – .above average
• Strengthen balance sheet 0% – below average
Market focus next 12 months:• Existing: Brazil, China, other Asia Pacific .(including Australia and Japan)
• New: Africa
Investment decision drivers over the next .12 months: staff training and development, new technology, business assets, mergers and acquisitions and joint ventures (all at same level)
Planned investment as a per cent of cash surplus: 64%
South Africa
Finland
The Netherlands
Norway
Spain
Switzerland
Luxembourg
Italy
Germany
France
UK
Austria
Denmark
Belgium
Regional variations
Click on country to
view regional variations
9
7
6
5
4
2
3
1
10
11
9
8
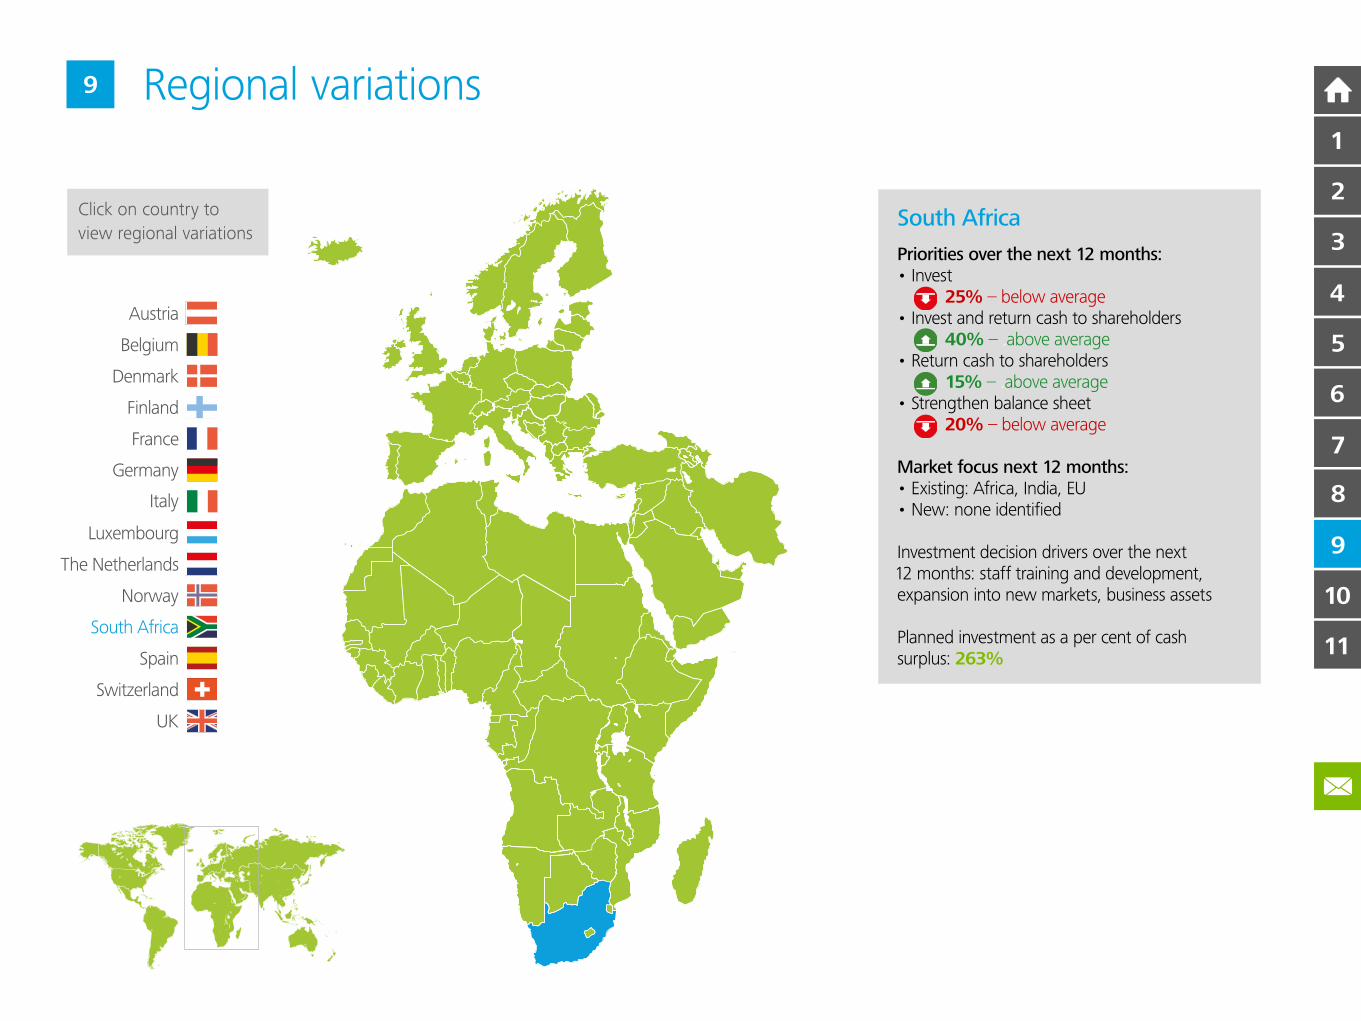
South Africa
Priorities over the next 12 months:• Invest 25% – below average
• Invest and return cash to shareholders 40% – .above average
• Return cash to shareholders 15% – .above average
• Strengthen balance sheet 20% – below average
Market focus next 12 months:• Existing: Africa, India, EU • New: none identified
Investment decision drivers over the next .12 months: staff training and development, expansion into new markets, business assets
Planned investment as a per cent of cash surplus: 263%
South Africa
Finland
The Netherlands
Norway
Spain
Switzerland
Luxembourg
Italy
Germany
France
UK
Austria
Denmark
Belgium
Regional variations
Click on country to
view regional variations
9
7
6
5
4
2
3
1
10
11
9
8
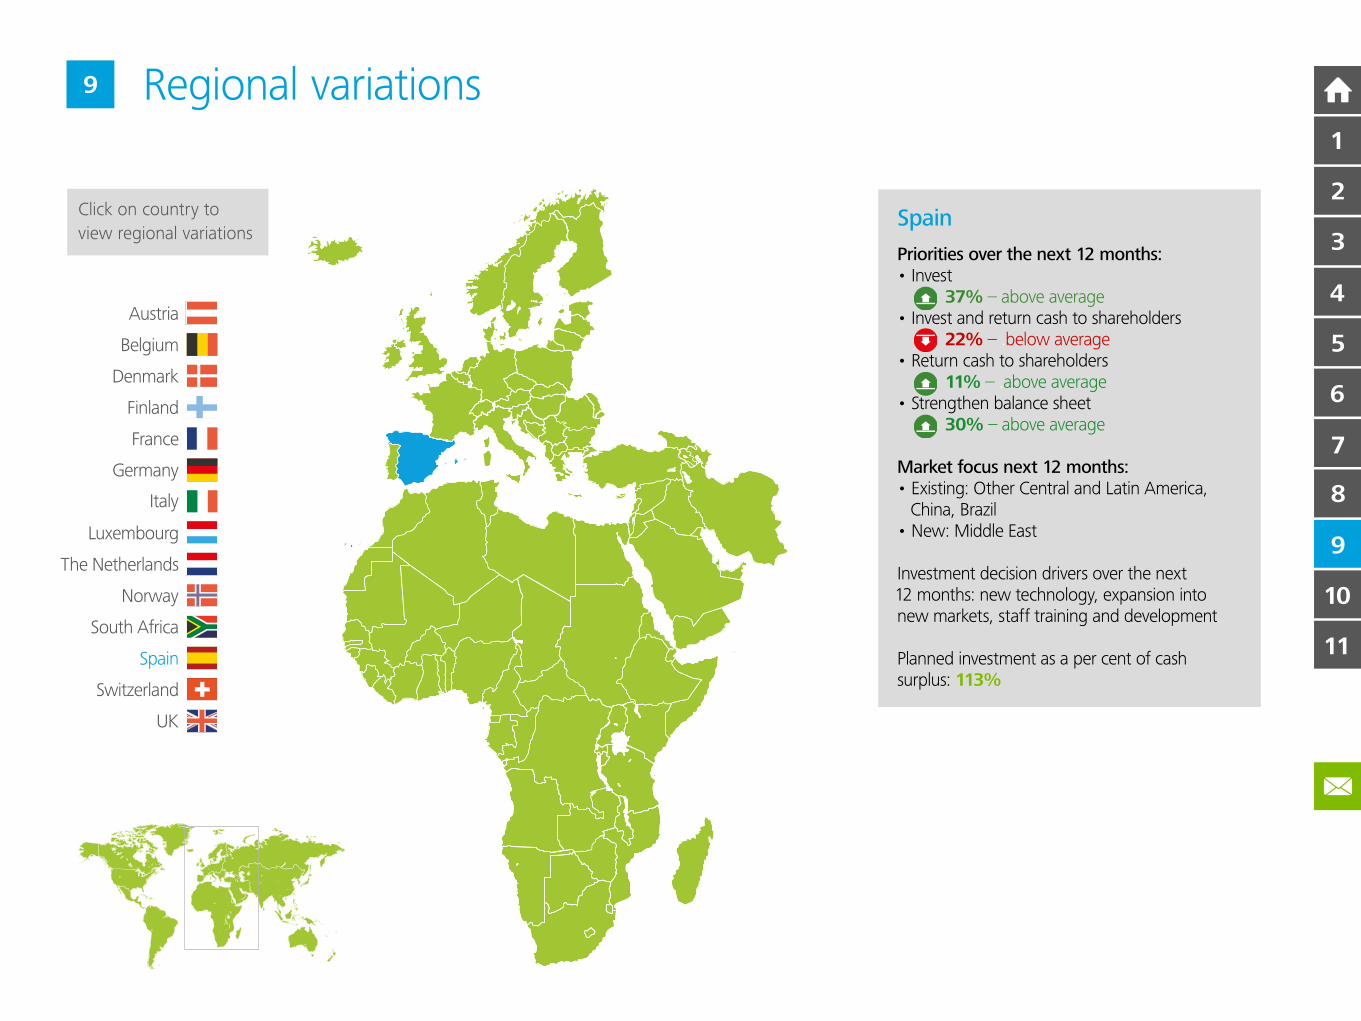
Spain
Priorities over the next 12 months:• Invest 37% – above average
• Invest and return cash to shareholders 22% – .below average
• Return cash to shareholders 11% – .above average
• Strengthen balance sheet 30% – above average
Market focus next 12 months:• Existing: Other Central and Latin America, .China, Brazil
• New: Middle East
Investment decision drivers over the next .12 months: new technology, expansion into new markets, staff training and development
Planned investment as a per cent of cash surplus: 113%
South Africa
Finland
The Netherlands
Norway
Spain
Switzerland
Luxembourg
Italy
Germany
France
UK
Austria
Denmark
Belgium
Regional variations
Click on country to
view regional variations
9
7
6
5
4
2
3
1
10
11
9
8

Switzerland
Priorities over the next 12 months:• Invest 56% – above average
• Invest and return cash to shareholders 22% – .below average
• Return cash to shareholders 0% – .below average
• Strengthen balance sheet 22% – below average
Market focus next 12 months:• Existing: EU, North American, China • New: Other Asia Pacific (including Australia
and Japan), EU
Investment decision drivers over the next .12 months: expansion into new markets, staff training and development, new technology
Planned investment as a per cent of cash surplus: 53%
South Africa
Finland
The Netherlands
Norway
Spain
Switzerland
Luxembourg
Italy
Germany
France
UK
Austria
Denmark
Belgium
Regional variations
Click on country to
view regional variations
9
7
6
5
4
2
3
1
10
11
9
8
South Africa
Finland
The Netherlands
Norway
Spain
Switzerland
Luxembourg
Italy
Germany
France
UK
Austria
Denmark
Belgium
Regional variations
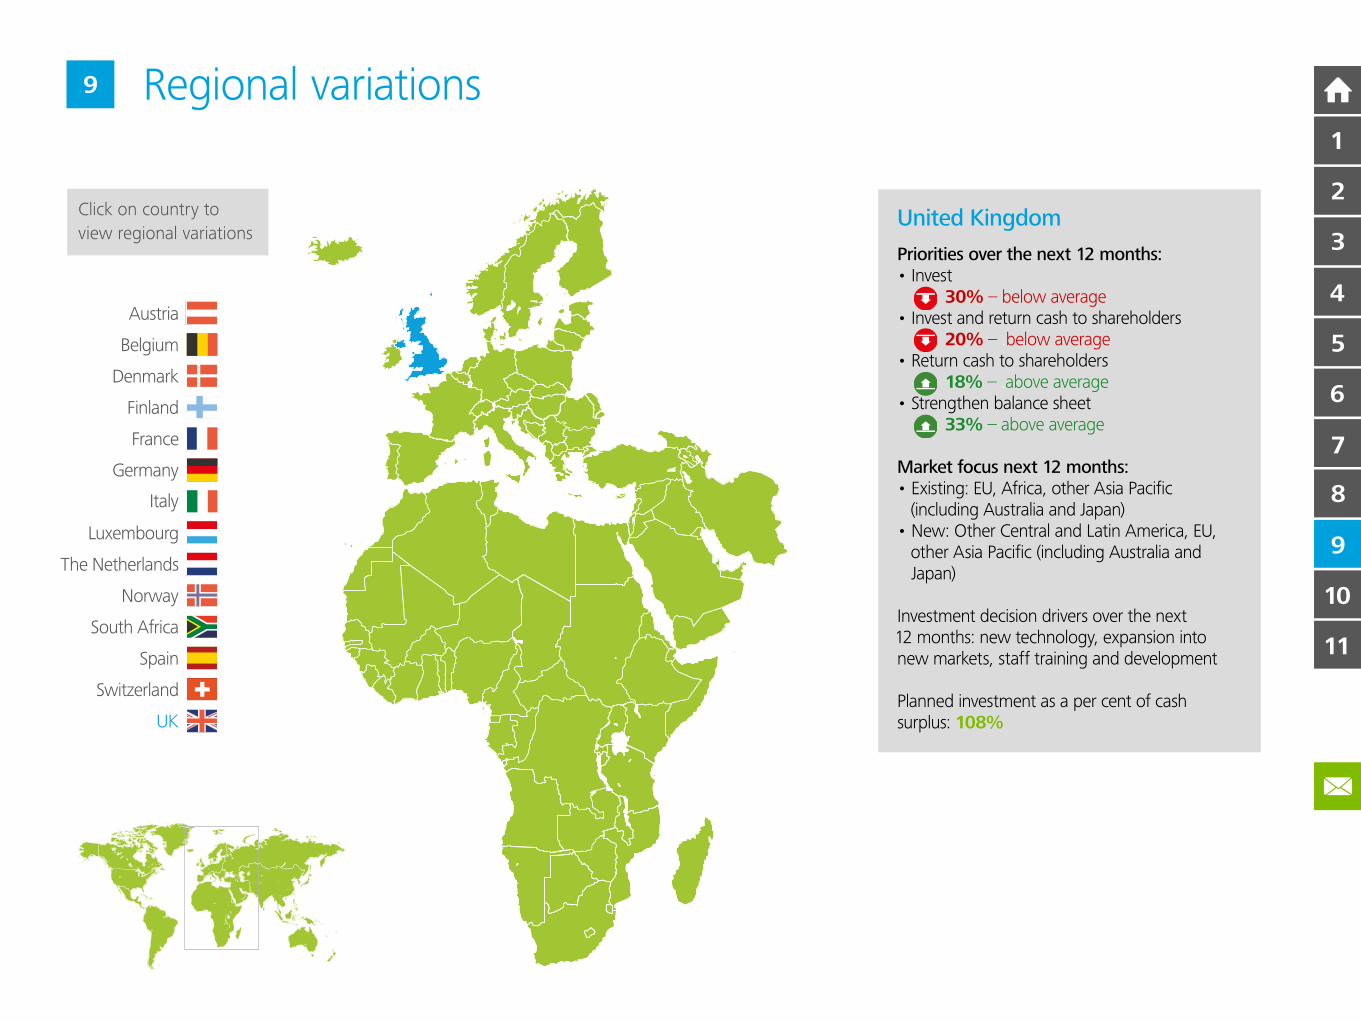
United Kingdom
Priorities over the next 12 months:• Invest 30% – below average
• Invest and return cash to shareholders 20% – .below average
• Return cash to shareholders 18% – .above average
• Strengthen balance sheet 33% – above average
Market focus next 12 months:• Existing: EU, Africa, other Asia Pacific .(including Australia and Japan)
• New: Other Central and Latin America, EU, .other Asia Pacific (including Australia and .Japan)
Investment decision drivers over the next .12 months: new technology, expansion into new markets, staff training and development
Planned investment as a per cent of cash surplus: 108%
Click on country to
view regional variations
9
7
6
5
4
2
3
1
10
11
9
8
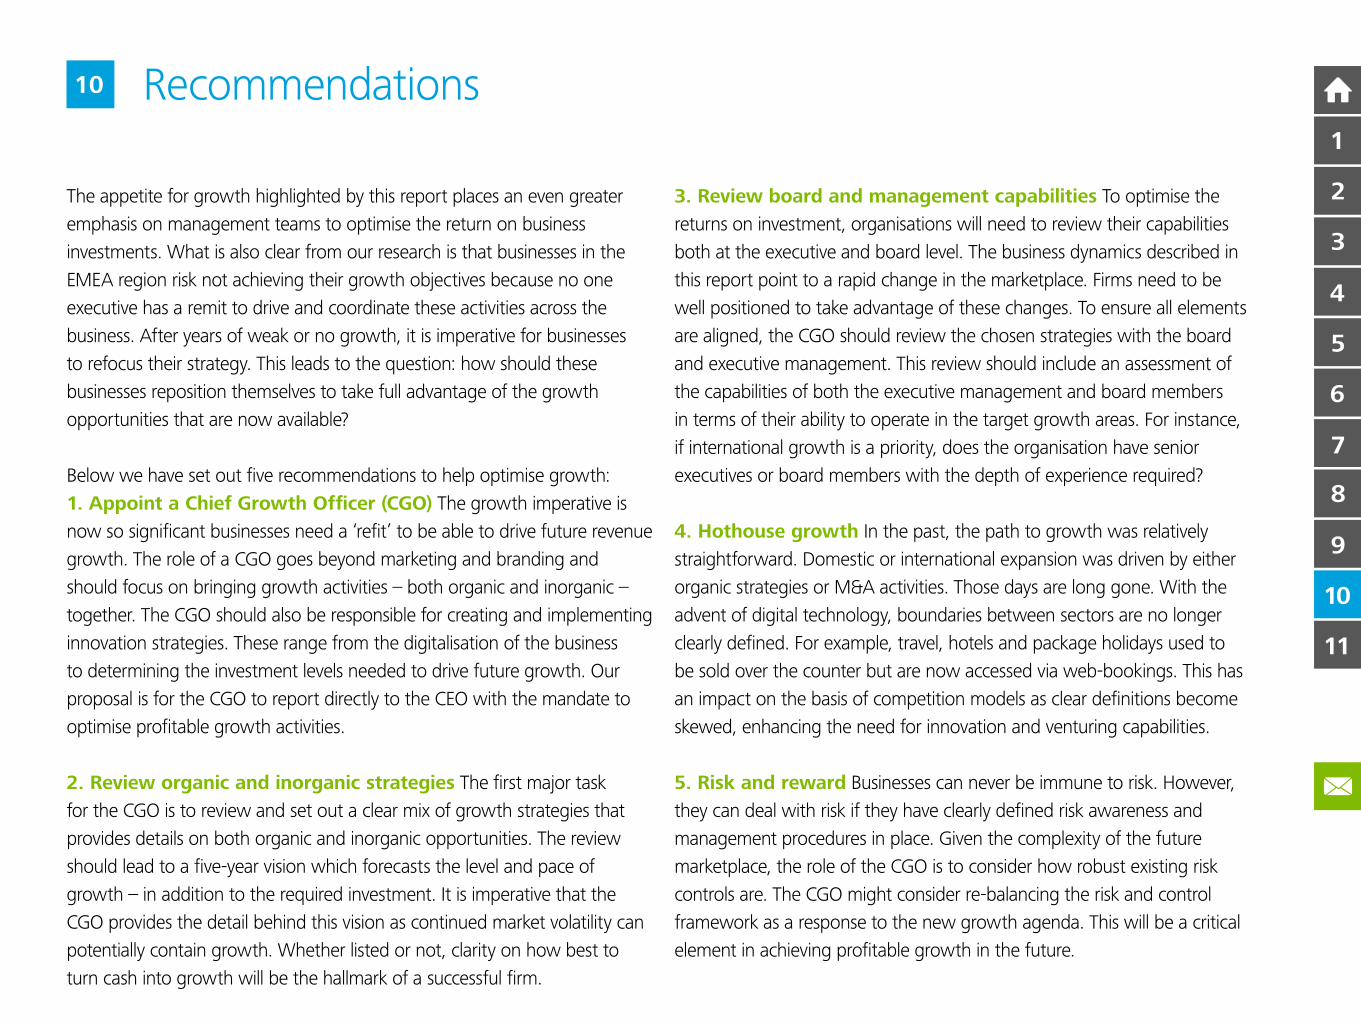
3The appetite for growth highlighted by this report places an even greater
emphasis on management teams to optimise the return on business
investments. What is also clear from our research is that businesses in the
EMEA region risk not achieving their growth objectives because no one
executive has a remit to drive and coordinate these activities across the
business. After years of weak or no growth, it is imperative for businesses
to refocus their strategy. This leads to the question: how should these
businesses reposition themselves to take full advantage of the growth
opportunities that are now available?
Below we have set out five recommendations to help optimise growth:
1. Appoint a Chief Growth Officer (CGO) The growth imperative is
now so significant businesses need a ‘refit’ to be able to drive future revenue
growth. The role of a CGO goes beyond marketing and branding and
should focus on bringing growth activities – both organic and inorganic –
together. The CGO should also be responsible for creating and implementing
innovation strategies. These range from the digitalisation of the business
to determining the investment levels needed to drive future growth. Our
proposal is for the CGO to report directly to the CEO with the mandate to
optimise profitable growth activities.
2. Review organic and inorganic strategies The first major task
for the CGO is to review and set out a clear mix of growth strategies that
provides details on both organic and inorganic opportunities. The review
should lead to a five-year vision which forecasts the level and pace of
growth – in addition to the required investment. It is imperative that the
CGO provides the detail behind this vision as continued market volatility can
potentially contain growth. Whether listed or not, clarity on how best to
turn cash into growth will be the hallmark of a successful firm.
3. Review board and management capabilities To optimise the
returns on investment, organisations will need to review their capabilities
both at the executive and board level. The business dynamics described in
this report point to a rapid change in the marketplace. Firms need to be
well positioned to take advantage of these changes. To ensure all elements
are aligned, the CGO should review the chosen strategies with the board
and executive management. This review should include an assessment of
the capabilities of both the executive management and board members
in terms of their ability to operate in the target growth areas. For instance,
if international growth is a priority, does the organisation have senior
executives or board members with the depth of experience required?
4. Hothouse growth In the past, the path to growth was relatively
straightforward. Domestic or international expansion was driven by either
organic strategies or M&A activities. Those days are long gone. With the
advent of digital technology, boundaries between sectors are no longer
clearly defined. For example, travel, hotels and package holidays used to
be sold over the counter but are now accessed via web-bookings. This has
an impact on the basis of competition models as clear definitions become
skewed, enhancing the need for innovation and venturing capabilities.
5. Risk and reward Businesses can never be immune to risk. However,
they can deal with risk if they have clearly defined risk awareness and
management procedures in place. Given the complexity of the future
marketplace, the role of the CGO is to consider how robust existing risk
controls are. The CGO might consider re-balancing the risk and control
framework as a response to the new growth agenda. This will be a critical
element in achieving profitable growth in the future.
10 Recommendations
7
6
5
4
2
3
1
10
11
9
8
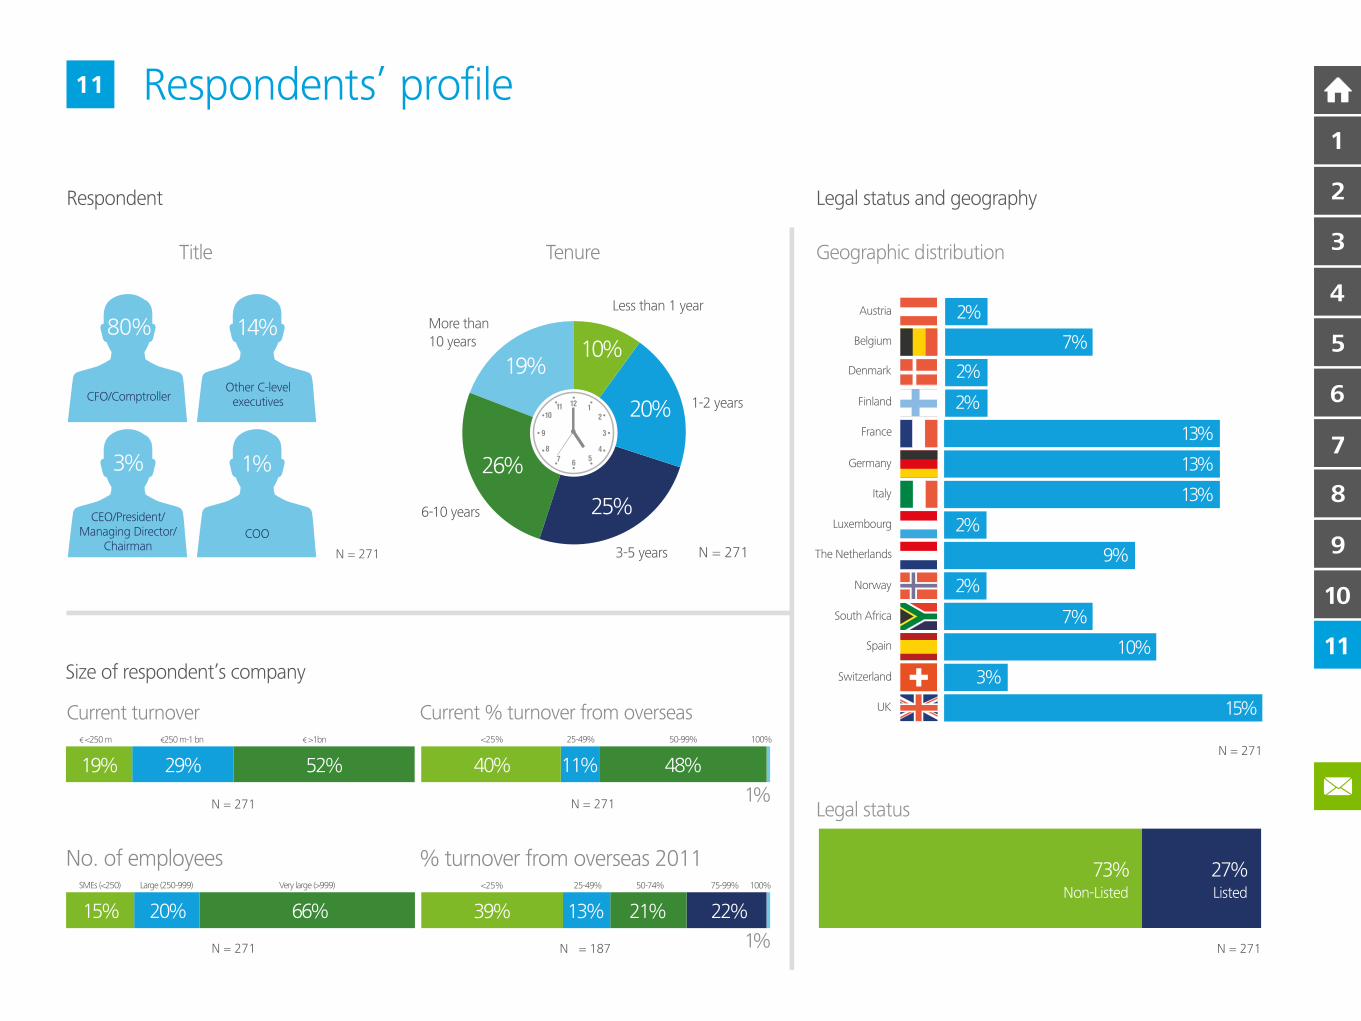
Respondents’ profile
Respondent
Size of respondent’s company
Legal status and geography
Legal status
Geographic distribution
Current turnover€ <250 m €250 m-1 bn € >1bn
19% 29% 52%
N = 271
No. of employees SMEs (<250) Large (250-999) Very large (>999)
15% 20% 66%
N = 271 N = 271
N = 271
Tenure
Less than 1 yearMore than
10 years
6-10 years
3-5 years
1-2 years
N = 271
10%
20%
25%
26%
19%
% turnover from overseas 2011<25% 25-49% 50-74% 75-99% 100%
39% 13% 21% 22%
N = 187 1%
7%South Africa
2%Finland
9%The Netherlands
Norway
10%Spain
3%Switzerland
Luxembourg
13%Italy
13%Germany
13%France
15%UK
2%Austria
2%Denmark
7%Belgium
Current % turnover from overseas
40% 11% 48%
N = 2711%
<25% 25-49% 50-99% 100%
Title
N = 271
3%
CEO/President/Managing Director/
Chairman
1%
COO
14%
Other C-levelexecutives
80%
CFO/Comptroller
2%
2%
Listed
27%73%Non-Listed
11
7
6
5
4
2
3
1
10
11
9
8
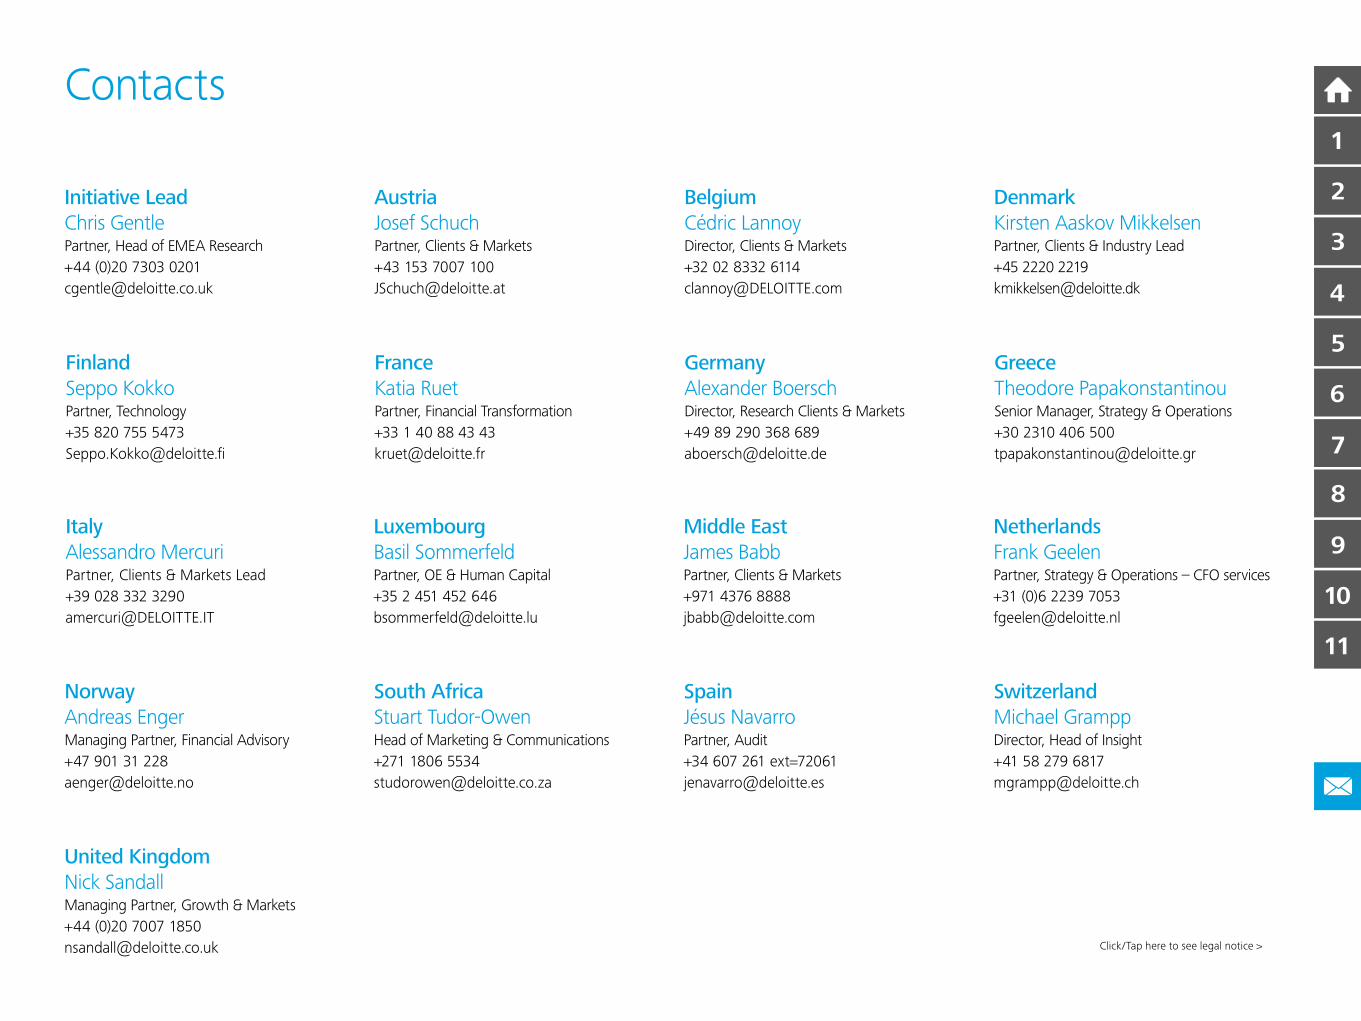
Contacts
Click/Tap here to see legal notice >
Initiative Lead
Chris GentlePartner, Head of EMEA Research
+44 (0)20 7303 0201
Austria
Josef SchuchPartner, Clients & Markets
+43 153 7007 100
Germany
Alexander BoerschDirector, Research Clients & Markets
+49 89 290 368 689
Middle East
James BabbPartner, Clients & Markets
+971 4376 8888
Spain
Jésus NavarroPartner, Audit
+34 607 261 ext=72061
France
Katia RuetPartner, Financial Transformation
+33 1 40 88 43 43
Luxembourg
Basil SommerfeldPartner, OE & Human Capital
+35 2 451 452 646
South Africa
Stuart Tudor-OwenHead of Marketing & Communications
+271 1806 5534
Belgium
Cédric LannoyDirector, Clients & Markets
+32 02 8332 6114
Finland
Seppo KokkoPartner, Technology
+35 820 755 5473
Greece
Theodore PapakonstantinouSenior Manager, Strategy & Operations
+30 2310 406 500
Netherlands
Frank Geelen Partner, Strategy & Operations – CFO services
+31 (0)6 2239 7053
Switzerland
Michael GramppDirector, Head of Insight
+41 58 279 6817
Italy
Alessandro MercuriPartner, Clients & Markets Lead
+39 028 332 3290
Norway
Andreas EngerManaging Partner, Financial Advisory
+47 901 31 228
United Kingdom
Nick SandallManaging Partner, Growth & Markets
+44 (0)20 7007 1850
Denmark
Kirsten Aaskov MikkelsenPartner, Clients & Industry Lead
+45 2220 2219
7
6
5
4
2
3
1
10
11
9
8

Deloitte refers to one or more of Deloitte Touche Tohmatsu Limited, a UK private company limited by guarantee (“DTTL”), its network of member
firms, and their related entities. DTTL and each of its member firms are legally separate and independent entities. DTTL (also referred to as “Deloitte
Global”) does not provide services to clients. Please see www.deloitte.com/about for a more detailed description of DTTL and its member firms.
Deloitte provides audit, tax, consulting, and financial advisory services to public and private clients spanning multiple industries. With a globally
connected network of member firms in more than 150 countries and territories, Deloitte brings world-class capabilities and high-quality service
to clients, delivering the insights they need to address their most complex business challenges. Deloitte’s more than 200,000 professionals are
committed to becoming the standard of excellence.
This communication contains general information only, and none of Deloitte Touche Tohmatsu Limited, its member firms, or their related entities
(collectively, the “Deloitte network”) is, by means of this communication, rendering professional advice or services. No entity in the Deloitte network
shall be responsible for any loss whatsoever sustained by any person who relies on this communication.
© 2014. For information, contact Deloitte Touche Tohmatsu Limited.
Designed and produced by The Creative Studio at Deloitte, London. 35874A
7
6
5
4
2
3
1
10
11
9
8