Embed Size (px)
Citation preview

Cash Conver te r s In te r na t iona l L imi ted
A N N U A L R E P O R T2 0 0 9

C o r p o r a t e D i r e c t o r y
DIRECTORS
Reginald Webb Chairman
Peter Cumins Managing Director
John Yeudall Non-Executive Director
Paul Cowan Non-Executive Director
COMPANY SECRETARY
Ralph Groom
REGISTERED OFFICE
Level 18, Citibank House
37 St George’s Terrace
PERTH Western Australia 6000
WEBSITE
www.cashconverters.com
ABN
39 069 141 546
SHARE REGISTRARS
In Australia:
Computershare Investor Services Pty Limited
Level 2, Reserve Bank Building
45 St George’s Terrace
PERTH Western Australia 6000
In United Kingdom:
Computershare Investor Services PLC
PO Box 82
The Pavilions
Bridgewater Road
BRISTOL BS 99 7NH
AUDITORS
Deloitte Touche Tohmatsu
Level 14, Woodside Plaza
240 St George’s Terrace
PERTH Western Australia 6000
SOLICITORS
Cooke & Co
38 Kookaburra Street
STIRLING Western Australia 6021
BANKERS
In Australia:
Westpac Business Bank
109 St George’s Terrace
PERTH Western Australia 6000
In United Kingdom:
Barclays Bank PLC
Corporate Banking Centre
32 Clarendon Road
WATFORD Hertfordshire
United Kingdom
TRUSTEE FOR UNSECUREDNOTE HOLDERS
Perpetual Trustee Consolidated Limited
Level 11, Angel Place
123 Pitt Street
SYDNEY New South Wales 2000
STOCK EXCHANGE
In Australia:
Australian Stock Exchange
Exchange Plaza, 2 The Esplanade
PERTH Western Australia 6000
In United Kingdom:
London Stock Exchange Limited
LONDON United Kingdom
EC2N 1HP

1
CASH
CONVERTERSINTERNATIONALLIMITED
ANNUALREPORT
2009
Chairman and Managing Director’s Review 2
Review of the Year 8
Acquisitions 10
History 11
Group Structure 12
Corporate Objectives 13
Core Business 13
Directors’ Profiles 14
Financial Statements Contents 15
Directors’ Report 16
Corporate Governance 25
Income Statement 28
Balance Sheet 29
Statement of Recognised Income and Expense 30
Cash Flow Statement 31
Notes to the Financial Statements 32
Directors’ Declaration 73
Independent Audit Report to the Members 74
Independence Declaration 76
Shareholder Information 77

C h a i r m a n a n d M a n a g i n g D i r e c t o r ’ s R e v i e w
2
It gives us great pleasure to
present the Annual Report
and the group accounts for
the financial year ending
June 2009.
The directors of Cash
Converters International
Limited (‘Cash Converters’)
are pleased to report a record
profit result of $16.2 million
for the 2009 financial year.
The table below provides a summary of the financial performance.
FINANCIAL RESULTS SUMMARY
30 June 2009 30 June 2008 Variance$ $ %
Revenue 94,397,900 74,405,882 +26.9
EBITDA 25,604,525 23,443,909 +9.2
Depreciation and amortisation 1,162,068 882,312 +31.7
EBIT 24,442,457 22,561,597 +7.4
Income tax 7,152,524 6,423,983 +11.3
Borrowing costs 1,135,225 963,028 +17.9
Net profit before minority interests 16,154,708 15,174,586 +6.5
Less minority interests (10,153) 31,183 +132.6
Net profit after minority interests 16,164,861 15,143,403 +6.7
Basic earnings per share 6.77 6.28 +7.8
Divisional operating profit
Store operations 7,234,263 4,348,261 +66.4
Finance operations 16,122,541 17,299,880 -6.8
Total divisional operating profit* 23,356,804 21,648,141 +7.9
*see segment note

3
� The 2009 financial year has been the most successful in the Company’s history,
with a record net profit of $16.2 million, up 6.5% on the previous year.
� Revenue growth of 26.9% to $94.4 million. The major drivers for revenue growth
over the year included an increase in personal loan interest and establishment fees
of $3.6 million, an increase in corporate store revenue of $16.5 million and an
increase in financial services commission of $578,896.
� The UK has continued its improved performance over recent years and contributed
an EBIT of $2.7 million, up 174.6% on the previous year. Store numbers (company
owned and franchised) grew by 6 to 136.
� The Australian business continued to be a solid contributor with EBIT from
franchising operations of $2.5 million (incorporating the absorption of 75% of all
head office costs). The total EBIT from Australian franchising and store operations
was $5.6 million. Store numbers (company owned and franchised) grew by 2 to
136.
� The Company owned store strategy has gained momentum with the acquisition
this year of 15 franchised stores, seven in the UK and eight in Australia, taking total
corporate store numbers to 37.
� The corporate store network has seen revenues grow by 96.6% to $33.6 million
producing a combined EBIT of $4.4 million (up 187% on 2008FY) for the UK and
Australian owned stores, with only a part year contribution from the 15 staggered
store acquisitions.
� Safrock loan book growth of 55.1% to $21.4 million. The Safrock personal loans
business and the MON-E cash advance administration platform generated an EBIT
of $16.1 million (2008 $17.3 million) which is down 6.8% on the previous year. This
reduction was the result of the Company renegotiating the terms of its franchise
agreement with franchisees and granting franchisees a reduction in the process
charges levied by MON-E. The reduced fee arrangement had a negative impact on
MON-E in 2009 of approximately $2 million.
CASH
CONVERTERSINTERNATIONALLIMITED
ANNUALREPORT
2009
HIGHLIGHTS

C h a i r m a n a n d M a n a g i n g D i r e c t o r ’ s R e v i e w
4
SOME KEY FINANCE DIVISION STATISTICSFOR THE TWELVE MONTHS ENDING 30 JUNE 2009:
CASH ADVANCE
� Total principal loaned decreased slightly, by 0.2% to $124,546,527
� Average loan amount increased slightly from $286 to $303
� Total customer numbers increased by 11.9% to 231,262
PERSONAL LOANS
� Total number of loans approved increased by 40.8% to 28,937
� Total number of customers increased by 44.7% to 19,211
� Loan Book increased by 55.1% to $21,427,110
ONLINE
Although this initiative has not yet made a meaningful financial contribution to the Group result, Cash Converters online presence
allows us to present the business to a new audience of potential customers at a low delivery cost.
We have seen new customers visit stores and purchase product after their first contact with the brand commenced with their online
search. We are also beginning to see commercial quantities of product sales.
For the first time the combined sales from the two sites exceeded $1 million for the year. Total sales $1,295,892. The Company
receives a commission based on an agreed percentage of sales for providing the ‘webshop’ online service to its franchisees.

SOME KEY ONLINE STATISTICS:
UK Australia
Registered users 69,949 12,396
Unique visitors 1,165,000 865,000
Total page views 21,035,000 10,385,000
As we can see from these statistics we now have a significant number of visitors to our UK and Australian webshop sites. Our strategy
will be to maximise the commercial opportunities that these new customers present.
Online lending is one such opportunity and a lead generation marketing pilot was conducted for three weeks during June with very
positive results as shown below. This online lead generation will become a key component of our 2010 marketing campaign.
KEY METRICS FROM LEAD GENERATION PILOT
Number of leads 2,442
Number of loans 326
Number new customers 225
% new customers 69%
5
CASH
CONVERTERSINTERNATIONALLIMITED
ANNUALREPORT
2009

C h a i r m a n a n d M a n a g i n g D i r e c t o r ’ s R e v i e w
6
SUBSEQUENT EVENT
STRATEGIC INVESTOR INTRODUCED TO FUND SIGNIFICANT GROWTH OPPORTUNITIES
In August the Company entered into a Subscription Agreement with EZCORP, Inc. to make a placement of 108,218,000 fully paid
ordinary units at an issue price of A$0.50 per unit to raise approximately $54 million. This will represent 30% of the fully diluted capital
of the Company after the placement has been made.
EZCORP will have two directors in the event the placement is approved by shareholders.
The funds will be utilised to grow the earnings of the Company through accelerating the acquisition of franchised stores and to
increase the size of the Safrock loan books.
Full details of the transaction including an independent experts report will be sent to shareholders with the appropriate notice for a
general meeting.
ABOUT EZCORP
EZCORP, a U.S. company with its corporate headquarters in Austin, Texas. EZCORP’s Class A Non-Voting Common Stock is listed
on the Nasdaq Stock Market with a market capitalisation of US$559 million.
At June 30, 2009, EZCORP operated a total of 897 company owned stores in the USA and Mexico, consisting of 370 U.S.
pawnshops, 47 pawnshops in Mexico and 480 U.S. signature loan stores.
For over 10 years, EZCORP has also had a substantial investment in Albermarle & Bond Holdings PLC, which is one of the largest
pawnbrokers in the United Kingdom with shares listed on AIM, the secondary market operated by the London Stock Exchange.
DIVIDEND
The directors have declared a fully franked final dividend of 1.5 cents per share. The dividend will be paid on 30 September 2009 to
those shareholders on the register at the close of business on 16 September 2009. This will take the total dividend payment for the
year to 3.0 cents per share, fully franked. This represents a payout ratio of approximately 45%.

7
CASH
CONVERTERSINTERNATIONALLIMITED
ANNUALREPORT
2009
GUIDANCE FOR THE 2010 FINANCIAL YEAR
The Company expects earnings growth in 2010 from the full year impact of store acquisitions in 2009 and the impact from the
significant growth in the Safrock loan book in the last quarter of this financial year.
In the absence of new capital from the proposed EZCORP transaction, the expected NPAT for 2010 is in the range of $18.0 to $18.5
million. With the deployment of the additional capital, should the EZCORP transaction proceed, earnings are expected to exceed this
guidance.
OUTLOOK
The announcement in August of the introduction (subject to shareholder approval and due diligence) of EzCorp as a strategic
shareholder representing a fully diluted interest of 30% of the Company will result in a cash injection of approximately $54 million.
Following the completion of this transaction, Cash Converters will be very well positioned to fast track the execution of its stated
strategy of opening new company stores in the UK and Australia, as well as further acquisitions of franchised stores in 2010. The
Company sees the acquisition of franchised stores and increasing the funding capacity of the cash advance and personal loan
products as a real opportunity to transform the group into a significant store operating entity.
The year has been a busy and challenging one with the successful acquisition and integration of 15 franchised stores into our
corporate store division. During one of the worst global economic downturns, Cash Converters has reported a record profit result.
With the growth opportunities we have identified, we are optimistic that further growth will be achieved in the 2010 financial year. The
staff, management and franchisees are to be congratulated for their contributions to the strong financial result this year.
Reg Webb Peter Cumins
Chairman Managing Director
Perth, Western Australia
Date 22 September 2009

8
� Earnings before interest, tax, depreciation
and amortisation up 9.2% to $25,604,525
(2008: $23,443,909)
� Net profit attributable to members
up 6.7% to $16,164,861
(2008: $15,143,403)
� Store operations, operating profit
up 66.4% to $7,234,263
(2008: $4,348,261)
� Finance operations, operating profit
down 6.8% to $16,122,541
(2008: $17,299,880)
� Fully franked dividend for the year 3.0 cents
� Corporate store network in the UK expands
to 21 stores following the acquisition of one
store in Barnsley on 10 August 2009
� Corporate store network in Australia
currently stands at 17 stores
� In August 2009 the Company enters into a
Subscription Agreement with Ezcorp Inc. to
make a placement of 108,218,000 fully paid
ordinary units at an issue price of A$0.50 per
unit to raise approximately $54 million
R e v i e w o f t h e Ye a r

9
CASH
CONVERTERSINTERNATIONALLIMITED
ANNUALREPORT
2009
OPERATING PROFITBefore tax, depreciation,amortisation & interest
FINANCIALSERVICESOperating profit before tax
WEEKLYFRANCHISE FEES
INITIALFRANCHISE FEES

10
UK CORPORATE STORES
On the 22 September 2008 Cash Converters (UK) Limited (CCUK) acquired three existing stores from a franchisee in Liverpool in the
north west of England. The total consideration paid for these stores was £1.3 million ($2.8 million) including assets.
A further two stores were acquired on 1 December, Hull & Scarborough, in the north east of England. CCUK acquired the Doncaster
store, again in the north of England and the Eccles store in the Manchester area, both from existing franchisees on the 27 April and
27 May respectively. The total consideration paid for these four stores was £0.5 million ($1.0 million) including assets.
On 10 August 2009 CCUK acquired the Barnsley store from an existing franchisee, again in the north of England. The total
consideration paid for this store was £0.7 million ($1.4 million) including assets.
All these stores are trading successfully and have continued to add to the overall contribution the corporate store network is making
to the UK business.
The addition of these stores to the existing corporate store network brings the total number of owned stores to 21. This expansion
of the owned store group will continue to create efficiencies and economies of scale, therefore adding to the overall profitability of the
corporate chain in the UK.
Negotiations are currently underway to acquire more existing franchise stores in the UK, primarily around the north of England.
AUSTRALIAN CORPORATE STORES
On 23 September 2008 the Company announced that it had entered into contracts to acquire two existing franchised stores in
Western Australia. These stores would be the first of seven acquired in Western Australia during the year. The first store was in the
suburb of Armadale, south of Perth on 17 October 2008. A further store was acquired in Fremantle on 29 October, closely followed
by Greenwood on 1 December and Canning Vale on 18 December 2008. This brought the total to four stores acquired during the
first half of the financial year.
During January 2009 the Osborne Park store was purchased, followed by Phoenix Park and Clarkson on the 17 and 24 February
respectively. This brought the total WA acquisitions to seven.
An opportunity also arose to acquire the Runaway Bay store in Queensland and this was concluded on 29 April.
Negotiations are currently underway to acquire more existing franchise stores around Australia.
A c q u i s i t i o n s

11
H i s t o r y
The history of Cash Converters dates back to November 1984, when
Brian Cumins, the Company’s founder, began operating his first retail
outlet in Perth, Western Australia.
During the next four years the merchandising formula and trading style
that has underwritten the groups success were developed and tested
in the market place. A total of seven stores were open and trading
profitably before the franchising of Cash Converters began with the
opening of two franchised outlets in Perth in June 1988.
In 1990 the Group began to expand into other Australian States and
now has over 130 outlets throughout Australia. The success of its
Australian operations resulted in Cash Converters seeking to expand
into overseas markets.
The Company’s carefully planned entry into Europe was launched in
1991 when the first store in the United Kingdom was opened at Gants
Hill in Essex. Since then further stores have opened in the UK taking
the total to 124 stores.
The Company’s first non-English speaking market, commenced with
the opening of its pilot store in Vitrolles, near Marseilles in France in
December 1994.
Since launching the concept in 1984, Cash Converters has grown
enormously with representation in 21 countries worldwide and to a
network of approximately 500 franchised stores.
CASH
CONVERTERSINTERNATIONALLIMITED
ANNUALREPORT
2009

12
G r o u p S t r u c t u r e
CASH CONVERTERS INTERNATIONAL LIMITED (CCIL)
Parent EntityIncorporated in Australia
Public Company
CCUKHoldingsPLC
(CCUKH)
100% ownedby CCIL
Incorporatedin the UK
Overseas Entity
CashConvertersPty Ltd(CCPL)
100% ownedby CCIL
Incorporatedin Australia
LargeProprietaryCompany
CCUSALimited(CCUSA)
58.87% ownedby CCIL
Incorporatedin Australia
SmallProprietaryCompany
CCUK Ltd
100% ownedby CCUKH
Incorporatedin the UK
Overseas Entity
MON-EPty Ltd
100% ownedby CCIL
Incorporatedin Australia
SmallProprietaryCompany
CCUSA Inc(CCUSA)
100% ownedby CCUSA
Incorporatedin the USA
Overseas Entity
CashConvertersFinance
CorporationLimited(CCFCL)
36.9% ownedby CCPL
Incorporatedin Australia
Disclosing Entity
SafrockFinanceGroupPty Ltd
SafrockFinance
CorporationQLD Pty Ltd
SafrockFinance
CorporationWA Pty Ltd
FinanceAdministratorsof AustraliaPty Ltd
100% ownedby CCIL
Incorporatedin Australia
All smallProprietaryCompanies
CashConverters(Stores)Pty Ltd
100% ownedby CCIL
Incorporatedin Australia
SmallProprietaryCompany
CashConverters(CashAdvance)Pty Ltd
100% ownedby CCIL
Incorporatedin Australia
SmallProprietaryCompany

13
CASH
CONVERTERSINTERNATIONALLIMITED
ANNUALREPORT
2009
C o r e B u s i n e s sThe core business of Cash Converters is the ownership
and franchising of retail and financial services stores,
which operate as retailers of second hand goods and
suppliers of financial products. The Cash Converters
business has changed consumer perceptions of its
industry by the systematic application of modern retailing
practices, professional management techniques and high
ethical standards to the management of its stores. As a
result, Cash Converters has been able to position its
corporate and franchised outlets as alternative retail
merchandise and financial services stores and, in the
process, created a profitable market for the group.
Over 20 years, the Company has developed and refined
its franchise offering to the point where it has mature and
stable multi-store franchise chains in both Australia and
the United Kingdom. The Company also acts as the
international master franchisor of the franchising concept.
The Company grants trade mark licences to enable
independent entities to develop a matching franchise
chain in another country in return for a passive royalty
income. This minimises risk to the Company while
allowing the brand to flourish overseas.
The directors see the following as theprincipal corporate objectives of the group:
� To achieve high profitability, enablingCash Converters to meet itsresponsibilities to shareholders andother stakeholders;
� To offer opportunities for franchiseesand employees to succeed bothfinancially and in their careers;
� To be recognised as a world leader inthe retail of second hand goods andthe provision of micro-lendingproducts; and
� To provide consumers with retail outletsthat are distinguished by the quality ofretail standards and value of themerchandise on offer.
C o r p o r a t e O b j e c t i v e s

14
REGINALD WEBB – Chairman
Reginald Webb, aged 66, is a Fellow of the Institute of Chartered Accountants of Australia and has retired as a partner of
PricewaterhouseCoopers. In that position he worked in both North America and Europe as well as Australia. He was a partner for
20 years and served on the Policy Board of that firm.
Mr Webb joined the Board in 1997 and is Chairman of the Audit Committee and serves on the remuneration and nomination
committees.
Mr Webb is also a director of Dorsogna Limited which he joined in 1996.
PETER CUMINS – Managing Director
Peter Cumins aged 58, is an Australian national. He joined the Group in August 1990 as Finance and Administration Manager when
the Company had just 23 stores, becoming General Manager in March 1992. He became Group Managing Director in April 1995.
Peter Cumins, a qualified accountant, has overseen the major growth in the number of franchises in Australia as well as the
international development of the Cash Converters franchise system.
His experience in the management of large organisations has included senior executive positions in the government health sector,
specifically with the Fremantle Hospital Group, where he was Finance and Human Resources Manager.
JOHN YEUDALL - Non-Executive Director
John Yeudall aged 65 was born in the UK and qualified there as a Chartered Engineer. He has been an Australian Citizen for many
years making Perth his home since 1982. He has a successful history in both the public and private sectors having spent ten years
with the Australian Trade Commission responsible for facilitating Australian trade with the Middle East. Part of that role was a three
year term as Consul General in Dubai. This followed a successful career in private business in Saudi Arabia. He was the founder of
the IKEA franchise in WA holding the position as Managing Director.
Mr Yeudall joined the Board in December 2002 and is Chairman of the Remuneration Committee and serves on the audit and
nomination committees.
Mr Yeudall is also Chairman of the ISS Group Limited since September 2004 and joined the Board of Advanced Ocular Systems
Limited in August 2007 – now IFS Construction Services limited.
PAUL COWAN – Non-Executive Director
Paul Cowan aged 50, has over 25 years experience in the financial services sector and presently serves as an executive director of
River Capital Pty Ltd, a Melbourne based investment management group.
He has previously served as Chief Executive Officer of Lowell Capital Limited and as a non-executive director of Brumby’s Bakeries
Holdings Limited.
Paul has a Bachelor of Economics degree from Monash University and is a qualified Chartered Accountant. He commenced his
working career with Price Waterhouse in 1980.
D i r e c t o r s ’ P r o f i l e s

F i n a n c i a l R e p o r t
15
CASH
CONVERTERSINTERNATIONALLIMITED
ANNUALREPORT
2009
Directors’ report 16-24
Corporate governance 25-27
Income statement 28
Balance sheet 29
Statement of recognised income and expense 30
Cash flow statement 31
Notes to the financial statements:
1 Summary of accounting policies 32-40
2 Profit from operations 41-42
3 Income tax expense 43
4 Remuneration of auditors 44
5 Cash and cash equivalents 45
6 Trade and other receivables 45-46
7 Inventories 46
8 Other assets 46
9 Plant and equipment 47
10 Trade and other payables 47
11 Borrowings 48
12 Provisions 49
13 Deferred establishment fees 49
14 Other intangible assets 49
15 Goodwill 50-51
16 Issued capital 51
17 Reserves and retained earnings 52
18 Financial instruments 52-56
19 Leases 57
20 Related party transactions 58-61
21 Subsequent events 61
22 Subsidiaries 62-65
23 Contingent liabilities 65
24 Earnings per share 66
25 Cash flow information 67
26 Dividends 68
27 Receivables and payables denominated inforeign currencies 68
28 Employee numbers 68
29 Acquisition of businesses 69-70
30 Segmental information 70-72
31 Company details 72
Directors’ declaration 73
Independent audit report to the members 74
Independence declaration 76
Shareholder information 77

D i r e c t o r s ’ R e p o r t
In respect of the financial year ended 30 June 2009 the directors of Cash Converters International Limited submit the following report
made out in accordance with a resolution of the directors.
DIRECTORS
The following persons held office as directors of the Company during or since the end of the financial year:
Mr Reginald Webb (Non-executive Director, Chairman)
Mr Peter Cumins (Managing Director)
Mr John Yeudall (Non-executive Director)
Mr Andrew Moffat (Non-executive Director – resigned 27 October 2008)
Mr Cameron Hetherington (Non-executive Director – resigned 28 April 2009)
Mr Paul Cowan (Non-executive Director – appointed 27 October 2008)
PRINCIPAL ACTIVITIES
The consolidated entity’s principal activity is that of a franchisor of second hand goods and financial services stores, a provider of
secured and unsecured loans and the operator of a number of corporate stores, all of which trade under the Cash Converters name.
Country franchise licences are also sold to sub-franchisors to allow the development of the Cash Converters brand but without the
need for support from Cash Converters International Limited.
TRADING RESULTS
The consolidated entity’s net profit attributable to members of the parent entity for the year ended 30 June 2009 was $16,164,861
(2008: $15,143,403) after a charge for income tax of $7,152,524 (2008:$ 6,423,983), and adjusting for profit attributable to outside
equity interests in controlled entities of $10,153 loss (2008: $31,183 profit).
DIVIDENDS
The directors of the Company paid a fully franked interim dividend of 1.5 (one and a half) cents per share on 31 March 2009. The
directors have also declared a final fully franked dividend of 1.5 (one and a half) cents per share to be paid on 30 September 2009
to those shareholders on the register at the close of business on 16 September 2009. In addition, a fully franked dividend of 1.5 (one
and a half) cents per share declared in relation to the prior year was paid on 30 September 2008.
REVIEW OF OPERATIONS
A summary of consolidated revenues and results by significant industry segments is set out below.
Segment revenues Segment results2009 2008 2009 2008
Store operations 65,558,769 43,911,732 7,234,263 4,348,261
Finance operations 28,839,131 30,494,150 16,122,541 17,299,880
94,397,900 74,405,882 23,356,804 21,648,141
Unallocated less expenses 49,572 49,572
Operating profit 23,307,232 21,598,569
Income tax attributable to operating profit (7,152,524) (6,423,983)
Operating profit after income tax 16,154,708 15,174,586
Less: Profit attributable to outside equity interests 10,153 (31,183)
Profit attributable to members of Cash Converters International Limited 16,164,861 15,143,403
16

17
CASH
CONVERTERS
INTERNATIONAL
LIMITED
ANNUAL
REPORT
2009
Comments on the operations and the results of those operations are set out below:
STORE OPERATIONS
AUSTRALIAN OPERATIONS
The net profit before tax for the Australian operations (including international franchise revenue) was $4,741,969 (2008:$3,508,027)
for the period ending 30 June 2009.
The total number of stores open as at 30 June 2009 was 136, with 44 in Queensland, 32 in Victoria, 12 in New south Wales, 20 in
South Australia, 25 in Western Australia and 3 in Tasmania.
During the past two years, changes have been introduced into the Australian business model which have had a significant effect in
repositioning the brand and making the look and feel of the business more contemporary.
In spite of deteriorating global retail conditions, the Australian business has once again demonstrated its resilience with a strong
performance. Shoppers have shown their desire to shop for value and as a result retail sales have been 10 - 15% higher than the
previous year.
During the year, communication to short term loan customers was refined and our connection with customers far better targeted.
This campaign has successfully positioned the company in the minds of our customers as a credible provider of short term loans.
While cash advance earnings are flat for the year, returns have been affected by an important contract renegotiation with franchisees
where the company introduced significant volume based fee reductions as incentives for franchisees.
The physical look of our network has changed noticeably over the past two years with almost all stores having now adopted the new
style for their exteriors and approximately 40% have also modified their store interiors. This is pleasing progress on what was always
going to be a costly project for franchisees.
The acquisition of the Safrock small personal loans business, the MON-E cash advance software business and 17 corporate stores
in four states has been company transforming from a value perspective. It has demanded that different business disciplines and
controls be introduced and it has raised integration issues, changes to personnel and shifts in responsibility and accountability. These
matters will require ongoing attention.
The company has devoted significant resources to addressing the legislative environment. As a result, legislation introduced into
parliament in August is consistent with all our recommendations made to Government and the Federal takeover of consumer credit
does not currently threaten any of our lending products.
Our online presence is in its infancy but we have seen a favourable and cost effective impact from our online advertising efforts. We
are strongly placed to make a much bigger impact on our business by extending the 'webshop' initiative to generate business. As a
result of a recent successful trial, there appears to be a great opportunity for online lending.
UNITED KINGDOM
The net profit before tax for the 12 month period ending 30 June 2009 was $2,514,362 (2008: $859,932).
The corporate store division now has 21 stores trading following the recent acquisition, in August 2009, of a store in Barnsley in the
north of England. All corporate stores performed well during the year with strong retail growth and the consistent growth of loan
banks, associated with pawnbroking and other personal loan products, all delivering to bottom line profit.
Total store numbers in the UK currently stand at 137. A further four franchised stores are planned to open in the three month period
ending October 2009. Franchise enquiries are still high so we anticipate further strong growth in store openings. UK franchisees have
continued to enjoy strong business growth and this has given further encouragement to existing franchisees to also grow their store
numbers.
The UK auction site continues to increase in terms of sales growth, the number of registered users and the number of ‘hits’ to the
site. There are now 66 stores offering products on the auction site with a total products listed of over 11,000. During July 2009
approximately 174,000 unique visitors logged onto the site, resulting in over 44,000 UK Pounds in sales.
In September 2009 the financial services currently offered in Australia will start to be promoted in the UK market. The trial will
commence in the north of England at the Ashton-under-Lyne store and move to the 21 store corporate network once the trial proves
successful. The credit environment in the UK operates under a more sophisticated credit rating with both positive and negative credit
checks available for prospective borrowers. This lessens the credit risk significantly and helps in the decision on whether to lend
funds.

D i r e c t o r s ’ R e p o r t
18
In summary, excellent progress has been made in significantly improving the profitability of the UK business through the acquisition
of stores and the expansion of the franchise network. Further store acquisitions and the anticipated growth in financial services
income should continue to deliver profit growth this financial year.
FINANCIAL SERVICES
The Safrock secured and unsecured loans business has continued to grow strongly year on year. The loan book as at 30 June 2008
was $13.8 million. By 30 June 2009 this had grown to $21.4 million, representing a 55.1% increase over the year.
The net profit before tax for Safrock was $9,183,941 this year, compared to $8,219,381 last year, representing growth of 12.2%.
On I July 2009 the operations for the software services provided by MON-E were amalgamated with those of Safrock in order to
produce a more cost effective service. In addition to significant overhead cost savings, this will deliver a faster, more efficient system
with added features that assist users to run their business.
The MON-E net profit before tax this year was $6,916,040, compared to $9,014,306 to June 2008. The main shortfall was the result
of a new fee scale offered to the franchise network to encourage them to increase the volume of their cash advance business.
With the UK commencing a trial in September to offer similar financial services to those offered in Australia, the outlook for growth is
significant.
Cash Converters Finance Corporation Limited (CCFCL) provides working capital loans to the Australian franchise network only. The
average loan is for $150,000 with an interest rate of 12 % or 13%. The loan is secured against the assets of the franchised store.
During the period CCFCL made a profit of $22,560 (2008:$66,193).
CHANGES IN STATE OF AFFAIRS
During the financial year there were no significant changes in the state of affairs of the consolidated entity other than referred to
elsewhere in the report, the financial statements or notes thereto.
SUBSEQUENT EVENTS
Since the end of the financial year the directors are not aware of any matter or circumstance, other than those mentioned below, that
has significantly or may significantly affect the operations of the Company, the results of these operations or the state of affairs of the
Company in subsequent financial years.
On 8 July 2009 Cash Converters International Limited announced that it was to raise $5 million through the issuance of up to 12.5
million shares at an issue price of $0.40 per share to institutional and sophisticated investors.
On 11 August 2009 Cash Converters International Limited announced that its UK subsidiary (CCUK) acquired an existing store in
Barnsley as a going concern for a total consideration of approximately £660,000 ($1.3 million). This acquisition takes the total number
of corporate stores to 38, comprising of 17 in Australia and 21 in the UK.
On 18 August 2009 Cash Converters International Limited entered into a Subscription Agreement with EZCORP, Inc. to make a
placement of 108,218,000 fully paid ordinary units at an issue price of A$0.50 per unit to raise approximately $54 million. This will
represent 30% of the fully diluted capital of the Company after the placement has been made. This placement is subject to
shareholder approval.
The funds will be utilised to grow the earnings of the Company through accelerating the acquisition of franchised stores and to
increase the size of the Safrock loan books.
FUTURE DEVELOPMENTS
There are no likely developments in the operations of the consolidated entity other than those discussed in this report.
Further information on likely developments in the operations of the consolidated entity and the expected results of operations have
not been included in this report as the directors believe it would likely result in unreasonable prejudice to the consolidated entity.
19
CASH
CONVERTERS
INTERNATIONAL
LIMITED
ANNUAL
REPORT
2009
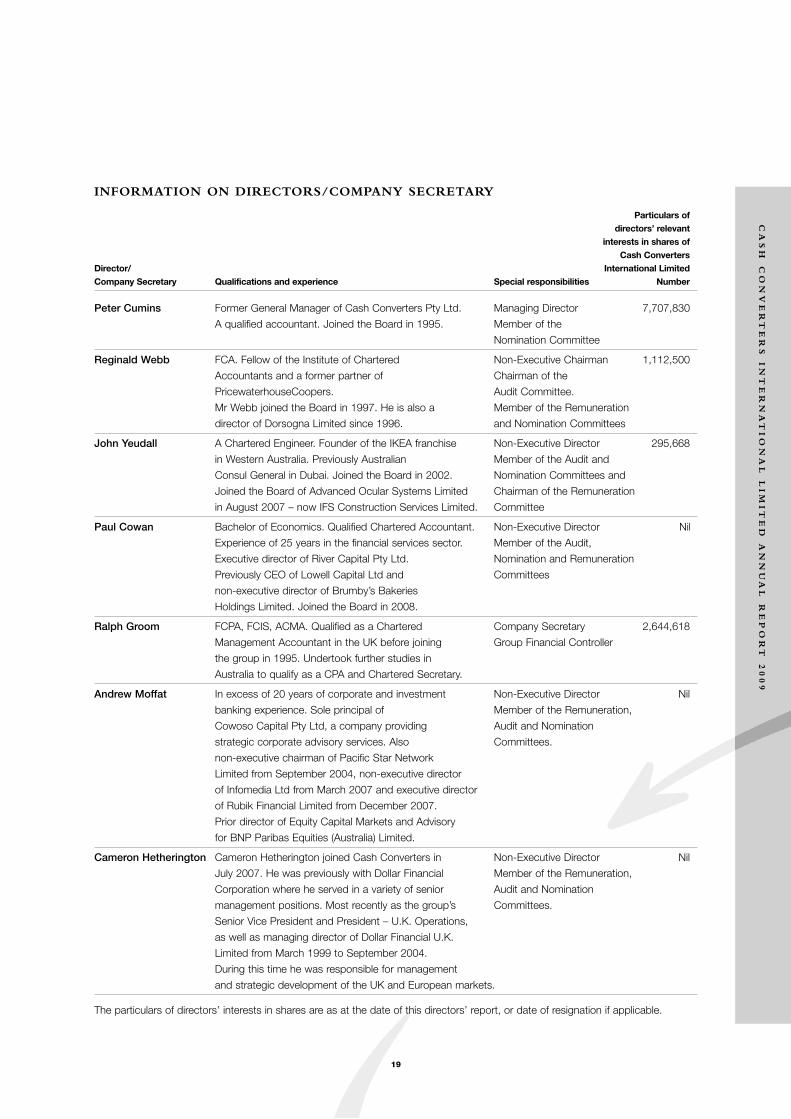
INFORMATION ON DIRECTORS/COMPANY SECRETARY
Particulars ofdirectors’ relevant
interests in shares ofCash Converters
Director/ International LimitedCompany Secretary Qualifications and experience Special responsibilities Number
Peter Cumins Former General Manager of Cash Converters Pty Ltd. Managing Director 7,707,830
A qualified accountant. Joined the Board in 1995. Member of the
Nomination Committee
Reginald Webb FCA. Fellow of the Institute of Chartered Non-Executive Chairman 1,112,500
Accountants and a former partner of Chairman of the
PricewaterhouseCoopers. Audit Committee.
Mr Webb joined the Board in 1997. He is also a Member of the Remuneration
director of Dorsogna Limited since 1996. and Nomination Committees
John Yeudall A Chartered Engineer. Founder of the IKEA franchise Non-Executive Director 295,668
in Western Australia. Previously Australian Member of the Audit and
Consul General in Dubai. Joined the Board in 2002. Nomination Committees and
Joined the Board of Advanced Ocular Systems Limited Chairman of the Remuneration
in August 2007 – now IFS Construction Services Limited. Committee
Paul Cowan Bachelor of Economics. Qualified Chartered Accountant. Non-Executive Director Nil
Experience of 25 years in the financial services sector. Member of the Audit,
Executive director of River Capital Pty Ltd. Nomination and Remuneration
Previously CEO of Lowell Capital Ltd and Committees
non-executive director of Brumby’s Bakeries
Holdings Limited. Joined the Board in 2008.
Ralph Groom FCPA, FCIS, ACMA. Qualified as a Chartered Company Secretary 2,644,618
Management Accountant in the UK before joining Group Financial Controller
the group in 1995. Undertook further studies in
Australia to qualify as a CPA and Chartered Secretary.
Andrew Moffat In excess of 20 years of corporate and investment Non-Executive Director Nil
banking experience. Sole principal of Member of the Remuneration,
Cowoso Capital Pty Ltd, a company providing Audit and Nomination
strategic corporate advisory services. Also Committees.
non-executive chairman of Pacific Star Network
Limited from September 2004, non-executive director
of Infomedia Ltd from March 2007 and executive director
of Rubik Financial Limited from December 2007.
Prior director of Equity Capital Markets and Advisory
for BNP Paribas Equities (Australia) Limited.
Cameron Hetherington Cameron Hetherington joined Cash Converters in Non-Executive Director Nil
July 2007. He was previously with Dollar Financial Member of the Remuneration,
Corporation where he served in a variety of senior Audit and Nomination
management positions. Most recently as the group’s Committees.
Senior Vice President and President – U.K. Operations,
as well as managing director of Dollar Financial U.K.
Limited from March 1999 to September 2004.
During this time he was responsible for management
and strategic development of the UK and European markets.
The particulars of directors’ interests in shares are as at the date of this directors’ report, or date of resignation if applicable.

D i r e c t o r s ’ R e p o r t
20
DIRECTORS’ MEETINGS
The number of directors’ meetings and meetings of committees of directors held in the period each director held office and the
number of meetings attended by each director are:
Board of directors Audit committee Remuneration/nominationmeetings meetings committee meetings
Director Number Number Number Number Number Numberheld attended held attended held attended
P. Cumins 11 11 3 3 - -
R. Webb 11 11 3 3 4 4
J. Yeudall 11 11 3 3 4 4
P. Cowan 8 8 1 1 1 1
A. Moffat 3 3 2 2 4 4
C. Hetherington 9 9 3 3 - -
REMUNERATION REPORT
DIRECTORS’ AND EXECUTIVES’ REMUNERATION
This remuneration report, which forms part of the directors’ report, sets out information about the remuneration of Cash Converters
International Limited directors and its senior management for the financial year ended 30 June 2009. The prescribed details for each
person covered by this report are detailed below under the following headings:
• director and senior management details
• remuneration policy
• relationship between the remuneration policy and company performance
• remuneration of directors and senior management
• key terms of employment contracts.
DIRECTOR AND SENIOR MANAGEMENT DETAILS
The following persons acted as directors of the company during or since the end of the financial year:
• Mr Reginald Webb (Non-executive Director, Chairman)
• Mr Peter Cumins (Managing Director)
• Mr John Yeudall (Non-executive Director)
• Mr Andrew Moffat (Non-executive Director – resigned 27 October 2008)
• Mr Cameron Hetherington (Non-executive Director – resigned 28 April 2009)
• Mr Paul Cowan (Non-executive Director – appointed 27 October 2008)
The term ‘senior management’ is used in this remuneration report to refer to the following persons. Except as noted, the named
persons held their current position for the whole of the financial year and since the end of the financial year:
• Mr Michael Cooke (Group Legal Counsel)
• Ian Day (General Manager, Australia)
• Ralph Groom (Company Secretary / Group Financial Controller)
• Mark Lemmon (Director of Operations, UK – resigned May 2009)
• Jim Spratley (Group Accountant, UK)
• Richard Pilgrim (Operations Manager, UK)
Senior management as used within this remuneration report are officers who are involved in, concerned in, or who take part in, the
management of the affairs of Cash Converters International Limited and / or related bodies corporate.
21
CASH
CONVERTERS
INTERNATIONAL
LIMITED
ANNUAL
REPORT
2009
REMUNERATION POLICY
The remuneration committee, consisting of three non-executive directors, advises the Board on remuneration policies and practices
generally, and makes specific recommendations on remuneration packages and other terms of employment for executive directors
and other senior executives.
Executive remuneration and other terms of employment are reviewed by the Committee having regard to performance against goals
set, relevant comparative information and independent expert advice. As well as a base salary, remuneration packages include
superannuation, performance-related bonuses and fringe benefits.
Remuneration packages are set at levels that are intended to attract and retain executives capable of managing the consolidated
entity’s operations.
Remuneration and other terms of employment for the Managing Director and certain other senior executives are formalised in service
agreements (refer to the key terms of employment contracts section within the remuneration report for further information).
Remuneration of non-executive directors is determined by the Remuneration Committee and approved by the Board within the
maximum amount approved by the shareholders from time to time. Bonuses are not payable to non-executive directors.
Remuneration packages contain the following key elements:
(a) Short-term employee benefits – salary/fees, bonuses and non-monetary benefits including the provision of motor vehicles;
(b) Post-employment benefits – include superannuation and prescribed retirement benefits;
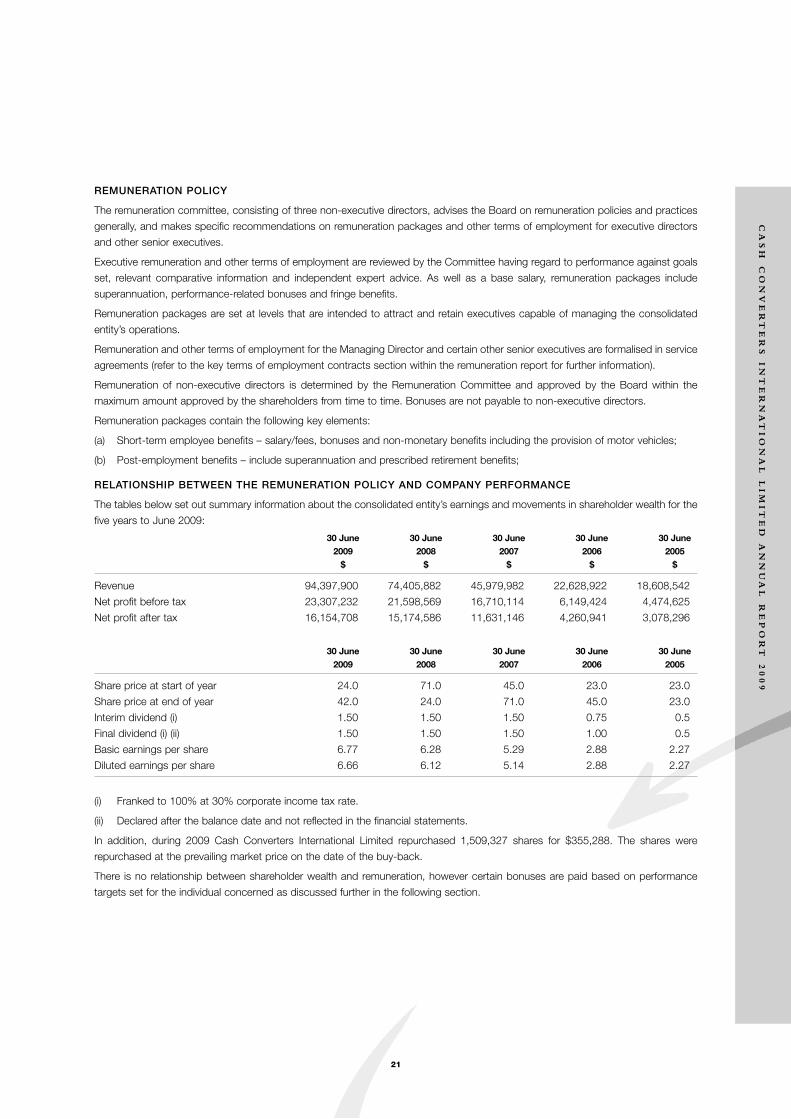
RELATIONSHIP BETWEEN THE REMUNERATION POLICY AND COMPANY PERFORMANCE
The tables below set out summary information about the consolidated entity’s earnings and movements in shareholder wealth for the
five years to June 2009:
30 June 30 June 30 June 30 June 30 June2009 2008 2007 2006 2005$ $ $ $ $
Revenue 94,397,900 74,405,882 45,979,982 22,628,922 18,608,542
Net profit before tax 23,307,232 21,598,569 16,710,114 6,149,424 4,474,625
Net profit after tax 16,154,708 15,174,586 11,631,146 4,260,941 3,078,296
30 June 30 June 30 June 30 June 30 June2009 2008 2007 2006 2005
Share price at start of year 24.0 71.0 45.0 23.0 23.0
Share price at end of year 42.0 24.0 71.0 45.0 23.0
Interim dividend (i) 1.50 1.50 1.50 0.75 0.5
Final dividend (i) (ii) 1.50 1.50 1.50 1.00 0.5
Basic earnings per share 6.77 6.28 5.29 2.88 2.27
Diluted earnings per share 6.66 6.12 5.14 2.88 2.27
(i) Franked to 100% at 30% corporate income tax rate.
(ii) Declared after the balance date and not reflected in the financial statements.
In addition, during 2009 Cash Converters International Limited repurchased 1,509,327 shares for $355,288. The shares were
repurchased at the prevailing market price on the date of the buy-back.
There is no relationship between shareholder wealth and remuneration, however certain bonuses are paid based on performance
targets set for the individual concerned as discussed further in the following section.

D i r e c t o r s ’ R e p o r t
22
REMUNERATION OF DIRECTORS AND SENIOR MANAGEMENT
Details of the nature and amount of each element of the remuneration of each director of the Company and member of senior
management of the consolidated entity are set out in the following tables:
Post- Share-Short-term employee benefits employment Other based
benefits long-term paymentSalary Motor Super- employee Options& fees Bonus vehicles Other annuation benefits & rights Total
2009 $ $ $ $ $ $ $ $
Non-executive directors
R. Webb 85,000 - - - - - - 85,000
J. Yeudall 60,000 - - - - - - 60,000
A. Moffat 18,349 - - - 1,651 - - 20,000
C. Hetherington 45,872 - - - 4,128 - - 50,000
P. Cowan 40,822 - - - - - - 40,822
Executive directors
P. Cumins 367,500 - 30,821 - - - - 398,321
Other executives of theconsolidated entity
M. Cooke 347,727 - - - - - - 347,727
I. Day 240,826 - - - 21,674 - - 262,500
J. Spratley 171,054 32,128 17,162 - 36,330 - - 256,674
R. Groom 183,616 - 20,663 14,976 54,908 - - 274,163
M. Lemmon 187,879 40,724 14,763 - 29,606 - - 272,972
R. Pilgrim 114,871 65,195 13,201 - 23,186 - - 216,453
Total 1,863,516 138,047 96,610 14,976 171,483 - - 2,284,632
Post- Share-Short-term employee benefits employment Other based
benefits long-term paymentSalary Motor Super- employee Options& fees Bonus vehicles Other annuation benefits & rights Total
2008 $ $ $ $ $ $ $ $
Non-executive directors
R. Webb 78,750 - - - - - - 78,750
J. Yeudall 55,500 - - - - - - 55,500
A. Moffat 48,165 - - - 4,335 - - 52,500
C. Hetherington 50,023 - - - 2,477 - - 52,500
Executive directors
P. Cumins 355,662 - 31,973 - - - - 387,635
Other executives of theconsolidated entity
M. Cooke 336,000 - - - - - - 336,000
M. Lemmon 197,297 17,344 17,612 - 28,202 - - 260,455
I. Day 226,000 - - - 24,000 - - 250,000
J. Spratley 167,187 16,312 17,612 - 32,621 - - 233,732
R. Groom 183,616 - 18,111 14,976 41,907 - - 258,610
Total 1,698,200 33,656 85,308 14,976 133,542 - - 1,965,682
No director or senior management person appointed during the period received a payment as part of his or her consideration for
agreeing to hold the position.

23
CASH
CONVERTERS
INTERNATIONAL
LIMITED
ANNUAL
REPORT
2009
BONUSES AND SHARE-BASED PAYMENTS GRANTED AS COMPENSATION FOR THE CURRENT FINANCIAL YEAR
Bonuses - 2009
The bonuses received by M Lemmon, R Pilgrim and J Spratley were paid for achieving a profit result for the UK business that was
above the forecast result. Bonuses are earned and awarded at the discretion of the Board. The actual bonuses were granted in
July/August 2009.
Bonuses - 2008
The bonuses received by M Lemmon and J Spratley were paid for achieving a profit result for the UK business that was above the
forecast result. Bonuses are earned and awarded at the discretion of the Board. The actual bonuses were granted in July/August
2008.
All bonuses are cash settled and were paid in full during the period concerned. There is no predefined upper or lower limit to the
annual bonus pool.
No share based payments were made during the current or prior financial year.
CASH BONUS AS A PERCENTAGE OF TOTAL COMPENSATION
2009:
M. Lemmon: 14.9%
J. Spratley: 12.5%
R. Pilgrim: 30.1%
2008:
M Lemmon: 6.66%
J. Spratley: 6.98%
KEY TERMS OF EMPLOYMENT CONTRACTS
Contracts of employment for Peter Cumins, Michael Cooke, Ralph Groom and Ian Day require a notice period of not less than three
months from the executive and twelve months from the company, to terminate employment. In the event of termination by the
company the company may elect that the executive does not serve the notice period in which case twelve months salary would be
payable. The contracts are rolling with no fixed term.
Contracts of employment for Mark Lemmon, Richard Pilgrim and Jim Spratley require a notice period of not less than three months
by either party. In the event of termination by the company the company may elect that the executive does not serve the notice period
in which case three months salary would be payable. The contracts are rolling with no fixed term.
None of the non-executive directors have an employment contract with the Company.
ENVIRONMENTAL STATEMENT
The Company has assessed whether there are any particular or significant environmental Regulations, which apply to the Company,
and has determined that there are none.
INDEMNIFICATION AND INSURANCE OF OFFICERS
During the financial year, the company paid a premium in respect of a contract insuring the directors of the company (as named
above), the company secretary, Ralph Groom, and all executive officers of the company and of any related body corporate against a
liability incurred as such a director, secretary or executive officer to the extent permitted by the Corporations Act 2001. The contract
of insurance prohibits disclosure of the nature of the liability and the amount of the premium.
The company has not otherwise, during or since the end of the financial year, except to the extent permitted by law, indemnified or
agreed to indemnify an officer or auditor of the company or of any related body corporate against a liability incurred as such an officer
or auditor.

D i r e c t o r s ’ R e p o r t
24
AUDITOR’S INDEPENDENCE DECLARATION
The auditor’s independence declaration is included at the end of the financial statements.
NON-AUDIT SERVICES
The directors are satisfied that the provision of non-audit services, during the year, by the auditor is compatible with the general
standard of independence for auditors imposed by the Corporations Act 2001.
The directors are satisfied that the provision of non-audit services, during the year, by the auditor did not compromise the auditor
independence requirements of the Corporations Act 2001, as the nature of the services was limited to the preparation of the statutory
income tax return, and generic accounting advice.
Details of the amounts paid or payable to the auditor for non-audit services provided during the year by the auditor are outlined in
note 4 to the financial statements.
The directors’ report is signed in accordance with a resolution of directors made pursuant to S298(2) of the Corporations Act 2001.
For and on behalf of the Board
Reginald Webb
Director
Perth, Western Australia
Date: 22 September 2009

C o r p o r a t e G o v e r n a n c e
25
CASH
CONVERTERS
INTERNATIONAL
LIMITED
ANNUAL
REPORT
2009
BOARD
The Board is responsible for setting the Company’s strategic direction and it strives to create shareholder value and to ensure
shareholders funds are adequately protected. Its functions include:
• approving corporate strategies, financial budgets and group policies;
• assessing actual performance against budgets in order to monitor the suitability of corporate strategy and to assess the
performance of the management team;
• review operational performance to ensure a clear understanding of the financial health of the Company;
• ensure the Company always acts with a high level of ethical standards and in a legal and responsible way;
• appointing, evaluating and rewarding the senior executives of the management team.
The non-executive directors, being Mr Reginald Webb, Mr John Yeudall and Mr Paul Cowan, are independent, having no business
or other relationships, which could compromise their autonomy. If a potential conflict of interest does arise, the director concerned
does not receive the associated board papers and leaves the board meeting while the issue is considered. Directors must keep the
Board advised on any matters that may lead to a conflict of interest. The Board has not conducted a performance evaluation in the
current reporting period. A formal Board Charter has been adopted by the Board.
AUDIT COMMITTEE
The audit committee was established in 1995 and comprises of the three non-executive directors appointed by the Board, being Mr
Reginald Webb (Chairman), Mr John Yeudall and Mr Paul Cowan, and with regular attendance by the managing director at the request
of the audit committee.
Meetings of the committee are usually held in February, July and August each year and at any other time as requested by a member
of the committee or the external auditors. The primary function of the committee is to assist the Board in fulfilling its responsibilities
for the Company’s financial reporting and external reporting and ensuring all accounting reports are prepared in accordance with the
appropriate accounting standards and statutory requirements. In addition, it reviews the performance of the auditors and makes any
recommendations the committee feels necessary.
INDEPENDENT PROFESSIONAL ADVICE
In fulfilling their duties, the directors may obtain independent professional advice at the Company’s expense.
SHARE TRADING
Included in the Board Charter is a share trading policy. This policy imposes restrictions on share dealings for directors, officers and
senior employees and prohibits them from dealing in Company’s securities while in possession of inside information.
REMUNERATION COMMITTEE
The remuneration committee was established on 26 May 1997 and comprises of the three non-executive directors, being
Mr John Yeudall (Chairman), Mr Reginald Webb and Mr Paul Cowan, appointed by the Board. The aims of the committee are to
maintain a remuneration policy, which ensures the remuneration package of senior executives properly reflects their duties and
responsibilities, and to attract and motivate senior executives of the quality required.

C o r p o r a t e G o v e r n a n c e
26
ASX BEST PRACTICE RECOMMENDATIONS
The table below contains each of the ASX Best Practice Recommendations. Where the Company has complied with a
recommendation during the reporting period, this is indicated with a tick (�) in the appropriate column. Where the Company
considered it was not appropriate to comply with a particular recommendation, this is indicated with a cross (�) and the Company’s
reasons are set out on the corresponding note appearing at the end of the table.
Complied Note
1.1 Formalise and disclose the functions reserved to the Board and those delegated to management �
1.2 Disclose the process for evaluating the performance of senior executives �
1.3 Provide the information indicated in the Guide to reporting on Principle 1. �
2.1 A majority of the Board should be independent directors �
2.2 The Chairperson should be an independent director �
2.3 The roles of the Chairperson and Chief Executive Officer should not be exercised
by the same individual �
2.4 The Board should establish a nomination committee �
2.5 Disclose the process for evaluating the performance of the board, its committees
and individual directors �
2.6 Provide the information indicated in Guide to reporting on Principle 2. �
3.1 Establish a code of conduct to guide the Directors, the Chief Executive Officer (or equivalent),
the Chief Financial Officer (or equivalent) and any other key executives as to:
3.1.1 the practices necessary to maintain confidence in the Company’s integrity �
3.1.2 the responsibility and accountability of individuals for reporting and investigating reports
of unethical practices �
3.2 Establish a policy concerning trading in company securities by directors, senior executives
and employees and disclose the policy or a summary of that policy �
3.3 Provide the information indicated in Guide to reporting on Principle 3. �
4.1 The Board should establish an audit committee �
4.2 Structure of the audit committee so that it consists of:
- only non-executive directors �
- a majority of independent directors �
- an independent chairperson, who is not chairperson of the Board � 1
- at least three members �
4.3 The audit committee should have a formal charter �
4.5 Provide the information indicated in Guide to reporting on Principle 4. �
Note:
1. The Chairman of the audit committee is also the Chairman of the Board. However, the directors are of the belief that the
Chairman, being a retired partner of PricewaterhouseCoopers , is suitably qualified to undertake both roles.

27
CASH
CONVERTERS
INTERNATIONAL
LIMITED
ANNUAL
REPORT
2009
Complied Note
5.1 Establish written policies and procedures designed to ensure compliance with
ASX Listing Rule disclose requirements to ensure accountability at a
senior management level for that compliance �
5.2 Provide the information indicated in Guide to reporting on Principle 5. �
6.1 Design and disclose a communications strategy to promote effective communication
with shareholders and encourage effective participation at general meetings �
6. 2 Provide the information indicated in Guide to reporting on Principle 6. �
7.1 The Board or appropriate board committee should establish policies on
risk oversight and management �
7.2 The board should require management to design and implement the risk management
and internal control system to manage the company’s material business risks and report
to it on whether those risks are being managed effectively. The board should disclose that
management has reported to it as to the effectiveness of the company’s management
of its material business risks �
7.3 The board should disclose whether it has received assurance from the chief executive officer
(or equivalent) and the chief financial officer (or equivalent) that the declaration provided in
accordance with section 295A of the Corporations Act is founded on a sound system of risk
management and internal control and that the system is operating effectively in all material
respects in relation to financial reporting risks. �
8.1 The Board should establish a remuneration committee �
8.2 Clearly distinguish the structure of non-executive directors remuneration from that of executives �
8.3 Provide the information indicated in Guide to reporting on Principle 9. �

I n c o m e S t a t e m e n tFOR THE FINANCIAL YEAR ENDED 30 JUNE 2009
28
Consolidated Company2009 2008 2009 2008
Notes $ $ $ $
Revenue 2 94,397,900 74,405,882 18,135,308 8,204,442
Employee benefits expense (19,711,189) (13,010,857) - -
Depreciation and amortisation expenses (1,162,068) (882,312) - -
Finance costs (1,135,225) (963,028) - -
Legal fees / legal settlements (506,175) (478,977) - -
Changes in inventories (23,972,266) (16,745,147) - -
Area agents fees / commissions (4,941,768) (5,709,839) - -
Rental expense on operating leases (3,912,899) (2,413,997) - -
Motor vehicle/travel costs (1,113,848) (1,016,238) - -
Advertising and promotion (1,227,387) (451,379) -
Management fees - - (655,295) (975,000)
Bad debts/bad debt provision (4,819,0032) (4,302,072) - -
Professional and registry costs (1,375,378) (929,264) - -
Auditing and accounting services (343,615) (320,522) - -
Bank charges (821,029) (1,177,660) - -
Other expenses from ordinary activities 2 (6,048,789) (4,406,021) - -
Profit before income tax expense 23,307,232 21,598,569 17,480,013 7,229,442
Income tax expense 3 (7,152,524) (6,423,983) - -
Profit for the year 16,154,708 15,174,586 17,480,013 7,229,442
Attributable to: 22
Equity holders of the parent 16,164,861 15,143,403 17,480,013 7,229,442
Minority interest (10,153) 31,183 - -
16,154,708 15,174,586 17,480,013 7,229,442
Earnings per share
Basic (cents per share) 24 6.77 6.28
Diluted (cents per share) 24 6.66 6.12
The above income statement should be read in conjunction with the accompanying notes.

B a l a n c e S h e e tAS AT 30 JUNE 2009
29
CASH
CONVERTERS
INTERNATIONAL
LIMITED
ANNUAL
REPORT
2009
The above balance sheet should be read in conjunction with the accompanying notes.
Consolidated Company2009 2008 2009 2008
Notes $ $ $ $
Current assets
Cash and cash equivalents 5 7,002,971 16,322,202 38,661 -
Trade receivables 6 6,681,554 5,161,595 - -
Personal loans receivable 6 25,070,661 14,280,565 - -
Inventories 7 6,958,592 3,306,989 - -
Other assets 8 853,164 281,553 - -
Total current assets 46,566,942 39,352,904 38,661 -
Non-current assets
Trade and other receivables 6 1,368,700 1,950,157 30,707,733 17,994,425
Other financial assets 22 - - 43,572,916 43,572,916
Plant and equipment 9 4,633,423 2,580,301 - -
Deferred tax assets 3 1,866,991 1,851,285 172,770 260,236
Goodwill 15 49,873,170 43,650,114 - -
Other intangible assets 14 10,473,947 9,876,716 - -
Total non-current assets 68,216,171 59,908,573 74,453,419 61,632,577
Total assets 114,783,114 99,261,477 74,492,080 61,632,577
Current liabilities
Trade and other payables 10 8,366,970 6,743,196 - 769,296
Borrowings 11 3,942,312 4,539,025 2,600,000 2,160,000
Current tax payables 3 3,298,192 2,748,328 2,697,371 2,552,283
Deferred establishment fees 13 1,310,668 1,399,282 - -
Provisions 12 1,127,578 823,048 - -
Total current liabilities 18,045,720 16,252,879 5,297,371 5,481,579
Non-current liabilities
Borrowings 11 12,978,034 7,689,721 10,559,000 7,460,000
Deferred tax liabilities 3 1,269,700 1,272,968 - -
Total non-current liabilities 14,247,734 8,962,689 10,559,000 7,640,000
Total liabilities 32,293,454 25,215,568 15,856,371 12,941,579
Net assets 82,489,660 74,045,909 58,635,709 48,690,998
Equity
Issued capital 16 47,202,376 46,424,331 47,202,376 46,424,331
Reserves 17 259,515 1,568,504 1,133,333 2,266,667
Retained earnings 17 34,758,496 25,773,648 10,300,000 -
Parent entity interest 82,220,387 73,766,483 58,635,709 48,690,998
Minority interests 22 269,273 279,426 - -
Total equity 82,489,660 74,045,909 58,635,709 48,690,998

S t a t e m e n t o f R e c o g n i s e d I n c o m e a n d E x p e n s eFOR THE FINANCIAL YEAR ENDED 30 JUNE 2009
30
Consolidated Company2009 2008 2009 2008$ $ $ $
Exchange differences arising on translation
of foreign operations (175,655) (610,717) - -
Net income (expense) recognised directly in equity (175,655) (610,717) - -
Profit for the year 16,154,708 15,174,586 17,480,013 7,229,442
Total recognised income and expense for the year 15,979,053 14,563,869 17,480,013 7,229,442
Attributable to:
Equity holders of the parent 15,989,206 14,532,686 17,480,013 7,229,442
Minority interest (10,153) 31,183 - -
15,979,053 14,563,869 17,480,013 7,229,442
The above statement of recognised income and expense should be read in conjunction with the accompanying notes.
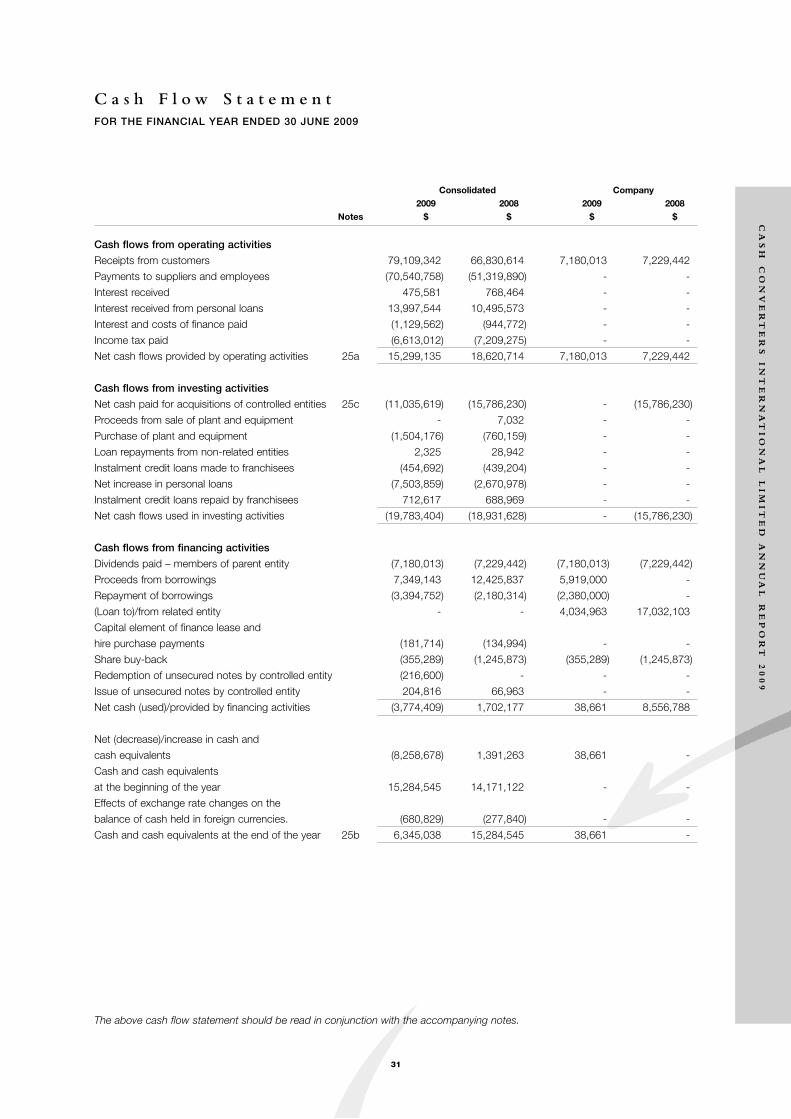
C a s h F l o w S t a t e m e n tFOR THE FINANCIAL YEAR ENDED 30 JUNE 2009
31
CASH
CONVERTERS
INTERNATIONAL
LIMITED
ANNUAL
REPORT
2009
The above cash flow statement should be read in conjunction with the accompanying notes.
Consolidated Company2009 2008 2009 2008
Notes $ $ $ $
Cash flows from operating activities
Receipts from customers 79,109,342 66,830,614 7,180,013 7,229,442
Payments to suppliers and employees (70,540,758) (51,319,890) - -
Interest received 475,581 768,464 - -
Interest received from personal loans 13,997,544 10,495,573 - -
Interest and costs of finance paid (1,129,562) (944,772) - -
Income tax paid (6,613,012) (7,209,275) - -
Net cash flows provided by operating activities 25a 15,299,135 18,620,714 7,180,013 7,229,442
Cash flows from investing activities
Net cash paid for acquisitions of controlled entities 25c (11,035,619) (15,786,230) - (15,786,230)
Proceeds from sale of plant and equipment - 7,032 - -
Purchase of plant and equipment (1,504,176) (760,159) - -
Loan repayments from non-related entities 2,325 28,942 - -
Instalment credit loans made to franchisees (454,692) (439,204) - -
Net increase in personal loans (7,503,859) (2,670,978) - -
Instalment credit loans repaid by franchisees 712,617 688,969 - -
Net cash flows used in investing activities (19,783,404) (18,931,628) - (15,786,230)
Cash flows from financing activities
Dividends paid – members of parent entity (7,180,013) (7,229,442) (7,180,013) (7,229,442)
Proceeds from borrowings 7,349,143 12,425,837 5,919,000 -
Repayment of borrowings (3,394,752) (2,180,314) (2,380,000) -
(Loan to)/from related entity - - 4,034,963 17,032,103
Capital element of finance lease and
hire purchase payments (181,714) (134,994) - -
Share buy-back (355,289) (1,245,873) (355,289) (1,245,873)
Redemption of unsecured notes by controlled entity (216,600) - - -
Issue of unsecured notes by controlled entity 204,816 66,963 - -
Net cash (used)/provided by financing activities (3,774,409) 1,702,177 38,661 8,556,788
Net (decrease)/increase in cash and
cash equivalents (8,258,678) 1,391,263 38,661 -
Cash and cash equivalents
at the beginning of the year 15,284,545 14,171,122 - -
Effects of exchange rate changes on the
balance of cash held in foreign currencies. (680,829) (277,840) - -
Cash and cash equivalents at the end of the year 25b 6,345,038 15,284,545 38,661 -

N o t e s t o t h e F i n a n c i a l S t a t e m e n t s
32
1. SUMMARY OF ACCOUNTING POLICIES
STATEMENT OF COMPLIANCE
The financial report is a general purpose financial report which has been prepared in accordance with the Corporations Act 2001,
Accounting Standards and Interpretations, and complies with other requirements of the law.
Accounting Standards include Australian equivalents to International Financial Reporting Standards (‘A-IFRS’). Compliance with
the A-IFRS ensures that the financial statements and notes of the company and consolidated entity comply with International
Financial Reporting Standards (‘IFRS’).
The financial statements were authorised for issue by the directors on 22 September 2009.
BASIS OF PREPARATION
The financial report has been prepared on the basis of historical cost, except for the revaluation of certain non-current assets
and financial instruments. Cost is based on the fair values of the consideration given in exchange for assets. Unless otherwise
noted, all amounts are presented in Australian dollars.
CRITICAL ACCOUNTING JUDGEMENTS AND KEY SOURCES OF ESTIMATION UNCERTAINTY
In the application of the consolidated entity’s accounting policies, management is required to make judgments, estimates and
assumptions about carrying values of assets and liabilities that are not readily apparent from other sources. The estimates and
associated assumptions are based on historical experience and various other factors that are believed to be reasonable under
the circumstance, the results of which form the basis of making the judgments. Actual results may differ from these estimates.
The estimates and underlying assumptions are reviewed on an ongoing basis. Revisions to accounting estimates are recognised
in the period in which the estimate is revised if the revision affects only that period, or in the period of the revision and future
periods if the revision affects both current and future periods.
The following are the key assumptions concerning the future and other key sources of estimation uncertainty at the balance
sheet date, that have a significant risk of causing a material adjustment to the carrying amounts of assets and liabilities within
the next financial year:
Impairment of goodwill
Determining whether goodwill is impaired requires an estimation of the value in use of the cash-generating units to which
goodwill has been allocated. The value in use calculation requires the entity to estimate the future cash flows expected to arise
from the cash-generating unit and a suitable discount rate in order to calculate present value.
The carrying amount of goodwill at the balance sheet date was $49,873,170 (2008: $43,650,114) refer to note 15.
Useful lives of trade names
The consolidated entity reviews the estimated useful lives of trade names at the end of each annual reporting period. The
estimation of the remaining useful lives of the trade names requires the entity to make significant estimates based on both past
performance and expectations of future performance.
The carrying amount of trade names at the balance sheet date was $8,948,813 (2008: $9,043,145) refer to note 14.
Allowance for doubtful debts
The impairment of personal loans requires the Group to assess impairment regularly. The credit provisions raised (specific and
collective) represent management’s best estimate of the losses incurred in the loan portfolio at balance date based on their
experienced judgment. The collective provision is estimated on the basis of historical loss experience for assets with credit
characteristics. The historical loss experience is adjusted based on current observable data and events. The use of such
judgments and reasonable estimates is considered by management to be an essential part of the process and does not impact
on reliability.
Specific provisioning is applied when the full collectibles of one of the Group’s loans is identified as being doubtful.

33
CASH
CONVERTERS
INTERNATIONAL
LIMITED
ANNUAL
REPORT
2009
SIGNIFICANT ACCOUNTING POLICIES
Accounting policies are selected and applied in a manner which ensures that the resulting financial information satisfies the
concepts of relevance and reliability, thereby ensuring that the substance of the underlying transactions or other events is
reported. In the current year, the company and the consolidated entity have adopted all of the new and revised Standards and
Interpretations issued by the Australian Accounting Standards Board (the AASB) that are relevant to their operations and effective
for the current annual reporting period. The adoption of these new and revised Standards and Interpretations has not resulted
in any changes to the company’s and the consolidated entity’s accounting policies.
The following significant accounting policies have been adopted in the preparation and presentation of the financial report:
(a) BORROWINGS
Borrowings are recorded initially at fair value, net of transaction costs.
Subsequent to initial recognition, borrowings are measured at amortised cost with any difference between the initial recognised
amount and the redemption value being recognised in profit and loss over the period of the borrowing using the effective interest
rate method.
(b) CASH AND CASH EQUIVALENTS
Cash and cash equivalents comprise cash on hand, cash in banks and investments in short term money market instruments,
net of outstanding bank overdrafts. Bank overdrafts are shown within borrowings in current liabilities in the balance sheet.
(c) EMPLOYEE BENEFITS
Provision is made for benefits accruing to employees in respect of wages and salaries, annual leave, long service leave, and sick
leave when it is probable that settlement will be required and they are capable of being measured reliably.
Provisions made in respect of employee benefits expected to be settled within 12 months, are measured at their nominal values
using the remuneration rate expected to apply at the time of settlement.
Provisions made in respect of employee benefits which are not expected to be settled within 12 months are measured as the
present value of the estimated future cash outflows to be made by the consolidated entity in respect of services provided by
employees up to reporting date.
Defined contribution plans
Contributions to defined contribution superannuation plans are expensed when incurred.
(d) FINANCIAL ASSETS
Investments are recognised and derecognised on trade date where purchase or sale of an investment is under a contract whose
terms require delivery of the investment within the timeframe established by the market concerned, and are initially measured at
fair value, net of transaction costs.
Subsequent to initial recognition, investments in subsidiaries are measured at cost.
Other financial assets are classified as ‘loans and receivables’.
Effective interest method
The effective interest method is a method of calculating the amortised cost of a financial asset and of allocating interest income
over the relevant period. The effective interest rate is the rate that exactly discounts estimated future cash receipts through the
expected life of the financial asset, or where appropriate, a shorter period.
Loans and receivables
Trade receivables, loans, and other receivables are recorded at amortised cost using the effective interest method less
impairment.
N o t e s t o t h e F i n a n c i a l S t a t e m e n t s
34
1. SUMMARY OF ACCOUNTING POLICIES (continued)
(e) FINANCIAL INSTRUMENTS ISSUED BY THE COMPANY
Debt and equity instruments
Debt and equity instruments are classified as either liabilities or as equity in accordance with the substance of the contractual
arrangement.
Transaction costs on the issue of equity instruments
Transaction costs arising on the issue of equity instruments are recognised directly in equity as a reduction of the proceeds of
the equity instruments to which the costs relate. Transaction costs are the costs that are incurred directly in connection with the
issue of those equity instruments and which would not have been incurred had those instruments not been issued.
Interest and dividends
Interest and dividends are classified as expenses or as distributions of profit consistent with the balance sheet classification of
the related debt or equity instruments or component parts of compound instruments.
Financial guarantee contract liabilities
Financial guarantee contract liabilities are measured initially at the fair values and subsequently at the higher of the amount
recognised as a provision and the amount initially recognised less cumulative amortisation in accordance with the revenue
policies.
Impairment of financial assets
Financial assets, other than those at fair value through profit or loss, are assessed for indicators of impairment at each balance
sheet date. Financial assets are impaired where there is objective evidence that as a result of one or more events that occurred
after the initial recognition of the financial asset the estimated future cash flows of the investment have been impacted. For
financial assets carried at amortised cost, the amount of the impairment is the difference between the asset’s carrying amount
and the present value of estimated future cash flows, discounted at the original effective interest rate.
The carrying amount of the financial asset is reduced by the impairment loss directly for all financial assets with the exception of
trade receivables where the carrying amount is reduced through the use of an allowance account. When a trade receivable is
uncollectible, it is written off against the allowance account. Subsequent recoveries of amounts previously written off are credited
against the allowance account. Changes in the carrying amount of the allowance account are recognised in profit or loss.
If, in a subsequent period, the amount of the impairment loss decreases and the decrease can be related objectively to an event
occurring after the impairment was recognised, the previously recognised impairment loss is reversed through profit or loss to
the extent the carrying amount of the investment at the date the impairment is reversed does not exceed what the amortised
cost would have been had the impairment not been recognised.
(f) FOREIGN CURRENCY
Foreign currency transactions
All foreign currency transactions during the financial year are brought to account using the exchange rate in effect at the date of
the transaction. Foreign currency monetary items at reporting date are translated at the exchange rate existing at reporting date.
Non-monetary assets and liabilities carried at fair value that are denominated in foreign currencies are translated at the rates
prevailing at the date when the fair value was determined.
Exchange differences are recognised in profit or loss in the period in which they arise except that:
i. exchange differences on transactions entered into in order to hedge certain foreign currency risks ; and
ii. exchange differences on monetary items receivable from or payable to a foreign operation for which settlement is neither
planned or likely to occur, which form part of the net investment in a foreign operation, are recognised in the foreign currency
translation reserve and recognised in profit or loss on disposal of the net investment.
35
CASH
CONVERTERS
INTERNATIONAL
LIMITED
ANNUAL
REPORT
2009
Foreign operations
On consolidation, the assets and liabilities of the consolidated entity’s overseas operations are translated at exchange rates
prevailing at the reporting date. Income and expense items are translated at the average exchange rates for the period unless
exchange rates fluctuate significantly. Exchange differences arising, if any, are recognised in the foreign currency translation
reserve, and recognised in profit or loss on disposal of the foreign operation.
Goodwill and fair value adjustments arising on the acquisition of a foreign entity on or after the date of transition to A-IFRS are
treated as assets and liabilities of the foreign entity and translated at exchange rates prevailing at the reporting date.
(g) GOODS AND SERVICES TAX
Revenues, expenses and assets are recognised net of the amount of goods and services tax (GST), except:
i. where the amount of GST incurred is not recoverable from the taxation authority, it is recognised as part of the cost of
acquisition of an asset or as part of an item of expense; or
ii. for receivables and payables which are recognised inclusive of GST.
The net amount of GST recoverable from, or payable to, the taxation authority is included as part of receivables or payables.
Cash flows are included in the cash flow statement on a gross basis. The GST component of cash flows arising from investing
and financing activities which is recoverable from, or payable to, the taxation authority is classified as operating cash flows.
(h) IMPAIRMENT OF OTHER TANGIBLE AND INTANGIBLE ASSETS
At each reporting date, the consolidated entity reviews the carrying amounts of its tangible and intangible assets to determine
whether there is any indication that those assets have suffered an impairment loss. If any such indication exists, the recoverable
amount of the asset is estimated in order to determine the extent of the impairment loss (if any). Where the asset does not
generate cash flows that are independent from other assets, the consolidated entity estimates the recoverable amount of the
cash-generating unit to which the asset belongs.
Recoverable amount is the higher of fair value less costs to sell and value in use. In assessing value in use, the estimated future
cash flows are discounted to their present value using a pre-tax discount rate that reflects current market assessments of the
time value of money and the risks specific to the asset for which the estimates of future cash flows have not been adjusted.
If the recoverable amount of an asset (or cash-generating unit) is estimated to be less than its carrying amount, the carrying
amount of the asset (cash-generating unit) is reduced to its recoverable amount. An impairment loss is recognised in profit or
loss immediately.
Where an impairment loss subsequently reverses, the carrying amount of the asset (cash-generating unit) is increased to the
revised estimate of its recoverable amount, but only to the extent that the increased carrying amount does not exceed the
carrying amount that would have been determined had no impairment loss been recognised for the asset (cash-generating unit)
in prior years. A reversal of an impairment loss is recognised in profit or loss immediately.
(i) INCOME TAX
Current tax
Current tax is calculated by reference to the amount of income taxes payable or recoverable in respect of the taxable profit or
tax loss for the period. It is calculated using tax rates and tax laws that have been enacted or substantively enacted by reporting
date. Current tax for current and prior periods is recognised as a liability (or asset) to the extent that it is unpaid (or refundable).
Deferred tax
Deferred tax is accounted for using the comprehensive balance sheet liability method in respect of temporary differences arising
from differences between the carrying amount of assets and liabilities in the financial statements and the corresponding tax base
of those items.
In principle, deferred tax liabilities are recognised for all taxable temporary differences. Deferred tax assets are recognised to the
extent that it is probable that sufficient taxable amounts will be available against which deductible temporary differences or
unused tax losses and tax offsets can be utilised. However, deferred tax assets and liabilities are not recognised if the temporary
differences giving rise to them arise from the initial recognition of assets and liabilities (other than as a result of a business
combination) which affects neither taxable income nor accounting profit. Furthermore a deferred tax liability is not recognised in
relation to the temporary differences arising from the initial recognition of goodwill.

N o t e s t o t h e F i n a n c i a l S t a t e m e n t s
36
1. SUMMARY OF ACCOUNTING POLICIES (continued)
(i) INCOME TAX (continued)
Deferred tax (continued)
Deferred tax liabilities are recognised for taxable temporary differences arising on investments in subsidiaries, branches,
associates and joint ventures except where the consolidated entity is able to control the reversal of the temporary differences
and it is probable that the temporary differences will not reverse in the foreseeable future.
Deferred tax assets arising from deductible temporary differences associated with these investments and interests are only
recognised to the extent that it is probable that there will be sufficient taxable profits against which to utilise the benefits of the
temporary differences and they are expected to reverse in the foreseeable future.
Deferred tax assets and liabilities are measured at the tax rates that are expected to apply to the period(s) when the asset and
liability giving rise to them are realised or settled, based on tax rates (and tax laws) that have been enacted or substantively
enacted by reporting date. The measurement of deferred tax liabilities and assets reflects the tax consequences that would
follow from the manner in which the consolidated entity expects, at the reporting date, to recover or settle the carrying amount
of its assets and liabilities.
Deferred tax assets and liabilities are offset when they relate to income taxes levied by the same taxation authority and the
company/consolidated entity intends to settle its current tax assets and liabilities on a net basis.
Current and deferred tax for the period
Current and deferred tax is recognised as an expense or income in the income statement, except when it relates to items
credited or debited directly to equity, in which case the deferred tax is also recognised directly in equity, or where it arises from
the initial accounting for a business combination, in which case it is taken into account in the determination of goodwill or excess.
Tax consolidation
The company and its wholly-owned Australian resident entities are part of a tax-consolidated group under Australian taxation
law. Cash Converters International Limited is the head entity in the tax-consolidated group. Tax expense/income, deferred tax
liabilities and deferred tax assets arising from temporary differences of the members of the tax-consolidated group are
recognised in the separate financial statements of the members of the tax-consolidated group using the ‘separate taxpayer
within group’ approach. Current tax liabilities and assets and deferred tax assets arising from unused tax losses and tax credits
of the members of the tax-consolidated group are recognised by the company (as head entity in the tax-consolidated group).
Due to the existence of a tax funding arrangement between the entities in the tax-consolidated group, amounts are recognised
as payable to or receivable by the company and each member of the group in relation to the tax contribution amounts paid or
payable between the parent entity and the other members of the tax-consolidated group in accordance with the arrangement.
Where the tax contribution amount recognised by each member of the tax-consolidated group for a particular period is different
to the aggregate of the current tax liability or asset and any deferred tax asset arising from unused tax losses and tax credits in
respect of that period, the difference is recognised as a contribution from (or distribution to) equity participants.
(j) INTANGIBLE ASSETS
Trade names
Trade names are recorded at cost less accumulated amortisation and impairment. Amortisation is charged on a straight line
basis over their estimated useful lives of 100 years. The estimated useful life and amortisation method is reviewed at the end of
each annual reporting period.
Intangible assets acquired in a business combination
All potential intangible assets including software, acquired in a business combination are identified and recognised separately
from goodwill where they satisfy the definition of an intangible asset and their fair value can be measured reliably.

37
CASH
CONVERTERS
INTERNATIONAL
LIMITED
ANNUAL
REPORT
2009
Web site development costs
Development expenditure incurred is recognized when it is possible that future economic benefits that are attributable to the
asset will flow to the entity.
Following initial recognition of the development expenditure, the cost model is applied requiring the asset to be carried at cost
less any accumulated amortisation and accumulated impairment losses.
Any expenditure carried forward is amortised on a straight line basis over the estimated useful life of 5 years.
Goodwill
Goodwill acquired in a business combination is initially measured at its cost, being the excess of the cost of the business
combination over the acquirer’s interest in the net fair value of the identifiable assets, liabilities and contingent liabilities
recognised. Goodwill is subsequently measured at its cost less any impairment losses.
For the purpose of impairment testing, goodwill is allocated to each of the Group’s cash-generating units (CGUs), or groups of
CGUs, expected to benefit from the synergies of the business combination. CGUs (or groups of CGUs) to which goodwill has
been allocated are tested for impairment annually, or more frequently if events or changes in circumstances indicate that goodwill
might be impaired.
If the recoverable amount of the CGU (or group of CGUs) is less than the carrying amount of the CGU (or groups of CGUs), the
impairment loss is allocated first to reduce the carrying amount of any goodwill allocated to the CGU (or groups of CGUs) and
then to the other assets of the CGU (or groups of CGUs) pro-rata on the basis of the carrying amount of each asset in the CGU
(or groups of CGUs). An impairment loss recognised for goodwill is recognised immediately in profit or loss and is not reversed
in a subsequent period.
On disposal of an operation within a CGU, the attributable amount of goodwill is included in the determination of the profit or
loss on disposal of the operation.
(k) INVENTORIES
Inventories are valued at the lower of cost and net realisable value. Costs, including an appropriate portion of fixed and variable
overhead expenses, are assigned to inventory on hand by the method most appropriate to each particular class of inventory,
with the majority being valued on a first in first out basis. Net realisable value represents the estimated selling price less all
estimated costs of completion and costs necessary to make the sale.
(l) LEASED ASSETS
Leases are classified as finance leases whenever the terms of the lease transfer substantially all the risks and rewards of
ownership to the lessee. All other leases are classified as operating leases.
Consolidated entity as lessee
Assets held under finance leases are initially recognised at their fair value or, if lower, at amounts equal to the present value of
the minimum lease payments, each determined at the inception of the lease. The corresponding liability to the lessor is included
in the balance sheet as a finance lease obligation.
Lease payments are apportioned between finance charges and reduction of the lease obligation so as to achieve a constant
rate of interest on the remaining balance of the liability. Finance charges are charged directly against income.
Finance leased assets are amortised on a straight line basis over the estimated useful life of the asset.
Operating lease payments are recognised as an expense on a straight-line basis over the lease term, except where another
systematic basis is more representative of the time pattern in which economic benefits from the leased asset are consumed.
(m) PAYABLES
Trade payables and other accounts payable are recognised when the consolidated entity becomes obliged to make future
payments resulting from the purchase of goods and services.

N o t e s t o t h e F i n a n c i a l S t a t e m e n t s
38
1. SUMMARY OF ACCOUNTING POLICIES (continued)
(n) PRINCIPLES OF CONSOLIDATION
The consolidated financial statements are prepared by combining the financial statements of all the entities that comprise the
consolidated entity, being the company (the parent entity) and its subsidiaries as defined in Accounting Standard AASB 127
‘Consolidated and Separate Financial Statements’. A list of subsidiaries appears in note 22 to the financial statements.
Consistent accounting policies are employed in the preparation and presentation of the consolidated financial statements.
On acquisition, the assets, liabilities and contingent liabilities of a subsidiary are measured at their fair values at the date of
acquisition. Any excess of the cost of acquisition over the fair values of the identifiable net assets acquired is recognised as
goodwill. If, after reassessment, the fair values of the identifiable net assets acquired exceeds the cost of acquisition, the
deficiency is credited to profit and loss in the period of acquisition.
The interest of minority shareholders is stated at the minority’s proportion of the fair values of the assets and liabilities recognised.
The consolidated financial statements include the information and results of each subsidiary from the date on which the
company obtains control and until such time as the company ceases to control such entity.
In preparing the consolidated financial statements, all intercompany balances and transactions, and unrealised profits arising
within the consolidated entity are eliminated in full.
(o) PLANT AND EQUIPMENT
Plant and equipment, leasehold improvements and equipment under finance lease are stated at cost less accumulated
depreciation and impairment. Cost includes expenditure that is directly attributable to the acquisition of the item. In the event
that settlement of all or part of the purchase consideration is deferred, cost is determined by discounting the amounts payable
in the future to their present value as at the date of acquisition.
Depreciation is provided on plant and equipment. Depreciation is calculated on a straight line basis so as to write off the net cost
or other revalued amount of each asset over its expected useful life to its estimated residual value. Leasehold improvements are
depreciated over the period of the lease or estimated useful life, whichever is the shorter, using the straight line method. The
estimated useful lives, residual values and depreciation method is reviewed at the end of each annual reporting period.
The following estimated useful lives are used in the calculation of depreciation:
Leasehold improvements 8 years
Plant and equipment 5 years
Equipment under finance lease 5 years
Fixtures & fittings 8 years
(p) PROVISIONS
Provisions are recognised when the consolidated entity has a present obligation, the future sacrifice of economic benefits is
probable, and the amount of the provision can be measured reliably.
The amount recognised as a provision is the best estimate of the consideration required to settle the present obligation at
reporting date, taking into account the risks and uncertainties surrounding the obligation. Where a provision is measured using
the cashflows estimated to settle the present obligation, its carrying amount is the present value of those cashflows.
When some or all of the economic benefits required to settle a provision are expected to be recovered from a third party, the
receivable is recognised as an asset if it is virtually certain that recovery will be received and the amount of the receivable can
be measured reliably.

39
CASH
CONVERTERS
INTERNATIONAL
LIMITED
ANNUAL
REPORT
2009
(q) REVENUE RECOGNITION
Income from franchisees is recognised as follows:
Franchise sales/renewals
Fees in respect of the initial sale of a franchise licence and fees from the renewal of a franchise licence are recognised on an
accruals basis. Income is recognised in full upon the sale’s completion or upon the renewal of the licence as all material services
and/or conditions relating to the sale or renewal have been fully performed or satisfied by the economic entity.
Continuing franchise fees/levies
Continuing franchise fees/levies in respect of particular services, are recognised as income when they become due and
receivable and the costs in relation to the income are recognised as expenses when incurred.
Instalment credit loan interest
Interest received from franchisees in respect of instalment credit loans is recognised as income when earned. The effective
interest rate method has been used to allocate fixed interest to accounting periods.
Personal loan interest
Interest revenue in relation to personal loans is accrued on a time basis by reference to the principal outstanding and at the
effective interest rate applicable, which is the rate that exactly discounts estimated future cash receipts through the expected
life of the financial asset to that asset net carrying amount.
Loan establishment fee revenue
Establishment fees are deferred and recognised over the life of the loans at the effective interest rate applicable so as to
recognise revenue at a constant rate to the underlying principal over the expected life of the loan.
Other categories of revenue
Other categories of revenue, such as retail wholesale sales, corporate store revenue, cheque cashing commission and financial
services commission, are recognised when the company has passed control of the goods to the buyer or when the services are
provided. Bank interest and rent are recognised as earned on an accruals basis.
(r) SHARE-BASED PAYMENTS
All equity-settled share-based payments were granted and vested before 7 November 2002. The consolidated entity has elected
not to expense these options, as permitted on first time adoption of A-IFRS.
(s) BUSINESS COMBINATIONS
Acquisitions of subsidiaries and businesses are accounted for using the purchase method. The cost of the business combination
is measured as the aggregate of the fair values (at the date of exchange) of assets given, liabilities incurred or assumed, and
equity instruments issued by the Group in exchange for control of the acquiree, plus any costs directly attributable to the
business combination. The acquiree’s identifiable assets, liabilities and contingent liabilities that meet the conditions for
recognition under AASB 3 ‘Business Combinations’ are recognised at their fair values at the acquisition date, except for non-
current assets (or disposal groups) that are classified as held for sale in accordance with AASB 5 ‘Non-current Assets Held for
Sale and Discontinued Operations’, which are recognised and measured at fair value less costs to sell.
Goodwill arising on acquisition is recognised as an asset and initially measured at cost, being the excess of the cost of the
business combination over the Group’s interest in the net fair value of the identifiable assets, liabilities and contingent liabilities
recognised. If, after reassessment, the Group’s interest in the net fair value of the acquiree’s identifiable assets, liabilities and
contingent liabilities exceeds the cost of the business combination, the excess is recognised immediately in profit or loss.
The interest of minority shareholders in the acquiree is initially measured at the minority’s proportion of the net fair value of the
assets, liabilities and contingent liabilities recognised.

N o t e s t o t h e F i n a n c i a l S t a t e m e n t s
40
1. SUMMARY OF ACCOUNTING POLICIES (continued)
(s) BUSINESS COMBINATIONS (continued)
Standards and Interpretations in issue not yet adopted
At the date of authorisation of the financial report, a number of Standards and Interpretations including those Standards and
Interpretations issued by the IASB/IFRIC where an Australian equivalent has not been made by the AASB, were in issue but not
yet effective.
Initial application of the following Standards will not affect any of the amounts recognised in the financial report, but will change
the disclosures presently made in relation to the consolidated entity’s and the company’s financial report:
Effective for annual Expected to bereporting periods initially applied in the
Standard beginning on or after financial year ending
• AASB 101 ‘Presentation of Financial Statements’(revised September 2007), AASB 2007-8 ‘Amendmentsto Australian Accounting Standards arising from AASB 101’ 1 January 2009 30 June 2010
• AASB 8 ‘Operating Segments’, AASB 2007-3 ‘Amendmentsto Australian Accounting Standards arising from AASB 8’ 1 January 2009 30 June 2010
• AASB 2009-2 Amendments to Australian AccountingStandards – Improving Disclosures about Financial Instruments 1 January 2009 30 June 2010
Management is currently evaluating the impact that the initial application of the following Standards and Interpretations will have
on the financial report of the consolidated entity and the company:
Effective for annual Expected to bereporting periods initially applied in the
Standard/Interpretation beginning on or after financial year ending
• AASB 123 ‘Borrowing Costs’ (revised), AASB 2008-6‘Amendments to Australian Accounting Standards arisingfrom AASB 123’ 1 January 2009 30 June 2010
• AASB 3 ‘Business Combinations’ (2008), AASB 127 AASB 3‘Consolidated and Separate Financial Statements’ and (business combinationsAASB 2008-3 ‘Amendments to Australian Accounting Standards occurring after the beginningarising from AASB 3 and AASB 127’ of annual reporting periods
beginning 1 July 2009),AASB 127 andAASB 2009-3(1 July 2009) 30 June 2010
• AASB 2008-1 ‘Amendments to Australian Accounting Standard– Share-based Payments: Vesting Conditions and Cancellations’ 1 January 2009 30 June 2010
• AASB 2008-5 ‘Amendments to Australian Accounting Standardsarising from the Annual Improvements Project’ 1 July 2009 30 June 2010
• AASB 2008-6 ‘Further Amendments to Australian AccountingStandards arising from the Annual Improvements Project’ 1 January 2009 30 June 2010
• AASB 2008-7 Amendments to Australian Accounting Standards– Cost of an Investment in a Subsidiary, Jointly ControlledEntity or Associate 1 January 2010 30 June 2011
• AASB 2009-5 Further Amendments to Australian AccountingStandards arising from the Annual Improvements Process
AASB 3 ‘Business Combinations’ 2008
From 1 July 2009, the material impact of AASB 3 Business combinations (2009) will be increased volatility of the consolidated
entity’s earnings as transaction costs of business combinations and changes in valuation of contingent settlement arrangements
will be recognised through the income statement, rather than capitalised into the investment value and recorded in goodwill.

41
CASH
CONVERTERS
INTERNATIONAL
LIMITED
ANNUAL
REPORT
2009
Consolidated Company2009 2008 2009 2008$ $ $ $
2. PROFIT FROM OPERATIONS
(a) REVENUE
Revenue from continuing operations consisted of the following items:
Revenue
Weekly franchise fees 7,650,729 7,598,199 - -
Initial fees 179,075 463,448 - -
Licence fees 15,000 81,191 - -
Ten-year renewals 412,273 162,736 - -
Ten-year renewals – renewed at six years - - - -
Sub-franchisor licence sales 137,776 - - -
Advertising levies 393,650 374,826 - -
Instalment credit loan interest 270,417 327,237 - -
Personal loan interest 15,169,863 13,005,819 - -
Loan establishment fees 7,708,653 6,236,861 - -
Recovery of bad debt 884,588 549,259 - -
Retail wholesale sales 5,308,920 6,675,497 - -
Cheque cashing commission 1,081,461 1,145,638 - -
Training levies 968,248 946,265 - -
Corporate store revenue 33,564,099 17,075,801 - -
Computer levy 1,614,406 1,412,175 - -
Financial services commission and brokerage 18,030,950 17,452,054 - -
Rent received 67,987 69,772 - -
Interest revenue 475,581 654,291 - -
93,933,406 74,231,069 - -
Dividend revenue from subsidiary - - 17,480,013 7,229,442
Management fees from controlled entity - - 655,295 975,000
Other revenue 464,494 174,813 - -
464,494 174,813 18,135,308 8,204,442
94,397,900 74,405,882 18,135,308 8,204,442

N o t e s t o t h e F i n a n c i a l S t a t e m e n t s
42
2. PROFIT FROM OPERATIONS (continued)
Consolidated Company2009 2008 2009 2008$ $ $ $
(b) PROFIT BEFORE INCOME TAX
Profit before income tax has been arrived at
after charging the following expenses:
Changes in inventories (cost of sales) 23,972,266 16,745,147 - -
Area agents fees / commissions 4,941,768 5,709,839 - -
Depreciation of plant and equipment 840,278 601,215 - -
Amortisation of intangibles 321,790 281,097 - -
Rental expense on operating leases 3,912,899 2,413,997 - -
Finance costs
Interest 1,084,969 955,470 - -
Finance lease charges 50,256 7,558 - -
Total finance costs 1,135,225 963,028 - -
Provision for employee benefits 209,609 74,549 - -
Employee expense 1,418,787 891,123 - -
Bad debts written off
- Trade debtors/instalment loans
and personal loans 4,819,032 4,302,072 - -
Amounts received or due and receivable,
by Deloitte Touche Tohmatsu for
(these amounts are paid on behalf of the
Company by a controlled entity):
- Auditing the financial statements 343,615 320,522 - -
- Other services 206,488 71,234 - -
- Due diligence/completion accounts - - - -
Profit before income tax has been arrived at after
crediting/(charging) the following gains and losses
from continuing operations:
Loss on disposal of plant and equipment - (43,125) - -

43
CASH
CONVERTERS
INTERNATIONAL
LIMITED
ANNUAL
REPORT
2009
Consolidated Company2009 2008 2009 2008$ $ $ $
3. INCOME TAX EXPENSE
(a) INCOME TAX RECOGNISED IN PROFIT OR LOSS
Tax expense comprises:
Current tax expense 7,176,157 6,472,689 - -
Adjustment recognised in the current year
in relation to the current tax of prior years (38,079) 66,659 - -
Deferred tax expense relating to the origination
and reversal of temporary differences 14,446 (115,365) - -
Total tax expense 7,152,524 6,423,983 - -
Attributable to:
Continuing operations 7,152,524 6,423,983 - -
The prima facie income tax expense on pre-tax
accounting profit from operations reconciles
to the income tax expense in the financial statements
as follows:
Profit from continuing operations 23,307,232 21,598,569 17,480,013 7,229,442
Income tax expense calculated at 30% 6,992,170 6,479,571 5,244,004 2,168,833
Non-deductible expenses 247,81 27,523 - -
Unused tax losses and tax offsets
not recognised as deferred tax assets - - - -
Utilisation of prior year tax losses not previously
recognised as deferred tax assets - - - -
Intra-group dividends - - (5,244,004) (2,168,833)
Impact of items recognised through equity - (88,662) - -
Other (87,465) - - -
7,152,524 6,418,432 - -
Under provision of income tax in previous year - 5,551 - -
7,152,524 6,423,983 - -
(b) CURRENT TAX LIABILITIES
Income tax payable attributable to:
Parent entity - - - -
Entities in the tax-consolidated group 2,697,371 2,552,283 2,697,371 2,552,283
Overseas subsidiaries 600,821 196,045 - -
3,298,192 2,748,328 2,697,371 2,552,283
(c) DEFERRED TAX BALANCES
Deferred tax assets comprise:
Provisions 1,002,702 1,078,523 - -
Deferred income 393,200 419,785 - -
Share issue costs 172,770 260,236 172,770 260,236
Other 298,319 92,741 - -
1,866,991 1,851,285 172,770 260,236
Deferred tax liabilities comprise:
Plant and equipment 137,219 70,773 - -
Intangible assets 1,085,069 1,098,497 - -
Other 47,412 103,698 - -
1,269,700 1,272,968 - -

N o t e s t o t h e F i n a n c i a l S t a t e m e n t s
44
3. INCOME TAX EXPENSE (continued)
Consolidated Company2009 2008 2009 2008$ $ $ $
(d) INCOME TAX RECOGNISED DIRECTLY IN EQUITY
The following deferred amounts were credited
directly to equity during the period:
Deferred tax
Share issue expenses deductible over 5 years - - - -
(e) UNRECOGNISED DEFERRED TAX BALANCES
The following deferred tax assets have not
been brought to account as assets:
Tax losses – revenue 166,511 180,429 - -
Tax losses – capital 2,721,601 2,721,601 2,721,601 2,721,601
2,888,112 2,902,030 2,721,601 2,721,601
(f) TAX CONSOLIDATION
Relevance of tax consolidation to the consolidated entity
The company and its wholly-owned Australian resident entities have formed a tax-consolidated group with effect from 1 July
2003 and are therefore taxed as a single entity from that date. The head entity within the tax-consolidated group is Cash
Converters International Limited. The members of the tax-consolidated group are identified in note 22.
Nature of tax funding arrangements and tax sharing agreements
Entities within the tax-consolidated group have entered into a tax funding arrangement and a tax-sharing agreement with the
head entity. Under the terms of the tax funding arrangement, Cash Converters International Limited and each of the entities in
the tax-consolidated group has agreed to pay a tax equivalent payment to or from the head entity, based on the current tax
liability or current tax asset of the entity. Such amounts are reflected in amounts receivable from or payable to other entities in
the tax-consolidated group.
The tax sharing agreement entered into between members of the tax-consolidated group provides for the determination of the
allocation of income tax liabilities between the entities should the head entity default on its tax payment obligations. No amounts
have been recognized in the financial statements in respect of this agreement as payment of any amounts under the tax sharing
agreement is considered remote.
Consolidated Company2009 2008 2009 2008$ $ $ $
4. REMUNERATION OF AUDITORS
Auditor of the parent entity
Audit or review of the financial report 343,615 320,522 - -
Taxation services 60,358 53,334 - -
Other non-audit services 146,130 17,900 - -
550,103 391,756 - -
The auditor of Cash Converters International Limited is Deloitte Touche Tohmatsu. The auditors remuneration for Cash
Converters International Limited is borne by Cash Converters Pty Ltd.

45
CASH
CONVERTERS
INTERNATIONAL
LIMITED
ANNUAL
REPORT
2009
Consolidated Company2009 2008 2009 2008$ $ $ $
5. CASH AND CASH EQUIVALENTS
On hand 1,006,682 460,789 38,661 -
In bank 5,996,289 15,861,413 - -
7,002,971 16,322,202 38,661 -
6. TRADE AND OTHER RECEIVABLES
Current
Trade receivables (i) 6,181,129 4,590,840 - -
Allowance for doubtful debts - - - -
6,181,129 4,590,840 - -
Instalment credit loans (ii) 500,425 570,755 - -
Allowance for doubtful debts - - - -
500,425 570,755 - -
6,681,554 5,161,595 - -
Personal short term loans (iii) 27,248,628 16,450,444 - -
Allowance for doubtful debts (2,177,967) (2,169,879) - -
25,070,661 14,280,565 - -
31,752,215 19,442,160 - -
Non-current
Instalment credit loans (ii) 1,368,700 1,950,157 - -
Loans to controlled entities (iv) - - 30,707,733 17,994,425
1,368,700 1,950,157 30,707,733 17,994,425
(i) Trade debtors include weekly franchise fees, sub-master licence sales and development agent fees outstanding. Where the
collection of the debtor is doubtful an allowance for doubtful debts is recognised, with no allowance being recognised at
either 30 June 2009 or 2008. The average credit period on sales is 30 days. No interest is charged for the first 30 days
from the date of the invoice. Thereafter, interest is charged at 2% per annum on the outstanding balance.
ii) The instalment credit loans relate to Cash Converters Finance Corporation Limited and have a maximum maturity of 5
years. Interest rates are fixed at the time of entering into the contract at the rate of 12% or 13% depending on the repayment
options agreed with each franchisee.
To secure the instalments credit loans a fixed and floating charge is held over the franchisee’s store. Where collection of
the debtor is doubtful and the assessed value of the property is less than the amount outstanding, an allowance for doubtful
debtors is recognised for the shortfall, with no allowance being recognised at either 30 June 2009 or 30 June 2008.
iii) The credit period provided in relation to Personal short term loans varies from 30 days to 7 months. Interest is charged on
these loans at a fixed rate which varies dependent on the state of origin. An allowance has been made for estimated
unrecoverable amounts arising from loans already issued, which has been determined by reference to past default
experience. Before accepting any new customers, the consolidated entity uses an external scoring system to assess the
potential customer’s credit quality and define credit limits by customer. There is no concentration of credit risk within the
personal loan book.
iv) The loans to controlled entities have no specific terms or conditions.

N o t e s t o t h e F i n a n c i a l S t a t e m e n t s
46
6. TRADE AND OTHER RECEIVABLES (continued)
Consolidated Company2009 2008 2009 2008$ $ $ $
Ageing of past due but not impaired
60 – 90 days 965,114 801,599 - -
90 – 120 days 286,526 276,847 - -
Total 1,251,640 1,078,446 - -
Personal short term loans: movement
in the allowance for doubtful debts
Balance at the beginning of the year 2,169,879 1,903,354 - -
Balance recognised on acquisition of business - 162,000
Impairment losses recognised on receivables 3,846,170 3,811,987 - -
Amounts written off as uncollectible (4,819,032) (4,302,072) - -
Amounts recovered during the year 980,950 594,610 - -
Impairment losses reversed - - - -
Unwind of discount - - - -
Balance at the end of the year 2,177,967 2,169,879 - -
In determining the recoverability of a personal loan, the consolidated entity considers any change in the credit quality of the
receivable from the date credit was initially granted up to the reporting date. The concentration of credit risk is limited due to the
customer base being large and unrelated. Accordingly, the directors believe that there is no further credit provision required in
excess of the allowance for doubtful debts.
Ageing of impaired personal short term loans:
Consolidated Company2009 2008 2009 2008$ $ $ $
60 - 90 days 825,064 606,012 - -
90 - 120 days - - - -
Total 825,064 606,012 - -
7. INVENTORIES
New and pre-owned goods
at cost 6,958,592 3,306,989 - -
8. OTHER ASSETS
Current
Prepayments 853,164 281,553 - -

47
CASH
CONVERTERS
INTERNATIONAL
LIMITED
ANNUAL
REPORT
2009
Consolidated
Leasehold Plant and Equipmentimprovements equipment under finance
at cost at cost lease at cost TotalNote $ $ $ $
9. PLANT AND EQUIPMENT
Gross carrying amount
Balance as at 1 July 2007 145,498 3,263,286 158,144 3,566,928
Acquisition through business combinations - 1,289,540 - 1,289,540
Additions 38,287 705,405 - 743,682
Disposals - (105,207) - (105,207)
Net foreign currency exchange differences (15,840) (207,265) - (223,105)
Balance as at 30 June 2008 167,945 4,945,759 158,144 5,271,848
Acquisition through business combinations 28,629 996,390 - 1,025,019
Additions 17,558 1,843,489 - 1,861,047
Disposals - (360,022) (158,144) (518,166)
Net foreign currency exchange differences (1,716) (25,944) - (27,660)
Balance as at 30 June 2009 212,416 7,399,672 - 7,612,088
Accumulated depreciation
Balance as at 1 July 2007 69,071 2,026,404 158,144 2,253,619
Disposals - (55,050) - (55,050)
Depreciation expense 22,800 578,415 - 601,215
Net foreign currency exchange differences (7,296) (100,941) - (108,237)
Balance as at 30 June 2008 84,575 2,448,828 158,144 2,691,547
Disposals - (360,022) (158,144) (518,166)
Depreciation expense 23,481 816,796 - 840,278
Net foreign currency exchange differences (2,262) (32,731) - (34,993)
Balance as at 30 June 2009 105,794 2,872,871 - 2,978,665
Net book value
As at 30 June 2008 83,370 2,496,931 - 2,580,301
As at 30 June 2009 106,622 4,526,801 - 4,633,423
Note: The Company does not own any plant and equipment in its own right.
Consolidated Company2009 2008 2009 2008$ $ $ $
10. TRADE AND OTHER PAYABLES
Current
Trade payables 3,249,157 2,503,009 - 769,296
Accruals 4,607,814 3,315,004 - -
Unsecured notes 484,999 900,183 - -
Other 25,000 25,000 - -
8,366,970 6,743,196 - 769,296
The consolidated entity has financial risk management policies in place to ensure that all payables are paid within the allowed
credit period in order to avoid the payment of interest on outstanding accounts. Unsecured notes do not earn interest and are
repayable on demand should a franchisee leave the franchise network, but otherwise will be credited to the consolidated entity’s
income in payment of a noteholder’s franchise renewal fee, at the end of the initial franchise term.

N o t e s t o t h e F i n a n c i a l S t a t e m e n t s
48
Consolidated Company2009 2008 2009 2008$ $ $ $
11. BORROWINGS
(all borrowings are secured)
Current
At amortised cost
Bank overdraft (i) 657,933 1,037,657 - -
Loans (i) 2,975,774 3,427,695 2,600,000 2,160,000
Hire purchase and lease liabilities (note 19) (ii) 308,605 73,673 - -
3,942,312 4,539,025 2,600,000 2,160,000
Non-current
At amortised cost
Loans (i) 11,830,324 7,460,000 10,559,000 7,460,000
Hire purchase and lease liabilities (note 19) (ii) 1,147,710 229,721 - -
12,978,034 7,689,721 10,559,000 7,460,000
Financing arrangements
Unrestricted access was available at
balance date to the following lines of credit:
Credit standby arrangements
Total facilities
Bank overdrafts 1,376,436 1,425,000 - -
Variable rate bill facility 13,159,000 10,700,000 13,159,000 10,700,000
Term loans 1,647,098 1,920,000 - -
16,182,532 14,045,000 13,159,000 10,700,000
Used at balance date
Bank overdrafts 657,933 1,037,657 - -
Variable rate bill facility 13,159,000 9,620,000 13,159,000 9,620,000
Term loans 1,647,098 1,267,695 - -
15,464,031 11,925,352 13,159,000 9,620,000
Unused at balance date
Bank overdrafts 750,000 387,343 - -
Variable rate bill facility - 1,080,000 - 1,080,000
Term loans - 652,305 - -
750,000 2,119,648 - 1,080,000
(i) The bank overdraft and the loans payable are secured by a fixed and floating charge over the total assets of the entity and
a cross guarantee from the parent entity. There have been no breaches of loan covenants during the current or prior period.
(ii) Hire purchase and lease liabilities are effectively secured as the rights to the leased asset revert to the lessor in the event
of default.
The bank overdraft facilities may be drawn at any time and may be terminated by the bank without notice. Interest rates are
variable and are currently 2% above the bank base rate.

49
CASH
CONVERTERS
INTERNATIONAL
LIMITED
ANNUAL
REPORT
2009
Consolidated Company2009 2008 2009 2008$ $ $ $
12. PROVISIONS
Current
Employee benefits 1,123,079 820,046 - -
Fringe benefits tax 4,499 3,002 - -
1,127,578 823,048 - -
13. DEFERRED ESTABLISHMENT FEES
Deferred establishment fees 1,310,668 1,399,282 - -
Deferred establishment fees relate to establishment fees charged on personal loans.
ConsolidatedTrade names Software Total
$ $ $
14. OTHER INTANGIBLE ASSETS
Gross carrying amount
Balance as at 1 July 2007 13,002,835 1,626,665 14,629,500
Acquisitions through business combinations - - -
Additions - 257,364 257,364
Disposals - - -
Balance as at 1 July 2008 13,002,835 1,884,029 14,886,864
Additions - 919,021 919,021
Disposals - (388,481) (388,481)
Balance as at 30 June 2009 13,002,835 2,414,569 15,417,404
Amortisation
Balance as at 1 July 2007 3,865,358 863,693 4,729,051
Amortisation charge 94,332 186,765 281,097
Disposals - - -
Balance as at 1 July 2008 3,959,690 1,050,458 5,010,148
Amortisation charge 94,332 227,458 321,790
Disposals - (388,481) (388,481)
Balance as at 30 June 2009 4,054,022 889,435 4,943,457
Net book value
At the beginning of the financial year 9,043,145 833,571 9,876,716
At the end of the financial year 8,948,813 1,525,134 10,473,947
Note: The Company does not own any intangible assets in its own right.
Amortisation expense is included in the line item ‘depreciation and amortisation expenses’ in the income statement.
Trade names are stated at cost to the consolidated entity and relates to amounts recognised either through the buy-back of
overseas sub-master licence rights, or through direct acquisition of regional sub-master rights in Australia by Cash Converters
Pty Ltd. The depreciable amount of all trade names is amortised on a straight-line basis over their economic useful life, where
material. The economic useful life of the trade names has been assessed on an individual asset basis but not more than 100
years from the date of acquisition. The directors review the economic useful life on a regular basis.

N o t e s t o t h e F i n a n c i a l S t a t e m e n t s
50
Consolidated Company2009 2008 2009 2008
Note $ $ $ $
15. GOODWILL
Gross carrying amount
Balance at beginning of financial year 43,650,114 34,073,651 - -
Additional amounts recognised from business
combinations occurring during the period 29 6,361,122 9,878,183 - -
Foreign exchange movement (138,066) (301,720) - -
Balance at the end of the financial year 49,873,170 43,650,114 - -
Accumulated impairment losses
Balance at the beginning of the financial year - - - -
Impairment losses for the year - - - -
Balance at end of financial year - - - -
Net book value
At the beginning of the financial year 43,650,114 34,073,651 - -
At the end of the financial year 49,873,170 43,650,114 - -
Allocation of goodwill to cash-generating units
Goodwill has been allocated for impairment testing purposes to the following cash-generating units:
• Financing - MON-E
• Financing - Safrock
• Corporate Stores (Australia)
• Corporate Stores (UK)
The carrying amount of goodwill allocated to cash-generating units that are significant individually or in aggregate is as follows:
Consolidated Consolidated2009 2008$ $
MON-E 17,292,967 17,292,967
Safrock 16,780,684 16,780,684
Corporate Stores (Australia) 11,222,381 7,193,512
Corporate Stores (UK) 4,577,138 2,382,951
49,873,170 43,650,114
MON-E
The recoverable amount for MON-E is determined based on a value in use calculation which uses cash flow projections based
on financial budgets approved by management covering a one-year period, and a discount rate of 15% per annum. Cash flow
projections during the budget period take into account management’s assessment of the impact of the micro-lending legislation
recently announced in Queensland.
Cash flows beyond the one-year period have been extrapolated using a steady 5% per annum growth rate. Management
believes that any reasonably possible change in the key assumptions in which the recoverable amount is based would not cause
the aggregate carrying amount to exceed the aggregate recoverable amount of the cash generating unit.
SAFROCK
The recoverable amount for Safrock is determined based on a value in use calculation which uses cash flow projections based
on financial budgets approved by management covering a one-year period, and a discount rate of 15% per annum. Cash flow
projections during the budget period take into account managements assessment of the impact of the micro-lending legislation
recently announced in Queensland.

51
CASH
CONVERTERS
INTERNATIONAL
LIMITED
ANNUAL
REPORT
2009
Cash flows beyond the one-year period have been extrapolated using a steady 5% per annum growth rate. Management
believes that any reasonably possible change in the key assumptions in which the recoverable amount is based would not cause
the aggregate carrying amount to exceed the aggregate recoverable amount of the cash generating unit.
CORPORATE STORES (UK & AUSTRALIA)
The recoverable amount for Corporate Stores is determined based on a value in use calculation which uses cash flow projections
based on financial budgets approved by management covering a one-year period, and a discount rate of 15% per annum.
Separate cash flow projections have been prepared for both the UK and Australia.
Cash flows beyond the one-year period have been extrapolated using a steady 5% per annum growth rate. Management
believes that any reasonably possible change in the key assumptions in which the recoverable amount is based would not cause
the aggregate carrying amount to exceed the aggregate recoverable amount of the cash generating unit.
Company2009 2008Shares SharesNo No
16. ISSUED CAPITAL
(a)
Fully paid ordinary shares
Balance at beginning of financial year 238,685,685 240,311,699
Shares issued during the year 2,833,333 2,833,333
Share buy-back (1,509,327) (4,459,347)
Balance at end of financial year 240,009,691 238,685,685
Fully paid ordinary shares carry one vote per share and carry the right to dividends.
Changes to the Corporate law abolished the authorised capital and per value concept in relation to the share capital from 1 July
1998. Therefore, the Company does not have a limited amount of authorised capital and issued shares do not have a par value.
Consolidated Company2009 2008 2009 2008$ $ $ $
(b)
Balance at the beginning of the year 46,424,331 46,536,871 46,424,331 46,536,871
Earn-out shares issued (note 17a) 1,133,333 1,133,333 1,133,333 1,133,333
Share buy-back (355,288) (1,245,873) (355,288) (1,245,873)
Balance at the end of the financial year 47,202,376 46,424,331 47,202,376 46,424,331
Cash Converters UK securities are stapled securities. These securities are stapled to Cash Converters International shares and
were issued on a one for one basis.
(c) SHARE BUY-BACK
On 23 November 2007 Cash Converters International Limited advised the Market that it would commence a share buy-back of
its shares commencing on 10 December 2007. The buy-back was open for a 12 month timeframe with a maximum number of
shares to be purchased being 24,300,000. Under this buy-back 5,968,674 were acquired for the total consideration of
$1,601,161. On 10 December 2008 Cash Converters International Limited advised the Market that it would commence a buy-
back of its shares commencing 28 December 2008. The buy-back will be open for a 12 month timeframe with a maximum
number of shares to be purchased being 23,700,000. No shares have yet been purchased under this buy-back.

N o t e s t o t h e F i n a n c i a l S t a t e m e n t s
52
Consolidated Company2009 2008 2009 2008$ $ $ $
17. RESERVES AND RETAINED EARNINGS
(a) RESERVES
Foreign currency translation reserve (873,818) (698,163) - -
Acquisition earnout reserve 1,133,333 2,266,667 1,133,333 2,266,667
Balance at the end of the financial year 259,515 1,568,504 1,133,333 2,266,667
Foreign currency translation reserve
Balance at the beginning of the financial year (698,163) (87,446) - -
Translation of foreign operations (175,656) (610,717) - -
Balance at the end of the financial year (873,819) (698,163) - -
Exchange differences relating to the translation from the functional currencies of the Group’s foreign controlled entities into
Australian Dollars are brought to account by entries made directly to the foreign currency translation reserve.
Acquisition earnout reserve
Balance at the beginning of the financial year 2,266,667 3,400,000 2,266,667 3,400,000
Contingent consideration for Safrock acquisition - - - -
Contingent consideration agreed for the year (1,133,333) (1,133,333) (1,133,333) (1,133,333)
Balance at the end of the financial year 1,133,334 2,266,667 1,133,334 2,266,667
Under the terms of the acquisition in regard to the Safrock Group 8,500,000 earn-out shares may be issued in tranches as soon
as practicable after the end of the relevant financial year subject to meeting certain earnings targets. The end of the first relevant
financial period was 30 June 2007 with the earnings targets being met resulting in 2,833,333 earn-out shares being issued. A
further 2,833,333 earn-out shares were issued for the period ending 30 June 2008 following the earn-out target being met. This
leaves a balance of 2,833,334 earn-out shares to be issued if the future financial targets are met. The acquisition earn-out
reserve is used to record a reasonable estimate of the likely equity to be issued in relation to earn-out targets pertaining to the
acquisition of Safrock.
An equity reserve is used to record this amount due to a fixed number of equity instruments to be issued.
(b) RETAINED EARNINGS
Balance at the beginning of the financial year 25,773,648 17,859,689 - -
Net profit attributable to members of the parent entity 16,164,861 15,143,403 17,480,013 7,229,442
Dividends provided for or paid (note 26) (7,180,013) (7,229,442) (7,180,013) (7,229,442)
Balance at the end of the financial year 34,758,496 25,773,648 10,300,000 -
18. FINANCIAL INSTRUMENTS
(a) CAPITAL RISK MANAGEMENT
The consolidated entity manages its capital to maximise the return to stakeholders through the optimisation of the debt and
equity balance whilst ensuring that the consolidated entity is able to continue as a going concern. The consolidated entity’s
overall strategy remains unchanged from 2008.
The capital structure of the consolidated entity consists of debt, which includes the borrowings disclosed in note 11, cash and
cash equivalents and equity attributable to holders of the parent, comprising issued capital, reserves and retained earnings as
disclosed in notes 16 and 17 respectively.
The consolidated entity operates globally, primarily through subsidiary companies established in the markets in which the
consolidated entity trades. None of the consolidated entity’s operations are subject to externally imposed capital requirements.
The consolidated entity’s policy is to borrow centrally, using a variety of borrowing facilities, to meet anticipated funding
requirements.

53
CASH
CONVERTERS
INTERNATIONAL
LIMITED
ANNUAL
REPORT
2009
Consolidated Company2009 2008 2009 2008$ $ $ $
(b) CATEGORIES OF FINANCIAL INSTRUMENTS
Financial assets
Cash and cash equivalents 7,002,971 16,322,202 38,661 -
Trade and other receivables 6,681,554 5,161,595 27,798,536 17,529,498
Personable loan receivables 25,070,661 14,280,565 - -
Financial liabilities
Trade and other payables 8,366,970 6,743,196 - -
Borrowings 16,920,346 12,228,746 13,159,000 10,389,296
(c) FINANCIAL RISK MANAGEMENT OBJECTIVES
The consolidated entity’s treasury function provides services to the business, co-ordinates access to domestic and international
financial markets, and manages the financial risks relating to the operations of the consolidated entity. The consolidated entity
does not enter into or trade financial instruments, including derivative financial instruments, for speculative purposes. The
consolidated entity’s activities expose it primarily to the financial risks of changes in foreign currency exchange rates and interest
rates.
(d) MARKET RISK
The consolidated entity’s activities expose it primarily to the financial risks of changes in foreign currency exchange rates (refer
note 18(e)) and interest rates (refer note 18(f)).
There has been no change to the consolidated entity’s exposure to market risks or the manner in which it manages and
measures the risk from the previous period.
(e) FOREIGN CURRENCY RISK MANAGEMENT
The consolidated entity undertakes certain transactions denominated in foreign currencies, hence exposures to exchange rate
fluctuations arise. Exchange rate exposures are relatively small and spot rates are normally used.
The carrying amount of the consolidated entity’s foreign currency denominated monetary assets and monetary liabilities at the
reporting date is as follows:
Liabilities Assets2009 2008 2009 2008$ $ $ $
Payable - Pounds Stirling 3,892,166 3,072,090 - -
- United States Dollars 4,794 4,026 - -
Receivables - Pounds Stirling - - 4,491,372 3,190,579
The consolidated entity is mainly exposed to Pounds Sterling, through its operations in the United Kingdom.
Consolidated entity sensitivity
At 30 June 2009, if the Australian Dollar / Pound Sterling exchange rate had changed by +/- 5% from the actual rates observed
during the year, with all other variables held constant, post tax profit and equity for the year would have been $73,150
higher/lower (2008 - $16,902 higher/lower).
Parent entity sensitivity
At 30 June 2009, if the Australian Dollar / Pound Sterling exchange rate had changed by +/- 5% from the actual rates observed
during the year, with all other variables held constant, post tax profit and equity for the year would have been $zero higher/lower
(2008 - $zero higher/lower).

N o t e s t o t h e F i n a n c i a l S t a t e m e n t s
54
18. FINANCIAL INSTRUMENTS (continued)
(f) INTEREST RATE RISK MANAGEMENT
The company and the consolidated entity are exposed to interest rate risk as entities in the consolidated entity borrow funds at
variable rates and place funds on deposit at variable rates. Personal loans issues by the consolidated entity are at fixed rates.
The risk is managed by the Consolidated Entity by monitoring interest rates.
The company and the consolidated entity’s exposures to interest rates on financial assets and financial liabilities are detailed in
the liquidity risk management section of this note.
Interest rate sensitivity analysis
The sensitivity analyses below have been determined based on the exposure to interest rates at the reporting date and the
stipulated change taking place at the beginning of the financial year and held constant throughout the reporting period. A 200
basis point increase or decrease is used because this represents management’s assessment of the possible change in interest
rates.
At reporting date, if interest rates had been 200 basis points higher or lower and all other variables were held constant, the
consolidated entity’s:
• net profit would increase/decrease by approximately $169,000 (2008: increase/decrease by approximately $88,000). This
is mainly attributable to additional borrowings this year.
The Consolidated entity’s sensitivity to interest rates has increased during the current period mainly due to additional borrowings.
At reporting date, if interest rates had been 200 basis points higher or lower and all other variables were held constant, the Parent
Company’s:
• net profit would increase/decrease by approximately $263,180 (2008: increase/decrease by approximately $208,000). This
is mainly attributable to additional borrowings this year.
The Parent Company sensitivity to interest rates has increased during the current period mainly due to additional borrowings.
(g) CREDIT RISK MANAGEMENT
Credit risk refers to the risk that a counterparty will default on its contractual obligations resulting in financial loss to the
consolidated entity. The consolidated entity has adopted the policy of only dealing with creditworthy counterparties and
obtaining sufficient collateral or other security where appropriate, as a means of mitigating the risk of financial loss from defaults.
The consolidated entity measures credit risk on a fair value basis.
The consolidated entity does not have any significant credit risk exposure to any single counterparty or any group of
counterparties having similar characteristics, other than its franchisees. The consolidated entity has a policy of obtaining
sufficient collateral or other securities from these franchisees.
The majority of loans within the financing division relate to loans made by Safrock which makes both secured and unsecured
personal loans. Credit risk is present in relation to all unsecured loans made which is managed within an agreed corporate policy
on customer acceptance and on-going review of recoverability.
(h) LIQUIDITY RISK MANAGEMENT
Ultimate responsibility for liquidity risk management rests with the board of directors, who have built an appropriate liquidity risk
management framework for the management of the consolidated entity’s short, medium and long-term funding and liquidity
management requirements. The consolidated entity manages liquidity risk by maintaining adequate cash reserves, banking
facilities and reserve borrowing facilities by continuously monitoring forecast and actual cash flows and matching maturity profiles
of financial assets and liabilities. Included in note 11 is a listing of additional undrawn facilities that the company/consolidated
entity has at its disposal to further reduce liquidity risk.

55
CASH
CONVERTERS
INTERNATIONAL
LIMITED
ANNUAL
REPORT
2009
Liquidity and interest risk tables
The following tables detail the Company’s and the consolidated entity’s remaining contractual maturity for its financial liabilities.
The tables have been drawn up based on the undiscounted cash flows of financial liabilities based on the earliest date on which
the consolidated entity can be required to pay. The table includes both interest and principal cash flows.
Weightedaverageeffective More than
interest rate 1 year or less 1 to 5 years 5 years Total% $ $ $ $
CONSOLIDATED
2009
Non-interest bearing - 8,366,970 - - 8,366,970
Finance lease liability 8.52 415,913 1,310,532 - 1,726,445
Variable interest rate instruments 7.56 3,929,809 12,703,914 - 16,633,723
Financial guarantee contracts - - - - -
12,712,692 14,014,446 - 26,727,138
2008
Non-interest bearing - 6,743,196 - - 6,743,196
Finance lease liability 9.55 80,709 286,894 - 367,603
Variable interest rate instruments 10.30 4,818,404 8,206,000 - 13,024,404
Financial guarantee contracts - - - - -
11,642,309 8,492,894 - 20,135,203
At the year end it was not probable that the counterparty to the financial guarantee contract will claim under the contract.
Consequently, the amount included above is nil.
COMPANY
2009
Non-interest bearing - - - - -
Finance lease liability - - - - -
Variable interest rate instruments 7.25 2,788,500 11,324,528 - 14,113,028
Financial guarantee contracts - - - - -
2,788,500 11,324,528 - 14,113,028
2008
Non-interest bearing - - - - -
Finance lease liability - - - - -
Variable interest rate instruments 10.30 3,231,013 8,206,000 - 11,437,013
Financial guarantee contracts - - - - -
3,231,013 8,206,000 - 11,437,013
At the year end it was not probable that the counterparty to the financial guarantee contract will claim under the contract.
Consequently, the amount included above is nil.
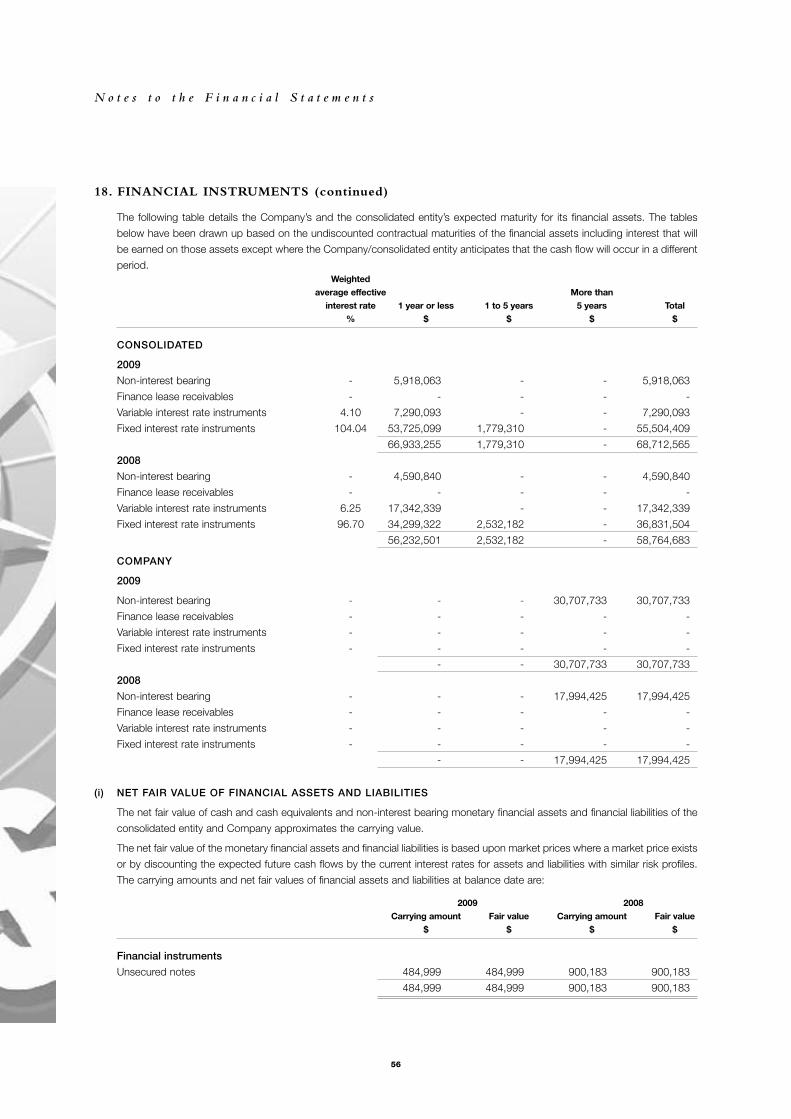
N o t e s t o t h e F i n a n c i a l S t a t e m e n t s
56
18. FINANCIAL INSTRUMENTS (continued)
The following table details the Company’s and the consolidated entity’s expected maturity for its financial assets. The tables
below have been drawn up based on the undiscounted contractual maturities of the financial assets including interest that will
be earned on those assets except where the Company/consolidated entity anticipates that the cash flow will occur in a different
period.Weighted
average effective More thaninterest rate 1 year or less 1 to 5 years 5 years Total
% $ $ $ $
CONSOLIDATED
2009
Non-interest bearing - 5,918,063 - - 5,918,063
Finance lease receivables - - - - -
Variable interest rate instruments 4.10 7,290,093 - - 7,290,093
Fixed interest rate instruments 104.04 53,725,099 1,779,310 - 55,504,409
66,933,255 1,779,310 - 68,712,565
2008
Non-interest bearing - 4,590,840 - - 4,590,840
Finance lease receivables - - - - -
Variable interest rate instruments 6.25 17,342,339 - - 17,342,339
Fixed interest rate instruments 96.70 34,299,322 2,532,182 - 36,831,504
56,232,501 2,532,182 - 58,764,683
COMPANY
2009
Non-interest bearing - - - 30,707,733 30,707,733
Finance lease receivables - - - - -
Variable interest rate instruments - - - - -
Fixed interest rate instruments - - - - -
- - 30,707,733 30,707,733
2008
Non-interest bearing - - - 17,994,425 17,994,425
Finance lease receivables - - - - -
Variable interest rate instruments - - - - -
Fixed interest rate instruments - - - - -
- - 17,994,425 17,994,425
(i) NET FAIR VALUE OF FINANCIAL ASSETS AND LIABILITIES
The net fair value of cash and cash equivalents and non-interest bearing monetary financial assets and financial liabilities of the
consolidated entity and Company approximates the carrying value.
The net fair value of the monetary financial assets and financial liabilities is based upon market prices where a market price exists
or by discounting the expected future cash flows by the current interest rates for assets and liabilities with similar risk profiles.
The carrying amounts and net fair values of financial assets and liabilities at balance date are:
2009 2008Carrying amount Fair value Carrying amount Fair value
$ $ $ $
Financial instruments
Unsecured notes 484,999 484,999 900,183 900,183
484,999 484,999 900,183 900,183

57
CASH
CONVERTERS
INTERNATIONAL
LIMITED
ANNUAL
REPORT
2009
19. LEASES
(a) FINANCE LEASES
Leasing arrangements
Finance leases relate to computer equipment and motor vehicles with lease terms of up to 5 years. The consolidated entity has
options to purchase the equipment for a nominal amount at the conclusion of the lease agreements.
Finance lease liabilities
Minimum future lease payments Present value of minimum future lease paymentsConsolidated Company Consolidated Company
2009 2008 2009 2008 2009 2008 2009 2008$ $ $ $ $ $ $ $
Finance lease and hire purchase
expenditure contracted for at
balance sheet date, payable:
Within one year 415,913 80,709 - - 307,988 73,751 - -
Later than one, not later than
five years 1,310,532 286,894 - - 1,148,328 229,647 - -
1,726,445 367,603 - - 1,456,316 303,394 - -
Less future finance charges (270,129) (64,209) - - - - - -
1,456,316 303,394 - - 1,456,316 303,394 - -
Included in the financial
statement as:
Current borrowings
(note 11) 308,606 73,673 - -
Non-current borrowings
(note 11) 1,147,710 229,721 - -
1,456,316 303,394 - -
(b) OPERATING LEASES
Leasing arrangements
Operating leases relate to office accommodation and retail premises with lease terms of between 5 to 10 years, with an option
to extend for a further 5 years. All operating lease contracts contain market review clauses in the event that the consolidated
entity exercises its option to renew. The consolidated entity does not have an option to purchase the leased assets at the expiry
of the lease period.
Consolidated Company2009 2008 2009 2008$ $ $ $
Non-cancellable operating lease commitments payable:
Within one year 3,604,361 1,647,102 - -
Later than one, not later than five years 9,886,547 4,181,332 - -
Later than five years 1,484,591 1,197,069 - -
14,975,499 7,025,503 - -
Operating lease commitments relate to head office premises in Australia, the regional offices in the UK and around Australia and
the corporate stores in the UK and Australia. Cash Converters hold an option to renew on the Australian premises.
(c) COMMITMENT FOR CAPITAL EXPENDITURE
At 30 June 2009 capital expenditure commitments were $550,000 (2008: $nil)

N o t e s t o t h e F i n a n c i a l S t a t e m e n t s
58
20. RELATED PARTY TRANSACTIONS
(a) KEY MANAGEMENT PERSONNEL REMUNERATION
Details of key management personnel of Cash Converters International Limited during the year are:
• R. Webb (Chairman, Non-executive Director)
• P. Cumins (Managing Director, Executive)
• J. Yeudall (Non-executive Director)
• P. Cowan (Non-executive Director – appointed October 2008)
• A. Moffat (Non-executive Director – resigned October 2008)
• C. Hetherington (Non-executive Director – resigned April 2009)
• M. Cooke (Legal Counsel)
• M. Lemmon (Director of Operations UK – resigned May 2009)
• I. Day (General Manager – Australia)
• R. Groom (Company Secretary / Group Financial Controller)
• J. Spratley (Group Accountant – UK)
• R. Pilgrim (Operations Manager – UK)
The aggregate compensation of the key management personnel of the consolidated entity and the Company is set out below:
Consolidated Company2009 2008 2009 2008$ $ $ $
Short-term employee benefits 2,113,149 1,832,140 - -
Long-term employee benefits - - - -
Post-employee benefits 171,483 133,542 - -
Total 2,284,632 1,965,682 - -
(b) KEY MANAGEMENT PERSONNEL RELATED ENTITIES
The relationships between the Company and key management personnel related entities are as follows:
Franchise holders - The directors of the Company together with their associated entities held interests in the following
franchised stores:
Franchisee Franchise Related Party
Blackport Pty Ltd Phoenix Park & Clarkson WA Peter Cumins
During the period, Cash Converters Stores Pty Ltd acquired both the Phoenix Park and Clarkson WA stores, refer to note 29
for further information.

59
CASH
CONVERTERS
INTERNATIONAL
LIMITED
ANNUAL
REPORT
2009
(c) LOAN TO KEY MANAGEMENT PERSONNEL
LoanBalance Interest Interest repayments Balance Number
at beginning charged not charged received at end in Group$ $ $ $ $
2009Director- related entities 307,247 22,964 - (330,211) - 1
Other key management personnel - - - - - -
Total 307,247 22,964 - (330,211) - 1
2008Directors – related entities 264,526 33,420 - - 307,247 1
Other key management personnel - - - - - -
Total 264,526 33,420 - - 307,247 1
INDIVIDUALS WITH LOANS ABOVE $100,000 IN THE YEAR
LoanBalance Interest Interest repayments Balance Highest
at beginning charged not charged received at end in period$ $ $ $ $ $
2009P. Cumins [Blackport Pty Ltd] 307,247 22,964 - (330,211) - 307,247
Total 307,247 22,964 - (330,211) - 307,247
2008P. Cumins [Blackport Pty Ltd] 264,526 33,420 - - 307,247 307,247
Total 264,526 33,420 - - 307,247 307,247
The above loans are made through Cash Converters Finance Corporation Limited for additional working capital in developing
Cash Converters franchised businesses.
Commercial rates of interest are charged on loans made to director-related entities, which are made on the same terms and
conditions as those made to other franchisees.

N o t e s t o t h e F i n a n c i a l S t a t e m e n t s
60
20. RELATED PARTY TRANSACTIONS (continued)
(d) DIRECTORS’ AND SPECIFIED KEY MANAGEMENT PERSONNEL EQUITY HOLDINGS
Fully paid ordinary shares issued by Cash Converters International Limited
Received Acquisition BalanceBalance at Granted as on exercise /(disposal) Balance at held1 July 2008 remuneration of options of shares 30 June 2009 indirectly
No. No. No. No. No. No.
Directors
P. Cumins 7,637,035 - - 70,795 7,707,830 -
R. Webb 1,112,500 - - - 1,112,500 -
J. Yeudall 295,668 - - - 295,668 -
P. Cowan - - - - - -
C. Hetherington - - - - - -
A. Moffat - - - - - -
Other key management personnel
I. Day 3,949,260 - - - 3,949,260 -
R. Groom 2,584,618 - - 60,000 2,644,618 -
J. Spratley - - - - - -
M. Lemmon - - - - - -
M. Cooke 5,315,000 - - 500,000 5,815,000 -
R. Pilgrim - - - - - -
20,894,081 - - 630,795 21,524,876 -
Fully paid ordinary shares issued by Cash Converters International Limited
Received Acquisition BalanceBalance at Granted as on exercise /(disposal) Balance at held1 July 2007 remuneration of options of shares 30 June 2008 indirectly
No. No. No. No. No. No.
Directors
P. Cumins 7,565,575 - - 71,460 7,637,035 -
R. Webb 1,112,500 - - - 1,112,500 -
A. Moffat - - - - - -
J. Yeudall 79,365 - - 216,303 295,668 -
C Hetherington - - - - - -
Other key management personnel
I. Day 3,314,419 - - 634,841 3,949,260 -
R. Groom 3,271,618 - - (687,000) 2,584,618 -
J. Spratley - - - - - -
M. Lemmon - - - - - -
M. Cooke 5,315,000 - - - 5,315,000 -
20,658,477 - - 235,604 20,894,081 -

61
CASH
CONVERTERS
INTERNATIONAL
LIMITED
ANNUAL
REPORT
2009
(e) OTHER TRANSACTIONS WITH KEY MANAGEMENT PERSONNEL
The profit from operations before income tax includes the following items of revenue and expense that resulted from transactions
other than compensation, loans or equity holdings, with key management personnel or their related entities:
2009 2008$ $
Franchise fees payable in advance on the 1st of each month 68,762 107,285
Total advertising levy payable monthly in advance 95,983 157,773
Total training levies paid monthly in advance 5,080 7,920
Total miscellaneous fees payable on 30 day account 2,488 4,858
Total wholesale invoices payable on 30 day account 5,438 6,535
Total recognised as revenue 177,751 284,371
Transactions between the consolidated entity and these parties are conducted on the normal commercial terms that apply to all
franchise operators.
21. SUBSEQUENT EVENTS
Since the end of the financial year the directors are not aware of any matter or circumstance, other than those mentioned below,
that has significantly or may significantly affect the operations of the Company, the results of these operations or the state of
affairs of the Company in subsequent financial years.
On 8 July 2009 Cash Converters International Limited announced that it was to raise $5 million through the issuance of up to
12.5 million shares at an issue price of $0.40 per share to institutional and sophisticated investors.
On 11 August 2009 Cash Converters International Limited announced that its UK subsidiary (CCUK) acquired an existing store
in Barnsley as a going concern for a total consideration of approximately £660,000 ($1.3 million). This acquisition takes the total
number of corporate stores to 38, comprising of 17 in Australia and 21 in the UK.
On 18 August 2009 Cash Converters International Limited entered into a Subscription Agreement with EZCORP, Inc. to make
a placement of 108,218,000 fully paid ordinary units at an issue price of A$0.50 per unit to raise approximately $54 million. This
will represent 30% of the fully diluted capital of the Company after the placement has been made. This placement is subject to
shareholder approval.
The funds will be utilised to grow the earnings of the Company through accelerating the acquisition of franchised stores and to
increase the size of the Safrock loan books.

N o t e s t o t h e F i n a n c i a l S t a t e m e n t s
62
22(a). SUBSIDIARIES
Ownership interestName of entity Country of incorporation 2009 2008
Parent entity
Cash Converters International Limited (i) Australia
Directly controlled by Cash Converters International Limited
Cash Converters Pty Ltd (ii) (iii) Australia 100% 100%
Cash Converters UK Holdings PLC UK 100% 100%
Cash Converters USA Limited (note 22c) Australia 58.87% 58.87%
MON-E Pty Ltd (ii) (iii) Australia 100% 100%
Safrock Finance Group Pty Ltd (ii) (iii) Australia 100% 100%
Safrock Finance Corporation (QLD) Pty Ltd (ii) (iii) Australia 100% 100%
Safrock Finance Corporation (WA) Pty Ltd (ii) (iii) Australia 100% 100%
Finance Administrators of Australia Pty Ltd (ii) (iii) Australia 100% 100%
Cash Converters (Stores) Pty Ltd (ii) (iii) Australia 100% 100%
Cash Converters (Cash Advance) Pty Ltd (ii) (iii) Australia 100% 100%
Directly controlled by Cash Converters Pty Ltd
Cash Converters Finance Corporation Limited (refer note 22c) Australia 36.86% 36.86%
Directly controlled by Cash Converters USA Limited
Cash Converters USA Inc USA 100% 100%
(i) Cash Converters International Limited is the head entity within the tax consolidated group.
(ii) These companies are members of the tax consolidated group.
(iii) These wholly owned subsidiaries have entered into a deed of cross guarantee with Cash Converters International Limited
pursuant to ASIC Class Order 98/1418 and are relieved from the requirement to prepare and lodge an audited financial
report.
Company2009 2008$ $
Investments in subsidiaries
Non-current
Investments in subsidiaries – at cost 43,572,916 43,572,916

63
CASH
CONVERTERS
INTERNATIONAL
LIMITED
ANNUAL
REPORT
2009
22(b). SUBSIDIARIES
The consolidated income statement and balance sheet of the entities party to the cross guarantee are:
INCOME STATEMENT
Consolidated2009 2008$ $
Revenue 62,274,572 51,971,582
Employee benefits expense (12,969,395) (8,782,286)
Depreciation and amortisation expenses (763,201) (556,412)
Finance costs (916,869) (683,067)
Legal fees / legal settlements (506,175) (477,608)
Changes in inventories (6,911,581) (3,970,715)
Area agents fees / commissions (4,329,587) (5,399,958)
Rental expense on operating leases (2,639,143) (1,561,344)
Motor vehicle/travel costs (638,363) (554,928)
Bad debts/bad debt provision (4,819,032) (4,279,543)
Professional and registry costs (691,385) (486,160)
Auditing and accounting services (383,282) (286,960)
Bank charges (612,734) (815,136)
Other expenses from ordinary activities (4,963,092) (3,072,841)
Profit before income tax expense 21,130,733 21,044,724
Income tax expense (6,514,038) (6,271,778)
Profit for the year from continuing operations 14,616,695 14,772,946
Minority interest - -
Equity holders of the parent 14,616,695 14,772,946
Profit for the year 14,616,695 14,772,946

N o t e s t o t h e F i n a n c i a l S t a t e m e n t s
64
22(b). SUBSIDIARIES (continued)
BALANCE SHEETConsolidated
2009 2008$ $
Current assets
Cash and cash equivalents 6,451,779 13,805,551
Trade receivables 3,352,154 3,775,576
Personal loans receivable 23,408,264 11,878,839
Inventories 3,514,997 1,859,630
Other assets 853,164 281,553
Total current assets 37,580,358 31,601,149
Non-current assets
Trade and other receivables 7,800,723 5,590,320
Other financial assets 463,480 463,480
Plant and equipment 2,828,518 1,469,399
Deferred tax assets 1,855,868 1,841,579
Goodwill 45,296,091 41,267,163
Other intangible assets 8,414,421 7,817,189
Total non-current assets 66,659,101 58,449,130
Total assets 104,239,459 90,050,279
Current liabilities
Trade and other payables 5,564,842 2,714,969
Borrowings 2,908,606 3,002,969
Current tax payables 2,697,372 2,552,283
Deferred establishment fees 1,310,668 1,399,282
Provisions 1,108,726 807,419
Total current liabilities 13,590,214 10,476,922
Non-current liabilities
Borrowings 11,706,710 7,689,721
Deferred tax liabilities 1,222,287 1,244,783
Total non-current liabilities 12,928,997 8,934,504
Total liabilities 26,519,211 19,411,426
Net assets 77,720,248 70,638,853
Equity
Issued capital 47,202,376 46,424,331
Reserves 1,365,105 2,498,437
Retained earnings 29,152,767 21,716,085
Parent entity interest 77,720,248 70,638,853
Minority interests - -
Total equity 77,720,248 70,638,853
Consolidated2009$
Retained earnings
Retained earnings as at the beginning of the financial year 21,716,085
Net profit 14,616,695
Dividends provided for or paid (7,180,013)
Retained earnings as at the end of the financial year 29,152,767

65
CASH
CONVERTERS
INTERNATIONAL
LIMITED
ANNUAL
REPORT
2009
(c) OUTSIDE EQUITY INTERESTS IN CONTROLLED ENTITIES
Outside equity interests hold 540,029 (2008: 595,196), 50 cent ordinary shares in Cash Converters Finance Corporation Limited,
being 63.14% of the ordinary issued share capital, and 63.08% of the total equity of the Company.
Cash Converters International Limited controls Cash Converters Finance Corporation Limited, because it holds 100% of the
issued share capital of Cash Converters Pty Ltd, giving it control of that company which in turn controls Cash Converters Finance
Corporation Limited by virtue of its 100% holding of the “A” Management shares of Cash Converters Finance Corporation
Limited which confer 51% of the votes in general meetings.
Outside equity interests hold 83,936 - one cent ordinary units in Cash Converters USA Limited, being 41.13% of the total equity
of the company.
Consolidated2009 2008$ $
Outside equity interests in controlled entities comprises:
Contributed capital 3,234,757 3,278,127
Accumulated losses (2,965,484) (2,998,701)
269,273 279,426
23. CONTINGENT LIABILITIES
Cash Converters International Limited (CCIL) has provided a bank guarantee to Barrier Shelf Company (No 57) Pty Ltd as
security for the head office lease.
CCUK has also provided a guarantee to Barclays Bank for a term loan of £800,000. CCIL has also provided a cross guarantee
on this loan.
Cash Converters UK Limited (CCUK) has provided lease rental guarantees for franchisees of $414,907.
Cash Converters Pty Ltd (CCPL) has subordinated $780,883 of its total receivable from CCFCL.
In the course of its normal business the consolidated entity occasionally receives claims and writs for damages and other matters
arising from its operations. Where in the opinion of the directors it is deemed appropriate a specific provision is made, otherwise
the directors deem such matters are either without merit or of such kind or involved such amounts that would not have a material
adverse effect on the operating results or financial position of the economic entity if disposed of unfavourably.
CCIL has agreed to provide ongoing financial support to CCUK, CCUSA, CCPL and CCFCL for the foreseeable future.
The directors are not aware of any other material contingent liabilities in existence at 30 June 2009 requiring disclosure in the
financial statements.

N o t e s t o t h e F i n a n c i a l S t a t e m e n t s
66
Consolidated2009 2008
24. EARNINGS PER SHARE
Basic earnings per share (cents per share) 6.77 6.28
Diluted earnings per share (cents per share) 6.66 6.12
2009 2008$ $
Basic earnings per share
The earnings and weighted average number of ordinary shares
used in the calculation of basic earnings per share are as follows:
Earnings 16,164,861 15,143,403
Number Number
Weighted average number of ordinary shares
for the purpose of basic earnings per share 238,739,529 240,971,887
Earnings used in the calculation of basic earnings per share reconciles
to net profit in the income statements as follows:
$ $
Net profit 16,164,861 15,143,403
Earnings used in the calculation of basic earnings per share 16,164,861 15,143,403
Diluted earnings per share
The earnings used in the calculation of diluted earnings per share
are equal to those used in basic earnings per share
Weighted average number of ordinary and potential ordinary shares
used in the calculation of diluted earnings per share reconciles to the
weighted average number of ordinary shares used in the calculation
of basic earnings per share as follows:
Weighted average number of ordinary shares used in the
calculation of basic earnings per share 238,739,529 240,971,887
Earnout shares (note 17) 4,044,293 6,510,474
Weighted average number of ordinary shares used in the
calculation of diluted earnings per share 242,783,822 247,482,361
The number of potential ordinary shares not included in the above calculation is Nil (2008: Nil).

67
CASH
CONVERTERS
INTERNATIONAL
LIMITED
ANNUAL
REPORT
2009
Consolidated Company2009 2008 2009 2008$ $ $ $
25. CASH FLOW INFORMATION
(a) RECONCILIATION OF PROFIT FOR THE YEAR TONET CASH FLOWS FOR THE OPERATING ACTIVITIES
Profit for the year 16,154,708 15,174,586 17,480,013 7,229,442
Non-cash flows in operating profit:
Amortisation 321,790 281,097 - -
Depreciation 840,278 601,215 - -
Bad debts written off 4,819,032 4,302,072 - -
Lease and hire purchase interest 50,256 7,558 - -
Loss on sale of plant and equipment - 43,125 - -
(Increase)/decrease in income taxes payable 549,864 (564,423) - -
Increase in future income tax benefits 15,706 (122,446) - -
Increase/(decrease) in deferred tax (3,268) 123,977 - -
Net exchange differences (240) 1,289 - -
Realised foreign exchange (gain)/loss - - - -
Change in assets and liabilities:
Increase in inventories (1,558,672) (800,546) - -
(Increase)/decrease in prepayments (622,990) (214,369) - -
(Increase)/decrease in trade and term receivables (7,874,121) (1,201,663) - -
Increase in trade payables and accruals 1,518,586 927,550 - -
Increase/(decrease) in employee and other provisions 462,264 59,054 - -
Increase/(decrease) in fees receivable rolled
into loans to/from other related entities 625,942 2,638 (10,300,000) -
Cash flows from operations 15,299,135 18,620,714 7,180,013 7,229,442
(b) RECONCILIATION OF CASH AND CASH EQUIVALENTS
For the purpose of the cash flow statement, cash and cash equivalents includes cash on hand, deposits held at call with banks
or financial institutions, net of bank overdrafts and is reconciled to the related items in the balance sheet as follows:
Consolidated Company2009 2008 2009 2008$ $ $ $
Cash and cash equivalents 7,002,971 16,322,202 38,661 -
Bank overdraft (657,933) (1,037,657) - -
6,345,038 15,284,545 38,661 -
(c) BUSINESS ACQUIRED
During the financial year the Group acquired two businesses. The net cash out flow on acquisition was $11,035,619 (2008:
$15,756,230). Refer to note 29 for further details of these acquisitions.
(d) NON-CASH FINANCING AND INVESTING ACTIVITIES
During the current financial year the consolidated entity conducted two store fit-outs and purchased software with a fair value
of $1,325,817 (2008: $181,684) under a hire purchase agreement.

N o t e s t o t h e F i n a n c i a l S t a t e m e n t s
68
26. DIVIDENDS
The directors of the Company paid a fully franked interim dividend of 1.5 (one and a half) cents per share on 31 March 2009.
The directors have also declared a final fully franked dividend of 1.5 (one and a half) cents per share to be paid on 30 September
2009 to those shareholders on the register at the close of business on 16 September 2009.
The Company has Australian franking credits available of $14,564,272 on a tax paid basis (2008: $11,886,420).
2009 2008Cents per Total Cents per Totalshare $ share $
Fully paid ordinary shares
Recognised amounts
Interim dividend: Franked to 100% at 30% 1.5 3,599,728 1.5 3,624,765
Final dividend: Franked to 100% at 30% 1.5 3,580,285 1.5 3,604,677
Unrecognised amounts
Final dividend: Franked to 100% at 30% 1.5 3,787,645 1.5 3,580,285
Consolidated Company2009 2008 2009 2008$ $ $ $
27. RECEIVABLES AND PAYABLESDENOMINATED IN FOREIGN CURRENCIES
RECEIVABLES
Current – not hedged
Pounds Sterling 4,491,372 3,190,579 - -
United States Dollars - - - -
PAYABLES
Current – not hedged
Pounds Sterling 3,892,166 3,072,090 - -
United States Dollars 4,794 4,026 - -
No. No.
28. EMPLOYEE NUMBERS
Average number of employees during the financial year 138 136 - -

69
CASH
CONVERTERS
INTERNATIONAL
LIMITED
ANNUAL
REPORT
2009
29. ACQUISITIONS OF BUSINESS
Acquisition of trade and assets: Seven stores in the United Kingdom and eight stores in Australia
During the period the Group acquired the trade and assets of seven stores in the UK and eight stores in Australia for total
consideration of $11,980,447.
This transaction has been accounted for using the acquisition method of accounting.
The net assets acquired in the business combination, and the goodwill arising, are as follows:
Acquiree’scarrying amountbefore business Fair valuecombination adjustments Fair value
$ $ $
Net assets acquired:
Cash and cash equivalents 162,813 - 162,813
Trade and other receivables 2,093,449 473,015 2,566,464
Inventories 2,224,731 (15,293) 2,209,438
Property plant and equipment 1,025,019 - 1,025,019
Trade and other payables (88,906) (255,503) (344,409)
Fair value of net identifiable assets acquired 5,417,106 202,219 5,619,325
Consideration
Consideration satisfied by cash 11,198,432
Deferred consideration 205,000
Other consideration 577,016
Total consideration 11,980,447
Goodwill arising on acquisition 6,361,122
The initial accounting for the acquisition of the 15 stores has only been provisionally determined at reporting date.
For tax purposes the tax values of the assets are required to be reset based on market values and other factors. At the date of
issuance of this report, the necessary market valuations and other calculations had not been finalised and the adjustment to
deferred tax liabilities and goodwill noted above has therefore only been provisionally determined based on the directors’ best
estimate of the likely tax values. The market valuations obtained for tax purposes may also impact the recognised fair values of
the other assets acquired as part of the business combination.
Goodwill arose in the business combination because the cost of the combination included a control premium paid to acquire
the 15 stores. In addition, the consideration paid for the combination effectively included amounts in relation to the benefit of
expected synergies, revenue growth, future market development and the assembled workforce of the 15 stores. These benefits
are not recognised separately from goodwill as the future economic benefits arising from them cannot be reliably measured.
Included in the net profit for the period is $917,851 attributable to the additional business generated by the 15 stores.
Had the business combinations been effected at 1 July 2008, the revenue of the Group would be $103,018,546 and net profit
$17,065,382. The directors of the Group consider these ‘pro-forma’ numbers to represent an approximate measure of the
performance of the combined group on an annualised basis and to provide a reference point for future periods.
In determining the ‘pro-forma’ revenue and profit of the Group had the 15 stores been acquired at the beginning of the current
reporting period, the directors have:
• calculated depreciation and amortisation of plant and equipment acquired on the basis of the fair values arising in the initial
accounting for the business combination rather than the carrying amounts recognised in the pre-acquisition financial
statements
• based borrowing costs on the funding levels, credit ratings and debt/equity position of the Group after the business
combination
• utilised the un-audited 30 June 2008 financial information of the 15 stores.
N o t e s t o t h e F i n a n c i a l S t a t e m e n t s
70
29. ACQUISITIONS OF BUSINESS (continued)
The vendors of the Phoenix and Clarkson stores that were acquired during the year included Peter Cumins. Peter Cumins owned
50% of the stores concerned and received $850,432. The purchase of the Phoenix and Clarkson stores by Cash Converters
Stores Pty Ltd was conducted on an arm’s length basis and was overseen by those directors without shareholdings in the stores
concerned.
30. SEGMENTAL INFORMATION
Segment results, assets and liabilities include items directly attributable to a segment as well as those that can be allocated on
a reasonable basis.
Unallocated items mainly comprise income earning assets and revenue, interest bearing loans, borrowings and expense and
corporate assets and expenses. Segment capital expenditure is the total cost incurred during the period to acquire segment
assets that are expected to be used for more than one period.
BUSINESS SEGMENTS
The consolidated entity comprises the following main business segments based on the consolidated entity management
reporting system:
Store operations - This involves the sale of franchises for the retail sale of second hand goods, and sales of master licences
for the development of franchises in countries around the world and the corporate stores in the UK and Australia.
Financing - The financing division was originally established to provide loans to existing franchisees within Australia, for the
development of their businesses. In October 2006 this division was substantially expanded with the acquisition of MON-E and
the Safrock group of companies.
MON-E provides the software and back-office support for the cash advance business and Safrock provides unsecured personal
loans through the franchised network.
GEOGRAPHICAL SEGMENTS
In presenting information on the basis of geographical segments, segment revenue is based on the geographical location of each
business division.
Segment assets are based on geographical location of assets.

71
CASH
CONVERTERS
INTERNATIONAL
LIMITED
ANNUAL
REPORT
2009
PRIMARY REPORTING - BUSINESS SEGMENTS
External Sales Inter-segment Total2009 2008 2009 2008 2009 2008$ $ $ $ $ $
SEGMENT REVENUES
Store operations 65,273,844 43,257,441 - - 65,273,844 43,257,441
Financing 28,727,086 30,494,150 - - 28,727,086 30,494,150
Total of all segments 94,000,930 73,751,591 - - 94,000,930 73,751,591
Eliminations - -
Unallocated 396,970 654,291
Consolidated revenue 94,397,900 74,405,882
Total2009 2008$ $
SEGMENT RESULTS
Store operations 7,234,263 4,348,261
Financing 16,122,541 17,299,880
Total of all segments 23,356,804 21,648,141
Eliminations - -
Unallocated (49,572) (49,572)
Profit before income tax expense 23,307,232 21,598,569
Income tax expense (7,152,524) (6,423,983)
Profit for the period 16,154,708 15,174,586
Assets Liabilities2009 2008 2009 2008$ $ $ $
SEGMENT ASSETS & LIABILITIES
Store operations 51,165,829 45,573,210 16,141,762 17,244,573
Financing 63,617,285 53,688,267 16,151,692 7,970,995
Total of all segments 114,783,114 99,261,477 32,293,454 25,215,568
Consolidated 114,783,114 99,261,477 32,293,454 25,215,568
Store operations Financing2009 2008 2009 2008$ $ $ $
OTHER SEGMENT INFORMATION
Acquisition of segment assets 1,281,984 691,157 58,665 69,002
Depreciation and amortisation of segment assets 1,023,210 765,593 138,858 137,147
Significant expenses:
Bad debts/bad debt provision 852,955 427,290 3,966,077 3,852,253

N o t e s t o t h e F i n a n c i a l S t a t e m e n t s
72
30. SEGMENTAL INFORMATION (continued)
SECONDARY REPORTING - GEOGRAPHICAL SEGMENTS
Revenue Revenue Acquisition Acquisitionfrom from of of
external external Segment Segment segment segmentcustomers customers assets assets assets assets2009 2008 2009 2008 2009 2008$ $ $ $ $ $
Geographical segments
Australia 61,927,167 51,361,575 100,145,761 88,939,361 805,857 448,408
UK Division 32,110,057 22,710,115 14,635,893 10,318,133 534,792 311,751
US Division 13,270 9,446 1,460 3,983 - -
Rest of the World 347,406 324,746 - - - -
Consolidated 94,397,900 74,405,882 114,783,114 99,261,477 1,340,649 760,159
1. Intersegment pricing is based upon an agreed interest rate between Cash Converters Pty Ltd and Cash Converters Finance
Corporation Limited.
2. Under the geographical segment the revenue included under the ‘rest of the world’ is the percentage revenue due to the
consolidated entity from the sub-master franchisors at a contracted percentage rate of their revenue generated from
operations in their countries.
31. COMPANY DETAILS
Cash Converters International Limited is a listed public company, incorporated in Australia.
Registered office & Principal place of business:
Level 18, 37 St Georges Terrace
PERTH WA 6000
Telephone: +61 8 9221 9111

D i r e c t o r s ’ D e c l a r a t i o n
73
CASH
CONVERTERS
INTERNATIONAL
LIMITED
ANNUAL
REPORT
2009
The directors declare that:
(a) in the directors’ opinion, there are reasonable grounds to believe that the disclosing entity will be able to pay its debts as and
when they become due and payable;
(b) in the directors’ opinion, the attached financial statements and notes thereto are in accordance with the Corporations Act 2001,
including compliance with accounting standards and giving a true and fair view of the financial position and performance of the
company and the consolidated entity; and
(c) the directors have been given the declarations required by s.295A of the Corporations Act 2001.
At the date of this declaration, the Company is within the class of companies affected by ASIC Class Order 98/1418. The nature of
the deed of cross guarantee is such that each company which is party to the deed guarantees to each creditor payment in full of any
debt in accordance with the deed of cross guarantee.
In the directors’ opinion, there are reasonable grounds to believe that the Company and the companies to which the ASIC Class
Order applies, as detailed in Note 22 to the financial statements will, as a group, be able to meet any obligations or liabilities to which
they are or may become subject, by virtue of the Deed of Cross Guarantee.
Signed in accordance with a resolution of the directors made pursuant to s.295(5) of the Corporations Act 2001.
On behalf of the directors
Reginald Webb
Director
Perth, Western Australia
Date: 22 September 2009

I n d e p e n d e n t A u d i t R e p o r t
74

75
CASH
CONVERTERS
INTERNATIONAL
LIMITED
ANNUAL
REPORT
2009

I n d e p e n d e n c e D e c l a r a t i o n
76

77
S h a r e h o l d e r I n f o r m a t i o nTHE SHAREHOLDER INFORMATION SET OUT BELOW WAS APPLICABLE AS AT 11 SEPTEMBER 2009
CASH
CONVERTERS
INTERNATIONAL
LIMITED
ANNUAL
REPORT
2009
SUBSTANTIAL SHAREHOLDERS
Substantial shareholders (5% or above) in the Company and the number of equity securities in which they have an interest are set
out below:
Number of Percentage ofName ordinary shares issued shares
HSBC Custody Nominees 19,411,593 7.69
J P Morgan Nominees Australia Limited 16,215,228 6.42
DISTRIBUTION OF EQUITYHolders
Distribution schedule of holdings:
1 - 1,000 285
1,001 - 5,000 1327
5,001 - 10,000 1030
10,001 - 100,000 1919
100,001 and over 221
Total number of holders 4782
Number of holders of less than a marketable parcel 144
TWENTY LARGEST EQUITY SECURITY HOLDERSNumber of Percentage of
Name ordinary shares issued shares
HSBC Custody Nominees 19,411,593 7.69
J P Morgan Nominees Australia Limited 16,215,228 6.42
Alli Nominees Pty Ltd 11,976,097 4.74
Benos Nominees Pty Ltd 10,915,870 4.32
Hosking Financial Investments Pty Ltd 10,765,369 4.26
RBC Dexia Investor Services Australia Nominees Pty Ltd 9,159,334 3.63
Rand Holdings Pty Ltd 6,241,720 2.47
Australian Executor Trustees Limited 5,406,676 2.14
Mrs Heather Janette Hubbard & Mr Russell Leonard Tyrrell 4,163,694 1.65
Fawngrove Pty Ltd 4,136,880 1.64
Merle Cooke & Simon James Cooke 3,591,000 1.42
National Nominees Limited 3,335,806 1.32
Fawngrove Pty Ltd 2,900,000 1.15
Cogent Nominees Pty Limited 2,638,280 1.04
Jagen Nominees Pty Ltd 2,500,000 0.99
Citicorp Nominees Pty Limited 1,898,182 0.75
Mrs Andreana Debra Groom 1,883,000 0.75
Riolane Holdings Pty Ltd 1,781,406 0.71
Mr Michael Edward Constable 1,733,801 0.69
Mrs Merle Cooke 1,724,000 0.68
122,377,936 48.46
S h a r e h o l d e r I n f o r m a t i o n
78
VOTING RIGHTS
All shares are of one class with equal voting rights.
SHAREHOLDER INFORMATION
The Shareholder information set out above was applicable as at 11 September 2009.
SAFROCK EARN-OUT SHARES
In September 2006, the Company acquired the Safrock Group of Companies (comprising Safrock Finance Corporation (Qld) Pty Ltd,
Safrock Finance Corporation (WA) Pty Ltd, Safrock Finance Group Pty Ltd and Financial Administrators of Australia Pty Ltd). The
Company paid the sellers consideration of $14.1 million (in cash and fully paid ordinary shares in the Company issued at $0.40 per
share). In addition to this, the Company has agreed to issue the sellers up to 8,500,000 additional fully paid ordinary shares in the
Company (at $0.40 per share up to a maximum value of $3.4 million) as an earn-out if the Safrock Group of Companies exceeds
certain EBIT hurdles over the 2 years and 9 months following completion of the acquisition. The hurdles will be measured, and shares
potentially issued, at intervals during this period.
At a general meeting on 29 September 2006, the Company obtained a number of shareholder approvals, including approval under
ASX Listing Rule 7.1 to the issue of these additional earn-out shares. ASX Listing Rule 7.3.2 would usually require these shares to be
issued within 3 months of the date of such shareholder approval. However, given the length of the EBIT target periods for the Safrock
earn-out, ASX has granted the Company a waiver of the requirement in Listing Rule 7.3.2 to allow the earn-out shares to be issued
no later than 31 October 2009.
It is a condition of the ASX Listing Rule waiver that the Company state, in each annual report released during the period when earn-
out remain to be issued, the number of earn-out shares issued in the relevant year, and the number that remain to be issued. To date,
5,666,666 earn-out shares have been issued to the sellers of the Safrock Group of Companies, and a maximum number of 2,833,334
fully paid ordinary shares in the Company could still be issued, subject to the Safrock Group of Companies exceeding the relevant
EBIT performance hurdles.

79
This page has been left blank intentionally
CASH
CONVERTERS
INTERNATIONAL
LIMITED
ANNUAL
REPORT
2009

80
This page has been left blank intentionally