Embed Size (px)
Citation preview

1 of 37
INTERIM REPORT
FIRST-HALF 2009
Financial Highlights ...........................................................................................................................2 Business Review..................................................................................................................................5 Interim Consolidated Financial Statements..................................................................................16 Statement by the Person Responsible for the Interim report ......................................................36 Statutory Auditors' Report on the 2009 interim financial information ......................................37
2 of 37
Financial Highlights
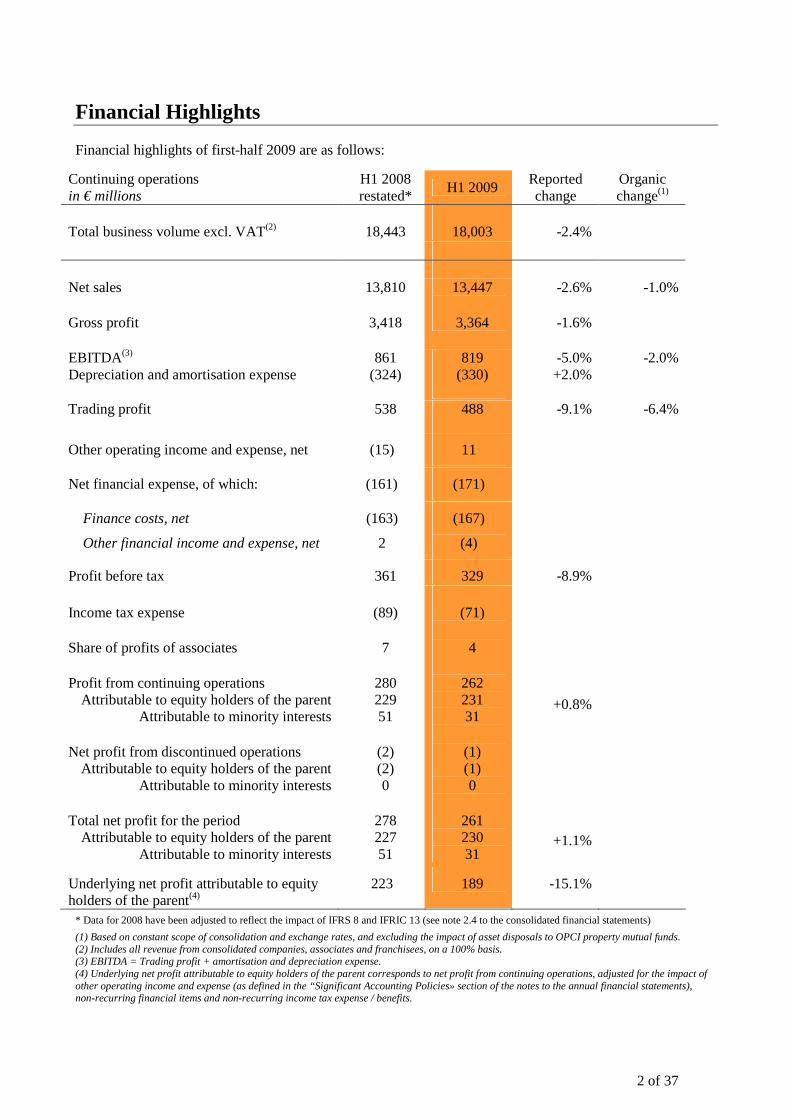
Financial highlights of first-half 2009 are as follows:
Continuing operations in € millions
H1 2008 restated* H1 2009 Reported
change Organic change(1)
Total business volume excl. VAT(2) 18,443 18,003 -2.4% Net sales Gross profit
13,810
3,418
13,447
3,364
-2.6%
-1.6%
-1.0%
EBITDA(3) 861 819 -5.0% -2.0% Depreciation and amortisation expense (324) (330) +2.0%
Trading profit 538 488 -9.1% -6.4%
Other operating income and expense, net (15) 11
Net financial expense, of which: (161) (171)
Finance costs, net
Other financial income and expense, net
(163)
2
(167)
(4)
Profit before tax 361 329 -8.9% Income tax expense Share of profits of associates Profit from continuing operations
Attributable to equity holders of the parent Attributable to minority interests
Net profit from discontinued operations
Attributable to equity holders of the parent Attributable to minority interests
Total net profit for the period
Attributable to equity holders of the parent Attributable to minority interests
(89)
7
280 229 51
(2) (2) 0
278 227 51
(71)
4
262 231 31
(1) (1) 0
261 230 31
+0.8%
+1.1%
Underlying net profit attributable to equity holders of the parent(4)
223 189 -15.1%
* Data for 2008 have been adjusted to reflect the impact of IFRS 8 and IFRIC 13 (see note 2.4 to the consolidated financial statements)
(1) Based on constant scope of consolidation and exchange rates, and excluding the impact of asset disposals to OPCI property mutual funds. (2) Includes all revenue from consolidated companies, associates and franchisees, on a 100% basis. (3) EBITDA = Trading profit + amortisation and depreciation expense. (4) Underlying net profit attributable to equity holders of the parent corresponds to net profit from continuing operations, adjusted for the impact of other operating income and expense (as defined in the “Significant Accounting Policies» section of the notes to the annual financial statements), non-recurring financial items and non-recurring income tax expense / benefits.

3 of 37
Significant events of the period
• On 5 March 2009, Casino announced the contribution of a €334 million portfolio of property assets
comprising Casino development projects and hypermarket retail and storage space to its subsidiary Mercialys under the Alcudia programme. The transaction, which represents a key milestone in the Alcudia programme, is part of the strategy underway since 2005 to capture and monetise the value of the Group's property assets. Mercialys issued 14.2 million new shares in exchange for the assets, raising Casino's interest in its capital from 59.7% to 66.1%.
• In line with the Mercialys IPO in 2005 and in order to comply with SIIC regulations, Casino decided to give its shareholders a direct stake in Mercialys's development and in the value creation potential represented by the asset contribution, as announced on March, 5th. To this end, on 2 June 2009, all shareholders (both ordinary and preferred non-voting shareholders) received a dividend distribution in Mercialys stock on the basis of one Mercialys share for every eight Casino shares held, in addition to the regular cash dividend of €2.57 per non-voting preferred share and €2.53 per ordinary share. Following the distribution of Mercialys shares, the Group's interest in Mercialys was reduced to approximately 50.4% of the share capital and voting rights.1 Casino intends to remain a long-term majority shareholder of Mercialys.
• On 20 March 2009, Casino announced the appointment of Antoine Giscard d'Estaing as the Group’s
Chief Financial Officer. On the same date, the mandatory annual negotiations on 2009 wages and working conditions led to an agreement signed by five French unions: FO, CFDT, UNSA, CFTC and Autonome. The agreement is part of the Group's employee relations revitalisation process launched across the Group in 2008 and focusing in particular on raising the lowest salaries and deploying a new series of measures to encourage gender equality.
• On 1 April 2009, Leader Price, Géant Casino Hypermarkets and Groupe Caillé, an independent Réunion retailer, confirmed that they were in talks concerning the rebranding of Caillé stores under the Leader Price and Géant Casino banners. Under the rebranding agreement:
o Two hypermarkets currently operated by Caillé under the Hyper Champion and Hypercrack banners will be rebranded as Géant Casino under a franchise agreement.
o The 28 supermarkets currently operated by Caillé under the Champion and Dia banners either directly or under a sub-franchise will be rebranded as Leader Price under a master franchise agreement.
The agreement, which represents an in-store business volume of nearly €400 million on a yearly basis, reflects the strong appeal of the Géant Casino and Leader Price banners and their Casino and Leader Price private label brands.
• On 2 April 2009, Casino announced an agreement with ING giving Casino a call option on ING's 5%
interest in Super de Boer. The call is exercisable at any time until 30 June 2010 at a price of €5 per share. Casino's call on the 6.2% interest in Super de Boer held by ING, RBS and Rabobank expired on 31 March 2009.
• On 4 May 2009, the Group increased its interest in CBD from 34.8% to 35.4%, following CBD shareholder approval of the issue to Casino of 2.2 million new shares of preferred stocks at a price of BRL 32.32 per share,2 making a total of BRL 71 million (€24 million). The issue was carried out in accordance with the May 2005 agreement with the Abilio Diniz family, under which Casino transferred to CBD the goodwill arising on its successive investments in the company in late 2006 in order to enable
1 Rallye and Casino together own 58.0% of the share capital and voting rights. 2 Volume weighted average price in the 15 trading days prior to 30 April 2009, date of the notice of shareholders' meeting.
4 of 37
CBD to benefit from tax deductibility of goodwill amortisation under Brazilian tax and securities legislation. Amortisation of the transferred goodwill will generate a total tax saving of BRL 517 million (€178 million) for CBD over an estimated period of six years beginning in 2008. In exchange, CBD has agreed to pass on 80% of the tax saving to Casino in the form of new CBD preferred stock. At the end of the goodwill amortisation period, Casino's interest in CBD will stand at about 38% based on the current share price.1
• On 15 June 2009, Casino converted all its 14,589,469 preferred non-voting shares into 12,505,254 ordinary shares on the basis of six ordinary shares for seven preferred non-voting shares, following approval at a special class meeting of holders of preferred non-voting shares and at the annual general meeting of shareholders on 19 May 2009. This conversion reduced the share capital by €3,188,848.95. The preferred non-voting stock has been transferred to the delisted compartment of NYSE Euronext Paris, where fractional rights will be tradable until 15 December 2009. The aim of the transaction was to simplify the Company's capital structure and enhance its stock market profile by increasing the free float.
1 If the minority shareholders exercise their pre-emptive subscription rights, CBD will pay part of Casino's share of the tax savings in cash, thereby reducing its percentage interest in CBD.
5 of 37
Business Review
• First-half results reflect the good positioning of the Group's business portfolio and the adaptability of its
banners to a difficult economic environment in both France and the international markets. • Net sales were down 2.6% due to the deconsolidation of two Franprix-Leader Price franchises at end-
December 2008 (negative scope effect of -0.5%) and to the decline of the Brazilian and Colombian currencies against the euro (negative currency effect of -1.1%).
• Organic* sales was down by a moderate 1.0% (versus 6.9% growth in 2008) but increased by 1.3%
excluding petrol and the calendar effect, driven by a resilient performance in France and continued robust growth in the international markets.
o In France, the convenience formats reported stable sales, helping contain the contraction in organic* sales to 4.2%.
o The international markets reported robust 5.0% organic* growth, driven by Brazil, Thailand and Vietnam.
• Trading profit was down 9.1% and 6.4% based on constant scope of consolidation and exchange rates.
o In France, the decline in trading profit was limited to 11.8% due to firm gross margins supported by the favourable impact of format and brand mix and a robust performance by the convenience formats, coupled with strict cost discipline through the rapid implementation of the cost-cutting plan.
o International trading profit contracted by 2.6% due to the decline of the Brazilian and Colombian currencies. On an organic* basis, trading profit was up 1.9%.
• Trading margin fell by 26 bp:
o In France, trading margin declined by 29 bp, but was supported by stable margins at the convenience formats and Franprix/Leader Price.
o International trading margin declined slightly by 16 bp, and was down only 10 bp on a comparable basis and at constant exchange rates, reflecting firm gross margins in all key countries offset to some extent by the adverse impact of strikes in Venezuela.
* Based on a comparable scope of consolidation and at constant exchange rates, excluding the impact of asset disposals to OPCI property mutual funds.

6 of 37
FRANCE (63% of net sales and 69% of consolidated trading profit)
In € millions First-half 2008 restated* First-half 2009 % change
% organic change
Net sales 9,008 8,530 -5.3% -4.2% Trading profit 384 339 -11.8% -9.8% Trading margin 4.3% 4.0% -29bp -24bp
* Data for 2008 have been adjusted to reflect the impact of IFRS 8 and IFRIC 13 (see note 2.4 to the consolidated financial statements)
In France, sales were down 5.3% to €8,530 million in first-half 2009, from €9,008 in first-half 2008. This resilient performance in the current economic environment attests to the solid positioning of the Group's business portfolio and was supported by satisfactory performances from the convenience formats (Monoprix, Casino supermarkets and Franprix), a tangible improvement in sales trends at Géant Casino in the second quarter and continued double-digit growth at Cdiscount. Despite the worsening economic environment, trading profit declined by a contained 11.8% to €339 million, and by 9.8% on an organic basis. This reflects firm gross margins thanks to the favourable impact of format and brand mix and the rapid implementation of the cost-cutting plan. Depreciation expense was up 2.0%. Trading margin therefore declined by 29 bp. The convenience formats and Franprix-Leader Price reported a stable trading margin, whilst the hypermarket margin was down compared with the previous year. Highlights by format were as follows:
• Géant Casino hypermarket sales were down 11.5% to €2,588 million, versus €2,924 million in first-half 2008. Excluding petrol, same-store sales were down 6.4%. The decline in same-store sales excluding petrol is slowing on a quarter-by-quarter basis (down 4.2% in the second quarter versus 8.6% in the first quarter) resulting from a substantial improvement in both footfall (down 3.7% versus 5.7%) and the average basket (down 0.5% versus 3.1%). This improvement reflects a recovery in food sales in the second quarter, with a moderate decline in same-store sales excluding petrol of 2.4% versus 7.4% in the first quarter, driven by the banner's stronger sales dynamics. As announced, Géant Casino stepped up its promotional activities as of end-March, supported by disciplined promotion management systems and targeted price cuts. This price investment was enabled by gains resulting from improved purchasing terms. Private label sales continued to grow rapidly. Non-food sales declined by 10.5% in the first half. In a difficult environment for discretionary spending, white and brown goods were particularly affected by consumer spending choices. The banner continued to refocus its offer on the most revenue-generating and highest margin categories such as apparel, home and leisure. Tight const control resulting mainly from in-store operational productivity gains partly offset the impact of lower sales. Géant's operating margin was down in the first half.
• Franprix/Leader Price sales declined by 5.6% to €2,018 million from €2,138 million in first-half 2008. Franprix delivered a satisfactory performance with stable same-store sales. Footfalls held firm, attesting to the robustness of the banner’s retail concept, which also benefits from the success of its new store concept. Leader Price's same-store sales decreased by 7.6% mainly due to a reduction in the average basket as discount store shoppers, generally more sensitive to the economic environment, continued to limit their spending. Footfalls remained virtually unchanged. Excluding the impact of the deconsolidation of two franchises at end-December 2008, total sales were down by just 1.1%, thanks to the significant contribution of new stores. Franprix maintained a
7 of 37
sustained pace of expansion, opening 27 new stores over the period whilst Leader Price opened some twenty new stores in line with its targets. Trading margin remained stable, illustrating the robustness of both banners' business models.
• Casino supermarket sales were down 2.9% to €1,605 million versus €1,654 million in first-half 2008. Same-store sales excluding petrol decreased by 3.1% due mainly to a 3.9% decline in footfalls whilst the average basket was up 0.9% thanks to robust private label sales. Total sales excluding petrol remained stable.
• Monoprix sales grew by 0.3% to €905 million versus €903 million in first-half 2008, supported by
continued expansion – 16 new stores were opened in the period – and the consolidation of Naturalia. Same-store sales were down 1.9%, a satisfactory performance reflecting Monoprix's differentiated positioning.
• Superette sales were down 3.0% to €731 million from €753 million in the prior-year period. The
decline was mainly due to a continued policy of store optimisation and rationalisation, with 214 stores closed during the period versus 190 new openings.
• Other businesses, primarily Cdiscount, Mercialys, Banque Casino and Casino Restauration, reported strong 7.5% growth, led by a solid performance at Cdiscount and Mercialys. Revenues from other businesses totalled €683 million versus €635 million in first-half 2008. Cdiscount reported further double-digit growth. Sales were up 14.9%, driven by an increase in the number of site visitors and an improved conversion rate, reflecting a successful strategy that combines extremely competitive prices with a highly responsive approach and a broadened product offering. Mercialys also reported ongoing double-digit growth in rental income and continued good management indicators. This performance bears out the robustness of the company's business model. The Group has also achieved a key milestone in its strategy of capturing the value of property assets by transferring 25 Alcudia projects with high restructuring and development potential to Mercialys in May 2009.
8 of 37
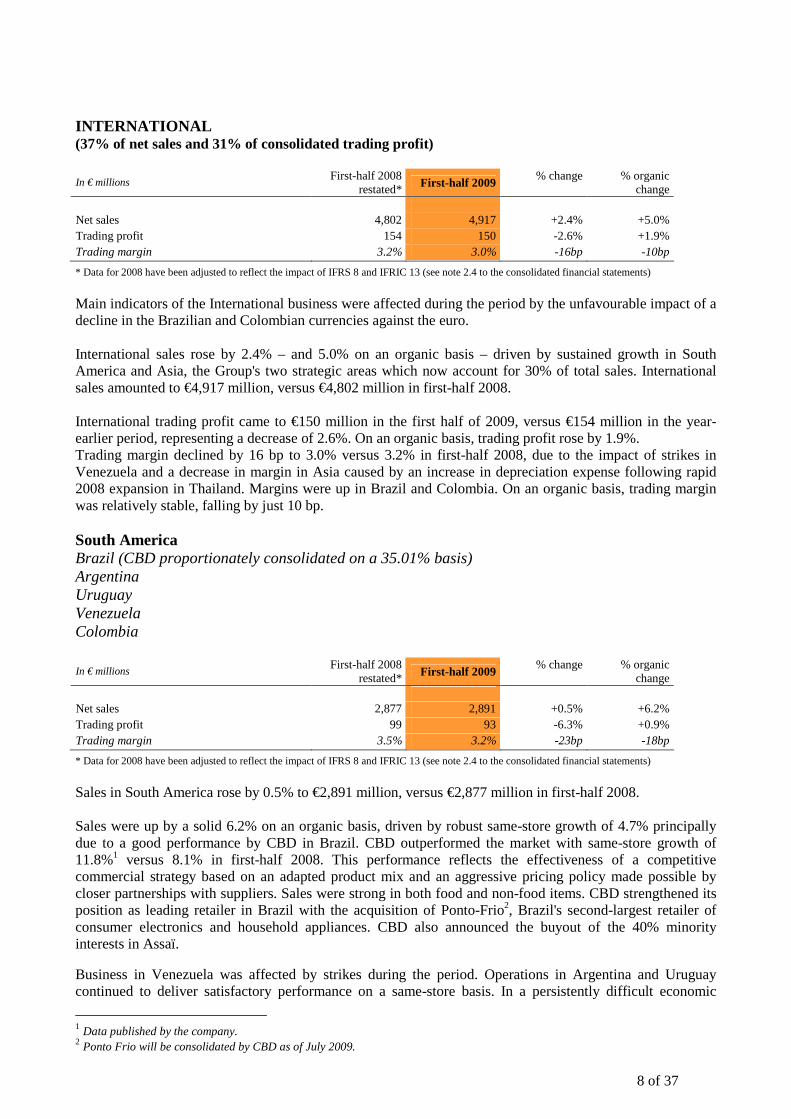
INTERNATIONAL (37% of net sales and 31% of consolidated trading profit) In € millions
First-half 2008 restated* First-half 2009
% change
% organic change
Net sales 4,802 4,917 +2.4% +5.0% Trading profit 154 150 -2.6% +1.9% Trading margin 3.2% 3.0% -16bp -10bp
* Data for 2008 have been adjusted to reflect the impact of IFRS 8 and IFRIC 13 (see note 2.4 to the consolidated financial statements)
Main indicators of the International business were affected during the period by the unfavourable impact of a decline in the Brazilian and Colombian currencies against the euro. International sales rose by 2.4% – and 5.0% on an organic basis – driven by sustained growth in South America and Asia, the Group's two strategic areas which now account for 30% of total sales. International sales amounted to €4,917 million, versus €4,802 million in first-half 2008. International trading profit came to €150 million in the first half of 2009, versus €154 million in the year-earlier period, representing a decrease of 2.6%. On an organic basis, trading profit rose by 1.9%. Trading margin declined by 16 bp to 3.0% versus 3.2% in first-half 2008, due to the impact of strikes in Venezuela and a decrease in margin in Asia caused by an increase in depreciation expense following rapid 2008 expansion in Thailand. Margins were up in Brazil and Colombia. On an organic basis, trading margin was relatively stable, falling by just 10 bp. South America Brazil (CBD proportionately consolidated on a 35.01% basis) Argentina Uruguay Venezuela Colombia
In € millions First-half 2008
restated* First-half 2009 % change
% organic
change Net sales 2,877 2,891 +0.5% +6.2% Trading profit 99 93 -6.3% +0.9% Trading margin 3.5% 3.2% -23bp -18bp
* Data for 2008 have been adjusted to reflect the impact of IFRS 8 and IFRIC 13 (see note 2.4 to the consolidated financial statements)
Sales in South America rose by 0.5% to €2,891 million, versus €2,877 million in first-half 2008. Sales were up by a solid 6.2% on an organic basis, driven by robust same-store growth of 4.7% principally due to a good performance by CBD in Brazil. CBD outperformed the market with same-store growth of 11.8%1 versus 8.1% in first-half 2008. This performance reflects the effectiveness of a competitive commercial strategy based on an adapted product mix and an aggressive pricing policy made possible by closer partnerships with suppliers. Sales were strong in both food and non-food items. CBD strengthened its position as leading retailer in Brazil with the acquisition of Ponto-Frio2, Brazil's second-largest retailer of consumer electronics and household appliances. CBD also announced the buyout of the 40% minority interests in Assaï. Business in Venezuela was affected by strikes during the period. Operations in Argentina and Uruguay continued to deliver satisfactory performance on a same-store basis. In a persistently difficult economic
1 Data published by the company. 2 Ponto Frio will be consolidated by CBD as of July 2009.
9 of 37
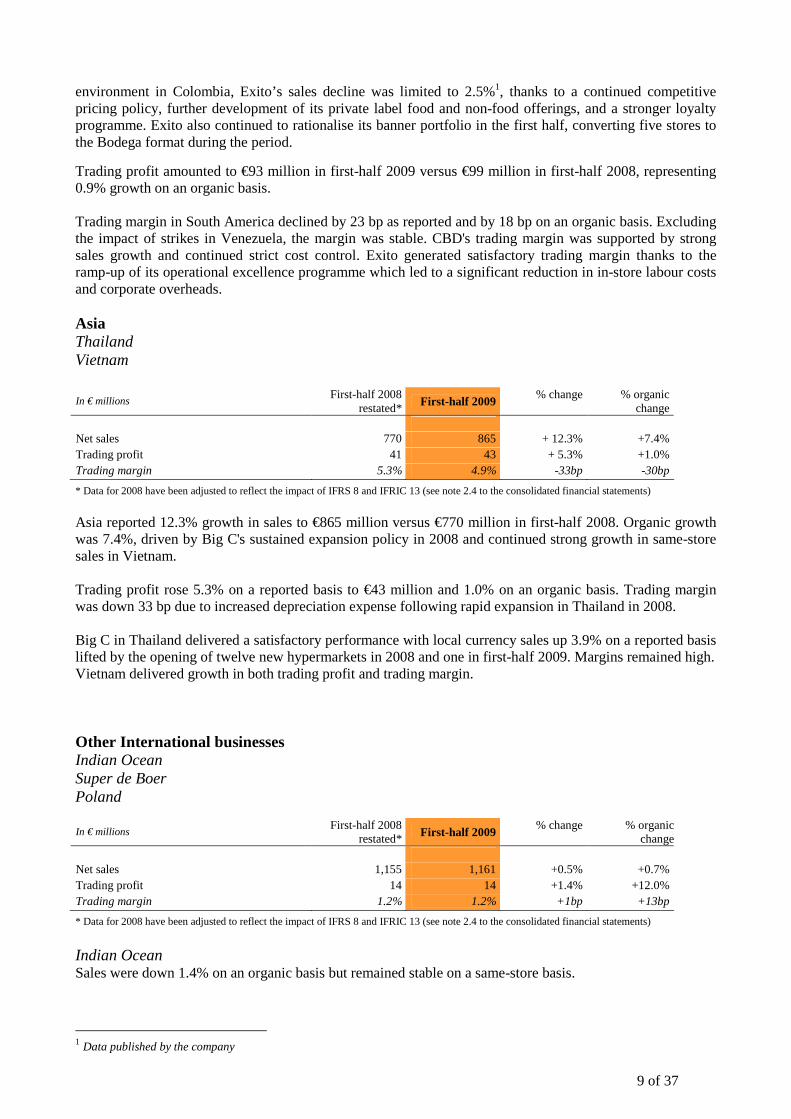
environment in Colombia, Exito’s sales decline was limited to 2.5%1, thanks to a continued competitive pricing policy, further development of its private label food and non-food offerings, and a stronger loyalty programme. Exito also continued to rationalise its banner portfolio in the first half, converting five stores to the Bodega format during the period.
Trading profit amounted to €93 million in first-half 2009 versus €99 million in first-half 2008, representing 0.9% growth on an organic basis. Trading margin in South America declined by 23 bp as reported and by 18 bp on an organic basis. Excluding the impact of strikes in Venezuela, the margin was stable. CBD's trading margin was supported by strong sales growth and continued strict cost control. Exito generated satisfactory trading margin thanks to the ramp-up of its operational excellence programme which led to a significant reduction in in-store labour costs and corporate overheads. Asia Thailand Vietnam In € millions
First-half 2008 restated*
First-half 2009 % change
% organic
change Net sales 770 865 + 12.3% +7.4% Trading profit 41 43 + 5.3% +1.0% Trading margin 5.3% 4.9% -33bp -30bp
* Data for 2008 have been adjusted to reflect the impact of IFRS 8 and IFRIC 13 (see note 2.4 to the consolidated financial statements)
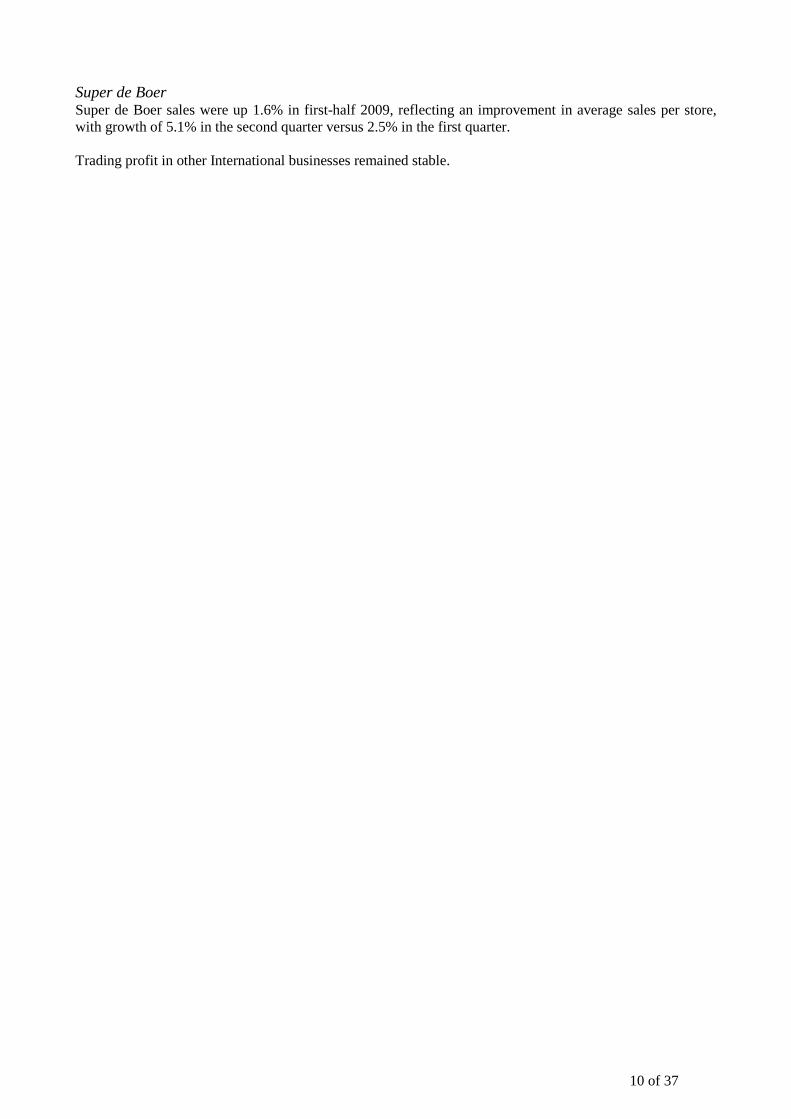
Asia reported 12.3% growth in sales to €865 million versus €770 million in first-half 2008. Organic growth was 7.4%, driven by Big C's sustained expansion policy in 2008 and continued strong growth in same-store sales in Vietnam. Trading profit rose 5.3% on a reported basis to €43 million and 1.0% on an organic basis. Trading margin was down 33 bp due to increased depreciation expense following rapid expansion in Thailand in 2008. Big C in Thailand delivered a satisfactory performance with local currency sales up 3.9% on a reported basis lifted by the opening of twelve new hypermarkets in 2008 and one in first-half 2009. Margins remained high. Vietnam delivered growth in both trading profit and trading margin. Other International businesses Indian Ocean Super de Boer Poland
In € millions First-half 2008
restated* First-half 2009 % change
% organic
change Net sales 1,155 1,161 +0.5% +0.7% Trading profit 14 14 +1.4% +12.0% Trading margin 1.2% 1.2% +1bp +13bp
* Data for 2008 have been adjusted to reflect the impact of IFRS 8 and IFRIC 13 (see note 2.4 to the consolidated financial statements)
Indian Ocean Sales were down 1.4% on an organic basis but remained stable on a same-store basis.
1 Data published by the company
10 of 37
Super de Boer Super de Boer sales were up 1.6% in first-half 2009, reflecting an improvement in average sales per store, with growth of 5.1% in the second quarter versus 2.5% in the first quarter. Trading profit in other International businesses remained stable.
11 of 37
Comments on the Consolidated Financial Statements Main changes in scope of consolidation Two Franprix-Leader Price franchises were deconsolidated at end-December 2008. This had a negative impact of €98 million on net sales, €11.5 million on EBITDA1 and €6.4 million on trading profit. The sale of store premises to a property mutual fund (OPCI) in December 2008 had a negative impact of €3.3 million on EBITDA1 and €1.9 million on trading profit. Main currency effects During the period, the Brazilian real and Colombian peso declined against the euro, although the negative effect was partially offset by the Thai baht's appreciation. Net sales Consolidated net sales for first-half 2009 fell by 2.6% to €13,447 million from €13,810 million in the year-earlier period. The currency effect was a negative 1.1% and changes in the scope of consolidation had a negative impact of 0.5%, mainly due to the deconsolidation of two Franprix-Leader Price franchises (see above). A detailed review of sales trends is presented above, in the sections on French and International operations. Trading profit Trading profit declined by 9.1% compared with first-half 2008 to €488 million. The currency effect was a negative 1.2% and changes in scope of consolidation had a negative impact of 1.5%, mainly due to the deconsolidation referred to above. Trading profit declined by 6.4% on an organic basis. A detailed review of trading profit growth is presented above, in the sections on French and International operations. Operating profit Other operating income and expense represented net income of €11 million in first-half 2009, compared with a net expense of €16 million in first-half 2008. The first-half 2009 figure mainly included:
• Gains on asset disposals for €109 million (including €139 million in gains on the distribution of Mercialys shares and a €28 million loss on the disposal of the Group's interest in Easy Colombia).
• €42 million in restructuring provisions and costs. • €40 million in provisions for contingencies. • €21 million in provisions for claims and litigations. • €6 million in asset impairment losses.
The net expense of €16 million in first-half 2008 mainly included:
• Gains on asset disposals (including a €23 million gain on the sale of shares in Mercialys) and impairment losses on non-current assets for a net amount of €24 million.
• €14 million in provisions for contingencies. • €11 million in restructuring provisions and costs, mainly at Exito and CBD. • A €5 million dilution loss on the Group's interest in CBD, following an increase of share capital.
After other operating income and expense, operating profit amounted to €500 million, down 4.4% from €522 million in first-half 2008.
1 EBITDA = trading profit + amortisation and depreciation expense

12 of 37
Profit before tax Profit before tax for the period declined by 8.9% to €329 million from €361 million in first-half 2008, after deducting net financial expense of €171 million compared with €161 million in the first six months of 2008. The total includes:
o Finance costs, net of €167 million, virtually unchanged from first-half 2008 (€163 million), reflecting a decrease in variable interest rates and an increase in average net debt.
o Other net financial expense of €4 million, compared with other net financial income of €2 million in first-half 2008.
Profit attributable to equity holders of the parent Income tax expense came to €71 million in first-half 2008 compared with €89 million in the year-earlier period. The effective tax rate in first-half 2009 was 21.7%. After adjustment for non-recurring exceptional items, the effective tax rate was 29.7% versus 29.4% in first-half 2008. The Group's share in profits of associates fell to €4 million from €7 million in first-half 2008. Profit attributable to minority interests totalled €31 million in first-half 2009, down from €51 million in first-half 2008. The decrease stemmed mainly from a €17 million adjustment to the split of Franprix-Leader Price earnings for the period 29 April to 31 December 2008 following the Baud dispute ruling. This amount had initially been allocated to minority interests (see note 17 to the consolidated financial statements). The adjustment reduced the amount of profit attributable to minority interests and increased the amount attributable to equity holders of the parent. In light of these factors, net profit from continuing operations attributable to equity holders of the parent rose by 0.8% to €231 million from €229 million in first-half 2008. The loss from discontinued operations attributable to equity holders of the parent amounted to €1 million, versus a loss of €2 million in first-half 2008. This loss corresponded both in first-half 2008 and 2009 to expenses associated with businesses disposed of in prior periods. Net profit attributable to equity holders of the parent rose 1.1% to €230 million from €227 million in first-half 2008. Cash flows Cash flow decreased 6.1% to €570 million from €607 million in first-half 2008. The change in working capital from €(895) million in first-half 2008 to €(916) million in first-half 2009 was mainly due to a one-off negative impact of the "LME" Act in France concerning supplier payment periods, for an amount of €350 million. In first-half 2009, capital expenditure amounted to €453 million versus €539 million in first-half 2008, a decrease of 16% in line with the Group's more selective capital spending policy. The Group continued to expand in the most buoyant and/or cash-efficient formats in France (Casino supermarkets, Monoprix, Franprix and Leader Price). In the international markets, capital expenditure dropped in Colombia and Thailand in the first-half after sustained expansion in 2008. Disposals amounted to €72 million, mainly due to disposals of stores and a warehouse in Colombia for €55 million.
13 of 37
Financial position At 30 June 2009, the Group had net debt of €6,003 million versus €4,851 million at 31 December 2008 and €5,868 million at 30 June 2008. The net debt to EBITDA1 ratio was stable at 3.1x at 30 June 2009 and gearing stood at 84% versus 83% a year earlier. The Group's liquidity was strengthened in first-half 2009 by bond issues totalling €750 million due in 2012 and 2013. A further €750 million of bonds were issued on 3 July 2009, making a total of €1.5 billion since 1 January 2009. Equity came to €7,146 million at 30 June 2009 compared with €7,031 million at 31 December 2008. Related party transactions The main related party transactions are described in Note 18 to the interim consolidated financial statements. 1EBITDA = Trading profit + amortisation and depreciation expense
Outlook for 2009 and conclusion The Group's performance in first-half 2009 illustrates its ability to adapt to a more difficult environment as well as to the effectiveness of its business model built around:
• A strategic focus on expanding the convenience formats, discount stores and e-business in France;
• A platform of international assets concentrated in high potential markets; • An assertive strategy to capture the value of property assets.
The Group intends to speed up the implementation of its action plans, with three main strategic objectives: 1. Strengthening the banners’ shopper appeal by:
• Continuing to develop the private label offering; • Optimising the pricing strategy; • Transforming in-depth the hypermarket operating model in France
2. Maintaining margins by:
• Improving purchasing conditions; • Ongoing action to cut costs, with the aim of generating more than €300 million in savings by
2010 (of which €150 million at end 2009). 3. Enhancing financial flexibility by:
• Improving free cash flow generation; • Reducing inventory by the equivalent of two days in 2009 and an additional day in 2010; • Applying a more selective approach to capital expenditure (with gross expenditure budgeted
at about €800 million in 2009 and €850 million in 2010); • Implementing a €1 billion asset disposal programme through to the end of 2010.
The Group therefore confirms its objective of improving its net debt/EBITDA ratio by end-2009 and bringing the ratio down to below 2.2x by the end of 2010. These forward-looking statements are based on what the Group believes to be reasonable assumptions, but are not an indication of future profits. They are subject to the risks and uncertainties inherent in the Group's businesses that could cause actual results to differ materially from the targets and outlook provided above. A fuller discussion of these risks and uncertainties is provided in the 2008 registration document.
14 of 37
Subsequent events • On 2 July 2009, the Arbitration Tribunal delivered its ruling in the dispute between Casino and the Baud
family. The tribunal found that Casino had legitimate grounds to remove the Baud family members from the management bodies of Franprix and Leader Price, thus acknowledging its right to take over operational management of Franprix and Leader Price. The tribunal consequently confirmed that the value of the Baud family's remaining interests in Franprix and Leader Price, respectively 5% and 25%, should be calculated on a multiple of 14 times the average of the 2006 and 2007 earnings of the two companies, which corresponds to the position taken by Casino in its previous financial statements. Subject to confirmation by an independent expert in charge of the calculation, Casino estimates that the final price should reach roughly €425 million including interest, as already accounted for in the Group’s consolidated financial statements (see note 17).
The other main subsequent events are described in Note 19 to the interim consolidated financial statements.
15 of 37
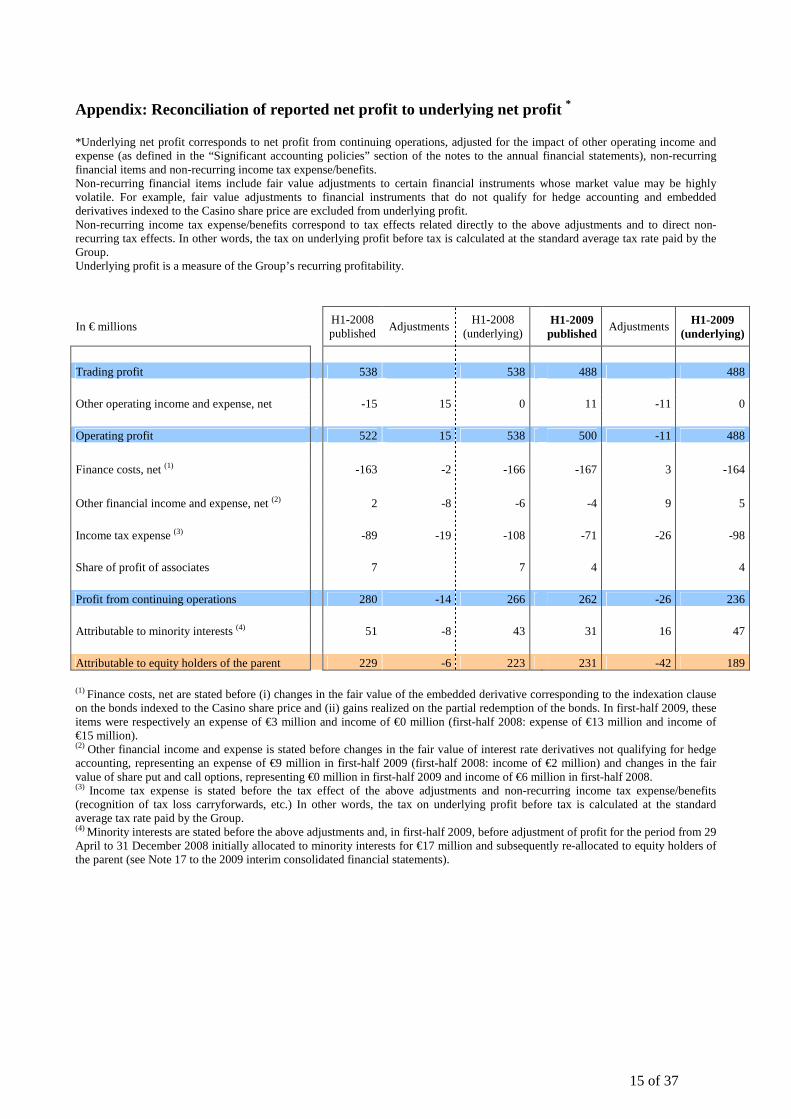
Appendix: Reconciliation of reported net profit to underlying net profit *
*Underlying net profit corresponds to net profit from continuing operations, adjusted for the impact of other operating income and expense (as defined in the “Significant accounting policies” section of the notes to the annual financial statements), non-recurring financial items and non-recurring income tax expense/benefits. Non-recurring financial items include fair value adjustments to certain financial instruments whose market value may be highly volatile. For example, fair value adjustments to financial instruments that do not qualify for hedge accounting and embedded derivatives indexed to the Casino share price are excluded from underlying profit. Non-recurring income tax expense/benefits correspond to tax effects related directly to the above adjustments and to direct non-recurring tax effects. In other words, the tax on underlying profit before tax is calculated at the standard average tax rate paid by the Group. Underlying profit is a measure of the Group’s recurring profitability.
In € millions
H1-2008 published
Adjustments H1-2008
(underlying)
H1-2009 published
Adjustments H1-2009 (underlying)
Trading profit 538 538 488 488 Other operating income and expense, net -15 15 0 11 -11 0 Operating profit 522 15 538 500 -11 488
Finance costs, net (1) -163 -2 -166 -167 3 -164
Other financial income and expense, net (2) 2 -8 -6 -4 9 5 Income tax expense (3) -89 -19 -108 -71 -26 -98 Share of profit of associates 7 7 4 4 Profit from continuing operations 280 -14 266 262 -26 236 Attributable to minority interests (4) 51 -8 43 31 16 47 Attributable to equity holders of the parent 229 -6 223 231 -42 189
(1) Finance costs, net are stated before (i) changes in the fair value of the embedded derivative corresponding to the indexation clause on the bonds indexed to the Casino share price and (ii) gains realized on the partial redemption of the bonds. In first-half 2009, these items were respectively an expense of €3 million and income of €0 million (first-half 2008: expense of €13 million and income of €15 million). (2) Other financial income and expense is stated before changes in the fair value of interest rate derivatives not qualifying for hedge accounting, representing an expense of €9 million in first-half 2009 (first-half 2008: income of €2 million) and changes in the fair value of share put and call options, representing €0 million in first-half 2009 and income of €6 million in first-half 2008. (3) Income tax expense is stated before the tax effect of the above adjustments and non-recurring income tax expense/benefits (recognition of tax loss carryforwards, etc.) In other words, the tax on underlying profit before tax is calculated at the standard average tax rate paid by the Group. (4) Minority interests are stated before the above adjustments and, in first-half 2009, before adjustment of profit for the period from 29 April to 31 December 2008 initially allocated to minority interests for €17 million and subsequently re-allocated to equity holders of the parent (see Note 17 to the 2009 interim consolidated financial statements).

16 of 37
Interim consolidated financial statements
The figures in the following tables have been rounded individually to the nearest million euros. Consequently, the totals and sub-totals may not correspond exactly to the sum of the reported amounts. CONSOLIDATED INCOME STATEMENT For the six-month periods ended 30 June 2009 and 30 June 2008
In € millions – unaudited Notes 30 June 2009 30 June 2008 Restated (*)
CONTINUING OPERATIONS Net sales 7 13,447 13,810 Cost of goods sold 8 (10,083) (10,392) Gross profit 3,363 3,418 Other income 7 81 74 Selling expenses 9 (2,416) (2,460) General and administrative expenses 9 (539) (495) Trading profit 488 538 as a % of sales 3.6 3.8 Other operating income 10 165 24 Other operating expense 10 (154) (40) Operating profit 500 522 as a % of sales 3.7 3.8 Income from cash and cash equivalents 15 27 Finance costs (182) (190) Finance costs, net (167) (163) Other financial income 58 48 Other financial expense (62) (46) Profit before tax 329 361 as a % of sales 2.4 2.6 Income tax expense (71) (89) Share of profits of associates 4 7 Profit from continuing operations 262 280 as a % of sales 1.9 2.0 Attributable to equity holders of the parent 231 229 Attributable to minority interests 31 51 DISCONTINUED OPERATIONS Net profit/(loss) from discontinued operations (1) (2) Attributable to equity holders of the parent (1) (2) Attributable to minority interests - - CONTINUING AND DISCONTINUED OPERATIONS Profit for the period 261 278 Attributable to equity holders of the parent 230 227 Attributable to minority interests 31 51
(*) See note 2.4

17 of 37
Earnings per share
In euros – unaudited 30 June 2009 30 June 2008 restated (*)
From continuing operations Basic earnings per share 1.94 1.82 Diluted earnings per share 1.94 1.82 From continuing and discontinued operations Basic earnings per share 1.93 1.81 Diluted earnings per share 1.93 1.81
(*) To ensure comparability from one period to the next, earnings per share at 30 June 2008 have been adjusted retrospectively for (i) the accounting change arising from the adoption of IFRIC 13 (see note 2.4.2) and (ii) the conversion of preferred non-voting shares into ordinary shares (see note 3). The 2008 figures are therefore presented as if both these events had already taken place. At 30 June 2009, the share capital comprised only ordinary shares. Historical data and the impacts of the accounting change and conversion of preferred non-voting shares are summarised below:
In euros – unaudited 30 June
2008 published
30 June 2008 Accounting
change
30 June 2008 Conversion of preferred non-voting shares
30 June 2008 restated
Earnings per ordinary share
From continuing operations Basic earnings per share 1.79 (0.01) 0.05 1.82 Diluted earnings per share 1.78 (0.01) 0.05 1.82 From continuing and discontinued operations
Basic earnings per share 1.78 (0.01) 0.05 1.81 Diluted earnings per share 1.77 (0.01) 0.05 1.81 Earnings per preferred non-voting share
From continuing operations Basic earnings per share 1.83 (0.01) - - Diluted earnings per share 1.82 (0.01) - - From continuing and discontinued operations
Basic earnings per share 1.81 (0.01) - - Diluted earnings per share 1.81 (0.01) - -
18 of 37
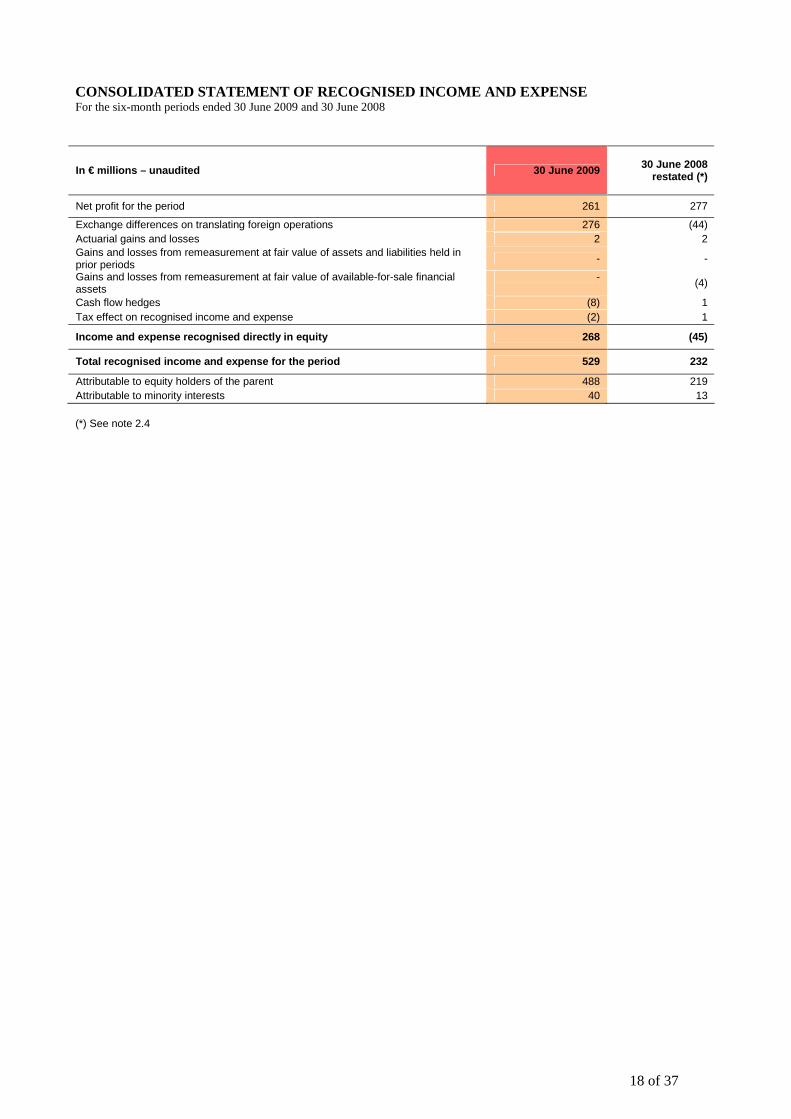
CONSOLIDATED STATEMENT OF RECOGNISED INCOME AND EXP ENSE For the six-month periods ended 30 June 2009 and 30 June 2008
In € millions – unaudited 30 June 2009 30 June 2008 restated (*)
Net profit for the period 261 277
Exchange differences on translating foreign operations 276 (44) Actuarial gains and losses 2 2 Gains and losses from remeasurement at fair value of assets and liabilities held in prior periods
- -
Gains and losses from remeasurement at fair value of available-for-sale financial assets
-
(4)
Cash flow hedges (8) 1 Tax effect on recognised income and expense (2) 1
Income and expense recognised directly in equity 268 (45)
Total recognised income and expense for the period 529 232
Attributable to equity holders of the parent 488 219 Attributable to minority interests 40 13 (*) See note 2.4
19 of 37
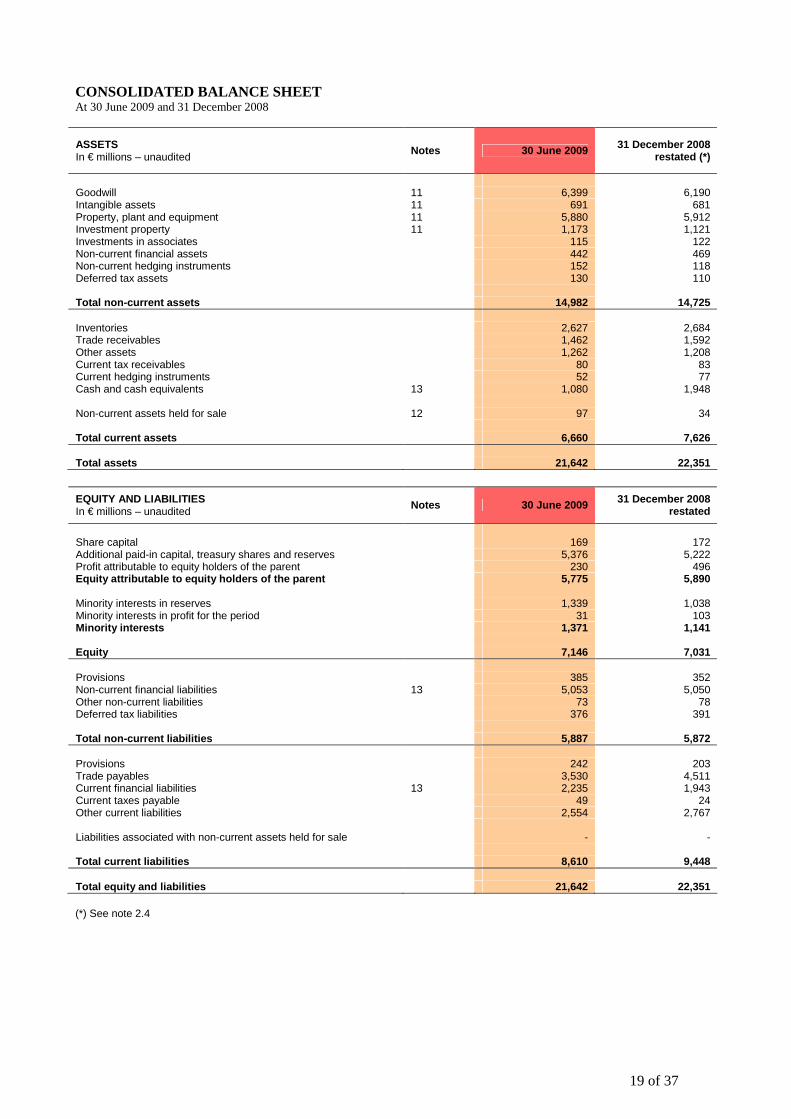
CONSOLIDATED BALANCE SHEET At 30 June 2009 and 31 December 2008
ASSETS In € millions – unaudited
Notes 30 June 2009 31 December 2008 restated (*)
Goodwill 11 6,399 6,190 Intangible assets 11 691 681 Property, plant and equipment 11 5,880 5,912 Investment property 11 1,173 1,121 Investments in associates 115 122 Non-current financial assets 442 469 Non-current hedging instruments 152 118 Deferred tax assets 130 110 Total non-current assets 14,982 14,725 Inventories 2,627 2,684 Trade receivables 1,462 1,592 Other assets 1,262 1,208 Current tax receivables 80 83 Current hedging instruments 52 77 Cash and cash equivalents 13 1,080 1,948 Non-current assets held for sale 12 97 34 Total current assets 6,660 7,626 Total assets 21,642 22,351
EQUITY AND LIABILITIES In € millions – unaudited
Notes 30 June 2009 31 December 2008 restated
Share capital 169 172 Additional paid-in capital, treasury shares and reserves 5,376 5,222 Profit attributable to equity holders of the parent 230 496 Equity attributable to equity holders of the parent 5,775 5,890 Minority interests in reserves 1,339 1,038 Minority interests in profit for the period 31 103 Minority interests 1,371 1,141 Equity 7,146 7,031 Provisions 385 352 Non-current financial liabilities 13 5,053 5,050 Other non-current liabilities 73 78 Deferred tax liabilities 376 391 Total non-current liabilities 5,887 5,872 Provisions 242 203 Trade payables 3,530 4,511 Current financial liabilities 13 2,235 1,943 Current taxes payable 49 24 Other current liabilities 2,554 2,767 Liabilities associated with non-current assets held for sale - - Total current liabilities 8,610 9,448 Total equity and liabilities 21,642 22,351 (*) See note 2.4
20 of 37
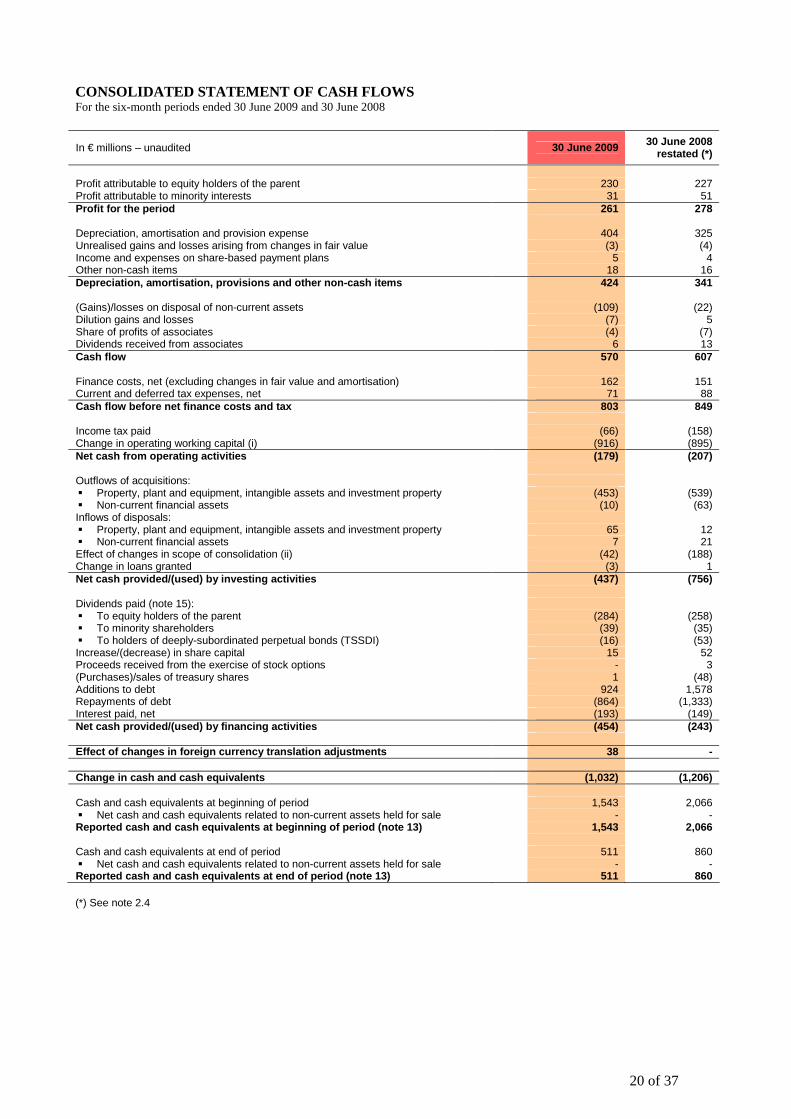
CONSOLIDATED STATEMENT OF CASH FLOWS For the six-month periods ended 30 June 2009 and 30 June 2008
In € millions – unaudited 30 June 2009 30 June 2008 restated (*)
Profit attributable to equity holders of the parent 230 227 Profit attributable to minority interests 31 51 Profit for the period 261 278 Depreciation, amortisation and provision expense 404 325 Unrealised gains and losses arising from changes in fair value (3) (4) Income and expenses on share-based payment plans 5 4 Other non-cash items 18 16 Depreciation, amortisation, provisions and other no n-cash items 424 341 (Gains)/losses on disposal of non-current assets (109) (22) Dilution gains and losses (7) 5 Share of profits of associates (4) (7) Dividends received from associates 6 13 Cash flow 570 607 Finance costs, net (excluding changes in fair value and amortisation) 162 151 Current and deferred tax expenses, net 71 88 Cash flow before net finance costs and tax 803 849 Income tax paid (66) (158) Change in operating working capital (i) (916) (895) Net cash from operating activities (179) (207) Outflows of acquisitions: � Property, plant and equipment, intangible assets and investment property (453) (539) � Non-current financial assets (10) (63) Inflows of disposals: � Property, plant and equipment, intangible assets and investment property 65 12 � Non-current financial assets 7 21 Effect of changes in scope of consolidation (ii) (42) (188) Change in loans granted (3) 1 Net cash provided/(used) by investing activities (437) (756) Dividends paid (note 15): � To equity holders of the parent (284) (258) � To minority shareholders (39) (35) � To holders of deeply-subordinated perpetual bonds (TSSDI) (16) (53) Increase/(decrease) in share capital 15 52 Proceeds received from the exercise of stock options - 3 (Purchases)/sales of treasury shares 1 (48) Additions to debt 924 1,578 Repayments of debt (864) (1,333) Interest paid, net (193) (149) Net cash provided/(used) by financing activities (454) (243) Effect of changes in foreign currency translation a djustments 38 - Change in cash and cash equivalents (1,032) (1,206) Cash and cash equivalents at beginning of period 1,543 2,066 � Net cash and cash equivalents related to non-current assets held for sale - - Reported cash and cash equivalents at beginning of period (note 13) 1,543 2,066 Cash and cash equivalents at end of period 511 860 � Net cash and cash equivalents related to non-current assets held for sale - - Reported cash and cash equivalents at end of period (note 13) 511 860 (*) See note 2.4
21 of 37
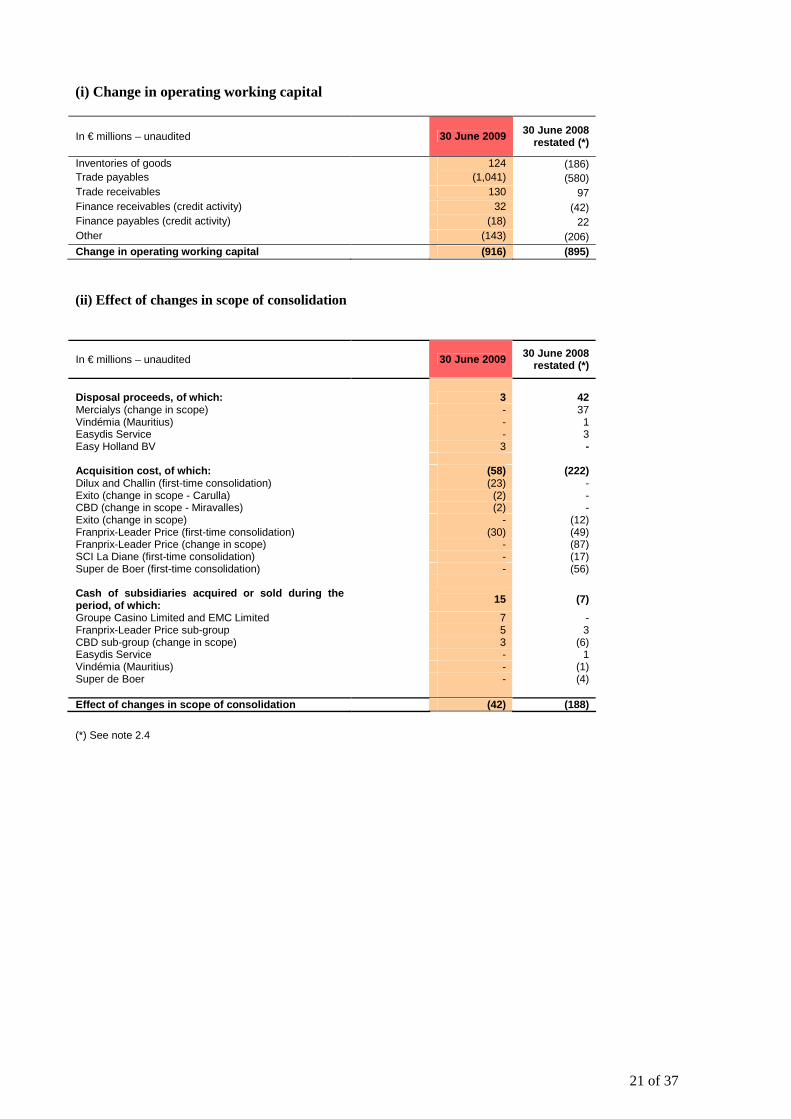
(i) Change in operating working capital
In € millions – unaudited 30 June 2009 30 June 2008 restated (*)
Inventories of goods 124 (186) Trade payables (1,041) (580) Trade receivables 130 97 Finance receivables (credit activity) 32 (42) Finance payables (credit activity) (18) 22 Other (143) (206) Change in operating working capital (916) (895)
(ii) Effect of changes in scope of consolidation
In € millions – unaudited 30 June 2009 30 June 2008 restated (*)
Disposal proceeds, of which: 3
42
Mercialys (change in scope) - 37 Vindémia (Mauritius) - 1 Easydis Service - 3 Easy Holland BV 3 - Acquisition cost, of which: (58) (222) Dilux and Challin (first-time consolidation) (23) - Exito (change in scope - Carulla) (2) - CBD (change in scope - Miravalles) (2) - Exito (change in scope) - (12) Franprix-Leader Price (first-time consolidation) (30) (49) Franprix-Leader Price (change in scope) - (87) SCI La Diane (first-time consolidation) - (17) Super de Boer (first-time consolidation) - (56) Cash of subsidiaries acquired or sold during the period, of which: 15 (7)
Groupe Casino Limited and EMC Limited 7 - Franprix-Leader Price sub-group 5 3 CBD sub-group (change in scope) 3 (6) Easydis Service - 1 Vindémia (Mauritius) - (1) Super de Boer - (4) Effect of changes in scope of consolidation (42) (188)
(*) See note 2.4
22 of 37
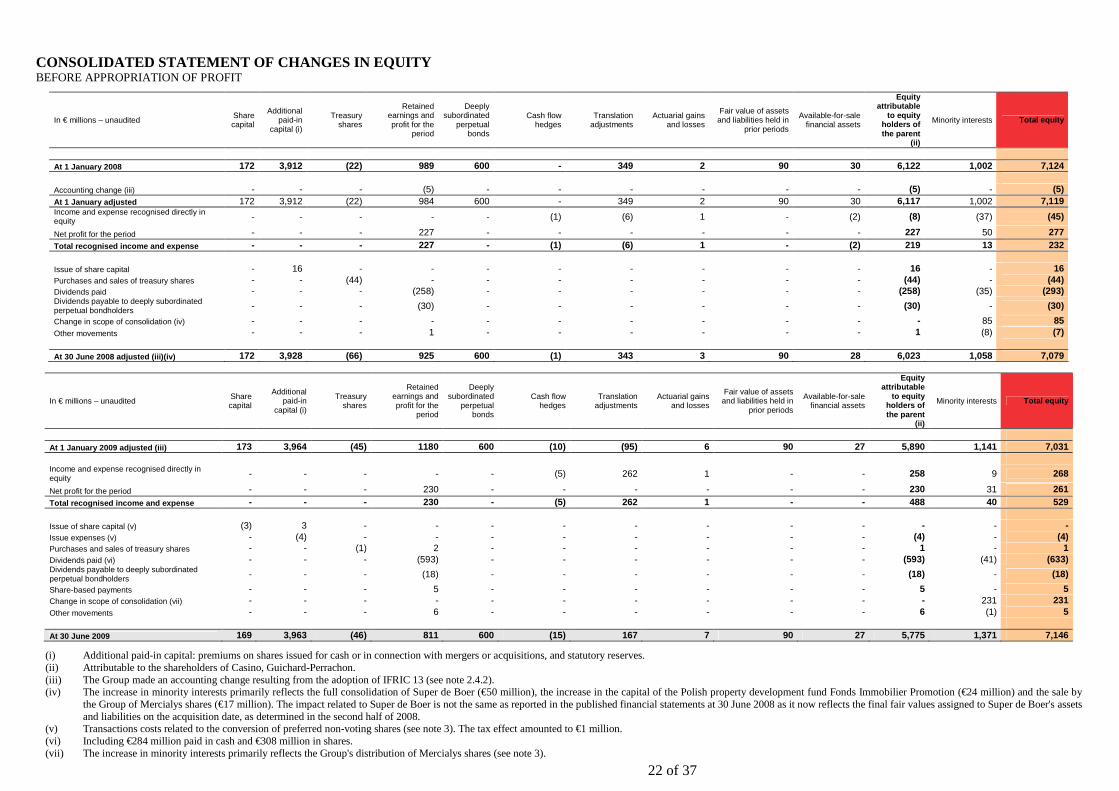
CONSOLIDATED STATEMENT OF CHANGES IN EQUITY BEFORE APPROPRIATION OF PROFIT
In € millions – unaudited Share capital
Additional paid-in
capital (i)
Treasury shares
Retained earnings and profit for the
period
Deeply subordinated
perpetual bonds
Cash flow hedges
Translation adjustments
Actuarial gains and losses
Fair value of assets and liabilities held in
prior periods
Available-for-sale financial assets
Equity attributable
to equity holders of the parent
(ii)
Minority interests Total equity
At 1 January 2008 172 3,912 (22) 989 600 - 349 2 90 30 6,122 1,002 7,124 Accounting change (iii) - - - (5) - - - - - - (5) - (5) At 1 January adjusted 172 3,912 (22) 984 600 - 349 2 90 30 6,117 1,002 7,119 Income and expense recognised directly in equity - - - - - (1) (6) 1 - (2) (8) (37) (45)
Net profit for the period - - - 227 - - - - - - 227 50 277 Total recognised income and expense - - - 227 - (1) (6) 1 - (2) 219 13 232 Issue of share capital - 16 - - - - - - - - 16 - 16 Purchases and sales of treasury shares - - (44) - - - - - - - (44) - (44) Dividends paid - - - (258) - - - - - - (258) (35) (293) Dividends payable to deeply subordinated perpetual bondholders - - - (30) - - - - - - (30) - (30)
Change in scope of consolidation (iv) - - - - - - - - - - - 85 85 Other movements - - - 1 - - - - - - 1 (8) (7) At 30 June 2008 adjusted (iii)(iv) 172 3,928 (66) 925 600 (1) 343 3 90 28 6,023 1,058 7,079
In € millions – unaudited Share capital
Additional paid-in
capital (i)
Treasury shares
Retained earnings and profit for the
period
Deeply subordinated
perpetual bonds
Cash flow hedges
Translation adjustments
Actuarial gains and losses
Fair value of assets and liabilities held in
prior periods
Available-for-sale financial assets
Equity attributable
to equity holders of the parent
(ii)
Minority interests Total equity
At 1 January 2009 adjusted (iii) 173 3,964 (45) 1180 600 (10) (95) 6 90 27 5,890 1,141 7,031 Income and expense recognised directly in equity - - - - - (5) 262 1 - - 258 9 268
Net profit for the period - - - 230 - - - - - - 230 31 261 Total recognised income and expense - - - 230 - (5) 262 1 - - 488 40 529 Issue of share capital (v) (3) 3 - - - - - - - - - - - Issue expenses (v) - (4) - - - - - - - - (4) - (4) Purchases and sales of treasury shares - - (1) 2 - - - - - - 1 - 1 Dividends paid (vi) - - - (593) - - - - - - (593) (41) (633) Dividends payable to deeply subordinated perpetual bondholders - - - (18) - - - - - - (18) - (18)
Share-based payments - - - 5 - - - - - - 5 - 5 Change in scope of consolidation (vii) - - - - - - - - - - - 231 231 Other movements - - - 6 - - - - - - 6 (1) 5 At 30 June 2009 169 3,963 (46) 811 600 (15) 167 7 90 27 5,775 1,371 7,146
(i) Additional paid-in capital: premiums on shares issued for cash or in connection with mergers or acquisitions, and statutory reserves. (ii) Attributable to the shareholders of Casino, Guichard-Perrachon. (iii) The Group made an accounting change resulting from the adoption of IFRIC 13 (see note 2.4.2). (iv) The increase in minority interests primarily reflects the full consolidation of Super de Boer (€50 million), the increase in the capital of the Polish property development fund Fonds Immobilier Promotion (€24 million) and the sale by
the Group of Mercialys shares (€17 million). The impact related to Super de Boer is not the same as reported in the published financial statements at 30 June 2008 as it now reflects the final fair values assigned to Super de Boer's assets and liabilities on the acquisition date, as determined in the second half of 2008.
(v) Transactions costs related to the conversion of preferred non-voting shares (see note 3). The tax effect amounted to €1 million. (vi) Including €284 million paid in cash and €308 million in shares. (vii) The increase in minority interests primarily reflects the Group's distribution of Mercialys shares (see note 3).

23 of 37
GROUPE CASINO NOTES TO THE CONSOLIDATED FINANCIAL STATEMENTS Six months ended 30 June 2009 Note 1: Reporting entity Casino, Guichard-Perrachon is a French société anonyme listed on compartment A of Euronext Paris. In these notes, the Company and its subsidiaries are referred to as "the Group" or "Casino". The interim consolidated financial statements for the six months ended 30 June 2009 reflect the accounting situation of the Company, its subsidiaries and jointly-controlled companies, as well as the Group's interests in associates. They have been the subject of a limited review by the Auditors. The condensed interim consolidated financial statements were approved for publication by the Board of Directors on 26 August 2009. Note 2: Basis of preparation of the financial statements and accounting policies 2.1. Statement of compliance Pursuant to European regulation 1606/2002 of 19 July 2002, the condensed consolidated financial statements have been prepared in accordance with the standards and interpretations issued by the International Accounting Standards Board (IASB), as adopted by the European Union and mandatory on 30 June 2009 as of the date when the Board of Directors approved the financial statements. These standards and interpretations include international accounting standards (IAS) and international financial reporting standards (IFRS), as well as interpretations issued by the Standing Interpretations Committee (SIC) and the International Financial Interpretations Committee (IFRIC). They are available on the European Commission's website (http://ec.europa.eu/internal_market/accounting/ias_fr.htm). 2.2. Basis of preparation The condensed interim consolidated financial statements have been prepared in accordance with IAS 34 - Interim Financial Reporting. They do not contain all the information and notes included in a complete set of annual financial statements and should therefore be read in conjunction with the consolidated financial statements for the year ended 31 December 2008, which are available on request from the company's head office at 1 Esplanade de France, Saint Etienne, and can be downloaded from the Group's website www.groupe-casino.fr. The consolidated financial statements are presented in millions of euros, the Group's functional and presentation currency. The figures in the tables have been individually rounded to the nearest million euros. Consequently, the totals and sub-totals may not correspond exactly to the sum of the reported amounts. 2.3. Summary of significant accounting policies The accounting polices used to prepare the condensed interim consolidated financial statements are unchanged compared with those applied in the 2008 consolidated financial statements, with the exception of the new standards and interpretations described below. 2.3.1. New standards and interpretations applicable as of 1 January 2009 The following revised standards, new standards and new interpretations are mandatory as of 2009: � IAS 1 Revised– Presentation of Financial Statements; � IFRS 8 – Operating Segments;
24 of 37
� IFRIC 13 – Customer Loyalty Programmes; � Amendment to IAS 23 – Borrowing Costs; � Amendment to IFRS 2 – Vesting Conditions and Cancellations; � Amendments to IAS 1 and IAS 32 – Puttable Instruments and Obligations Arising on Liquidation; � IFRIC 16 – Hedges of a Net Investment in a Foreign Operation; � IFRIC 15 – Agreements for the Construction of Real Estate (adopted by the European Union after 30
June 2009). They had no material effect on the consolidated financial statements. The application of IFRIC 13, IAS 23 Revised and IFRS 8 is described in more detail in note 2.4. 2.3.2. New standards and interpretations not yet applicable, adopted by the European Union at 30 June 2009 � IAS 27 Revised – Consolidated and Separate Financial Statements, mandatory for annual periods
beginning on or after 1 July 2009; � IFRS 3 Revised – Business Combinations, applicable to business combinations completed in the first
annual period beginning on or after 1 July 2009; � IFRIC 12 – Service Concession Arrangements, mandatory for annual periods beginning on or after 29
July 2009. � Amendment to IFRS 5 – Sale Plan Resulting in Loss of Control of a Subsidiary, mandatory for annual
periods beginning on or after 1 July 2009. The Group has not early adopted any of these new standards or interpretations. With the exception of the accounting treatment of put options on minority interests, which is currently being examined, IAS 27 Revised and IFRS 3 Revised will not have any impact on the consolidated financial statements on their date of application, but will have an impact on the Group's future acquisitions. The application of IFRIC 12 will not have any impact on the Group's consolidated financial statements. The amendment to IFRS 5 will be applied prospectively when adopted by the Group. 2.3.3. New standards and interpretations not yet applicable, not yet adopted by the European Union The following standards and interpretations issued by the IASB have not yet been adopted by the European Union: � Amendments to IFRIC 9 – Reassessment of Embedded Derivatives and IAS 39 – Financial Instruments:
Recognition and Measurement, mandatory for annual periods ended on or after 30 June 2009; � Amendment to IAS 39 – Financial Instruments: Recognition and Measurement "Eligible Hedged Items",
mandatory for annual periods beginning on or after 1 July 2009; � Amendment to IFRS 2 – Share-based Payment: Group Cash-settled Share-based Payment Transactions,
mandatory for annual periods beginning on or after 1 January 2010; � IFRIC 17 – Distributions of Non-cash Assets to Owners, mandatory for annual periods beginning on or
after 1 July 2009; � IFRIC 18 – Transfers of Assets from Customers, mandatory for annual periods beginning on or after 1
July 2009; � IFRS 7 – Financial Instruments: Disclosures, mandatory for annual periods beginning on or after 1
January 2009; � Annual improvements to IFRSs (16 April 2009), most of which are mandatory for annual periods
beginning on or after 1 January 2010.
2.4. Changes to previously published financial statements 2.4.1 Application of IFRS 8 IFRS 8 – Operating Segments is mandatory as of 1 January 2009 and replaces IAS 14 – Segment Reporting. It requires disclosure of financial information by reportable operating segment as opposed to primary and secondary reporting format (geographical and business segment).
25 of 37
Reportable operating segments must now reflect the internal reporting system used for management purposes. The impacts of this standard, which is applicable retrospectively, are presented in note 6. 2.4.2 Application of IFRIC 13 The Group has applied IFRIC 13 – Customer Loyalty Programmes as of 1 January 2009. This standard sets out the accounting treatment for award credits granted to customers upon an initial sale transaction for use against a future sale transaction. Award credits are recognised as a separately identifiable component of the initial sales transaction and their fair value at inception is deducted from the revenue generated by the sale. When the award credit is used by the customer, the revenue deferred at inception is recognised and the cost of the award credit is either deducted from the cost of goods sold (in the case of exchange vouchers) or from revenue (in the case of money vouchers). The Group has two types of loyalty plan covered by IFRIC 13: � a plan that awards points to customers when they purchase goods in Group stores, which may be cashed
in for money vouchers or gift vouchers; � a money voucher plan. The Group previously recognised a provision for the costs incurred in granting award credits to its customers. Under IFRIC 13, the Group now accounts for the fair value of the award credits granted (that is, the fair value to the customer), as opposed to their cost. Consequently, the impact of customer loyalty plans is now presented in the balance sheet as deferred income rather than provisions and in the income statement as a deduction from revenue or in the cost of goods sold, as applicable, rather than in marketing costs.
26 of 37
Following the retrospective application of IFRIC 13, the financial information previously published has been adjusted accordingly as presented below (in € millions): Balance sheet at 1 January 2008: Net increase in deferred tax assets 3 Net increase in deferred income 68 Decrease in trade payables 13 Decrease in provisions for liabilities and charges 47 Net decrease in total equity 5 Balance sheet at 31 December 2008: Net increase in deferred tax assets 4 Net increase in deferred income 64 Decrease in trade payables 9 Decrease in provisions for liabilities and charges 45 Net decrease in total equity 6 Income statement for the six months to 30 June 2008: Net decrease in revenue (3) Net decrease in cost of goods sold 7 Net increase in gross profit 4 Net decrease in other income (8) Net decrease in selling expenses 2 Net decrease in trading profit (2) Net decrease in income tax expense 1 Net decrease in profit from continuing operations (1) 2.4.3 Application of IAS 23 Revised Contrary to the option available and used by the Group until last year, borrowing costs that are directly attributable to the acquisition, construction or production of a qualifying asset are now capitalised as part of the cost of that asset when the commencement date for capitalisation is on or after 1 January 2009 and typically when the construction period is more than six months. The prospective application of IAS 23 Revised had little impact on the consolidated financial statements for the six months ended 30 June 2009; interest capitalised during the period amounted to €1 million. 2.5. Use of estimates and judgments The preparation of consolidated financial statements requires the use of estimates, judgments and assumptions that affect the reported amount of certain assets and liabilities and income and expenses, as well as the disclosures made in certain notes to the consolidated financial statements. Due to the inherent uncertainty of assumptions, actual results may differ from the estimates. Estimates and assessments are reviewed at regular intervals and adjusted where necessary to take into account past experience and any relevant economic factors. The main estimates and assumptions are based on the information available when the financial statements are drawn up and concern the following: � Commercial cooperation fees. � Provisions. � Put options granted to minority shareholders and earn-out payments on business combinations.
27 of 37
� Impairment losses on non-current assets and goodwill. � Deferred taxes. � Fair values of investment property and the accounting treatment of investment property acquisition. For
each transaction, the Group analyses the existing assets and operations to determine whether the acquisition should be treated as a business combination or an asset purchase.
� Fair value of derivatives, including hedging instruments. The main transaction requiring the Group to take an accounting position was the distribution of Mercialys shares (see note 3). Note 3: Significant events of the period � Further property assets transferred to Mercialys under the Alcudia value enhancement programme On 5 March 2009, Casino announced the transfer of a €334 million portfolio of property assets comprising Casino development projects and hypermarket retail and storage space to its subsidiary Mercialys under the Alcudia programme. The transaction was described in a document filed by Mercialys with the AMF on 17 April 2009 and forms part of the strategy pursued by the Group since 2005 to capture the value of and monetise its property assets. Mercialys issued 14.2 million new shares in exchange for the assets, lifting Casino's interest in its capital from 59.7% to 66.1%. As this was an intragroup transaction, the impact was eliminated in the consolidated financial statements. � Payment of a dividend in Mercialys shares to Casino shareholders At the annual general meeting of 19 May 2009, the shareholders of Casino, Guichard-Perrachon approved a mixed cash and stock dividend of €2.57 per share in cash for the preferred non-voting shares and €2.53 per share for the ordinary shares, plus one Mercialys share for every Casino eight shares held for all ordinary and preferred non-voting shares eligible for a dividend. Distribution of the stock dividend had the effect of reducing the Group's interest in Mercialys to around 50.4% of the capital and voting rights. This transaction, together with the conversion of preferred non-voting shares into ordinary shares referred to below, was described in a securities note filed with the AMF on 21 April 2009. The distribution to shareholders of shares in a subsidiary that does not involve loss of control is not specifically dealt with in current accounting standards. IFRIC 17 – Distributions of Non-cash Assets to Owners was published in November 2008, although its scope does not cover transactions in a subsidiary's shares leading to the recognition of minority interests. However, it does specify that this type of transaction should be accounted for in accordance with the provisions of IAS 27 Revised1, applicable by the Group as of 1 January 2010. The Group considers that the distribution of Mercialys shares should be treated as a reduction in its percentage interest in a subsidiary without loss of control. In accordance with the accounting principles described in note 3.2 "Business Combinations" to the financial statements for the year ended 31 December 2008, such a transaction gives rise to the recognition of a gain or loss equal to the difference between the proceeds of sale and the carrying amount of the interest sold. The Group has treated this transaction in the same way as it has always treated partial sales without loss of control and the distribution therefore led to the recognition of a disposal gain of €139 million (including €2 million in costs), recorded in the income statement under "Other operating income". The gain before expenses corresponds to the difference between the sale price of the Mercialys shares based on the closing price immediately preceding the Casino ex-dividend date (i.e. €22) and the carrying amount of the interests sold on the sale date. 1 IAS 27 Revised – Consolidated and Separate Financial Statements, applicable to annual periods starting on or after 1 July 2009 and which will be adopted by the Group for the first time in 2010, states that a change in percentage ownership of a company without loss of control should be accounted for as a transaction in equity with no impact on the income statement.
28 of 37
� Improved stock market profile by converting preferred stock into ordinary stock On 4 March 2009, Casino's Board of Directors unanimously approved the proposed conversion of the company's preferred non-voting shares into ordinary shares on the basis of 6 ordinary shares for 7 preferred shares. The purpose was to simplify the Company's capital structure and enhance its stock market profile by increasing the number of ordinary shares included in the free float. The movements in share capital arising from this transaction are described in note 14. � Bond issues In the first half of 2009, Casino made two bond issues totalling €750 million due in 2012 and 2013. It also made an early redemption of bonds totalling €175 million (see note 16). � Monoprix On 22 December 2008, Casino and Galeries Lafayette signed an amendment to their March 2003 strategic agreement which suspends the exercise of their respective put and call options on Monoprix shares for three years. As a result, Casino's call on 10% of Monoprix's capital and Galeries Lafayette's put on 50% of Monoprix's capital will be exercisable as of 1 January 2012. The other terms of exercise and provisions of the March 2003 strategic agreement remain unchanged. Accordingly, Monoprix remained proportionately consolidated at 30 June 2009 and the value of the options is disclosed under off-balance sheet commitments in the notes to the financial statements for the year ended 31 December 2008. � Call option on 5% of Super de Boer Casino and ING entered into an agreement on 1 April 2009 granting the Group a call option over ING's 5% interest in Super de Boer. The call is exercisable at any time until 30 June 2010 at an exercise price of €5 per share. The Group's call option on the 6.2% interest in Super de Boer held by ING, RBS and Rabobank expired on 31 March 2009. Note 4: Changes in the scope of consolidation The main changes in the scope of consolidation during the period were as follows: � Decrease in percentage ownership of the Mercialys sub-group from 59.67% to 50.89% resulting from the
partial sale described in note 3. � Divestment of the Group's entire 30% interest in Easy Holland BV, which owns Easy Colombia,
generating a loss of €28 million; � Other changes in scope during the period concern the Franprix-Leader Price Group for €30 million,
generating €18 million in goodwill, and the acquisition of Dilux and Challin (which own supermarket businesses) for €23 million, generating €27 million in goodwill.
Note 5: Seasonal fluctuations in business Seasonal fluctuations in business are limited. Net sales for 2008 at constant exchange rates and based on a comparable scope of consolidation broke down as 47% for the first-half and 53% for the second-half.
29 of 37
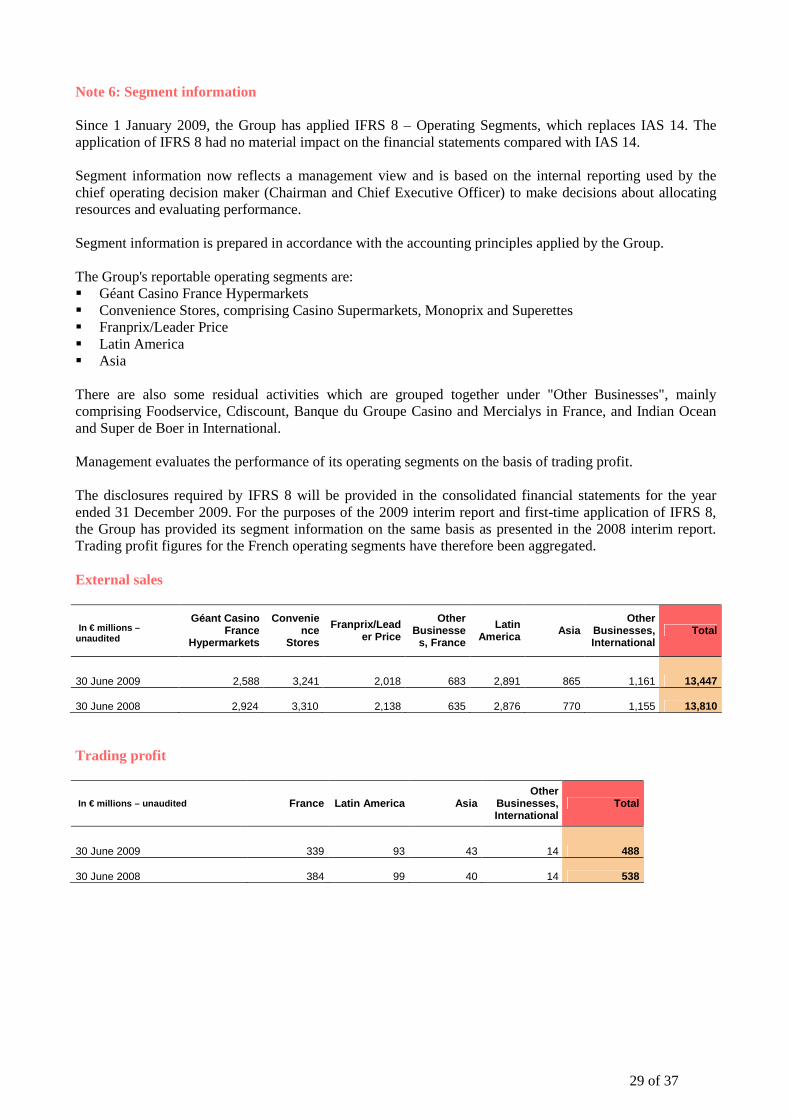
Note 6: Segment information Since 1 January 2009, the Group has applied IFRS 8 – Operating Segments, which replaces IAS 14. The application of IFRS 8 had no material impact on the financial statements compared with IAS 14. Segment information now reflects a management view and is based on the internal reporting used by the chief operating decision maker (Chairman and Chief Executive Officer) to make decisions about allocating resources and evaluating performance. Segment information is prepared in accordance with the accounting principles applied by the Group. The Group's reportable operating segments are: � Géant Casino France Hypermarkets � Convenience Stores, comprising Casino Supermarkets, Monoprix and Superettes � Franprix/Leader Price � Latin America � Asia There are also some residual activities which are grouped together under "Other Businesses", mainly comprising Foodservice, Cdiscount, Banque du Groupe Casino and Mercialys in France, and Indian Ocean and Super de Boer in International. Management evaluates the performance of its operating segments on the basis of trading profit. The disclosures required by IFRS 8 will be provided in the consolidated financial statements for the year ended 31 December 2009. For the purposes of the 2009 interim report and first-time application of IFRS 8, the Group has provided its segment information on the same basis as presented in the 2008 interim report. Trading profit figures for the French operating segments have therefore been aggregated. External sales
In € millions – unaudited
Géant Casino France
Hypermarkets
Convenience
Stores
Franprix/Leader Price
Other Businesse
s, France
Latin America Asia
Other Businesses, International
Total
30 June 2009 2,588 3,241 2,018 683 2,891 865 1,161 13,447
30 June 2008 2,924 3,310 2,138 635 2,876 770 1,155 13,810 Trading profit
In € millions – unaudited France Latin America Asia Other
Businesses, International
Total
30 June 2009 339 93 43 14 488
30 June 2008 384 99 40 14 538

30 of 37
Note 7: Revenue
In € millions – unaudited 30 June 2009 30 June 2008
Net sales 13,447 13,810 Other income 81 74 Total revenue 13,528 13,884
Note 8: Cost of goods sold
In € millions – unaudited 30 June 2009 30 June 2008
Purchases and change in inventories (9,532) (9,847) Logistics costs (551) (545) Cost of goods sold (10,083) (10,392)
Note 9: Expenses by nature and function 30 June 2009
In € millions – unaudited Logistics costs (i)
Selling expenses
General and administrative
expenses Total
Employee benefits expense (185) (1,105) (300) (1,590) Other expenses (346) (1,035) (195) (1,576) Depreciation, amortisation and provision expense (20) (276) (45) (341) Total (551) (2,416) (539) (3,507)
(i) Logistics costs are reported in the income statement under "Cost of goods sold".
31 of 37
30 June 2008
In € millions – unaudited Logistics costs (i)
Selling expenses
General and administrative
expenses Total
Employee benefits expense (177) (1,123) (278) (1,578) Other expenses (350) (1,067) (178) (1,594) Depreciation, amortisation and provision expense (19) (270) (39) (328) Total (545) (2,460) (495) (3,500)
(i) Logistics costs are reported in the income statement under "Cost of goods sold".
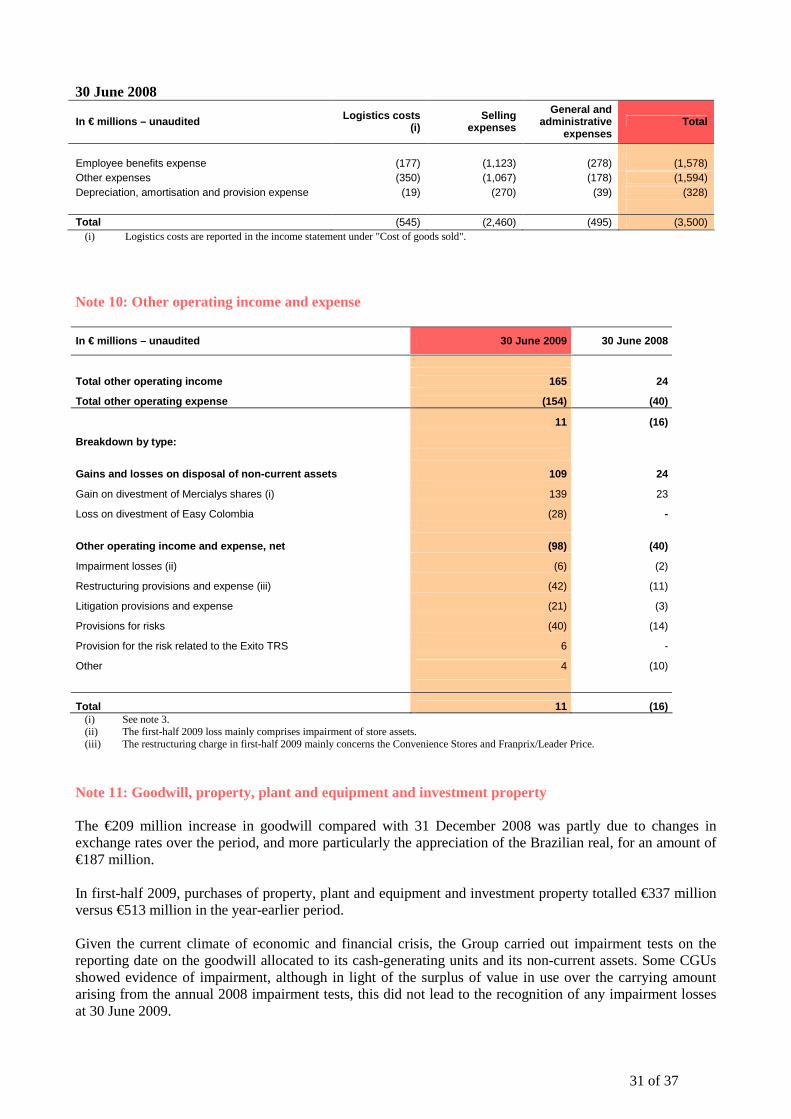
Note 10: Other operating income and expense
In € millions – unaudited 30 June 2009 30 June 2008
Total other operating income 165 24
Total other operating expense (154) (40)
11 (16)
Breakdown by type:
Gains and losses on disposal of non-current assets 109 24
Gain on divestment of Mercialys shares (i) 139 23
Loss on divestment of Easy Colombia (28) -
Other operating income and expense, net (98) (40)
Impairment losses (ii) (6) (2)
Restructuring provisions and expense (iii) (42) (11)
Litigation provisions and expense (21) (3)
Provisions for risks (40) (14)
Provision for the risk related to the Exito TRS 6 -
Other 4 (10)
Total 11 (16) (i) See note 3. (ii) The first-half 2009 loss mainly comprises impairment of store assets. (iii) The restructuring charge in first-half 2009 mainly concerns the Convenience Stores and Franprix/Leader Price.
Note 11: Goodwill, property, plant and equipment and investment property The €209 million increase in goodwill compared with 31 December 2008 was partly due to changes in exchange rates over the period, and more particularly the appreciation of the Brazilian real, for an amount of €187 million. In first-half 2009, purchases of property, plant and equipment and investment property totalled €337 million versus €513 million in the year-earlier period. Given the current climate of economic and financial crisis, the Group carried out impairment tests on the reporting date on the goodwill allocated to its cash-generating units and its non-current assets. Some CGUs showed evidence of impairment, although in light of the surplus of value in use over the carrying amount arising from the annual 2008 impairment tests, this did not lead to the recognition of any impairment losses at 30 June 2009.

32 of 37
Note 12: Discontinued operations and non-current assets held for sale Non-current assets held for sale came to €97 million at 30 June 2009 compared with €34 million at 31 December 2008. They mainly involve the Convenience Stores (€61 million), Franprix/Leader Price (€29 million) and Super de Boer (€7 million). At 30 June 2009, non-current assets held for sale mainly comprised property, plant and equipment. Negotiations for the sale of these assets were in progress at 30 June 2009 and the disposals are due to be finalised in the second half of 2009 or the first half of 2010 at the latest. Note 13: Net cash and financial debt Cash and cash equivalents and net debt break down as follows:
In € millions – unaudited 30 June 2009 31 December 2008
Cash equivalents 464 1,103 Cash 617 845 Cash and cash equivalents 1,080 1,948 Bank overdrafts (570) (404) Net cash and cash equivalents 511 1,543 Borrowings (other than bank overdrafts) 6,514 6,394 Net debt 6,003 4,851
Cash and cash equivalents include the €49 million proceeds from sales of receivables fulfilling the derecognition criteria of IAS 39 (€161 million at 31 December 2008). Cash equivalents at 30 June 2009 and 31 December 2008 consisted of term deposits, euro-denominated money market mutual funds and other short-term investments. Note 14: Share capital At 30 June 2009, share capital amounted to €168,837,969 versus €171,908,750 at 31 December 2008. The decrease is mainly due to the conversion of preferred non-voting shares into ordinary shares as described in note 3, which gave rise to a capital reduction. At 30 June 2009, the share capital comprised 110,351,614 fully-paid ordinary shares each with a par value of €1.53. Issued and fully-paid ordinary shares (number) 2009 2008
At 1 January 97,769,191 96,992,416
Shares issued on exercise of stock options - 266,064 Shares issued to minority shareholders in connection with mergers - 42 Bonus issue of ordinary shares 77,169 - Conversion of preferred non-voting shares into ordinary shares (i) 12,505,254 -
At 30 June 110,351,614 97,258,522 (i) In accordance with the 25th resolution passed by the shareholders at the annual general meeting of 19 May 2009, the preferred non-voting
shares have been converted into ordinary shares (see note 3 and the condensed income statement).
33 of 37
Note 15: Dividends At the annual general meeting of 19 May 2009, shareholders approved payment of a dividend of €2.53 per ordinary share and €2.57 per preferred non-voting share. The dividend paid to holders of deeply subordinated perpetual bonds amounted to €25.97 (of which €14.53 paid in January and €11.44 paid in April 2009). The dividend distribution accounted for as a capital reduction amounted to €593 million in the first half of 2009 (€284 million in cash and €308 million in shares). Note 16: Borrowings and other financial liabilities The main movements in the six months ended 30 June 2009 were as follows: � In the first half of 2009, Casino Guichard-Perrachon made early redemptions of its 2013 and 2014 bonds
for a nominal amount of €1 million and €174 million respectively. Given their characteristics, the resulting net cash outflow (including accrued interest) was €1 million and €171 million respectively.
� The 2004-2009 indexed bonds and the 2009 bonds were redeemed in the first half of 2009 in the amount of €37 million and €559 million respectively.
� On 9 February 2009, the Group made a €500 million bond issue due 9 August 2012. The bonds are
redeemable at par. The nominal interest rate is 7.875% for an effective rate of 7.938%. The fixed rate has been swapped for the 3-month Euribor + 516.5 bp.
� On 29 May 2009, the 2013 bond issue was topped up by €250 million on the same terms and hedged in
the same way as the initial tranche. The average effective interest rate is 6.271%. The fixed rate has been swapped for the 3-month Euribor + 310 bp.
Note 17: Contingent assets and liabilities � Dispute with the Baud family
- On 2 July 2009, the Arbitration Tribunal delivered its ruling in the dispute between Casino and the Baud family. The tribunal found that Casino had just cause to dismiss the Baud family members from the management bodies of Franprix and Leader Price, thus acknowledging its right to take over operational management of Franprix and Leader Price. The tribunal consequently confirmed that the value of the Baud family's remaining interests in Franprix and Leader Price, respectively 5% and 25%, should be calculated on a multiple of 14 times the average 2006 and 2007 earnings of the two companies, which corresponds to the position taken by Casino in its previous financial statements. The tribunal also rejected each and every one of the Baud family's claims, including their claim for the application of a 16 times earnings multiple and their various claims for damages. As regards Casino's claims, the tribunal ruled that the Group's claims for damages and losses should be made by Franprix and Leader Price, particularly within the criminal proceedings already filed by them against members of the Baud family for misappropriation of corporate assets. As provided for under the agreement and in accordance with the tribunal's ruling, the final price of the Baud family's interest in Franprix and Leader Price (mainly held by a Belgian company called Baudinter) resulting from the exercise of their put options on 28 April 2008, will be calculated on the basis of a 14 times earnings multiple by an independent expert appointed to resolve the remaining issues of dispute between the parties. Pending the expert's conclusions and in view of the 2006 and 2007 financial statements as adjusted for the anomalies and irregularities committed by the former managers, Casino believes that the final amount will be in the region of €425 million (including late interest), which has been recognised under current financial
34 of 37
liabilities at 30 June 2009 (€420 million at 31 December 2008). This sum corresponds to the value of the put option based on the contractual terms and conditions. The amount claimed by the Baud family is €475 million, which has been calculated on an incorrect basis and is disputed by the Group. Furthermore, pursuant to the tribunal's ruling and as the Baud family has exercised its put option, the Group now owns 100% of both Franprix and Leader Price. The financial statements for the period ended 30 June 2009 therefore include 100% of the earnings of Franprix and Leader Price in the first half plus an adjustment of €17 million for the earnings split over the period 29 April to 31 December 2008, which was initially allocated to minority interests. Although the 2006 and 2007 financial statements have not been approved, any dividend rights attached to the Franprix and Leader Price shares under option that are contested by Casino have been recognised in other current liabilities for an amount of €67 million. - As regards the dispute over the organisation and operation of Geimex, a company owned jointly and equally by Casino and the Baud family which owns the international rights to the Leader Price brand (all markets other than mainland France and the French overseas departments and territories), an acting director was appointed in May 2008 by the Paris commercial court to approve the 2006 and 2007 financial statements. They are due to be submitted to the shareholders before 30 September 2009. Geimex is proportionately consolidated in the Group's financial statements. Casino's interest in this company amounts to €73 million, of which €60 million corresponds to goodwill. � Super de Boer pension fund dispute In the Netherlands, Super de Boer's main pension plan is a defined benefits plan managed by Stichting Pensioenfonds SDB, an independent pension fund. The Dutch regulator, De Nederlandse Bank (DNB), requires pension funds to have a 125% funding ratio (measured under local standards), or failing that a 15-year funding plan to reach that level. Should the funding ratio fall below 105%, a refunding plan must be implemented, in principle over a period of three years, to achieve the minimum requirement. As a result of the financial crisis, most Dutch pension funds are now underfunded and have been forced to implement refunding plans. As the statutory funding ratio had fallen to 86.2% at 31 December 2008, Stichting Pensioenfonds SDB presented a refunding plan to the DNB on 1 April 2009. The plan includes a number of measures designed to restore the minimum ratio within a period of five years. Super de Boer disagrees with the measures envisaged by the pension fund and has preventively terminated the agreement between them as of 1 January 2010. However, the parties are in negotiations with a view to reaching agreement on a new refunding plan and continuing their contractual relationship. The financial impact of termination and the refunding plan cannot be measured at this stage.
� Madagascar damages During the unrest in Madagascar in the first quarter, Vindémia suffered losses as a result of vandalism, looting and business interruption. These events led to a €3 million charge in the consolidated financial statements for the first half of 2009. However, losses assessed on the basis of asset reconstruction or replacement cost together with business interruption losses are currently estimated at €18 million. Damage to goods, business interruption losses and expenses are covered by the Group's insurance policies. The recoverable amount is currently being quantified and depends on the reconstruction assumptions made. The insurance receivable has been recognised as a contingent asset at 30 June 2009.
35 of 37
Note 18: Related parties that control the Group Casino, Guichard-Perrachon is controlled by Groupe Rallye, which in turn is owned by Foncière Euris. At 30 June 2009, Groupe Rallye held 48.62% of the company's capital and 60.54% of the voting rights. Casino receives advice from its ultimate parent company, Euris, under a strategic advice and assistance contract signed in 2003. Related party transactions, including senior management compensation packages, were comparable to those in 2008. No transactions of an unusual nature or amount were carried out during the period. The main transaction in the first half between consolidated companies in the Casino and Rallye groups were the payment of a dividend for 2008 in the sum of €282 million, including €138 million in cash and €144 million in stock. Note 19: Subsequent events � New bond issue
On 3 July 2009, the Group made a €750 million bond issue due 30 January 2015. The bonds are redeemable at par. The fixed interest rate of 5.50% has been swapped for the 1-month Euribor + 257.5 bp. � Acquisition of Ponto Frio
On 8 June 2009, CBD announced the acquisition of 70.24% of Globex and its Ponto Frio banner, a retailer of household equipment and consumer electronics. The acquisition is subject to approval from the Brazilian competition authorities. It was also subject to shareholder approval, which was obtained on 6 July. The purchase price was BRL 824 million (€302 million) of which BRL 373 million (€137 million) was paid in cash on 8 July 2009. The balance of BRL 451 million (€165 million) adjusted on the basis of trends in the Brazilian interbank rate (Certificado de Deposito Interbancario) is due on 7 July 2013. However, in accordance with the acquisition agreement, the former majority shareholders of Globex have opted for payment of the balance in Class B preferred stock based on a 10% increase in the price and a guaranteed minimum value of BRL 40 per share. Accordingly, the former majority shareholders of Globex have received BRL 373 million in cash and in September 2009, the date of CBD's new share issue, will receive 12.4 million Class B preferred shares each carrying a contingent value right of BRL 40. The Class B preferred stock does not carry voting rights and is entitled to a fixed dividend of BRL 0.01 per share. The preferred stock will automatically be converted into Class A preferred stock on a 1 for 1 basis in accordance with a pre-set schedule between September 2009 and January 2011. Upon conversion, CBD will pay any negative difference between the contingent value right of BRL 40 per share adjusted for changes in the CDI and the weighted average Class A preferred share price in the 15 trading days prior to conversion. CBD has also made an offer for the remaining Globex shares at a price per share equal to 80% of the purchase price paid to the majority shareholders. The offer will be paid in cash on the basis of 45.3% upon acceptance and 54.7% four years later. Alternatively, the minority shareholders may subscribe to the new CBD share issue on the terms and conditions referred to above, in which case the price will also be increased by 10%. Should the minority shareholders subscribe in full to the CBD share issue and should Casino exercise its pre-emptive rights, CBD will issue 16.6 million preferred shares leading to 3.5% maximum dilution for the Group.
36 of 37
Statement by the Person Responsible for the Interim Report
I hereby declare that, to the best of my knowledge, (i) the condensed interim consolidated financial statements have been prepared in accordance with the applicable accounting standards and give a true and fair view of the assets and liabilities, financial position and results of operations of the companies included in the consolidation, and (ii) the accompanying interim management report includes a fair review of significant events of the first six months of the year, their impact on the interim consolidated financial statements, the main related party transactions for the period, as well as a description of the main risks and uncertainties in the second half of the year. Paris, 26 August 2009 Jean-Charles Naouri Chairman and Chief Executive Officer
37 of 37
Statutory Auditors' review report on the 2008 interim financial information
This is a free translation into English of the statutory auditor’s review report issued in French and is provided solely for the convenience of English speaking readers. This report should be read in conjunction with, and construed in accordance with, French law and professional auditing standards applicable in France. To the shareholders, In compliance with the assignment entrusted to us by the Board of directors and in accordance with article L.451-1-2 III of the French monetary and financial code (Code monétaire et financier), we hereby report to you on: − our review of the accompanying condensed interim consolidated financial statements of Casino
Guichard-Perrachon, for the period from January 1, 2009 to June 30, 2009, and − the verification of the information contained in the interim management report. These condensed half-yearly consolidated financial statements are the responsibility of the Board of directors. Our role is to express a conclusion on these financial statements based on our review.
1. Conclusions on the financial statements
We conducted our review in accordance with professional standards applicable in France. A review of interim financial statements consists of making inquiries, primarily of persons responsible for financial and accounting matters, and applying analytical and other review procedures. A review is substantially less in scope than an audit conducted in accordance with the professional standards applicable in France and consequently does not enable us to obtain assurance that the financial statements, taken as a whole, are free from material misstatements, as we would not become aware of all significant matters that might be identified in a full audit. Accordingly, we do not express an audit opinion. Based on our review, nothing has come to our attention that causes us to believe that these condensed half-yearly consolidated financial statements are not prepared in all material respects in accordance with IAS 34 - IFRS as adopted by the European Union applicable to interim financial information. Without modifying the conclusion expressed above, we draw attention to: − Notes 2.3 and 2.4 to the condensed half-yearly consolidated financial statements, which describe the new
standards and interpretations applied by the Group as of January 1st, 2009; − The accounting treatment used by the Group to account for a dividend distribution in Mercialys stocks,
as described in note 3 to the condensed half-yearly consolidated financial statements.
2. Specific verification
We have also verified the information provided in the interim management report in respect of the half-yearly financial statements that were the object of our review. We have no matters to report on the fairness and consistency of this information with the condensed half-yearly financial statements.
Paris and Lyon, on August 27, 2009
The Statutory Auditors Cabinet Didier Kling & Associés Ernst & Young Audit
Christophe Bonte Didier Kling Sylvain Lauria Daniel Mary-Dauphin