Embed Size (px)
DESCRIPTION
get to know your calculator better
Citation preview
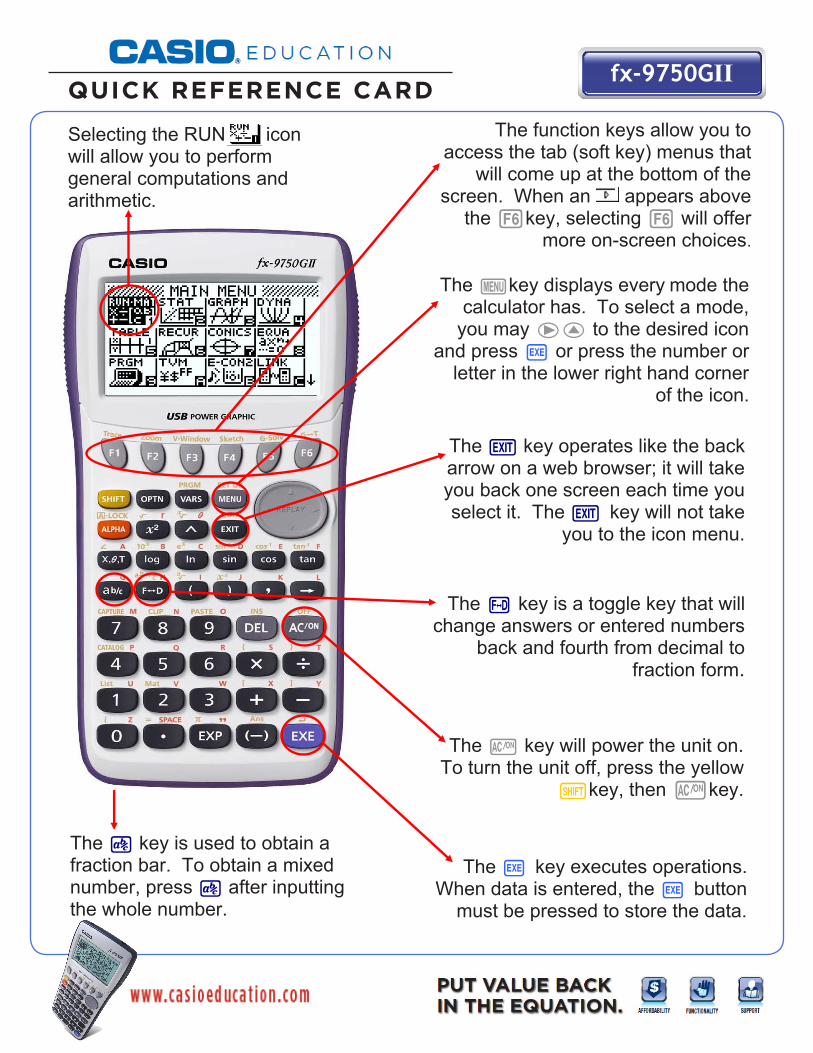
fx-9750GIIQUICK REFERENCE CARD
ldquoThe Basicsrdquo Reference Card CASIO fx-9750 Series
The O key will power the unit onTo turn the unit off press the yellow
Lkey then Okey
The l key executes operationsWhen data is entered the l button
must be pressed to store the data
The d key operates like the back arrow on a web browser it will take you back one screen each time you select it The d key will not take
you to the icon menu
Selecting the RUN iconwill allow you to perform general computations and arithmetic
The pkey displays every mode the calculator has To select a mode
you may $B to the desired icon and press l or press the number or
letter in the lower right hand corner of the icon
The x key is a toggle key that will change answers or entered numbers
back and fourth from decimal to fraction form
The z key is used to obtain a fraction bar To obtain a mixed number press z after inputting the whole number
The function keys allow you to access the tab (soft key) menus that
will come up at the bottom of the screen When an appears above
the ukey selecting u will offer more on-screen choices
fx-9750GIIBASIC FUNCTIONALITYldquoThe Basicsrdquo
CASIO fx-9750GII
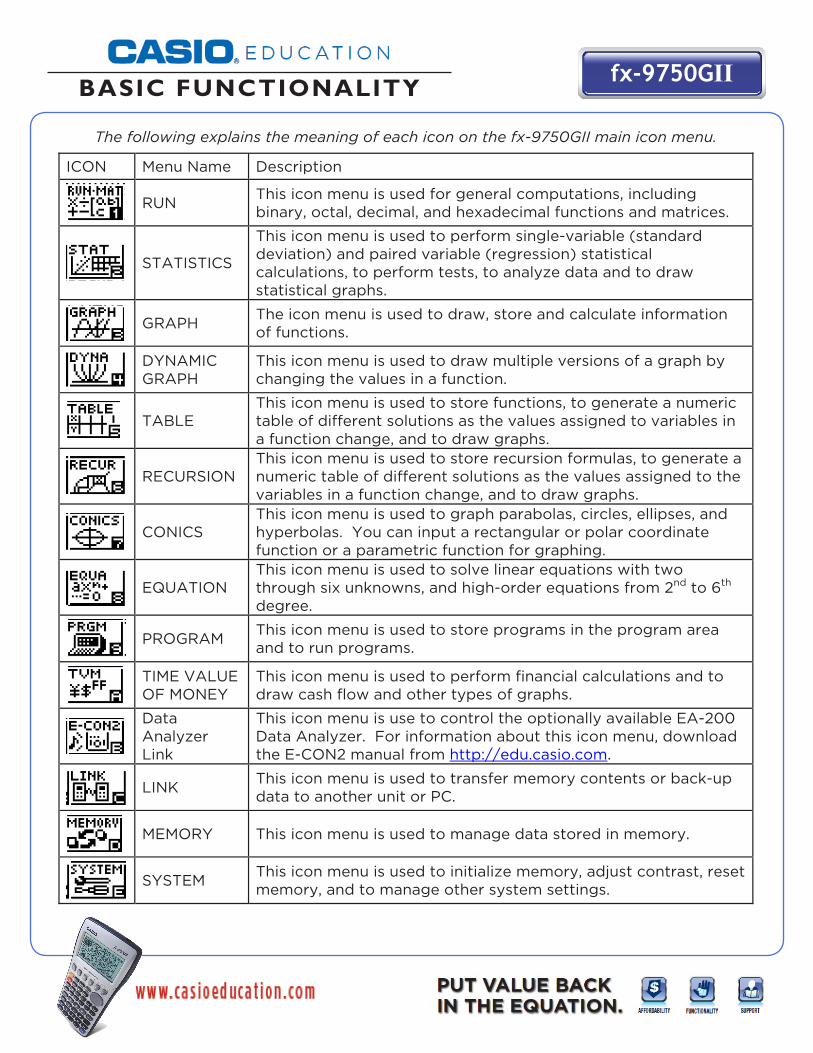
The following explains the meaning of each icon on the fx-9750GII main icon menu ICON Menu Name Description
RUN This icon menu is used for general computations including
binary octal decimal and hexadecimal functions and matrices
STATISTICS
This icon menu is used to perform single-variable (standard deviation) and paired variable (regression) statistical calculations to perform tests to analyze data and to draw statistical graphs
GRAPH The icon menu is used to draw store and calculate information
of functions
DYNAMIC GRAPH
This icon menu is used to draw multiple versions of a graph by changing the values in a function
TABLE
This icon menu is used to store functions to generate a numeric table of different solutions as the values assigned to variables in a function change and to draw graphs
RECURSION
This icon menu is used to store recursion formulas to generate a numeric table of different solutions as the values assigned to the variables in a function change and to draw graphs
CONICS
This icon menu is used to graph parabolas circles ellipses and hyperbolas You can input a rectangular or polar coordinate function or a parametric function for graphing
EQUATION
This icon menu is used to solve linear equations with two through six unknowns and high-order equations from 2nd to 6th degree
PROGRAM This icon menu is used to store programs in the program area
and to run programs
TIME VALUE OF MONEY
This icon menu is used to perform financial calculations and to draw cash flow and other types of graphs
Data Analyzer Link
This icon menu is use to control the optionally available EA-200 Data Analyzer For information about this icon menu download the E-CON2 manual from httpeducasiocom
LINK This icon menu is used to transfer memory contents or back-up
data to another unit or PC
MEMORY This icon menu is used to manage data stored in memory
SYSTEM This icon menu is used to initialize memory adjust contrast reset
memory and to manage other system settings
1
RUN
This section is an overview of the RUNMAT Icon To select an icon from the icon menu system use the $BNto highlight the desired icon then press l or press the
numberletter in the lower right corner of the icon For the Run menu press 1to display the initial Run screen
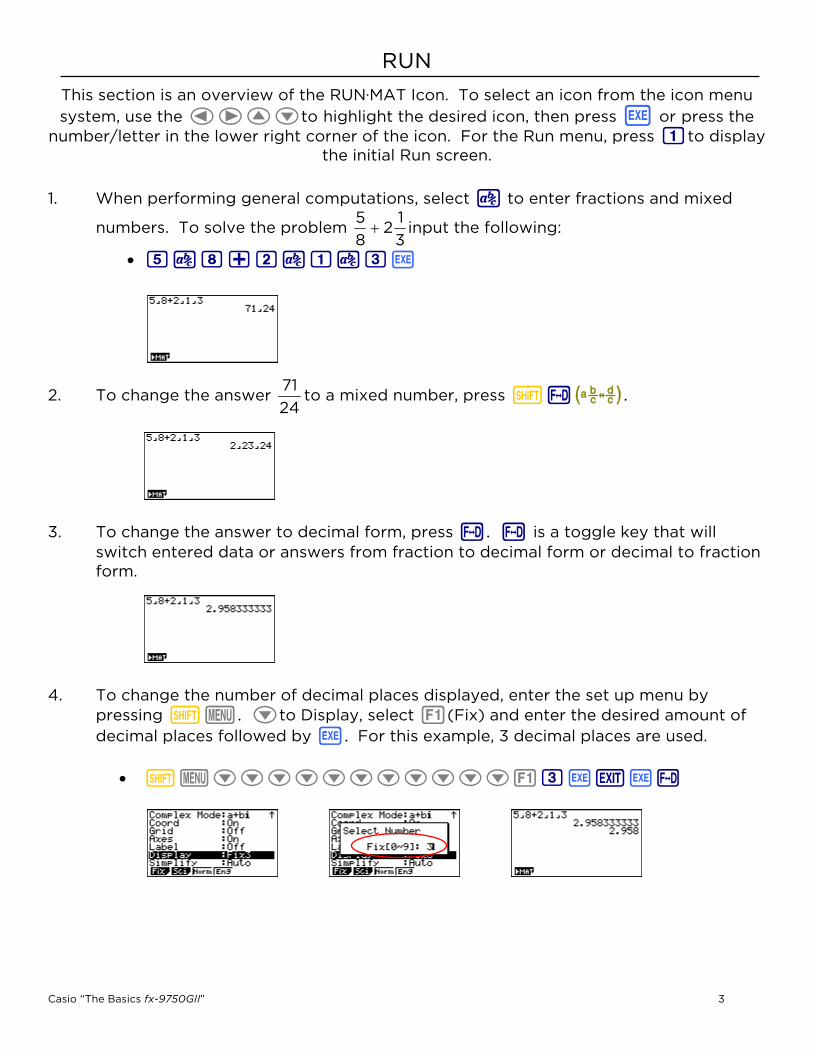
1 When performing general computations select z to enter fractions and mixed
numbers To solve the problem 31
285 input the following
5z8+2z1z3l
2 To change the answer 2471
to a mixed number press LxX
3 To change the answer to decimal form press x x is a toggle key that will switch entered data or answers from fraction to decimal form or decimal to fraction form
4 To change the number of decimal places displayed enter the set up menu by pressing Lp Nto Display select q(Fix) and enter the desired amount of decimal places followed by l For this example 3 decimal places are used
LpNNNNNNNNNNNq3ldlx
Casio ldquoThe Basics fx-9750GIIrdquo 3
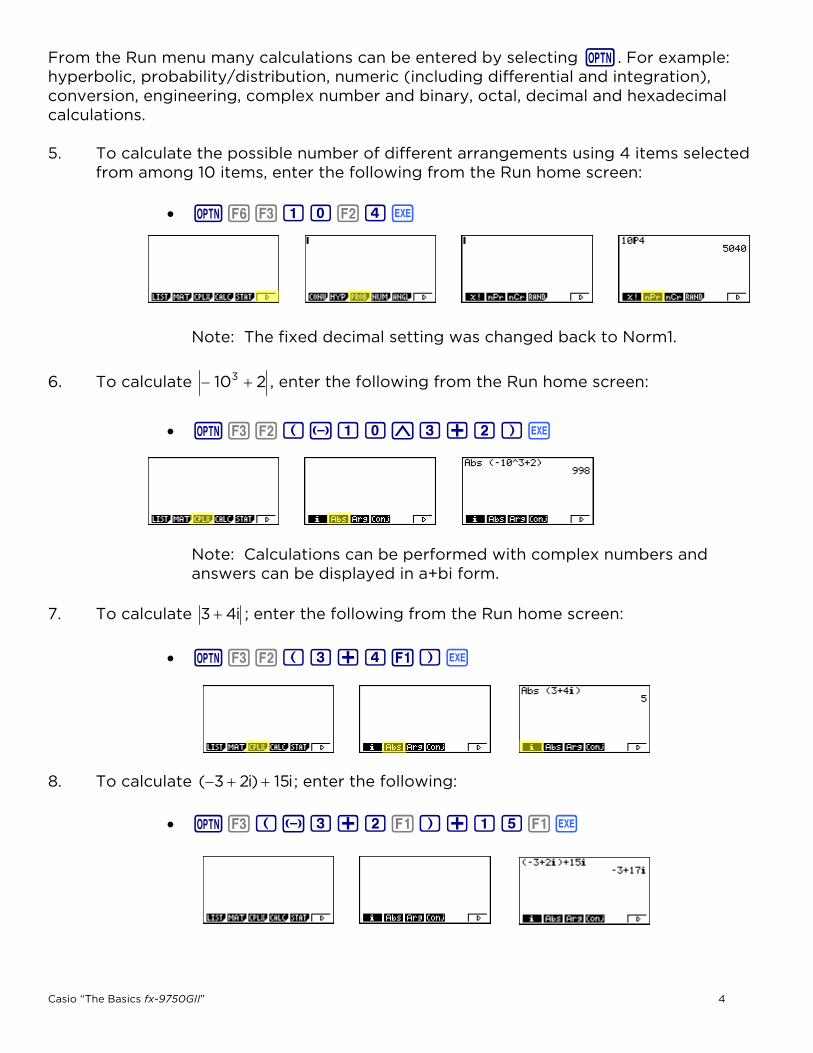
From the Run menu many calculations can be entered by selecting i For example hyperbolic probabilitydistribution numeric (including differential and integration) conversion engineering complex number and binary octal decimal and hexadecimal calculations
5 To calculate the possible number of different arrangements using 4 items selected from among 10 items enter the following from the Run home screen
iue10w4l
Note The fixed decimal setting was changed back to Norm1
6 To calculate 2103 enter the following from the Run home screen
iewjn10^3+2kl
Casio ldquoThe Basics fx-9750GIIrdquo 4
Note Calculations can be performed with complex numbers and
answers can be displayed in a+bi form
7 To calculate i43 enter the following from the Run home screen
iewj3+4qkl
8 To calculate ( enter the following i15)i23
iejn3+2qk+15ql
GRAPH
Various icon (Run Table Dynamic Recursion amp Conics) will allow you to graph or analyze the graphs of given information This section is an overview of the GRAPH Icon and will
highlight some basic features of this mode
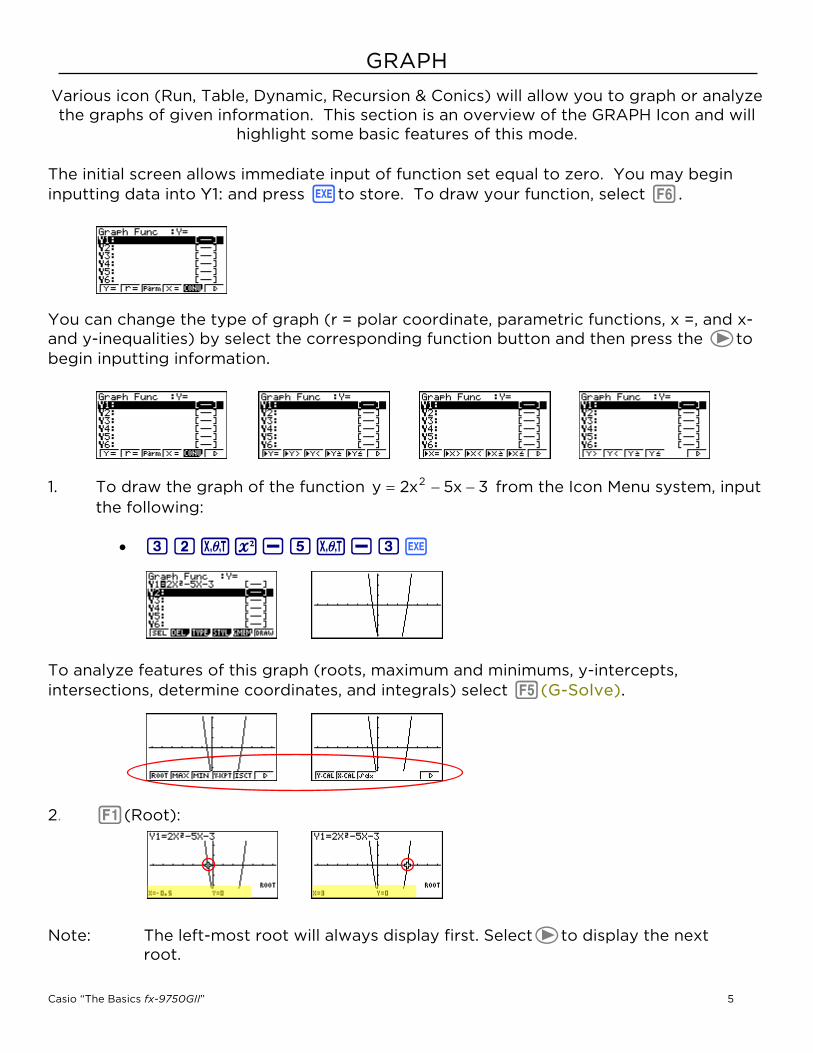
The initial screen allows immediate input of function set equal to zero You may begin inputting data into Y1 and press lto store To draw your function select u You can change the type of graph (r = polar coordinate parametric functions x = and x-and y-inequalities) by select the corresponding function button and then press the $to begin inputting information 1 To draw the graph of the function from the Icon Menu system input the following
3x5x2y 2
32fs-5f-3l
To analyze features of this graph (roots maximum and minimums y-intercepts intersections determine coordinates and integrals) select y(G-Solve)
2 q(Root)
Note The left-most root will always display first Select$to display the next root
Casio ldquoThe Basics fx-9750GIIrdquo 5
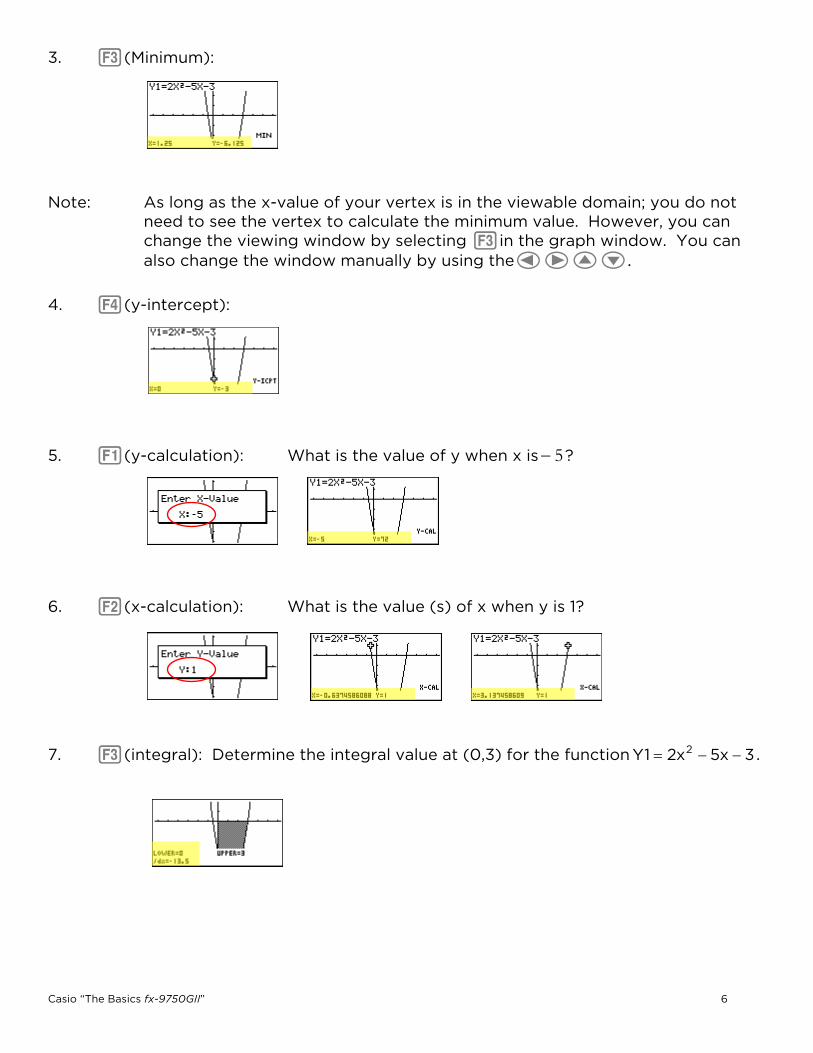
3 e(Minimum) Note As long as the x-value of your vertex is in the viewable domain you do not need to see the vertex to calculate the minimum value However you can change the viewing window by selecting ein the graph window You can also change the window manually by using the$BN
4 r(y-intercept) 5 q(y-calculation) What is the value of y when x is 5 6 w(x-calculation) What is the value (s) of x when y is 1 7 e(integral) Determine the integral value at (03) for the function
3x5x21Y 2
Casio ldquoThe Basics fx-9750GIIrdquo 6
TABLE
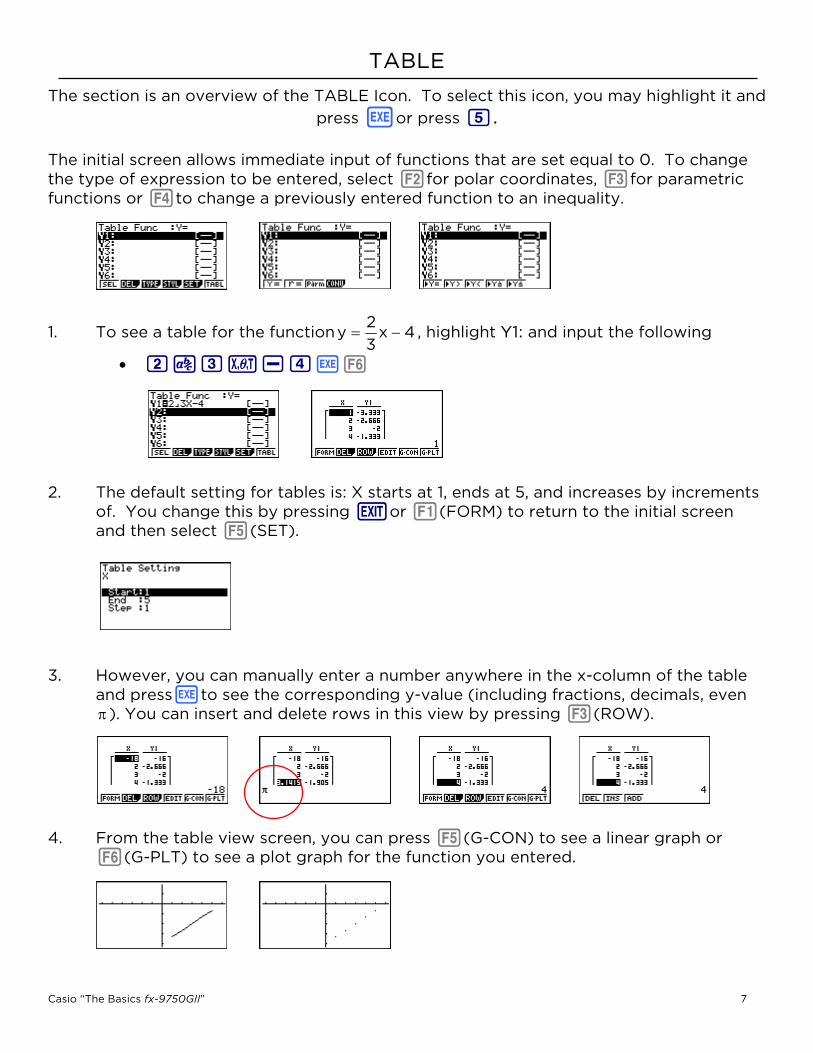
The section is an overview of the TABLE Icon To select this icon you may highlight it and press lor press 5
The initial screen allows immediate input of functions that are set equal to 0 To change the type of expression to be entered select wfor polar coordinates efor parametric functions or rto change a previously entered function to an inequality
1 To see a table for the function 4x32
y highlight Y1 and input the following
2z3f-4lu 2 The default setting for tables is X starts at 1 ends at 5 and increases by increments of You change this by pressing dor q(FORM) to return to the initial screen and then select y(SET) 3 However you can manually enter a number anywhere in the x-column of the table and presslto see the corresponding y-value (including fractions decimals even ) You can insert and delete rows in this view by pressing e(ROW) 4 From the table view screen you can press y(G-CON) to see a linear graph or
u(G-PLT) to see a plot graph for the function you entered
Casio ldquoThe Basics fx-9750GIIrdquo 7
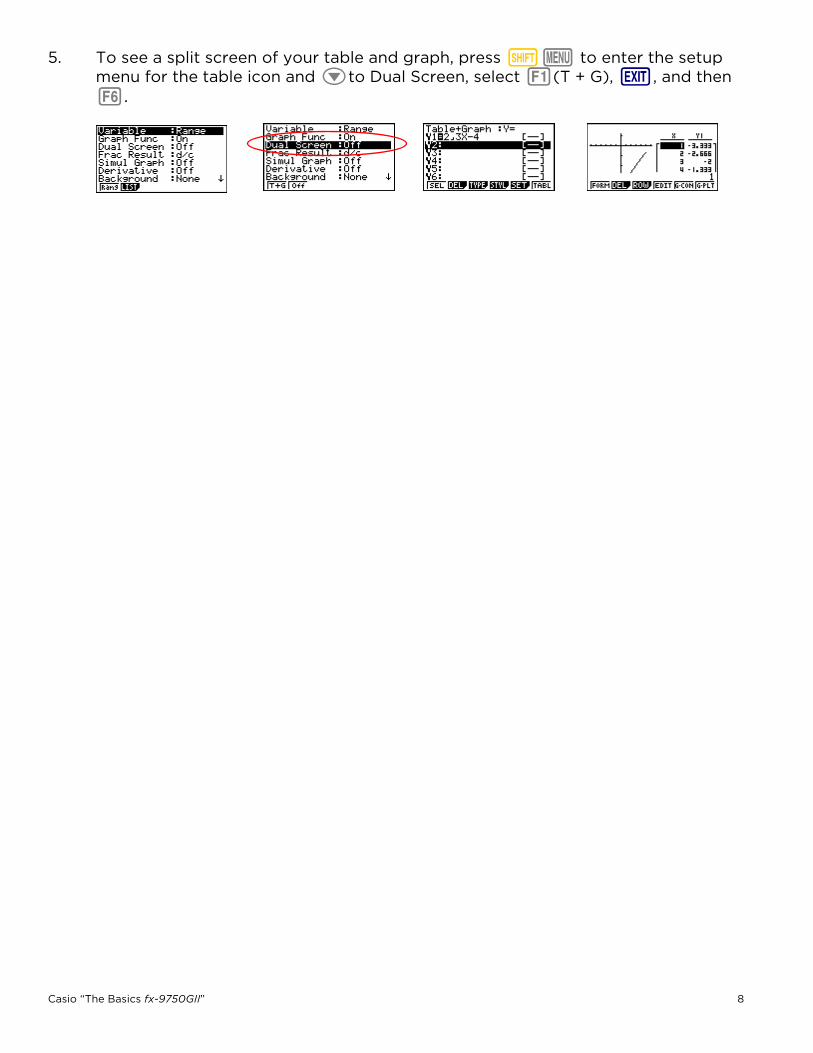
5 To see a split screen of your table and graph press Lp to enter the setup menu for the table icon and Nto Dual Screen select q(T + G) d and then u
Casio ldquoThe Basics fx-9750GIIrdquo 8
STATISTICS
This section is an overview of the STAT icon it will highlight just a few of the features for single-variable data and paired-variable data To select this icon you may highlight it and
presslor press2
The initial List Editor Screen that allows input of statistical data and performs numerous statistical calculations To input a list of single-variable data highlight the first cell under List 1 and enter each number followed by l 1 For this example input this set of data
1 05 12 4 -1 1 3 5 6 34 2 From this screen you display various graphs depending on whether you single or paired-variable data (scatter-plot line normal probability histogram median box mean box normal distribution broken line and regression linear quadratic cubic quartic logarithmic exponential power sinusoidal and logistic)
3 The initial default graph is a scatter-plot To change the type of graph you would like to use press q(GRPH) then u(SET) Nto Graph Type for this set of data we will make a histogram press u and then qfor histogram
Casio ldquoThe Basics fx-9750GIIrdquo 9
4 Press dto take you back to your list of data and select q(GPH1) and then lto see your graph 5 The following screen shots show what one-variable calculations can be obtained by pressing q
6 To delete this set of data press duntil you return to the initial List Editor screen Select ufor more options arrow up until List 1 is highlighted select r(Del-A) then q
7 For paired variable data use the following List 1 05 12 24 40 52 List 2 -21 03 15 20 24
Enter List 1 first and then $to begin entering List 2 8 To see a scatter-plot of these data you can go through and change back GPH 1 using the process above or select w(GPH 2) from the List Editor screen whose default is also a scatter-plot
Casio ldquoThe Basics fx-9750GIIrdquo 10
9 From the scatter-plot screen pressing qwill show all the calculation that can be obtained from this set of data 10 To calculate linear regression select wfrom the first set of options and then press qfor form baxy 11 From this screen you select y(COPY) to copy and then paste the equation into the initial graph screen or select u(DRAW) to show the linear regression
Casio ldquoThe Basics fx-9750GIIrdquo 11
EQUATION
This section is an overview of the EQUATION Icon To select this icon highlight it and press l or press 8
The initial Equation Editor screen has three modes to choose from Simultaneous Polynomial and Solver this section will give an overview of each mode The Simultaneous mode allows you to solve simultaneous linear equations with two to six unknowns 1 Solve the following system of equations
7zy4x51z3y6x1z2yx4
Press q to select the Simultaneous mode and press wfor three unknowns The calculator will display a matrix where the coefficients and constants can be entered in to as long as each equation is in standard form To enter this system of equations (already in standard form) input the following
4 l 1 l n 2 l n 1 l 1 l 6 l 3 l 1 l n 5 l 4 l 1 l n 7 l
There are four options at the bottom of the screen press q(SOLV) The solution to this system is (1 -1 2)
Casio ldquoThe Basics fx-9750G 12
Press dto return to the previous screen press q(REPT) to edit this problem or continue solving simultaneous equations with three unknowns To edit just one of the numbers in the system arrow to the number to be edited and press r(EDIT) or highlight the number to be edited and input the new number then press l Press duntil the Equation Editor screen is displayed The second mode is Polynomial w and can be used to solve high-order equations (in standard form) from the 2nd to the 6th degree 2 To solve the equation x3 ndash 2x2 ndash x + 2 = 0 input the following
ww1ln2ln1l2lq
3 To change the equation to x3 + 2x2 + 3x + 2 = 0 select q(REPT) and change the b- value to 2 the c-value to 3 and press q(SOLV)
4 The default setting is for real numbers to change the display to a+bi form press Lp for the Polynomial Set-Up menu select w(a+bi) d and then q(SOLV)
The third function Solver e allows you to determine the value of any variable in a formula or equation You can input any formula exactly as it appears using a for any variables We will take a look at solving a linear equation and a formula
5 To find the value of x in the following equation 2(x 5) = 3x + 2 input the following starting from the Equation Editor Screen
e2jf-5kLn3f+2lu
Casio ldquoThe Basics fx-9750GIIrdquo 13
In the last screen ldquoLftrdquo and ldquoRgtrdquo represent the values of the left and right sides that have calculated using the solution this is the calculatorrsquos way of checking the solution You can also enter a formula assign values and solve for specific variable using the Solver function of the Equation Editor 6 Find the radius (to the nearest hundredth) of sphere whose volume is 370597 cm3
To enter the formula 34
V r3 input the following in to the calculator
qBa2L4z3Lca6^3l
Note Selecting q will take you back to the previous screen where you can edit and re-
solve the previous equation or begin a new problem
Casio ldquoThe Basics fx-9750GII 14
CONICS
This section is an overview of the CONICS Icon To select this icon you may highlight it and press l or simply press 7
The initial screen allows you to choose from various conic functions including rectangular polar or parametric form You may use the BNto select the equation of the function in accordance with the type of graph you want to draw Once you have chosen the conic function that you would like to graph you will need to enter the coefficients of the function and then press DRAW u 1 To view the graph of the conic y select the form from the Conics formula menu
3x5x2 2 CBXAXY 2
In the Conics modes when you press y(G-Solv) although you are still graphing a parabola like in the graphing section notice how the vocabulary and options have changed 2 For example you can now examine the line of symmetry for this parabola and the equation of that line will be displayed
You can continue to analyze different areas of this graph and the line of symmetry will still be displayed
Casio ldquoThe Basics fx-9750GIIrdquo 15
fx-9750GIIBASIC FUNCTIONALITYldquoThe Basicsrdquo
CASIO fx-9750GII
The following explains the meaning of each icon on the fx-9750GII main icon menu ICON Menu Name Description
RUN This icon menu is used for general computations including
binary octal decimal and hexadecimal functions and matrices
STATISTICS
This icon menu is used to perform single-variable (standard deviation) and paired variable (regression) statistical calculations to perform tests to analyze data and to draw statistical graphs
GRAPH The icon menu is used to draw store and calculate information
of functions
DYNAMIC GRAPH
This icon menu is used to draw multiple versions of a graph by changing the values in a function
TABLE
This icon menu is used to store functions to generate a numeric table of different solutions as the values assigned to variables in a function change and to draw graphs
RECURSION
This icon menu is used to store recursion formulas to generate a numeric table of different solutions as the values assigned to the variables in a function change and to draw graphs
CONICS
This icon menu is used to graph parabolas circles ellipses and hyperbolas You can input a rectangular or polar coordinate function or a parametric function for graphing
EQUATION
This icon menu is used to solve linear equations with two through six unknowns and high-order equations from 2nd to 6th degree
PROGRAM This icon menu is used to store programs in the program area
and to run programs
TIME VALUE OF MONEY
This icon menu is used to perform financial calculations and to draw cash flow and other types of graphs
Data Analyzer Link
This icon menu is use to control the optionally available EA-200 Data Analyzer For information about this icon menu download the E-CON2 manual from httpeducasiocom
LINK This icon menu is used to transfer memory contents or back-up
data to another unit or PC
MEMORY This icon menu is used to manage data stored in memory
SYSTEM This icon menu is used to initialize memory adjust contrast reset
memory and to manage other system settings
1
RUN
This section is an overview of the RUNMAT Icon To select an icon from the icon menu system use the $BNto highlight the desired icon then press l or press the
numberletter in the lower right corner of the icon For the Run menu press 1to display the initial Run screen
1 When performing general computations select z to enter fractions and mixed
numbers To solve the problem 31
285 input the following
5z8+2z1z3l
2 To change the answer 2471
to a mixed number press LxX
3 To change the answer to decimal form press x x is a toggle key that will switch entered data or answers from fraction to decimal form or decimal to fraction form
4 To change the number of decimal places displayed enter the set up menu by pressing Lp Nto Display select q(Fix) and enter the desired amount of decimal places followed by l For this example 3 decimal places are used
LpNNNNNNNNNNNq3ldlx
Casio ldquoThe Basics fx-9750GIIrdquo 3
From the Run menu many calculations can be entered by selecting i For example hyperbolic probabilitydistribution numeric (including differential and integration) conversion engineering complex number and binary octal decimal and hexadecimal calculations
5 To calculate the possible number of different arrangements using 4 items selected from among 10 items enter the following from the Run home screen
iue10w4l
Note The fixed decimal setting was changed back to Norm1
6 To calculate 2103 enter the following from the Run home screen
iewjn10^3+2kl
Casio ldquoThe Basics fx-9750GIIrdquo 4
Note Calculations can be performed with complex numbers and
answers can be displayed in a+bi form
7 To calculate i43 enter the following from the Run home screen
iewj3+4qkl
8 To calculate ( enter the following i15)i23
iejn3+2qk+15ql
GRAPH
Various icon (Run Table Dynamic Recursion amp Conics) will allow you to graph or analyze the graphs of given information This section is an overview of the GRAPH Icon and will
highlight some basic features of this mode
The initial screen allows immediate input of function set equal to zero You may begin inputting data into Y1 and press lto store To draw your function select u You can change the type of graph (r = polar coordinate parametric functions x = and x-and y-inequalities) by select the corresponding function button and then press the $to begin inputting information 1 To draw the graph of the function from the Icon Menu system input the following
3x5x2y 2
32fs-5f-3l
To analyze features of this graph (roots maximum and minimums y-intercepts intersections determine coordinates and integrals) select y(G-Solve)
2 q(Root)
Note The left-most root will always display first Select$to display the next root
Casio ldquoThe Basics fx-9750GIIrdquo 5
3 e(Minimum) Note As long as the x-value of your vertex is in the viewable domain you do not need to see the vertex to calculate the minimum value However you can change the viewing window by selecting ein the graph window You can also change the window manually by using the$BN
4 r(y-intercept) 5 q(y-calculation) What is the value of y when x is 5 6 w(x-calculation) What is the value (s) of x when y is 1 7 e(integral) Determine the integral value at (03) for the function
3x5x21Y 2
Casio ldquoThe Basics fx-9750GIIrdquo 6
TABLE
The section is an overview of the TABLE Icon To select this icon you may highlight it and press lor press 5
The initial screen allows immediate input of functions that are set equal to 0 To change the type of expression to be entered select wfor polar coordinates efor parametric functions or rto change a previously entered function to an inequality
1 To see a table for the function 4x32
y highlight Y1 and input the following
2z3f-4lu 2 The default setting for tables is X starts at 1 ends at 5 and increases by increments of You change this by pressing dor q(FORM) to return to the initial screen and then select y(SET) 3 However you can manually enter a number anywhere in the x-column of the table and presslto see the corresponding y-value (including fractions decimals even ) You can insert and delete rows in this view by pressing e(ROW) 4 From the table view screen you can press y(G-CON) to see a linear graph or
u(G-PLT) to see a plot graph for the function you entered
Casio ldquoThe Basics fx-9750GIIrdquo 7
5 To see a split screen of your table and graph press Lp to enter the setup menu for the table icon and Nto Dual Screen select q(T + G) d and then u
Casio ldquoThe Basics fx-9750GIIrdquo 8
STATISTICS
This section is an overview of the STAT icon it will highlight just a few of the features for single-variable data and paired-variable data To select this icon you may highlight it and
presslor press2
The initial List Editor Screen that allows input of statistical data and performs numerous statistical calculations To input a list of single-variable data highlight the first cell under List 1 and enter each number followed by l 1 For this example input this set of data
1 05 12 4 -1 1 3 5 6 34 2 From this screen you display various graphs depending on whether you single or paired-variable data (scatter-plot line normal probability histogram median box mean box normal distribution broken line and regression linear quadratic cubic quartic logarithmic exponential power sinusoidal and logistic)
3 The initial default graph is a scatter-plot To change the type of graph you would like to use press q(GRPH) then u(SET) Nto Graph Type for this set of data we will make a histogram press u and then qfor histogram
Casio ldquoThe Basics fx-9750GIIrdquo 9
4 Press dto take you back to your list of data and select q(GPH1) and then lto see your graph 5 The following screen shots show what one-variable calculations can be obtained by pressing q
6 To delete this set of data press duntil you return to the initial List Editor screen Select ufor more options arrow up until List 1 is highlighted select r(Del-A) then q
7 For paired variable data use the following List 1 05 12 24 40 52 List 2 -21 03 15 20 24
Enter List 1 first and then $to begin entering List 2 8 To see a scatter-plot of these data you can go through and change back GPH 1 using the process above or select w(GPH 2) from the List Editor screen whose default is also a scatter-plot
Casio ldquoThe Basics fx-9750GIIrdquo 10
9 From the scatter-plot screen pressing qwill show all the calculation that can be obtained from this set of data 10 To calculate linear regression select wfrom the first set of options and then press qfor form baxy 11 From this screen you select y(COPY) to copy and then paste the equation into the initial graph screen or select u(DRAW) to show the linear regression
Casio ldquoThe Basics fx-9750GIIrdquo 11
EQUATION
This section is an overview of the EQUATION Icon To select this icon highlight it and press l or press 8
The initial Equation Editor screen has three modes to choose from Simultaneous Polynomial and Solver this section will give an overview of each mode The Simultaneous mode allows you to solve simultaneous linear equations with two to six unknowns 1 Solve the following system of equations
7zy4x51z3y6x1z2yx4
Press q to select the Simultaneous mode and press wfor three unknowns The calculator will display a matrix where the coefficients and constants can be entered in to as long as each equation is in standard form To enter this system of equations (already in standard form) input the following
4 l 1 l n 2 l n 1 l 1 l 6 l 3 l 1 l n 5 l 4 l 1 l n 7 l
There are four options at the bottom of the screen press q(SOLV) The solution to this system is (1 -1 2)
Casio ldquoThe Basics fx-9750G 12
Press dto return to the previous screen press q(REPT) to edit this problem or continue solving simultaneous equations with three unknowns To edit just one of the numbers in the system arrow to the number to be edited and press r(EDIT) or highlight the number to be edited and input the new number then press l Press duntil the Equation Editor screen is displayed The second mode is Polynomial w and can be used to solve high-order equations (in standard form) from the 2nd to the 6th degree 2 To solve the equation x3 ndash 2x2 ndash x + 2 = 0 input the following
ww1ln2ln1l2lq
3 To change the equation to x3 + 2x2 + 3x + 2 = 0 select q(REPT) and change the b- value to 2 the c-value to 3 and press q(SOLV)
4 The default setting is for real numbers to change the display to a+bi form press Lp for the Polynomial Set-Up menu select w(a+bi) d and then q(SOLV)
The third function Solver e allows you to determine the value of any variable in a formula or equation You can input any formula exactly as it appears using a for any variables We will take a look at solving a linear equation and a formula
5 To find the value of x in the following equation 2(x 5) = 3x + 2 input the following starting from the Equation Editor Screen
e2jf-5kLn3f+2lu
Casio ldquoThe Basics fx-9750GIIrdquo 13
In the last screen ldquoLftrdquo and ldquoRgtrdquo represent the values of the left and right sides that have calculated using the solution this is the calculatorrsquos way of checking the solution You can also enter a formula assign values and solve for specific variable using the Solver function of the Equation Editor 6 Find the radius (to the nearest hundredth) of sphere whose volume is 370597 cm3
To enter the formula 34
V r3 input the following in to the calculator
qBa2L4z3Lca6^3l
Note Selecting q will take you back to the previous screen where you can edit and re-
solve the previous equation or begin a new problem
Casio ldquoThe Basics fx-9750GII 14
CONICS
This section is an overview of the CONICS Icon To select this icon you may highlight it and press l or simply press 7
The initial screen allows you to choose from various conic functions including rectangular polar or parametric form You may use the BNto select the equation of the function in accordance with the type of graph you want to draw Once you have chosen the conic function that you would like to graph you will need to enter the coefficients of the function and then press DRAW u 1 To view the graph of the conic y select the form from the Conics formula menu
3x5x2 2 CBXAXY 2
In the Conics modes when you press y(G-Solv) although you are still graphing a parabola like in the graphing section notice how the vocabulary and options have changed 2 For example you can now examine the line of symmetry for this parabola and the equation of that line will be displayed
You can continue to analyze different areas of this graph and the line of symmetry will still be displayed
Casio ldquoThe Basics fx-9750GIIrdquo 15
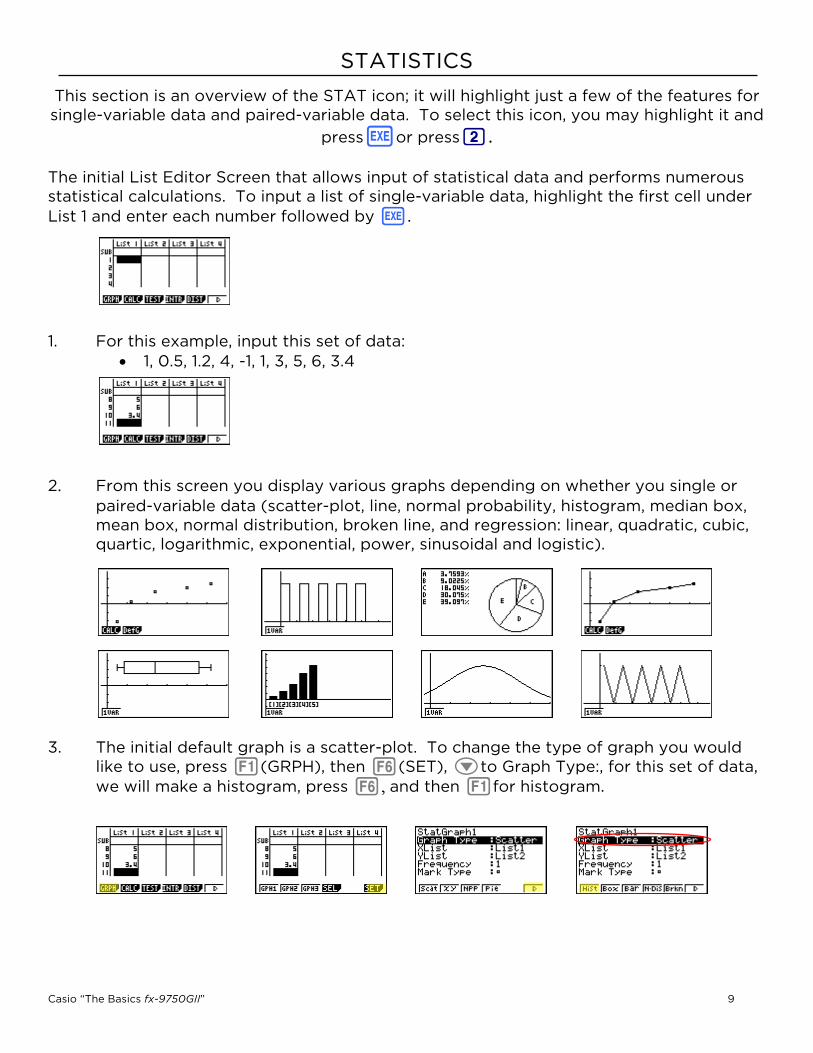
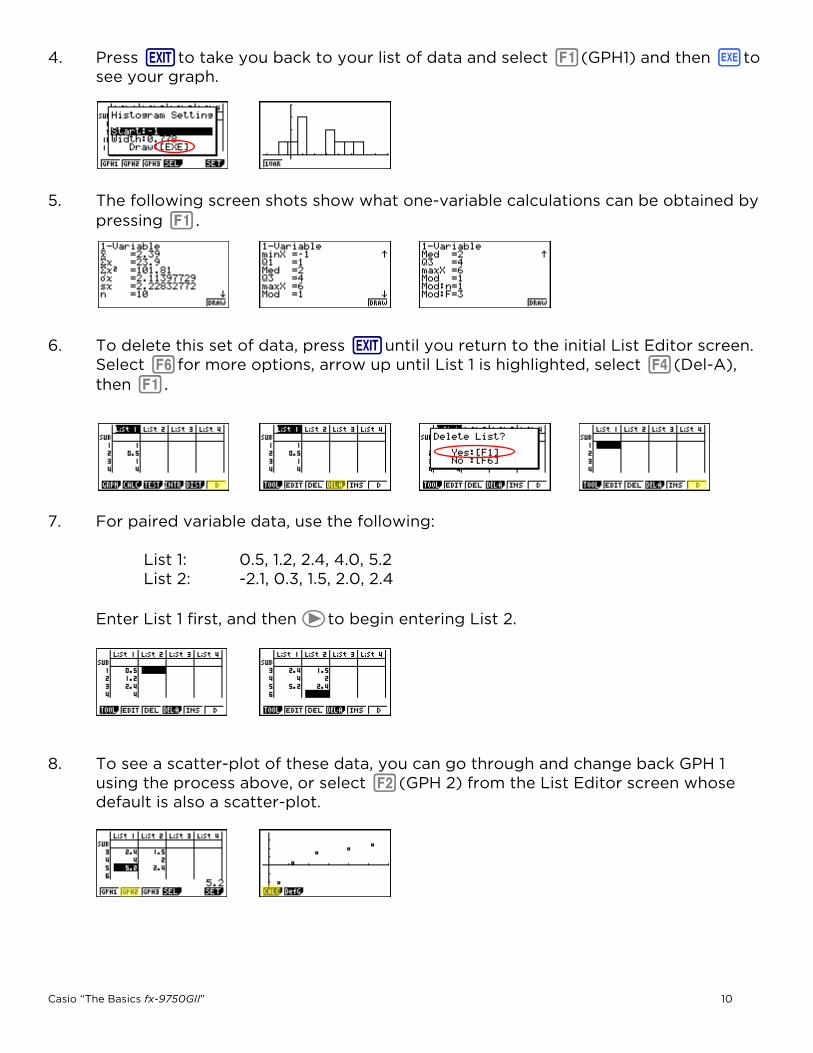
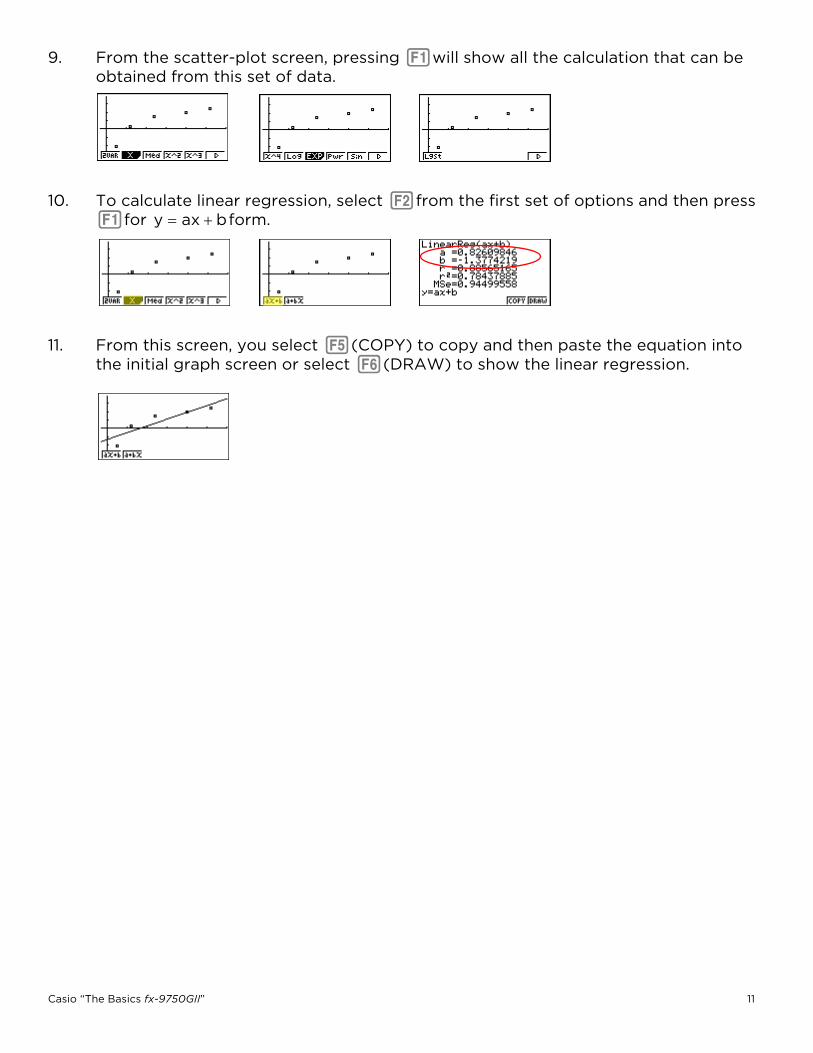
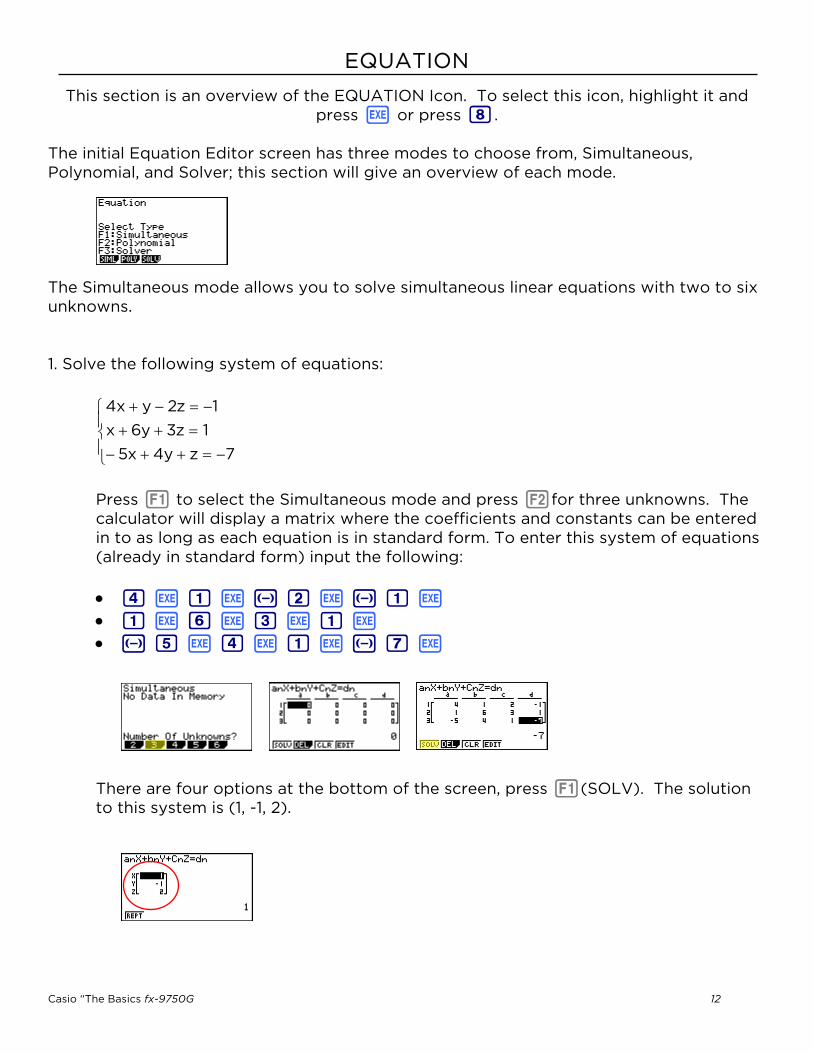
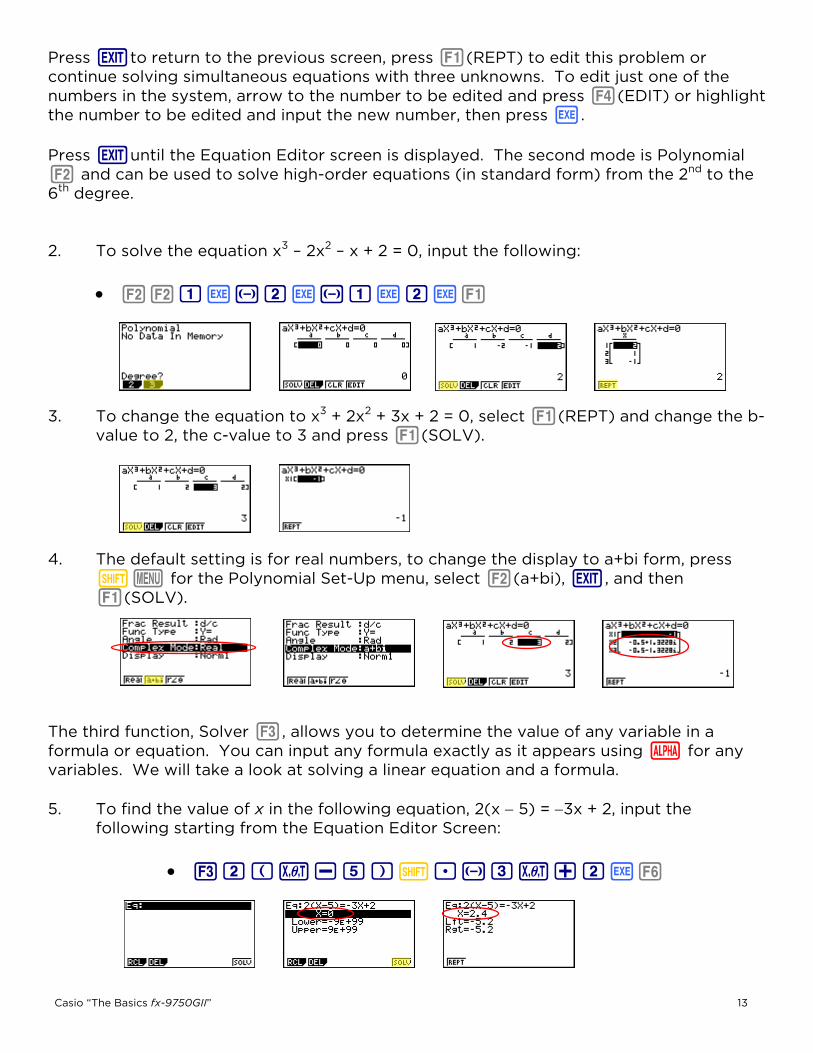
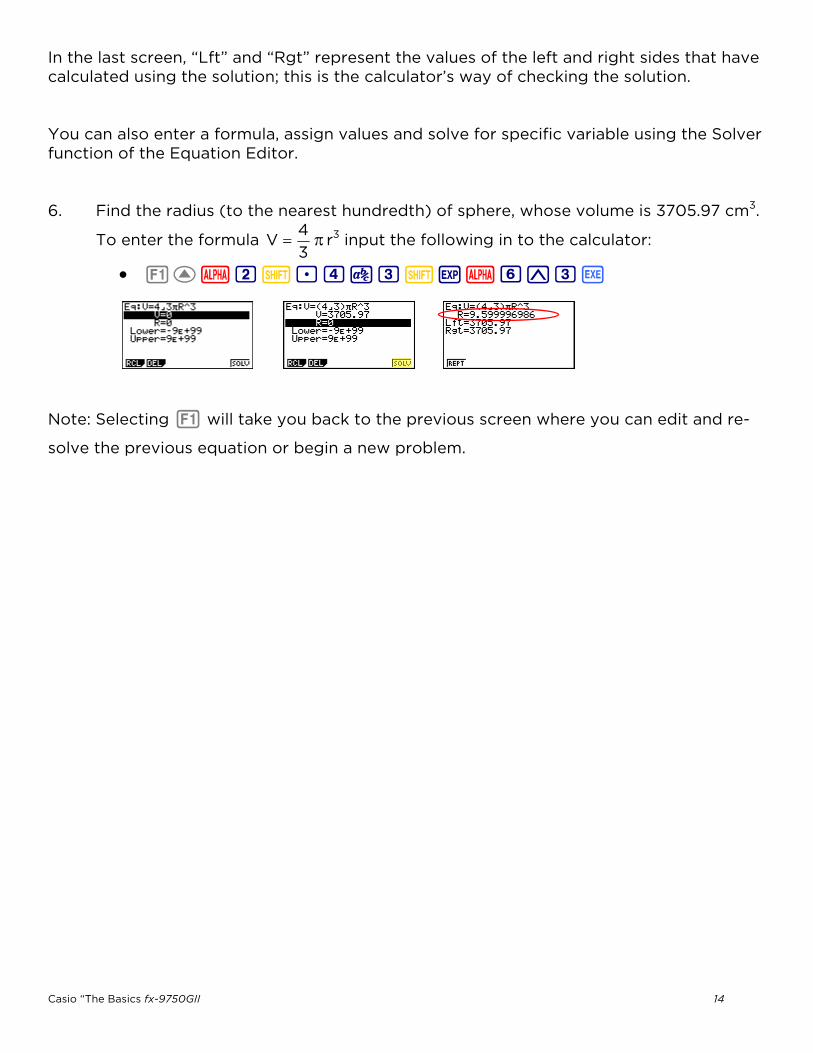
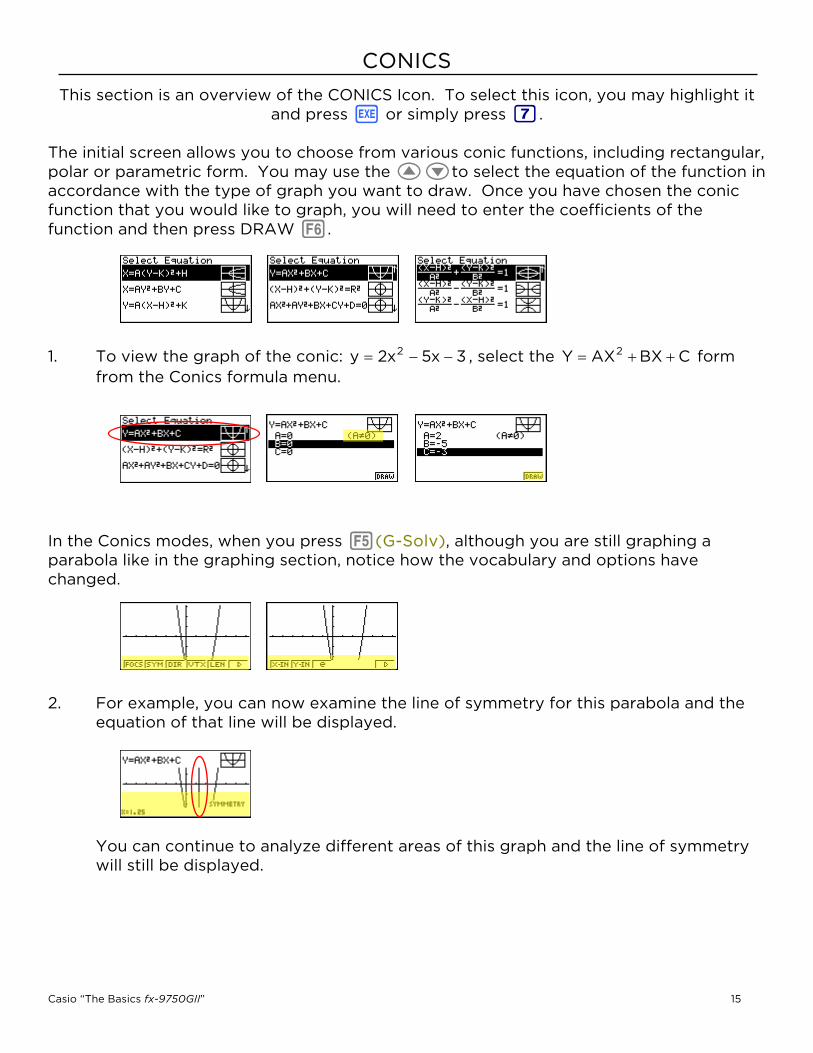