Embed Size (px)
Citation preview
Cass A and Cygnus A Contour Mapping
Using the SRT
Radio Astronomy for Teachers
By Jean Davis and Linda Pehr
Project Experimentation
• First Idea
Detect next 3 strongest radio sources. Use Moon, Cass A, and Cygnus A—based on handout received from Mark
• Second Idea
Use SRT to track the 3 sources and then average the data, graph it?, create a contour map to match the computer version
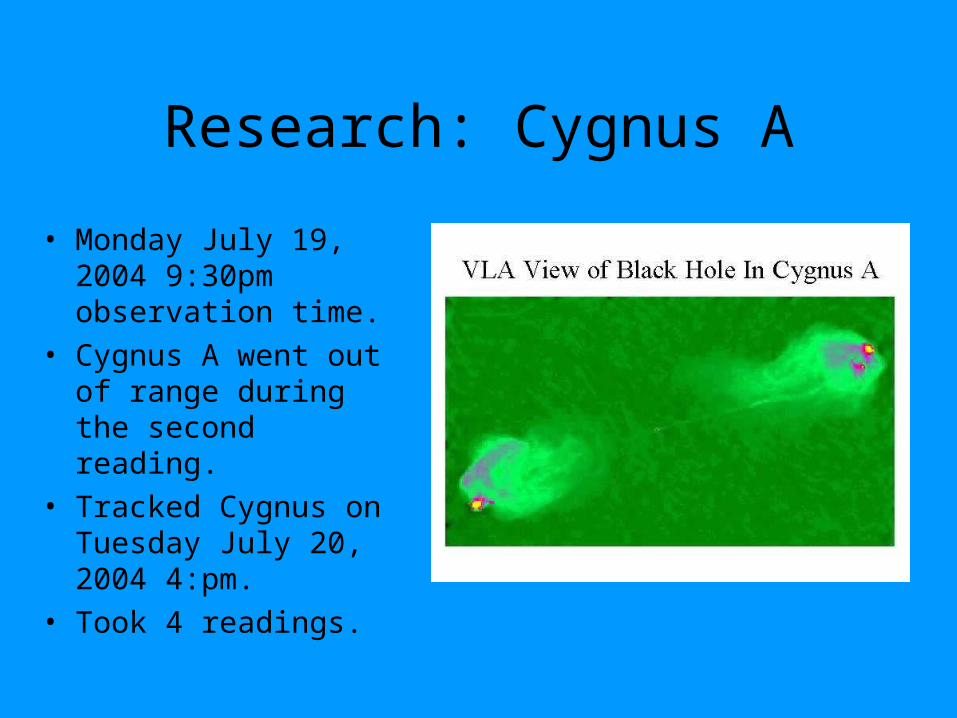
Research: Cygnus A
• Monday July 19, 2004 9:30pm observation time.
• Cygnus A went out of range during the second reading.
• Tracked Cygnus on Tuesday July 20, 2004 4:pm.
• Took 4 readings.

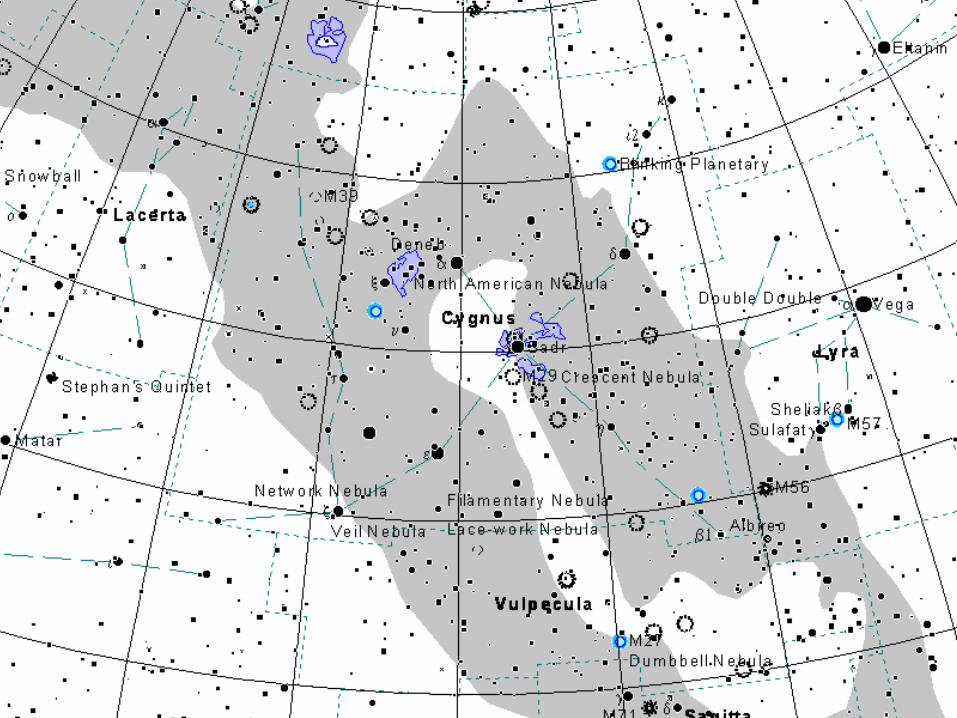
Research Cygnus A: Background
• Nicknamed Cyg A/cataloged 3C 405• AGN/radio elliptical galaxy• Quasar• Non-thermal emission• 720,000,000 ly (other sources range from
600,000,000-1,000,000,000)• RA 19: 57:44.44 (h:m:s)
• Declination 40:35:46.3 (degree:m:s)
• 3rd strongest source
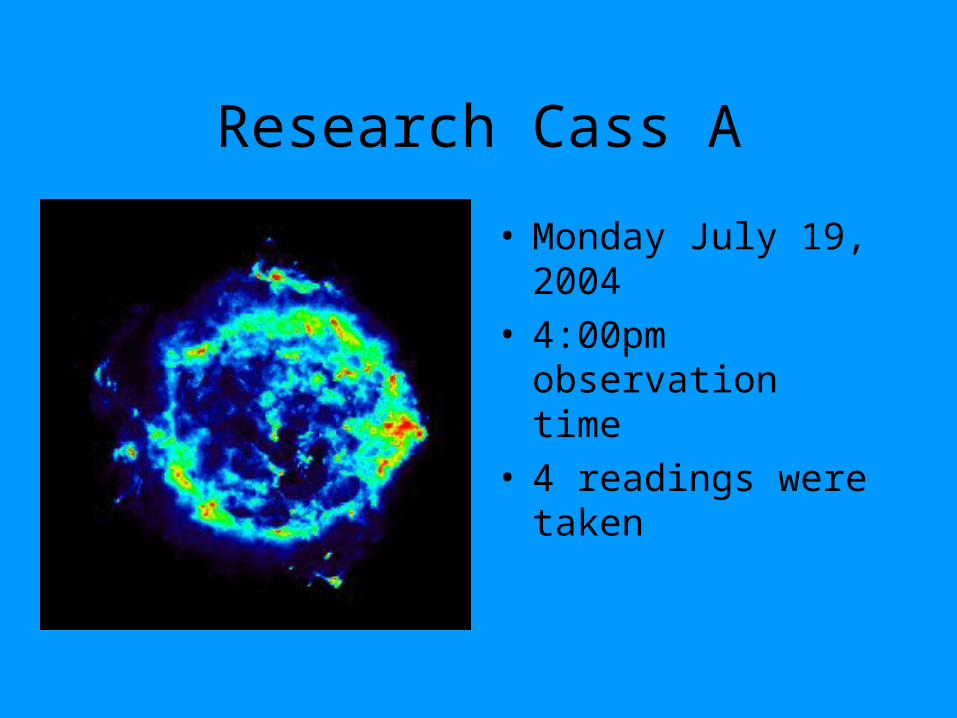
Research Cass A
• Monday July 19, 2004• 4:00pm observation
time• 4 readings were taken

Research Cassiopeia A: Background
• Nicknamed Cass A/cataloged 3C 461• A supernova remnant (youngest known)• Shell type remnant• Thermal emission• 11,000 ly• RA 23 : 23.4 (h:m)• Declination +58 : 8.9 (deg:m)• Strongest radio source besides the Sun
Project Goal
• Collect continuum data from Cass A and Cygnus A and generate a contour map to compare it to the intensity map generated by the SRT software.
• Question: Will our contour map resemble the computers?
• Hypothesis: We should be able to collect enough data points to generate a similar intensity picture.
Project Experimentation/dataMonday, July 19• Tracked the Moon, Virgo A, and Cass A• Averaged all Cass A data
– Created a 5 by 5 array after subtracting minimum data points.
– Array was written to represent sky placement.– Contour maps were drawn for trials #1, #12, and
the average.
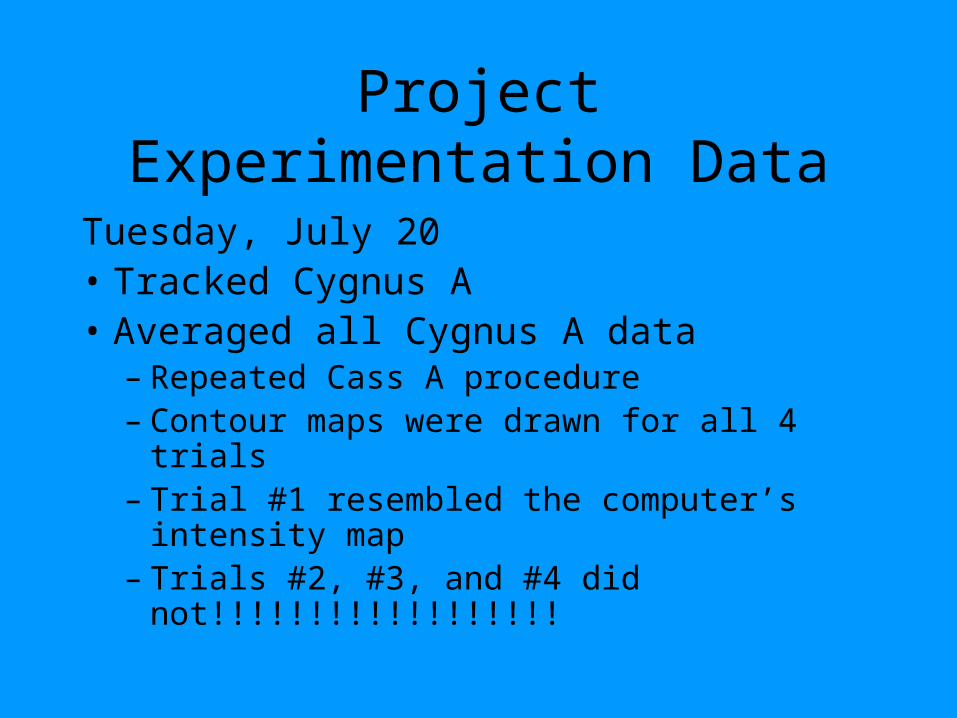
Project Experimentation Data
Tuesday, July 20• Tracked Cygnus A• Averaged all Cygnus A data
– Repeated Cass A procedure– Contour maps were drawn for all 4 trials– Trial #1 resembled the computer’s intensity
map– Trials #2, #3, and #4 did not!!!!!!!!!!!!!!!!!!
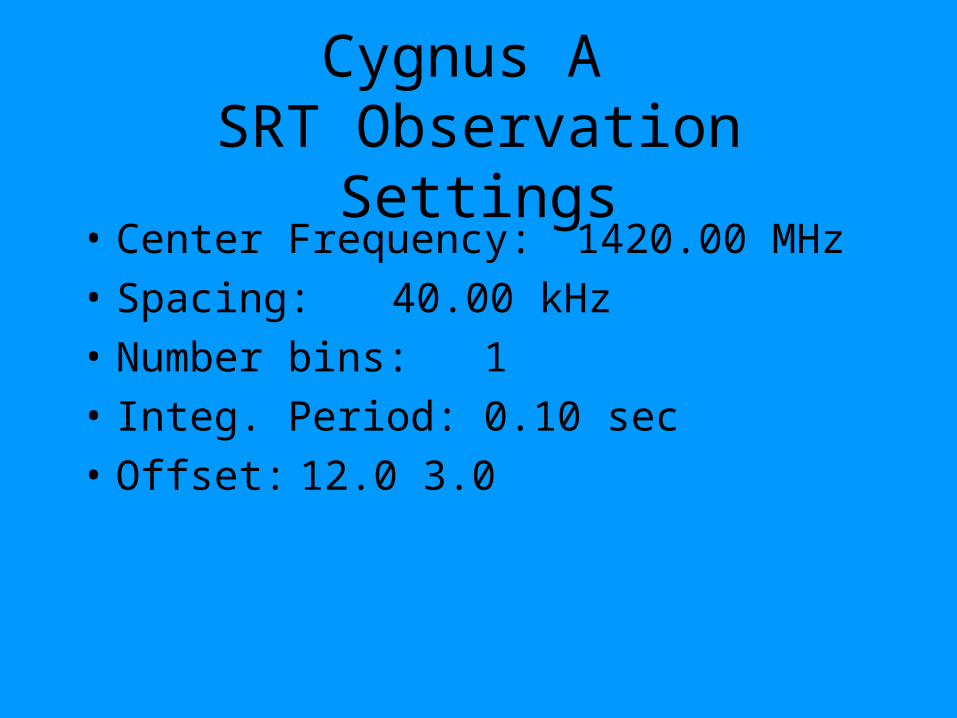
Cygnus A SRT Observation Settings
• Center Frequency: 1420.00 MHz
• Spacing: 40.00 kHz
• Number bins: 1
• Integ. Period: 0.10 sec
• Offset: 12.0 3.0
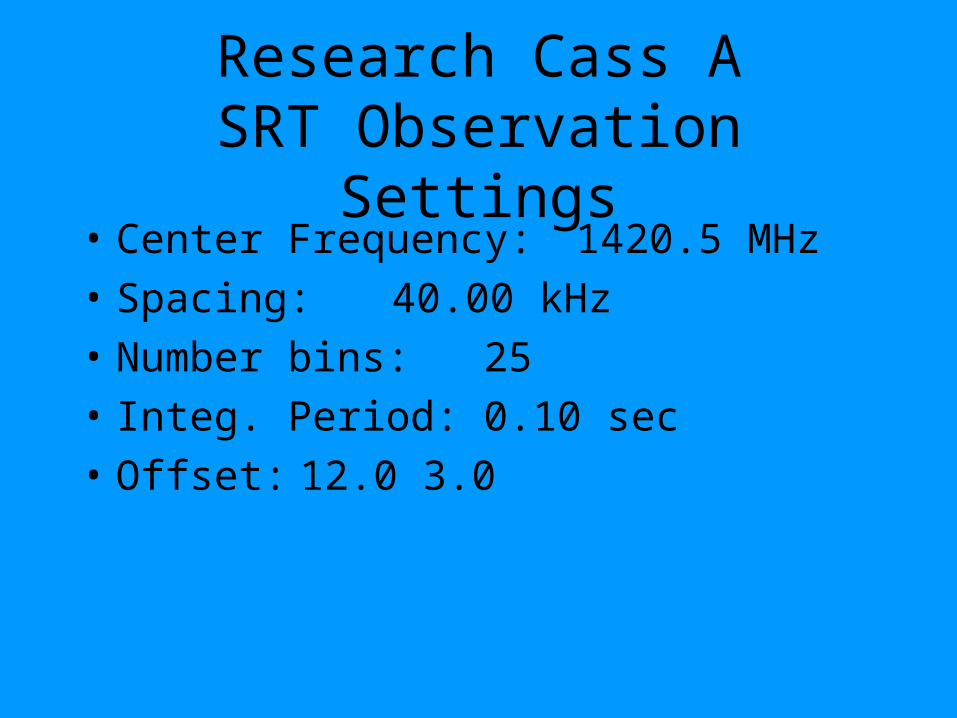
Research Cass ASRT Observation Settings
• Center Frequency: 1420.5 MHz
• Spacing: 40.00 kHz
• Number bins: 25
• Integ. Period: 0.10 sec
• Offset: 12.0 3.0

ComparisonCygnus A Scan #1
Project Conclusion
Since we don’t know exactly how the computer makes the picture and with what data, and after our many trials with only one match, we conclude our data was not significant enough to make a comparable intensity map.

References
• Chaisson, Eric and Steve McMillan. Astronomy Today. Upper Saddle River, NJ: Prentice Hall, 1999.
• http://www.hawastsoc.org/deepsky/cas/casp.html
• http://www.hawastsoc.org/deepsky/cyg/cygp.html
• http://68.5.152.104:800/observatory/radioast/sld024.htm
• http://coolcosmos.ipac.caltech.edu/cosmic_classroom/multiwavelength_astronomy/multiwavelength_museum/casA.html
• Kraus, John D. Radio Astronomy 2nd Edition. Powell, Ohio: Cygnus-Quasar Books, 1986.


![[Cygnus] grid component](https://img.pdfslide.net/doc/110x75/548cf25ab4795945158b4700/cygnus-grid-component.jpg)