Embed Size (px)
Citation preview
901
CAST STAINLESS STEEL FERRITE AND GRAIN STRUCTURE
CO Ruud, P Ramuhalli, RM Meyer, R Mathews, AA Diaz and MT Anderson
Pacific Northwest National Laboratory1, Richland, WA, USA
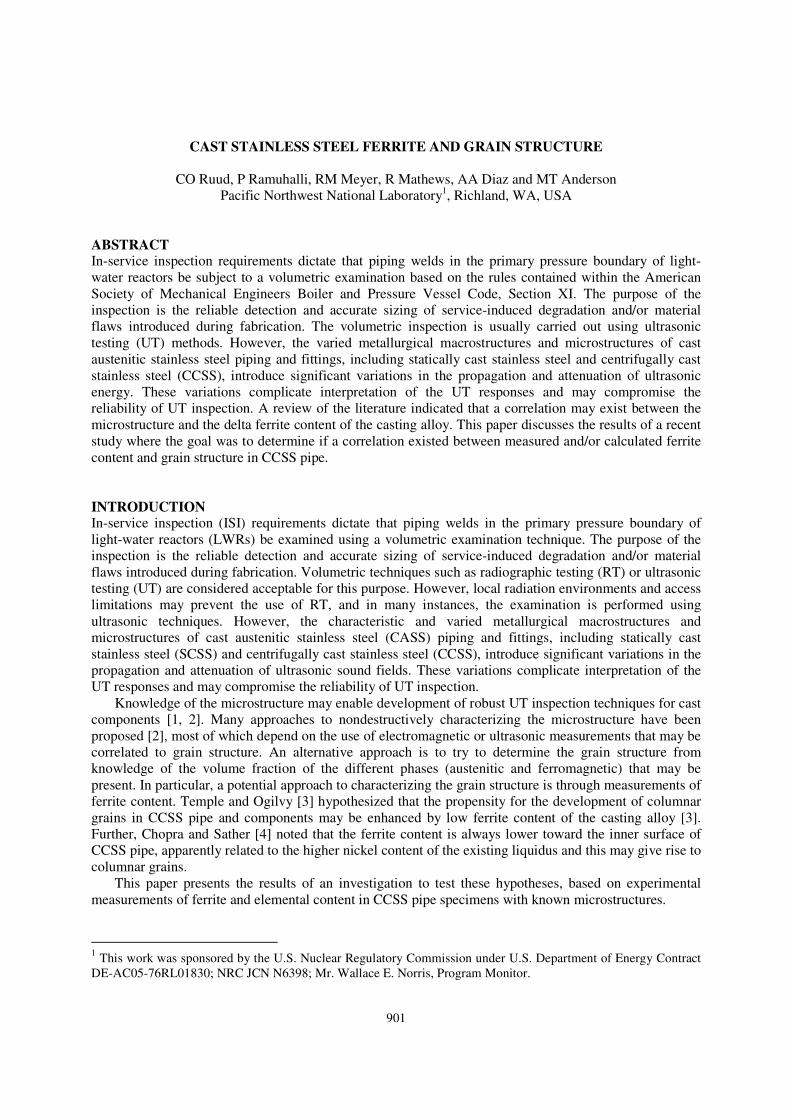
ABSTRACT
In-service inspection requirements dictate that piping welds in the primary pressure boundary of light-
water reactors be subject to a volumetric examination based on the rules contained within the American
Society of Mechanical Engineers Boiler and Pressure Vessel Code, Section XI. The purpose of the
inspection is the reliable detection and accurate sizing of service-induced degradation and/or material
flaws introduced during fabrication. The volumetric inspection is usually carried out using ultrasonic
testing (UT) methods. However, the varied metallurgical macrostructures and microstructures of cast
austenitic stainless steel piping and fittings, including statically cast stainless steel and centrifugally cast
stainless steel (CCSS), introduce significant variations in the propagation and attenuation of ultrasonic
energy. These variations complicate interpretation of the UT responses and may compromise the
reliability of UT inspection. A review of the literature indicated that a correlation may exist between the
microstructure and the delta ferrite content of the casting alloy. This paper discusses the results of a recent
study where the goal was to determine if a correlation existed between measured and/or calculated ferrite
content and grain structure in CCSS pipe.
INTRODUCTION
In-service inspection (ISI) requirements dictate that piping welds in the primary pressure boundary of
light-water reactors (LWRs) be examined using a volumetric examination technique. The purpose of the
inspection is the reliable detection and accurate sizing of service-induced degradation and/or material
flaws introduced during fabrication. Volumetric techniques such as radiographic testing (RT) or ultrasonic
testing (UT) are considered acceptable for this purpose. However, local radiation environments and access
limitations may prevent the use of RT, and in many instances, the examination is performed using
ultrasonic techniques. However, the characteristic and varied metallurgical macrostructures and
microstructures of cast austenitic stainless steel (CASS) piping and fittings, including statically cast
stainless steel (SCSS) and centrifugally cast stainless steel (CCSS), introduce significant variations in the
propagation and attenuation of ultrasonic sound fields. These variations complicate interpretation of the
UT responses and may compromise the reliability of UT inspection.
Knowledge of the microstructure may enable development of robust UT inspection techniques for cast
components [1, 2]. Many approaches to nondestructively characterizing the microstructure have been
proposed [2], most of which depend on the use of electromagnetic or ultrasonic measurements that may be
correlated to grain structure. An alternative approach is to try to determine the grain structure from
knowledge of the volume fraction of the different phases (austenitic and ferromagnetic) that may be
present. In particular, a potential approach to characterizing the grain structure is through measurements of
ferrite content. Temple and Ogilvy [3] hypothesized that the propensity for the development of columnar
grains in CCSS pipe and components may be enhanced by low ferrite content of the casting alloy [3].
Further, Chopra and Sather [4] noted that the ferrite content is always lower toward the inner surface of
CCSS pipe, apparently related to the higher nickel content of the existing liquidus and this may give rise to
columnar grains.
This paper presents the results of an investigation to test these hypotheses, based on experimental
measurements of ferrite and elemental content in CCSS pipe specimens with known microstructures.
1 This work was sponsored by the U.S. Nuclear Regulatory Commission under U.S. Department of Energy Contract
DE-AC05-76RL01830; NRC JCN N6398; Mr. Wallace E. Norris, Program Monitor.
902
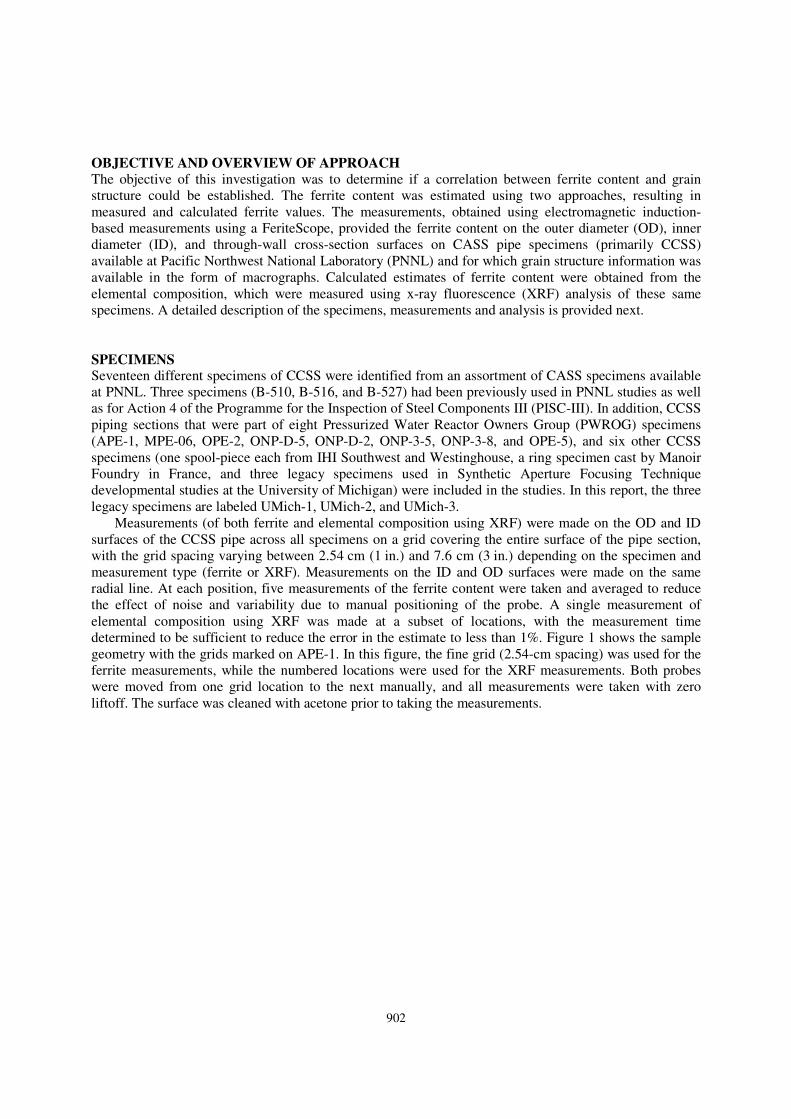
OBJECTIVE AND OVERVIEW OF APPROACH
The objective of this investigation was to determine if a correlation between ferrite content and grain
structure could be established. The ferrite content was estimated using two approaches, resulting in
measured and calculated ferrite values. The measurements, obtained using electromagnetic induction-
based measurements using a FeriteScope, provided the ferrite content on the outer diameter (OD), inner
diameter (ID), and through-wall cross-section surfaces on CASS pipe specimens (primarily CCSS)
available at Pacific Northwest National Laboratory (PNNL) and for which grain structure information was
available in the form of macrographs. Calculated estimates of ferrite content were obtained from the
elemental composition, which were measured using x-ray fluorescence (XRF) analysis of these same
specimens. A detailed description of the specimens, measurements and analysis is provided next.
SPECIMENS
Seventeen different specimens of CCSS were identified from an assortment of CASS specimens available
at PNNL. Three specimens (B-510, B-516, and B-527) had been previously used in PNNL studies as well
as for Action 4 of the Programme for the Inspection of Steel Components III (PISC-III). In addition, CCSS
piping sections that were part of eight Pressurized Water Reactor Owners Group (PWROG) specimens
(APE-1, MPE-06, OPE-2, ONP-D-5, ONP-D-2, ONP-3-5, ONP-3-8, and OPE-5), and six other CCSS
specimens (one spool-piece each from IHI Southwest and Westinghouse, a ring specimen cast by Manoir
Foundry in France, and three legacy specimens used in Synthetic Aperture Focusing Technique
developmental studies at the University of Michigan) were included in the studies. In this report, the three
legacy specimens are labeled UMich-1, UMich-2, and UMich-3.
Measurements (of both ferrite and elemental composition using XRF) were made on the OD and ID
surfaces of the CCSS pipe across all specimens on a grid covering the entire surface of the pipe section,
with the grid spacing varying between 2.54 cm (1 in.) and 7.6 cm (3 in.) depending on the specimen and
measurement type (ferrite or XRF). Measurements on the ID and OD surfaces were made on the same
radial line. At each position, five measurements of the ferrite content were taken and averaged to reduce
the effect of noise and variability due to manual positioning of the probe. A single measurement of
elemental composition using XRF was made at a subset of locations, with the measurement time
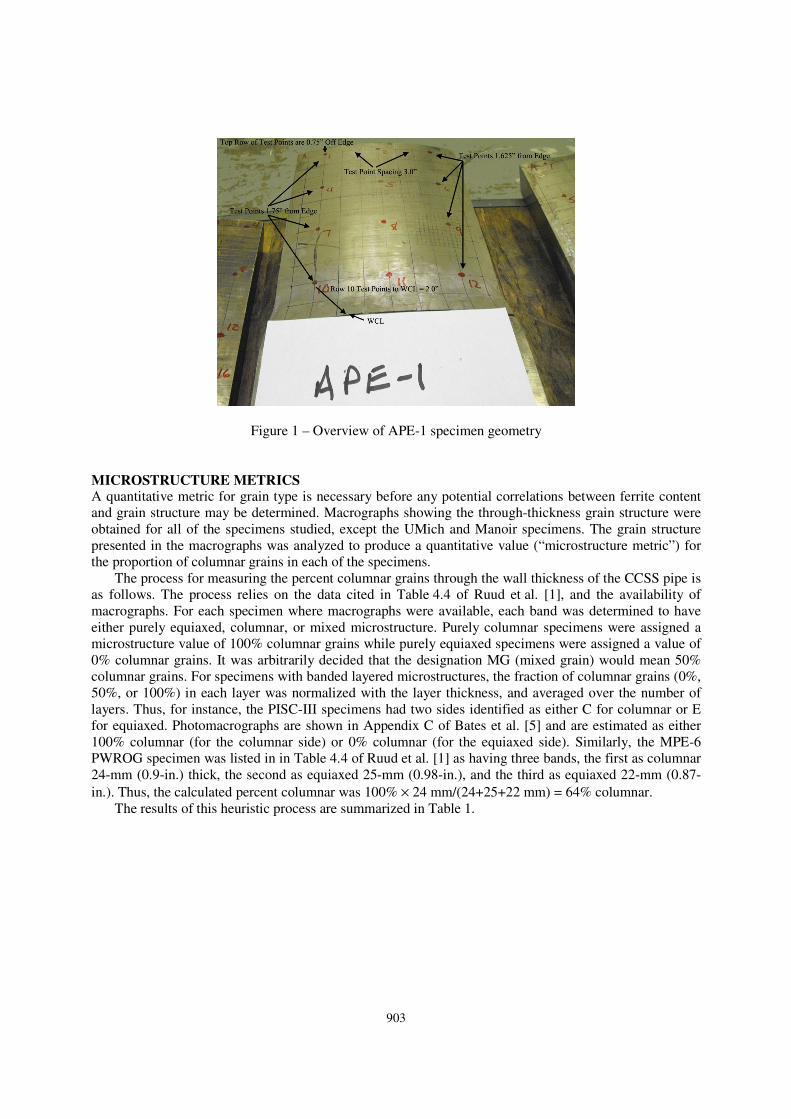
determined to be sufficient to reduce the error in the estimate to less than 1%. Figure 1 shows the sample
geometry with the grids marked on APE-1. In this figure, the fine grid (2.54-cm spacing) was used for the
ferrite measurements, while the numbered locations were used for the XRF measurements. Both probes
were moved from one grid location to the next manually, and all measurements were taken with zero
liftoff. The surface was cleaned with acetone prior to taking the measurements.
903
Figure 1 – Overview of APE-1 specimen geometry
MICROSTRUCTURE METRICS
A quantitative metric for grain type is necessary before any potential correlations between ferrite content
and grain structure may be determined. Macrographs showing the through-thickness grain structure were
obtained for all of the specimens studied, except the UMich and Manoir specimens. The grain structure
presented in the macrographs was analyzed to produce a quantitative value (“microstructure metric”) for
the proportion of columnar grains in each of the specimens.
The process for measuring the percent columnar grains through the wall thickness of the CCSS pipe is
as follows. The process relies on the data cited in Table 4.4 of Ruud et al. [1], and the availability of
macrographs. For each specimen where macrographs were available, each band was determined to have
either purely equiaxed, columnar, or mixed microstructure. Purely columnar specimens were assigned a
microstructure value of 100% columnar grains while purely equiaxed specimens were assigned a value of
0% columnar grains. It was arbitrarily decided that the designation MG (mixed grain) would mean 50%
columnar grains. For specimens with banded layered microstructures, the fraction of columnar grains (0%,
50%, or 100%) in each layer was normalized with the layer thickness, and averaged over the number of
layers. Thus, for instance, the PISC-III specimens had two sides identified as either C for columnar or E
for equiaxed. Photomacrographs are shown in Appendix C of Bates et al. [5] and are estimated as either
100% columnar (for the columnar side) or 0% columnar (for the equiaxed side). Similarly, the MPE-6
PWROG specimen was listed in in Table 4.4 of Ruud et al. [1] as having three bands, the first as columnar
24-mm (0.9-in.) thick, the second as equiaxed 25-mm (0.98-in.), and the third as equiaxed 22-mm (0.87-
in.). Thus, the calculated percent columnar was 100% × 24 mm/(24+25+22 mm) = 64% columnar.
The results of this heuristic process are summarized in Table 1.
904
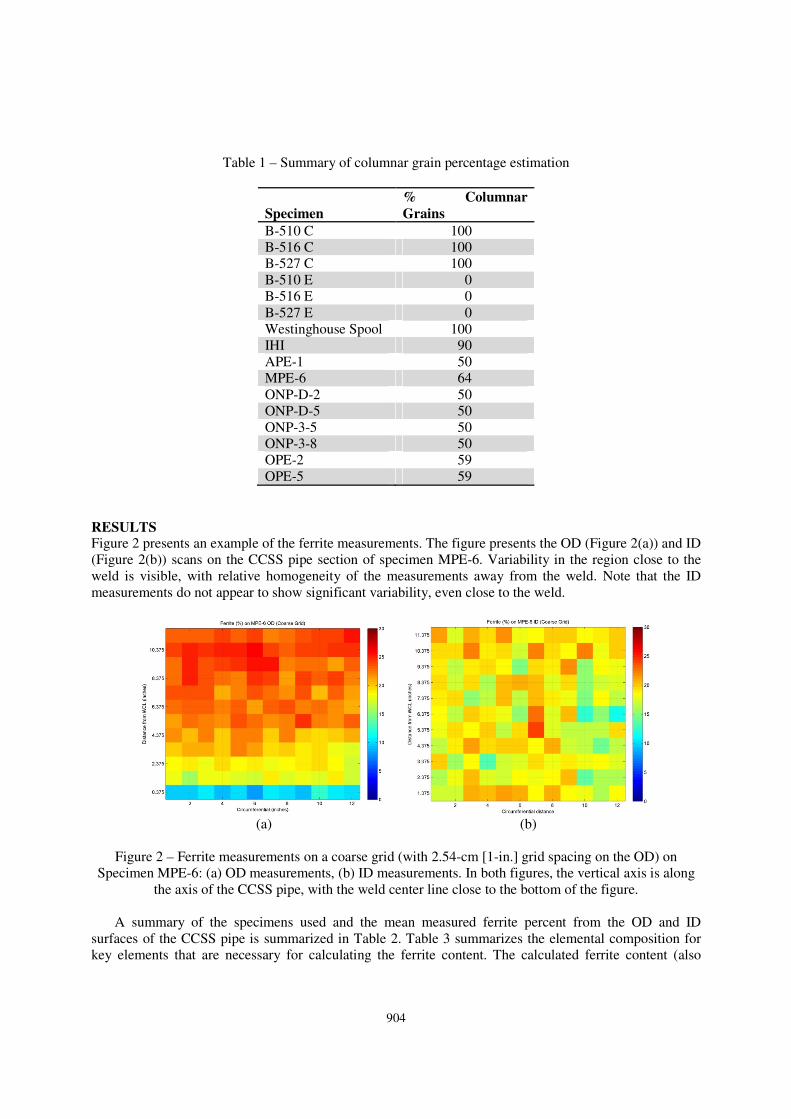
Table 1 – Summary of columnar grain percentage estimation
Specimen
% Columnar
Grains
B-510 C 100
B-516 C 100
B-527 C 100
B-510 E 0
B-516 E 0
B-527 E 0
Westinghouse Spool 100
IHI 90
APE-1 50
MPE-6 64
ONP-D-2 50
ONP-D-5 50
ONP-3-5 50
ONP-3-8 50
OPE-2 59
OPE-5 59
RESULTS
Figure 2 presents an example of the ferrite measurements. The figure presents the OD (Figure 2(a)) and ID
(Figure 2(b)) scans on the CCSS pipe section of specimen MPE-6. Variability in the region close to the
weld is visible, with relative homogeneity of the measurements away from the weld. Note that the ID
measurements do not appear to show significant variability, even close to the weld.
(a) (b)
Figure 2 – Ferrite measurements on a coarse grid (with 2.54-cm [1-in.] grid spacing on the OD) on
Specimen MPE-6: (a) OD measurements, (b) ID measurements. In both figures, the vertical axis is along
the axis of the CCSS pipe, with the weld center line close to the bottom of the figure.
A summary of the specimens used and the mean measured ferrite percent from the OD and ID
surfaces of the CCSS pipe is summarized in Table 2. Table 3 summarizes the elemental composition for
key elements that are necessary for calculating the ferrite content. The calculated ferrite content (also
905
shown in Table 3) was obtained using the model for predicting ferrite content according to Aubrey et al.
[6]:
eq % % %Cr Cr 1.21 Mo 0.48 Si 4.99= + + − (1)
2
eq % % % % %Ni Ni 0.11Mn 0.0086 Mn 18.4 N 24.5 C 2.77= + − + + + (2)
2
eq eq
calc%
eq eq
Cr CrFe 100.3 170.72 74.22.
Ni Ni
= − +
(3)
In these equations, refers to the percent composition of element X. These equations are based upon
Hull’s equivalent factors [6].
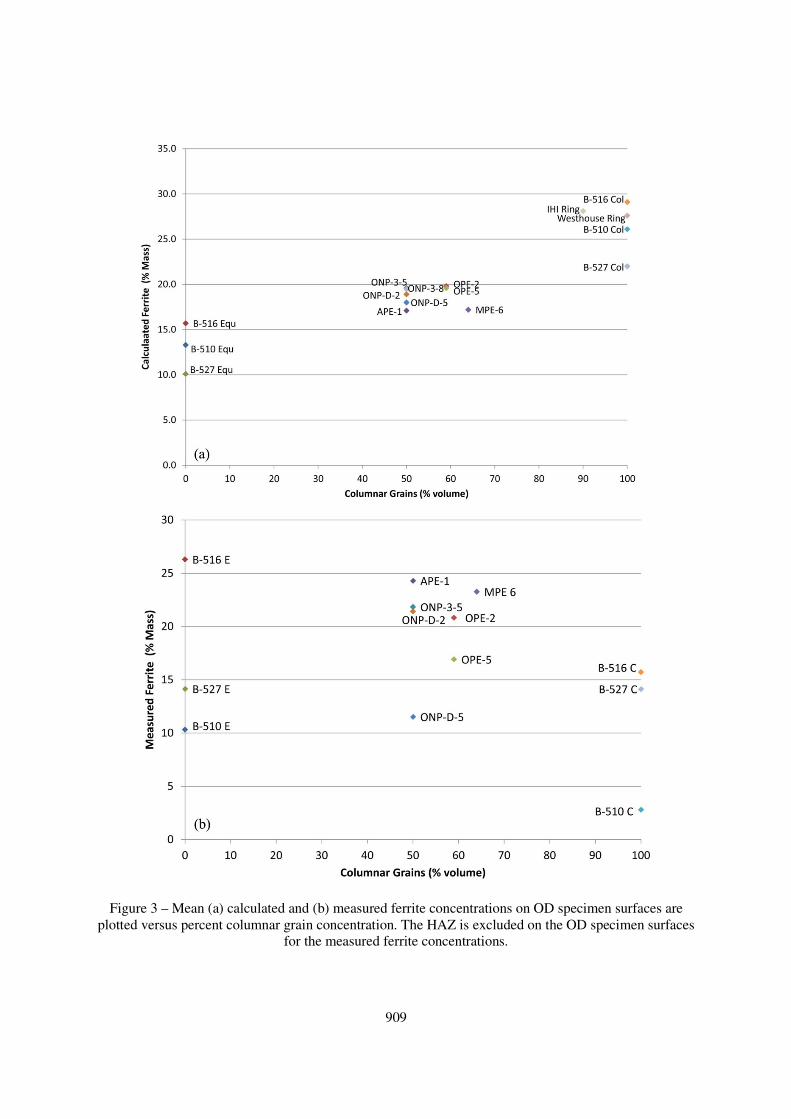
Figure 3(a) shows the grain type, as percent columnar grains, from Table 1 plotted against the refined
calculated percent ferrite from the mean OD XRF measurements. The calculated percent ferrite using the
refined data is listed in Table 3. Figure 3(b) shows the Feritscope-measured percent ferrite from the OD
(listed in Table 2) as a function of percent columnar grains.
906
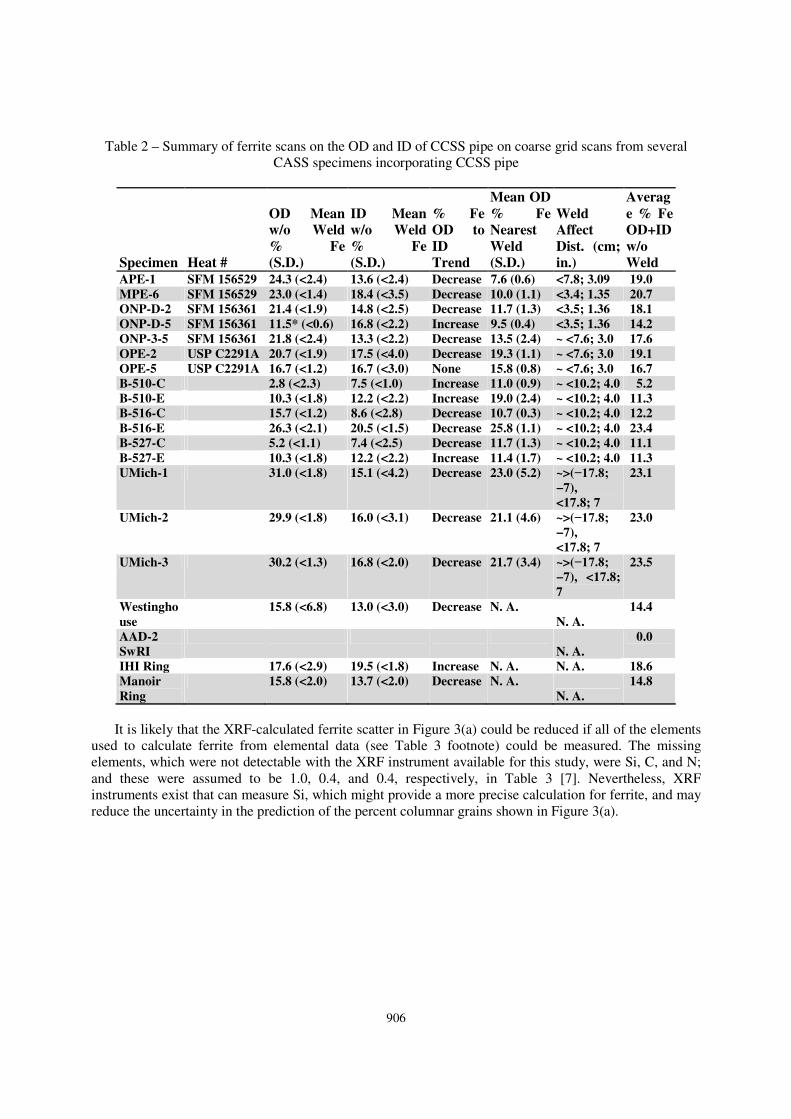
Table 2 – Summary of ferrite scans on the OD and ID of CCSS pipe on coarse grid scans from several
CASS specimens incorporating CCSS pipe
Specimen Heat #
OD Mean
w/o Weld
% Fe
(S.D.)
ID Mean
w/o Weld
% Fe
(S.D.)
% Fe
OD to
ID
Trend
Mean OD
% Fe
Nearest
Weld
(S.D.)
Weld
Affect
Dist. (cm;
in.)
Averag
e % Fe
OD+ID
w/o
Weld
APE-1 SFM 156529 24.3 (<2.4) 13.6 (<2.4) Decrease 7.6 (0.6) <7.8; 3.09 19.0
MPE-6 SFM 156529 23.0 (<1.4) 18.4 (<3.5) Decrease 10.0 (1.1) <3.4; 1.35 20.7
ONP-D-2 SFM 156361 21.4 (<1.9) 14.8 (<2.5) Decrease 11.7 (1.3) <3.5; 1.36 18.1
ONP-D-5 SFM 156361 11.5* (<0.6) 16.8 (<2.2) Increase 9.5 (0.4) <3.5; 1.36 14.2
ONP-3-5 SFM 156361 21.8 (<2.4) 13.3 (<2.2) Decrease 13.5 (2.4) ~ <7.6; 3.0 17.6
OPE-2 USP C2291A 20.7 (<1.9) 17.5 (<4.0) Decrease 19.3 (1.1) ~ <7.6; 3.0 19.1
OPE-5 USP C2291A 16.7 (<1.2) 16.7 (<3.0) None 15.8 (0.8) ~ <7.6; 3.0 16.7
B-510-C 2.8 (<2.3) 7.5 (<1.0) Increase 11.0 (0.9) ~ <10.2; 4.0 5.2
B-510-E 10.3 (<1.8) 12.2 (<2.2) Increase 19.0 (2.4) ~ <10.2; 4.0 11.3
B-516-C 15.7 (<1.2) 8.6 (<2.8) Decrease 10.7 (0.3) ~ <10.2; 4.0 12.2
B-516-E 26.3 (<2.1) 20.5 (<1.5) Decrease 25.8 (1.1) ~ <10.2; 4.0 23.4
B-527-C 5.2 (<1.1) 7.4 (<2.5) Decrease 11.7 (1.3) ~ <10.2; 4.0 11.1
B-527-E 10.3 (<1.8) 12.2 (<2.2) Increase 11.4 (1.7) ~ <10.2; 4.0 11.3
UMich-1 31.0 (<1.8) 15.1 (<4.2) Decrease 23.0 (5.2) ~>(−17.8;
−7),
<17.8; 7
23.1
UMich-2 29.9 (<1.8) 16.0 (<3.1) Decrease 21.1 (4.6) ~>(−17.8;
−7),
<17.8; 7
23.0
UMich-3 30.2 (<1.3) 16.8 (<2.0) Decrease 21.7 (3.4) ~>(−17.8;
−7), <17.8;
7
23.5
Westingho
use
15.8 (<6.8) 13.0 (<3.0) Decrease N. A.
N. A.
14.4
AAD-2
SwRI
N. A.
0.0
IHI Ring 17.6 (<2.9) 19.5 (<1.8) Increase N. A. N. A. 18.6
Manoir
Ring
15.8 (<2.0) 13.7 (<2.0) Decrease N. A.
N. A.
14.8
It is likely that the XRF-calculated ferrite scatter in Figure 3(a) could be reduced if all of the elements
used to calculate ferrite from elemental data (see Table 3 footnote) could be measured. The missing
elements, which were not detectable with the XRF instrument available for this study, were Si, C, and N;
and these were assumed to be 1.0, 0.4, and 0.4, respectively, in Table 3 [7]. Nevertheless, XRF
instruments exist that can measure Si, which might provide a more precise calculation for ferrite, and may
reduce the uncertainty in the prediction of the percent columnar grains shown in Figure 3(a).
90
7
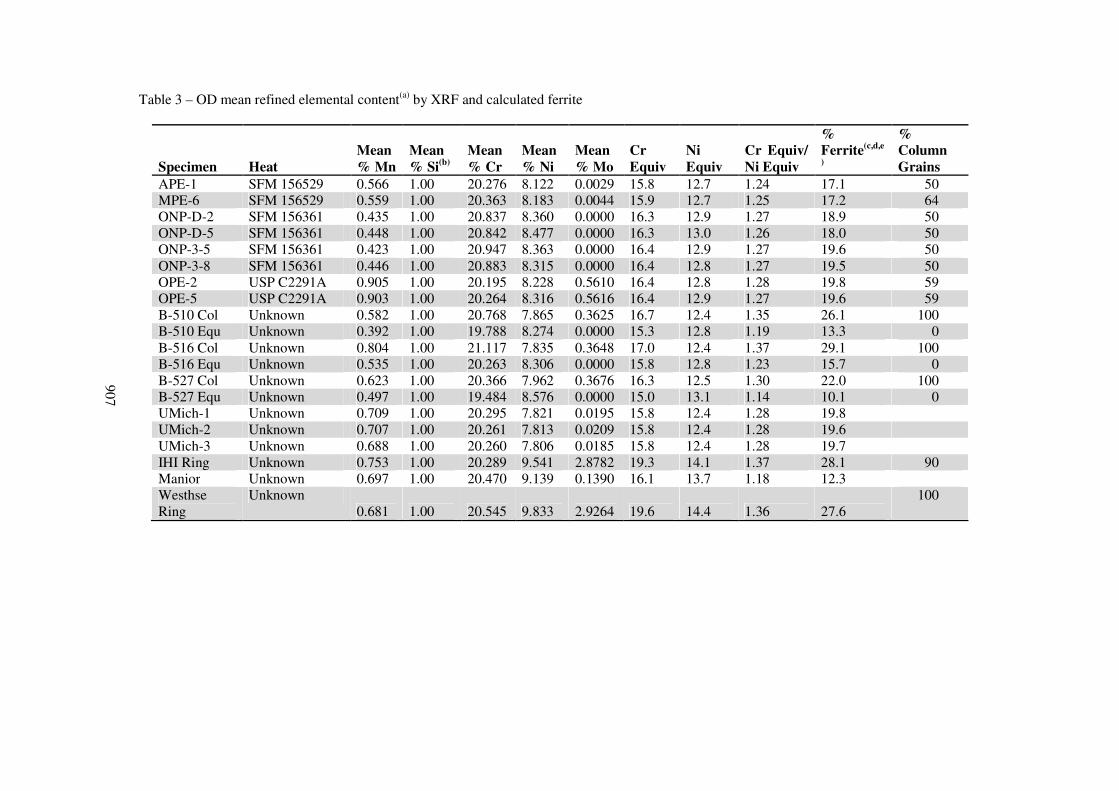
Table 3 – OD mean refined elemental content(a)
by XRF and calculated ferrite
Specimen Heat
Mean
% Mn
Mean
% Si(b)
Mean
% Cr
Mean
% Ni
Mean
% Mo
Cr
Equiv
Ni
Equiv
Cr Equiv/
Ni Equiv
%
Ferrite(c,d,e
)
%
Column
Grains
APE-1 SFM 156529 0.566 1.00 20.276 8.122 0.0029 15.8 12.7 1.24 17.1 50
MPE-6 SFM 156529 0.559 1.00 20.363 8.183 0.0044 15.9 12.7 1.25 17.2 64
ONP-D-2 SFM 156361 0.435 1.00 20.837 8.360 0.0000 16.3 12.9 1.27 18.9 50
ONP-D-5 SFM 156361 0.448 1.00 20.842 8.477 0.0000 16.3 13.0 1.26 18.0 50
ONP-3-5 SFM 156361 0.423 1.00 20.947 8.363 0.0000 16.4 12.9 1.27 19.6 50
ONP-3-8 SFM 156361 0.446 1.00 20.883 8.315 0.0000 16.4 12.8 1.27 19.5 50
OPE-2 USP C2291A 0.905 1.00 20.195 8.228 0.5610 16.4 12.8 1.28 19.8 59
OPE-5 USP C2291A 0.903 1.00 20.264 8.316 0.5616 16.4 12.9 1.27 19.6 59
B-510 Col Unknown 0.582 1.00 20.768 7.865 0.3625 16.7 12.4 1.35 26.1 100
B-510 Equ Unknown 0.392 1.00 19.788 8.274 0.0000 15.3 12.8 1.19 13.3 0
B-516 Col Unknown 0.804 1.00 21.117 7.835 0.3648 17.0 12.4 1.37 29.1 100
B-516 Equ Unknown 0.535 1.00 20.263 8.306 0.0000 15.8 12.8 1.23 15.7 0
B-527 Col Unknown 0.623 1.00 20.366 7.962 0.3676 16.3 12.5 1.30 22.0 100
B-527 Equ Unknown 0.497 1.00 19.484 8.576 0.0000 15.0 13.1 1.14 10.1 0
UMich-1 Unknown 0.709 1.00 20.295 7.821 0.0195 15.8 12.4 1.28 19.8
UMich-2 Unknown 0.707 1.00 20.261 7.813 0.0209 15.8 12.4 1.28 19.6
UMich-3 Unknown 0.688 1.00 20.260 7.806 0.0185 15.8 12.4 1.28 19.7
IHI Ring Unknown 0.753 1.00 20.289 9.541 2.8782 19.3 14.1 1.37 28.1 90
Manior Unknown 0.697 1.00 20.470 9.139 0.1390 16.1 13.7 1.18 12.3
Westhse
Ring
Unknown
0.681 1.00 20.545 9.833 2.9264 19.6 14.4 1.36 27.6
100
90
8
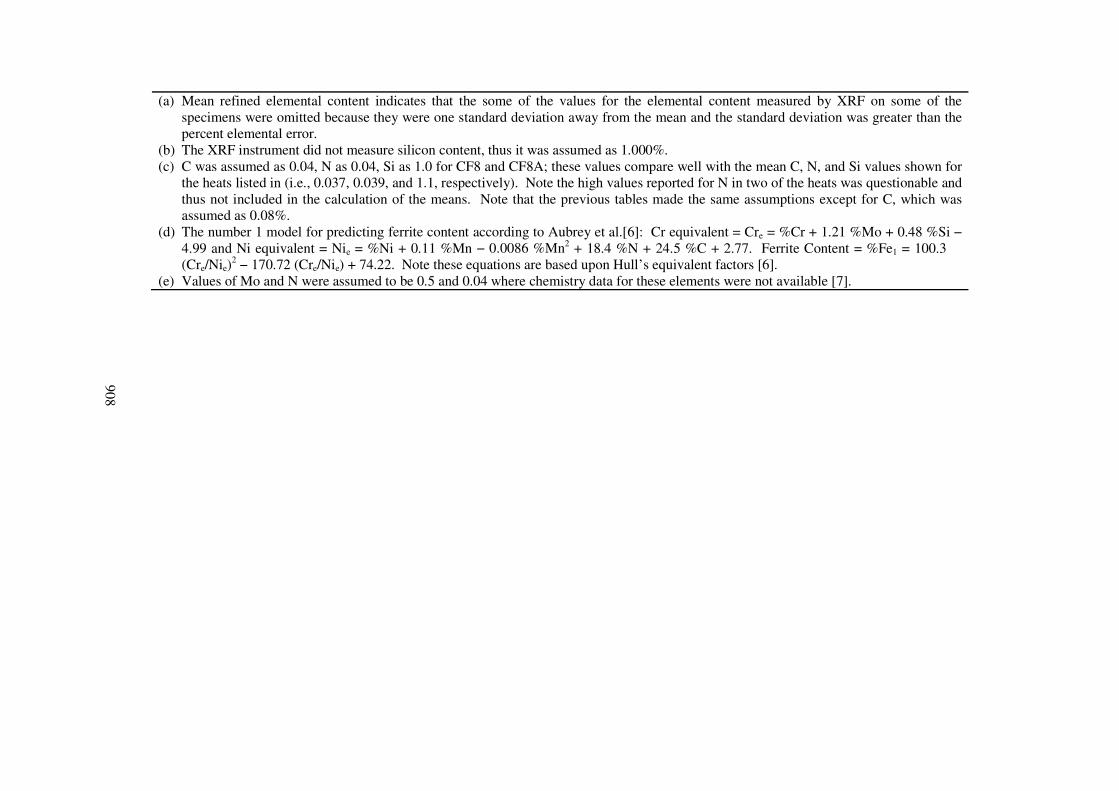
(a) Mean refined elemental content indicates that the some of the values for the elemental content measured by XRF on some of the
specimens were omitted because they were one standard deviation away from the mean and the standard deviation was greater than the
percent elemental error.
(b) The XRF instrument did not measure silicon content, thus it was assumed as 1.000%.
(c) C was assumed as 0.04, N as 0.04, Si as 1.0 for CF8 and CF8A; these values compare well with the mean C, N, and Si values shown for
the heats listed in (i.e., 0.037, 0.039, and 1.1, respectively). Note the high values reported for N in two of the heats was questionable and
thus not included in the calculation of the means. Note that the previous tables made the same assumptions except for C, which was
assumed as 0.08%.
(d) The number 1 model for predicting ferrite content according to Aubrey et al.[6]: Cr equivalent = Cre = %Cr + 1.21 %Mo + 0.48 %Si −
4.99 and Ni equivalent = Nie = %Ni + 0.11 %Mn − 0.0086 %Mn2 + 18.4 %N + 24.5 %C + 2.77. Ferrite Content = %Fe1 = 100.3 �
(Cre/Nie)2 − 170.72 (Cre/Nie) + 74.22. Note these equations are based upon Hull’s equivalent factors [6].
(e) Values of Mo and N were assumed to be 0.5 and 0.04 where chemistry data for these elements were not available [7].
909
Figure 3 – Mean (a) calculated and (b) measured ferrite concentrations on OD specimen surfaces are
plotted versus percent columnar grain concentration. The HAZ is excluded on the OD specimen surfaces
for the measured ferrite concentrations.
910
DISCUSSION
The results to date presented in Tables 2 and 3, along with the summary results plotted in Figure 3 indicate
that Feritscope-measured ferrite content is likely not a reliable indicator of grain structure (percent
columnar grains). The Feritscope-measured ferrite did not support Temple and Ogilvy’s [3] hypothesis
that low ferrite content would indicate columnar grains while high ferrite would indicate equiaxed grains.
In addition, the measured ferrite content showed no consistent trend OD to ID and thus did not support the
observations of Chopra and Sather [4] nor the rationale that slower cooling of the ID would result in lower
ferrite at the ID. A likely explanation for the lack of correlation between the measured ferrite levels and
the microstructure is that Feritscope-measured ferrite content is very sensitive to the heat of welding and is
likely sensitive to any post-casting thermal or mechanical processing. As a result, the measured ferrite
values, based on the data to date, are unlikely to be a reliable indicator of the conditions extant at the time
of solidification to reveal grain structure.
On the other hand, the data (Figure 3(a)) seem to indicate a correlation between the calculated ferrite
values (based on OD measurements of elemental composition) and the microstructure (percent columnar
grains). The indication that the higher the percent calculated ferrite, the more likely the existence of
columnar grains seems counterintuitive in that ferrite content is usually associated with equiaxed grains
[3]. Nevertheless, it is reasonable that the elemental content at the OD is a measure of the elemental
content of the metal as it initially solidifies and reflects the actual initial casting conditions. The rationale
that the OD elemental content of CCSS pipe would reflect the as-cast grain structure is supported by the
ASM Handbook [8, p. 298], “The as-cast structures obtained in horizontal centrifugal casting of steels
vary according to composition.” Since the initial solidification has a major effect on the grain structure of
the CCSS pipe, the correlation shown in Figure 3(a) is logical. Also, other elements are important in the
solidification grain structure of CASS including Si, and it is reasonable that quantifying more of the
pertinent elements would provide a more precise correlation.
Further, the correlation between OD elemental content and grain structure could likely be more
precise if more elements were measured. Note that the model for the calculation of ferrite from elemental
composition shown in Eqs. (1)–(3) indicates that the ferrite content is affected by the presence and
interaction of a number of elements, and the most accurate determination of ferrite requires quantification
of all of the pertinent elements. Also, the correlations in this study are based upon a small statistical
sampling of CCSS heats and only four of the seven pertinent elements; thus, the examination of more
heats and more elements are required to firmly establish the correlation with calculated percent ferrite as
determined by XRF analysis.
The proposed criterion for quantifying the volume percent of anisotropic columnar grains in CASS
specimens does not necessarily relate to the effects of beam skewing and splitting, or attenuation due to
scattering of ultrasonic waves at the grain boundaries that adversely affect the detection of flaws. The
development of an algorithm to quantitatively relate the acoustic effects to grain structure is needed.
CONCLUSIONS
A series of measurements of ferrite content, as well as calculated values of ferrite based on elemental
composition measurements using XRF, were made to determine if a correlation between ferrite content
and grain structure could be established. Measurements were made on CASS pipe specimens (primarily
CCSS) available at PNNL and for which grain structure information was available in the form of
macrographs. Based on the analysis of measurements to date, a correlation was observed between grain
structure, as defined by percent columnar grains, and ferrite percent as calculated from XRF
measurements on the outer surface of the CCSS pipe. However, there was no apparent correlation between
Feritscope-measured ferrite levels and grain structure. This is likely due to the measurement of ferrite by
the Feritscope being too sensitive to post-casting thermal (including welding) and mechanical processes to
be a reliable indicator of grain structure solidification.
911
REFERENCES
[1] Ruud, C O, Diaz, A A, and Anderson, M T, Grain Structure Identification and Casting Parameters
of Austenitic Stainless Steel (CASS) Piping, PNNL-19002, Richland, Washington: Pacific Northwest
National Laboratory; 2009. ADAMS Accession No. ML100252084.
[2] Ramuhalli, P, Meyer, R M, Cinson, A D, Moran, T L, Prowant, M S, Watson, B E, Mathews, R,
Harris Jr., R V, Diaz, A A, and Anderson, M T, "In-situ Characterization of Cast Stainless Steel
Microstructures," 9th International Conference on NDE in Relation to Structural Integrity for
Nuclear and Pressurized Components, Bellevue, Washington, 2012.
[3] Temple, J A G, and Ogilvy, J A, Propagation of Ultrasonic Elastic Waves in Centrifugally Cast
Austenitic Steel, AEA-RS-4223, Risley, United Kingdom: AEA Reactor Services; 1992.
[4] Chopra, O K, and Sather, A, Initial Assessment of the Mechanisms and Significance of Low-
Temperature Embrittlement of Cast Stainless Steels in LWR Systems, NUREG/CR-5385, ANL-
89/17, Washington, D.C.: U.S. Nuclear Regulatory Commission; 1990.
[5] Bates, D J, Doctor, S R, Heasler, P G, and Burck, E, Stainless Steel Round Robin Test: Centrifugally
Cast Stainless Steel Screening Phase, NUREG/CR-4970, PNL-6266, PISC III Report No. 3,
Washington, D.C.: U.S. Nuclear Regulatory Commission; 1987.
[6] Aubrey, L S, Wieser, P F, Pollard, W J, and Schoefer, E A, 1982, "Ferrite Measurement and Control
in Cast Duplex Stainless Steels," Stainless Steel Castings, ASTM STP 756, American Society for
Testing Materials, West Conshohocken, Pennsylvania.
[7] EPRI, Application of Electromagnetic Acoustic Transducers to Coarse-Grained Material, EPRI NP-
7438, Palo Alto, California: Electric Power Research Institute; 1991.
[8] ASM, ASM Handbook, Volume 15: Casting, Materials Park, Ohio, ASM International, 1992.