Embed Size (px)
Citation preview
FDS REPORTING STRATEGIES TO IMPROVE PHAS MASS/FASS SCORES
CASTERLINE ASSOCIATE’S ADVANCED PHA BUDGETING, ACCOUNTING & FINANCIAL REPORTING….
1Copyright Casterline Associates 2011
Casterline Associates PCwww.casterline.net(800) 337-5088
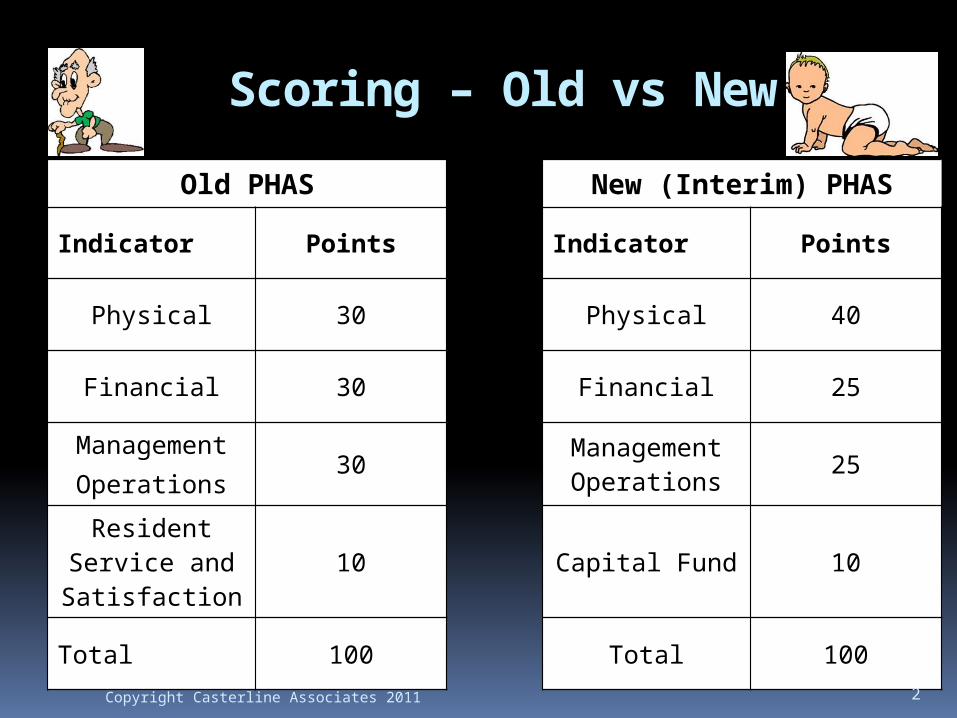
Scoring – Old vs New
Old PHAS New (Interim) PHAS
Indicator Points Indicator Points
Physical 30 Physical 40
Financial 30 Financial 25
ManagementOperations
30Management Operations 25
Resident Service and Satisfaction
10 Capital Fund 10
Total 100 Total 100
2Copyright Casterline Associates 2011

SCORING METHODOLOGY
3Copyright Casterline Associates 2011
Scoring Issues
The physical, financial, and management operations scores are based on a unit-weighted average of the scores for each AMP.
The Capital Fund score is based on all AMPS combined.
4Copyright Casterline Associates 2011
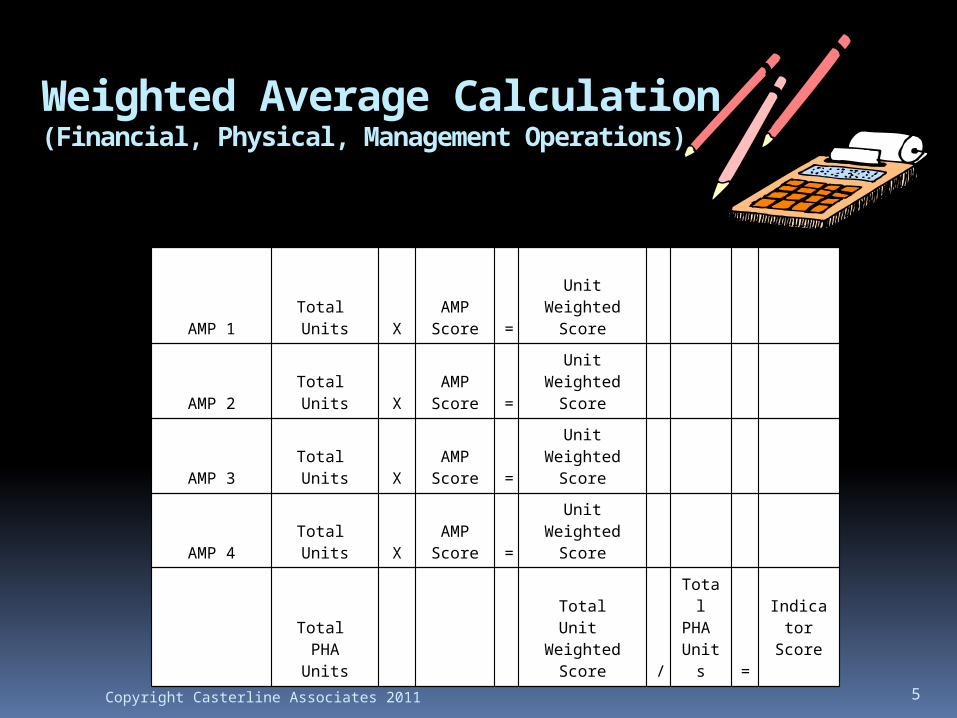
Weighted Average Calculation(Financial, Physical, Management Operations)
AMP 1Total Units X
AMPScore =
UnitWeighted
Score
AMP 2Total Units X
AMPScore =
UnitWeighted
Score
AMP 3Total Units X
AMPScore =
UnitWeighted
Score
AMP 4Total Units X
AMPScore =
UnitWeighted
Score
Total PHAUnits
TotalUnit
WeightedScore /
Total PHA Units =
Indicator
Score
5Copyright Casterline Associates 2011
6
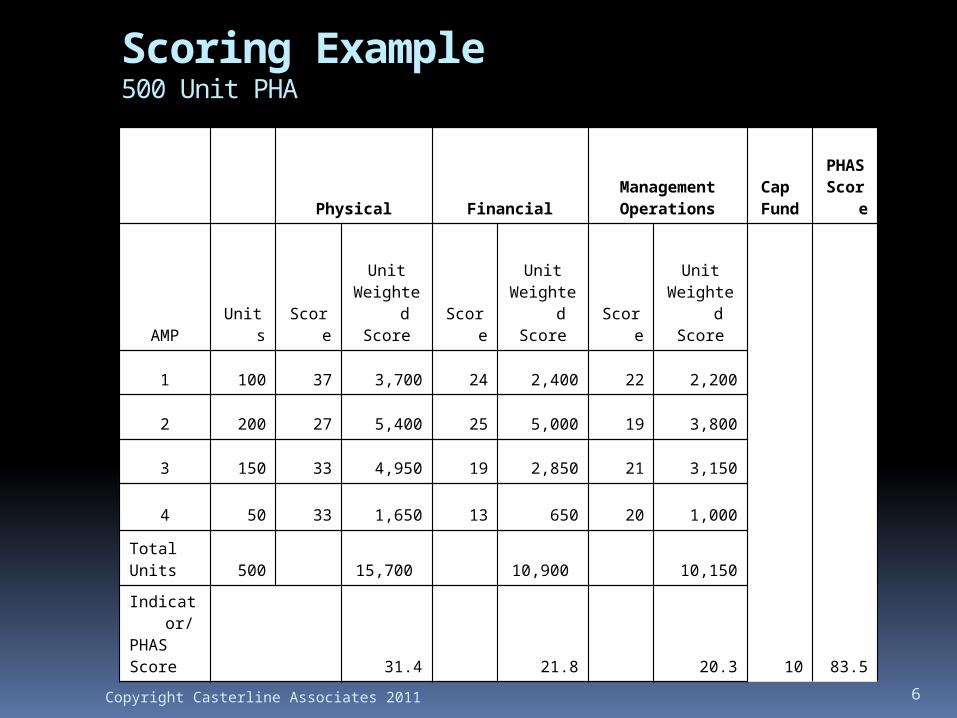
Scoring Example500 Unit PHA
Physical FinancialManagementOperations
Cap Fund
PHAS
Score
AMP Units Score
UnitWeighte
dScore Score
UnitWeighte
dScore Score
UnitWeighte
dScore
10
83.5
1 100 37 3,700 24 2,400 22 2,200
2 200 27 5,400 25 5,000 19 3,800
3 150 33 4,950 19 2,850 21 3,150
4 50 33 1,650 13 650 20 1,000
TotalUnits 500 15,700 10,900 10,150
Indicator/
PHAS Score
31.4 21.8 20.3
Copyright Casterline Associates 2011
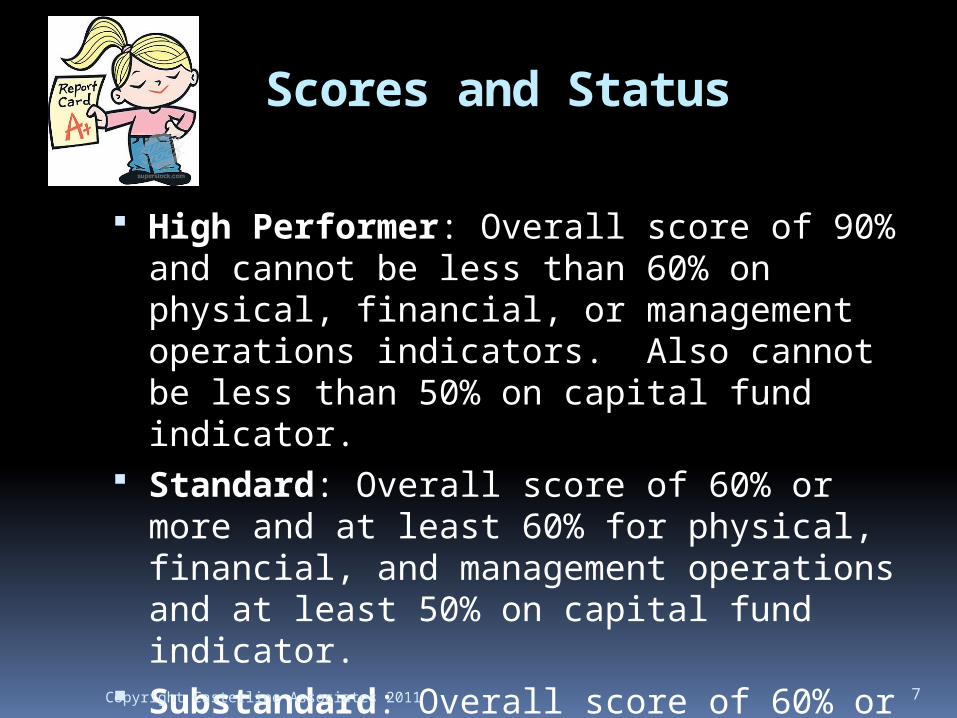
Scores and Status
High Performer: Overall score of 90% and cannot be less than 60% on physical, financial, or management operations indicators. Also cannot be less than 50% on capital fund indicator.
Standard: Overall score of 60% or more and at least 60% for physical, financial, and management operations and at least 50% on capital fund indicator.
Substandard: Overall score of 60% or more and a score of less than 60% under physical or financial or management operations.
7Copyright Casterline Associates 2011
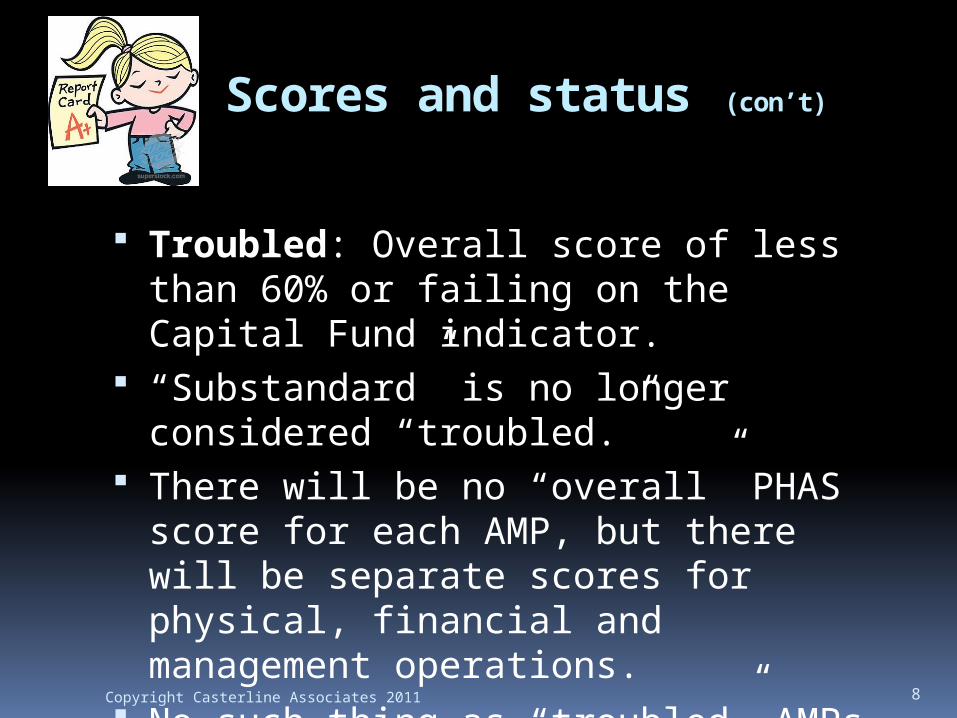
Scores and status (con’t)
Troubled: Overall score of less than 60% or failing on the Capital Fund indicator.
“Substandard” is no longer considered “troubled.”
There will be no “overall” PHAS score for each AMP, but there will be separate scores for physical, financial and management operations.
No such thing as “troubled” AMPs.8Copyright Casterline Associates 2011
PHAS Financial Indicators - (1) Quick Ratio (QR). The QR compares
quick assets to current liabilities. Quick assets are cash and assets that are easily convertible to cash and do not include inventory. Current liabilities are those liabilities that are due within the next 12 months. A QR of less than one indicates that the AMP’s ability to make payments on a timely basis may be at risk.
9Copyright Casterline Associates 2011
PHAS Financial Indicators - (2) Months Expendable Net Assets Ratio
(MENAR). The MENAR measures a AMP’s ability to operate using its net available, unrestricted resources without relying on additional funding. In particular, this ratio compares the net available unrestricted resources to the average monthly operating expenses. The result of this calculation shows how many months of operating expenses can be covered with currently available, unrestricted resources.
10Copyright Casterline Associates 2011
PHAS Financial Indicators -
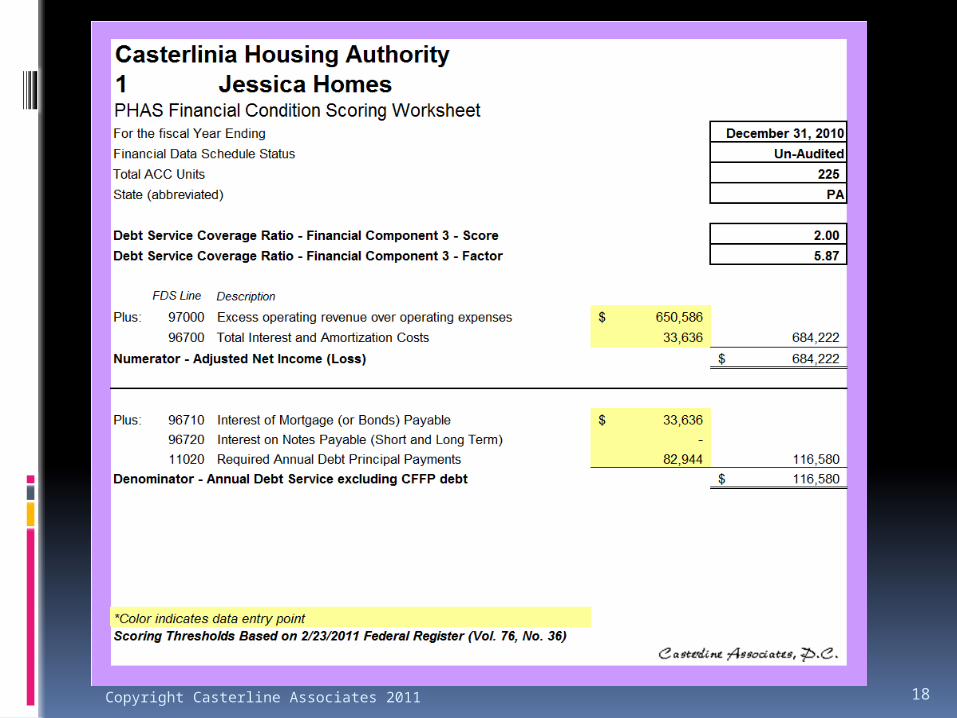
(3) Debt Service Coverage Ratio (DSCR). The DSCR is a measure of net operating income available to make debt payments to the amount of the debt payments. This sub indicator is used if the PHA has taken on long-term obligations. A DSCR of less than one would indicate that the AMP would have difficulty generating sufficient cash flow to cover both its expenses and its debt obligations. 11Copyright Casterline Associates 2011
Example – financial indicators Shown on the next page is an
example for the Casterlinia Housing Authority’s “Jessica Village” (AMP 1)
In the example shown, Jessica Village has four times as much in Quick Assets as Current Liabilities (“Quick Ratio” - line c) , and could survive for six months without any additional income (“Months Expendable Net Assets Ratio” - line g).
12Copyright Casterline Associates 2011
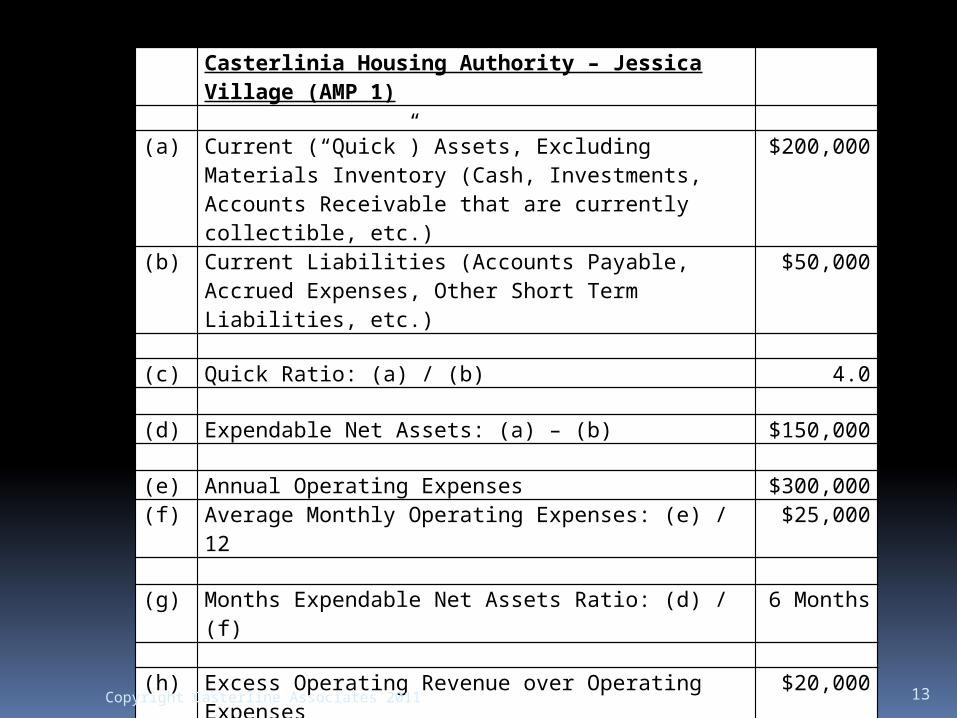
Casterlinia Housing Authority – Jessica Village (AMP 1)
(a) Current (“Quick”) Assets, Excluding Materials Inventory (Cash, Investments, Accounts Receivable that are currently collectible, etc.)
$200,000
(b) Current Liabilities (Accounts Payable, Accrued Expenses, Other Short Term Liabilities, etc.)
$50,000
(c) Quick Ratio: (a) / (b) 4.0
(d) Expendable Net Assets: (a) – (b) $150,000
(e) Annual Operating Expenses $300,000(f) Average Monthly Operating Expenses: (e) / 12 $25,000
(g) Months Expendable Net Assets Ratio: (d) / (f) 6 Months
(h) Excess Operating Revenue over Operating Expenses
$20,000
(i) Debt Service (Principal and Interest) $10,000
(j) Debt Service Coverage (h) / (i) 2.0 times
13Copyright Casterline Associates 2011
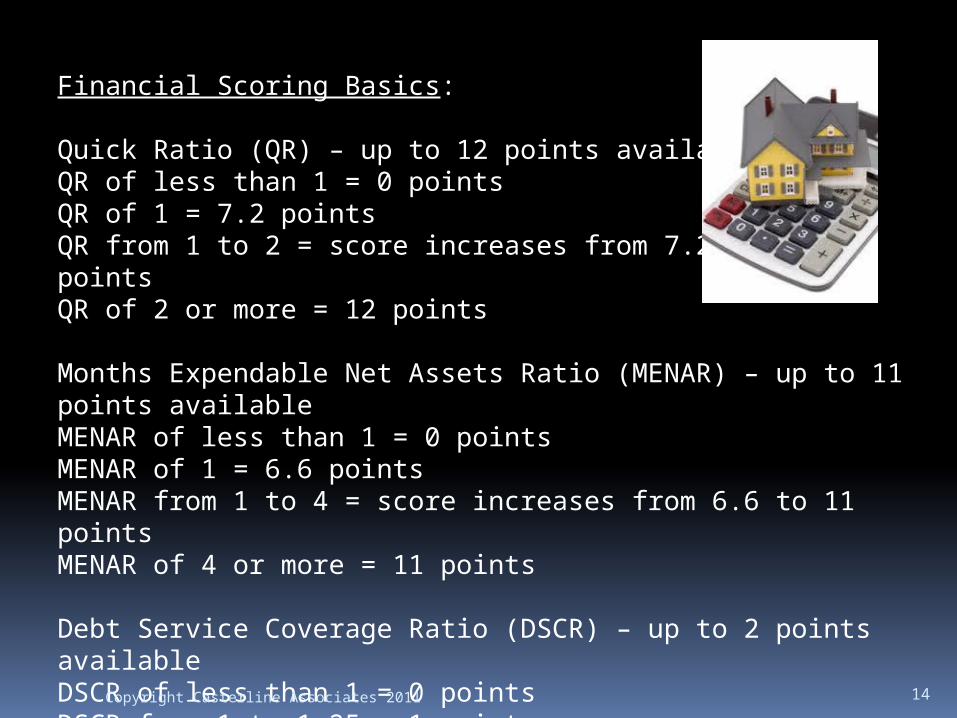
Financial Scoring Basics:
Quick Ratio (QR) – up to 12 points availableQR of less than 1 = 0 pointsQR of 1 = 7.2 pointsQR from 1 to 2 = score increases from 7.2 up to 12 pointsQR of 2 or more = 12 points
Months Expendable Net Assets Ratio (MENAR) – up to 11 points availableMENAR of less than 1 = 0 pointsMENAR of 1 = 6.6 pointsMENAR from 1 to 4 = score increases from 6.6 to 11 pointsMENAR of 4 or more = 11 points
Debt Service Coverage Ratio (DSCR) – up to 2 points availableDSCR of less than 1 = 0 pointsDSCR from 1 to 1.25 = 1 pointDSCR of 1.25 or more = 2 pointsNo Debt Service = 2 points 14Copyright Casterline Associates 2011
15Copyright Casterline Associates 2011
16Copyright Casterline Associates 2011
17Copyright Casterline Associates 2011
18Copyright Casterline Associates 2011
Ideas to Maximize Scores:Financial Indicators
As we have learned, the FASS and MASS scores are determined by how things are reported on the Authority’s Financial Data Schedule (FDS). This segment of the workshop will discuss ideas to improve scores on financial indicators including:
Quick Ratio (QR) Months Expendable Net Assets Ratio
(MENAR)
19Copyright Casterline Associates 2011
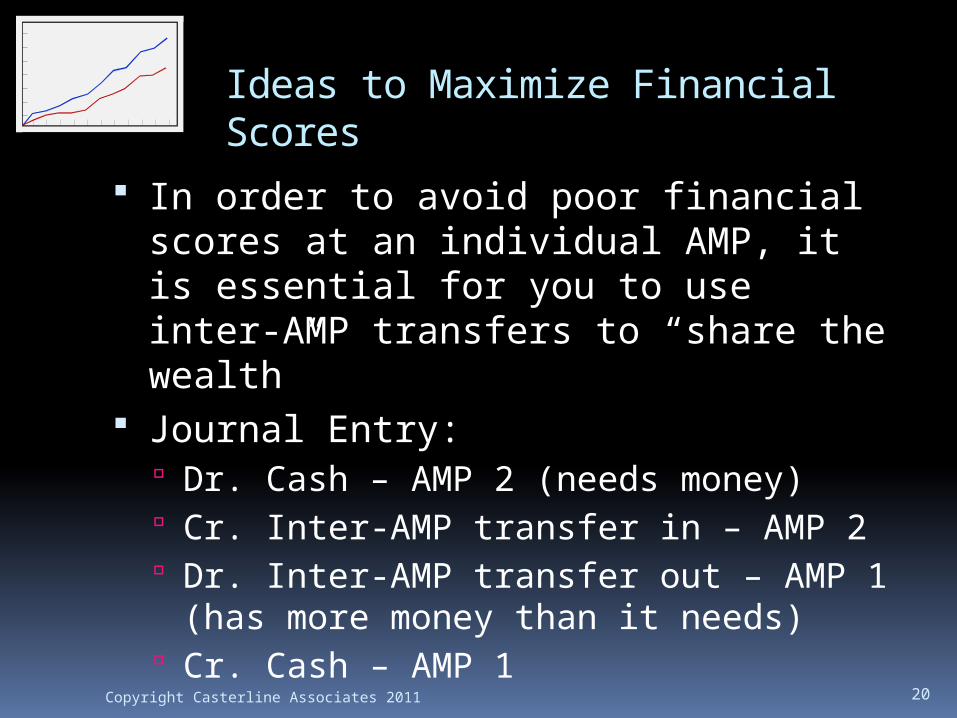
Ideas to Maximize Financial Scores
In order to avoid poor financial scores at an individual AMP, it is essential for you to use inter-AMP transfers to “share the wealth”
Journal Entry: Dr. Cash – AMP 2 (needs money) Cr. Inter-AMP transfer in – AMP 2 Dr. Inter-AMP transfer out – AMP 1 (has
more money than it needs) Cr. Cash – AMP 1
20Copyright Casterline Associates 2011
Applicable FDS Lines (Reference: REAC Interim Financial Data
Schedule Definition Guide)
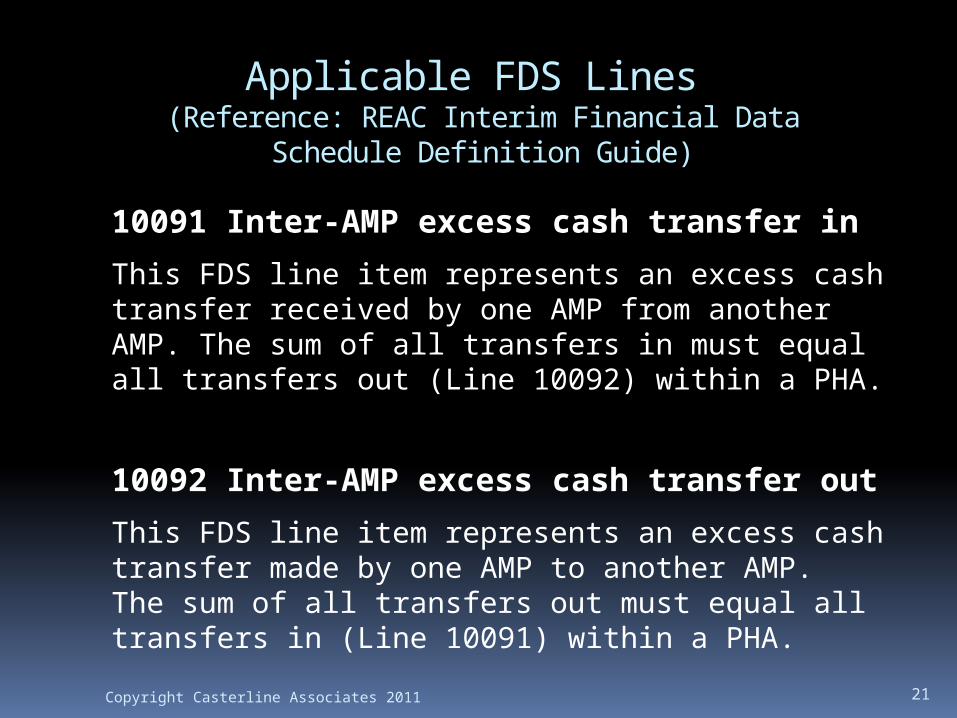
10091 Inter-AMP excess cash transfer in
This FDS line item represents an excess cash transfer received by one AMP from another AMP. The sum of all transfers in must equal all transfers out (Line 10092) within a PHA.
10092 Inter-AMP excess cash transfer out
This FDS line item represents an excess cash transfer made by one AMP to another AMP. The sum of all transfers out must equal all transfers in (Line 10091) within a PHA.
21Copyright Casterline Associates 2011
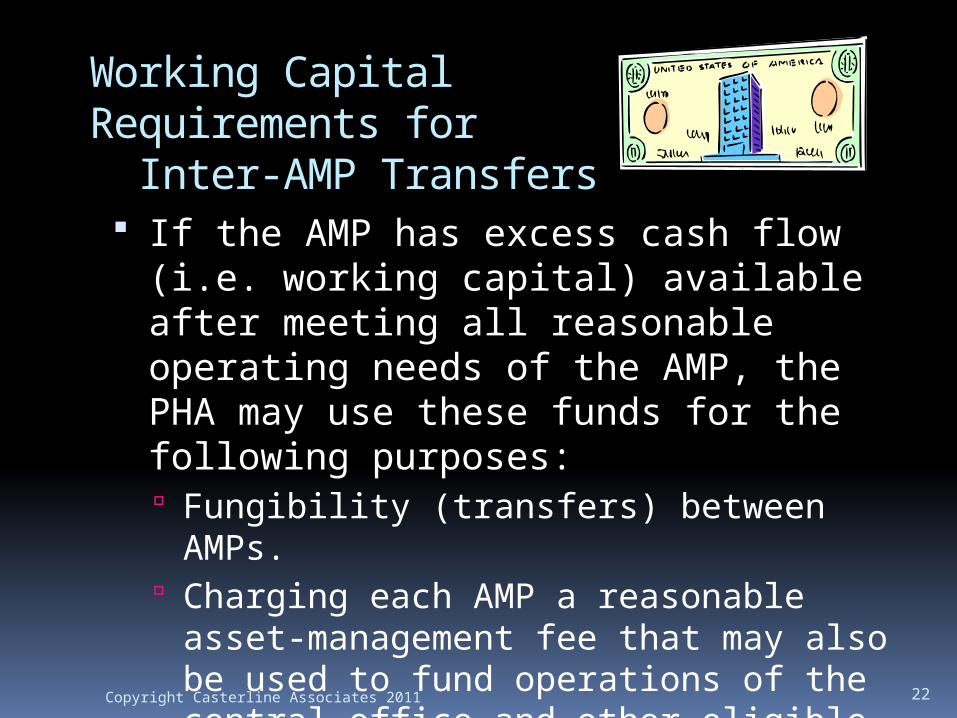
Working Capital Requirements for Inter-AMP Transfers If the AMP has excess cash flow (i.e.
working capital) available after meeting all reasonable operating needs of the AMP, the PHA may use these funds for the following purposes: Fungibility (transfers) between AMPs. Charging each AMP a reasonable asset-
management fee that may also be used to fund operations of the central office and other eligible purposes.
Other eligible purposes. 22Copyright Casterline Associates 2011
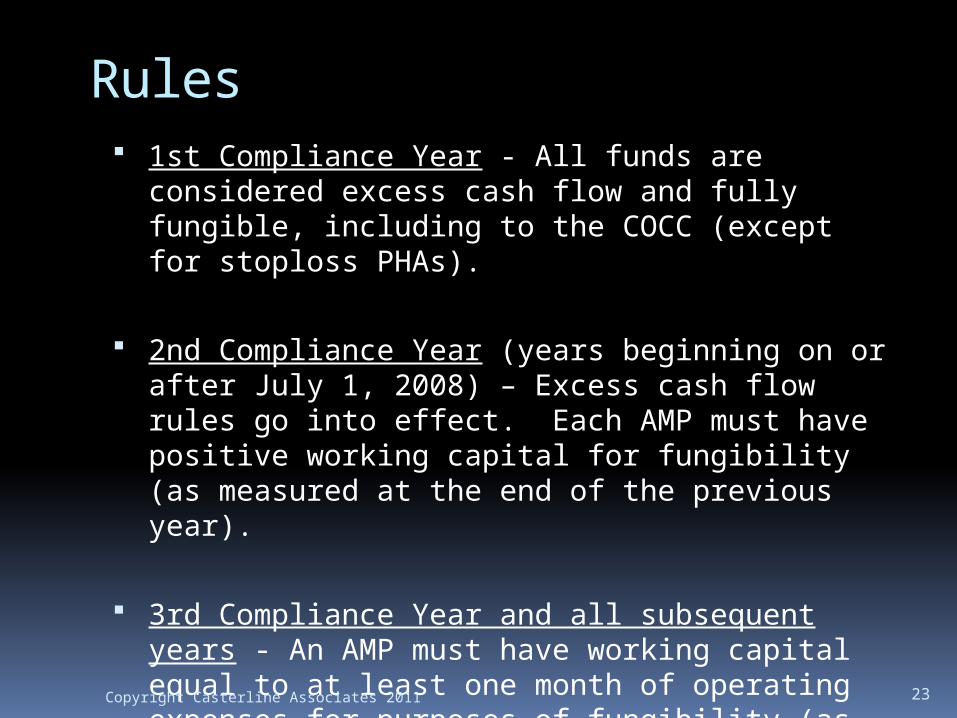
Rules 1st Compliance Year - All funds are considered
excess cash flow and fully fungible, including to the COCC (except for stoploss PHAs).
2nd Compliance Year (years beginning on or after July 1, 2008) – Excess cash flow rules go into effect. Each AMP must have positive working capital for fungibility (as measured at the end of the previous year).
3rd Compliance Year and all subsequent years - An AMP must have working capital equal to at least one month of operating expenses for purposes of fungibility (as measured at the end of the previous year). 23Copyright Casterline Associates 2011
Calculation of Excess Cash Flow
The “Balance Sheet” ApproachThis is similar in concept to “surplus cash” in FHA Multifamily Housing. Owners are compensated out of surplus cash. Once the PHA has reported their first AMP-based submission, the balance sheet will be used to calculate the amount of excess cash available. The excess cash (working capital) determined at the end of the year may be transferred, or Asset Management fees paid, in the following year. Balance Sheet balances included are:
24Copyright Casterline Associates 2011
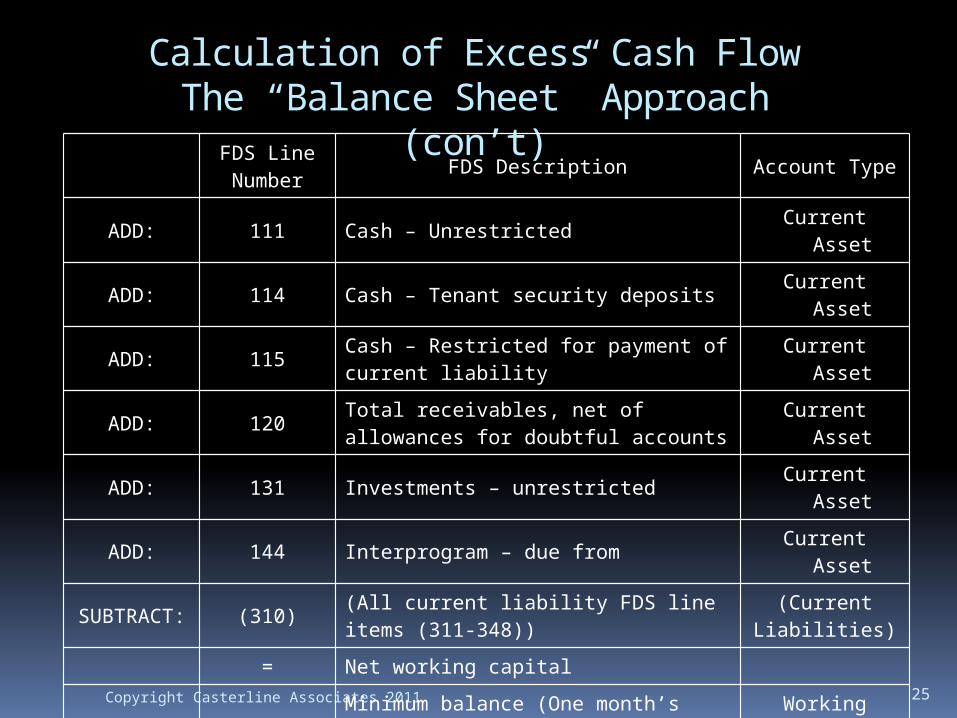
Calculation of Excess Cash FlowThe “Balance Sheet” Approach
(con’t)
25Copyright Casterline Associates 2011
FDS Line Number FDS Description Account Type
ADD: 111 Cash – Unrestricted Current Asset
ADD: 114 Cash – Tenant security deposits Current Asset
ADD: 115 Cash – Restricted for payment of current liability Current Asset
ADD: 120 Total receivables, net of allowances for doubtful accounts Current Asset
ADD: 131 Investments – unrestricted Current Asset
ADD: 144 Interprogram – due from Current Asset
SUBTRACT: (310) (All current liability FDS line items (311-348))
(Current Liabilities)
= Net working capital
MINUS:Minimum balance (One month’s worth of operating expenses) – FDS Line 96900/12 months
Working Capital
Minimum
= Excess working capital, also known as excess cash flow

Example – AMP A:
26Copyright Casterline Associates 2011
Cash $5,000
Accounts receivable 20,000
Investments 100,000
Accounts payable (35,000)
Net working capital 90,000
Less: One month’s operating expenses (50,000
)
Excess cash flow $40,000
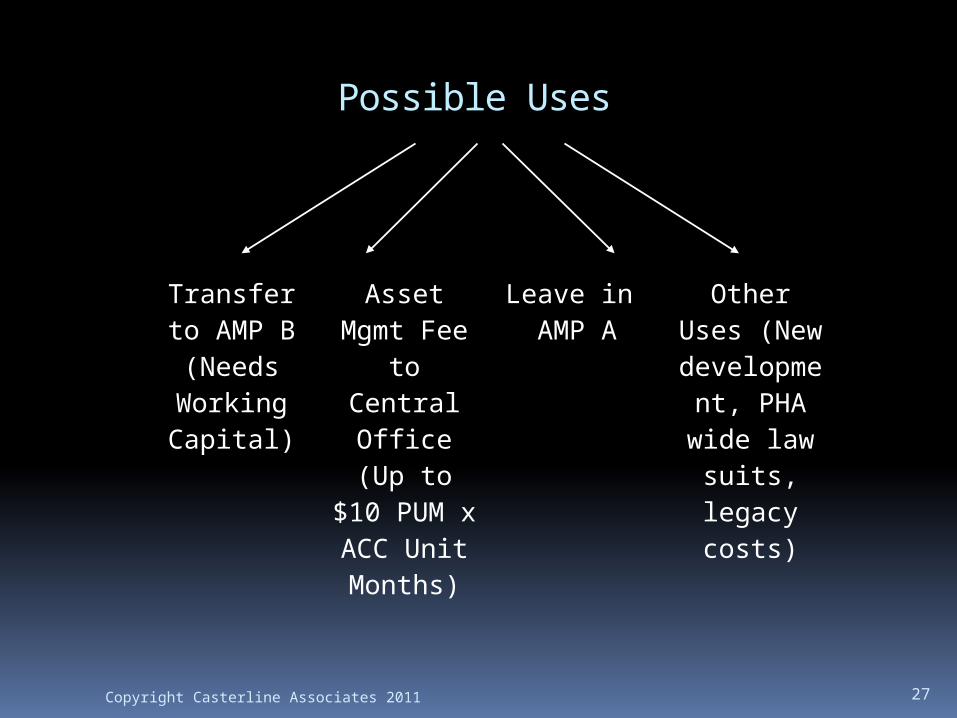
Possible Uses
27Copyright Casterline Associates 2011
Transfer to AMP B(Needs Working Capital)
Asset Mgmt Fee to Central Office (Up
to $10 PUM x ACC Unit
Months)
Leave in AMP A
Other Uses (New
development, PHA
wide law suits, legacy costs)
Ideas to Maximize Financial Scores
These inter-AMP transfers are especially important for PHAs that are currently high performers and would like to stay that way.
You need to keep each AMP at least reasonably financially healthy and fungilibity between AMPs may be the key!
28Copyright Casterline Associates 2011
Ideas to Maximize Financial Scores
Make sure if you have restricted cash or investments that it is classified properly. Showing cash/investments as restricted means that you do not get credit for those funds in your PHAS score. But note that if the restricted cash/investments has an offsetting or related current liability, you may show it as one of the following: FDS 115 – Cash restricted for payment of
current liability FDS 135 – Investments restricted for
payment of current liability
29Copyright Casterline Associates 2011
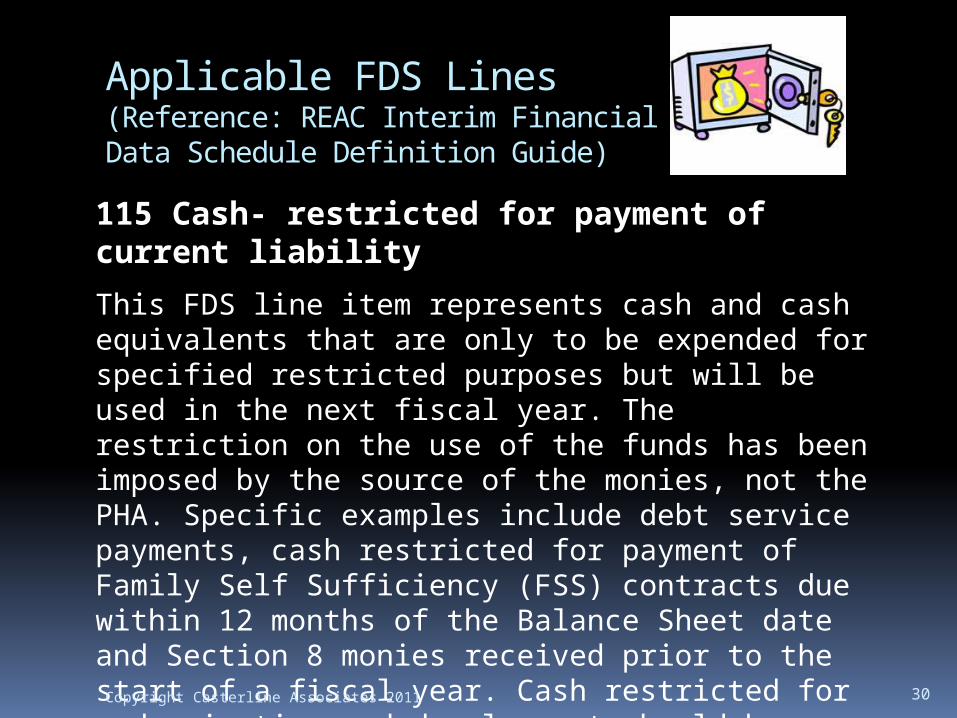
Applicable FDS Lines (Reference: REAC Interim Financial Data Schedule Definition Guide)
115 Cash- restricted for payment of current liability
This FDS line item represents cash and cash equivalents that are only to be expended for specified restricted purposes but will be used in the next fiscal year. The restriction on the use of the funds has been imposed by the source of the monies, not the PHA. Specific examples include debt service payments, cash restricted for payment of Family Self Sufficiency (FSS) contracts due within 12 months of the Balance Sheet date and Section 8 monies received prior to the start of a fiscal year. Cash restricted for modernization and development should be reported in line 112. 30Copyright Casterline Associates 2011
Applicable FDS Lines (Reference: REAC Interim Financial Data Schedule Definition Guide)
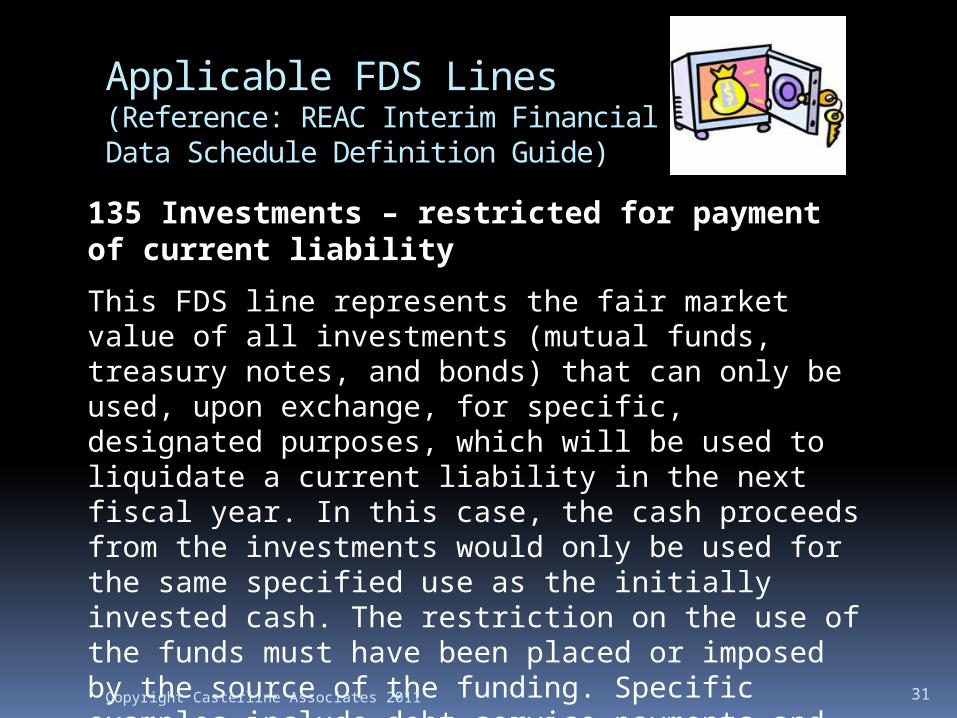
135 Investments – restricted for payment of current liability
This FDS line represents the fair market value of all investments (mutual funds, treasury notes, and bonds) that can only be used, upon exchange, for specific, designated purposes, which will be used to liquidate a current liability in the next fiscal year. In this case, the cash proceeds from the investments would only be used for the same specified use as the initially invested cash. The restriction on the use of the funds must have been placed or imposed by the source of the funding. Specific examples include debt service payments and Section 8 monies received prior to the start of a fiscal year. Investments restricted for modernization and development should be reported in line 132.
31Copyright Casterline Associates 2011
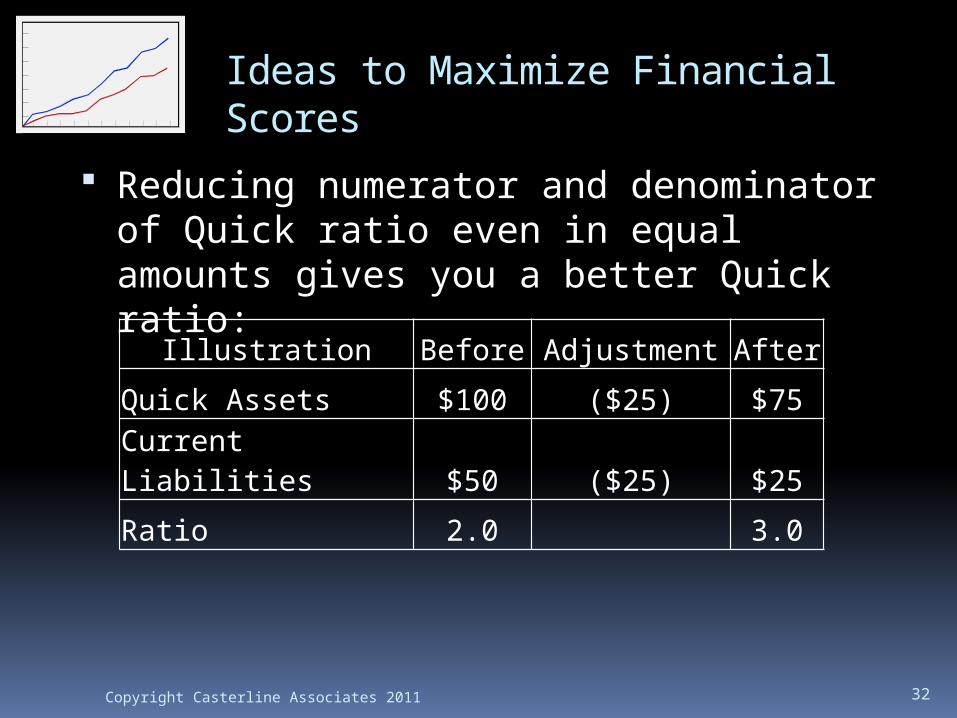
Ideas to Maximize Financial Scores
Reducing numerator and denominator of Quick ratio even in equal amounts gives you a better Quick ratio:
32Copyright Casterline Associates 2011
Illustration Before Adjustment After
Quick Assets $100 ($25) $75
Current Liabilities $50 ($25) $25
Ratio 2.0 3.0
How to do this…
Pay off liabilities before year end Accounts Payable (will also help A/P ratio) Accrued Expenses
Settle interfund payables before year end or merge interfunds with cash (as required)
Others?
33Copyright Casterline Associates 2011
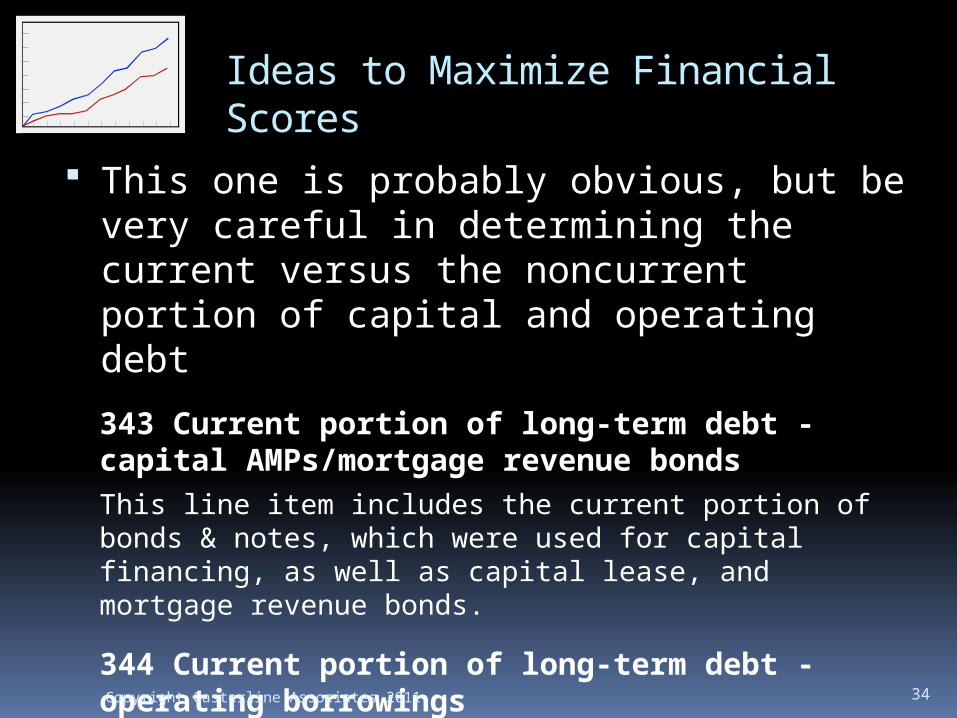
This one is probably obvious, but be very careful in determining the current versus the noncurrent portion of capital and operating debt
343 Current portion of long-term debt - capital AMPs/mortgage revenue bondsThis line item includes the current portion of bonds & notes, which were used for capital financing, as well as capital lease, and mortgage revenue bonds.
344 Current portion of long-term debt - operating borrowingsThis FDS line represents the current portion of long-term debt related to the PHA's normal operating expenses (non - capital AMPs).
34Copyright Casterline Associates 2011
Ideas to Maximize Financial Scores
345 Other current liabilitiesThis FDS line represents any current liability not specifically listed above. This line represents items such as earnest money, good faith deposits by contractors and bond purchasers, deposits on blue prints, liability or liabilities related to Family Self Sufficiency (FSS) contracts due within 12 months of the Balance Sheet date, etc. Tenant security deposits are not included since they are posted to FDS line 341. This line also represents any other current liabilities of the PHA not categorized in any of the lines above. This line item may also include FASB 5 current liabilities.
351 Long-term debt, net of current-capital AMPs/mortgage revenue bondsThis line item includes the long-term portion of bonds and notes, which were used for capital financing, as well as capital leases and mortgage revenue bonds.
35Copyright Casterline Associates 2011
Ideas to Maximize Financial Scores
352 Long-term debt, net of current-operating borrowingsThis FDS line represents the non-current portion of long-term notes issued for current operating expenses.
353 Non-current liabilities - otherThis FDS line may represent collections from homebuyers; mortgagors or MH homeowners for specified purposes such as the homebuyers’ earned home payments account, maintenance reserve, or taxes and insurance. It also may include the income derived from the investment of any of these funds. These amounts are payable upon the delivery of maintenance services, the submission of tax and insurance bills, or the purchase or acquisition of a dwelling. However, note that other Non-current liabilities not identified in other FDS lines may be included. This line also includes the liability or liabilities related to Family Self Sufficiency (FSS) contracts due more than 12 months after the fiscal year end.
36Copyright Casterline Associates 2011
Ideas to Maximize Financial Scores
Ideas to Maximize Financial Scores
Hoarding too much cash in COCC, or charging AMPs aggressively to balance the COCC, can cause the PHAS financial scores to decline.
Consider the health of other programs vs Public Housing – remember that scoring is no longer entity wide, it is on Public Housing only.
Principles on maximizing the former Current Ratio & Months Expendable Fund Balance still apply (maximize current assets, minimize current liabilities, control expenses) – these two indicators are still there, just under a different name.
37Copyright Casterline Associates 2011
Ideas to Maximize Financial Scores
Debt Service Coverage Ratio Energy Performance Contracting (EPC) Capital Fund Financing Program (CFFP)
Make sure you are reporting CFFP activity in the correct column (see Reporting brief #5)
38Copyright Casterline Associates 2011
PHAS Management Indicators -
(1) Occupancy. This subindicator measures the occupancy for the AMP’s fiscal year, adjust for allowable vacancies.
(2) Tenant accounts receivable. This subindicator measures the tenant accounts receivable of an AMP against the tenant charges for the AMP’s fiscal year.
39Copyright Casterline Associates 2011
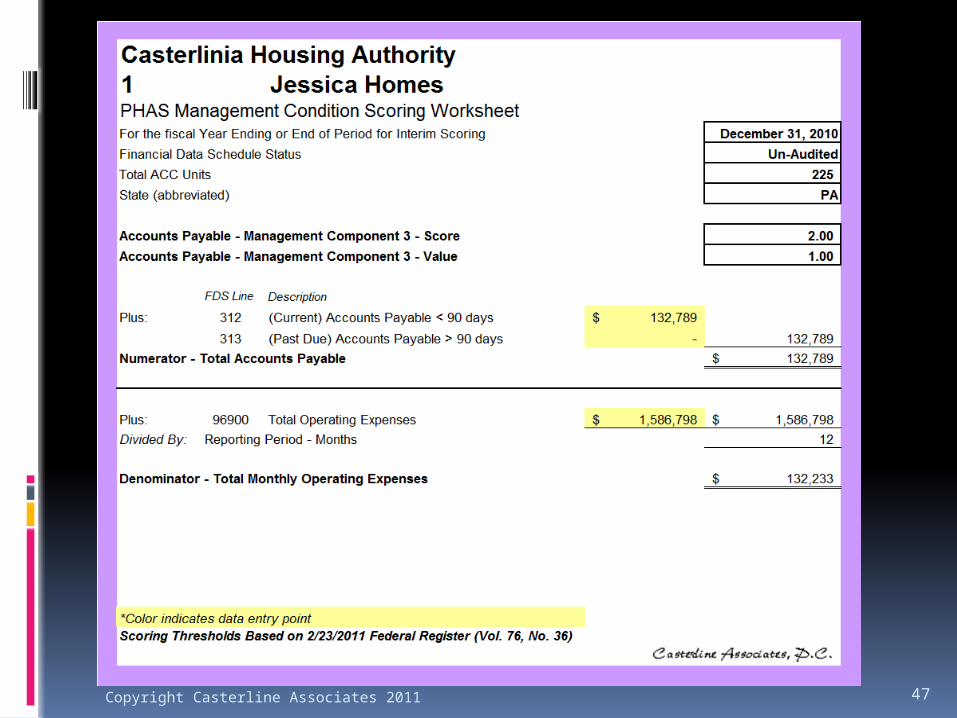
PHAS Management Indicators - (3) Accounts payable. This subindicator
measures the money that an AMP owes to the vendors at the end of the AMP’s fiscal year for products and services purchased on credit against total operating expenses.
40Copyright Casterline Associates 2011
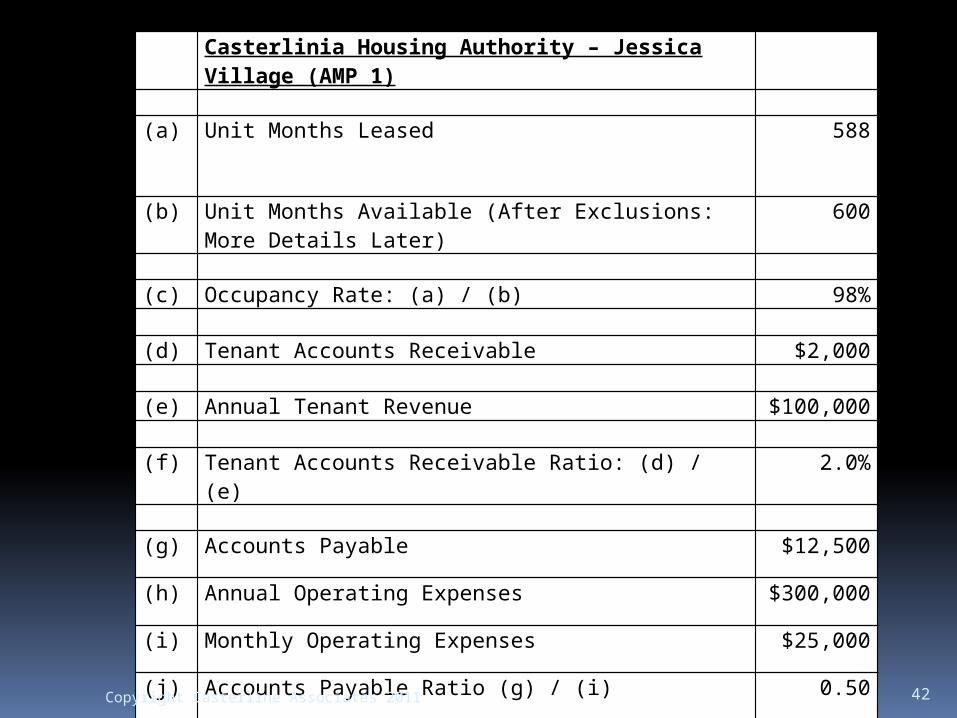
Example – management indicators
Shown on the next page is an example for the Casterlinia Housing Authority’s “Jessica Village” (AMP 1)
In the example shown, Jessica Village has an Occupancy rate of 98%, an Accounts receivable rate of 2%, and an Accounts payable ratio of 0.50.
41Copyright Casterline Associates 2011
Casterlinia Housing Authority – Jessica Village (AMP 1)
(a) Unit Months Leased 588
(b) Unit Months Available (After Exclusions: More Details Later)
600
(c) Occupancy Rate: (a) / (b) 98%
(d) Tenant Accounts Receivable $2,000
(e) Annual Tenant Revenue $100,000
(f) Tenant Accounts Receivable Ratio: (d) / (e) 2.0%
(g) Accounts Payable $12,500
(h) Annual Operating Expenses $300,000
(i) Monthly Operating Expenses $25,000
(j) Accounts Payable Ratio (g) / (i) 0.50
42Copyright Casterline Associates 2011
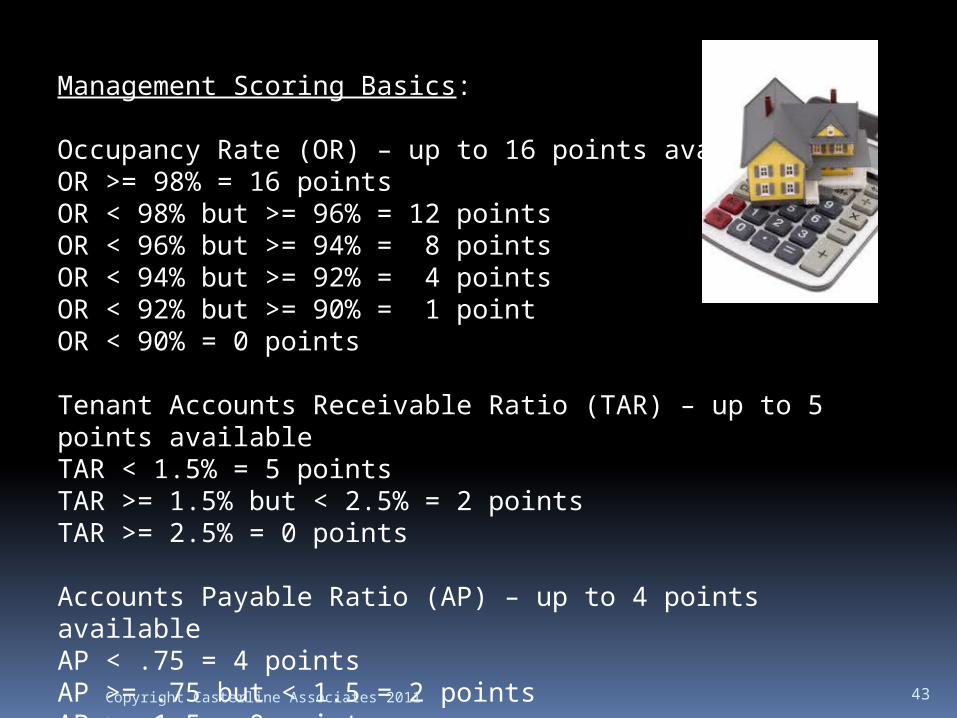
Management Scoring Basics:
Occupancy Rate (OR) – up to 16 points availableOR >= 98% = 16 pointsOR < 98% but >= 96% = 12 pointsOR < 96% but >= 94% = 8 pointsOR < 94% but >= 92% = 4 pointsOR < 92% but >= 90% = 1 pointOR < 90% = 0 points
Tenant Accounts Receivable Ratio (TAR) – up to 5 points availableTAR < 1.5% = 5 pointsTAR >= 1.5% but < 2.5% = 2 pointsTAR >= 2.5% = 0 points
Accounts Payable Ratio (AP) – up to 4 points availableAP < .75 = 4 pointsAP >= .75 but < 1.5 = 2 pointsAP >= 1.5 = 0 points 43Copyright Casterline Associates 2011
44Copyright Casterline Associates 2011
45Copyright Casterline Associates 2011
46Copyright Casterline Associates 2011
47Copyright Casterline Associates 2011
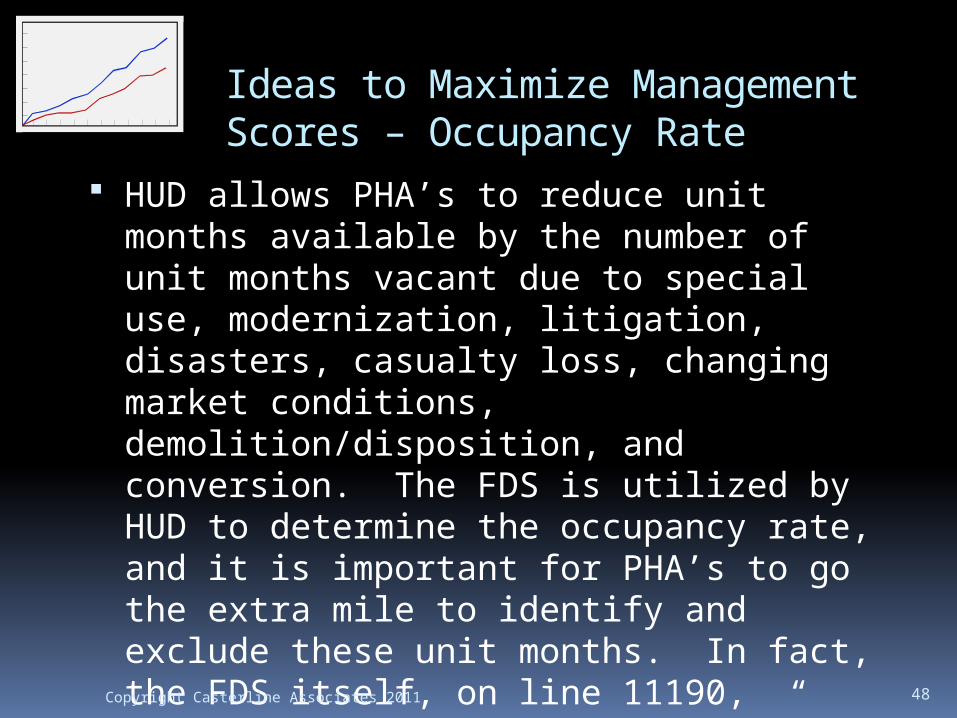
Ideas to Maximize Management Scores – Occupancy Rate
HUD allows PHA’s to reduce unit months available by the number of unit months vacant due to special use, modernization, litigation, disasters, casualty loss, changing market conditions, demolition/disposition, and conversion. The FDS is utilized by HUD to determine the occupancy rate, and it is important for PHA’s to go the extra mile to identify and exclude these unit months. In fact, the FDS itself, on line 11190, reports these amounts on a “net” basis and there are no lines or detail fields to remind the PHA to make these adjustments. 48Copyright Casterline Associates 2011
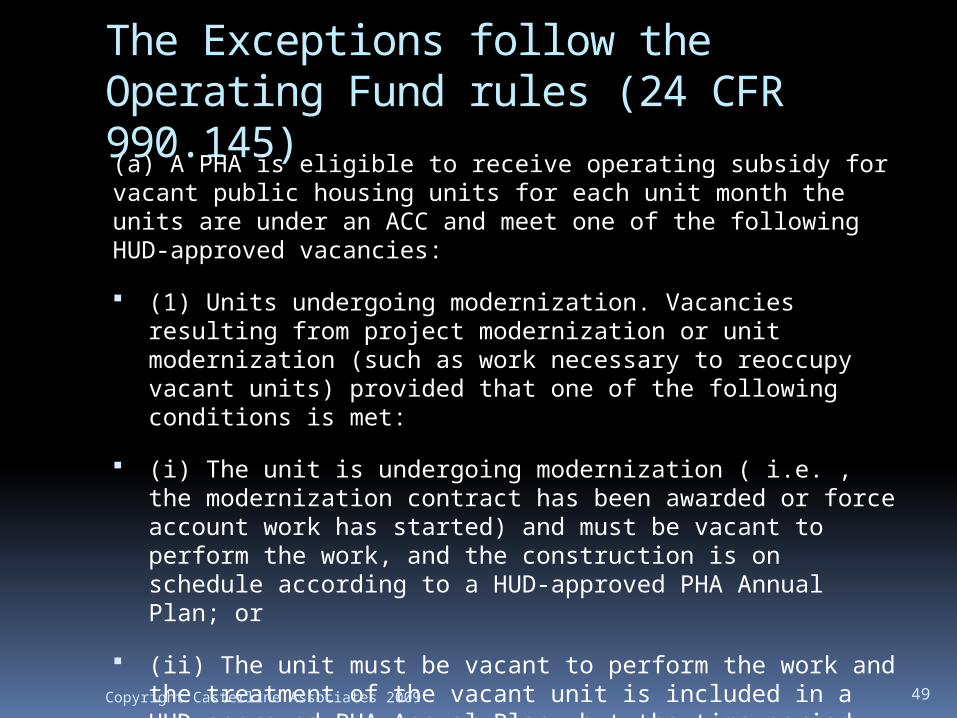
The Exceptions follow the Operating Fund rules (24 CFR 990.145)(a) A PHA is eligible to receive operating subsidy for vacant public housing units for each unit month the units are under an ACC and meet one of the following HUD-approved vacancies:
(1) Units undergoing modernization. Vacancies resulting from project modernization or unit modernization (such as work necessary to reoccupy vacant units) provided that one of the following conditions is met:
(i) The unit is undergoing modernization ( i.e. , the modernization contract has been awarded or force account work has started) and must be vacant to perform the work, and the construction is on schedule according to a HUD-approved PHA Annual Plan; or
(ii) The unit must be vacant to perform the work and the treatment of the vacant unit is included in a HUD-approved PHA Annual Plan, but the time period for placing the vacant unit under construction has not yet expired. The PHA shall place the vacant unit under construction within two federal fiscal years (FFYs) after the FFY in which the capital funds are approved.
Copyright Casterline Associates 2009 49
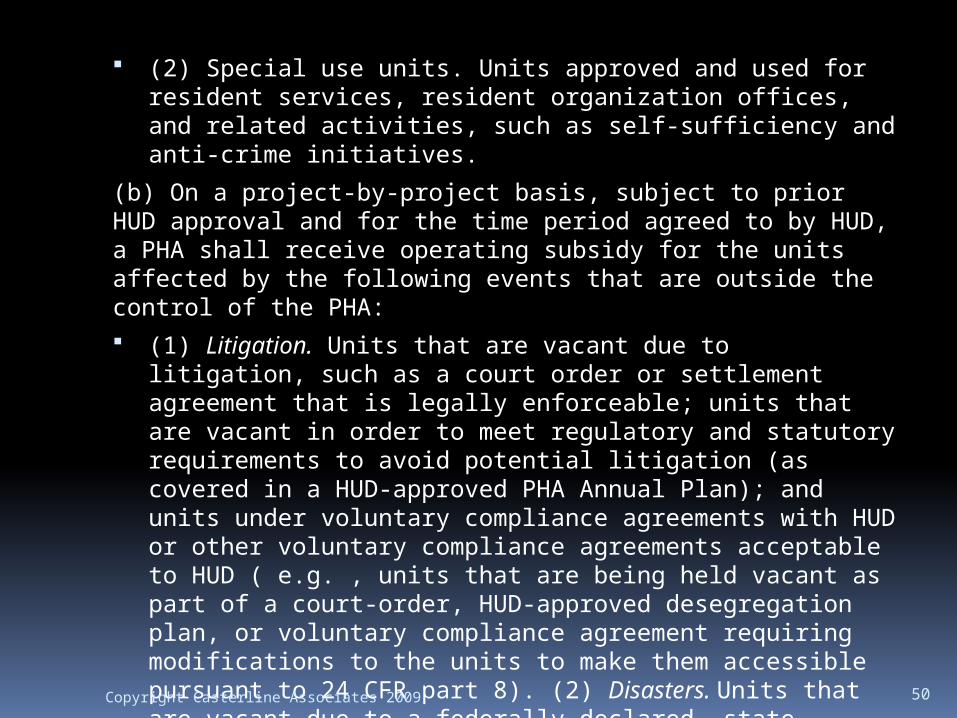
(2) Special use units. Units approved and used for resident
services, resident organization offices, and related activities, such as self-sufficiency and anti-crime initiatives.
(b) On a project-by-project basis, subject to prior HUD approval and for the time period agreed to by HUD, a PHA shall receive operating subsidy for the units affected by the following events that are outside the control of the PHA: (1) Litigation. Units that are vacant due to litigation, such as a
court order or settlement agreement that is legally enforceable; units that are vacant in order to meet regulatory and statutory requirements to avoid potential litigation (as covered in a HUD-approved PHA Annual Plan); and units under voluntary compliance agreements with HUD or other voluntary compliance agreements acceptable to HUD ( e.g. , units that are being held vacant as part of a court-order, HUD-approved desegregation plan, or voluntary compliance agreement requiring modifications to the units to make them accessible pursuant to 24 CFR part 8). (2) Disasters. Units that are vacant due to a federally declared, state-declared, or other declared disaster. (3) Casualty losses. Damaged units that remain vacant due to delays in settling insurance claims.
(c) A PHA may appeal to HUD to receive operating subsidy for units that are vacant due to changing market conditions (see subpart G of this part—Appeals).
Copyright Casterline Associates 2009 50
Applicable FDS Lines (Reference: REAC Interim Financial Data
Schedule Definition Guide)
11190 Unit months availableThis FDS line item represents the number of months available for all low rent, …. except those unit months vacant due to special use, modernization, litigation, disasters, casualty loss, changing market conditions, demolition / disposition and conversion. This is a required field.
11210 Unit months leased
This FDS line item represents total number of dwelling unit months leased by tenants during the reporting period. The reported amount should be based on the PHA’s tenant rent rolls or housing assistance payment records. 51Copyright Casterline Associates 2011
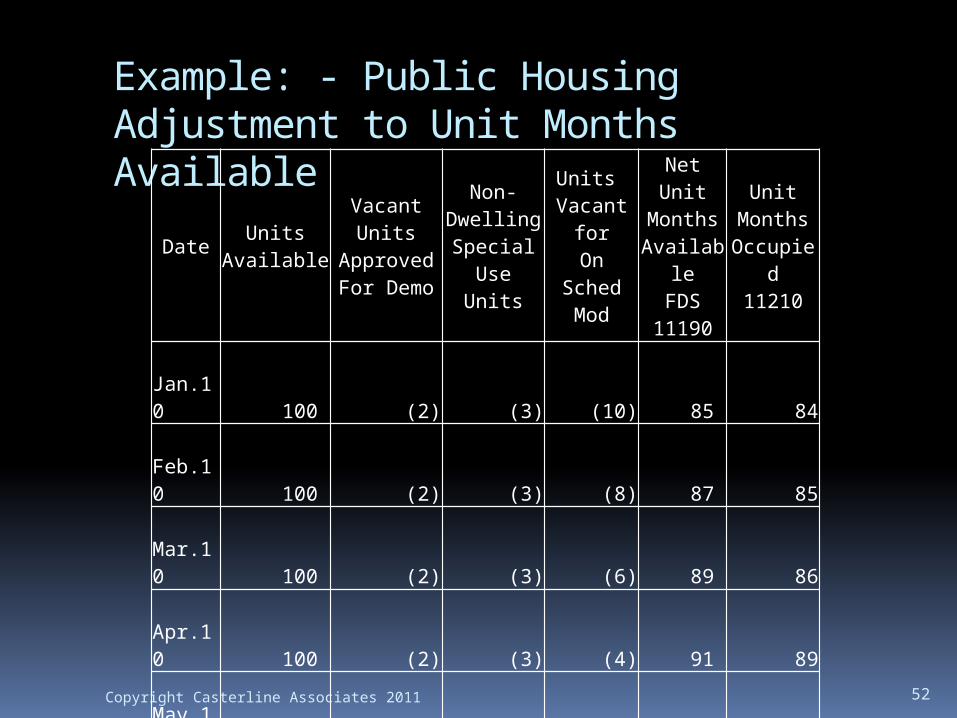
Example: - Public Housing Adjustment to Unit Months Available
52Copyright Casterline Associates 2011
Date UnitsAvailable
Vacant Units
ApprovedFor Demo
Non-DwellingSpecial
Use Units
Units Vacant
forOn
SchedMod
NetUnit
MonthsAvailabl
eFDS
11190
UnitMonthsOccupie
d11210
Jan.10
100
(2)
(3)
(10)
85
84
Feb.10
100
(2)
(3)
(8)
87
85 Mar.10
100
(2)
(3)
(6)
89
86
Apr.10
100
(2)
(3)
(4)
91
89 May.10
100
(2)
(3)
(2)
93
92
June.10
100
(2)
(3)
(1)
94
92
July.10
100
(2)
(3)
-
95
92 Aug.10
100
(2)
(3)
-
95
93
Sept.10
100
(2)
(3)
-
95
93
Oct.10
100
(2)
(3)
-
95
92 Nov.10
100
(2)
(3)
-
95
92
Dec.10
100
(2)
(3)
-
95
93
1,200
(24)
(36)
(31)
1,109
1,083
Ideas to Maximize Management Scores – Accounts Receivable
Make sure to write-off all vacated balances at year end
Remember that the allowance for doubtful accounts reduces the net accounts receivable, but will not help this indicator because it is based upon the gross receivable before the allowance is deducted
Make sure to report any fraud-related accounts receivable (e.g. amounts from unreported income/retro rents) in fraud accounts receivable (FDS line 128), because the ratio should not include these amounts and is based upon FDS line 126.
53Copyright Casterline Associates 2011
Applicable FDS Lines (Reference: REAC Interim Financial Data
Schedule Definition Guide)
126 Accounts receivable – tenantsThis FDS line represents the cumulative balance of all tenant rent payments due, owed and outstanding such as tenant rent charges, and utility reimbursement. It also includes charges such as rent, maintenance charges, excess utility charges or other adjustments. It is the gross amount due from tenants for rent.
126.1 Allowance for doubtful accounts - tenants
This FDS line represents a reserve for the receivables from tenants recorded in FDS line 126 that are not expected to be collected. This line reduces the total accounts receivable balance when analyzed in conjunction with the related receivable. This is a required field if an amount has been recorded in FDS line 126. The allowance account should not be greater than 126.
54Copyright Casterline Associates 2011
Applicable FDS Lines (Reference: REAC Interim Financial Data
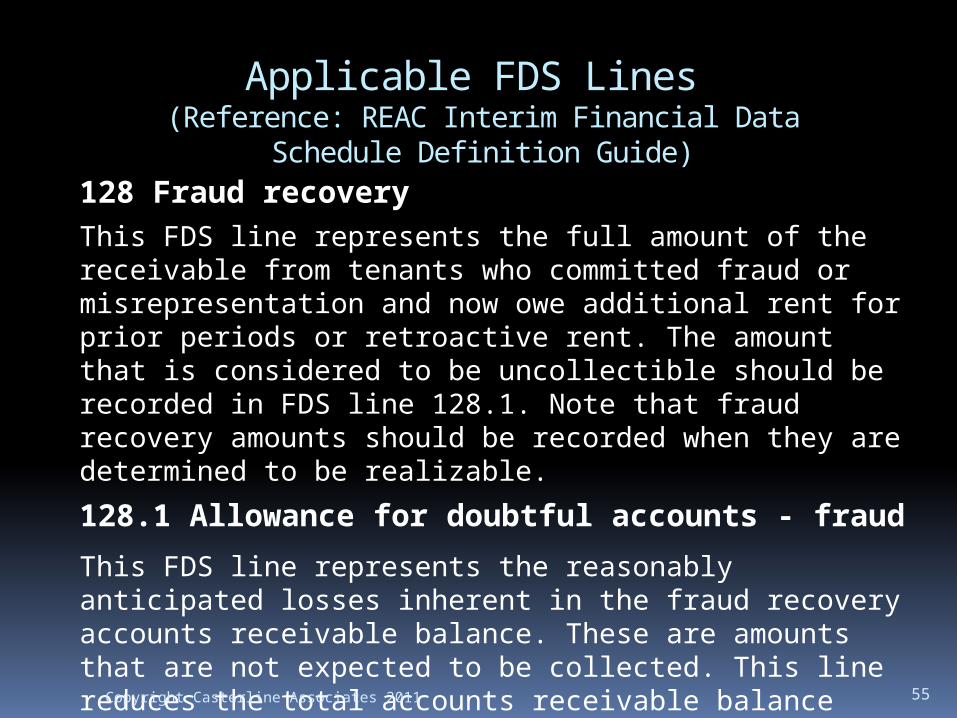
Schedule Definition Guide)128 Fraud recoveryThis FDS line represents the full amount of the receivable from tenants who committed fraud or misrepresentation and now owe additional rent for prior periods or retroactive rent. The amount that is considered to be uncollectible should be recorded in FDS line 128.1. Note that fraud recovery amounts should be recorded when they are determined to be realizable.
128.1 Allowance for doubtful accounts - fraud
This FDS line represents the reasonably anticipated losses inherent in the fraud recovery accounts receivable balance. These are amounts that are not expected to be collected. This line reduces the total accounts receivable balance when analyzed in conjunction with the related receivable. This is a required field if an amount has been recorded in FDS line 128. The allowance account should not be greater than 128.
55Copyright Casterline Associates 2011
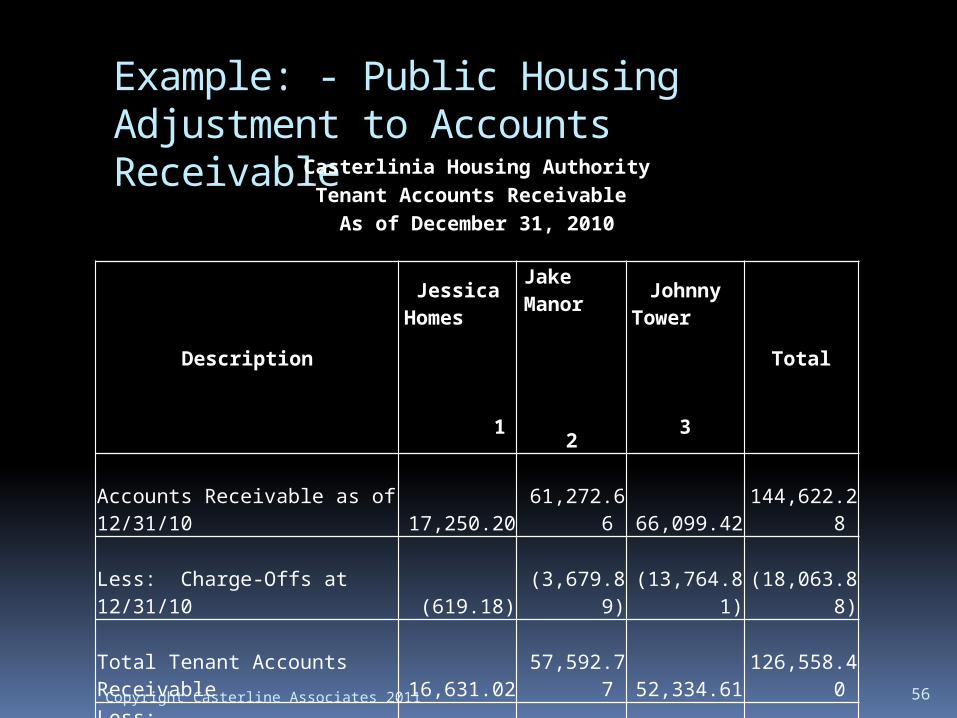
Example: - Public Housing Adjustment to Accounts Receivable
56Copyright Casterline Associates 2011
Casterlinia Housing AuthorityTenant Accounts Receivable
As of December 31, 2010
Description
Jessica Homes
1
Jake Manor
2
Johnny Tower
3
Total
Accounts Receivable as of 12/31/10 17,250.20
61,272.66
66,099.42
144,622.2
8
Less: Charge-Offs at 12/31/10
(619.18)
(3,679.89)
(13,764.81
)
(18,063.88
)
Total Tenant Accounts Receivable 16,631.02
57,592.77
52,334.61
126,558.4
0 Less:
Notes Receivable (FDS line 127)
(12,729.01
)
(42,594.6
1)
(28,659.39
)
(83,983.01
)Fraud Recovery (FDS line 128) -
(2,542.13)
(268.94)
(2,811.07)
Total Adjusted Tenant Accounts Receivable (FDS line 126) 3,902.01
12,456.03
23,406.28
39,764.32
Ideas to Maximize Management Scores – Accounts Payable
Make sure FDS lines 312 and 313 only include items that meet the definition in the FDS line definition guide. Other current liabilities that do not meet the definition in the guide may be placed on different FDS line numbers.
Pay off as many bills as possible on or before the last day of your fiscal year.
Extreme measure (use this one when desperate): avoid buying things the last month of your fiscal year!
57Copyright Casterline Associates 2011
Applicable FDS Lines (Reference: REAC Interim Financial Data
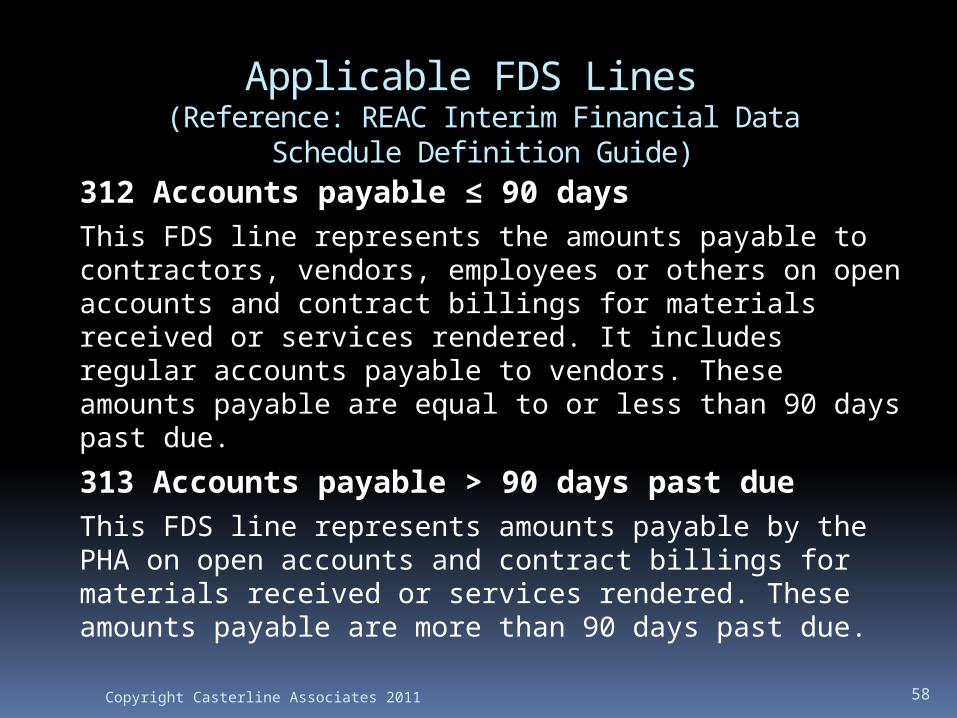
Schedule Definition Guide)312 Accounts payable ≤ 90 daysThis FDS line represents the amounts payable to contractors, vendors, employees or others on open accounts and contract billings for materials received or services rendered. It includes regular accounts payable to vendors. These amounts payable are equal to or less than 90 days past due.
313 Accounts payable > 90 days past dueThis FDS line represents amounts payable by the PHA on open accounts and contract billings for materials received or services rendered. These amounts payable are more than 90 days past due.
58Copyright Casterline Associates 2011
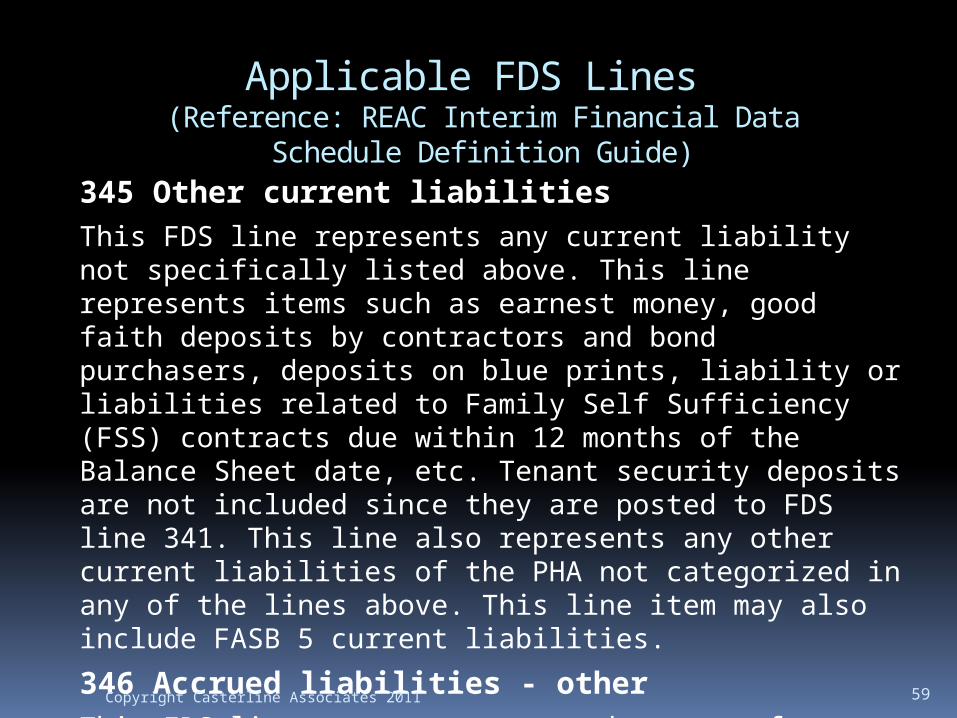
Applicable FDS Lines (Reference: REAC Interim Financial Data
Schedule Definition Guide)345 Other current liabilitiesThis FDS line represents any current liability not specifically listed above. This line represents items such as earnest money, good faith deposits by contractors and bond purchasers, deposits on blue prints, liability or liabilities related to Family Self Sufficiency (FSS) contracts due within 12 months of the Balance Sheet date, etc. Tenant security deposits are not included since they are posted to FDS line 341. This line also represents any other current liabilities of the PHA not categorized in any of the lines above. This line item may also include FASB 5 current liabilities.
346 Accrued liabilities - otherThis FDS line represents accrued amounts for utility expense, insurance, and other liabilities not applicable to other specific accounts.
59Copyright Casterline Associates 2011
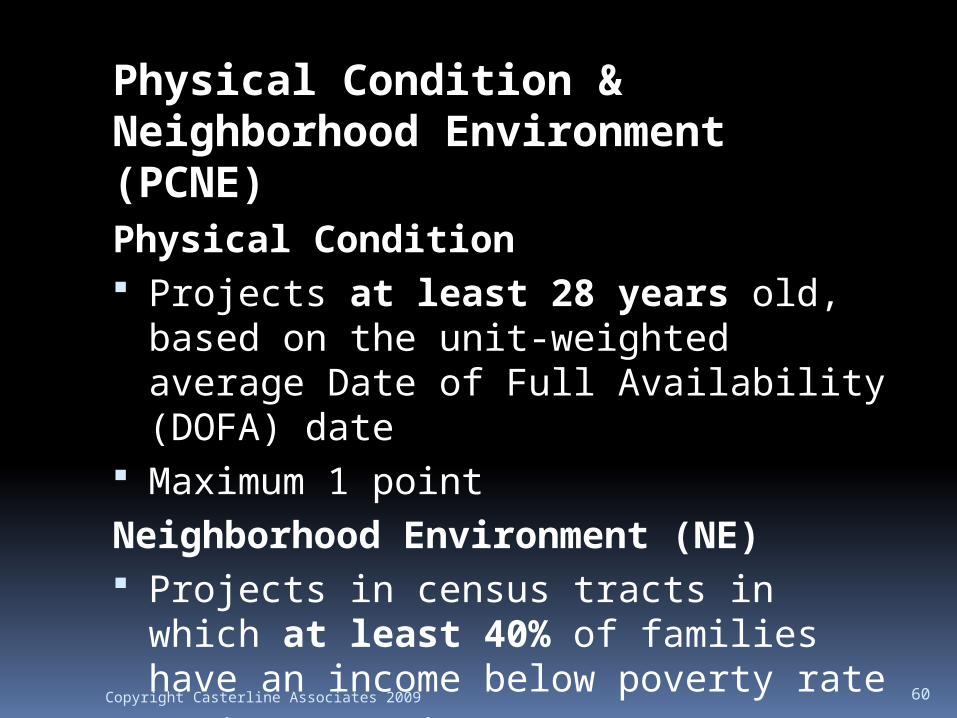
Physical Condition & Neighborhood Environment (PCNE)Physical Condition Projects at least 28 years old, based
on the unit-weighted average Date of Full Availability (DOFA) date
Maximum 1 pointNeighborhood Environment (NE) Projects in census tracts in which at
least 40% of families have an income below poverty rate
Maximum 1 pointCopyright Casterline Associates 2009 60