Embed Size (px)
Citation preview

CATA 2010 March 2010
Jewels, Himalayas and Fireworks,Extending Methods for
Visualizing N Dimensional Clustering
W. JockheckDept. of Computer ScienceNorth Dakota State UniversityFargo, North Dakota [email protected]
Dr. William PerrizoDept. of Computer ScienceNorth Dakota State UniversityFargo, North Dakota [email protected]

CATA 2010 March 2010
Overview• Visualization of high dimensional data is often difficult
and in some cases leads to incorrect conclusions.
• However the human mind is the most sophisticated and effective pattern recognizer available for two-dimensions (or three-dimensions?).
• This paper considers transformations of high dimensional data into two dimensional space for the purpose of using the human brain as a pattern recognition engine to get [partial] quick results.
• Then other methods can be used for further drill down.

CATA 2010 March 2010
Visualizing N Dimensional data Chernoff's faces
Parallel Coordinates
Jewel Diagram
CATA 2010 March 2010
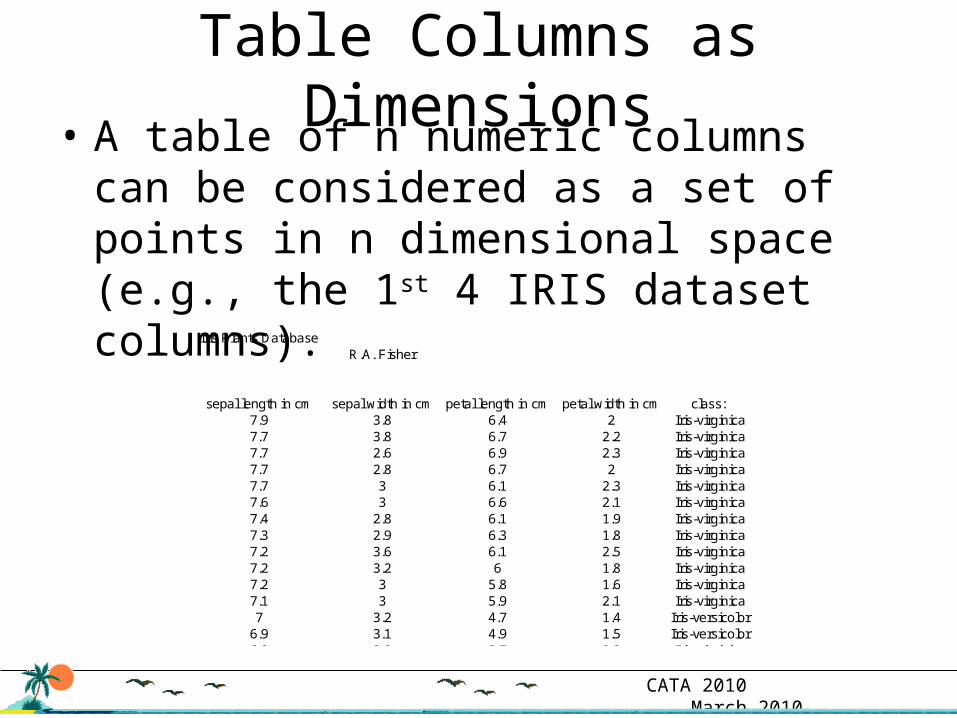
Table Columns as Dimensions• A table of n numeric columns can be
considered as a set of points in n dimensional space (e.g., the 1st 4 IRIS dataset columns).
Iris Plants DatabaseR.A. Fisher
sepal length in cm sepal width in cm petal length in cm petal width in cm class: 7.9 3.8 6.4 2 Iris-virginica7.7 3.8 6.7 2.2 Iris-virginica7.7 2.6 6.9 2.3 Iris-virginica7.7 2.8 6.7 2 Iris-virginica7.7 3 6.1 2.3 Iris-virginica7.6 3 6.6 2.1 Iris-virginica7.4 2.8 6.1 1.9 Iris-virginica7.3 2.9 6.3 1.8 Iris-virginica7.2 3.6 6.1 2.5 Iris-virginica7.2 3.2 6 1.8 Iris-virginica7.2 3 5.8 1.6 Iris-virginica7.1 3 5.9 2.1 Iris-virginica7 3.2 4.7 1.4 Iris-versicolor
6.9 3.1 4.9 1.5 Iris-versicolor6.9 3.2 5.7 2.3 Iris-virginica6.9 3.1 5.4 2.1 Iris-virginica6.9 3.1 5.1 2.3 Iris-virginica6.8 2.8 4.8 1.4 Iris-versicolor6.8 3 5.5 2.1 Iris-virginica6.8 3.2 5.9 2.3 Iris-virginica6.7 3.1 4.4 1.4 Iris-versicolor

CATA 2010 March 2010
Projecting Hypercube into 2D• When projecting, an arbitrary vector can be used for
each dimensional axis (typically, horizontal is used for the 1st dimension and vertical for the 2nd).
Five dimensional hypercube using the axis indicated.

CATA 2010 March 2010
Jewel Diagram and Projections• Each dimension is laid out as
the side of a regular n-gon. Data points are represented by connecting the points in each dimension with a line (just as is done in parallel coordinates).
• The mean of those dimension points is displayed as a 2-D projection of the n-D data point.
• However, the fact that the data is “wrapped around” can cause [unnecessary?] cancellation of information.

CATA 2010 March 2010
Other methods of projecting points
– Parallel coordinates
– Himalayan variation
A1 A2 A3 A4 A5
A
1
A
5

CATA 2010 March 2010
Adjustments and Fixes
• Variations on the arrangement and directionality of the axis were explored.– In some variations, pairs of attributes off set
each other (e.g., there is cancellation due to wrap-around)
• This led to placing all axis in a single quadrant (so that they don’t cancel out each other’s effects).

CATA 2010 March 2010
Single Quadrant Variations (IRIS data)
Himalayan Axis Spacing (doubling angle) Uniform angular Spacing

CATA 2010 March 2010
Fireworks

CATA 2010 March 2010
Injection of Noise
• The methods are, of course, sensitive to noise
• When additional random attributes were added to, e.g., the IRIS data, the clarity was diminished.
• That is to be expected.

CATA 2010 March 2010
Why not 3D instead of 2D• VRML, CAVE or other stereo-optics based viewing is possible, but do
they pay dividends given the increase in complexity and cost?• We tried a “3D” implementation with samples slightly offset in the Z axis.• 2D seems to be the winner.
– Humans only see in 2D. The retina, while curved only captures a 2D projection. Perspective and stereo-optics provide the 3rd dimension.
– Computer displays are 2D.– Printed outputs are 2D.– 3D display devices and technologies have largely been a failure (in research
– witness the fact that almost nothing has been written about the CAVE in 5 years…
– Even though there is a slight uptick in interest in 3D movies, there have been upticks before and they have always fizzled.
• A thought: perspective provides all the 3D we need and any stereo-optic enhancement adds very little– It fills the forward space between the screen and the eyes– Perspective already fills the space from the screen backward to infinity and
that seems to be enough.
X

CATA 2010 March 2010
Contribution of the Visualization
• A single projected point represents a sample and shows its relationship in the data set.
• The methods provide display of each attribute distribution and may provide the big picture for the user.

CATA 2010 March 2010
Summary
– These methods provide visualization of high dimensional
– Provides a single point projection for each sample (tuple).
– Computationally simple– Very modifiable and adaptable
• Colors, sequences, weighting, scaling

CATA 2010 March 2010
Jewels, Himalayas and Fireworks,Extending Methods for
Visualizing N Dimensional Clustering
W. JockheckDept. of Computer ScienceNorth Dakota State UniversityFargo, North Dakota [email protected]
Dr. William PerrizoDept. of Computer ScienceNorth Dakota State UniversityFargo, North Dakota [email protected]


![JEWELS [Catalogue]](https://img.pdfslide.net/doc/110x75/579078cc1a28ab6874c419e7/jewels-catalogue-579be8da5fe53.jpg)