Embed Size (px)
Citation preview
CATABOLIC PATHWAYS AND METABOLIC CONTROLS
IN PSEUDOMONAS AERUGINOSA
By
CLINTON MELVIN COWEN, / ,' ,
Bachelor of Science
Oklahoma State University
Stillwater, Oklahoma
1965
Submitted to the Faculty of the Graduate College of the
Oklahoma State University in partial fulfillment of the
requirements for the degree of MASTER OF SCIENCE
May, 1968
t-:" .. ;l j j ;~, / '/ -c. .,-,,., ,:~)_./'::.,;; ,, ')
\ '
CATABOLIC PATHWAYS AND METABOLIC CONTROLS
IN PSEUDOMONAS AERUGINOSA
Thesis Approved:
6B8270 ii
OKLAHOMA STATE UNIVERSITY LIBRARY
OCT 24 1968
ACKNOWLEDGMENTS
My thanks .are earnestly .extended to Dr. E.T. Gauq.y for her
valuable assistance throughout .this research.
Gratitude is due to the National Science Foundation for financial
aid through grant GB-4195.
iii.
TABLE OF CONTENTS
Chapter· Page
I.
IL
INTRODUCTION
MATERIALS AND METHODS. . . A. B, c. D. E.
F.
G. H. I. J.
Organism O Cl O • e e e O • II • e • 0 II e e •
Cultivation Media and Conditions of Growth. Measurement of Growth Chemicals ••••
' " • • Cl
• • 0 • . • ~
Chemica~ Analyses ••••• 1. Glucose •••• 2. Histidine o • • " • " • • • • o • •
3. Glycerol . • • • • • • • • 4. Protein • • • • • ••• Isolat:i,on of Mutants. • ••• 1. Selection for Mutants Using Nitrosoguanidine
and Penicillin. • . • . • • • • ••• 2. Direct Plating Method • • . • • • • • Preparation of Plate Stocks •• Transductions • . . . • . • • • • Preparation of Cell-Free Extracts Preparation of Cells for Assay of L-0<-glycero-
phosphate Dehydrogenase .••• Enzyme Assays . . . • . • • . • • . . • • . 1. Glycerol Kinase •••••••••• 2. L--0<-glyceropl).osphate Dehydrogenase of Cell-
Free Extract • ·• , • • , • • • • • • • • • • 3. L-tx'-glycerophosphate Dehydrogenase of Whole
Cell Preparation. 4. Triose7phosphate Isomerase ••••••
1
7
7 7 7 7 8 8 8 9 9
10
10 11 1,1 11 12
12 13 13
13
14 14
III. EXPERIMENTAL RESULTS ••ooooo••••oo••o~og 16
A. Control of Degradative Pathways in Pseudomonas .a.eruginosa . . . . o • • • o • Cl • o • o • • c, o 16
1. Inducibility of Degradative Pathways. • • • • 16 2. Loss of Induced Enzymes • • • • • • • 19 3. Repression by Glucose· • • • • • • • • • ·• 19 4. Inhibition by Gluca.se· • • • • • • • • • 37 5. Induction of.Histidine Degradative Enzymes by
Urocanic Acid 48
iv
Chapter Page
B. GlyceDol Pathway.in.Pseudomonas aeruginosa 48 1, Glycerol Permease • • • • • • • 48 2. Growth on «-Glycerol Phosphate • • • ·• • 51 3. Enzyme Assays • • · • • • ·• ·• . • ·• • • 54
C. Isolation and Characterization of Mutants • • • • 56 1. Isolation of Glycerol Mutants •• , • • • • • 56
a. Direct Plate Method • , • • • , • • 56 b. Nitrosoguan~dine and Penicillin • • • • • 56
2. Characterization of G:J_ycerol Mutants.. • 57 a. Growth Studies • • • • • • • • • • • • . • • 57 b. Enzyme Stud;i.es With Whole Cells 60 c. · Enzyme.Studies With Cell Extracts • • • • 60
3. Transduction Studies • • • • • • • • ·• • • 64 D. Susceptibility to Phage • • • • • 65
IV. DISCUSSION 67
v. SUMMARY AND CONCLUSIONS • . . 75
LITERATURE CITED •oo,o•eoo"oGoe 78
v
LIST pF TABLES
Table
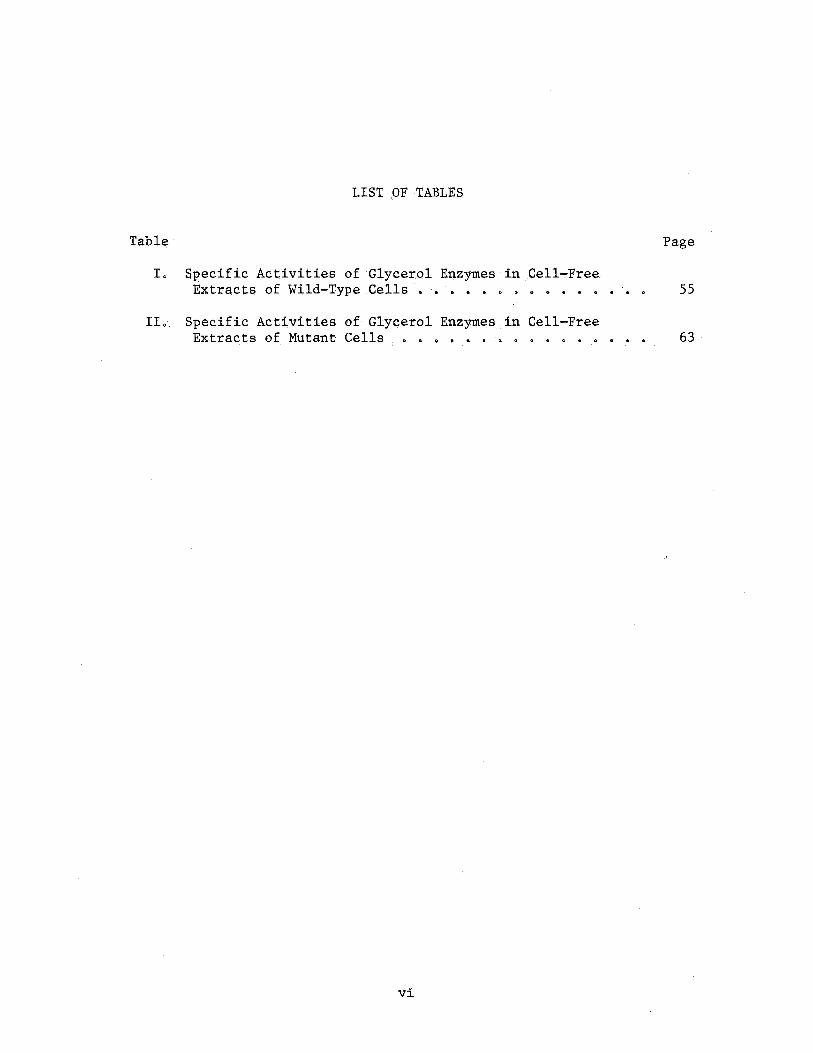
I. Specif;ic Activities of Gl.ycerol EI).zymes·in.Cell-:-Free Extract$ of Wild-Type ,Cells • • • • • • • • • ·• • •
II •. Speqific Activities of Glyc;.erol Enzymes in Cell-Free Extracts of. Mutant Cells • • • • • • • • • • • • •
vi
Page
55
63 ·
LI!?T OF-FIGURES
Figure Page
L · Maj or Pathways. for Glycerol Metabolism in B~cteria 4
2 •· · · Gi;owth of Glucose..;.Grown Cells on Glucose· and Other Carbon.· Sour(;!es • • • ·• ooee'•••o'•·'!' __ o••tt••• 18
3. Growth.of Induced Cell.s on .. Glucose and·on,the I~ductng S~bstrate:. . . . • . . . . . . . . . . . • . . . • . . 21
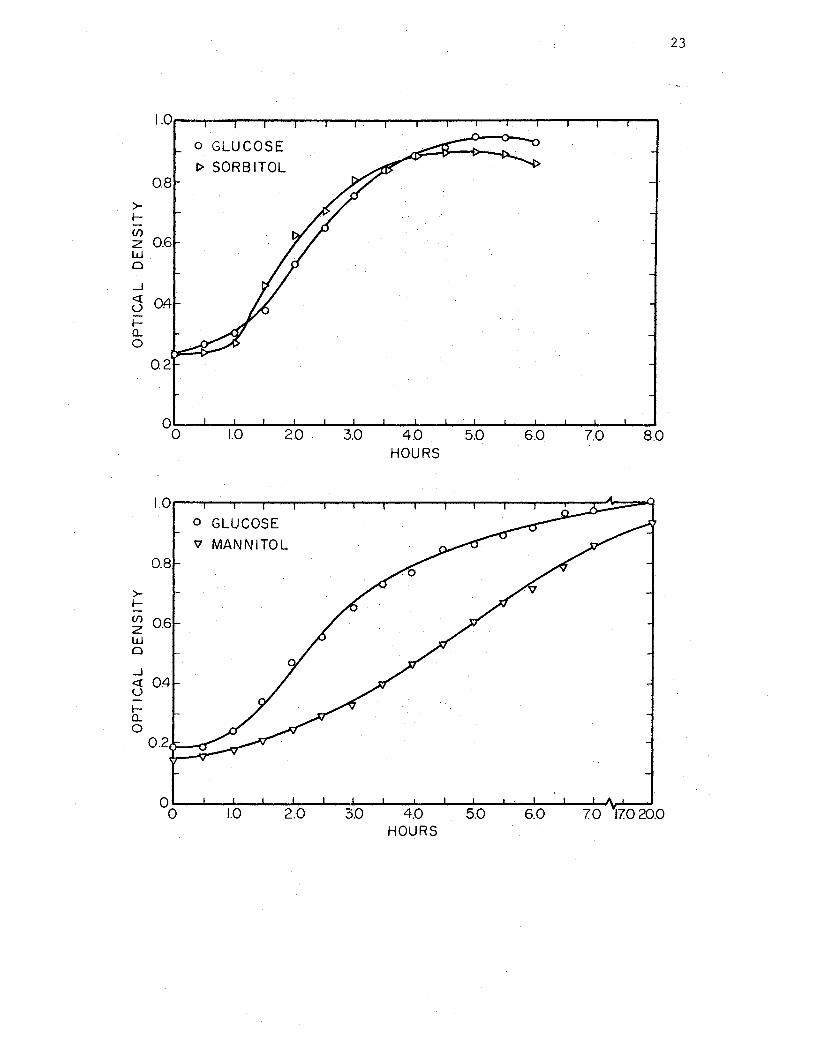
4. Growth of Induced.Cells on GlucoS1e·and on the Inducing Substr~t;e . . • 0 • . . . . . . . . • . . . . . . 23
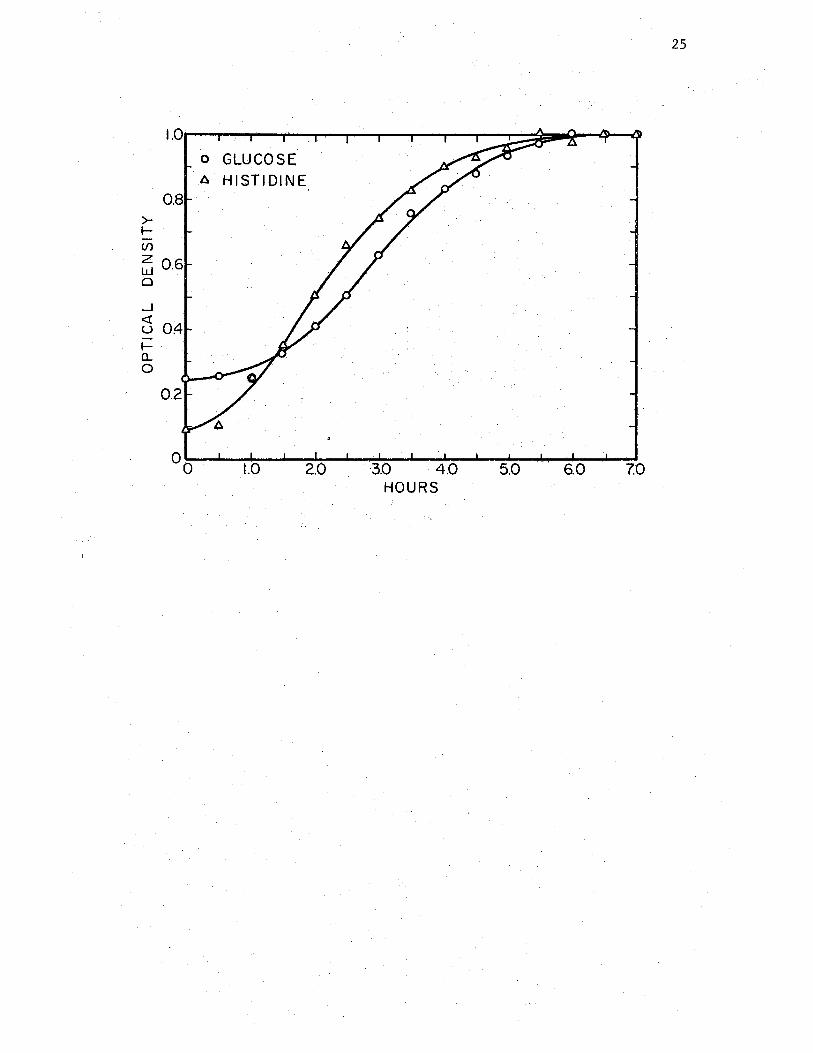
5. Growth ··of ,Indu~ed Cells .on Glucose and on the Inducing Substrate· • . . . . • . . . . . . . . . • . . . 25
6. Loss of Induced.Enzymes· in the.Absence of Substrate· ~ .. 27
7. LQSS of Induced.Enzymes in the.Abseij.ce· of Substrate· • . . 29
8. Growth on Glucose·and on Mixtures of Substrates ••• 32.
9. · Effect.of Glucose on Utilization of:Hist:i,dine by Glucose..;. Grown·. Gells . o , o o o o o • • • • o • • • • o • o o II 34 ·
10. Effect.of Glucose on Utilizatio:m. of,Glycerol by Glucose-Grown Cells . . ' . . . . . . . . . . . . . . . . . . . . . . 36
11. Growth'.· and Substrate Utilization by Glycerol-Grown C~lls .. •· 39
12. Inhibition of Glycerol Utilization by Glucose Added.at Zero Time . . . . . . . . . . • . . • . . . . . 41
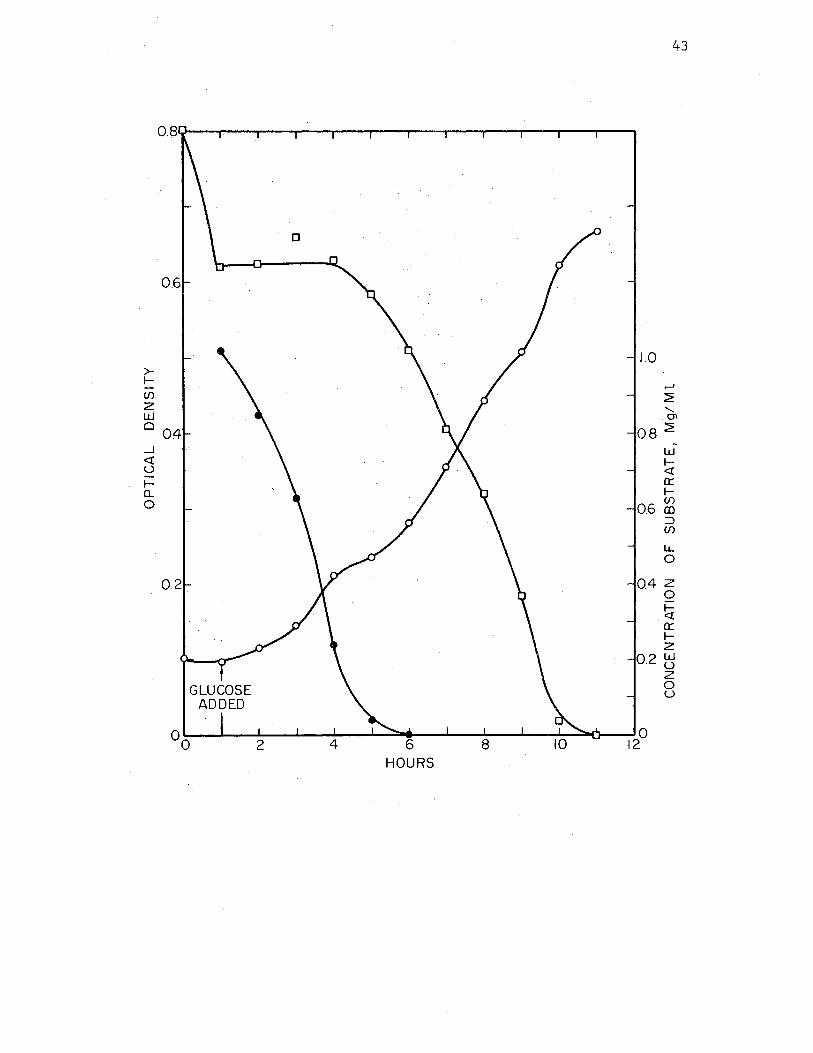
13. Inhibition of Glycerol Ut:i,lization by Glucose Added After One Hqur. . . . . . . . . . . . . . . . . . • . . 43
14. · Inhibition.of ·Glycerol Utilization by Glucose Added After ' ,.
Two Hours .• . • . . . . . . . . . . . . . . . . . 45
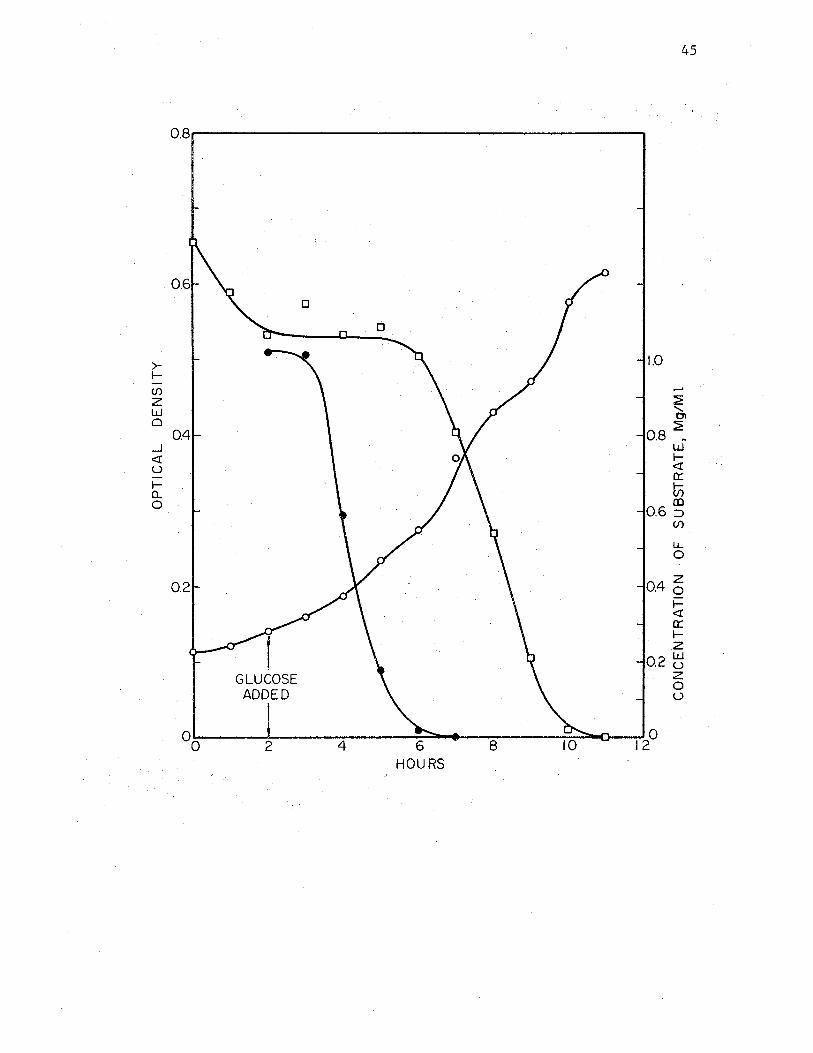
15. Inhibition of Glycerol Ut:f,.lization by Glucose Added After Three-Hours . . 0 . . . . . . . . . . . . . .. . . 47.
vii
Figure Page,
16. Inductic;m of~ Enzymes for Histidine Degradation by Urocanic Acid I • • • • o • • ·• • • • · • II • • • • • • • • • • 50
17. Accu~ulation of Glycerol by Glycerol-Grown Cells 53
18. Survival of .Mutant and Wild~type Cells in Glycerol Medium Con t~ining Pe11:foillin • • · • • • • • • • • • • • • • • • 5 9
19. Measurement 0f 0(-GlycerophoE:lphate · Dehydrogenase Activity in Whote · Cells . . . · . · . " o • • • • • • • • • , • . • • • • • • • 62
viii
CHAPTER I
INTRODUCTION
Synthesis.of the enzymes.of·certain catabolic pathways of
metabolism is.generally recognized to be·initiated by the presence.of
specific inducer molecules which interact with the product of a
regulatory gene (the repressor) and determine its functional state
(1), In the absence·of.inducer, the repressor.acts.on the operator to
preventthe functioning of the genes under its control. Theinducing
molecule renders the repressor inattive in its inhibitory function.·
Synthesis of catabolic enzymes.may also be subject to the
regulatory mechanism which has been labeled "catabolite repression"
(2). The end products·of biosynthetic pathways are unique and
specific, whereas the catabolic ,pathways.are convergent, leading to a
relatively restricted group of.dommon catabolites. The metabolism of
glucose, and certain other substrates which allow a rapid rate of.
growth~ may be expected.to result in an.accumulation of·catabolites
within the cel.L CB;tabql.ite repression r~fers to the repression of
the synthesis·of those enzymes which would tend to incr~ase,the
concentration of ·. this intracellular pool of compounds.
Recently, data have been.presented which show·that·mechanisms.
exist for.· the regulation of enzyme activity in ca,tabolic pathways
which are similar to the .feedl;>ack inhibition of.anabolic pathwayso
Komolrit and Gaudy (3) have.shown that cells which were growing
1
exponentially on various different polyalcohol,substrates ceased.to
utilize them immediately on the addition of glucose·to the medium.
Reeumption of utilization of the original·substrlilte abruptly follqwed
the depletion of glucose, Zwaig and Lin (4) have described,a specific
case of feedback·inhibition in the pathway of glycerol dissin;lilat,ion
in EscherichiE;t coli. Glycerol kinase was fo1,1nd to be subject to.
inhi~itic,n by the glycolytic intermediate, fructose-1,6-diphosphate.
The -elucidation of the mechani.sms. of metabolic· control has
2
largely. been. conducted using E • .£2.!i• Genetic_ data_ are· also avail1:1.ble __
for E_ • .£.21!.·and Salmonella typhimurium indic~ting clustering of related,
genee (5). No genetic data have been obtained for catabolic pathways
in,Pseudomonas aeruginosa, however, and comparative~y little,has been
done.in the area of control mechanisms for degradatiye pathways.
Ma.ndelstam and Jacoby (6) have examined the enzymes·of mandelate
degradation in P~ fluorescens and found three distinct operons for the
eight enzymes of .the pathway. The enzymes of each operon are induced
ae a group by t~e product of t~e preceeding operon, and the synthesis
of .each_ group of enzymes· is __ "multi_;sensitive''. to repression by the
products of succeeding operons. ·
A more recent stuc;ly of•• the mandelate pathway in Pseudomonas,
putidl! (fluorescens) showed.similar CC>Ordinat~ control of the three
groups of enzymes -- (7, 8, 9) • The· first group of five enzymes. was
found to be.coordinately induced n9t·only·by-the first,intermediate.of
the pathway, but also by benzoylformate, the third intermediate of the
sequence. The ph1;momenon, was demonstrated by. employing mutante which
were specifically blocked so as to be una~le either to further degrade
benzoylformate or to produce back-induction by its endogenous
conversion to mandelateo A non-metabolizable inducer, phenoxyacetate,
was tested with similar results; all five enzymes of the mandelate
group were formed simultaneously without induction of the enzymes of
the subsequent groups.
The present studies were.undertaken as a preliminary to future
investigations into the genetic and metabolic control mechanisms of
degradative pathways in R_. aeruginosa. A general survey of the growth
characteristics of the organism on various carbon sources led to the
choice of the glycerol pathway for more extensive investigation. The
enzymes of the glycerol pathway appeared to be inducible, repressible
by glucose, and also subject to inhibition during the metabolism of
glucose. Therefore, the pathway appeared to be a fruitful one for the
purpose of investigating mechanisms of metabolic control. A necessary
first step of such an investigation is the determination of the
reactions involved in the pathway.
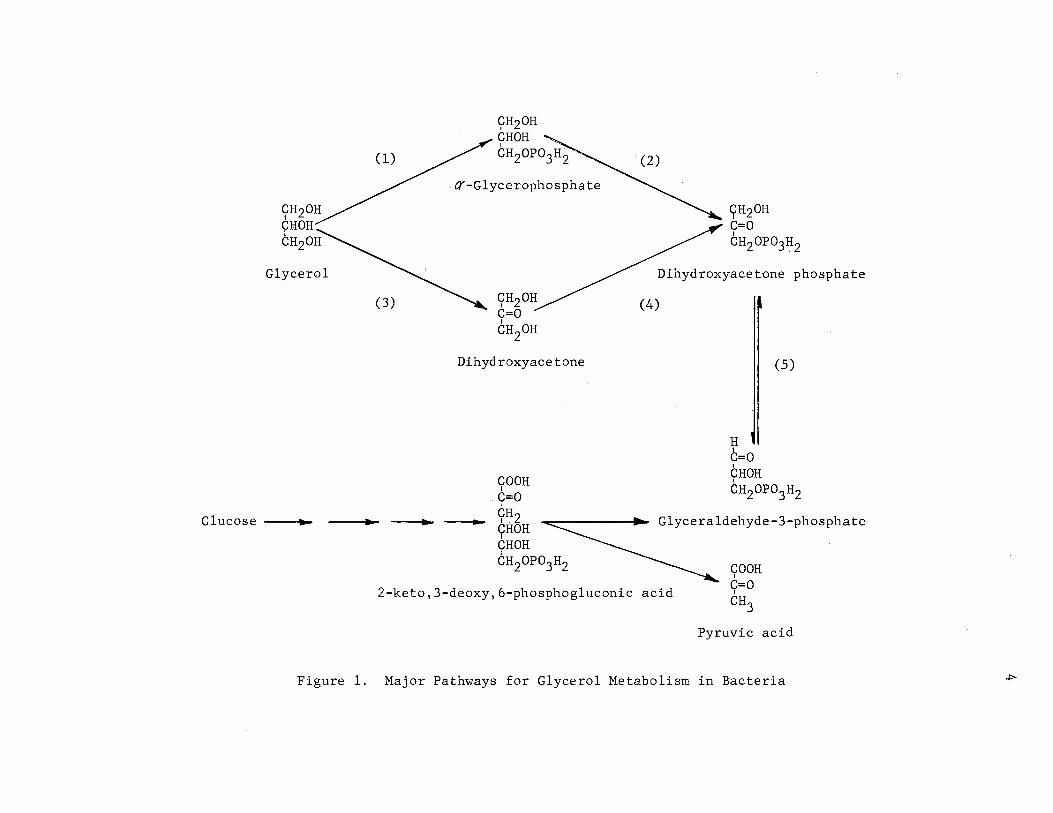
Two principle pathways for the dissimilation of glycerol have
been found among bacteria. These are shown in Figure 1. In one
pathway, glycerol is phosphorylated to form glycerophosphate and
subsequently oxidized to dihydroxyacetone phosphate (reactions 1 and
2). In the other pathway, glycerol is first oxidized to dihydroxy
acetone prior to phosphorylation to triose phosphate (reactions 3 and
4). The former pathway has been demonstrated for Mycobacterium (10),
Streptococcus.faecalis (l,O), Escherichia.freundii (10), Aerobacter
aerogenes. (10), and!!.· coli (11), The latter pathway has been found
in Acetobacter suboxydans (10), Aerobacter aerogenes (10), and!!.· coli
(12)o The presence of both pathways in A. aerogenes.strain 1033 was
described by Lin, et al (13)o This organism contains an inducible
3
Glycerol
Glucose ._ ..
(1)
(3)
yH20H CHOH I
CH20P03H2
«-Glycerophosphate
<;H20H C=O I
CH20H
Dihydroxyacetone
yOOH C=O r
yH2 - 9HOH
CHOH I CH20P03H2
yH20H C=O I
CH20P03H2
Dihydroxyacetone phosphate
(4)
(5)
H I
C=O I
CHOH CH20P03H2
Glyceraldehyde-3-phosphate
COOH I
2-keto,3-deoxy,6-phosphogluconic acid y=O CH3
Pyruvic acid
Figure 1. Major Pathways for Glycerol Metabolism in Bacteria ~
5
NAD-linked glycerol dehydrogenase when grown on glycerol under
anaerobic conditions.· When expose~ to aerobic·conditions, the glycerol
dehydrogenase is rapidly destroyed and glycerol is converted to glycero
phosphate, followed by oxidation to.triose phosphate by a glycero
phosphate dehydrogenase which does not require NAD. The electron
carrier has not been identified.
Different pathways have also been described for]_. coli in
independent investigations. Asnis and Brodie (12) reported the
conversion of glycerol to dihydroxyacetone by extracts of]_. coli, but
no data were presented as to the conditions of growth of the cells.
More recently, Koch, et al (11), studied the aerobic dissimilation of.
glycerol in!· coli strain KlO. The aerobic pathway.was shown.to
proceed via the glycerophosphate intermediate. These investigators·
reported the absence of the anaerobic pathway.
A third pathway of metabolism, characteristic of the lactobacilli,
involves the transformation of glycerol into.,6-propionaldehyde,
{J-hydroxypropionic acid and. trimethylglycol (14).
Glycerol has been shown to penetrate bacterial cells readily.
Hayashi.and Lin (15) have determined that free diffusion of glycerol
into cells of]_. coli.Kl2 is not rate-limiting for growth even at very
low concentrations. No active transport,system was found for glycerol,
but several mutant organisms were isolated which had lost the wild
type ability to accumulate the labeled substrate. These mutants were
further shown to lack glycerol kinase and were therefore unable to
"trap". the substrate by its conversion to 1-t.r-glycerophosphate, the
latter compound being unable to.diffuse freely across the cell
membrane.
6
Experiments by Lin, et al (16), showed that E.~ coli KlO was
capable of using exogenous L-c(-glycerophosphate without hydrolysis prior
to uptake, This was reported by Hayashi, et al (17), to be due to the
presence of a specific transport mec~anism for L-£X'-glycerophosphate 1
The enzymes of the transport system, glycerol kinase~ and L~-glycero
phosphate dehydrogenase were all subject to induction by both glycerol
and L~<X-glycerophosphate, but an analysis of mutants which were unable
to synth~size the particular enzymes revealed that L-t:r-glycerophosphate
was the actual inducer of all three enzymes (11).
In the present studies, cell-free extracts were employed to
determine which of the pathways for glycerol metabolism is utilized by
P. aeruginosa.
CHAPTJl:R II
MATERIALS AND METHODS
A, Organism
Pseudomonas.aeruginosa, strain 1 (PA-1), and.the mutants·derived
from it were used for all studies. The, organism was originally
obtained from B. W. Holloway of the University of Melbourne,
B. Cultivation Media~ Conditions of Growth
The cells were grown at 3 7 ° in a minimal, medium of. M-9 salts . (18)
contai~ing (g per lit~r): NH4c1, 1,0; Na2HP04·7H2o, 11.3; KH2Po4 , 3.0;
NaCl,· 5. 0; MgS04 • 7H2o, 0, 2; distilled wate'lc, · Carbon sources were
autoclaved separately and added to the desired concentration. Two
per cent agar was .. included for the preparation of plates. All liquid
c~ltures were aerated by shaking.
C. · Measurement of Growth .
Cell suspensions were read against appropriate blanks at 540 mµ
on a Coleman Junior Spectrophotometer, Model 6-D,
D. Chemicals .·
D-glyceraldehyde-3-phosphate (diethylacetal barium salt),
disodium DL...(.(-glycerophosphate, penicillin-G (potassium salt, B grade),
nicotinamide adenine dinucleotide (NAD) and its reduced form (NADH),
7
and adertosine triphosphate (ATP) were obtained from Calbiochem.
Muscle 0(-glycerophosphate dehydrogenase, urocanic acid, and thiazolyl
blue (MTT) were products of Nutritional Biochemicals Corporation.
N-methyl-N'-nitro-N-nitrosoguanidine was obtained from Aldrich
Chemical Corporation. All chemicals used in the preparation of growth
media were reagent grade.
E. Chemical Analyses
1, G],.ucose,.
Glucose was determined according to the Glucostat method.of
Worthington Biochemical Corporation. One ml samples containing 0.05
to 0.3 mg glucose were added to 9.0 ml of the prepared Glucostat
reagent and allowed to stand at room temperature for exactly 10
minutes. The reaction was stopped by adding one drop of 4M HCl and
the tubes were allowed to stand at room temperature at least five
minutes prior to reading on a.Coleman Junior Spectrophotometer at
400 mµ. ·
2. Histidine
Histidine was det.ermined by the method described by Jorpes .· (19).
A diazoniu~ solution was prepared by combintng 1.5 ml of 5% sodium
nitrite sol~tion with 1.5 ml of a solution containing 0.9% sulfanilic
acid and 9% HCl. The mixture was cooled on ice for 5 minutes. Then
6.0 ml of the.nitrite solution were added with shaking, the solution
was cooled again for 6 minutes~ and water was added to.a volume of
50 ml. Two ml of the diazonium solution were combined with 1,0 ml of
the histi4ine sample (neutral to faintly acid, with histidine at 0.05
8
to 0,005 mg/ml). After 1 to 3 hours, 5.0 ml of 1.1% sodium carbonate
were added, The tubes were read 4 to 8 minutes after the addition of
the carbonate at 500 mµ.
3, Glycerol
Komolrit's modification (20) of the method of Neish (21) was used
to determine glycerol. Periodate oxidation of glycerol allowed
colorimetric determination of the formaldehyde formed. An aliquot
containing 0.2 to 0.025 mg of glycerol was made up to 2.0 ml with
distilled water and 0.5 ml of freshly prepared 0.1 M periodic acid
was added to the sample. Exactly 10 minutes later, 0.5 ml of 1.0 M
freshly prepared sodium arsenite was added with thorough mixing.
About 10 minutes after addition of the arsenite, 6.9 ml of absolute
ethanol were added with thorough mixing. A 1.0 ml sample of that
solution was combined with 10.0 ml of chromotropic acid reagent
(60% H2so4 containing chromotropic acid at 0,1%) and heated in a
boiling water bath for 30 minutes under diffused light. The tubes
were cooled to room temperature and read at 570 mµ.
4. Protein
The protein content of cell extracts was determined according to
the ll).ethod 0£ Sutherland, et al (22). The extracts were diluted 1:20
and aliquots made up to 1.0 ml with water. Five ml of a reagent
containing sodium carbonate (4%), sodium-potassium tartrate (0.04%),
and Cuso4 (0.02%) were added to the protein sample. The tubes were
allowed to stand for 40 minutes at room temperature. Phenol reagent,
2 N, (Fisher Scientific Company) was diluted 1: 2 with water, 0. 5 ml
9
was added to the tubes and they were mixed immediately 0 The tubes
were read at 660 mp,with appropriate standardsa
F, Isolation of Mutants
L Selection for Mutants Using Nitrosoguanidine and Penicillin
PA-1 was inoculated into 10 ml of nutrient broth and grown to
8 8 x 10 cells/mL The cells were centrifuged, washed with 10 ml of
Oa05 M citrate buffer at pH 6a0, resuspended in 10 ml of citrate
buffer which contained nitrosoguanidine at 20 µg/ml (100 µg/ml was
used in some experiments), and incubated for 2a5 hours at 37@ C with
shaking, The cells were harvested by centrifugation, washed with
0,85% NaCl, divided into 10 separate tubes, each containing 6 ml of
nutrient broth, and allowed to grow to stationary phasea, In some
cases, the cells were further subcultured by growing up 0,1 ml of the
stationary-phase broth cells to stationary phase in glucosea They
were then collected, suspended in saline and incubated for 7 hours
with shakingo Tubes were prepared which contained glycerol (1%),
penicillin (189 mg), and M-9 salts in a total volume of 6 ml. Cells
from the saline suspensions were added to the penicillin tubes to a
concentration of 2.0 x 10⁸ cells/ml and incubated for 5.0 hourso A
dilution series (plated on glucose agar) provided the range to allow
subsequent plating of the cells on glucose agar at about 100 cells/
platea The glucose plates were replicated onto glucose and glycerol
agaro Colonies which were capable of growth on the glucose medium,
but not on glycerol~ were selected for further studyo
10
11
2o Direct Plating Method
Plates were prepared which contained Oo5% glycerol, Oo02% glucose,
and 5 pg/ml nitrosoguanidine in minimal medium solidified with 2% agar.
Cells were grown up in nutrient broth, diluted in saline, and plated at
about 100 cells/plateo Organisms which were incapable of growth on
glycerol appeared as small colonies among the larger wild-type
colonieso
G. Preparation of Phage Plate Stocks
The bacteriophage used in the preparation of plate stocks and for
transduction was E-l·PA-1, and was obtained from Ro Ro Greeno The
media used for phage cultivation were prepared as described by
Holloway, et al (23). One drop of log phase cells and Ool ml of a
phage suspension containing about 5 x 10⁶ phage/ml were combined in
2o5 ml of soft phage agar and poured over the surface of a plate
containing 30 ml of phage bottom-layer agaro After 12 hours incubation
at 37@ C, the plates were soaked with 5 ml Pseudomonas phage broth for
30 minutes; the broth was pipetted from the plates and the cells
removed by centrifugationo The supernatant was filtered through a
Millipore (HoAo Oo45 p pore size),
H. Transductions
Nutrient agar slants. of the organisms were inoculated 15 hours
prior to useo Each slant was flooded with 2 ml saline and 0.1 ml of
the cell suspension was spread over the surface of a glycerol minimal
agar plateo One-tenth ml of each phage suspension used was placed in
a localized, labeled area on the plate and allowed to dry prior to
incubation at 37© Co Growth of transductants was counted after 48-72
hours,
Io Preparation of Cell-Free Extracts
12
Cells were grown in 800 ml of the appropriate medium (0.5% glucose
or glycerol), collected by centrifugation during late log phasej
washed with Oo85% NaCl, and frozeno The cells were thawed~ resuspended
in 20 ml 0.02 M potassium phosphate buffer~ pH 7,0, and subjected to
six to eight lO~second bursts of sonic oscillation with intermittent
cooling in iceo Whole cells and cell debris were eliminated by
centrifugationo All extracts were dialyzed for 4 hours against 4
liters of Oo02 M potassium phosphate buffer, pH 7,0, prior to use in
enzyme analyses, In addition, each extract used in.the determination
of triose-phosphate isomerase activity was dialyzed against Oo02 M
bicine, pH 8.5, using 200 ml volumes.consecutively through 5 changes
of buffer, each treatment of 30 minutes durationo
J, Preparation of Cells for Assay of L::l(-glycerophosphate Dehydrogenase
Mutant organisms which were capable of growing in glucose .but not
in glycerol were prepared for assay of L--Or-glycerophosphate
dehydrogenase activity in whole-cell formo Endogenous substrates
which could affect the reduction of MTT via other dehydrogenase enzymes.
in the cell were largely removed by treating the cells with distilled
water at 0° C. Forty ml of Oa2% glucose were inoculated with Ool ml
of a saline suspension of cells from a nutrient agar slanto The
culture was removed from the shaker during late log phase and divided
into two 20-ml portions, To one portion of cells (A), glycerol was
13
added to a .concentration of 1%, and the culture was returned to the
shaker o The. remaining cells (B) were c~ntrifuged, rinsed with.
distilled wa~er, resuspended in 20 ml of distilled water~ and placed in
an ice bath for 4 hours prior to final centrifugation and freezing of
the pelleto The glycerol-treated cells (A) were removed from the
shaker after 4 hours, suspended in disti~led water for 4 hou~s and
treated .in the manner described .for "B"o
Ko Enzyme Assays
lo Glycerol Kinase
The phosphorylation of glycerol was measured by.coupling with the
L-OC-glycerophosphate dehydrogenase reaction according to the procedure
described by Lin, et al (16) o The assay mix tu.re contained: 0 o 3 ml of
Ool M glycerol, 0.3 ml of 3 N hydrazine, Oo5 ml of l.M sodium carbonate.
buffer at pH 9o5, Oo2 ml of Ool M ATP, 006 mlof Ool M MgC:t,2 , Oo2 ml·
of Oo02 M NAD, Oo3 mg L-0(-glycerophosphate dehydrogenase, and cell-:-free
extract in a final volu111e of . 3 o O ml o The.· glycerol was . omitted in the •
blank,, NAI)H formation was measured at 340 mµ in a Cary Recor<ling
Spectrophotometer, Model 14 (Applied Physics Corporation)o
2o L-«-glycerophosphate Dehydrogenase .Q.f.. Cell-Free Extract
L~-glycerophosphate d~hydrogenase was assayed according to Lin,
et al (16) by measuring the rate of reduction of the tetrazolium dye,
MTT (thiazolyl blue)j to its formazan which absorbed maximally at
550 mµo Meas~rement of dehydrogenase activity was enhanced by the
addition of KCN which prevented the passage of electrons·through the.
cytochrome·systemo The assay mixture contained: cell-free extract;
14
0.1 M phosphate buffer at pH 7~5, 0.1 ml of 1.0 M_DL-glycerophosphate.
(rx,{Jmixture), 0.1 ml of MTT (1 mg/ml), and 0.2 ml of 0.15 M KCN in
a final volull).e of 3.1 ml_. - The substrate ·was omitted .in the blank.
The reaction was followed in a Cary Recording Spectrophotometer.
3. L~«-glycerophosphate _ Dehydrogenase .2£. Whole~ell . Preparation
The differential rate of dye reduction by induced and non...-;1.nduced,
preparations of whole cells on the addition of substrate was taken.as -
a measure of ,L-K-glycerophosphate dehydrogenase _activity. The frozen
cells were thawed, sueipended in 2.0 ml of ,0.1 M phosphate buf~er,
pH 7. 5; and O. 2 ml of the cell suspens.ion was added to a solu t;f.01;1
coµ.taining: 1.6 ml -of 0.1 M phosphate b~ffer, pH 7.5, 0.2 ml of
0.15 M KCN, and 0.1 ml of MTT (l mg/ml,). The reaction was.followed.
for 6 ,minutes at 25° using a Coleman Junior -Spectrophotometer at s·so tnp'..
At 6 minutee, 0.2 ml of 1.0 M DL-ff-glycerophosphate was added to both_
the induc~d and non-ind~ced.preparations. The opti<;:aldensity was
recorded at one minute intervals for another s-10 minutes.·
4. Triose-phosphate .Isomerase
Triose-phosphate isomerase.activity was determined by coupl:lng
with added glycerophospbate _ dehydrogenase· ari.d'meaf3uting· ·oxidation -- of
NADH -on the _ addition of :D L :..glyceralclehyde-3-phosphate ~ The reaction
mixture contained: 0.2 llll of 0.02 .. .M NADH, 0,1 to .-0.3:mLextract,
0.3 mg L--«~glycerophoephate dehydrogenase (muscle), 0.5 ml of 0.025 M
L-glyceraldehyde-3-phosphate and 0.1 M bicine, pH 8.5; to a.total
volume of 3.7 ml. The substrate was replaced with water in the.blank.
Oxi_dation of -NADH was followed at 340 mµ using a -Cary Recording
Spectrophotometer, by reversing the positions of cuvettes contai~ing
blank and sample&
15
CHAPTER III
EXPERIMENTAL RESULTS
A. Control of Degradative·Pathways in Pseudomonas aeruginosa
1. Inducibility of Degradative Pathways.
Preliminary data, were obtained. demonstrating the·. ability of PA-1
to use as,sole.source of.carbon and energy the following c~rbon
sources; fructose, sorbit9l, mannitol, histidine, glycerol, and
glucose.· To.determine which of these catabolic pathways involved the
production of inducible enzymes, glucose-grown lqg phase cells were.
inoc1,1lated into minimal media containing each of the COI!lpciunds·at a
concentration of 0.5% and:the growth of the cultures was recorded
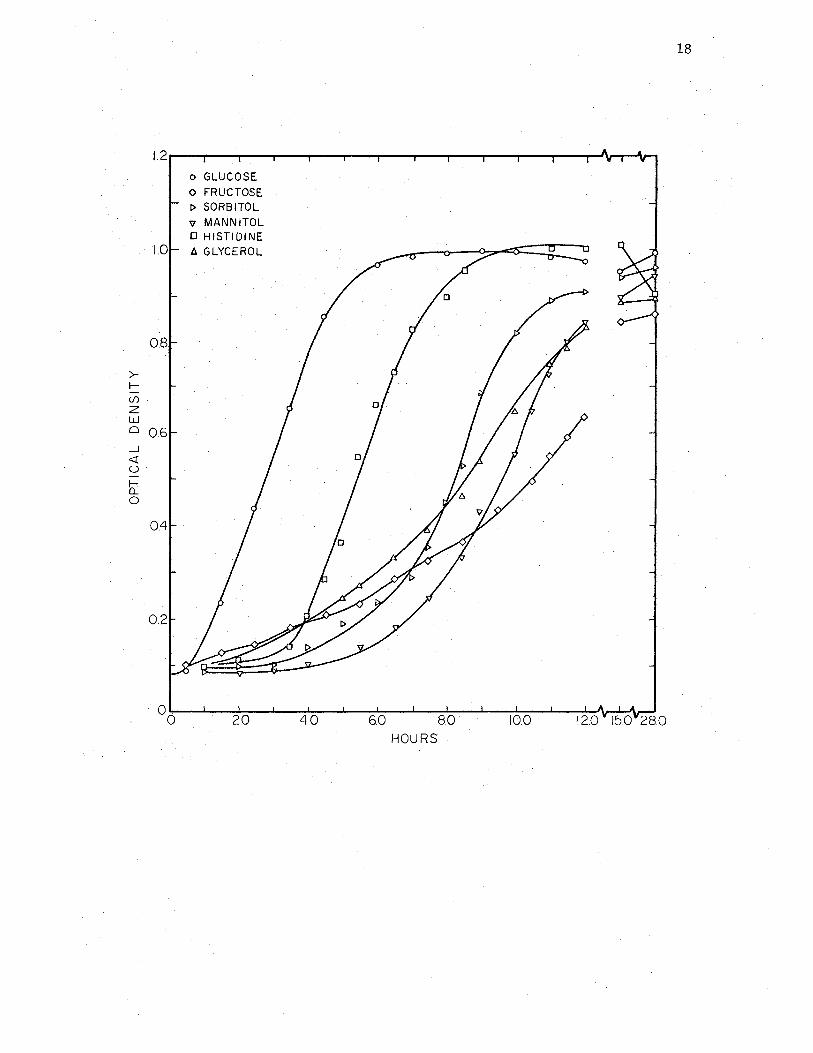
subsequently at 30 minute intervals. These growth curves are·shown
in Figure 2. The·glucose medium was.observed to. allow an ~ediate
resumption of,growth. A lag in growth was observed for the,othe+
media tested. Fructose evi4enced a very slow rate of growth
initially, which increased significantly after several·, hours of
incubation. Neither glycerol nor.fructose supported growth at a rate
col!lparl;lble · .. to that, on glucose even after an apparent maximum growth
rate·was rel;lched.
The inducibility of these pathways was further tested by growing
PA-1 to log phase,in eachof the above,medic';l, resuspending half of.
each.culture in fresh medium containing the same carbon source on
16
Figure 2. Growth of glucose..;.grown cells on glucose and other carbon sources. Wild-type cells were grown to log phase in glucose· minimal mediumj harvested, and inoculated into minimal media containing various.carbon so1,1rces, each at a concentration of.0.5%. Optical density was recorded at 30-~minute intervals. (Not all readings are shown.)
18
1.2 o GLUCOSE
<> FRUCTOSE t> SORBITOL v MANNITOL O HISTIDINE
1.0 A GLYCEROL
0.8
>-I-(/)
z w 0 0.6 _.J
<! u·
~ 0
0.4
oo •. ~_._~_._...__._~_.._~_.._~_.._~_..~_._~_._~~~_...~_._~~_..."'\I"...., 2.0 4.0 6.0 8.0 10.0 12.0 15.0 28.0
HOURS
19
which it was grown and the.other half in glucose minimal med~um.
Growth re:mmed in all cases without the lag period observed when cells
were trans~erred from a glucose mediumo Growth it). glucose.was not
delayed on transfer from the several different media. These data are.·
shown in Figures·3, 4, and 5. As in the previous experiments using
non-induced cells, growth rates on fructose.and glycerol were quite
slow compared to that on glucose even though fully-induced cells were
used as inoculum. ·
2. Loss . .Qf Induced Enzyn1es
Cells were inoculated iI).to minimal media containing 1.0%
concentrations of fructose, sorbitol, mannitol, and histidine, and.
allowed to grow to stationary phase~ Incubation of the cultures was
continued. for about two hours after maximum growth was reached. The
cells wer_e then tri;tnsferred into fresh media of the, same composition
and also into glucose. In each case, growth was noted withiI). one.hour.
in glucose but a considerable lag period was not~d for the other
substrates. Induced enzymes- for all four substrat~s appeared to be
degraded within a fairly short time after the substrate was.exhausted
from the.medi-umo These.data.are·shown. in Figures 6·and 7~
3. Repression .!!z. Glucose,
The biosynt,hesis of inducible catabolic enzyme~ may,besubject, to
repression by glucose~ This mechanism is someti~es·observed to
produce a characteristic effect on t~e growth.curve whet). the organism
is incubated in a medium containing both the inducing substrate and
glucose. ("diauxie11 )o
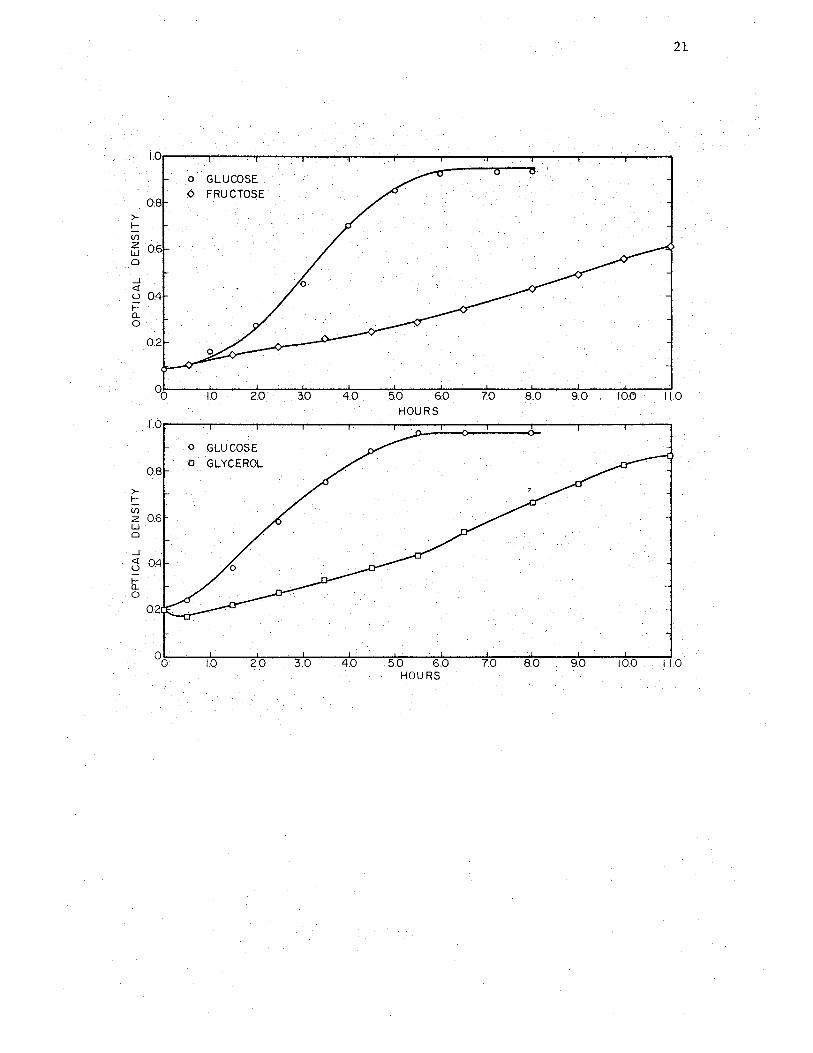
Figure 3o Growth of induced cells on glucose and on the. inducing substrate:, Wild-:type cells were grown to log phase in minimal medium containing a carbon source other than glucose at a concentration of 0.5%o Cells were harvested, inoculated into minimal medium containing the substrate on.which they had been. grown and into glucose minimal medium. Optical density was recorded at 30-minute intervals.
. 0.8 >-!--,
V)
-~ ·o.6 0
_J <( u 0.4 j::
. 0.. 0
·. 0:2.
00
1.0
0:8
>-!--,
in z .0.6 w· 0 .
. ; .. J <( 0.4 ~ Ii 0
0.2.
0 0
·a··· GLucosE .·
<> FRUCTOSE .
1.0 2.0
0 GLUCO~E a GLYCEROL
1.0 2.0
21
30 4.0 5.0 6.0 7.0 8.0 9.0 ·, 10.0 11.0 HOURS
3.0 .4.0 .. 5.0 6.0 7.0 8.0 9.0 · 10.0 11.0 HOURS
Figure 4. Growth of induced cells op glucose and on the inducing substrate. The experiment.was performed as descril;,ed for Figure 3 except that different carbon sources were used for growing cells •.
>-I-(/)
z w 0
_J <( (.)
I-a.. 0
>-1-
1.0
0.8
0.6
04
0.2
0.8
~. 0.6 w 0
..J 5 04 la.. 0
o GLUCOSE
t> SORBITOL
o GLUCOSE
. v MANNITOL
0 .2.1"\:.._~
1.0 2.0
23
3.0 4.0 5.0. 6.0 70 17.0 20.0 HOURS
Figu")'.'e 5. Growth of. induced . c1e.lls on glucose· and on the · inducing substrate. The experiment was.performeq as described .for Figure 3 except.that histidine was used for growit1g cells.
0.8 >I- . U)
~ 0.6 0
_J
<( u 04 · l-a.. 0
00
o GLUCOSE
A HISTIDINE
1.0 2.0
25
3.0. 4.0 5.0 6.0 70 HOURS
Figui::e 6. Loss . of · induced enzym~s .. in· the absence , of · sul::istrate,; Wild-type . cells . w~ri:? grown . in· minimal. medium containing 1. 0% carbon, sourGe and incubation w~s continued f9r twq hours·after growth ceased. Cells were harvested·and transferred.to fresh mediuiµ of the sa~e composition and also to glucose minimal medium. Optici:i.l·density was.recot;."ded.at 30 to 60.minu~e in~ervals~
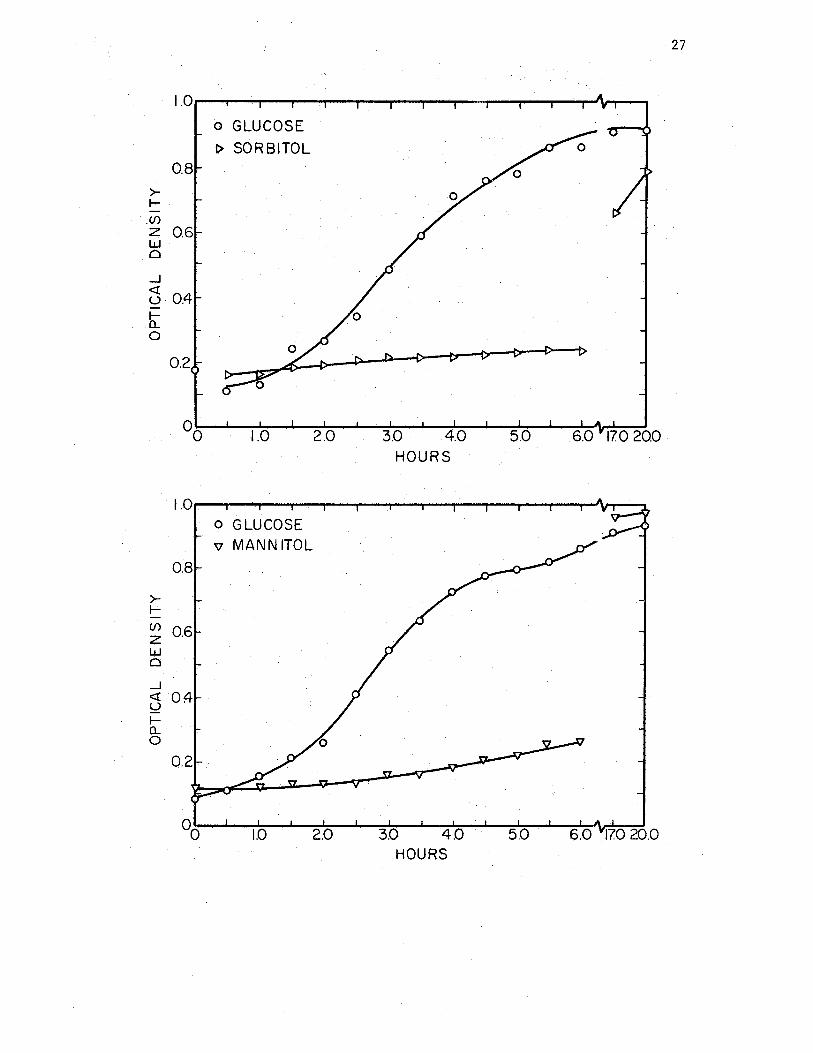
1.0
0 GLUCOSE
I> SORBITOL 0.8
>-t,.- .
_(/)
z 0.6 Lu . 0
....J <(
0.4 u t,.-Q_
0
0.2
oo __ _._ __ ..,_ _____ .,..__._ __ _,___... __ ..,.._ _______ ....... ____ ,._. __ ~ 1.0 2.0 3.0 4.0 · 5.0 6.0 170 20.0
>t,.-
008
(/) 0.6 z Lu 0
....J
5 04 I-Q_ .·
()
o GLUCOSE v MANN ITOL
HOURS
0o!""·---~w--'"'"!2~.0---3~.o-· __..._4~.o-· --5~.o--6~.o~-"'1~1.0~20.0
HOURS
27
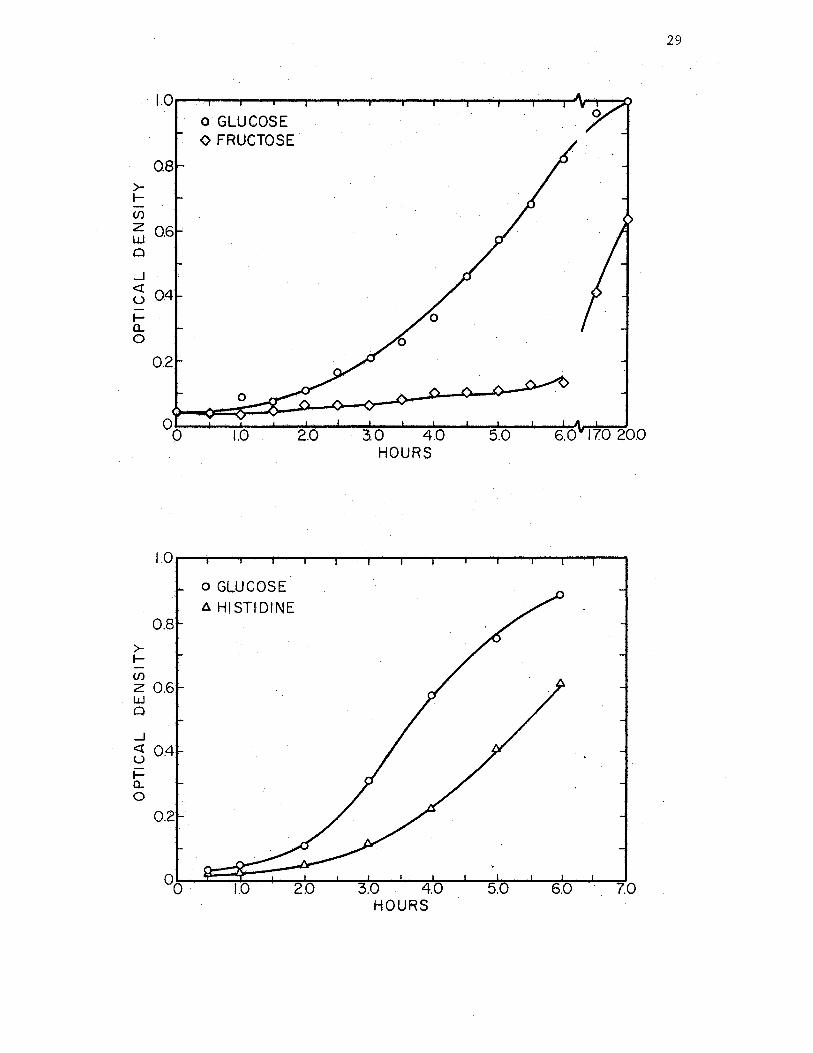
Figure 7. Loss.of induced enzymes 1 in the absence.of substrate. The experiment was performed as described for Figure 6.
0.8
-(/)
~ 0.6 0
_J
j 0.4 -l-o.. 0
0.2
o GLUCOSE <> FRUCTOSE
0o.\!!"" ___ _.Lo~· -~2~.0-· ...... -. '"'!!3~0~· --4~.o-......_~5~.o~-""!!"6.""'!to~17=0~20.o HOURS
1.0 ..... ----------------------
0.8
-(/)
z 0.6• I.LI C)
...J ..
j 0.4
ti: 0
0.2
o GLUCOSE 4. HISTIDINE
0oL.-.JE::!:::::::=:._--i. __ 3~.-......... -4~.o-·_..L,.......:5~.o-· -:i... .... 6~.o....-J.-.J.o HOURS
29
30
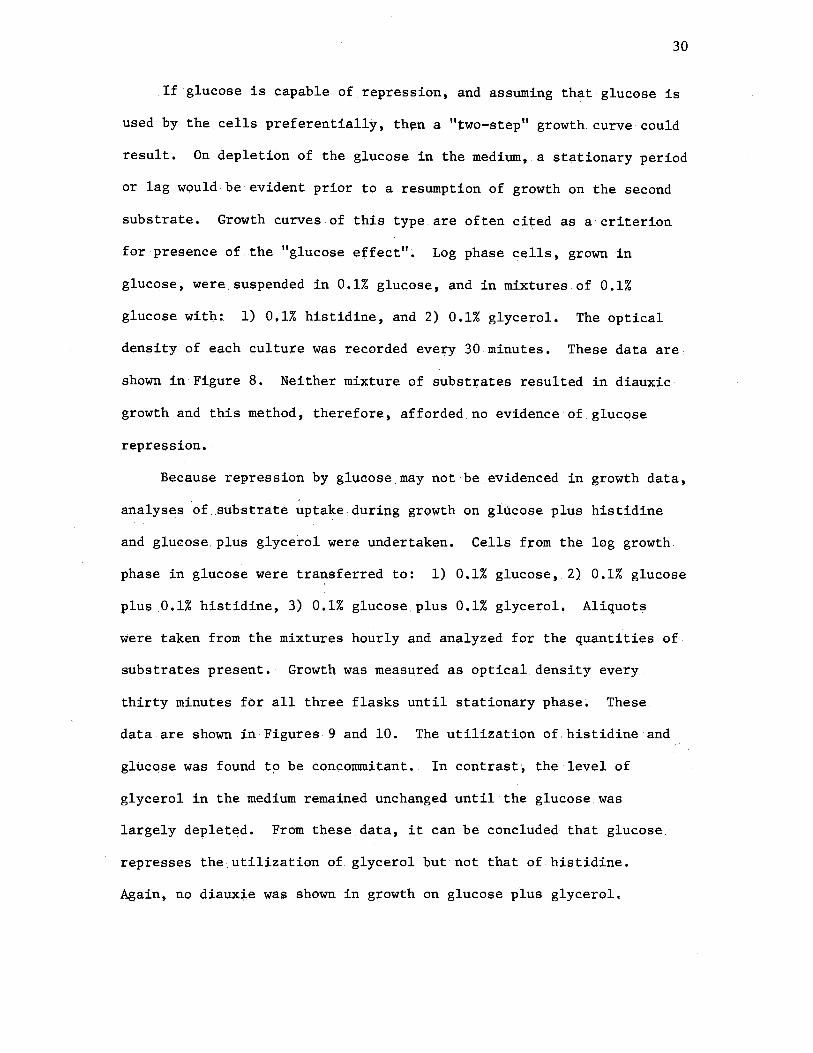
If glucose is capable of repression, and assuming that glucose is
used by the.cells preferentially, th1=n a "two-step" growth curve could
result. On depletion of the glucose in the medium, a stationary period
or lag would be evident prior to a resumption of growth on the second
substrate. Growth curves of this type are often cited as a criterion
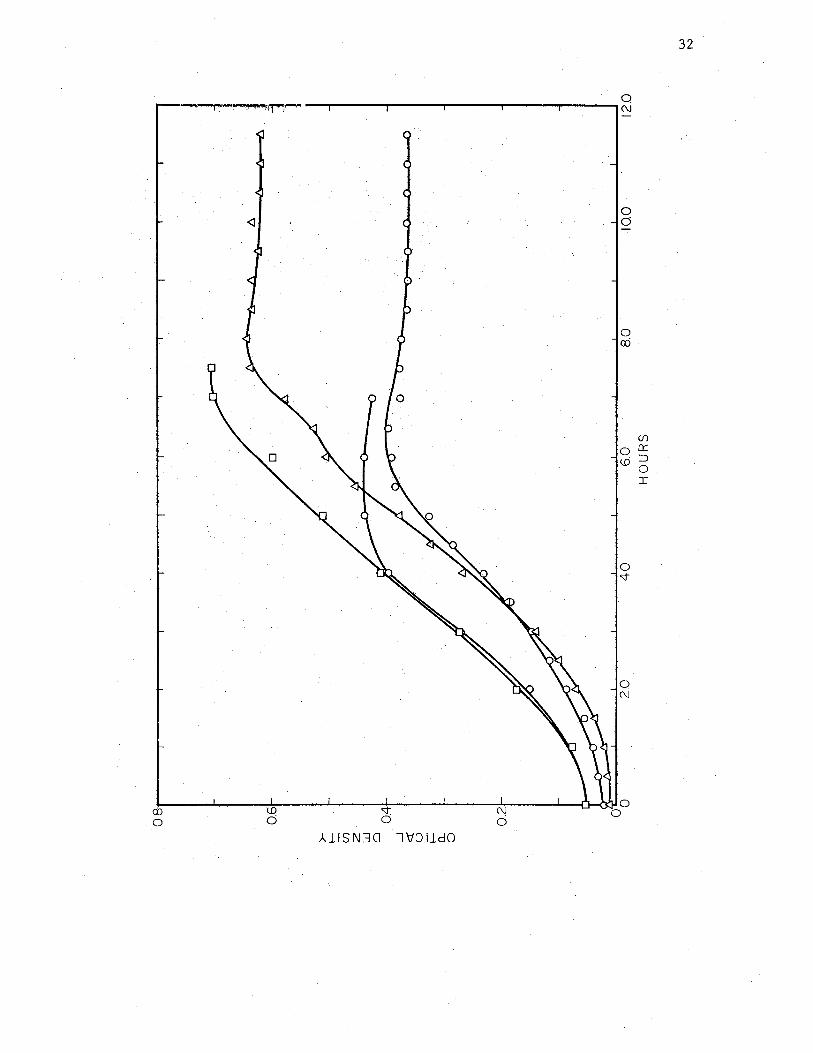
for·presence·of the "glucose effect". Log phase·cells, grown in.
glucose, were suspended in 0.1% gluGose, and in mixtures of 0.1%
glucose with: 1) 0.1% histidine, and 2) 0.1% glycerol. The optical
density of each culture was recorded every 30 minutes. These data are
shown in Figure 8. Neither mixture of substrates resulted in diauxic
growth and this method, therefore, afforded no evidence of glucose
repression.
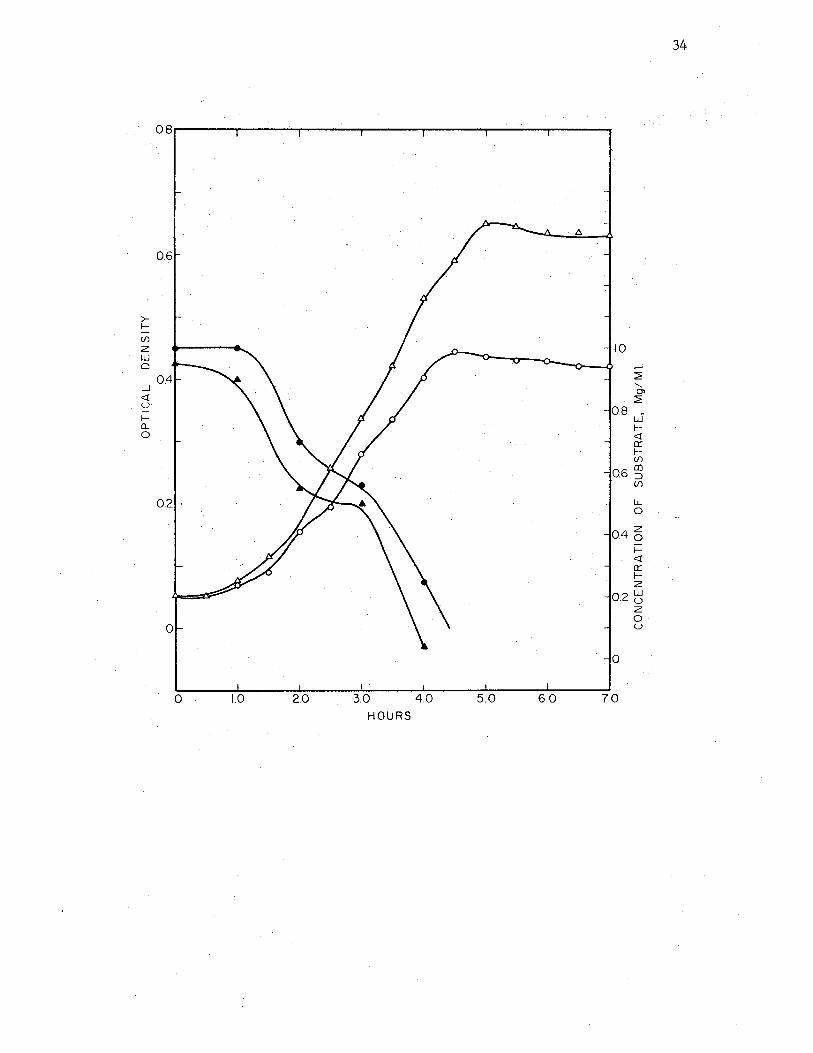
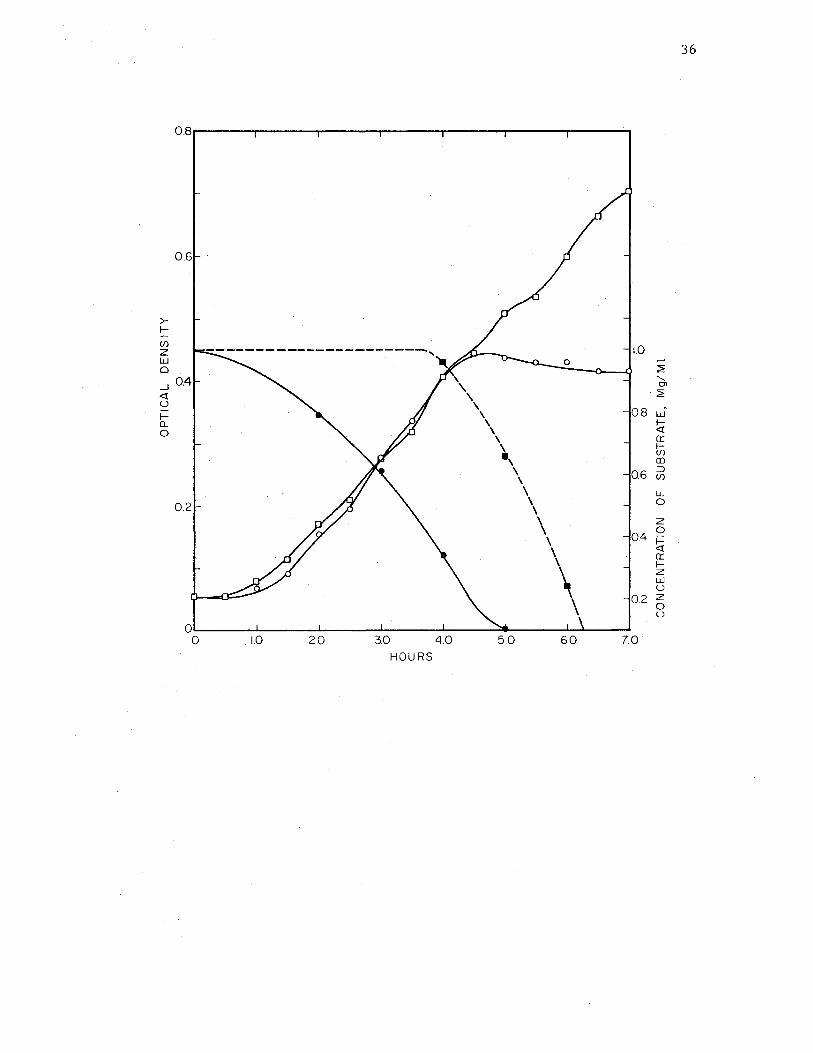
Because repression by glucose.may not·be.evidenced in growth data,
analyses of.substrate uptake during growth on glucose plus histidine
and glucose.plus glycerol were undertaken. Cells from the log growth
phase in glucose were transferred to: 1) 0.1% glucose, 2) 0.1% glucose
plus 0.1% histidine, 3) 0.1% glucose plus 0.1% glycerol. Aliquots
were taken from the mixtures hourly and analyzed for the quantities of
substrates present. Growth was measured as optical density every
thirty minutes for all three flasks until stationary phase~ These.
data are shown.inFigures 9·and 10. The utilization of.histidine and
glucose was found tp be conconunitant. In contrast, the level of
glycerol in the medium remained unchanged until the glucose was
largely depleted. From these data, it can be.concluded that glucose
represses the utilization of glycerol but not that of histidine.
Again, no diauxie was shown in growth on glucose plus glycerol •.
Figur:e 8. Growth on glucose and on. mixtures of substrates •. Wild-type cells were harvested during the log phase from glucose .minimal medium and resuspended in glucose.medium and in medium contain:i.ng glucose·combin~d with a second carbon source. Optical density was recorded at frequent intervals. Experiment 1: 0.1% glucose·(o); 0.1% glucose plus 0.1% glycerol (c). Experiment 2: 0.1% glucose (o); 0.1% glucose plus 0.1% histidine (A).
0 ~~·-....,....----,---.....-----------ru
0 0
0 cx:i
(/)
0 0: r.d ::::)
0 I
0 <;I'
0 N
~--...i...---~~--....1---~:-----'---~:-----'--CJ-<~O ~ w o~ ~ o o b o
J..11SN30 1\1:)lldO
32
Figure 9. Effect of glucose on utilization of.histidine by glucose~grown cells, Wild-type cells were harvested during the log phase from glucose minimal medium and inoculated into minimal media containing: (1) 0.1% glucose and (2) 0.1% glucose+ 0.1% histidine. Optical density was recorded for both f],asks hourly and sample$ were removed from the mixture and analyzed for glucose and histidine. Glucose concentration (e); histidine concentration(.&); optical density in.glucose alone (o); optical density in glucose plus histidine (A).
>I-(/)
z w 0
.....J <[ u la.. 0
0 1.0 2.0
·A
3.0 4.0 5.0 6.0 HOURS
....... ~
' C> ~
0.8 • w I<[ a:: IC/)
06 ~ (/)
LL 0
z 0.4 o
i== <[ . a:: 1-z
0.2 tj
0
7.0
z 0 u
34
Figure 10. Effect of glucose on utilization of glycerol by glucose-grown cells. The experiment was performed as described for histidine (Figure 9) except that the mixed substrate was composed of.0.1% glucose plus 0.1% glycerol. Glucose concentration (e) ; glycerol·. concentration(•); optical density in glucose alone (o); optical·density in glucose plus glycerol (ti).
>-1-
U)
z w 0
0.6
..J 04 <( u l-o.. 0
0.2
LO
\
20 3.0 4.0
HOURS
\ \
\
' ' ' \ •, \ \
5.0
' \ \ \ ' \
\ 6.0
1.0
0.8
06
04
0.2
7.0
36
2
" CJl
~
w I-<(
et: I-U) a)
::J U)
LL 0
z 0 i= <( et: I-z w u z 0 u
37
4. Inhibition EY_ Glucose
Because the degradation of glycerol had been shown to involve the
production of inducible enzymes that were sensitive to repression by
glucose, further investigations into the glycerol pathway were
initiated. Although glucose was seen to repress the formation of the
enzymes of the pathway, no evidence was available on the effect of
glucose on the activity of pre-formed enzyme.
To test the response to glucose addition of cells fully induced
to glycerol degradation, PA-1 was grown overnight from a small inoculum
in glycerol minimal medium. The culture was diluted with fresh
glycerol minimal medium and incubated to log phase. Cells were then
harvested by centrifugation, resuspended in one-fourth the original
volume of M-9 salts and used to inoculate six flasks with test tube
side-arms. One flask contained 0.25% glucose medium (glucose control)
and the other five contained 0.25% glycerol. Glucose was added to
one flask of glycerol medium at zero time and to the remaining three
flasks after one, two and three hours, respectively. The final
concentration of glucose in all cases was 0.25%. The fifth flask
containing glycerol was used as a control. All flasks were shaken at
37°, and at hourly intervals optical density was recorded and a
sample removed from each flask for determination of substrate
concentrations.
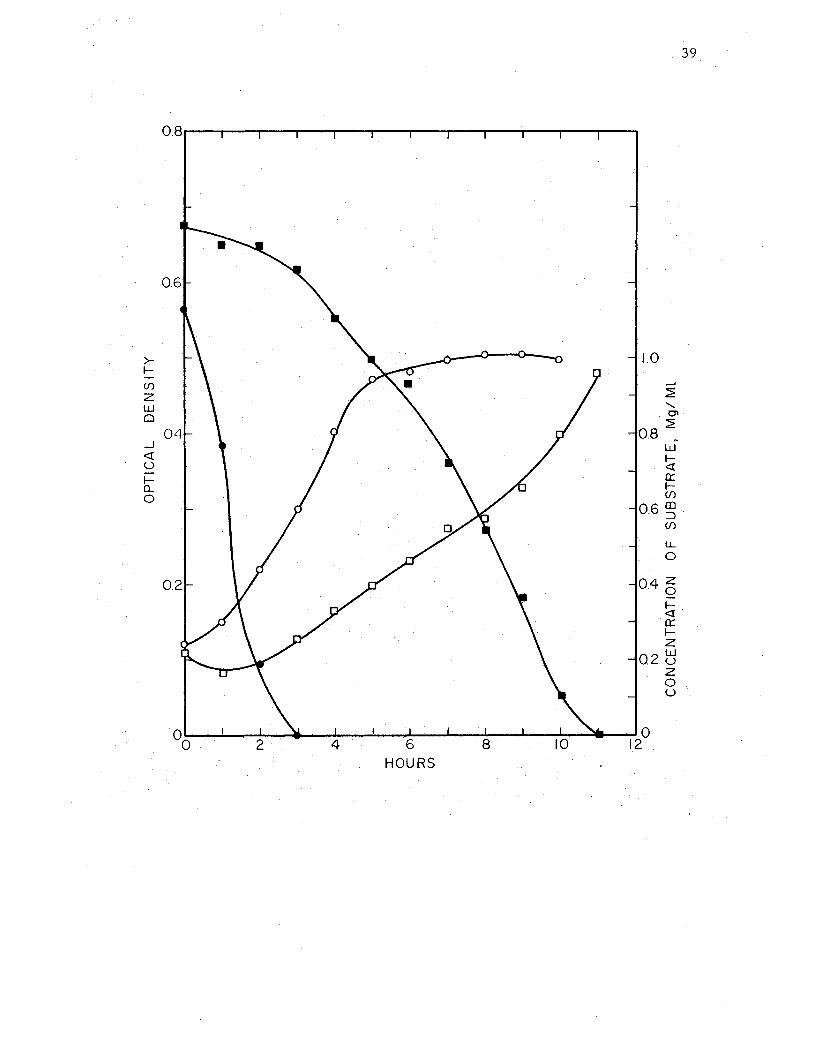
These data are shown in Figures 11 through 15. In Figure 11,
which shows the two control cultures, it may be seen that glycerol
grown cells utilize glucose much more rapidly than glycerol. Glucose
was depleted within 3 hours, whil~ 11 hours were required for complete
removal of glycerol. Figures 12 through 15 show the effect of
\
Figure llo Growth and substrate utilization by glyceroigrown cellso Wild-type cells were grown in glycerol minimal medium, .diluted into fresh glycerol medium, harvested during log phase and used to inoculate five flasks of glycerol minimal medium (Ool% glycerol) and one flask of glucose minimal medium (Ool% glucose)o Optical density was recorded for each flask hourly and samples were removed for determination of .substrate concentration. Data for control flasks.are shown.in this figure and for flasks receiving substrate mixtures in Figures 12 through 15. Optical density in glucose (o); optical density in glycerol (o); glucose concentration(•); glycerol concentration (a).
>-1-(/)
z w 0
_J
<! u lo... 0
2 4 6 HOURS
8 10
39
1.0
...... ~ .......
. Ol
0.8 ~~ w I-<! a:: I-(/)
0.6 ~, (/)
LL 0
0.4 6 I-<! a:: I-z w
0.2 u z 0 u
0 12
Figure·l2. Inhibition of glycerol utilization by glucose added at zero timE~. Glucose was added at zero time to one flask of glycerol medium to a concentration of 0.1%. Preparation of flasks was described for Figure 11. Optical density (o); glucose concentration(•); glycerol concentration (o).
41
>- 1.0 I-(/) ....... z 2 w .......
0 CJl
0.8 2
_J w <! I-u <! I- 0: 0... I-0
(/)
0.6 en ::::) (/)
LL 0
0.4 z 0
~ 0: I-z
0.2 ~ z 0 u
2 4 6 8 10 12°
HOURS
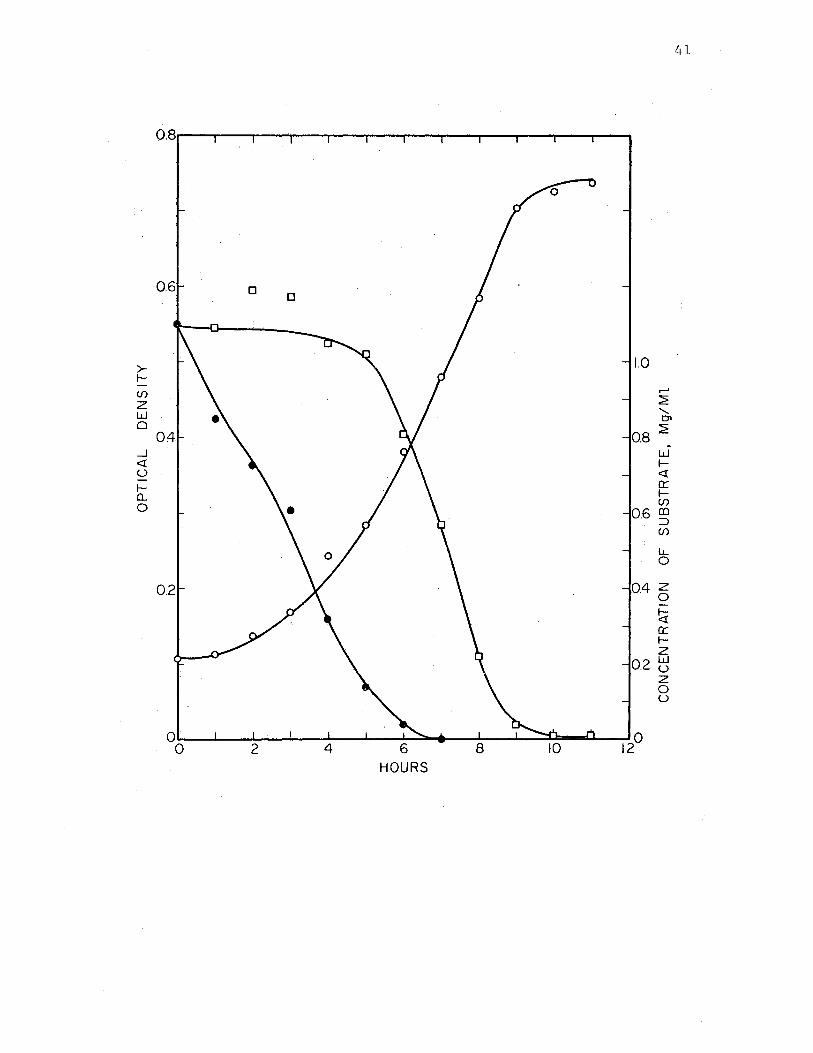
Figure 130 Inhibition of glycerol utilization added after one houro Glucose (Ool%) was added after one flask containing glycerol mediumo of flasks was described for Figure density Co); glucose concentration concentration (o).
by glucose
hour to a Preparation 11. Optical (•) ; glycerol
>r Cf)
z w
0.6
o 04 _J <[ 0 r a.. 0
0.2
HOURS
1.0
43
,.....,
~
' . Ol
0.8 ~ w r <[ er: r Cf)
0.6 en ::) Cf)
LL 0
0.4 z 0
~ er: r z
0.2 t5 z 0 0
Figure 14. Inhibition of glycerol utilization added after two hours. Glucose (0,1%) was added after two flask containing glycerol medium, of flasks .was described for Figure density (o); glucose concentration concentration (a),
by.glucose
hours to a Preparation 11. Optical (•); glycerol
45
0.8r-------------------------
>- 1.0 I-(/) -z ~ w t 0
0.4 0.8 ~ ..J w <[ I-u <[
I-0::
a. ln 0 CD
0.6:::, (/)
LL 0
0.2 . z 0.4 0
~ <[ 0:: I-.Z
0.2 ~ GLUCOSE z
ADDED 0 u.
00 2 4 6 8 10 12° HOURS
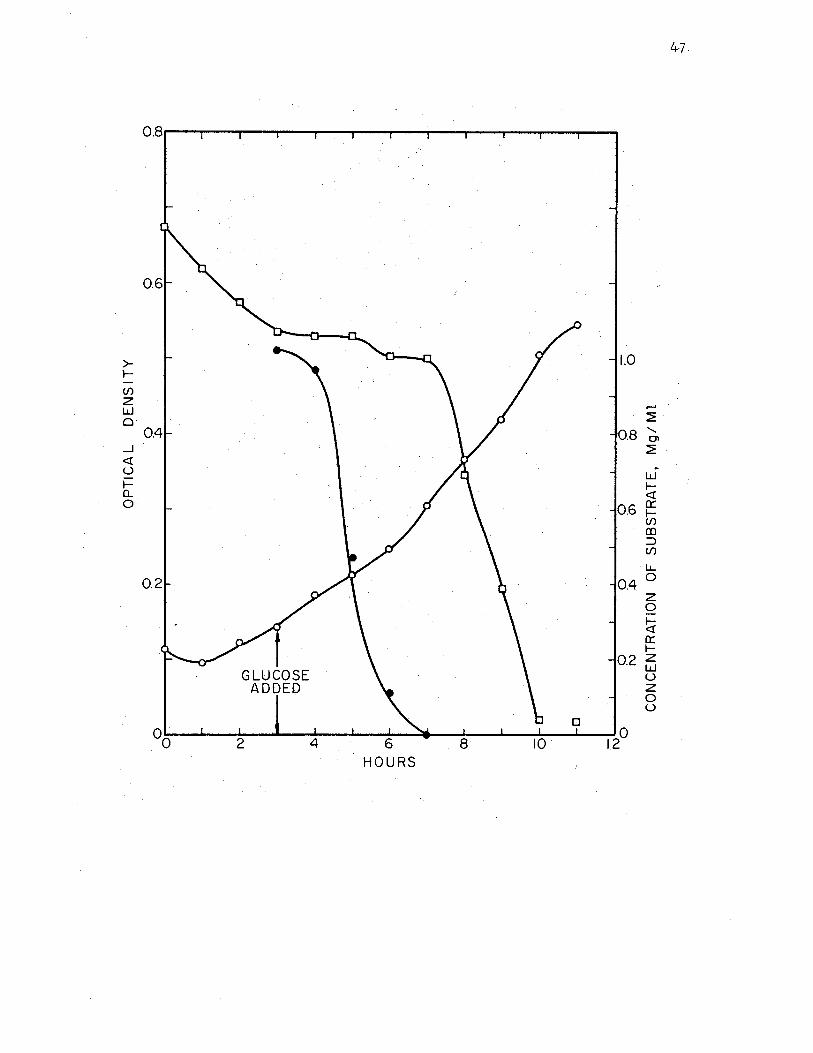
Figure 15. Inhibition of glycerol utilization by glucose added after three hourso Glucose (Ool%) was added after three hours to a flask containing glycerol medium" Preparation of flasks was described for Figure 11. Optical density (o); glucose concentration(•); glycerol concentration (D)o
4-7.
0.8r---...... --...--......---..,-.--...... --....... -----------------------~
>- 1.0 I-(/)
z .... w ~ Cl
0.4 0.8 ' °' ....J ~ <[ u w j:: I-a. <[ 0 0.6 0::
I-(/)
co ::> (/)
. LL
0.2 . 0 0.4
z 0
~ 0:: I-
GLUCOSE 0.2 ~
(.)
ADDED z 0 u
a 00 2 4 6 8 12°
HOURS
48
additiqn of ,glucose to cells fully adapted to growth on glycerol. In
each case, glycerol utilization wa,s promptly suspended upon addition of
glucose .and did not resume until a basal low level of glucose .had been
reached. This experiment clea,rly shows tha~ glucose .inhibits glycerol
utilization e~en though the .required enzymes have been fully induced.
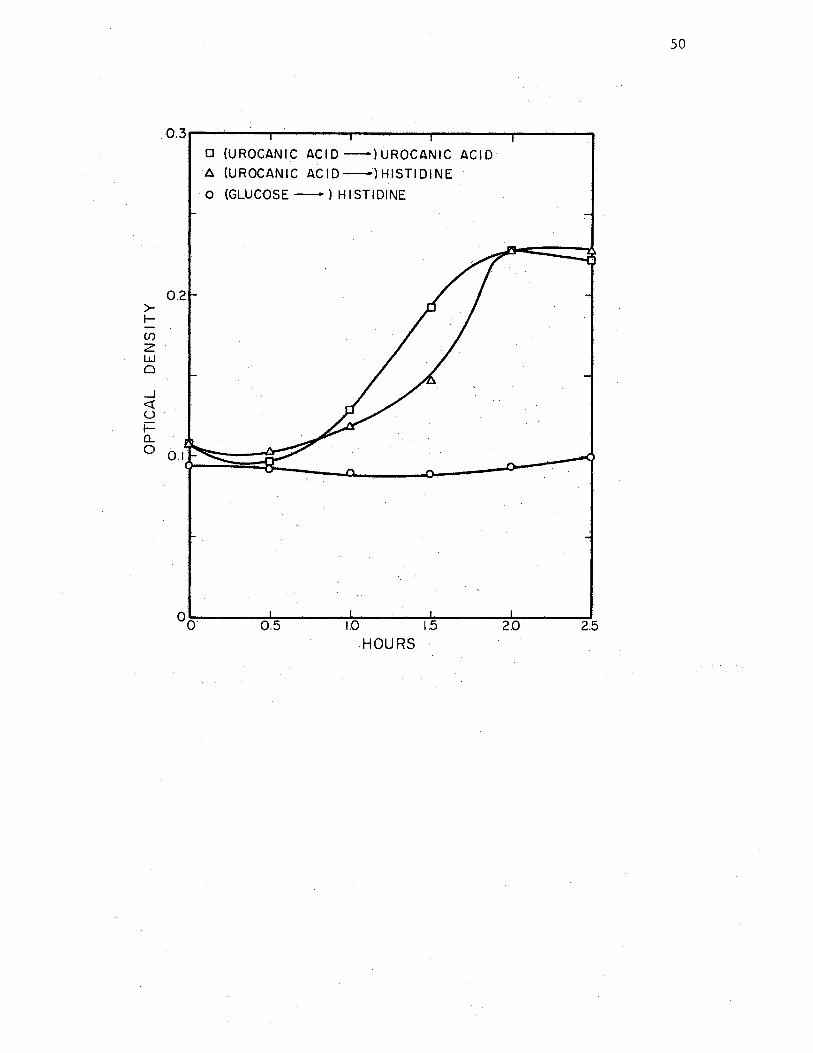
5. Induction of Histidine . Deg,radative Enzymes ·ll Urocani-e Acid
Urocanic .acid .has been shown ,to be .the true inducer of the enzymes
for histidine degradation in Aerobacter aerogenes (24). P. aeruginosa
was.tested for that·characteristic by growing cells to log phase in
urocanic aci4, resuspending the cells in histi,dine and . in urocanic aci,d
media, and comparing the course of growth for these organisms with the
growth of glucose-:-grown cells which .had been resuspended in .histidine.
Growth .curves are shown in Figure 16. No increase in cell density was
observed fqr the non-:-induced .culture during a 2.5 hour period of
. incubation. However, both.the urocanate .and histidine .cultµres '.which
had been previously grown on urocanate · res.urned growth within one .hour
at an .exponential rate. Therefore, it can be concluded that in P.:
aeruginosa, as in A. aerogenes, the enzymes for his ti.dine degradation
are induced by,urocanic ,acid.
B •· Glycerol Pathway. in .Pseudomonas aeruginosa
1. Glycerol Permease,.
A 100 ml cul,ture of PA,-1 i.n glycerol minimal.medium was grown for
15 hoµrs .and the ·log phase cells were c~ntrifuged, washed twice with
a minimal salts soluti,on, and suspended. in 10 ml of minim.al medium
containing glycerol a~ approximately 3 mg/ml., Samples (0. 5 ml) were
Figure 16. Induction of enzymes for histidin,e degradation by·urocal;}.:i,c·acid. Wild~type cells were grqwn to log phase in mi,nimal • medium contail;l.ing O ~ 5% uroca.nic, acid, harvested,, and. inoe1,ilated into minimal media containing ;urocEJ.ni.c '.acid, and histidine, respectively. Cells harves.ted . from. a log phase culture, in gluc.ose were simultaneoui:tlY inoculated into. histidine minimal. medium. . Optical density was recqrd.ed at 30-minute. _intervals.
>-1-(/"J
z w 0
_J
<t u lo.. 0
. 0,3,---._.;--..,....;---....----------;----..... D (UROCANIC ACID _:_)UROCANIC ACID
A (UROCANIC ACID-) HISTIDINE
o (GLUCOSE-) HISTIDINE
0.5 1.0 1.5
HOURS 2.0 2.5
50
51
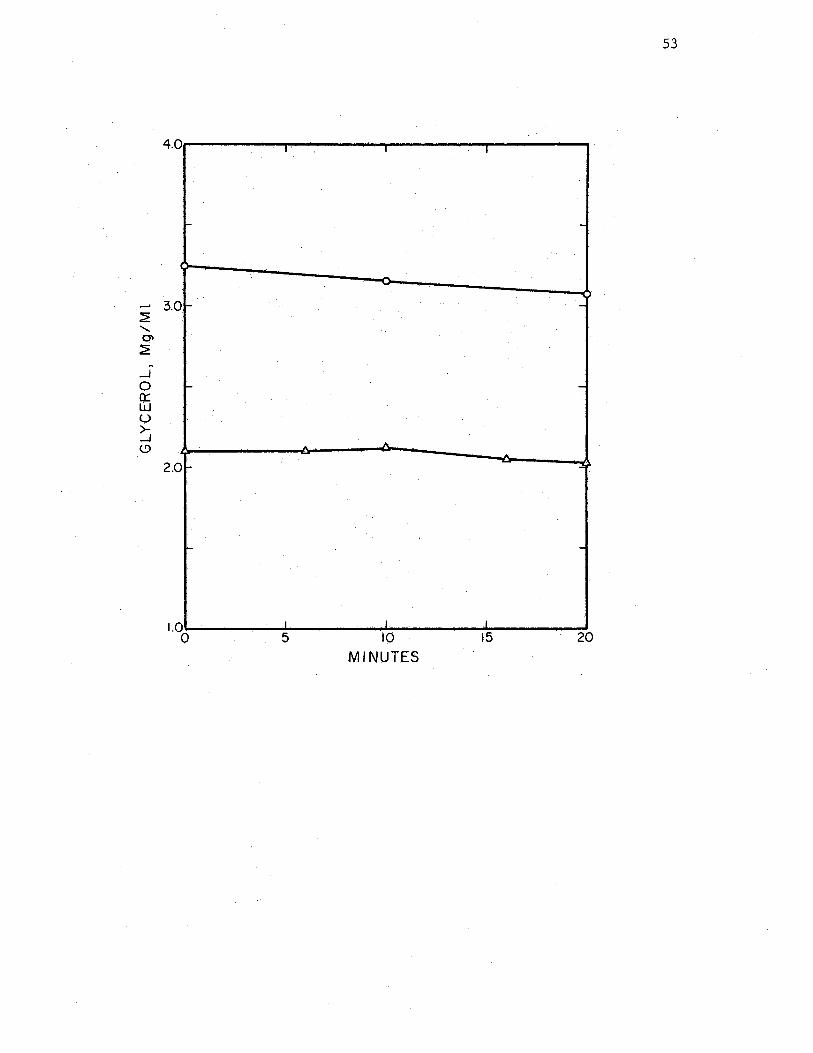
taken at zero, 10, and 20 minutes, and filtered immediately through a
Millipore filter. The samples were frozen until the time of assay for
glycerol content. The glycerol in the medium was found to have been
reduced from an original concentration of 3.25 mg/ml to 3.10 mg/ml
after 20 minutes.
In a second experiment using the same procedure, a 100 ml, 23-hour
log phase culture was concentrated into a 10 ml volume containing
glycerol at a slightly lower concentration of 2 mg/ml. As before, the
glycerol in the medium was seen to decrease by about 0.1 mg/ml during
the 20 minute period. Data fo+ both experiments are shown in Figure 17.
Since fully-induced cells were used in both experiments and essentially
no upta~e of glycerol occurred beyond that which might result from
simple diffusion, it may be concluded that there is no mechanism for
active concentration of glycerol in P. aeruginosa.
2. Growth .Q!!. ~-Glycerol Phosphate
Although the cell is generally considered to be impermeable to
the passage of phosphorylated compounds, a specific transport mechanism
for the uptake of ~-glycerol phosphate has been reported for
Escherichia coli (1°7). :eA-1 was tested for ability to grow on this
compound with negative results in all cases. Since or-glycerol
phosphate was shown in later experiments, described below, t,o be a
normal me.tabolite of glycerol in l.· aeruginosa, the inability of the
cells to use th:i,s ·compound for growth must be ascril;>ed to lac~ of
permeability.
Figure 17, Accumulation of glycerol by glycerol-grown cells. In Experiment 1, (o), a 15-hour log phase culture from glycerol minimal medium was harvested, washed, and resuspended in one-tenth the original volume of mtnimal medium containing glycer9l at a con~entration of ,3.25 mg/ml. Samples were removed, filtered and assayed for glycerol content. Experiment,2 (6) was similar except that· a.· 23-hour log phase culture was used and the initial concentration of glycerol was 2.1 mg/ml.
_J
0 0:: w u ~ <.!)
4.0
....
3.0 .....
...
2.0 -
-
1.0 0
I
..
I
5
I
-
-
..
I
10
MINUTES
l
I
15
53
-
.J
-
-
. - ..:
-
20
54
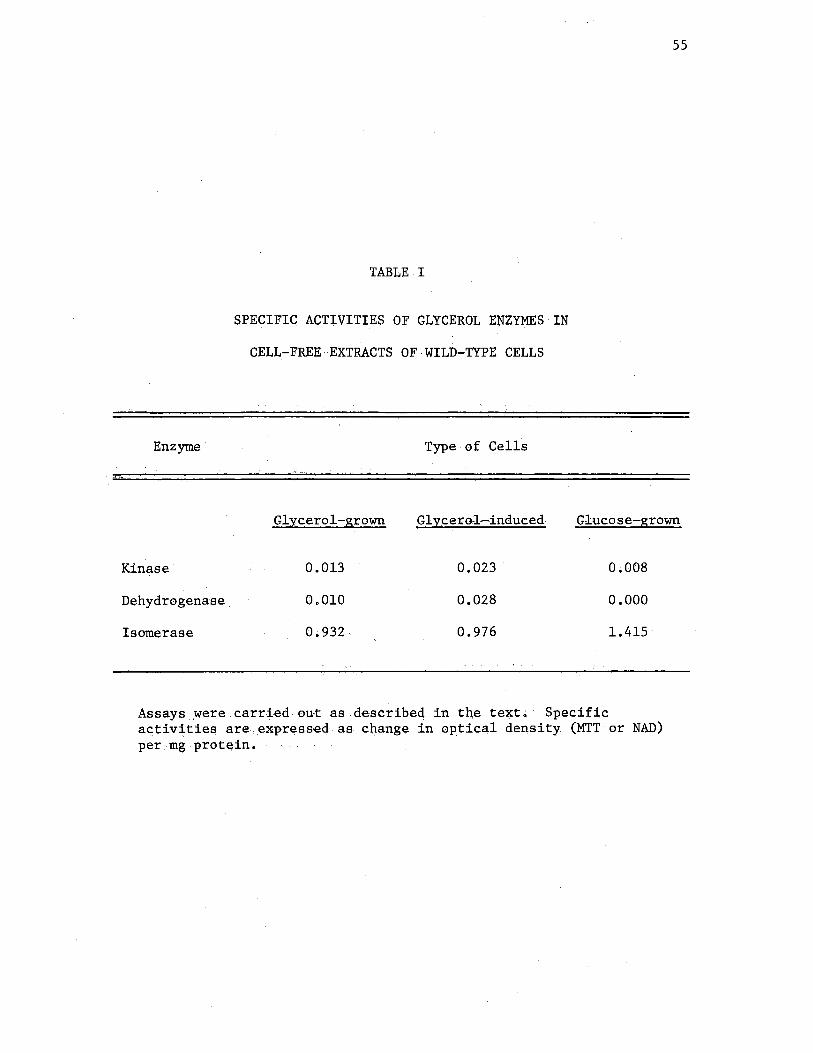
3. Enzyme Assays
The enzymes of the glycerol degradative pathway in PA-1 (wild
type) were assayed in extracts of cells which had been: 1) grown
solely on glucose, 2) grown solely on glycerol, and 3) grown on
glucose, then transferred to glycerol medium for a 4-hour period of
induction. Each extract was assayed for glycerol kinase,
(X-glycerophosphate dehydrogenase, and triose phosphate isomerase
activities. Enzyme activity levels for the three types of extract are
shown in Table I.
Substitution of NAD for the tetrazolium dye in the dehydrogenase
assay showed that no NAD-linked C(-glycerophosphate dehydrogenase
activity was present in either glucose- or glycerol-grown cells.
Based on these data, it may be concluded that the pathway for
glycerol catabolism in P. aeruginosa involves glycerol kinase, a
non-NAD-linked c(-glycerophosphate dehydrogenase, and triose phosphate
isomerase. This pathway is the same as that reported for_!. coli.
Only the dehydrogenase was shown to be completely absent in non-
induced cells. Growth on glyc;erol resulted in somewhat lower levels
of kinase and dehydrogenase than were found in cells grown on glucose
and induced by exposure to gl)l'cetol for four hours. Glycerol kinase
was not completely absent in non-induced cells, btitinduction with ,t
glycerol increased the level of this enzyme almost three-fold. No
evidence was obtained for induction of the triose phosphate isomerase
by glycerol. The activity of this enzyme was considerably higher than
those of the other two enzymes in all extracts, and the highest level
found occurred in glucose-grown cells. Therefore, it would appear
that this enzyme either is constitutive or is induced by growth on
55
TABLE·.I
SPECIFIC ACTIVITIES OF GLYCEROL ENZYMES IN
CELL-FREE·· EXTRACTS OF · WILD-TYPE CELLS
Enzyme Type·of Cells
Glycerol-grown Glycerol-induced Glucose-grown
Kinase 0.013 0.023 0.008
Dehydrogenase 0.010 0.028 0.000
Isomerase 0.932 0.976 1.415
Assays .were carried out as . described in tb,e text~ Specific activities are expressed as cliange in optical density (MTT or NAD) per mg protein.
56
glucose.
C. Isolation and Characterization of Mutants
1. Isolation of Glycerol Mutants
a. Direct Plate Method
On plates containing 800 to 1000 colonies on glycerol-glucose-
nitrosoguanidine agar, two distinct sizes of colony were noted.
Numerous pinpoint""-sized growths were observed among the larger wild
type colonies; 183 of these small colonies were picked for further
study. Each colony was transferred with an inoculating needle to
nutrient agar, glucose minimal agar and glycerol minimal agar. Of the
183 colonies tested, 56 grew on neither glucose nor glycerol.
b. Nitrosoguanidine and Penicillin
Several unsuccessful attempts at isolation of glycerol mutants
using nitrosoguanidine followed by penicillin selection prompted
investigation of the effectiveness of penicillin as a selective agent
and the optimal conditions for its use. One mutant organism which
was capable of growth on glucose but not on glycerol had been isolated
from prior sets of replica plates. A time study was run using this
mutant organism and the wild-type (PA-1) to determine the relative
mortality during treatment with penicillin. Both types of organism
were grown up in nutrient broth, incubated for 4 hours in saline to . 8
deplete the metabolic pool, suspended at a concentration of 1.5 x 10
cells/ml in 6 ml of 1% glycerol containing 189 mg of penicillin, and
incubated at 37° C with shaking. Samples were taken every 2 hours
57
and diluted for plate counts of viable cells. These data are shown in
Figure 18. As a.result of this experiment, an incubation time of five
hours was chosen for the penicillin step in subsequent experiments.
Using this technique, a total of 7 independent mutants were obtained
from replica plates of nitrosoguanidine and penicillin-treated cells.
2. Characterization o.f Glycerol Mutants
a. Growth Studies
Mutants which had been isolated as very small colonies from
nitrosoguanidine-containing plates (PA-1-623 through PA-1-678), were
found to be unable to grow on either glucose, glycerol, or a medium
containing both of these substrates. The addition of 0.02% yeast
extract to the three media, however, revealed that the organisms were
capable of growth on glucose to a level limited by the amount of yeast
extract added. Yeast extract did not allow the utilization of the
glycerol as carbon source. These mutants were further shown to require
added yeast extract to grow on any of the carbon soqrces which had
been tested originally with PA-1. In addition, the ability to grow on
sorbitol and on mannitol was lost even with yeast extract present.
PA-1 was checked for its ability to grow on the compounds te.sted at
the beginning o~ the research and was found to be unable to use
sorbitol, but growth on mannitol was the same as that previously
observed. The loss of the ability to grow on both glycerol and on
mannitol was therefore considered to be characteristic of these
mutants. These mutants, all of which had identical growth patterns,
were designated group II mutants.
Mutants which were obtained from replica plates (cells which had
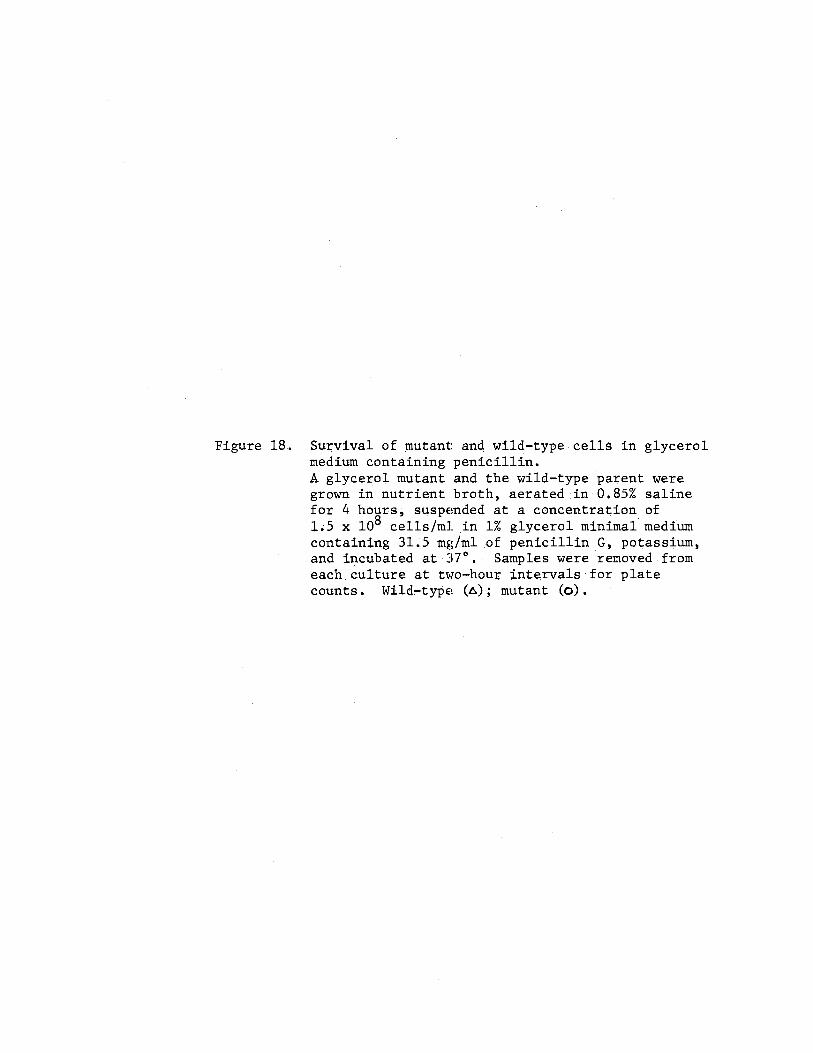
Figure 18~ Survival of mutant and wild-type cells in glycerol medium containing penicillin. A glycerol mutant and the wild-type parent were. grown in nutrient broth, aerated in 0.85% saline for.4 hours; st1spended at a concentration of LS x 108 cells/ml .in 1% glycerol minimai' medium containing 31~5 mg/ml of penicillin G, potassium, and incubated at 37° •. Samples were 'removed from each culture at two-hour int~rvals for plate counts. Wild~type (6); mutant (o).
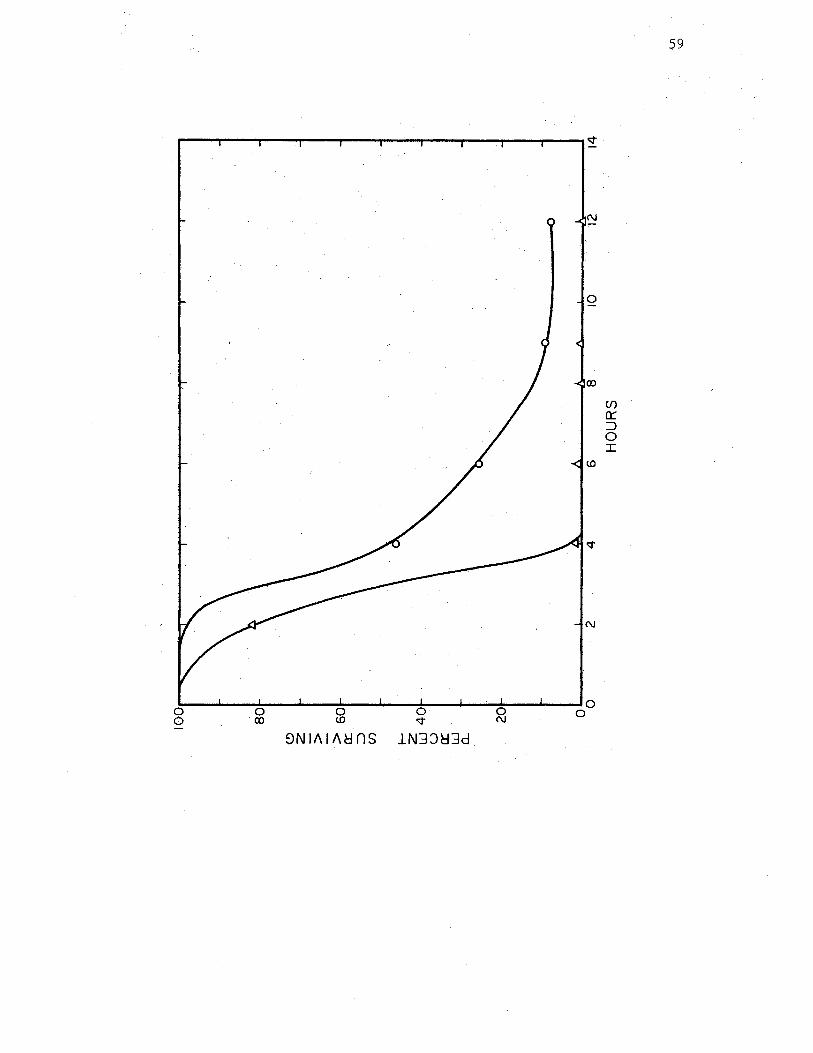
59
0
..,._ _________________________________________ _,o
0 0 0 0 0 O 0 00 W ~ N
~NIAIA~ns 1N3J~3d
60
been treated with both nitrosoguanidine and penicillin) grew readily on
glucose but were unable to grow on glycerol. These mutants were
designated group I mutants.
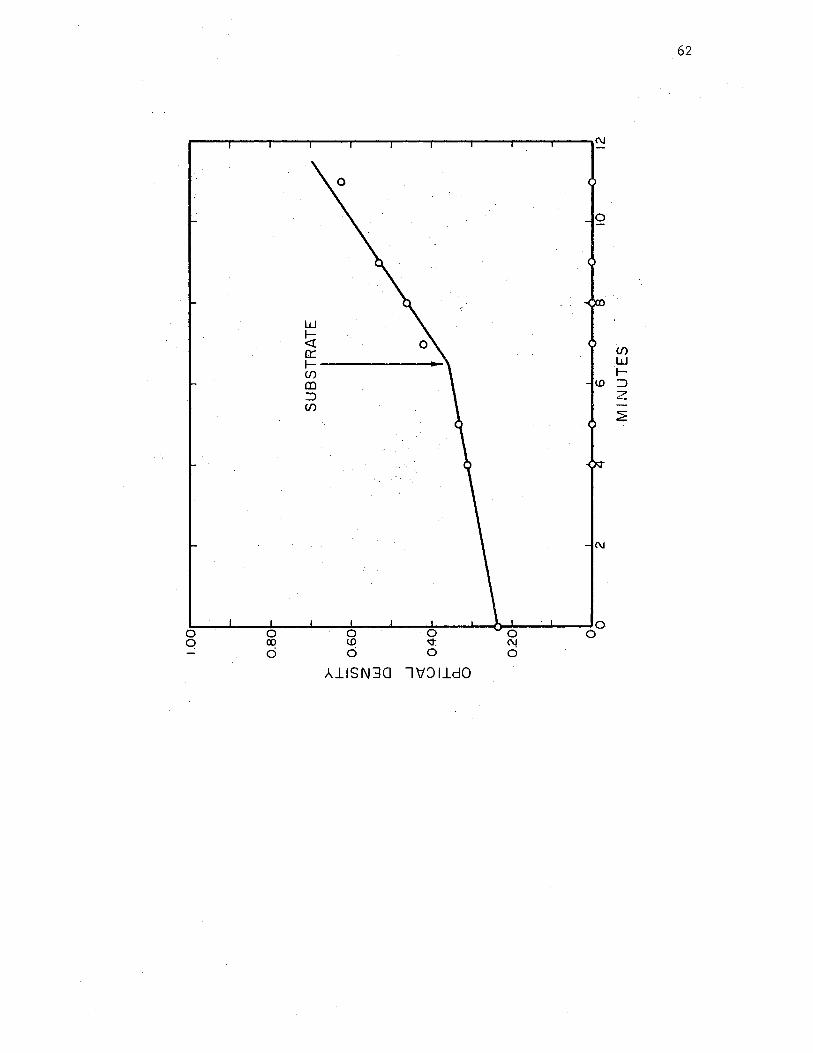
b. Enzyme Studies R!!h, Whole Cells
Four mutants from group I were tested for the presence of
c.r-glycerophosphate dehydrogenase. Preparations of whole cells which
had been specially treated as described before were used in the assays.
One of these failed to show dehydrogenase activity by this method.
The other three preparations showed marked increases in rate of dye
reduction, on the addition of substrate, for the induced cells
relative to the glucose-grown cells. The optical density readings for
one mµtant, C, are shown in Figure 19. Similar results were obtained
with mutants E and 20 of group I. Mutant F had no dehydrogenase
activity, as measured by this method.
c. Enzyme Studies With Cell Extracts ~--
Extracts were prepared from one mutant of each group. Since all
the mutants of group I had appreciable rates of reversion to wild
type, only mutant E was used for enzyme studies. This mutant was
chosen because its rate of reversion was the lowest of the group as
judged by numbers of colonies obtained from glucose-grown cells plated
on glycerol minimal agar. Only one mutant of group II was studied
because it appeared that all these mutants possessed identical
defects.
The enzyme activities measured in extracts of these two mutants
are given in _Table II. Neither of the extracts examined was found to
Figure •. 19 ~ Measu:t;"ement · of :{X-glycerophosphate dehydrogenase · activity in whole cells. Mutant C (group II) was prepare(! as described in the text by growth on glucose, induction of·onehalf the cells with glycerol, washing and storage.· in ice-cold distilled water·. to remove. endogettol!,s·sul?strates .and freezing tQ inci::ease permeability. Dehydrogenase activity was measured as reduction of MTT before, .and after addition of substrate, 0(-glycerophosphate. The non-,.induced portion of the ,culture, similarly treated, served as a control.· The optical density o~ the control remained at 0.0 throughout · the. experiment.
62
w ~ a::: Cl)
f- w Cl) f-(I) Y) :::)
:::) ~ Cl)
~
Al1SN30 1'1:>lldO
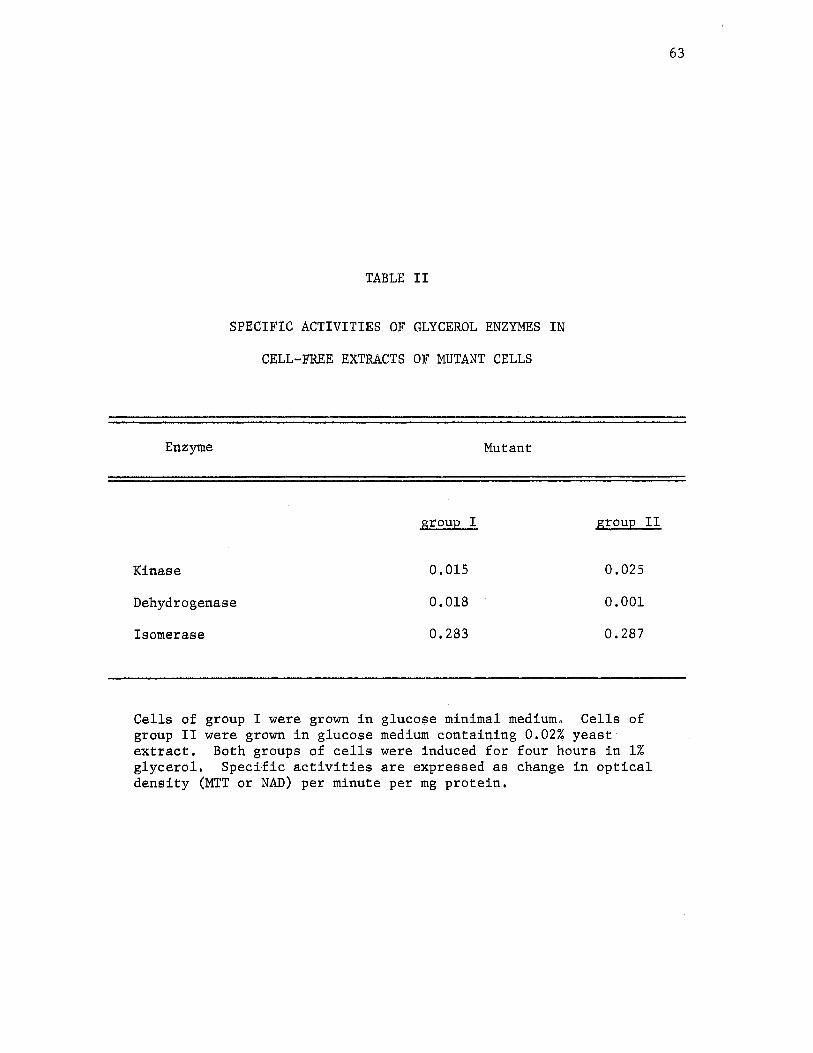
TABLE II
SPECIFIC ACTIVITIES OF GLYCEROL ENZYMES IN
CELL-FREE EXTRACTS OF MUTANT CELLS
Enzyme Mutant
group I group II
Kinase 0.015 0.025
Dehydrogenase 0.018 0.001
Isomerase 0.283 0.287
Cells of group I were grown in glucose minimal medium, Cells of group II were grown in glucose medium containing 0.02% yeast extract, Both groups of cells were induced for four hours in 1% glycerol. Specific activities are expressed as change in optical density (MTT or NAD) per minute per mg protein.
63
64
lack glycerol kinase activity. Both the extract that was prepared from
a replica plate isolate (group I mutant) and the extract of a yeast
extract-requiring organism (group II mutant) showed enzyme activities
about equal to the wild type glycerol-grown or glycerol-induced
extracts. Only the extract from the group II mutant was shown to lack
appreciablec:(-glycerophosphate dehydrogenase activity. The activity of
the other mutant extract was intermediate between that of the glycerol-
grown and the induced wild type extractso The extracts from both
groups of mutants were shown to have a basal level of isomerase
activity which was significantly lower than the enzyme activity
observed for the wild type.
3. Transduction Studies
The organisms of group I yielded plate stocks with·titers of 1010
11 ( to 10 phage/ml. Attempts to prepare plate stocks of the organisms
of group II were unsuccessful. Although all plates were prepared
simultaneously, using the same media and phage suspension, no lysis
occurred on plates containing any of five mutants from group II.
Therefore, it was not possible to study transduction between the two
groups of mutants.
Transduction studies were done between the members of group I,
each mutant being treated with phage obtained from the other mutants
of the group. The frequency of reversion to wild type growth was
observed to be very high, making it impossible to determine whether
transduction had occurred. The number of colonies observed within
the area where phage had been applied was about equal to the number of
revertants in other areas of the plateso Control plates using a
non-reverting auxotrophic mutant gave excellent results, indicating
that the phage stocks used were capable of transduction.
D, Susceptibility to Phage
The initial attempt to prepare plate stocks of group II mutants
showed that no lysis of cells occurr.ed with treatment with E-l ·PA-1.
Twelve other strains of phage were tested for their ability to lyse
two group II mutants and also a group I mutant. Eleven of the twelve
phage were seen to lyse the group I organism, but none of these were
observed to lyse either of the group II organisms.
The lack of susceptibility of the group II mutants to phage
suggested a possible aberration of the cell wall structure which
65
could be related to the use of glycerol as a biosynthetic component.
Hauser and Karnovsky (25) have shown that glycerol is a precursor in
the formation of rhamnose, and that fructose is an intermediate in
that biosynthetic pathway. Furthermore, rhamnose has been found to be
an integral component of the cell wall mucopeptide in Pseudomonas
aeruginosa (26), Rhamnose and fructose were both checked to determine
if the presence of these substrates in the growth medium could support
growth of the mutants in the same manner as added yeast extract. The
mutants were inoculated into:
1) 0.4% fructose
2) 0.2% fructose + 0.2% glycerol
3) 0.4% fructose + 0.02% yeast extract
4) 0.2% fructose + 0.2% glucose
5) 0.4% rhamnose
6) 0.2% rhamnose + 0.2% glycerol
66
7) 0,4% rhamnose + 0,02% yeast extract
8) 0,2% rhamnose + 0,2% glucose
Of these media, only the fructose plus yeast extract was observed to
allow growtho The wild type (PA-1) was also shown to be unable to use
rhamnose as carbon source, The possibility that rhamnose may be
involved in the phenomenon has not been excluded, however, because no
data are yet available concerning the permeability of the cells to
that substrate, Preliminary data have been dbtained for non-adsorption
of phage to the mutants, revealing a relative resistance as compared
to the wild type cello
. ·"··
CHAPTER IV
DISCUSSION
In general, the data obtained in these studies support the
conclusion that P, aeruginosa is subject to control mechanisms for
catabolic pathways of the same types as those found in E. coli.
Growth data obtained under three different conditions for several
carbon sources indicate that pathways for these compounds are subject
to genetic repression; i.e., the enzymes are not formed except in the
presence of an inducer. The long induction periods required for growth
of glucose-grown cells on other carbon sources (Figure 2), the
immediate utilization of these same compounds by induced cells
(Figures 3, 4 and 5) and the loss of induced enzymes after exhaustion
of substrate (Figures 6 and 7) are evidence for genetic repression.
Failure of glucose-grown cells to utilize glycerol in the presence of
glucose is presumptive evidence for catabolite repression, or the
"glucose effect". A newer control mechanism, inhibition of glycerol
utilization by glucose in cells fully-induced by glycerol, was also
demonstrated ..
The two phenomena, repression by glucose and inhibition by
glucose, are difficult to distinguish experimentally. Both mechanisms
are seen to prevent the normal utilization of specific substrates in
the presence of glucose. The differentiation of the two mechanisms
has been somewhat complicated recently by a report that diauxic growth
67
68
of_!. coli on glucose and lactose is caused by interference·of glucose
with the uptake of lactose; tqus reducing the internal concentration of
inducer. (27) o
The data for uptake of histidine from a glucose-histidine mixture
clearly show that neither mechanism affects histidine catabolism in
PA-1. In contrast, Lessie and Neidhardt ,(28) have found the histidine
pathway of another strain of the same·organism to.be quite sensitive
to repression by glucose or by succinate~
Glucose·was effective in.preventing the dissimil,ation of glycerol
by f.. aeruginosa, strain 1, in all cases. The abrupt halt·in uptake of
glycerol by induced cells on the addition of glucose possibly implies
that the enzyme, glycerol kinase, had been rendered inactive. Glycerol
was shown not to be actively transported into the cell at a.rate
greater than that of free diffusion. The rate of uptake of glycerol
prior to addition of glucose, therefore, probably represents the rate
of·one-way diffusion of glycerol into.the cells where phosphorylation
by glycerol kinase prevents its exito The uptake of glycerol would
continue at a constant rate per cell in the presence of the.active
kinase. Very low levels of glucose were seen to prevent.the use of
glycerol. If competitive uptake.of the substrates were involved to a
significant degree,.some evidence of increased glycerol uptake should
have become increasingly apparent at these low levels of glucose.
The uptake data which were obtained for non-induced cells growing
in a mixture of glucose. and glycerol are· typ!i.cal of ·. the results which·
have been cited as evidence of.glucose repression by many different
investigators. Some of.these investigators have also corroborated·
their uptake data by specific enzyme analyses, demonstrating the
absence of the repressed enzyme during the metabolism of glucose.
Such assays were not carried out in the present studyo
69
Since it does not appear that in R.~ aeruginosa, strain 1, a
permease is involved in glycerol accumulation, prevention of induction
by a hindrance of glycerol accumulation,~ se, appears unlikely. In
view of the other data obtained, another explanation for the "glucose
effect" can be advancedo The glycerol enzymes (or at least one.
required step in glycerol utilization) are clearly subject to
inhibition by glucoseo This inhibitory effect of glucose would prevent
the detection of any induced enzymes of the glycerol pathway until the
glucose had been depletedo The possibility exists that induction by
'glycerol is not prevented by glucose; instead, the enzymes are
synthesized normally but are rendered inactive until the metabolism of
glucose ceases. Considerable further study will be required to
clarify the exact mechanism involvedo
The absence of a discreet lag period between the time at which
glucose is depleted from the medium and the observed uptake of glycerol
indicates that the induction of the glycerol enzymes must be very
rapid if true repression of enzyme synthesis had occurred during
glucose metabolism.
The pathway of glycerol dissimilation in R_o aeruginosa, strain 1,
was found to involve the.same intermediates as in aerobically-grown
!_. aerogenes strain 1041 or 1033 and.§_. coli strain KlO. Both of
these organisms differ, however, in certain aspects of.their treatment
of glycerol from the strain of R_. aeruginosa used in this study. The
NAD-linked pathway of anaerobically-grown!_. aerogenes strain 1033
may be considered absent in PA-1 as in E. coli and A. aerogenes
70
strain 1041; since no redu~tion of NAD was observe4 in f~lly induced
cell-extracts, The· formation of dihydroxyacetone by an NAD-linked
glycerol dehydrogenase·and the.participation of NAD in.the oxidation of
0(-glycerophosphate were e~cluded as possible rouies of metabol:l..sm by
testing .the cell extracts for their c~pacity to reduce NAD on·the
addition of 0(-glycerophosphate or glycerol as substrate~
];_. coli differs from PA:-1 in its ability to. transport Of-glycero
phosphate into the cell~ Both organisms.are impermeable to 4'-glycero
phosphate by free diffusion; therefore, PA-1 may be considered to trap
glycerol on its diffusion into the cell in the same manner.as has been
noted for·];_~ coli. In ];_.· coli 7 the glycerophosphate · pe:i;:mease and
dehydrogenase;. and· glycerol kinase . are induce.d by growth'. on, either
tr-glycerophosphate or glycerol. In.mutant cells which .lacked the
glycerol kinase, howeyer, glycerol was ineffective as an inducer, but
~-glycerophosphate induced both the permease and. the dehydrogenase
(11), Since,no mutants were obtqined during the present research
which lacked·glycerol kinase·activityt it is not·possible·to.speculate
as to whether the true inducer for the pathway is glycerol, or whether
the enzym~s·are induced.bylX'--glycerophosphate a~ in E.coli. The lack
of ,a transport system for C(-glycerophosphate would seem to preclude
any direct advantage to tqe cell of such.a mechanism of,induction. ·
The isomerase data obtained for the wild~type cell extracts show
little significant·difference,between the induced and non-:1..nduced
cells. Constitutive synthesis of the isomerase could account for this
cqndi~ion, Alternatively, the high levels of enzyme formed during
both cond:l..tions of:growth could be explained by induction by.glucose
and by.glycerol. The·latter possibility cannot be excluded since no.
71
data are· available for this enzyme during growth on substrates which
are not degraded by the glycolytic route. Furthermore~ the data do
not preclude the possibility that two isomerase enzymes are present in
this organism, one enzyme, formed during growth on glucose, mediating
the conversion of glyceraldehyde-3-phosphate to dihydro~yacetone
phosphateand a second enzyme mediating the reverse of that reaction,.
which is specifically inducible by glycerol.. Although the isomerase
reaction is normally considered to be reversibly mediated by a single
enzyme, the peculiar pathway.for glucose degradation in Pseudomonads
gives the isomerase step two distinct functions, one.anabolic and
another catabolic, depending on the substrate being metabolizedo
Separate enzymes are synthesized for.other reactions of intermediary
metabolism which function in both synthesis and catabolism (29).
Therefore, teleonomic·reasons may be seen which could give credence to
the possibility that special control mechanisms may have evolved for
this organismo Breakdown of glucose via the Entner-Doudoroff pathway
does not involve the formation of dihydroxyacetone phosphate; instead,
glyceraldehyde phosphate and pyruvate are formed directly from
cleavage of a six-carbon precursor (Figure 1). During growth on
glucose, therefore, biosynthesis of triglyceride and any other
derivative of glycerophosphate would be dependent on the formation of.
dihydroxyacetone phosphate and its subsequent conversion to glycero
phosphate;, Because glycerophosphate is readily available to the cell
during catabolism of glycerol, the isomerase step would have the.
single function of shuttling dihydro~yacetone phosphate into the
mainstream of glycolysis.
Dihydroxyacetone.phosphate was.not specifically tested as a.
72,
substrate with cell extracts. However, the assay method used required
that dihydroxyacetone phosphat;:e·be produced.from glyceraldehyde~3~
phosphate·by an isomerase present in the extract~ If two distinct
isomerases:are formed by the cell, the·en~yme.measured 1need.not have
been induced by.glycerol, since the highest levels were observed in,
glucose-grown extracts. This explanation appears.· improbable; however,
since,cells grown on.glycerol possessed high levels of isomerase·when
measured in.the same way.·
The low level of ,isomerase activity for both extracts.prepared
from mutants deserves particular attention. If the isomerase is
cqnstitut~ve or is inducible by either glucose.or glycerol, the low
activity could be,due to production of an altered enzyme molecule. If
there.are two isomerases, one.inducible by glucose·and the other by
glycerol, the activities measured in the mutant extracts may represent
residual glucose~induced enzyme.which had been formed during growth of
the cells on glucose.prior to a four~hour period of induction by,
glycerol. In the latter case, the glycerol-induced isomerase could be
completely absent and this could explain the inability of the two
mutants to grow on glycerol •. If a single constitutive, reversible.
isomerase is produced, then it must be assumed t~at the level of
activity measure~ in the group I m~tant is inadequate to produce a
rate of growth sufficient to sustain viability when glycerol is the
sole carbon source. If a single enzyme, inducible by_either glucose
or glycerol is involved, then the mutation could have occurred in the
regulator gene; producing a repressor insensitive to glycerol, thus
preventing growth.on glycerol but allowing growth on glucose. In
this c~se as well, the activity measured would represent residual
73
glucose.;.induced enzyme.· Genetic studies and extensive purification of
the enzyme produced under different conditions of growth will be
required to distinguish between these possibilities • ... ,.-.··-
The resistance of group II mutants t9 infection by.phages capable
of attacking the wild-type, PA-1, and mutants.of group I.is of.consider-:
able int~rest. · Preliminary data (R. R. Green, personal .. communication)
indicate that the phage are not.adsorbed by group II mutants. Since
adsorption depends upon the presence of specific.sites in the cell
wall, these mutants may be assumed to have an altered cell wall. This
alteration does not affect viability since.cells grow quite well in
media in which phage adsorption does not occur. It is possible that
the alteration in the cell wall is the result of a second.mutation
distinct.from that involved in ability to grow on glycerol. However,
the occurrence of a nutp.ber of apparently identical, independent, ·
double mutations seems less likely.than the occurrence of a single
mutation affecting both glycerol utilization and cell wall composition
or structure •. The most obvious explanation for such a single mutation
is a requirement for glycerol or a product formed.from it in cell wall
synthesis. A glycerol-containing teichoic acid would present one
possibility but these have not been reported inf.. aeruginosa to our
knowledge. Triglycerides or other glycerol-containing lipids may also
be components of the cell wall and these.compounds could be.involved
in phage·adsorption. · Based on present knowledge of the cell wall of
R_. aeruginosa, it appeared quite possible that rhamnose might.be the
compound involved in the cell wall alteration. Both Collins (30) and
Eagon and Carson (26) have reported that rhamnose is a component of
the cell wall of P. a~ruginosa, although neither.has specified its
74
exact· locatiot).. · Since rhamnose is a component of the .. lipopolysacclla
ride layer. in Salmonella typhimurium (31) and.· a rhamnose-contai11-ing
lipid.is.produced.in·la~ge quantities by P. aeruginosa growing on.
glycerol or fructos.e (25), it is poss:Lble. that: .rhamnose. occul;'s in a
lipopolysaccharic;le·layer.in the wall.of P. aeruginosa. This.layer, in·
E. coli, contains sites.for adsorption of phages T3;.T4·and T7 (32).
Hauser and Karnovsky (25) showed.by labelling studies that·glycerol is
the prec~rsor for rhamnose.synthesis inf.. aeruginosa, and.that
fructose is an intermediate in the pathway •. Neither fructose nor
rhamnose was capable of replacing the yeast extract requirement of
group. II mutants for growth·. on glucose, nor did they promote growth on
glycerol. This does not preclude the,poss:Lbility that rhamnose is the
compound.involved in phage.sensitivity, sine~ the.cell.wall.alteration
may have no effect on growth; i .• e., tl).e two phenomena may have a
common,origin in.glycerol metabolism but may.result from effects on.
different pathways of utilization of :glycerol for synthesis .. of· cell
components~ The· fact.· that these mut~nts. lack (X-glycerophosphate
dehydrogenase;, but have· glycerol kinase. activity, · would tend to . ··
indicate that rhamnose, rather than.glycerol~lipids,.is involved in.
the cell wall alteration since glycerol phosphate, which can be
produced by the$e cells is the.usual precursor for glyceride synthesis.
Sit).ce these. mutants do not, grow. on a combinatic;m of. glucose and·
glycerol, it does not. appear likely. that a defect in synthesis of:
glycerol-lipids is the.primary lesion in tq.ese.cells.
CHAPTER V
SUMMARY AND CONCLUSIONS
The growth of Pseudomonas aeruginosa on various substrates was
characterized, The enzymes.of inducible degradative pathways were
contrasteq with the constitutive enzymes of glucose dissimilation;
evidence was cited indicating the rapid degradation of inducible
enzymes on incubation in the absence of substrate, whereas.the
constitutive glucose enzymes did not appear to lose activity on
similar treatment. The presence of glucose in the growth medium was
shown to have no effect on the synthesis or activity of the inducible
enzymes of the histidine degradative pathway. The enzymes of glycerol
degradation, however, appeared to be subject to both repression and
inhibition by glucose, The.first intermediate in the pathway for
histid,ine, urocanic acid, was found.to be. the inducer of histidase,
the enzyme required for its own.formatiol)., as.well as enzymes required
for its further degradation.
Data were accumulated elucidating the pathway of .. glycerol
catabolism for this organism. No mechanism for the active
incorporation of,glycerol into the cells was found to be present.
~-Glycerophosphate did not support growth, presumably because of
impermeability of the cells to this substrate. Analyses of cell
extracts for enzymic activities showed that glycerol is first
converted to L-0(-glycerophosphate by glycerol kinase. The transforma-
75
76
tion.of L~JX'-glycerophosphate to dihydroxyacetone phosphate is mediated
by an NAD-independent L-a'-glycerophosphate dehydrogenase. Triose
phosphate isomerase effects the conversion of.dihydroxyacetone
phosphate to glyceraldehyde-3-phosphate. The levels of the first two
enzymes of the pathway were shown.to vary markedly betwee~ induced and
non-induced cells. Variation in levels of triose pho$phate isomerase
activity was not significant .for these conditions.
T~o groups of mutant organisms were isolated for the,glycerol
pathway. These groups were distinguished by their ability to use
glucose as sole.carbon so~rce in a minimal medium. Although both
groups of mutants were unable to use glycerol as substrate, only.the
group I mutants.had retained the ability to grow in a glucose minimal
medium. The mutants of tlle second group were able to use glucose only
when yeast extract was also present in the medium. The·ability to
utilize mannitol was also lost in the.latter group, even in the
presence of yeast extract.
Enzyme data for two mutants were obtained. No appreciable loss of
glycerol kinase activity was found for either mutant. lX-Glycero
phosphate dehydrogenase activity was observed for an extract of a
group I mutant; but was absent in a similar extract,of a group II
mutant~ Triose phosphate isomerase activity was greatly reduced for
both mutants as compared to the wild type, A basal level of isomerase
activity persisted in both extracts, however.
A new method for measuring glycerophosphate dehydrogenase
activity in whole cells was developed for use in this study. By its
use, one mut~nt of group I was shown to lack dehydrogenase activity.
A marked difference in susceptibility to phage was observed for
77
the.two set.s of mutants~ Whereas the group I cells were readily lysed
by E-l 0 PA~l, none of 13 strains of phage tested was.able.to lyse the
other mutants. Preliminary.dat~ were obtained indicating that a change
in.the cell wall structure,may be involved in the phenomenon, since
phage adsorption is probably affected in group II cells.
LITERATURE CITED
1. Jacob, F. , and J, Monad, 1961. On the regulation of gene activity. Cold Spring Harbor Symp. Quant, Biol. 26:193-211.
2. Magasanik, B. 1961. Symp. Quant, Bi~l.
Catabolite repression, ~:249-256.
Cold Spring Harbor
3., Komolrit, K., and A. F. Gaudy, Jr, 1964. Proc. Ind. Waste Conf., 19th, Purdue Univ. (Purdue Eng. Extension Ser. No, 117, !t2_:796-810, 1965).
4. Zwaig, N., and E. C. C. Lin. 1966. Feedback inhibition of glycerol kinase, a catabolic enzyme in Escherichia.· coli. · Science 153:755-757.
5. Demerec, M. 1964. Clustering of functionally related genes in Salmonella typhimurium. Proc. Nat. Acad. ScL (U.S.) g:1057-1060.
6. Mandelstam, J., and G. A. Jacoby. 1965. Induction and multisensitive end-product repression in th~ enzymic.pathway degrading mandelate in Pseudomonas fluorescens. · Biochem. J, 94:569-577.
7. Hegeman, G.D. 1966. Synthesis of the enzymes of the mandelate pathway by Pseudomonas putida. I. Synthesis of the ,enzymes by the wild type, · J, Bacterial. 91 :1140-1154,
8. Hegeman, G.D. 1966, Synthesis of the enzymes of the mandelate pathway by Pseudomonas putida. II.. Isolation and properties of blocked mutants. J. Bacteriol. 91:1155-1160,
9. Hegeman, G.D. 1966. Synthesis of the enzymes of the mandelate pathway by Pseudomonas putida. III. Isolation and properties of constitutive. mutants. J, Bacterial. .21:.1161-1167.
10. Gunsalus, I. C., B. L. Horecker, and W. A. Wood. 1955. Pathways of carbohydrate metabolism in .microorganisms. Bacterial. Rev. 19:·104-128.
11. Koch, J.P., S. Hayashi, and E. C. C. Lin. 1964. The control of dissimilation of glycerol and L-(X-glycerophosphate.in Escherichia coli. J, Biol. Chem. 239:3106-3108.
12. Asnis, R. E., and A. F. Brodie. 1953. from Escherichia coli. J, Biol. Chem.
78
A glycerol dehydrogenase 203:153-159.
79
13. Lin, E. C. C., A. P. Levin, aI).d B. Magasanik. 1960. The effect of aerobic metabolism on the inducible glycerol dehydrogenase of, Aerobacteraerogenes. J. Biol. Chem. 235:1824--1829.
' ~ .
14. Cantoni; C._, and M. R. Molnar. 1967. glycerol metabolism of Lactobacilli. . ' . . .
Investigations on the. J. appl. .Bact. 30:-197-205 •.
15. Hayashi, S., and E. C. C. Lin. 1965. Capture of glycerol by cells of .Escherichia coli. Biochi,m. Biophys. Acta. 94:479-487.
16. Lin, E. C. C., J.P. Koch, T~ M. Chused, ands. E. Jorgensen. 1962. Ut:i,lizatio-q. of L-4-glycerophosphate · by E:schericpia coli without hydrolysis. Pr~c. Natl. Acad. ScL U. s. 48:2145-:-2150.
17. Hayashi, S., J. P. Koch, and E. C. C. Lin. 1964. Active t:r,ansport of L-~-glycerophosphate in Escherichia .££1!.. J., Biol. Chem. 239:3098-3105.
18. Roberts, R •. B., P. H. Abelson,(D. B •. Cowiet E. T. Bolton, and R. J. Britten. 1957. Studies .of biosynthesis in.Escherichia coli, 2nd printing. Carnegie Inst. Wash. Pub. 607:5.
19. Jorpes, E. 1932. The colorimetric determination of histidine. Biochem. J. 26: 1507-1511.
20. Komolrit; K. 1965. Biochemical response of activated sludge processes to organic shock loads.. Ph.D. Thesis,· Oklahoma State University, Stillwater.
21. Neish, A. C. 1952. Analytical methods for bacterial fermentations. Natl. Res. Council Can. Rept. 46-8-3 (2nd ed.) pg 36.
22. Sutherland, E. W., C. F. Cori, R. Haynes, and N. S •. Olson. 1949. Purification of the ,hyperglycemic-glycogenolytic .factor from insulin and from gastric mucosa. J. .BioL Chem. 180: 825-83 7.
23. Holloway, B. W., and M. Monk •. 1959. Transduction in Pseudomonas aeruginosa. Virology.18:80-94.
24. Schlesinger, S., P •. Scotto, and B. Magasanik. 196'5. Exogenous and endogenous induction of the histidine degrading ·enzymes in Aerobacter aerogenes. - J ~ Biol. Chem. 240:4331+4337.
25. Hauser, G., and M •. L. Karnovsky. 1957. Rhamnose and rhamnoli-:pide biosynthesis by Pseudomonas aeruginosa. J ~ _Biol. Chem. 224:91-105.
26. Eagon, R. G., andK. J. Carson •. 1965. Lysis of:cell.walls and. intact cells of Pseudomonas.aeruginosa by.ethylenediami,net~tra-:acetate and by lysozyme. Can. J. Micro biol. 11 :.193-201.
27. Loomis, W •. F. Jr •. , and B. Magasanik. 1967. Glu,cose-lactose diauxie in Escherichia coli. J. Bacterial.· _2l:1397-1401.
28. Lessie, T. Go, and. Fo C. Neidhardto 19670 Format:Lon and· operation of the ,histidine-degrading pathw~y in Pseudomonas· aeruginosa o Jo Bacterial o 2}_:·1800-1810.
80
29. Taylor, Wo H., Mo L. Taylor, and D~ F. Ea.}Iles. 1966. Two functionally different dihydroorotic ,dehydrogenases in bacteria. J. Bactei;-!lol. 91:2251-2256.
30. Coa.lins, F o M. 1964. Composition of cell walls .of ageing Pseudomonas aeruginosa and Salmonella bethesda.' J. gen. Micro biol. 34 :)V9-388.
31. Osborn, M. J., S., Mo Rosen, L.' Rothfi,eld, L. D. Zeleznick, and· B •. L. Horecker. 1964. Lipopolysaccharide of the gram-negative • cell.wall. Science,145·:783-789.
f 32. Wei,.del, W. 1958. Bacterial viruses.(with particul,ar reference to
adsorption/penetration). Ann. Revo Microl:>iol. 12 :27--48.
VITA
Clinton Melvin Cowen,
~andidate for the Degree of.
Master of ScieI).ce
Thesis: CATABOLIC PATHWAYS AND METABOLIC CONTROLS IN PSEUDOMONAS AERUGINOSA .
Maj or Field: Microbiology
Biographicql:
Personal Data: Born at Shreveport, Louisiana, on December 1, 1942, the son of ,William P. and Edna.Compton Cowen.
Education: Graduated from College High School in Bartlesville, Okla'q.oma, in 1960; received the Bachelor of Science degree from O~lahoma St:ate,University in 1965 with a major in Psychology.
Prof e1;1sional Experience: Graduate Res.ear ch Assista.nt, Department of ~icrobiology, Oklahoma State University, from June, 1966, to August, 1967.


![The ERK and JNK pathways in the regulation of metabolic ... · bolic pathways and anabolic pathways, respectively [1]. Through catabolic pathways, carbon fuels such as glucose, fatty](https://img.pdfslide.net/doc/110x75/60b4f6c98a758f4d9117b520/the-erk-and-jnk-pathways-in-the-regulation-of-metabolic-bolic-pathways-and-anabolic.jpg)