Embed Size (px)
Citation preview

CATCHMENT AND COMMUNITY
Towards a management-focused dynamical study
of the ACT water system
BioPhysical
Social &Cultural Economic
Water
Katrina Proust
Centre for Resource and Environment Studies Australian National University
Barry Newell
Department of Engineering
Faculty of Engineering and Information Technology Australian National University
July 2006

Actew Project WF-30038
Final Report
July 2006
ii
SUMMARY The work reported here has had two main aims. First, to develop an overview of the interplay between the socio-biophysical variables that can affect the resilience and sustainability of the ACT water system. Second, to investigate the feasibility of carrying out a dynamical study that would help water researchers and managers to improve their understanding of the system. Such understanding is essential for the design and implementation of effective management strategies and policies. To meet the first of these aims we worked in collaboration with ACT researchers, planners, managers, and administrators. Together we identified key physical, biological and social variables and constructed a range of causal maps and conceptual models that provided an initial overview of the interplay between major sub-structures of the ACT system. We ran two workshops that involved interested individuals from ACT research institutions, companies, and Government. The workshops were designed to help us to assess the progress of our study and to promote an integrative discussion, across research and management silos, of system structure and dynamical effects. Our overview of the dynamical structure of the ACT water system is presented as Figure 19. This diagram should help to promote integrative discussions across the ACT. To meet the second aim we initiated an Integrative Conceptual Modelling (ICM) exercise. ICM begins with the opportunistic modelling of a variety of sub-systems, not necessarily disjoint, focused around existing knowledge ‘hot spots’ and key management issues. We have concluded that ACT water managers need the research community to become more involved in the translation of research results into management understanding. While a significant amount of valuable research has been carried out in the ACT, the effort has been fragmented and unevenly distributed across the system. The research problem is exacerbated by fundamental data deficiencies. Despite these problems, we believe that the wide range of expertise available in the ACT community is sufficient to support a useful study of the dynamics of the water supply-and-demand system. The stock-and-flow models presented in §4.3 represent a first step in this direction. We have concluded that ACTEW can make a major contribution to the ACT by: R1. Promoting a regional approach to sustainable resource use and management. R2. Promoting the sharing of data and models across the ACT and the region. R3. Collaborating in the development of management-focused research questions and scenario-planning exercises. In the context of R3 we have developed, in collaboration with workshop participants, four well-defined research questions. These questions target threats to the ACT water system that arise from: (a) climate change, (b) attempts to manage wildfire in the catchments, and (c) population growth coupled with a water-intensive urban lifestyle. During the course of our study it has become apparent that the ACT is unusually rich in specialists who can work across all dimensions of complex human activity systems. There can be little doubt that the Canberra region can become the site of a world-leading effort in the struggle to establish communities that are resilient and sustainable.
iii

ACKNOWLEDGMENT We thank ACTEW for sponsoring this project (under grant WF-30038) and the following people for their contributions to the development of the ideas and approaches presented here: Sara Beavis Centre for Resource and Environmental Studies (CRES) ANU Ross Bradstock NSW Department of Environment and Conservation Geoff Cary School of Resources, Environment and Society (SRES) ANU Stewart Chapman ACT Office of Sustainability, Chief Minister's Dept Karen Civil ACT Office of Sustainability, Chief Minister's Dept Judith Clark CRES ANU Barry Croke Integrated Catchment Assessment and Management (iCAM) ANU Robert Dyball Human Ecology Program, SRES ANU Ian Falconer Conservation Council of South East Region and Canberra John Feint Environment ACT Joern Fischer CRES ANU Barney Foran CRES ANU Nick Gellie SRES ANU Malcolm Gill Bushfire CRC Jennie Gilles ACT Office of Sustainability, Chief Minister's Dept Quentin Grafton Asia Pacific School of Economics and Government, ANU Trish Harup Conservation Council of South East Region and Canberra Lance Heath CRES ANU Ken Horsham Policy Advisor, ACTEW Corporation Ken Johnson SRES ANU Allen Kearns CSIRO Sustainable Ecosystems Ross Knee ACTEW Corporation Sharon Lane Environment ACT Cameron LeMaitre ACT Office of Sustainability, Chief Minister's Dept Janette Lindesay SRES ANU Adrian Manning CRES ANU Norm Mueller Ecowise Environmental Pty Limited Phillip Pagan CRES ANU Principal of Burley Griffin Landscapes, Canberra Rosemary Purdie ACT Commissioner for the Environment John Schooneveldt Sustainability Science, Canberra Jason Sharples Bushfire CRC, ADFA Helen Sims Office of the ACT Commissioner for the Environment Will Steffen Director, CRES ANU Patrick Troy CRES ANU Alan Wade CRES ANU Robert Wasson DVC (Research), Charles Darwin University, Darwin Rodney Weber Bushfire CRC, ADFA Ian White CRES ANU Adrian Whitehead Conservation Council of South East Region and Canberra
iv

TABLE OF CONTENTS
Summary . . . . . . . . . . . . . . . . . . . . . . . . . . . . . . . . . . . . . . . . . . . . .
iii
Acknowledgment . . . . . . . . . . . . . . . . . . . . . . . . . . . . . . . . . . . . . . .
iv
1 Introduction . . . . . . . . . . . . . . . . . . . . . . . . . . . . . . . . . . . . . . . . . . . 1.1 Background . . . . . . . . . . . . . . . . . . . . . . . . . . . . . . . . . . . . . . . . 1.2 Project Aims . . . . . . . . . . . . . . . . . . . . . . . . . . . . . . . . . . . . . . . . 1.3 Structure of Report . . . . . . . . . . . . . . . . . . . . . . . . . . . . . . . . . . .
1 1 2 3
2 System Terminology and Principles . . . . . . . . . . . . . . . . . . . . . . . .
4
3 Understanding the ACT Water System . . . . . . . . . . . . . . . . . . . . . .
9
4 Mapping the ACT Water System . . . . . . . . . . . . . . . . . . . . . . . . . . . 4.1 Historical Constraints . . . . . . . . . . . . . . . . . . . . . . . . . . . . . . . . . 4.2 The Structure of the ACT Water System . . . . . . . . . . . . . . . . . . 4.3 Stock-and-Flow Models . . . . . . . . . . . . . . . . . . . . . . . . . . . . . . . 4.4 Conclusion . . . . . . . . . . . . . . . . . . . . . . . . . . . . . . . . . . . . . . . . .
15
15 20 28 45
5 Recommendations . . . . . . . . . . . . . . . . . . . . . . . . . . . . . . . . . . . . . .
46
6 References . . . . . . . . . . . . . . . . . . . . . . . . . . . . . . . . . . . . . . . . . . . . 6.1 Cited in the Report . . . . . . . . . . . . . . . . . . . . . . . . . . . . . . . . . . . 6.2 Other Materials Consulted . . . . . . . . . . . . . . . . . . . . . . . . . . . . .
50 50 50
Appendix A . . . . . . . . . . . . . . . . . . . . . . . . . . . . . . . . . . . . . . . . . . .
54
v

vi
1. INTRODUCTION 1.1 Background The Australian climate is characterised by high variability with naturally occurring cycles of wet and dry periods. Despite this characteristic there is a widely held view among Australians that droughts are abnormal events. Since the late 1990s, however, south-eastern Australia has experienced increasingly severe droughts which are forcing ACT residents, businesses and Government to face the possibility of climate change. A decrease in average rainfall and an increase in average temperatures would have serious consequences for an inland city like Canberra. In particular, the December 2001 bushfires and the fire-storm of January 2003 have focused our attention on the vulnerability of the ACT water supply-and-demand system (hereinafter called the ACT water system). As awareness of the risks has grown ACTEW Corporation has commissioned significant research into key aspects of water supply and demand in the ACT. Like any major organisation ACTEW needs the ability to assess the relative merits of alternative policies and management strategies. To this end the company has funded a range of research projects, many of which have been designed to understand better the characteristics of the Cotter catchment. The work completed in these projects has met some of ACTEW’s needs. In particular, it has contributed to an increased understanding of specific processes that affect catchment yield and water quality. Nevertheless, it is difficult to link narrowly focused research to management needs and policy assessment. The overall research effort remains fragmented and discipline-based. The existing coverage of the ACT water system is uneven, with a particular emphasis on catchment biophysics. One problem is that research teams usually concentrate their attention on isolated aspects of the system, in order to make progress in the face of complexity, but managers and strategic planners do not have this luxury. The consequences of their actions must play out within the full system. In any effort to redress this difference the principal challenge is to find ways to couple the detailed research to the overall management needs. The development of a ‘systems’ view of water supply and use in the ACT is an essential first step towards this blending. As stated by Boyden et al. (1981)
… all human situations involve a continual interplay between many different aspects of reality. These different aspects are conventionally the concern of experts in different branches of government and in the different academic disciplines of the natural sciences, social sciences and humanities. We hold, however, that a proper understanding of human situations, such as required for the formulation of wise policies for the future, demands that we pay a great deal more attention to the patterns of interplay as such. Indeed, in our view, the persistence of so many of the problems facing humankind in the modern world is to a large extent due to the excessive compartmentalization, fragmentation, and specialism which are so characteristic of education, research and government today. There is an urgent need for more intellectual effort aimed at improving knowledge and understanding of the patterns of interplay between different cultural and natural processes in human situations, and of the principles relevant to this
1

interplay. We use the word ‘comprehensive’ to describe work which has this objective (Boyden et al 1981).
A particular deficiency of ACT water research to date, as seen from the policy assessment point of view, is its fragmentation and its consequent lack of attention to the interactions that occur between basic ecological, social and economic processes. This is a serious deficiency. Such process-to-process interactions play a determining role in the dynamics of the water system.1 In order to manage the system optimally (and assess its resilience and sustainability in the face of possible changes in climate, population and patterns of consumption) it is necessary to take these systemic interactions into account. The present project has been funded by ACTEW as a first step toward developing the required comprehensive approach. 1.2 Project Aims 1.2.1 Overall Aims • To develop an initial view of the interplay between the socio-biophysical variables
that can affect the resilience and sustainability of the ACT water system. • To investigate the feasibility of carrying out a dynamical study of the ACT system
that would be useful to water researchers and managers. 1.2.2 Procedural Aims: While system investigations are inherently integrative, the procedural aims outlined below were intended to establish a collaborative process that could help to keep the research effort firmly tied to the management issues facing ACTEW and the ACT community: • To work in collaboration with ACT researchers, planners, managers and
administrators to identify the main physical, biological and social variables of the ACT water system,
• To work in collaboration with ACT researchers, planners, managers and
administrators to construct causal maps and conceptual models that provide an initial overview of the interplay between major socio-biophysical variables of the ACT water system,
• To promote an integrative discussion of system structure and dynamical effects, • To use the system overview to identify potential threats to the sustainable
management of the ACT water system, and • To suggest integrative research projects that could lead to a better understanding of
the way that water management strategies and policies affect the resilience and sustainability of Canberra and the surrounding regions.
1 We will use the word ‘dynamics’ in the physicist’s sense to refer to the way that the state of a system changes over time in response to externally and internally generated forces.
2
1.3 Structure of Report In this report we discuss the challenge of managing the ACT water system. The challenge arises particularly from the feedback effects that drive the behaviour of any complex human activity system. We focus particularly on the manager’s need to understand the dynamics of the water system and the impediments to learning caused by the fragmentation of research and management efforts. The systems concepts that underlie the work reported here are not widely used. It is important, therefore, for us to begin by briefly explaining the ideas and language that we have adopted. We do this in §2 System Terminology and Principles. In §3 Understanding the ACT Water System we outline the research method that we have adopted in this study. This approach, which we call ‘Integrative Conceptual Modelling’ (ICM), is particularly suited to the task of building a comprehensive approach to water management issues in the ACT. We define ICM to be a collaborative endeavour that focuses on (a) the construction of simple, conceptual models that capture the essential interaction-driven aspects of system behaviour, and (b) the use of those models to improve the community’s understanding of the system. In §4 Mapping the ACT Water System, we present the initial steps in an ICM approach aimed at increasing management understanding of the ACT water system. In §4.1 we begin with a discussion of some of the constraints, faced by water managers in the ACT, that result from decisions that were made many years ago. A brief history of several of these decisions is presented (a) to clarify the historical (rather than fundamental) nature of the corresponding constraints, (b) to illustrate the path dependence that is typical of the evolution of complex adaptive systems. In §4.2 our systems analysis is extended to causal loop diagrams that illustrate representative aspects of the ACT system. We conclude this section with an influence diagram, presented in Figure 19, that summarises our view of the feedback structure the ACT water system. In §4.3 we discuss a representative sample of the stock-and-flow models that were developed during the study and that can be used as the starting points for more extended investigations. We show some examples of how such models can be used to increase management understanding of dynamical effects. We summarise our findings in §4.4. The report concludes with §5 Recommendations. Our recommendations are addressed to ACTEW, as the sponsor of this research, and so are focused on water management. Nevertheless, since water management is inextricably bound up with a variety of other management issues in the Territory, the recommendations are relevant to resource management in general across the wider ACT and regional communities and are couched in these terms. Finally, Appendix A, entitled Selected Policy Decisions Affecting the ACT Water System, contains a list of key management decisions in ACT history, and some of their implications for managing the ACT water system today.
3

2. SYSTEM TERMINOLOGY AND PRINCIPLES In this report we will consider a system to be something composed of parts, or elements, that interact to influence each other’s behaviour. It is this interplay, between the parts of the system, that gives rise to its emergent properties and behaviour. A system’s emergent behaviour is behaviour that is characteristic of the system taken as a whole—it cannot be displayed by any of its parts taken in isolation. The traditional term ‘emergent’ reflects the strong influence that engineering has had on the development of system theory. As used today it generalises the engineer’s notion that behaviour characteristic of an artificial system appears only when the system is assembled. The mutual interactions that drive the behaviour of a system are usually referred to as causal loops or feedback loops. There are only two types of feedback—positive and negative (see Figure 1). In both diagrams the labels represent system variables and the arrows represent causal links. The polarity of each link is indicated by a plus (+) or minus (-) sign near the arrowhead. Positive polarity means that an increase/decrease in the value of the variable at the tail of the arrow will cause an increase/decrease in the value of the variable at the head of the arrow, all else being equal. Negative polarity means that an increase/decrease in the value of the variable at the tail of the arrow will cause a decrease/increase in the value of the variable at the head of the arrow, all else being equal. Panel a: A positive feedback loop. An increase in the amount of vegetation in the catchment can increase infiltration of water into the vadose zone. Increased infiltration will raise the soil moisture and so promote further vegetation growth. The encircled R in the centre of the diagram indicates that this is a ‘reinforcing’ process. Panel b: A negative feedback loop. An increase in the amount of vegetation in the catchment can increase evaporation and transpiration. Increased evapotranspiration will lower the soil moisture and so inhibit further vegetation growth. The encircled B in the centre of the diagram indicates that this is a ‘balancing’ process.
Soil moisture
VegetationInfiltration+
+
+
R
Soil moisture
VegetationEvapo-
transpiration
+
+
-B
(a) Positive feedback (b) Negative feedback
Figure 1. Causal Loop Diagrams (CLDs) illustrating (a) positive and (b) negative feedback.
We use the stock-and-flow language and graphical conventions that were originally devised by Forrester (1961). In this approach rectangles represent ‘stocks’ (accumulations) of things or material that can be counted or ‘measured’—for example, water, vegetation, people, gardens, money, and mental stress (see Figure 2). We can always measure variables that are difficult to quantify (such as mental stress) on some convenient but arbitrary scale, or use a surrogate measure (such as the number of days of sick-leave taken). In a dynamical model the stocks play the role of ‘state variables’.
4

The amount of material or other quantity accumulated in a stock is referred to as the ‘level’ of the stock (corresponding to the ‘value’ of a state variable). The cloud symbols represent sources and sinks with unlimited capacity. The circles represent parameters and auxiliary variables. The rectilinear double-line arrows represent ‘flows’ (processes) that can change the levels of the stocks. Inward arrows indicate processes that can increase the level of a stock and outward arrows indicate processes that can decrease the level of a stock. The tap symbols associated with each arrow represent the ‘flow rates’ of the processes—that is, the rates at which the processes change the levels of the stocks. In a model these ‘valves’ can be considered to ‘contain’ the process-rate equations. The curved single-line arrows represent influence or ‘information’ links—the small circles at the tail of these influence arrows serve as a reminder that an influence is exerted via a ‘measurement’ that does not change the levels of the variables and stocks that exert the influence.
stock
Process that increases level
of stock
Process that decreases level
of stock
parameter that influences
process rate
Figure 2. Stock-and-flow conventions.
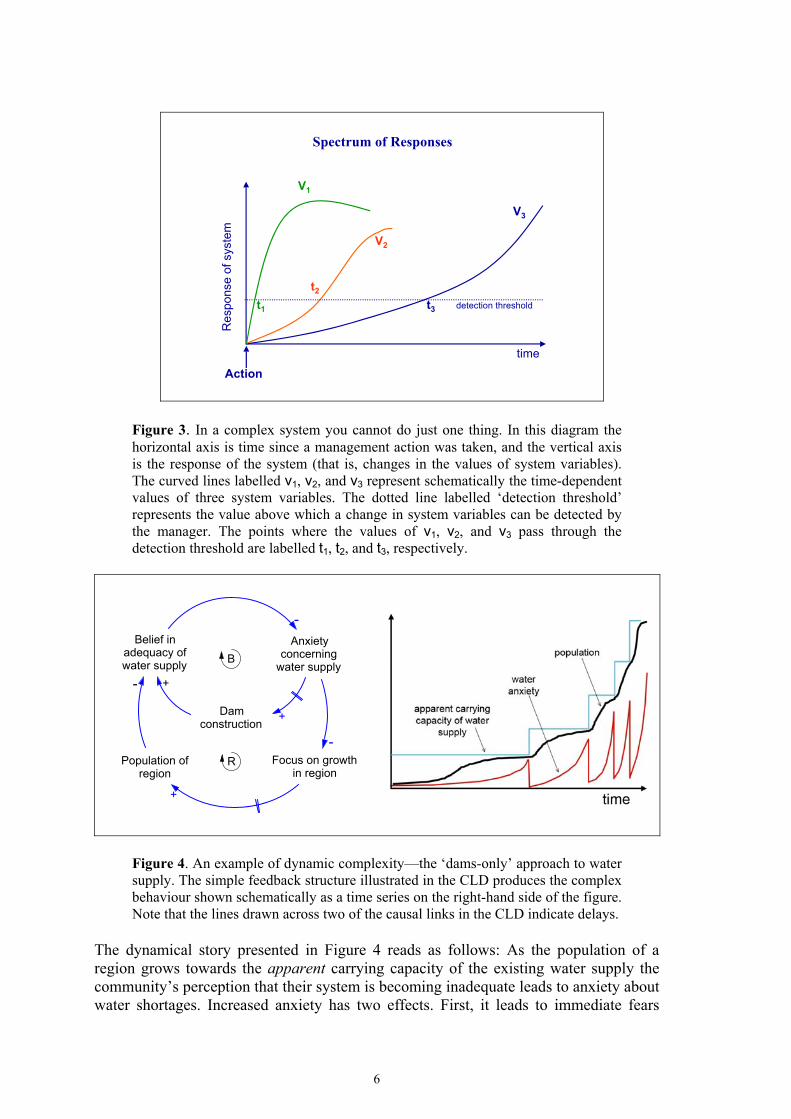
The existence of feedback loops in the ACT water system means that a change in any one part of the system will affect other parts of the system. Thus, the actions taken by managers will have multiple outcomes. Some of those outcomes will be expected and wanted, but some will be unexpected and unwanted. The expected outcomes will usually occur before the unexpected outcomes. Thus, for example, any change in ACT water policy has the potential to impact land sales and house prices throughout the Territory—aspects of the system that are not usually considered to have anything to do with water. This type of behaviour is illustrated schematically in Figure 3, where v1 can be taken to be the intended response of the system to a particular management action and v2 and v3 can be thought of as unexpected outcomes. Typically the wanted outcomes occur quickly and the unexpected outcomes are delayed (that is, t1 < t2 and t3). Even a structurally simple system can produce unintended policy outcomes on widely varying temporal and spatial scales. The ACT system displays both ‘detail complexity’ and ‘dynamic complexity’. Detail complexity arises when managers must deal with a large number of items. A typical case involves the scheduling of the activities of field-service staff. In such situations it can be difficult to ensure that all eventualities have been taken into account, but it is usually possible to devise structured approaches that are effective in practice. Dynamic complexity is much harder to manage. It is caused by feedback effects, and can occur in simple systems with only a few variables. Such a case is illustrated in Figure 4. The situation depicted is the common ‘dams-only’ scenario where a community erroneously considers the total storage volume of their dams to be the ‘capacity’ of their water supply system.
5
Spectrum of Responses
Res
pons
e of
sys
tem
time
t3t1
V3
V1
detection threshold
Action
t2
V2
Figure 3. In a complex system you cannot do just one thing. In this diagram the horizontal axis is time since a management action was taken, and the vertical axis is the response of the system (that is, changes in the values of system variables). The curved lines labelled v1, v2, and v3 represent schematically the time-dependent values of three system variables. The dotted line labelled ‘detection threshold’ represents the value above which a change in system variables can be detected by the manager. The points where the values of v1, v2, and v3 pass through the detection threshold are labelled t1, t2, and t3, respectively.
Belief inadequacy ofwater supply
Damconstruction
Population ofregion
- +
B
R
Anxietyconcerning
water supply
Focus on growthin region
-
+
+
-
Figure 4. An example of dynamic complexity—the ‘dams-only’ approach to water supply. The simple feedback structure illustrated in the CLD produces the complex behaviour shown schematically as a time series on the right-hand side of the figure. Note that the lines drawn across two of the causal links in the CLD indicate delays.
The dynamical story presented in Figure 4 reads as follows: As the population of a region grows towards the apparent carrying capacity of the existing water supply the community’s perception that their system is becoming inadequate leads to anxiety about water shortages. Increased anxiety has two effects. First, it leads to immediate fears
6
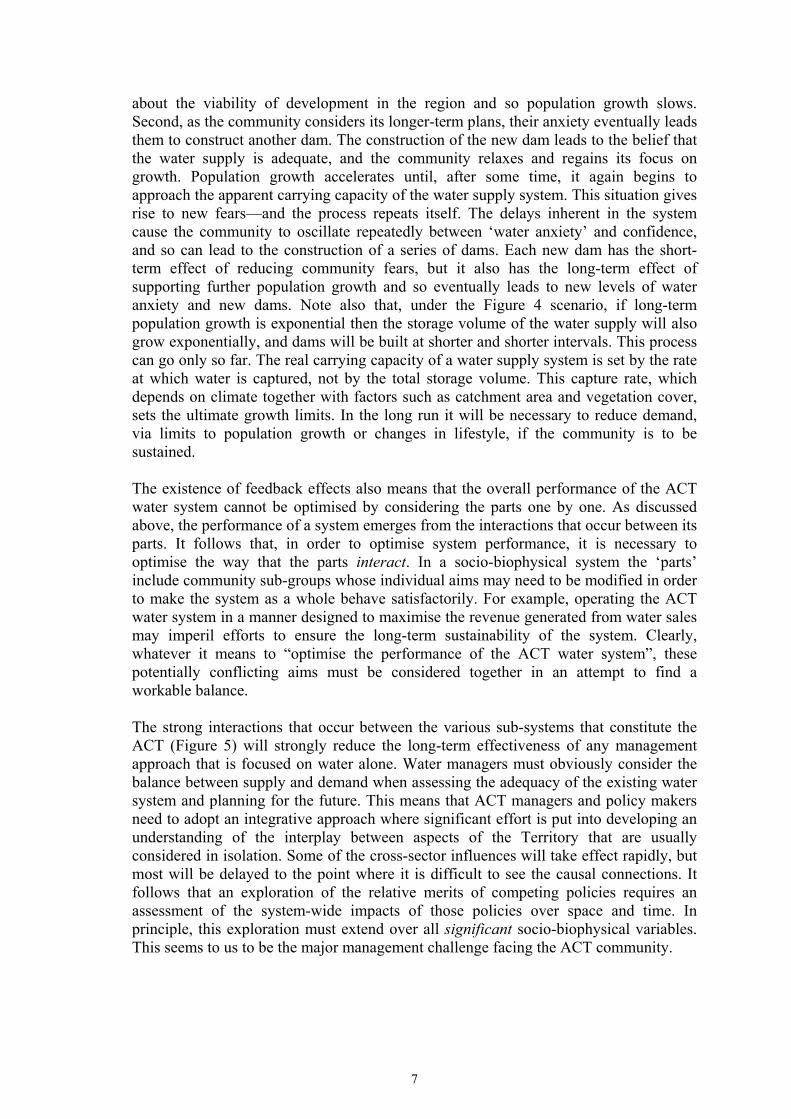
about the viability of development in the region and so population growth slows. Second, as the community considers its longer-term plans, their anxiety eventually leads them to construct another dam. The construction of the new dam leads to the belief that the water supply is adequate, and the community relaxes and regains its focus on growth. Population growth accelerates until, after some time, it again begins to approach the apparent carrying capacity of the water supply system. This situation gives rise to new fears—and the process repeats itself. The delays inherent in the system cause the community to oscillate repeatedly between ‘water anxiety’ and confidence, and so can lead to the construction of a series of dams. Each new dam has the short-term effect of reducing community fears, but it also has the long-term effect of supporting further population growth and so eventually leads to new levels of water anxiety and new dams. Note also that, under the Figure 4 scenario, if long-term population growth is exponential then the storage volume of the water supply will also grow exponentially, and dams will be built at shorter and shorter intervals. This process can go only so far. The real carrying capacity of a water supply system is set by the rate at which water is captured, not by the total storage volume. This capture rate, which depends on climate together with factors such as catchment area and vegetation cover, sets the ultimate growth limits. In the long run it will be necessary to reduce demand, via limits to population growth or changes in lifestyle, if the community is to be sustained. The existence of feedback effects also means that the overall performance of the ACT water system cannot be optimised by considering the parts one by one. As discussed above, the performance of a system emerges from the interactions that occur between its parts. It follows that, in order to optimise system performance, it is necessary to optimise the way that the parts interact. In a socio-biophysical system the ‘parts’ include community sub-groups whose individual aims may need to be modified in order to make the system as a whole behave satisfactorily. For example, operating the ACT water system in a manner designed to maximise the revenue generated from water sales may imperil efforts to ensure the long-term sustainability of the system. Clearly, whatever it means to “optimise the performance of the ACT water system”, these potentially conflicting aims must be considered together in an attempt to find a workable balance. The strong interactions that occur between the various sub-systems that constitute the ACT (Figure 5) will strongly reduce the long-term effectiveness of any management approach that is focused on water alone. Water managers must obviously consider the balance between supply and demand when assessing the adequacy of the existing water system and planning for the future. This means that ACT managers and policy makers need to adopt an integrative approach where significant effort is put into developing an understanding of the interplay between aspects of the Territory that are usually considered in isolation. Some of the cross-sector influences will take effect rapidly, but most will be delayed to the point where it is difficult to see the causal connections. It follows that an exploration of the relative merits of competing policies requires an assessment of the system-wide impacts of those policies over space and time. In principle, this exploration must extend over all significant socio-biophysical variables. This seems to us to be the major management challenge facing the ACT community.
7

BioPhysical
Social &Cultural Economic
Water
Figure 5. The ACT community is a complex adaptive system with many variables and processes that interact via multiple causal loops. Water influences, and is influenced by, the biological, physical, social, cultural, and economic sub-systems of the Territory. This means that water-related policies, decisions and activities can influence behaviour in other, apparently unrelated, sub-systems. It also means that management decisions taken in other sub-systems (management sectors) can have serious impacts on the water system.
The main management implications of the above ideas are summarised in the following interrelated system principles: System Principle 1: Feedback effects operating between the parts of the system are important determinants of behaviour in any complex socio-biophysical situation. System Principle 2: Any action taken in a complex system will produce a spectrum of outcomes, some expected and desired, some unexpected and undesired. The expected outcomes will usually occur before the unexpected outcomes. System Principle 3: The behaviour of a complex system cannot be optimised by optimising the behaviour of its parts taken separately. System Principle 4: The effective design and management of human activity systems requires integrative approaches that take into account the interplay between a wide range of socio-biophysical variables.
8

3. UNDERSTANDING THE ACT WATER SYSTEM All design, policy, and management decisions require some level of anticipation or prediction. But, prediction is not possible without a ‘model’ of how things will change as time passes. The models used by managers range from their private ‘mental models’ to detailed computer models that are ‘public’ in the sense that their output is used by the full management team. A person’s mental models are built on the basis of experience, either at first hand or passed on from others. They capture behaviour patterns that he or she perceives to be typical of the world, and thus are seen to provide a reasonable basis for perception and prediction. It is important to recognise that such models are often constructed and used automatically, without their owner being consciously aware of their existence. Our predictive models, both private and public, constitute our ‘understanding’ of the behaviour of the systems that we live in and seek to manage. In particular, a manager’s models of how the system will respond to various management actions underpin all of his or her efforts to identify critical management questions, and to build effective policies and strategic plans. These dynamical models are called into play whenever “what-if” questions are posed and answered, and whenever scenarios are used to support long-term planning under uncertainty. In the simplest cases a manager’s mental models, as built on the job, will provide adequate support for his or her day-to-day decisions. It is, however, difficult for managers to anticipate the response of complex systems without the help of computer-based dynamical models (see Sterman 2000 and System Principe 2). Adaptive management, as originally developed by Holling (1978) and his colleagues, depends heavily on model-based anticipation of the multiple effects of management actions.2 The production of reliable dynamical models of human activity systems is a large undertaking. Feedback effects are dominant and often difficult to discern. The levels of the stocks (values of state variables) can be changed by flows (state-change processes). But, at any particular time, the rate of each flow depends on the current levels of a sub-set of the stocks. Thus, the flows change the levels of the stocks while, at the same time, the levels of the stocks control the flows. It is the existence of such causal loops that gives rise to dynamic complexity (see §2). A major complication arises from the adaptive nature of human activity systems. As managers (who are integral parts of the system) work to solve operational problems, their actions and policy initiatives cause changes to the structure of the system. New variables are added or existing variables are removed, new feedback connections between variables are made or existing ones are broken, process rates are modified, and parameter settings are altered. From the modeller’s point of view, the managed system is a moving target. Furthermore, as Tainter (1988) has pointed out, there is a strong tendency for managers to adopt ‘solutions’ that increase the complexity of the managed operation. When managers invest in higher levels of complexity as a fundamental problem-solving strategy, the approach works initially but with declining marginal returns as complexity increases (see System Principle 2). In Figure 6 we show the type of generic behaviour, driven by a causal loop, that can lead to the accelerating growth of complexity in a policy-making 2 Adaptive management is sometimes seen primarily as “management by experiment”. This narrow view can lead to a dangerous “wait-and-see” approach where no action is taken until something goes wrong. All managers strive to avoid unwelcome surprises, but if managers of complex systems wait until they are surprised before they take action, it will often be too late to recover effectively.
9
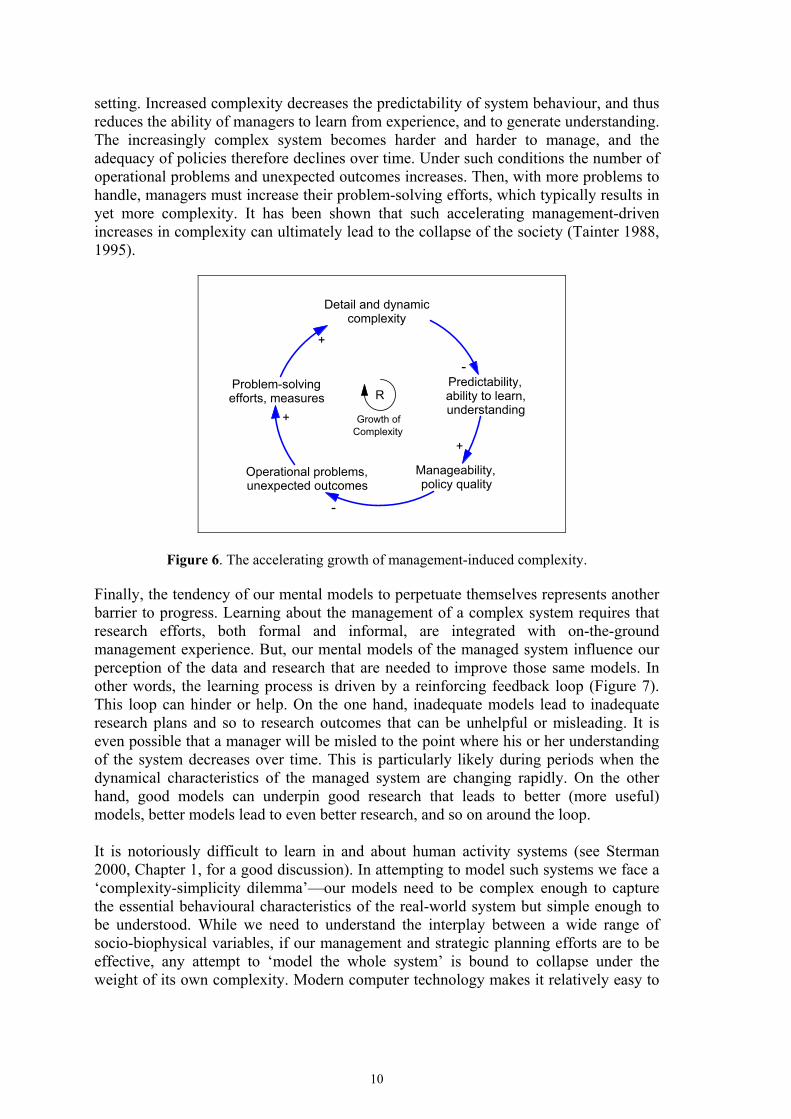
setting. Increased complexity decreases the predictability of system behaviour, and thus reduces the ability of managers to learn from experience, and to generate understanding. The increasingly complex system becomes harder and harder to manage, and the adequacy of policies therefore declines over time. Under such conditions the number of operational problems and unexpected outcomes increases. Then, with more problems to handle, managers must increase their problem-solving efforts, which typically results in yet more complexity. It has been shown that such accelerating management-driven increases in complexity can ultimately lead to the collapse of the society (Tainter 1988, 1995).
Detail and dynamic
complexity
Predictability,ability to learn,understanding
Manageability,policy quality
Operational problems,unexpected outcomes
Problem-solvingefforts, measures
-
+
-
+
+
R
Growth ofComplexity
Figure 6. The accelerating growth of management-induced complexity.
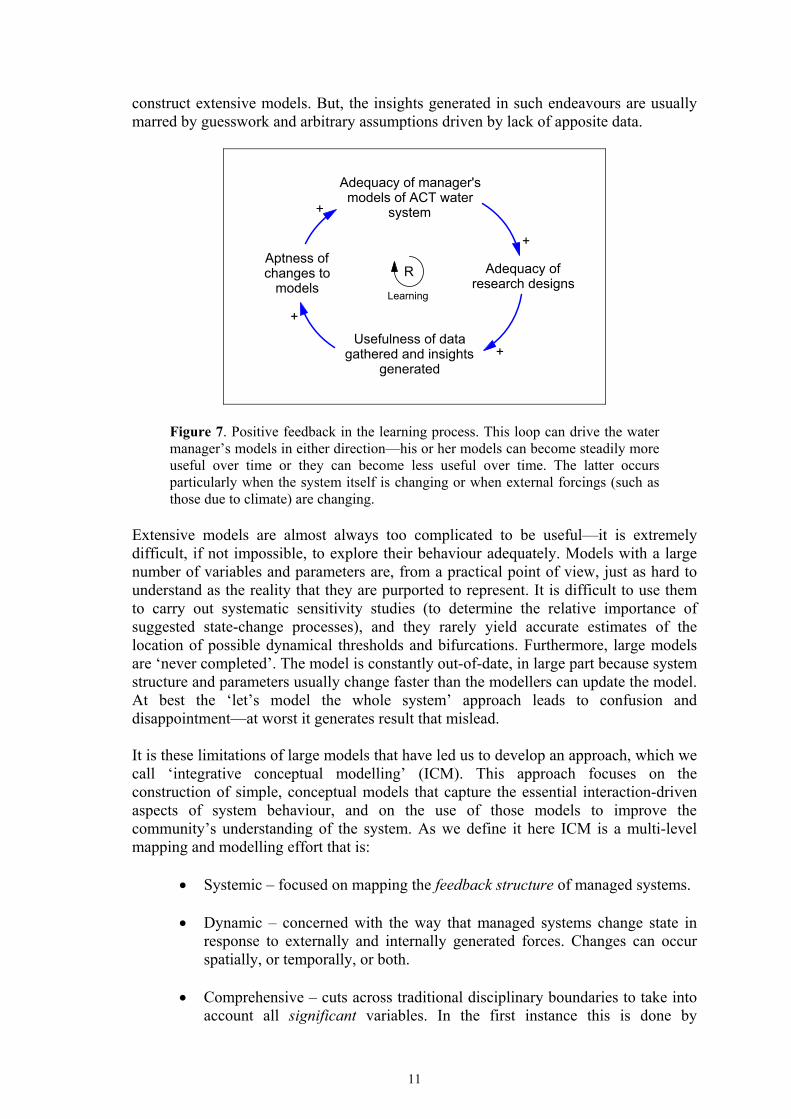
Finally, the tendency of our mental models to perpetuate themselves represents another barrier to progress. Learning about the management of a complex system requires that research efforts, both formal and informal, are integrated with on-the-ground management experience. But, our mental models of the managed system influence our perception of the data and research that are needed to improve those same models. In other words, the learning process is driven by a reinforcing feedback loop (Figure 7). This loop can hinder or help. On the one hand, inadequate models lead to inadequate research plans and so to research outcomes that can be unhelpful or misleading. It is even possible that a manager will be misled to the point where his or her understanding of the system decreases over time. This is particularly likely during periods when the dynamical characteristics of the managed system are changing rapidly. On the other hand, good models can underpin good research that leads to better (more useful) models, better models lead to even better research, and so on around the loop. It is notoriously difficult to learn in and about human activity systems (see Sterman 2000, Chapter 1, for a good discussion). In attempting to model such systems we face a ‘complexity-simplicity dilemma’—our models need to be complex enough to capture the essential behavioural characteristics of the real-world system but simple enough to be understood. While we need to understand the interplay between a wide range of socio-biophysical variables, if our management and strategic planning efforts are to be effective, any attempt to ‘model the whole system’ is bound to collapse under the weight of its own complexity. Modern computer technology makes it relatively easy to
10
construct extensive models. But, the insights generated in such endeavours are usually marred by guesswork and arbitrary assumptions driven by lack of apposite data.
Adequacy of manager's
models of ACT watersystem
Adequacy ofresearch designs
Usefulness of datagathered and insights
generated
Aptness ofchanges to
models
+
+
+
+
R
Learning
Figure 7. Positive feedback in the learning process. This loop can drive the water manager’s models in either direction—his or her models can become steadily more useful over time or they can become less useful over time. The latter occurs particularly when the system itself is changing or when external forcings (such as those due to climate) are changing.
Extensive models are almost always too complicated to be useful—it is extremely difficult, if not impossible, to explore their behaviour adequately. Models with a large number of variables and parameters are, from a practical point of view, just as hard to understand as the reality that they are purported to represent. It is difficult to use them to carry out systematic sensitivity studies (to determine the relative importance of suggested state-change processes), and they rarely yield accurate estimates of the location of possible dynamical thresholds and bifurcations. Furthermore, large models are ‘never completed’. The model is constantly out-of-date, in large part because system structure and parameters usually change faster than the modellers can update the model. At best the ‘let’s model the whole system’ approach leads to confusion and disappointment—at worst it generates result that mislead. It is these limitations of large models that have led us to develop an approach, which we call ‘integrative conceptual modelling’ (ICM). This approach focuses on the construction of simple, conceptual models that capture the essential interaction-driven aspects of system behaviour, and on the use of those models to improve the community’s understanding of the system. As we define it here ICM is a multi-level mapping and modelling effort that is:
• Systemic – focused on mapping the feedback structure of managed systems.
• Dynamic – concerned with the way that managed systems change state in response to externally and internally generated forces. Changes can occur spatially, or temporally, or both.
• Comprehensive – cuts across traditional disciplinary boundaries to take into
account all significant variables. In the first instance this is done by
11
constructing a number of small maps and models that are focused on the interactions between key socio-biophysical variables.
• Collaborative – requires researchers, managers and community members to
work together to construct system maps and models. More advanced dynamical models are built by teams with broad membership. Such teams need to comprise a small core group, that manages the mapping and modelling, plus a wider group of engaged specialists. Collaborative model-building drives ‘conceptual integration’. Participants develop shared conceptual frameworks that can (a) engender better communication between researchers and managers, (b) support the blending of the team members’ different worldviews, (c) support the development of integrative management approaches, and (d) guide data gathering and research design by helping team members to pose research questions that have clear links to management issues. The integrative process is facilitated if participants adopt the “looking outward” strategy described by Holling et al (1978).
• Conceptual – aims to construct maps and models that are as simple as
possible consistent with capturing essential behavioural characteristics of the system. Conceptual models are used differentially (see §4.3, page 35) to improve understanding of dynamics rather than to predict behaviour in detail. A focus on capturing essential system interactions helps the team to develop models that are neither too sparse nor too detailed. The models produced early in an ICM project will typically be too complex but, in such cases, a major aim must be to simplify that model while retaining the essential aspects of its behaviour.
The ICM approach, which rests on a solid theoretical foundation developed by one of us (BN), involves four phases of model construction: Phase I: Researchers and managers work together to identify a range of 'sub-systems' selected for a rich variety of reasons (see Figure 20). Use historical studies and causal-loop diagrams. On this basis build very simple stock-and-flow models that take advantage of knowledge 'hot spots' or that are focused on key management questions. Specify the dominant state-change processes using existing data and process knowledge. Test the model’s ability to provide insights into system behaviour. Phase II: Researchers and managers work together to gradually expand the Phase I models, adding state variables and state-change processes, as judged necessary, to improve the ability of the model to explain the observed behaviour or provide insights into the driving management questions. During this phase the modelled sub-systems will spread out (become more comprehensive) and overlap more and more. In addition, each model will necessarily become more complex. Attempts to build useful Phase I and Phase II models will usually reveal deficiencies in the available data or the driving research questions, and so can guide the gathering of additional data or the formulation of more effective questions. Phase III: Simplify the Phase II models. Reduce the complexity of each Phase II model while preserving its overall diversity of variables (comprehensiveness) and its essential behaviour. Typically the production of Phase III models will require (a) the
12
performance of sensitivity tests on the Phase II models to determine the relative importance of the various state-change processes, and (b) the aggregation of some Phase II variables. Aim to produce the simplest possible model that can explain the general ‘shape’ of the observed systemic behaviour or provide useful insights into management issues. The Phase III models will be improved versions of the Phase I models. They should include only the most important state variables and feedback links. Phase IV: Link the Phase III models together to examine the effects of interactions between the sub-systems. The overlapping nature of the sub-systems ensures that this process will have been a clear priority from the beginning, so the Phase III models will already share variables. The Phase III and Phase IV models are the ‘conceptual models’ of our ICM approach. Keep in mind that the aim of a management-related ICM exercise is not a ‘management tool’ but better understanding on the part of managers. The primary aim of the exercise is for the managers in different domains to gain an improved feel for (a) the operation of their own sub-system, and (b) possible interactions between their management domain and other domains. In any attempt to ‘distil out the essence’ we must, of course, avoid going too far in the opposite direction and over-simplifying the situation. Simplistic (as opposed to simple) models might themselves be easy to understand, but they yield few (if any) useful insights. The primary challenge in an ICM approach is to achieve an appropriate balance between complexity and simplicity. This requires that we wrestle with the complexity of the system (Phase I and Phase II) before we simplify and summarise (Phase III and Phase IV). In Figure 8 we have attempted to capture this characteristic of the ICM process. Note also that the progression from Phase I to Phase IV is a progression toward increasing integration. To some extent it will be a development through time, but it will often be valuable to iterate the Phase I → Phase II → Phase III progression. It is important to recognise that an ICM program will have immediate benefits. The integrative force comes more from collaborative model-building efforts than from model-running activities. While Phase I and Phase II models are intended to be steps towards Phase III and Phase IV models, they, of course, will be useful in their own right. The time and effort required to construct and test them will be resources well spent. Such endeavours can challenge our understanding of the feedback structure of the water system and our knowledge of the functional form of the major state-change processes. Further, the integrative effort that is required to construct reliable working models (of the type shown in Figures 36, 37 and 38) will pull together the results that have been generated to date by isolated, discipline-based research. It will also provide an immediate impetus for well-focused data gathering and research efforts within the ACT and region, and thus pave the way for the more difficult and longer-term challenge of developing adequate Phase III and Phase IV models. Thus, it is not necessary to wait until the end of a long evolutionary process that produces a highly refined integrated model, before an ICM effort becomes worthwhile. Work to develop even one cross-disciplinary, cross-sectorial, Phase I model will require the sharing of data and knowledge, and will promote an increase in mutual understanding.
13

An ICM program provides an effective way to develop high-level structural maps of complex systems, and to use those maps to guide, and integrate the output from, more detailed research and modelling efforts. Also, to the extent that working dynamic models are developed, ICM can help to identify system thresholds and bifurcations, and support scenario planning and adaptive management (of the model-based kind proposed by Holling et al 1978). We believe that ICM can drive the feedback loop of Figure 7 in the constructive direction—that is, it can increase the probability that data gathering and research activities will help managers to improve their practical understanding and their strategic planning.
Ran
ge o
f Int
egra
tion
Phas
e I
P
hase
II
P
hase
s III
& IV
Figure 8. The ICM Approach. In this diagram the boxes represent models. The size of the box represents the 'disciplinary reach' of the model. The vertical scale represents the ‘range of integration’ (extent of the system) covered by typical models. The small boxes at the bottom of the diagram represent the highly-focused Phase I models. In this phase small models are built in existing patches of discipline-based knowledge, or focused on specific behaviours and questions. The larger boxes in the centre of the diagram represent the Phase II models (expanded versions of the Phase I models that will be simplified to produce the Phase III models). The linked cluster of boxes at the top of the diagram represents a Phase IV model formed by coupling together the highly distilled Phase III models. The boxes are coloured (green, blue or violet) to represent their membership in one of three development streams, each focused on a specific behaviour or management question. The intensity of the colours represents the degree to which the essential dynamical structures have been isolated. The diagram is intended to give a sense of the overall flow of development from the unconstrained, opportunistic basis of the Phase I activity, through the expansion and overlapping of these models that takes place in Phase II, to the contraction and linking that occurs in Phases III and IV. Note, however, that the detailed flow of development is not a simple time-flow; the movement from one phase to the next can be iterated and development efforts will usually go on at all phases simultaneously.
14
4. MAPPING THE ACT WATER SYSTEM In this section we briefly describe our high-level study of the structure and dynamics of the ACT water system. One of our primary aims in this work was to explore the practicality of carrying out a full ICM study of the system. Here we summarise three aspects of our research: an historical investigation of the development of water-related policies in the ACT (§4.1 and Appendix A), a collaborative study of the interconnections between key variables of the ACT water system (§4.2), and an exploration of the possibility of constructing Phase I and II stock-and-flow models capable of revealing the basic dynamics of the ACT water system (§4.3). We present a summary of our findings in §4.4. 4.1 Historical Constraints The first stage of our study involved a survey of past policy decisions. Each significant new policy has changed the structure of the ACT system, and therefore has changed its dynamics. A study of the history of policy development is a powerful way to investigate the growth of complexity in the system, and has the potential to reveal the nature and causes of problems that challenge today’s managers. In this report we will use the term ‘historical constraints’ to refer to present-day management limitations or problems that have their origin in past policy decisions. According to our definition, historical constraints differ from ‘natural constraints’ (such as the law of gravity and the physical and chemical properties of water) in that, no matter how permanent they may appear to be, historical constraints are the result of human decisions, and so can be removed if there is sufficient reason. Of course, while some of the effects of past management decisions can be eliminated by reversing those past decisions, there is always the possibility that some of their effects will be permanent (for example, irreparable environmental damage). Any management action taken in a complex system will have a spectrum of outcomes, a significant proportion of which will be unexpected and delayed (see §2, Figure 3 and System Principle 2). The prevalence of delayed outcomes means that many of the constraints that impede present-day managers in the ACT are the result of decisions that were made at the time of Federation in 1901, or even earlier. This idea is illustrated in Figure 9. Given that unexpected outcomes may not appear for many decades after the original management actions were taken, the only practical way to investigate the causal composition of present-day conditions is via historical studies. In Appendix A we present an initial list of past policy decisions and management actions that we consider are likely to have an impact on present-day water managers. For example, policies associated with the selection of the site for the Commonwealth seat of government have produced a considerable legacy of conditions that constrain today’s managers in the Territory. Three of these historical legacies are described briefly below. They serve to illustrate both the historical context of ACT water management, and the path dependence that is typical of the evolution of complex adaptive systems.
15

timenow
outcome
a1 a2 a3 a4
1
2
3
4
Figure 9. Historical Constraints. In this diagram the horizontal axis represents elapsed time. The vertical axis labeled ‘outcome’ represents the values of four system variables that are affected by four separate management actions. The management actions are taken at times labeled a1, a2, a3, and a4. The curved lines show the way that the variable associated with each management action (i.e., the outcome of each management action) has varied over time—each line is labeled with a number that identifies its related management action. The vertical dashed line labeled ‘now’ represents the present. The diagram illustrates the notion that conditions that constrain present-day managers can have their origins in management actions distributed widely over the past. This diagram complements the ‘spectrum of outcomes’ view of Figure 3.
4.1.1 The ACT has a limited carrying capacity Canberra is unusual among the cities of the world, having been sited in a place that from the outset had a strictly limited ability to support growth. Most cities have evolved naturally over centuries at locations that offer clear natural advantages. These advantages have included good harbours, or locations on major trade routes, and abundant hinterland resources. In particular, cities have grown at places where there are ample supplies of fresh-water—near major rivers, lakes, or groundwater sources. When a city's water supply fails, growth stalls, and the city dies. This dependence on water is well illustrated in the case of India's Fatehpur Sikri. Completed in 1585 as the capital of the Mughal Empire, the city had to be abandoned after only 15 years because of its inadequate water supply. Canberra was established under Section 125 of the Commonwealth of Australia Constitution Act, 1900. As a result of inter-colonial rivalry this section provided not only for the creation of the seat of government but specified its general location, at least 100 miles from Sydney. The site for the seat of government was formally proclaimed in 1913. The site-selection criteria related primarily to Canberra’s intended role as the Commonwealth seat of government—the issue of the sustainability of the city in its own right received much less attention. The Act had specified that the Federal Capital
16
Territory should have a minimum area of 100 square miles. The area eventually chosen consisted predominantly of sheep-grazing land located in a semi-arid landscape with a so-called Mediterranean climate. Here the rain falls during the winter months when demand for water is low, but is scarce during the warmer season when demand is high. During the site-selection process (1899-1909), the establishment of a water supply for Canberra was seen as paramount. The source had to be identified, and infrastructure designed and built, before other major works could proceed. The boundary of the ACT was drawn to enclose the water catchments of the Cotter and the Gudgenby-Naas rivers. The catchment of the Queanbeyan River was not included in the ACT (see §4.1.2, below) and access to the waters of the Murrumbidgee River was excluded. The process of “securing Canberra’s water supply” determined the Territory’s actual size, shape, topography, hydrogeology and ecology—and so determined its long-term carrying capacity. A large proportion of the land area of the ACT is steep and characterised by poor soils—water catchment terrain that is unsuitable for agricultural pursuits. These early decisions have resulted in the creation of a community that does not have the resource base to be self-supporting. The Commonwealth seat of government could have been constructed within an existing viable city (as has been typical in other countries). Furthermore, such an approach would have minimised infrastructure and other development costs and would have isolated the Commonwealth from issues related to the maintenance and development of the host city. But the construction of a new city in an inland area of low rainfall, necessitated a relatively large area of land and has led to high infrastructure and development costs. Significant Commonwealth resources for the development of Canberra as Australia’s national capital were not made available until 1958 when the National Capital Development Commission was established. But, by granting the ACT self-government in May 1989 the Commonwealth has now, in large measure, withdrawn from the direct support of Canberra itself and has moved to the more conventional model of a seat of government that occupies only a small area within an existing city. Today the Commonwealth is identified most obviously with the Parliamentary Triangle, which includes the area around Lake Burley Griffin, and continues to fund the maintenance of only that section of the city that falls within the Triangle. Because of its limited resource base, the Territory continues to rely on Commonwealth grants and subsidies, while generating some income from sources such as tourism, land and water sales, and locally levied rates and taxes. This situation creates continuing problems for all ACT administrators and resource managers. At present water appears not to be a limiting factor, but it is likely to become so under a range of plausible climate-change scenarios. 4.1.2 The ACT does not manage the Queanbeyan River catchment When the boundary of the ACT was established in 1909, it did not enclose the neighbouring township of Queanbeyan or the Queanbeyan River catchment. There were two reasons why the NSW town and the catchment were excluded from the federal territory. The first was the strong belief in States' rights on the part of many delegates to the Constitutional Conventions in the 1890s. This attitude resulted in a general reluctance to give the new Commonwealth more territory and resources than was
17
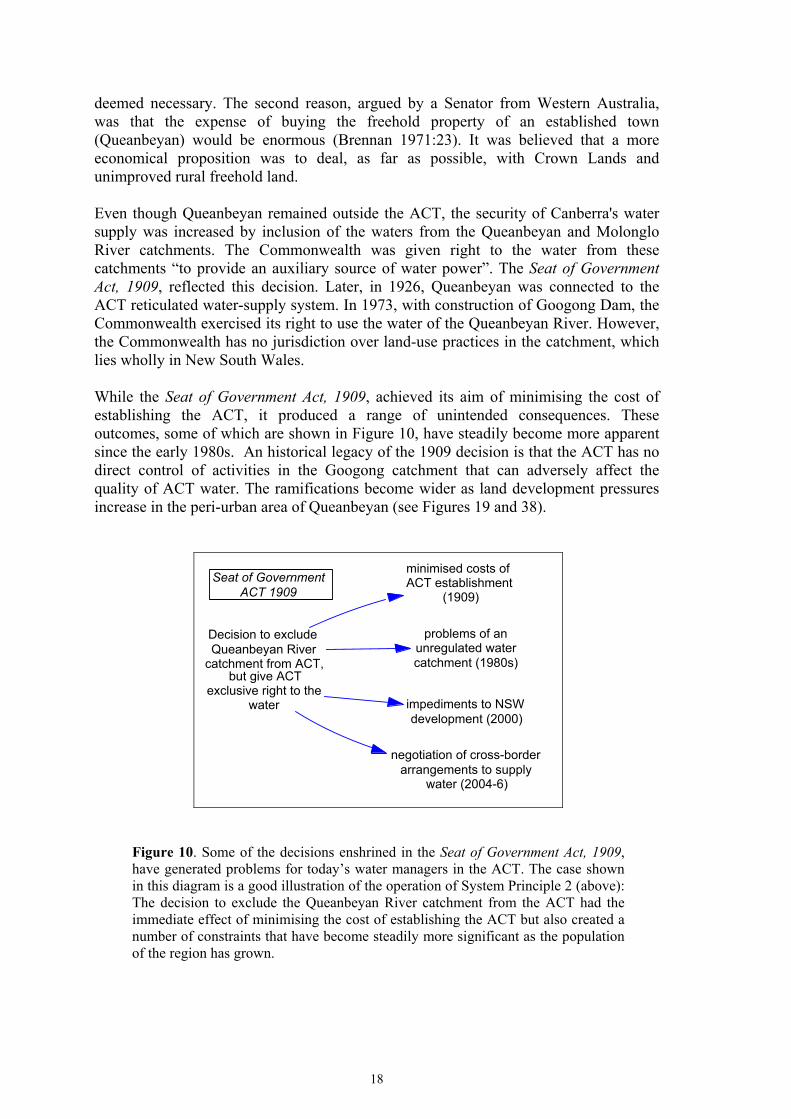
deemed necessary. The second reason, argued by a Senator from Western Australia, was that the expense of buying the freehold property of an established town (Queanbeyan) would be enormous (Brennan 1971:23). It was believed that a more economical proposition was to deal, as far as possible, with Crown Lands and unimproved rural freehold land. Even though Queanbeyan remained outside the ACT, the security of Canberra's water supply was increased by inclusion of the waters from the Queanbeyan and Molonglo River catchments. The Commonwealth was given right to the water from these catchments “to provide an auxiliary source of water power”. The Seat of Government Act, 1909, reflected this decision. Later, in 1926, Queanbeyan was connected to the ACT reticulated water-supply system. In 1973, with construction of Googong Dam, the Commonwealth exercised its right to use the water of the Queanbeyan River. However, the Commonwealth has no jurisdiction over land-use practices in the catchment, which lies wholly in New South Wales. While the Seat of Government Act, 1909, achieved its aim of minimising the cost of establishing the ACT, it produced a range of unintended consequences. These outcomes, some of which are shown in Figure 10, have steadily become more apparent since the early 1980s. An historical legacy of the 1909 decision is that the ACT has no direct control of activities in the Googong catchment that can adversely affect the quality of ACT water. The ramifications become wider as land development pressures increase in the peri-urban area of Queanbeyan (see Figures 19 and 38).
Decision to excludeQueanbeyan River
catchment from ACT,but give ACT
exclusive right to thewater
minimised costs ofACT establishment
(1909)
problems of anunregulated watercatchment (1980s)
impediments to NSWdevelopment (2000)
negotiation of cross-borderarrangements to supply
water (2004-6)
Seat of GovernmentACT 1909
Figure 10. Some of the decisions enshrined in the Seat of Government Act, 1909, have generated problems for today’s water managers in the ACT. The case shown in this diagram is a good illustration of the operation of System Principle 2 (above): The decision to exclude the Queanbeyan River catchment from the ACT had the immediate effect of minimising the cost of establishing the ACT but also created a number of constraints that have become steadily more significant as the population of the region has grown.
18

4.1.3 Canberra's parks and gardens have a high water-demand The development of Canberra was strongly influenced by the Garden City Movement. The concept of the Garden City developed in Britain in the early twentieth century with the aim of improving urban environments. It takes its name from the work of Ebenezer Howard who advanced the idea of garden cities in his To-Morrow: A Peaceful Path to Real Reform (1898). Howard’s ideas operated at two levels: (a) low-density residential planning, and (b) planning at the metropolitan, regional and national levels with concepts of green belts, satellite towns, and decentralisation of population. Planning for the garden city included ideas of a green, low-density city of tree-lined streets, parkways, parks, playgrounds and gardens. This was the anthesis of the congested industrial metropolis. The Garden City Movement inspired Walter Burley Griffin in his planning of Canberra. In the development of Canberra, the need to improve the landscape by planting trees was universally accepted, and the first planting occurred in 1915. Thomas Weston was responsible for afforestation and the development of the urban-forest character of inner Canberra during 1915-1926. He worked with advice from J.H. Maiden, Director of the Sydney Botanic Gardens. Between 1921-1924 some 1.2 million trees were planted. However, not all of the species selected were suited to such a low-rainfall area. The many exotic species planted placed a high demand on the water supply (Figure 11). The decision by the Federal Capital Commission not to install water meters was defended as a stimulant to the development of domestic gardens “in conformity with the garden city idea” (Freestone 1989:123). By 1962-63 the National Capital Development Commission (NCDC) was beginning to question how far the garden-city concept could be taken. Canberra was expanding, and it was becoming evident that the maintenance of its garden-city landscape could well require excessive resources. By 1966-67 the NCDC was obviously concerned about water consumption. It was noted that the city had a relatively higher per capita consumption of water than other inland towns, and this was directly related to its garden-city character. Yet, the NCDC re-affirmed the commitment to “the landscape character established in the city for more than 50 years” (NCDC Annual Report, 1966-67, p.30). Today, the increasing possibility of a hotter, drier, more variable regional climate has made it clear that adherence to the extant vegetation mix of Canberra’s gardens has potentially serious implications for the sustainability of the city. In Guidelines for Subdivision (1971) the NCDC addressed the evolution of the garden-city concepts to deal with environmental considerations. In 1972-73 it began a program to incorporate native grasses in the city's planting schemes. Nevertheless, such efforts go only part of the way to reducing the constraints on ACT water managers. It will take a long time to reduce the water requirements of Canberra’s gardens to a significant extent, particularly since the city’s managers are constrained by the need to maintain the attractiveness of the area.
19

Resources to developand maintain
Canberra's parks andgardens
Size of tree-plantingprogram for public
lands
Extent of parksand openspaces
+
+
Water usage forpublic and private
gardens
# trees provided tonew residential
blocks
Adequacy of ACTwater supply
Commitment to"Garden City"
character+
-
+
Ratio ofwater-dependent to
drought-tolerantspecies
Understanding ofAustralian climate
+
+
+-
+ B
Extent of adverseclimate change
-
Figure 11. The adoption of the Garden City concept, together with a limited understanding of the local climate, has led to the establishment of an overly water-dependent urban environment in Canberra. Gardens, public and private, consume some 40% of the water supplied to Canberra. This situation represents a significant constraint on ACT water managers as they work to reduce the load on the system.
4.2 The Structure of the ACT Water System The second stage of our study involved the construction of a number of focused influence and causal loop diagrams (CLDs). Much of this work was carried out in collaboration with scientists, managers and administrators from across the ACT community. Each diagram was focused on a fragment of the ACT system and was intended to help us to (a) identify the key variables of that aspect of the system, and (b) capture at least one view of the interplay between those variables. This process was also invaluable as preparation for our exploration of ways to study the management dynamics of the system (§4.3). In this section we present a selection of the influence diagrams and CLDs that were developed during this stage of the study. Figure 12. Changes in climate are recognised as likely to become principal drivers of changes in the long-term viability of the ACT water system. This diagram represents a particular view of one aspect of the ACT water system. All the text blocks describe key variables of the system—in this case the variables have been ordered to produce Driver-Hazard-Impact causal chains. Figure 13. Population is one of the principal factors that determine the load on the ACT water system. But it also affects the system in a number of other ways, some of which impact the system’s capacity to deliver a buffered water supply. There are two positive feedback (reinforcing) loops identified in this Driver-Hazard-Impact diagram. Loop R1: The growth of ACT population will stimulate the growth of satellite developments over the border in NSW. This peri-urban growth will in turn stimulate Canberra’s economy
20
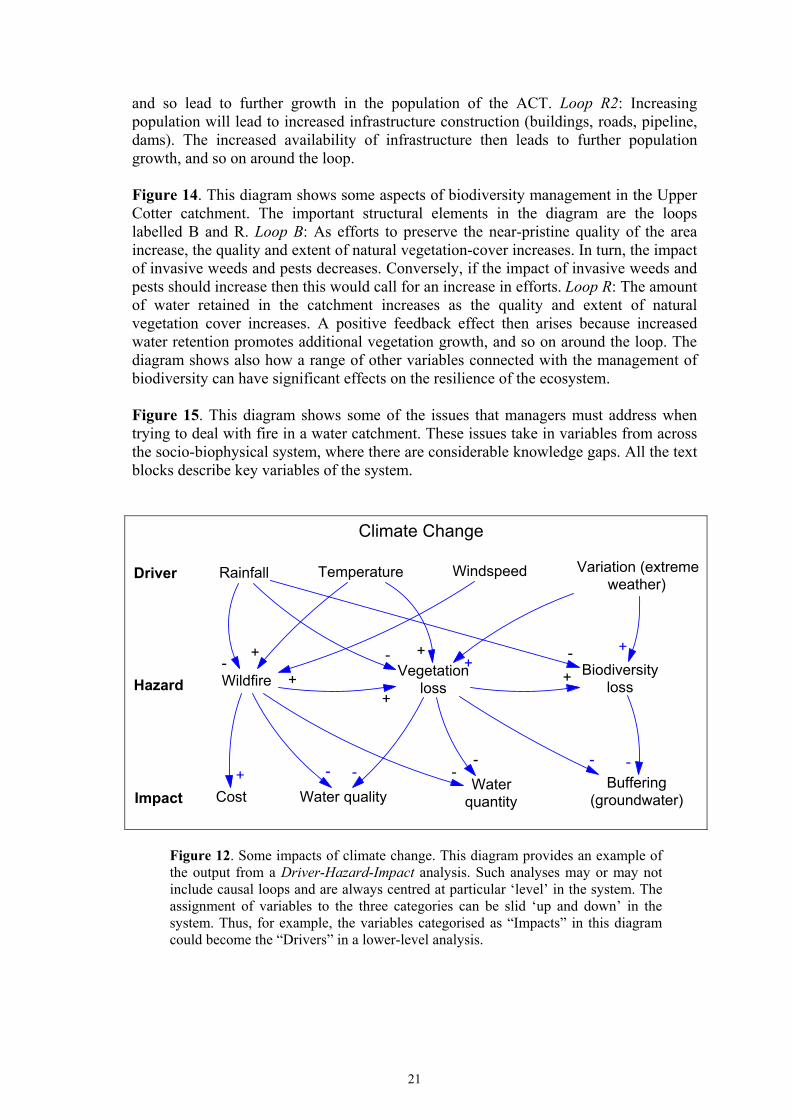
and so lead to further growth in the population of the ACT. Loop R2: Increasing population will lead to increased infrastructure construction (buildings, roads, pipeline, dams). The increased availability of infrastructure then leads to further population growth, and so on around the loop. Figure 14. This diagram shows some aspects of biodiversity management in the Upper Cotter catchment. The important structural elements in the diagram are the loops labelled B and R. Loop B: As efforts to preserve the near-pristine quality of the area increase, the quality and extent of natural vegetation-cover increases. In turn, the impact of invasive weeds and pests decreases. Conversely, if the impact of invasive weeds and pests should increase then this would call for an increase in efforts. Loop R: The amount of water retained in the catchment increases as the quality and extent of natural vegetation cover increases. A positive feedback effect then arises because increased water retention promotes additional vegetation growth, and so on around the loop. The diagram shows also how a range of other variables connected with the management of biodiversity can have significant effects on the resilience of the ecosystem. Figure 15. This diagram shows some of the issues that managers must address when trying to deal with fire in a water catchment. These issues take in variables from across the socio-biophysical system, where there are considerable knowledge gaps. All the text blocks describe key variables of the system.
Climate Change
Driver Rainfall Temperature Windspeed Variation (extremeweather)
Hazard WildfireVegetation
lossBiodiversity
loss
Impact Cost Water qualityWater
quantityBuffering
(groundwater)
-+
+
- ++
+ - --- - -
++
+ -
Figure 12. Some impacts of climate change. This diagram provides an example of the output from a Driver-Hazard-Impact analysis. Such analyses may or may not include causal loops and are always centred at particular ‘level’ in the system. The assignment of variables to the three categories can be slid ‘up and down’ in the system. Thus, for example, the variables categorised as “Impacts” in this diagram could become the “Drivers” in a lower-level analysis.
21

Population Change
Driver Satellitedevelopment
Load on watersystem
Hazard Recreation Forestryoperations
Infrastructureconstruction
Groundwaterextraction
Impact Water qualityWaterquantity Cost
Buffering(in-catchment
storage)
Population
+
+
+ + +
+
+
+
Buffering (builtstorage)
R1
R2
--- - - + +
-
Figure 13. Some impacts of population change. This diagram provides a second example of the output from an intermediate level Driver-Hazard-Impact analysis.
Efforts to preserve thenear-pristine quality of
the area
Perceived value ofecosystem functions in
the Upper Cottercatchment
Quality of nativespecies habitats
Impact ofinvasive
weeds & pests
# survey, mappingand monitoring
programs
Impact of fire
+
Extent ofbiodiversity
# self-sustainingpopulations of flora
& fauna
Quality and extentof natural
vegetation cover
+
-
+
+
Waterretention
++R
+
+
+
Carrying capacityfor native species
+
+
+
-
+B
Resilience ofecosystem
+
Biodiversity
Figure 14. Some factors that affect biodiversity in the Upper Cotter catchment. Note that, while biodiversity is supported by an increase in the amount of water retained in the catchment, an increase in water retention may well reduce the yield of the catchment, as seen from a water-supply point of view.
22

Efforts to manage firein the catchment
Extent of fire-trailnetwork
Requirements forconstruction and
maintenance
Water quality
+
Dispersal of feralanimal population
+
Mobilisationand delivery of
sediment tostreams
+
-
Integrity ofhydrologicalprocesses
-
Amount of infiltrationto groundwater +
Pressure toreduce fuel loads
+
Resilience ofecosystem
Extent ofprescribed
burning+
-
Stability oferosion-prone
zones
--
+
Fire Management
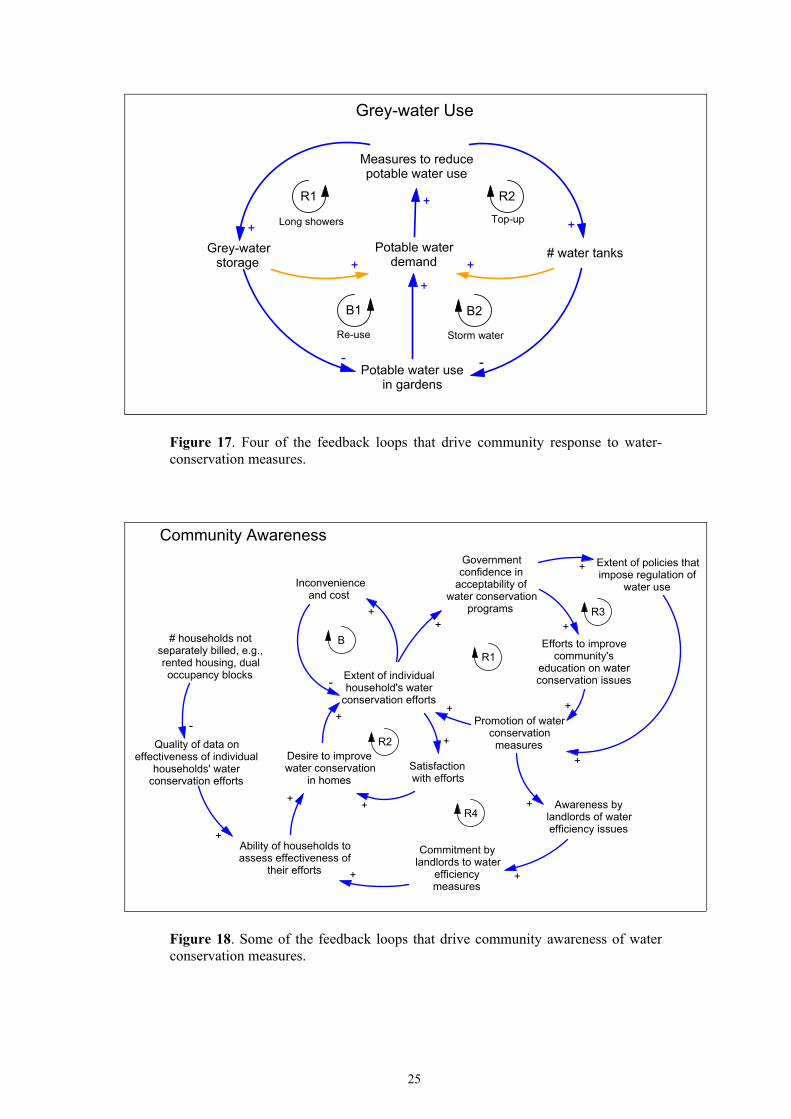
Figure 15. Some factors that affect fire management in the Cotter catchment. Figure 16. Management of recreation facilities in the Cotter catchment. This diagram shows some aspects of management of a national park in a water catchment. The text blocks describe key variables of the system. The important structural elements in the diagram are the balancing loops labelled B1 and B2. Loop B1: As the level of visitor impacts increases, the ability of the park to absorb those impacts decreases. This change will lead, in turn, to increased measures to reduce these impacts. Loop B2: The balancing effects of negative feedback establish a relationship between the number of park visitors and the quality of visitor experience. Too many visitors will reduce the quality of the experience, and so will reduce the popularity of the park and the number of visitors. The diagram also shows how the other variables can effect park management. An important variable is the resilience of the ecosystem. Figure 17. This diagram captures an aspect of the social sub-system of the ACT water system based on the domestic use of water, water reuse, and rain-water capture. The important structural elements in the diagram are the loops labelled B1, B2, R1 and R2. Together they represent a bi-stable system driven by two opposing forms of social behaviour. B1 (Re-use) and B2 (Storm water) are negative-feedback loops, each with four variables. They represent socially responsible behaviour where domestic users collect rainwater in tanks and store grey water for use in gardens. These activities reduce the load on the potable-water supply, and therefore contribute to sustainability. These balancing loops are opposed by the positive-feedback loops R1 (Long showers) and R2 (Top-up). These loops represent socially irresponsible behaviour and will begin to operate whenever users decide to exploit the opportunities presented by water-saving measures. This behaviour undermines the spirit and intention of regulations designed to reduce the load on the system.
23
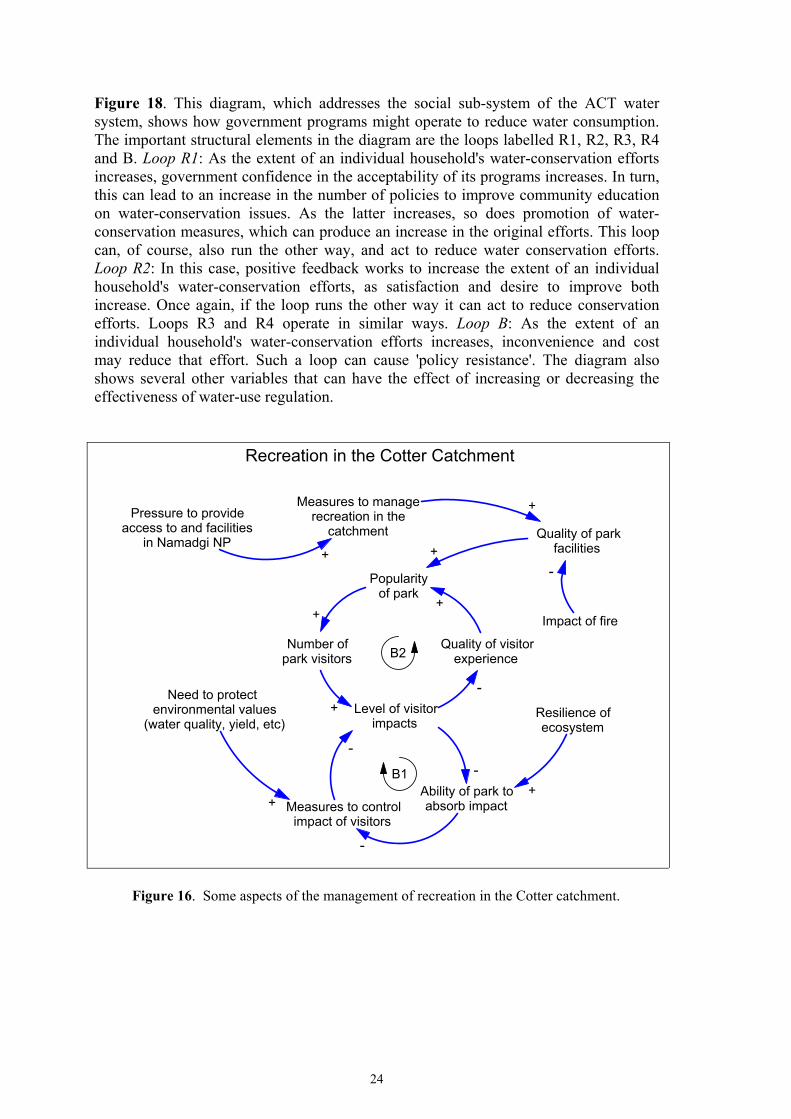
Figure 18. This diagram, which addresses the social sub-system of the ACT water system, shows how government programs might operate to reduce water consumption. The important structural elements in the diagram are the loops labelled R1, R2, R3, R4 and B. Loop R1: As the extent of an individual household's water-conservation efforts increases, government confidence in the acceptability of its programs increases. In turn, this can lead to an increase in the number of policies to improve community education on water-conservation issues. As the latter increases, so does promotion of water-conservation measures, which can produce an increase in the original efforts. This loop can, of course, also run the other way, and act to reduce water conservation efforts. Loop R2: In this case, positive feedback works to increase the extent of an individual household's water-conservation efforts, as satisfaction and desire to improve both increase. Once again, if the loop runs the other way it can act to reduce conservation efforts. Loops R3 and R4 operate in similar ways. Loop B: As the extent of an individual household's water-conservation efforts increases, inconvenience and cost may reduce that effort. Such a loop can cause 'policy resistance'. The diagram also shows several other variables that can have the effect of increasing or decreasing the effectiveness of water-use regulation.
Pressure to provideaccess to and facilities
in Namadgi NP
Measures to controlimpact of visitors
Level of visitorimpacts
Resilience ofecosystem
Number ofpark visitors
Popularityof park
+
+
+
+
Quality of parkfacilities+
Ability of park toabsorb impact
-
-
-
B1
Need to protectenvironmental values
(water quality, yield, etc)
+
Measures to managerecreation in the
catchment
Quality of visitorexperience
-
+
B2
+
Impact of fire
-
Recreation in the Cotter Catchment
Figure 16. Some aspects of the management of recreation in the Cotter catchment.
24
Measures to reducepotable water use
Grey-waterstorage
Potable waterdemand
# water tanks
Potable water usein gardens
+
-
+
-
++
+
+
R1 R2
B1 B2
Long showers Top-up
Re-use Storm water
Grey-water Use
Figure 17. Four of the feedback loops that drive community response to water-conservation measures.
Efforts to improvecommunity's
education on waterconservation issues
Ability of households toassess effectiveness of
their efforts
Satisfactionwith efforts
Promotion of waterconservation
measures
Extent of individualhousehold's water
conservation efforts
Desire to improvewater conservation
in homes
+
+
+++
+
R2
# households notseparately billed, e.g.,rented housing, dualoccupancy blocks
Quality of data oneffectiveness of individual
households' waterconservation efforts
+
-
Awareness bylandlords of waterefficiency issues
Commitment bylandlords to water
efficiencymeasures
+ +
+
Governmentconfidence in
acceptability ofwater conservation
programs+ +
R1
Inconvenienceand cost
-
+
B
Extent of policies thatimpose regulation of
water use
+
+
Community Awareness
R3
R4
Figure 18. Some of the feedback loops that drive community awareness of water conservation measures.
25

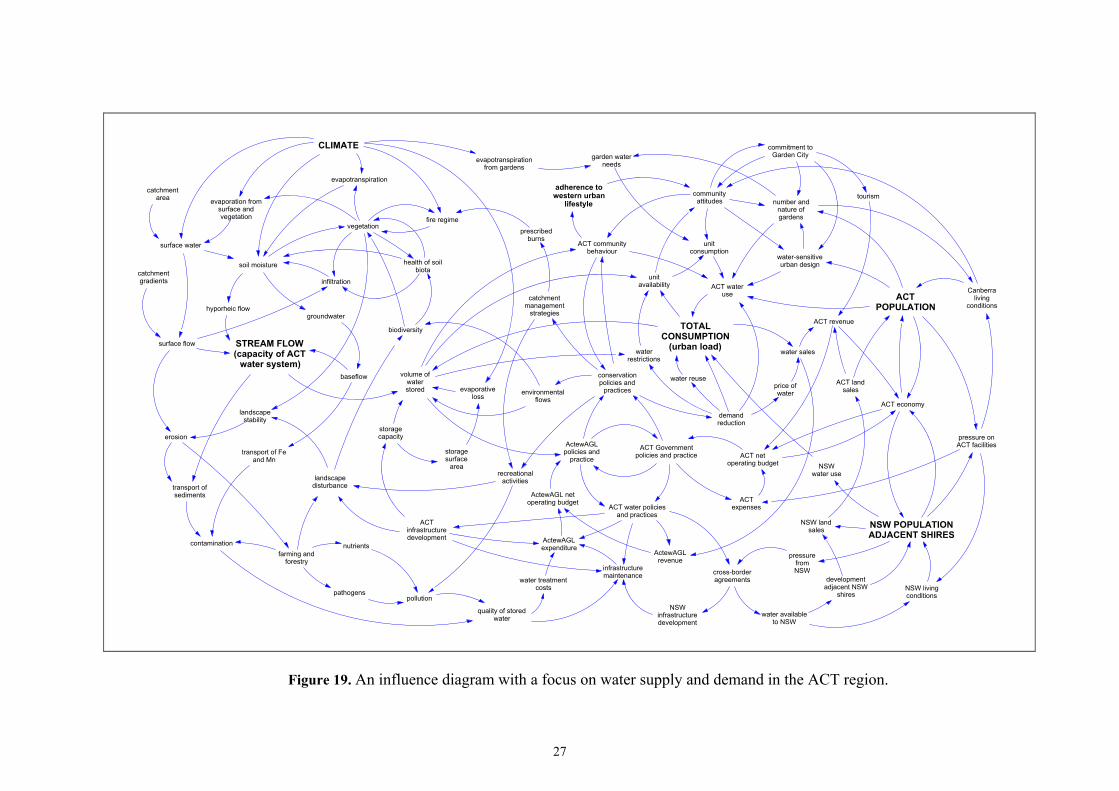
When water in the ACT is considered in its broad socio-biophysical context, a picture of considerable complexity emerges. Figure 19 is an influence diagram that represents our high-level view of the causal structure of the water system. This diagram shows the interactions that occur between 81 of the key elements that we identified in our historical and causal sub-structure studies. Note that many of these elements would need to be represented by an array of variables, often with their own interconnections, in any attempt to model the dynamics of the system—examples include Climate, community attitudes, and ActewAGL expenditure. What counts as a ‘high-level’ map of system structure depends on the use that will be made of the map—one group’s high-level map will be another’s low-level map. For example, while the overview diagram presented in Figure 5 (above) is useful in general discussions of the challenge of managing the ACT water system, it is clearly far too high-level to guide detailed data gathering and modelling efforts. The variables displayed in Figure 19 are a carefully selected subset of the variables that play a part in the dynamics of the ACT system as a whole. In constructing the diagram we have endeavoured to keep the ‘level’ consistent across the various sectors by focusing on variables that connect reasonably directly with water management issues. Figure 19 is organised around the two variables (Stream Flow and Total Consumption) that measure the balance between the capacity of the water system and the urban load on the system. We have also highlighted several other variables (Climate, ACT Population, adherence to western urban lifestyle, and NSW Population Adjacent Shires) that can be considered to relate to the major threats to the sustainability of the community. The variables in the diagram are clustered according to the following themes:
1. Water Quantity. Variables associated with catchment hydrological and landscape processes are presented in the upper left-hand corner of the diagram. Variables that relate to water storage and losses are included in the left-centre region of the diagram. Climate, which can be thought of as a set of exogenous variables, is a major driver of all of these processes.
2. Water Quality. Variables that are related to the generation and transportation of
water-supply contaminants and pollutants are displayed along the lower left-hand edge of the diagram. These variables link directly to those that measure the cost of water treatment and system maintenance.
3. Management Actions and Policy Processes. Variables related to the policies and
activities of ActewAGL and the ACT Government are located in the lower centre of the diagram.
4. Community Values and Actions. Variables that reflect the behaviour of members
of the ACT community, and the effect of this behaviour on water consumption, are placed in the upper centre of the diagram. These variables capture some of the cultural values that drive our Western urban lifestyle—including our attitudes to water use, the garden-city character of Canberra, and water-sensitive urban design.
26
farming andforestry
recreationalactivities
cross-borderagreements
ACT wateruse
NSWwater use
developmentadjacent NSW
shires
NSW POPULATIONADJACENT SHIRES
ACTPOPULATION
NSW landsales
ACT landsales
ACT revenue
ACT economy
TOTALCONSUMPTION
(urban load)
pathogens
nutrients
pollution
contamination
landscapedisturbance
number andnature ofgardens
price ofwater
ActewAGLexpenditure
ACTinfrastructuredevelopment
quality of storedwater
ACT water policiesand practices
demandreduction
water sales
water reuse
NSW livingconditions
water treatmentcosts
ACT netoperating budget
infrastructuremaintenance
Canberraliving
conditions
unitconsumption
commitment toGarden City
tourism
unitavailability
communityattitudes
garden waterneeds
evapotranspirationfrom gardens
ActewAGLpolicies and
practice
ACT Governmentpolicies and practice
conservationpolicies and
practices
storagecapacity
catchmentarea
prescribedburns
biodiversity
CLIMATE
vegetation
storagesurface
area
health of soilbiota
STREAM FLOW(capacity of ACT
water system)volume of
waterstored
groundwater
baseflow
evaporation fromsurface andvegetation
evapotranspiration
soil moisture
infiltration
surface flow
surface water
hyporheic flow
evaporativeloss
landscapestability
erosion
environmentalflows
catchmentgradients
transport of Feand Mn
transport ofsediments
fire regime
catchmentmanagement
strategies
waterrestrictions
adherence towestern urban
lifestyle
ACT communitybehaviour
pressure onACT facilities
ACTexpenses
water-sensitiveurban design
ActewAGL netoperating budget
ActewAGLrevenue
NSWinfrastructuredevelopment
water availableto NSW
pressurefromNSW
Figure 19. An influence diagram with a focus on water supply and demand in the ACT region.
27
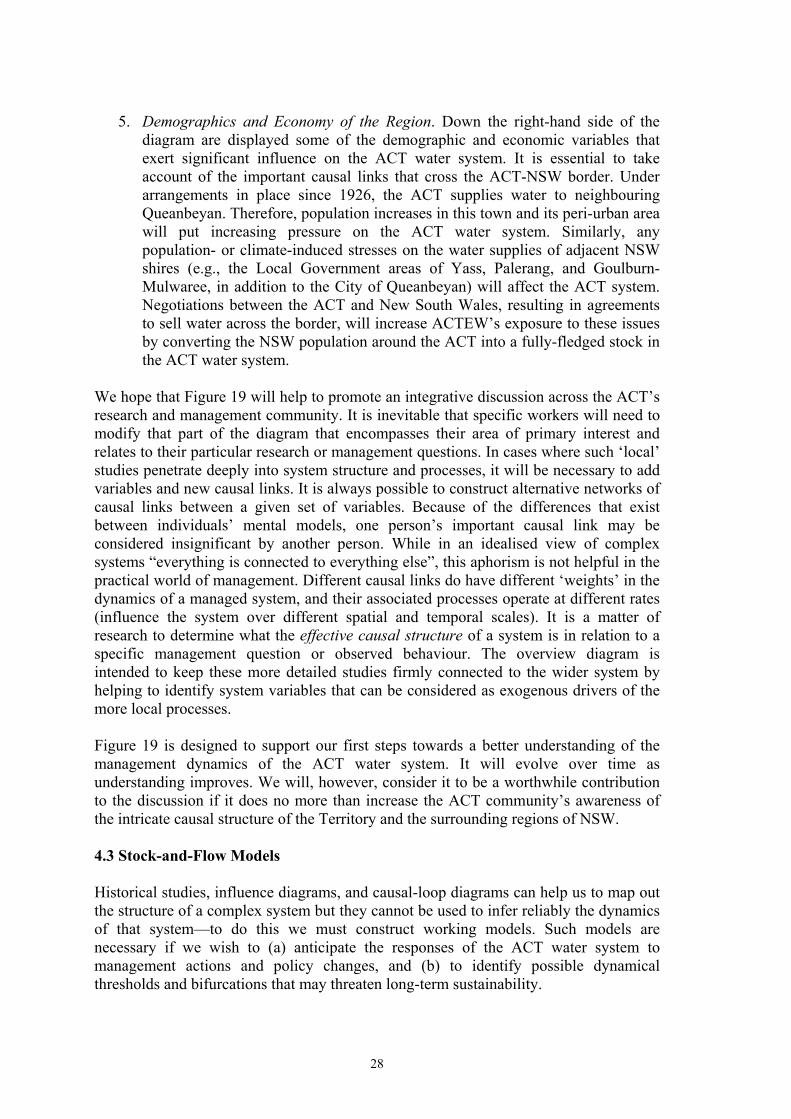
5. Demographics and Economy of the Region. Down the right-hand side of the
diagram are displayed some of the demographic and economic variables that exert significant influence on the ACT water system. It is essential to take account of the important causal links that cross the ACT-NSW border. Under arrangements in place since 1926, the ACT supplies water to neighbouring Queanbeyan. Therefore, population increases in this town and its peri-urban area will put increasing pressure on the ACT water system. Similarly, any population- or climate-induced stresses on the water supplies of adjacent NSW shires (e.g., the Local Government areas of Yass, Palerang, and Goulburn-Mulwaree, in addition to the City of Queanbeyan) will affect the ACT system. Negotiations between the ACT and New South Wales, resulting in agreements to sell water across the border, will increase ACTEW’s exposure to these issues by converting the NSW population around the ACT into a fully-fledged stock in the ACT water system.
We hope that Figure 19 will help to promote an integrative discussion across the ACT’s research and management community. It is inevitable that specific workers will need to modify that part of the diagram that encompasses their area of primary interest and relates to their particular research or management questions. In cases where such ‘local’ studies penetrate deeply into system structure and processes, it will be necessary to add variables and new causal links. It is always possible to construct alternative networks of causal links between a given set of variables. Because of the differences that exist between individuals’ mental models, one person’s important causal link may be considered insignificant by another person. While in an idealised view of complex systems “everything is connected to everything else”, this aphorism is not helpful in the practical world of management. Different causal links do have different ‘weights’ in the dynamics of a managed system, and their associated processes operate at different rates (influence the system over different spatial and temporal scales). It is a matter of research to determine what the effective causal structure of a system is in relation to a specific management question or observed behaviour. The overview diagram is intended to keep these more detailed studies firmly connected to the wider system by helping to identify system variables that can be considered as exogenous drivers of the more local processes. Figure 19 is designed to support our first steps towards a better understanding of the management dynamics of the ACT water system. It will evolve over time as understanding improves. We will, however, consider it to be a worthwhile contribution to the discussion if it does no more than increase the ACT community’s awareness of the intricate causal structure of the Territory and the surrounding regions of NSW. 4.3 Stock-and-Flow Models Historical studies, influence diagrams, and causal-loop diagrams can help us to map out the structure of a complex system but they cannot be used to infer reliably the dynamics of that system—to do this we must construct working models. Such models are necessary if we wish to (a) anticipate the responses of the ACT water system to management actions and policy changes, and (b) to identify possible dynamical thresholds and bifurcations that may threaten long-term sustainability.
28
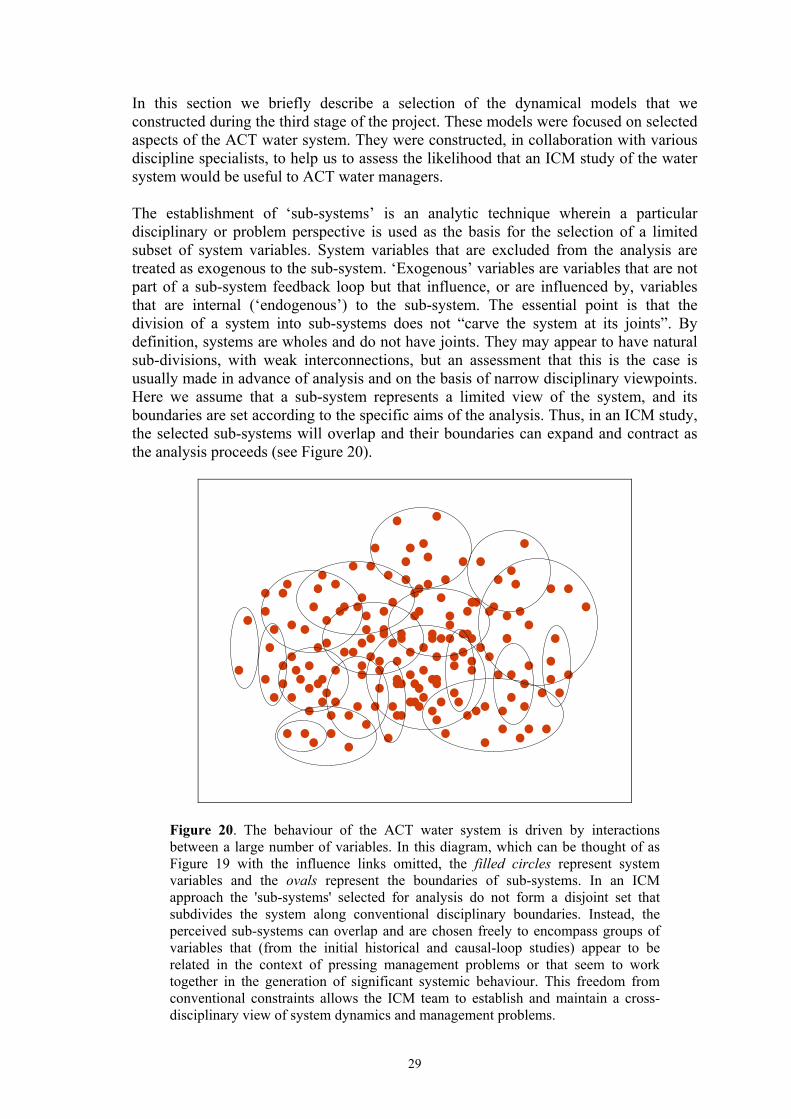
In this section we briefly describe a selection of the dynamical models that we constructed during the third stage of the project. These models were focused on selected aspects of the ACT water system. They were constructed, in collaboration with various discipline specialists, to help us to assess the likelihood that an ICM study of the water system would be useful to ACT water managers. The establishment of ‘sub-systems’ is an analytic technique wherein a particular disciplinary or problem perspective is used as the basis for the selection of a limited subset of system variables. System variables that are excluded from the analysis are treated as exogenous to the sub-system. ‘Exogenous’ variables are variables that are not part of a sub-system feedback loop but that influence, or are influenced by, variables that are internal (‘endogenous’) to the sub-system. The essential point is that the division of a system into sub-systems does not “carve the system at its joints”. By definition, systems are wholes and do not have joints. They may appear to have natural sub-divisions, with weak interconnections, but an assessment that this is the case is usually made in advance of analysis and on the basis of narrow disciplinary viewpoints. Here we assume that a sub-system represents a limited view of the system, and its boundaries are set according to the specific aims of the analysis. Thus, in an ICM study, the selected sub-systems will overlap and their boundaries can expand and contract as the analysis proceeds (see Figure 20).
Figure 20. The behaviour of the ACT water system is driven by interactions between a large number of variables. In this diagram, which can be thought of as Figure 19 with the influence links omitted, the filled circles represent system variables and the ovals represent the boundaries of sub-systems. In an ICM approach the 'sub-systems' selected for analysis do not form a disjoint set that subdivides the system along conventional disciplinary boundaries. Instead, the perceived sub-systems can overlap and are chosen freely to encompass groups of variables that (from the initial historical and causal-loop studies) appear to be related in the context of pressing management problems or that seem to work together in the generation of significant systemic behaviour. This freedom from conventional constraints allows the ICM team to establish and maintain a cross-disciplinary view of system dynamics and management problems.
29

A simple stock-and-flow model of the water-quantity aspects of the ACT water system is shown in Figure 21. With only two stocks and limited feedback, this model can be considered to lie at the low-complexity end of the Phase I models. The population level changes over time as the result of four growth processes—births, deaths, immigration, and emigration. The level of Stored Water is influenced by five processes—inflow from the catchment (labeled stream flow), evaporation from the surface of the dams, overflow from the dams, deliberately released environmental flows, and urban consumption. At any time the stream flow depends on the weather conditions and catchment parameters such as area, topography, and soil and vegetation types and conditions. Evaporation depends on weather conditions and the current surface area of the stored water, and overflow depends on the storage volume of the dams. Urban consumption is driven by weather conditions, the level of Population (including users in NSW), and lifestyle parameters that relate the prevalent urban lifestyle to water usage. Five feedback loops are specified in the model: Stored Water influences, and is influenced by, its four outflows, and Population and Growth interact in the same way. The presence of feedback loops means that this simple model can be dynamically complex.
Stored Water
stream flow
overflow
urban consumption
evaporation
surface area
environmental flow
weather conditions
weather conditionscatchment
parameters
Population
Growth
storage volume
lifestyle parameters
Figure 21. Basic Phase I model of the water-quantity aspects of the ACT water system. Recall that the rectangles in this diagram represent stocks (or state variables) and the double-lined arrows represent flows (processes) that can change the levels of the stocks, and the single-line curved arrows represent influence links (see Figure 2 for more details of the graphical conventions used here). This simple model has only two stocks Stored Water and Population. Population Growth is shown as a ‘bi-flow’ and so can range from positive flows (that increase Population) to negative flows (that decrease Population). In the graphical conventions used here the unfilled arrowhead of the bi-flow indicates the positive flow direction and the filled arrowhead indicates the negative flow direction.
30

We define the capacity C of the ACT water system to be the rate at which water flows out of the catchments into the Territory’s dams.3 The load L on the system is the rate at which water flows out of the dams. Here we take L to be the sum of evaporative losses (L1), overflow from the dams (L2), consumption by the ACT community (L3), and water released as environmental flows (L4). The performance of the system depends on the average value LCR of the load-to-capacity ratio:
LCR =LC
=L1 + L2 + L3 + L4
C
When LCR << 1 the resilience of the system will be high. The dams will remain reasonably full and any variation in C or L will be well buffered. As LCR → 1 the level of the dams will become more and more sensitive to variations in C and L and the resilience of the system will decrease steadily. The resilience of the system will be at a minimum when LCR ~ 1. Finally, when LCR > 1, the stored-water level will decrease at a rate dependent on LCR . Phase I models even less complicated than that shown in Figure 21 can be used to explore the dependence of water quantity on various assumptions about climate change and the functional form of the internal feedback processes. For example, the Stored Water time series shown in Figure 22 was computed using a simplified and normalised version of the Figure 21 model. Monthly rainfall was assumed to be a discrete random variable drawn from a Poisson distribution with a mean of 1 unit/unit time. No allowance was made for seasonal variation. The effect of stream-flow delays was modelled using third-order exponential smoothing. The initial load on the system was assumed to be 0.5 (in units of the average monthly rainfall) and this flow rate increased exponentially with time due to population growth. The parameter storage volume assumed in the computations was varied to reflect approximately the addition of the Corin and Googong dams to the water system—that is, the storage volume was approximately doubled at 90 months. All other parameters were assumed to be constant. A comparison between the time series generated by this model and the historical data (Figure 23) shows that normal statistical fluctuations in rainfall, together with a steady increase in LCR , can explain the bulk of the observed variation in storage levels. The effect of the severe drought in the early 1980s can be seen in the historical data. Despite the simplicity of the Figure 21 model, it enables us to carry out numerical experiments that provide considerable insight into the impact that random rainfall events can have on the Stored Water level. As expected the level of Stored Water becomes more sensitive to the random fluctuations in stream flow as LCR → 1 and this level begins to fall steadily once LCR > 1. When 0.6 < LCR < 1.0 the water level in the dams executes a constrained random walk and so the ‘shape’ of the time series produced by the model can vary enormously (compare Figures 22 and 24). 3 This means that the capacity of the ACT water system to handle the load imposed on it is not equal to the volume of the Territory’s water-storage dams. Dams act as buffers that decouple unequal water inflows and outflows, and thus allow a water system to handle short-term shocks. It follows that, when a new dam is built, the capacity of the water system increases only if there is a corresponding increase in the total catchment area of the system. The addition of more storage does increase the buffering capability of the system, thus allowing it to handle more extreme differences between dam inflows and outflows.
31
Untitled
Page 1
0.00 90.00 180.00 270.00 360.00
Months
1:
1:
1:
0.00
12.50
25.00
1: Stored Water
2:
2:
2:
0.00
1.00
2.00
2: LCR
Figure 22. A Stored Water time series. The horizontal axis represents a 30-year time period and the vertical axis represents Stored Water (in units of 10 GL) and average load-to-capacity ratio LCR in dimensionless units. As LCR → 1 the storage level becomes more sensitive to the random fluctuations in precipitation and the average value of Stored Water decreases once LCR > 1. Compare this time series with the historical data displayed in Figure 23.
Figure 23. Volume of water stored in ACT dams as a function of time. Data provided by Norm Mueller, Ecowise Environmental Pty Ltd.
32

Untitled
Page 1
0.00 90.00 180.00 270.00 360.00
Months
1:
1:
1:
0.00
12.50
25.00
1: Stored Water
2:
2:
2:
0
1
2
2: LCR
Figure 24. A low-probability time series generated by the base model. The parameter settings used for this computation were identical to those used in the simulation run represented in Figure 22. The difference between the two computations is caused purely by random differences in the simulated rainfall pattern—each computation produces a different realisation of the time evolution of the same system. Computations of this nature can demonstrate the possible impacts of variation in the corresponding real-world system.
In Figure 25 the basic model of Figure 21 has been expanded to include aspects of catchment hydrology. This new model has five state variables and, while it is more complex than its progenitor, its lack of extensive feedback loops leads us to classify it as Phase I. In this model it is assumed that rain falling in the catchment replenishes the stock of Surface Water. Some of the surface water evaporates, some runs off to augment the stock of Stream water, and some sinks into the ground (infiltration) to increase the stock of Soil Moisture. A portion of the soil moisture is lost through transpiration and the rest percolates further down to recharge the Ground Water. The stock of ground water then seeps out into the streams as baseflow. The stock of Stream water flows into the dams (stream flow) to be captured as Stored Water. In Figures 26 and 27 we display the output from a typical run of this model. The precipitation rate is assumed to be a discrete random variable drawn from a Poisson distribution with mean = 1 unit/unit time. The load on the system is assumed to be constant at 0.9 unit/unit time. In these computations the stock of Surface Water fluctuates rapidly in response to the random arrival of rain. The other stocks follow suit but with phase shifts and varying degrees of smoothing caused by the delays in the system. The construction of models at this level of complexity, with four or five stocks (state variables), provides a strong driver for the design and coordination of fieldwork. The functional form of each of the flow rates (process rates) must be specified before the model can be considered to be a good representation of the real-world system. And the computed behaviour of the stocks and flows provides a rich set of results for comparison with field data. When such
33
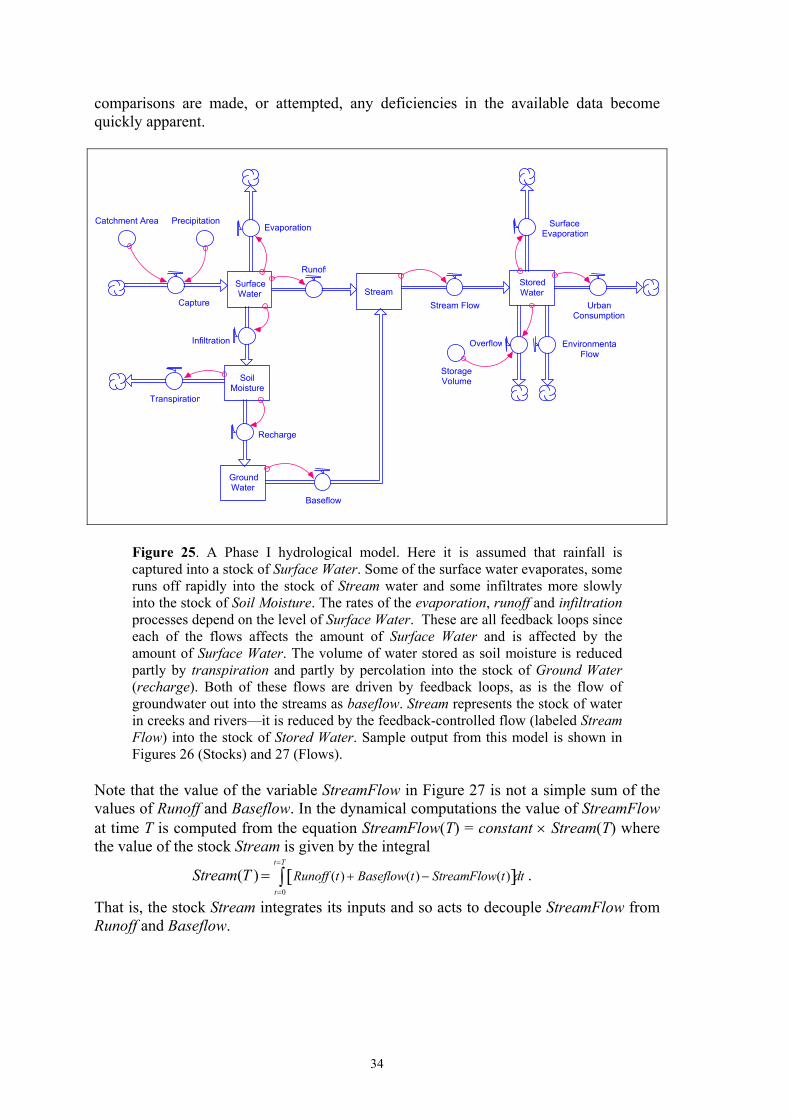
comparisons are made, or attempted, any deficiencies in the available data become quickly apparent.
Surface Water
Soil Moisture
GroundWater
Stream
Catchment Area
Stream Flow
Baseflow
RunoffStored Water
Infiltration
Recharge
EnvironmentalFlow
Overflow
Capture
PrecipitationEvaporation
Transpiration
Surface Evaporation
Storage Volume
Urban Consumption
Figure 25. A Phase I hydrological model. Here it is assumed that rainfall is captured into a stock of Surface Water. Some of the surface water evaporates, some runs off rapidly into the stock of Stream water and some infiltrates more slowly into the stock of Soil Moisture. The rates of the evaporation, runoff and infiltration processes depend on the level of Surface Water. These are all feedback loops since each of the flows affects the amount of Surface Water and is affected by the amount of Surface Water. The volume of water stored as soil moisture is reduced partly by transpiration and partly by percolation into the stock of Ground Water (recharge). Both of these flows are driven by feedback loops, as is the flow of groundwater out into the streams as baseflow. Stream represents the stock of water in creeks and rivers—it is reduced by the feedback-controlled flow (labeled Stream Flow) into the stock of Stored Water. Sample output from this model is shown in Figures 26 (Stocks) and 27 (Flows).
Note that the value of the variable StreamFlow in Figure 27 is not a simple sum of the values of Runoff and Baseflow. In the dynamical computations the value of StreamFlow at time T is computed from the equation StreamFlow(T) = constant × Stream(T) where the value of the stock Stream is given by the integral
Stream(T ) = Runoff (t) + Baseflow(t) − StreamFlow(t)[ ]t=0
t=T
∫ dt .
That is, the stock Stream integrates its inputs and so acts to decouple StreamFlow from Runoff and Baseflow.
34
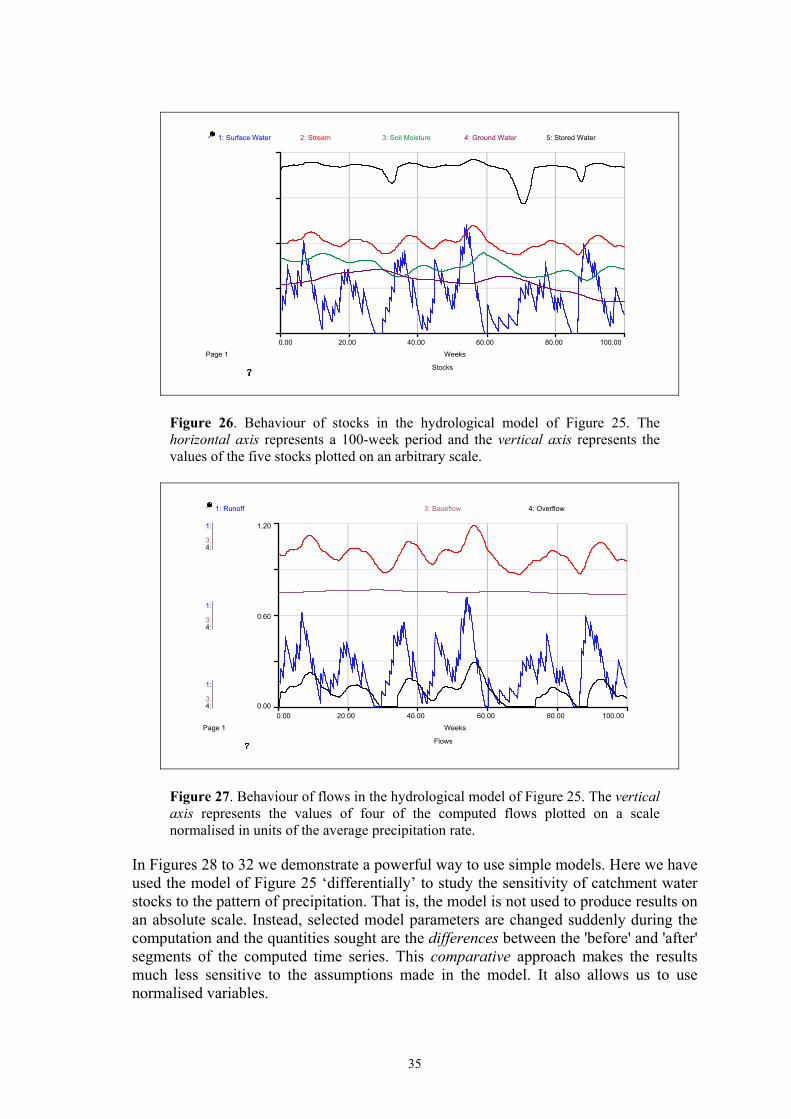
Stocks
Page 1
0.00 20.00 40.00 60.00 80.00 100.00
Weeks
1: Surface Water 3: Soil Moisture 4: Ground Water 5: Stored Water
2: Stream
2:
2:
2:
2: Stream Flow
Figure 26. Behaviour of stocks in the hydrological model of Figure 25. The horizontal axis represents a 100-week period and the vertical axis represents the values of the five stocks plotted on an arbitrary scale.
Flows
Page 1
0.00 20.00 40.00 60.00 80.00 100.00
Weeks
1:
1:
1:
3:
3:
3:
4:
4:
4:
0.00
0.60
1.20
1: Runoff 3: Baseflow 4: Overflow
Figure 27. Behaviour of flows in the hydrological model of Figure 25. The vertical axis represents the values of four of the computed flows plotted on a scale normalised in units of the average precipitation rate.
In Figures 28 to 32 we demonstrate a powerful way to use simple models. Here we have used the model of Figure 25 ‘differentially’ to study the sensitivity of catchment water stocks to the pattern of precipitation. That is, the model is not used to produce results on an absolute scale. Instead, selected model parameters are changed suddenly during the computation and the quantities sought are the differences between the 'before' and 'after' segments of the computed time series. This comparative approach makes the results much less sensitive to the assumptions made in the model. It also allows us to use normalised variables.
35
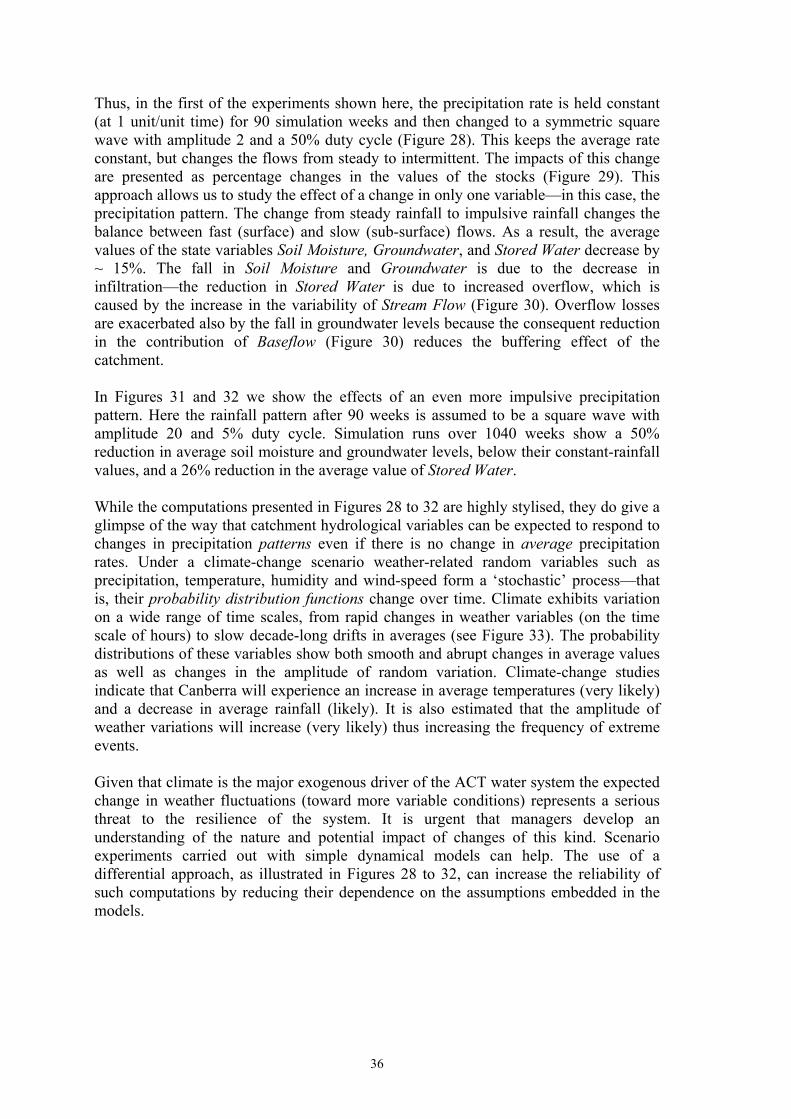
Thus, in the first of the experiments shown here, the precipitation rate is held constant (at 1 unit/unit time) for 90 simulation weeks and then changed to a symmetric square wave with amplitude 2 and a 50% duty cycle (Figure 28). This keeps the average rate constant, but changes the flows from steady to intermittent. The impacts of this change are presented as percentage changes in the values of the stocks (Figure 29). This approach allows us to study the effect of a change in only one variable—in this case, the precipitation pattern. The change from steady rainfall to impulsive rainfall changes the balance between fast (surface) and slow (sub-surface) flows. As a result, the average values of the state variables Soil Moisture, Groundwater, and Stored Water decrease by ~ 15%. The fall in Soil Moisture and Groundwater is due to the decrease in infiltration—the reduction in Stored Water is due to increased overflow, which is caused by the increase in the variability of Stream Flow (Figure 30). Overflow losses are exacerbated also by the fall in groundwater levels because the consequent reduction in the contribution of Baseflow (Figure 30) reduces the buffering effect of the catchment. In Figures 31 and 32 we show the effects of an even more impulsive precipitation pattern. Here the rainfall pattern after 90 weeks is assumed to be a square wave with amplitude 20 and 5% duty cycle. Simulation runs over 1040 weeks show a 50% reduction in average soil moisture and groundwater levels, below their constant-rainfall values, and a 26% reduction in the average value of Stored Water. While the computations presented in Figures 28 to 32 are highly stylised, they do give a glimpse of the way that catchment hydrological variables can be expected to respond to changes in precipitation patterns even if there is no change in average precipitation rates. Under a climate-change scenario weather-related random variables such as precipitation, temperature, humidity and wind-speed form a ‘stochastic’ process—that is, their probability distribution functions change over time. Climate exhibits variation on a wide range of time scales, from rapid changes in weather variables (on the time scale of hours) to slow decade-long drifts in averages (see Figure 33). The probability distributions of these variables show both smooth and abrupt changes in average values as well as changes in the amplitude of random variation. Climate-change studies indicate that Canberra will experience an increase in average temperatures (very likely) and a decrease in average rainfall (likely). It is also estimated that the amplitude of weather variations will increase (very likely) thus increasing the frequency of extreme events. Given that climate is the major exogenous driver of the ACT water system the expected change in weather fluctuations (toward more variable conditions) represents a serious threat to the resilience of the system. It is urgent that managers develop an understanding of the nature and potential impact of changes of this kind. Scenario experiments carried out with simple dynamical models can help. The use of a differential approach, as illustrated in Figures 28 to 32, can increase the reliability of such computations by reducing their dependence on the assumptions embedded in the models.
36
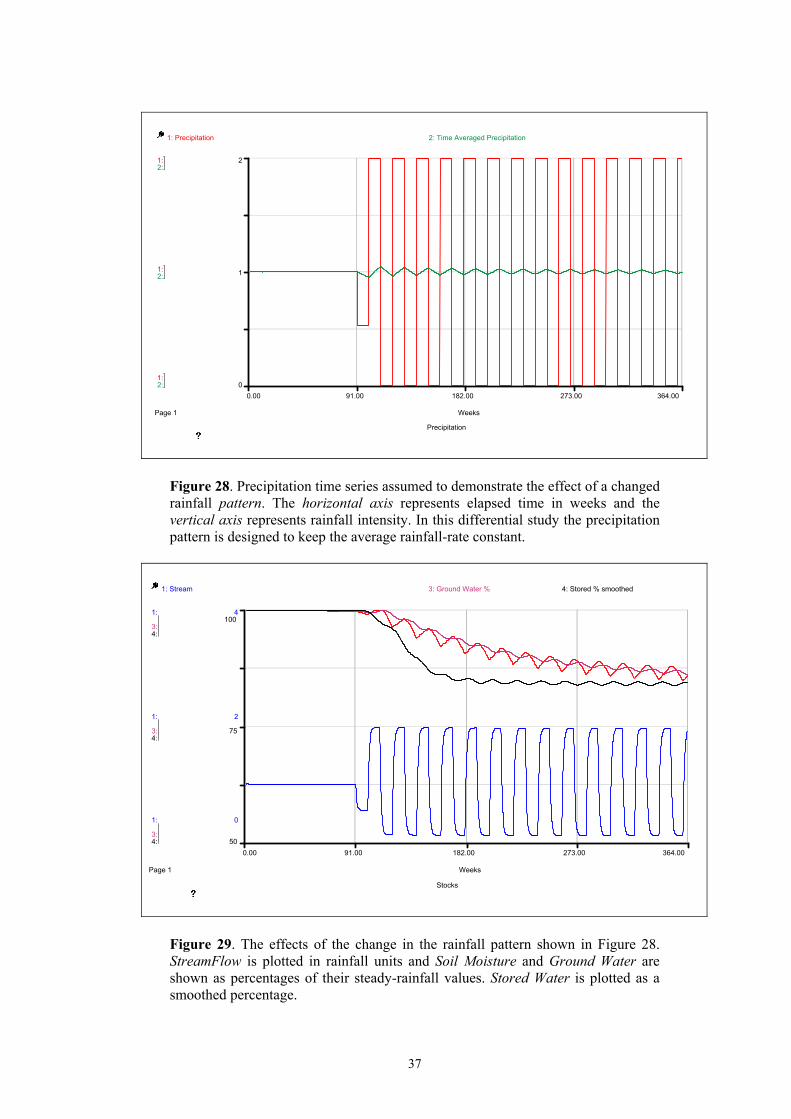
Precipitation
Page 1
0.00 91.00 182.00 273.00 364.00
Weeks
2:
2:
2:
0
1
2
2: Time Averaged Precipitation
1:
1:
1:
1: Precipitation
2:
2:
2:
2: Soil Moisture %
Figure 28. Precipitation time series assumed to demonstrate the effect of a changed rainfall pattern. The horizontal axis represents elapsed time in weeks and the vertical axis represents rainfall intensity. In this differential study the precipitation pattern is designed to keep the average rainfall-rate constant.
Stocks
Page 1
0.00 91.00 182.00 273.00 364.00
Weeks
1:
1:
1:
3:
3:
3:
4:
4:
4:
0
2
4
50
75
100
1: Stream 3: Ground Water % 4: Stored % smoothed
Figure 29. The effects of the change in the rainfall pattern shown in Figure 28. StreamFlow is plotted in rainfall units and Soil Moisture and Ground Water are shown as percentages of their steady-rainfall values. Stored Water is plotted as a smoothed percentage.
37

Baseflow and Overflow
Page 1
0.00 91.00 182.00 273.00 364.00
Weeks
1:
1:
1:
75
88
100
1: Baseflow %
2:
2:
2:
0
2
5
2: Overflow
1:
1:
1:
1: Precipitation
Figure 30. The effect of rainfall pattern on Baseflow and Overflow. The fall in Stored Water seen in Figure 29 is due to overflow losses. Overflow losses increase because an increased fraction of the captured water is carried by rapid surface flows. The effect is exacerbated by the reduced importance of groundwater buffering (see text for discussion).
Precipitation
Page 1
0.00 91.00 182.00 273.00 364.00
Weeks
2:
2:
2:
0
10
20
2: Time Averaged Precipitation
Figure 31. An extreme precipitation pattern (compare with Figure 28). The horizontal axis represents elapsed time in weeks and the vertical axis represents rainfall intensity. In this case rainfall intensity is assumed to be steady until week 90 and then become an asymmetric square wave with amplitude 20 and a 5% duty cycle. The average rainfall rate remains constant at 1 unit/unit time.
38
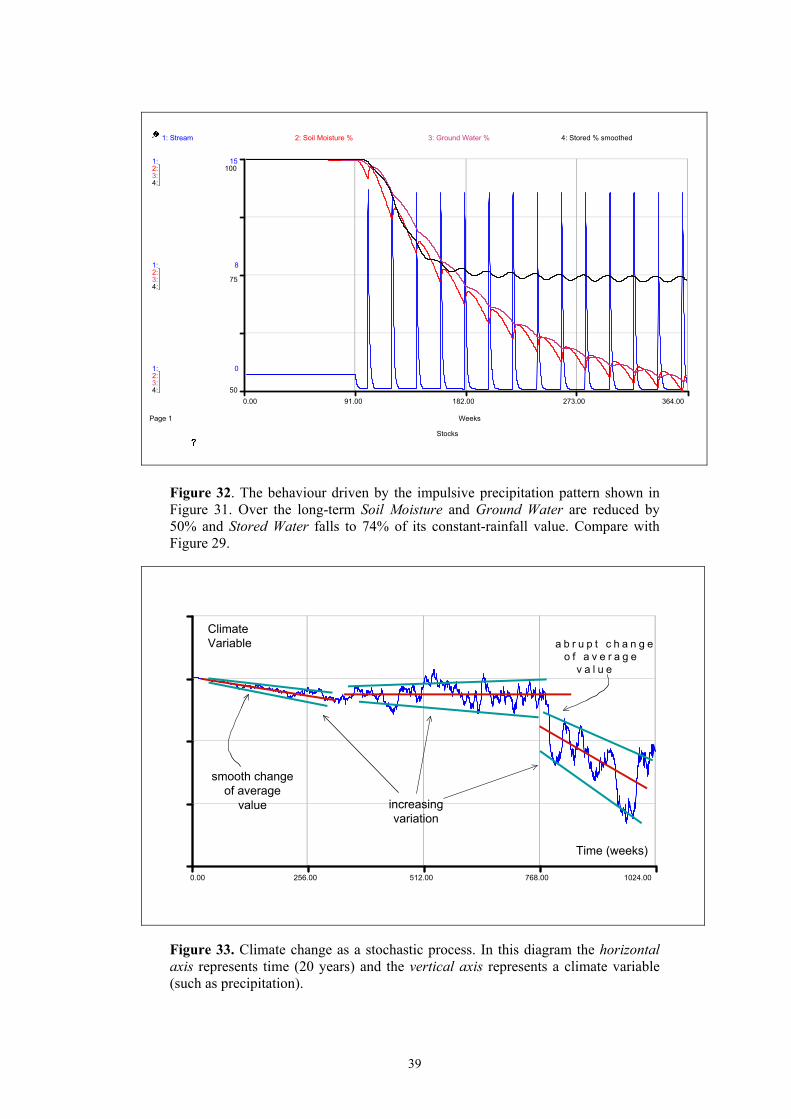
Stocks
Page 1
0.00 91.00 182.00 273.00 364.00
Weeks
1:
1:
1:
3:
3:
3:
4:
4:
4:
0
8
15
50
75
100
1: Stream 3: Ground Water % 4: Stored % smoothed
2:
2:
2:
2: Soil Moisture %
Figure 32. The behaviour driven by the impulsive precipitation pattern shown in Figure 31. Over the long-term Soil Moisture and Ground Water are reduced by 50% and Stored Water falls to 74% of its constant-rainfall value. Compare with Figure 29.
Climate Variation
0.00 256.00 512.00 768.00 1024.00
Time
Time (weeks)
ClimateVariable a b r u p t c h a n g e
o f a v e r a g ev a l u e
increasingvariation
smooth changeof average
value
Figure 33. Climate change as a stochastic process. In this diagram the horizontal axis represents time (20 years) and the vertical axis represents a climate variable (such as precipitation).
39

In the discussion so far we have concentrated on water quantity. In Figure 34 we present a Phase I model that is focused on one aspect of water quality. The model is designed to simulate the movement of iron (Fe) and manganese (Mn) atoms through the water system. While iron and manganese are non-toxic, they cannot be removed economically in water-treatment plants, and they cause a range of problems for water managers and consumers. They support the growth of bacterial slime on pipe walls, turn drinking water brown, and stain clothing in the wash. Groundwater tends to be anoxic (in the presence of organic material) and so any iron and manganese atoms present in the groundwater will tend to exist as ions. These ions are transported by the baseflow into surface steams (the process labeled Fe Mn Ions Coflow in Figure 34). In the oxygen-rich stream environment iron and manganese oxides are formed—the oxides flocculate and the flocs are carried by the stream flow into the dams (Fe Mn Flocs Coflow). In the dams the flocs sink into the bottom sediments (Settling). Decomposers in the bottom sediments consume oxygen, creating anoxic conditions under which the Fe and Mn flocs are reduced to release Fe and Mn ions (Reduction). When the dam turns over in April-June the ion-rich water is mixed up into the oxygen-rich levels of the dam (Turnover Mixing). There they are oxidised (Oxidation) to form flocs which once again sink back into the bottom sediments. There is not enough energy in the turnover flows to lift the oxide flocs up from the bottom sediments, but the Fe and Mn ions are transported easily. Water contaminated with Fe and Mn flows out into the reticulation system (Ions Coflow and Flocs Coflow).
Baseflow
Fe Mn Flocs
Fe Mn Ions CoFlow
Fe Mn concentration in groundwater
Suspended Flocs
Fe Mn Flocs CoFlow
Streamflow
Transport Efficiency
Sediment Flocs
Settling
Settling Time Constant
Sediment Ions
Reduction
Suspended Ions
Turnover Mixing
Mixing Efficiency
Turnover Events
Reduction Rate Constant
Oxidation
Oxidation Rate Constant
Flocs CoFlow
Urban Load
Ions CoFlow
Sediment O2 level
O2 level
Reticulated Fe Mn
Figure 34. A Phase I model of the flow of iron and manganese in ACT streams and dams. The blue double-lined arrows represent physical flows and the green double-lined arrows represent ‘chemical flows’. The behaviour of this model is illustrated in Figure 35.
40
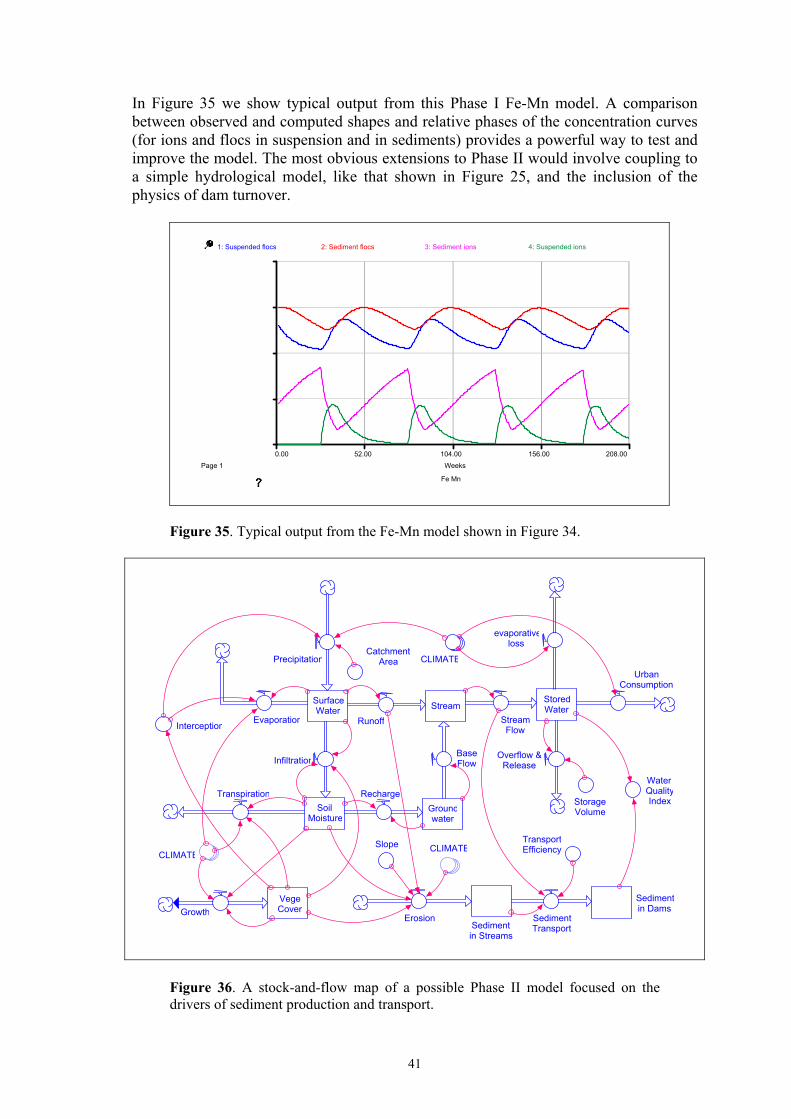
In Figure 35 we show typical output from this Phase I Fe-Mn model. A comparison between observed and computed shapes and relative phases of the concentration curves (for ions and flocs in suspension and in sediments) provides a powerful way to test and improve the model. The most obvious extensions to Phase II would involve coupling to a simple hydrological model, like that shown in Figure 25, and the inclusion of the physics of dam turnover.
Fe Mn
Page 1
0.00 52.00 104.00 156.00 208.00
Weeks
1: Suspended flocs 3: Sediment ions 4: Suspended ions
2: Sediment flocs
Figure 35. Typical output from the Fe-Mn model shown in Figure 34.
Transpiration
Surface Water
Groundwater
Soil Moisture
Recharge
Vege Cover
Base FlowInfiltration
StoredWaterStream
Sedimentin Dams
Water QualityIndex
Runoff
Precipitation
Evaporation
Sediment in Streams
CLIMATE
Stream Flow
GrowthErosion
CLIMATE
Sediment Transport
Interception
Catchment Area
evaporativeloss
Slope TransportEfficiency
Urban Consumption
Overflow &Release
StorageVolume
CLIMATE
Figure 36. A stock-and-flow map of a possible Phase II model focused on the drivers of sediment production and transport.
41
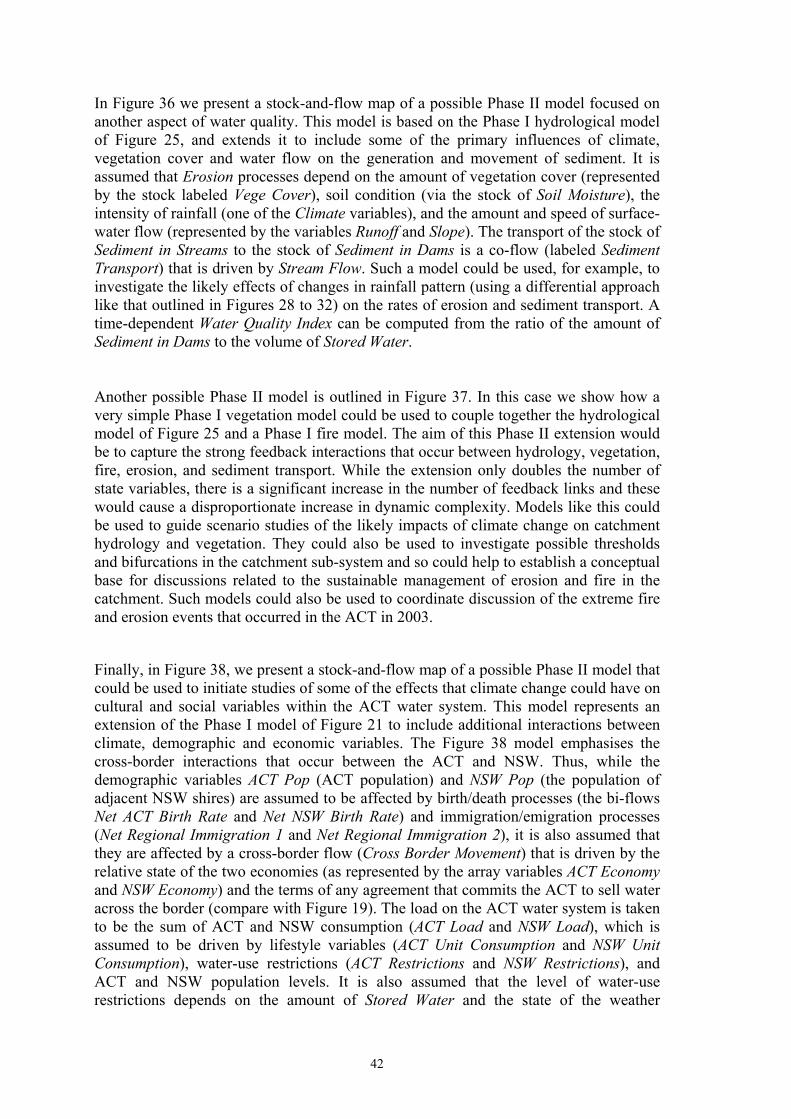
In Figure 36 we present a stock-and-flow map of a possible Phase II model focused on another aspect of water quality. This model is based on the Phase I hydrological model of Figure 25, and extends it to include some of the primary influences of climate, vegetation cover and water flow on the generation and movement of sediment. It is assumed that Erosion processes depend on the amount of vegetation cover (represented by the stock labeled Vege Cover), soil condition (via the stock of Soil Moisture), the intensity of rainfall (one of the Climate variables), and the amount and speed of surface-water flow (represented by the variables Runoff and Slope). The transport of the stock of Sediment in Streams to the stock of Sediment in Dams is a co-flow (labeled Sediment Transport) that is driven by Stream Flow. Such a model could be used, for example, to investigate the likely effects of changes in rainfall pattern (using a differential approach like that outlined in Figures 28 to 32) on the rates of erosion and sediment transport. A time-dependent Water Quality Index can be computed from the ratio of the amount of Sediment in Dams to the volume of Stored Water. Another possible Phase II model is outlined in Figure 37. In this case we show how a very simple Phase I vegetation model could be used to couple together the hydrological model of Figure 25 and a Phase I fire model. The aim of this Phase II extension would be to capture the strong feedback interactions that occur between hydrology, vegetation, fire, erosion, and sediment transport. While the extension only doubles the number of state variables, there is a significant increase in the number of feedback links and these would cause a disproportionate increase in dynamic complexity. Models like this could be used to guide scenario studies of the likely impacts of climate change on catchment hydrology and vegetation. They could also be used to investigate possible thresholds and bifurcations in the catchment sub-system and so could help to establish a conceptual base for discussions related to the sustainable management of erosion and fire in the catchment. Such models could also be used to coordinate discussion of the extreme fire and erosion events that occurred in the ACT in 2003.
Finally, in Figure 38, we present a stock-and-flow map of a possible Phase II model that could be used to initiate studies of some of the effects that climate change could have on cultural and social variables within the ACT water system. This model represents an extension of the Phase I model of Figure 21 to include additional interactions between climate, demographic and economic variables. The Figure 38 model emphasises the cross-border interactions that occur between the ACT and NSW. Thus, while the demographic variables ACT Pop (ACT population) and NSW Pop (the population of adjacent NSW shires) are assumed to be affected by birth/death processes (the bi-flows Net ACT Birth Rate and Net NSW Birth Rate) and immigration/emigration processes (Net Regional Immigration 1 and Net Regional Immigration 2), it is also assumed that they are affected by a cross-border flow (Cross Border Movement) that is driven by the relative state of the two economies (as represented by the array variables ACT Economy and NSW Economy) and the terms of any agreement that commits the ACT to sell water across the border (compare with Figure 19). The load on the ACT water system is taken to be the sum of ACT and NSW consumption (ACT Load and NSW Load), which is assumed to be driven by lifestyle variables (ACT Unit Consumption and NSW Unit Consumption), water-use restrictions (ACT Restrictions and NSW Restrictions), and ACT and NSW population levels. It is also assumed that the level of water-use restrictions depends on the amount of Stored Water and the state of the weather
42

(CLIMATE). The consumption variables ACT Load and NSW Load are allowed to affect the ACT economy via revenue from water sales (ACT Water Sales) and construction, maintenance, and operating costs (ACT Capital and Operating Costs).
Transpiration
Surface Water
Ground water
Soil Moisture
Recharge
Vege
Base Flow
Infiltration
Stored WaterStream
Death
Runoff
Precipitation
Evaporation
Soil Moisture
CLIMATE
Stream Flow
Growth
CLIMATE
CO2 Coflow
Interception
Contibution to Greenhouse Effect
Catchment Area
Litter
evaporative loss
Canopy Leaf Area
Canopy Combustion
Litter Production
Urban Consumption
Overflow & Release
Storage Volume
Decomposition
Litter Combustion
Carbon Dioxide
CLIMATE
Drought Factor
Leaf Growth
Canopy Equilirium
Ash in DamsAsh Coflow
CLIMATE
Fire Intensity
Control Burns
Litter
Ash
Trigger Events
Figure 37. A possible Phase II model that includes some of the feedback interactions that occur between hydrology, vegetation and forest fire in ACT catchments.
43
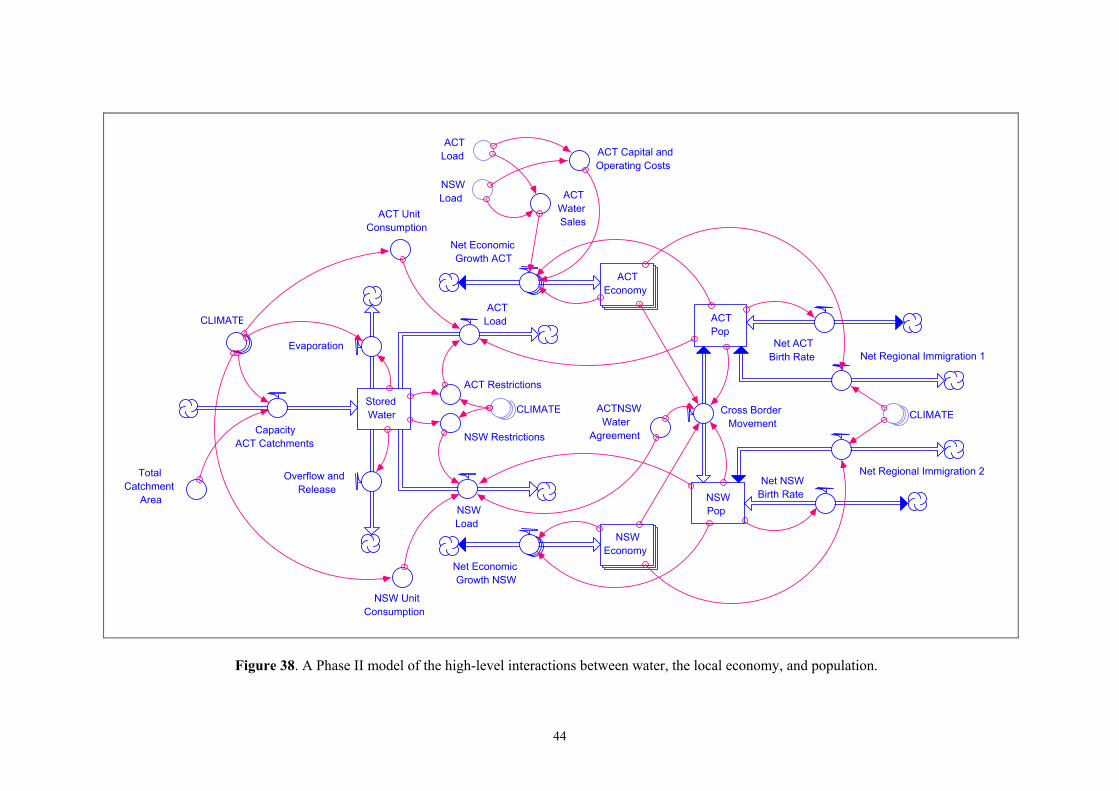
ACT Pop
Cross Border Movement
Net Regional Immigration 1
Net Regional Immigration 2
Net ACT Birth Rate
NSWPop
Net NSW Birth Rate
NSW Economy
ACT Economy
Net Economic Growth ACT
Stored Water
Capacity ACT Catchments
ACT LoadCLIMATE
NSW Load
NSW Unit Consumption
ACT Unit Consumption
ACTNSW Water
Agreement
Net Economic Growth NSW
Total Catchment
Area
Evaporation
Overflow and Release
CLIMATE
ACT Restrictions
NSW Restrictions
CLIMATE
ACT Load
NSW Load ACT
Water Sales
ACT Capital and Operating Costs
Figure 38. A Phase II model of the high-level interactions between water, the local economy, and population.
44

4.4 Conclusion We have carried out a three-stage study of the dynamical structure of the ACT water system. The study was aimed primarily at the development of an initial view of the interplay between the socio-biophysical variables that can affect the resilience and sustainability of the ACT community. A second aim was to investigate the feasibility of carrying out a dynamical study that would be useful to water researchers and managers. Our work involved the production of (a) an initial historical study of the evolution of the ACT policy environment, aimed at helping us to isolate the key variables of the ACT system (§4.1), (b) a high-level map of the feedback structure of the ACT water system (§4.2), and (c) a number of stock-and-flow maps and models of the ACT system (§4.3). We worked in collaboration with ACT researchers, planners, managers and administrators to identify key physical, biological and social variables and to construct a range of causal maps and conceptual models that provided an initial overview of the interplay between major sub-structures of the ACT system (see Figure 19). We ran two workshops that involved interested individuals from ACT research institutions, companies and government. The workshops were designed to help us to assess the progress of our study and to promote an integrative discussion, across research and management silos, of system structure and dynamical effects. Our study has confirmed the following views: 1. ACT water researchers and managers need to build a more integrated understanding of the behavioural characteristics of the ACT socio-biophysical system. The barriers facing those who seek to tackle this challenge include high levels of complexity, silo mentalities, defensive strategies, fragmented management and research efforts, and a lack of reliable apposite data. These barriers have perpetuated a generally poor understanding of the dynamics of the ACT as a whole. 2. While a significant amount of valuable research has been carried out in the ACT, the effort has been unevenly distributed across the system. There has been a strong focus on the biophysics of the Cotter catchment, particularly in the aftermath of the 2003 fires. Much less effort has been expended in investigating the socio-cultural aspects of water supply and demand. This is understandable, considering the difficulty of unearthing the causal structure of human activity systems, but it is not possible to understand the ACT water system adequately without including the human dimensions. 3. The research problem is exacerbated by fundamental data deficiencies. There are some valuable records, but in many cases the required data are non-existent, inaccurate, incomplete, discontinued, or labelled confidential. A major continuing problem is deciding what data are needed—excellent data can be of little use if they are not relevant to significant management issues. 4. Despite the above problems, we believe that the wide range of expertise available in the ACT community is sufficient to support a useful ICM study of the dynamics of the water supply-and-demand system. As described in §3, an ICM study begins with the opportunistic modelling of a variety of sub-systems, not necessarily disjoint, focused around existing knowledge ‘hot spots’ and key management issues (Phase I). We found that such models could be built with a relatively modest commitment of resources in
45
areas such as catchment hydrology, water quality, and fire behaviour. The introduction of vegetation dynamics will be more difficult, particularly because of the paucity of data. And, as might be expected, it will require a significantly greater effort again to model the socio-cultural dynamics of the ACT in a useful way. Nevertheless, we have come to believe that this is possible, provided that the focus of such endeavours is to produce simple, high-level models that capture a small number of essential behaviours.
5. RECOMMENDATIONS On the basis of this study we make the following recommendations. While these recommendations are addressed to ACTEW (the sponsor of this research) and so tend to focus on water management, they are necessarily relevant to resource management in general across the wider ACT and regional communities. R1. Promote a regional approach to sustainable resource use and management. The ACT water system is a complex adaptive system with many variables, state-change processes and feedback loops. Biophysical, social, cultural and economic forces are operating in and on the system, and any policy change has the potential to produce a wide range of significant effects. Some of these effects, usually the intended outcomes of the policy, will occur promptly but others will be delayed and difficult to relate back to their source in management actions. These delayed outcomes will often be unwanted. It follows that a systems approach is necessary for the development of effective water-management for the ACT. But any attempt to establish a systems approach will fail if it focuses on water alone and on the ACT alone. Our research has convinced us that there is an urgent need for a resource-management approach that is (a) regional, (b) multi-sectorial, and (c) able to span a wide range of timescales. The development of such a comprehensive approach is not the responsibility of any one sector of the ACT and regional community. The ACT is rich in specialists who can work across all dimensions of the system. There is no doubt that the Canberra region can become the site of a world-leading effort in the struggle to establish communities that are resilient and sustainable. For this to happen, however, there needs to be a rich and open collaboration between business, government, research institutions, and the wider community. As a major player in the ACT and (increasingly) the region, ACTEW can make a significant contribution to the establishment and maintenance of such a collaboration. R2. Promote the sharing of data and models across the ACT and the region. Most of the research carried out in support of ACT resource-use management is data poor. This is understandable, given the complexity of the system and extant resource limitations, but it represents a major impediment to progress. The situation is exacerbated when data collections are considered to be confidential by their owners. While there are good reasons why specific data sets must be protected, it would benefit the whole community if efforts were made to minimise such constraints. Similarly, within the ACT there are a number of people within research institutions and the planning and strategy groups of business and government who are involved in the
46

production of predictions of various kinds. While many of them may not think of their work as ‘modelling’, because they see themselves engaged in relatively simple calculations (typically using computer-implemented spreadsheets), they are all working with assumptions about conditions in the ACT and the way that the system will evolve over time. While they may not be constructing sophisticated computer models, their assumptions about how conditions will change over time (a) are based on experience of selected aspects of the behaviour of the ACT system, and (b) are dynamical models. These individuals and groups could play a key role in an ICM program if they were free to engage in collaborative work across institutional boundaries. In particular, a compilation and comparison of assumptions about the way that the ACT ‘works’ could be highly beneficial to all players. R3. Collaborate in the development of management-focused research questions and scenario-planning exercises. While system investigations are inherently integrative, a system as complex as the ACT offers many opportunities for researchers to get “lost in the labyrinth”. There is an urgent need to establish a collaborative process that can help to keep the research effort firmly tied to the management issues facing ACTEW and the ACT community. Below we present, as examples, several well-defined research questions that were developed collaboratively during this project, and that we believe meet the following criteria:
• Provide a practical way to cut through the complexity of the ACT system, • Ensure that water-focused research maintains a system-wide view, • Are well-enough bounded to drive practical and productive research, • Drive institutional and conceptual integration, and • Ensure that research remains focused on the main threats to the resilience and
sustainability of the ACT community. We consider the main threats to the ACT water system to arise from (a) climate change, (b) attempts to manage wildfire in the catchments, and (c) population growth coupled with a water-intensive urban lifestyle. The following research questions are designed to target these threats. Questions Q1 and Q2 focus on the catchment (the supply side of the equation), while Questions Q3 and Q4 focus on the community (the demand side of the equation): Q1: How might the yield and quality of water from the ACT catchments respond to changes in the normal patterns of rainfall and temperature variation? Climate change is a potential threat to the resilience and sustainability of the ACT. While growing attention has been focused on the possibility of long-term changes in average conditions, it is also necessary to take into account the possible effects of changes in the short-term variation of key variables such as precipitation levels and temperature (see Figure 33). By “short-term variation” we refer to the way that these variables fluctuate from day to day and through the seasons. A glimpse of the type of effects that such changes can have on Canberra’s water supply is given by the computations reported above in Figures 28 to 32.
47
A question of this type can form the basis for a robust, differential study (see §4.3, page 35). It can drive well-focused data gathering and guide well-bounded detailed research that is focused on the interplay between climate and catchment geology, hydrology and vegetation cover. Q2: How might alternative fire-management policies affect the response of ACT catchment vegetation to climate change? The development of effective policies for the management of wildfire in the ACT catchments is one of the most challenging issues facing ACT management. It is very easy to use ‘controlled’ burns to change the fire regime in the catchment, but there is a wide range of opinions concerning the possible outcomes of such actions. Indeed, some fire experts believe that it is not possible to use fire as a management tool in a sensible way, particularly in the Upper Cotter, and that the best policy is to do nothing. There is no doubt that deliberately burning catchment vegetation is one way that the ACT community can have a major impact on the performance of the catchment. During our study we have come to the conclusion that this is one area where the current lack of system understanding is potentially very dangerous. For this reason we recommend that policy makers move with caution, particularly in the face of the possibility that the ACT climate will change in a wildfire-promoting direction. This question provides the basis for an effective comparative study of the possible effects of different fire-management policies on the resilience of the catchment vegetation. The expertise to make such a research project successful is available in the ACT. Q3: Under what circumstances, from a water-system perspective, would it be necessary to limit the population of the ACT? A major factor in determining the resilience and sustainability of the ACT is the load-to-capacity ratio of the Territory’s water system (see §4.3, page 30). The capacity of the system is the rate at which water flows out of the catchment, and the load on the system depends on the rate of consumption by individuals summed over the whole of the water-using population. Given that climate change is likely to decrease capacity and increase consumption, it is essential that consideration be given now to the possibility of reducing the load on the system by controlling population growth and reducing individual consumption. There is widespread acceptance that climate change may well lead to increasing restrictions on individual water consumption in the ACT. But the notion that the growth of population in the region should, or even can, be controlled is obviously highly controversial. The question is not whether there is a limit to how many water-users can live in the region, but rather what is that limit. In many sectors the health and well-being of the region’s community is believed to depend fundamentally on continued population growth, while in other sectors the limited carrying capacity of the region (with respect to a wide range of resources—not just water) is a primary consideration. For this reason, the above question is formulated in a way designed to promote the development of ‘scenarios’ (Schwartz 1991, van der Heijden 1996, de Geus 1997).
48

The main aim of scenario planning is to examine alternative futures and the likely outcomes of a range of possible management strategies under these futures. An essential aspect of such studies is to consider at least some approaches that appear to be ‘impossible’. Such ‘off the wall’ scenarios help to generate a deeper understanding of the boundaries of the problem and can reveal the existence of historical constraints that look immutable, but can be removed given sufficient cause (see §4.1). We suggest, therefore, that an open, research-based discussion of the conditions that would make it essential to reduce, or at least limit, the population of water users in the ACT will help to establish a deeper understanding of the potential impact of climate change on the resilience and sustainability of the community. Such an exercise can be given additional weight by the use of simple dynamical models of the type discussed in §4.3. In this context it is worth recalling System Principle 3: The behaviour of a complex system cannot be optimised by optimising the behaviour of its parts taken separately. It follows that, in any attempt to maximise the resilience of the ACT community, it is necessary to integrate a wide range of perspectives when considering the optimal level for the region’s population. Q4: How can cross-border water agreements be formulated to minimise the dynamic complexity facing ACT water managers? The supply of water across the border into the adjacent shires of NSW, while beneficial for the region, increases the load on the ACT water system and increases the ‘dynamic complexity’ that must be dealt with by managers (see §2, page 5). As discussed in §3, any increase in dynamic complexity makes it harder for managers to understand the behaviour of the system and to minimise the unintended outcomes of their policies. These difficulties, in their turn, make it harder to assess the resilience and sustainability of the region in the face of climate change. The supply of water to support peri-urban development will have a considerable range of impacts on the ACT as a whole (see Figures 19 and 38). It will increase the load on the ACT water system and will affect discussions of the need for a new dam. It will influence the relationship between land values in the ACT and NSW, and so will affect development in the ACT. At the same time it will promote development in the adjacent NSW shires, and that development will have a range of impacts (both wanted and unwanted) on the ACT economy and infrastructure. It will make the control of individual water-consumption more difficult. From the point of view of ACT water managers, cross-border water sales must be seen as a mixed blessing. This is a classic systems problem and an ICM approach should be highly productive. Question Q4 is designed to promote a differential study of possible alternative forms of cross-border agreements. The establishment of an open integrative study will promote cross-sector discussions that will have immediate benefits for the regional community.
_______________________________________________________
49

6. REFERENCES 6.1 Cited in the Report Boyden, S., Millar, S., Newcombe, K., and O’Neill, B., 1981, The ecology of a city and its
people: The case of Hong Kong, Canberra: Australian National University Press. Brennan, F., 1971, Canberra in Crisis, a history of land tenure and leasehold administration,
Canberra: Dalton Publishing Co. de Geus, A., 1997, The Living Company, London: Nicholas Brealy. Forrester, J.W., 1961, Industrial Dynamics, Cambridge MA: Productivity Press. Freestone, R., 1989, Model Communities, The Garden City Movement in Australia, Melbourne:
Nelson. Holling, C.S. (ed), 1978, Adaptive Environmental Assessment and Management, Chichester:
Wiley. Howard, E., 1902, To-Morrow: A Peaceful Path to Real Reform, London: Swan Sonnenschein. Juuti, P.S. and Katko, T.S. (eds), 2005, Water, Time and European Cities, History Matters for
the Future, European Union Fifth Framework Program. The WaterTime Project can be found at http//:www.watertime.net
National Capital Development Commission, 1971, Guidelines for Subdivision. National Capital Development Commission, Annual Reports 1958-1988. Schwartz, P., 1991, The Art of the Long View, New York: Doubleday. Sterman, J.D., 2000, Business Dynamics, Systems Thinking and Modeling for a Complex World,
Boston: Irwin McGraw Hill. Tainter, J.A., 1988, The Collapse of Complex Societies, Cambridge: CUP. Tainter, J.A., 1995, Sustainability of Complex Societies, Futures, 27(4): 397-407. van der Heijden, K., 1996, Scenarios: The Art of Strategic Conversation, Chichester: Wiley. 6.2 Other Materials Consulted ACT Chief Minister's Dept, 2004, Shaping Our Territory. Revitalising the Cotter: action to date
and future opportunities. ACT Chief Minister's Sustainability Expert Reference Group, 2003, Water Resources in the
ACT and Region ― The Issues of Cotter and Googong Catchment Management, SERG Draft Discussion Paper.
ACT Council of Social Services and Conservation Council of the South East Region and
Canberra, 2003, Saving our Water Resources, an equitable and sustainable policy for the ACT.
50

ACT Government, 2003, Shaping Our Territory. Options and Opportunities for Non-Urban ACT. Overview.
ACT Government, 2004, Think water, act water, 3 volumes. ACT Government, 2005, Commissioner for the Environment, Australian Capital Territory,
Annual Report 2004-2005. ACT Government, 2006, Clean water, Healthy landscapes, Lower Cotter Catchment Draft
Strategic Management Plan. Actew Corporation, 1994, ACT Future Water Supply Strategy, our water our future. Actew Corporation, 2004, Future water options for the ACT region in the 21st century― An
assessment of the need to increase the ACT's water storage. Actew Corporation, 2005, Future water options for the ACT region in the 21st century― A
recommended strategy to increase the ACT's water supply. Actew Corporation, 2005, Future water options for the ACT region in the 21st century―
Sustainability Framework and Assessment Plan. Actew Corporation, http://www.actew.com.au/ Australia, 1983, Canberra Planning and Development, Report of the Committee of Review of
the Role and Functions of the National Capital Development Commission, Canberra: AGPS. Australia, Bureau of Meteorology, http://www.bom.gov.au/ Australian Bureau of Statistics, 2002, Year Book Australia - The Australian Capital Territory -
Canberra - Fifty Years of Development. Australian Bureau of Statistics, Australian Capital Territory Statistical Summary (annual). Baker, B., Austin, Barnett, Kearns, A. and Shugart, 2000, Global warming, local consequences
... can we predict the likely impacts of climate change in the ACT region? A discussion paper prepared by CSIRO Wildlife and Ecology for Actew Corp and Environment ACT.
Bates, B.C., Charles, S.P., Chiew, F., Harle, K., Howden, M., Kirby, M., Peel, M., Suppiah, R.,
Siriwardena, L., Viney, N.R., and Whetton, P.H., 2003, Climate change projections and the effects on water yield and water demand for the Australian Capital Territory. CSIRO Report for ACT Electricity and Water.
Binns, K. (ed), 1938, Handbook for Canberra, Canberra: ANZAAS and Cth Govt Printer. Birkeland, J. and Schooneveldt, J., 2003, Futures. Mapping regional metabolism: a decision-
support tool for natural resource management. Bradstock, R., Cohn, J., Gill, M., and Cary, G., 2006, Changing worlds and fire regimes?
Possible consequences of global change for bushfire risk management in the Sydney region. Paper presented at the 10th Biennial Australasian Bushfire Conference Bushfire2006.
Brennan, F., 1971, Canberra in Crisis, a history of land tenure and leasehold administration,
Canberra: Dalton Publishing Co.
51

Clark, R.L., 1980, Sphagnum growth on Ginini Flats, ACT. Clark, R.L., 1986, The Fire History of Rotten Swamp, ACT. Donovan, P., 1999, Lights! Water! . . . ACTEW! A history of ACTEW and its predecessors,
Canberra: ACTEW Corporation. Dudley, N. and Stolton, S., 2005, The role of forest protected areas in supplying drinking water
to the world's biggest cities, in T. Trzyna (ed), The Urban Imperative, California Institute of Public Affairs, Sacramento, Ca.
Environment ACT, 1999, Water Resources Management Plan. Environment ACT, 2000, An Integrated Catchment Management Framework for the ACT. Environment ACT, 2000, Nature based tourism strategy for the Australian Capital Territory. Environment ACT, 2001, An Integrated Catchment Management Framework for the ACT,
Implementation Plan June 2001-2003. Environment ACT, 2004, ACT Water Report 2003-2004. Gill, A.M., 2005, Landscape fires as social disasters: An overview of 'the bushfire problem',
Environmental Hazards, 6: 65-80. Grundy, P., Oakes, B., Reeder, L. and Wettenhall, R., 1996, Reluctant Democrats, The
Transition to Self-Government in the Australian Capital Territory, Canberra: The Federal Capital Press.
Hamilton, C. and Barbato, C., 2005, How Big Should Canberra Be?, The Australia Institute. Higgins, M., 1993, Brumby Running in Namadgi. Higgins, M., 1994, Namadgi Sites. Higgins, M., 2001, Surveyors at the Snowline, Surveying the ACT-NSW border 1910-15,
Canberra Historical Journal. Higgins, M., n.d., Watershed in History, some themes in the European history and heritage of
the Brindabellas, in Fraser, I. and McJannett (eds), Brindabella Heritage, Canberra & South-East Region Environment Centre.
Hope, G. and Wade, A., 2004, Response of Sphagnum Bogs to Mountain Fire Regime. Report to
ACTEW Corp, 6 Feb 2004. Hunter Water, 2003, Demand Management Strategy, Hunter Water Corp. King, K., Bradstock, R., Cary, G., Weber, R., Gill, M and Hilliker, C., n.d., Managing Bushfire
Risk in a Changing World, Bushfire CRC poster paper. Lea-Scarlett, E., 1968, Queanbeyan: district and people, Queanbeyan Municipal Council. Lea-Scarlett, E., 1970, A short history of Queanbeyan, Queanbeyan Municipal Council.
52
Lindenmayer, D., 2006, Salvage harvesting―past lessons and future issues. The Forestry
Chronicle, 82 (1) 1-6. Linge, G.J.R., 1961, Canberra after Fifty Years, Geographical Review, 51(4): 467-486. Linge, G.J.R., 1975, Canberra Site and City, Canberra: ANU Press. Moore, B., 1999, Cotter Country, a history of the early settlers, pastoral holdings and events in
and around the County of Cowley, NSW, Canberra: G. Moore. Parliament of the Australian Capital Territory,
http://www.parliament.curriculum.edu.au/act.php3 Parliament of the Commonwealth of Australia, 1992, Our Bush Capital, Protecting and
Managing the National Capital's Open Spaces, Report of the Joint Committee on the National Capital, Canberra: AGPS.
Purchase, S. (ed), 1994, As I Recall, Reminiscences of Early Canberra by Charles Daley,
Canberra: Mulini Press with Canberra and District Historical Society. Resource and Environmental Consulting (ANU) Group, 1973, Resource and Management
Survey of the Cotter River Catchment. The Canberra Times, 2005-2006, various news items on water-related issues. Wade, A., White, I., Worthy, M. and Mueller, N., 2005, Water Quality Report Card for Cotter
River Storages, Winter 2005. Report to Actew Corp. Wasson, R.J., Croke, B.F., McCulloch, M.M., Mueller, N., Olley, J., Starr, B., Wade, A., White,
I., Whiteway, T., 2003, Sediment, particulate and dissolved organic carbon, iron and manganese input to Corin reservoir. Report to ActewAGL, 25 July 2003.
Watson, F., 1927, A Brief History of Canberra, Canberra: Federal Capital Press. White, I., Wade, A., Barnes, R., Worthy, M., Mueller, N. and Knee R., 2006, Impacts of the
January 2003 Wildfires on ACT Water Supply Catchments. Paper presented at Enviro 06, 9 May 2006.
White, I., Wade, A., Worthy, M., Mueller, N., Daniell, T. and Wasson, R, 2006, The
vulnerability of water supply catchments to bushfires: Impacts of the January 2003 wildfires on the Australian Capital Territory, Australian Journal of Water Resources, 10 (2).
Wright, W. and Jones, D., 2003, Long-term rainfall declines in southern Australia, in R. Stone
and I. Partridge (eds), Proceedings of National Drought Forum: Science for Drought, April 2003, Brisbane, Queensland DPI, p.35-40.
53

APPENDIX A
SELECTED POLICY DECISIONS AFFECTING THE ACT WATER SYSTEM
Our approach to building up a policy history of water management in the ACT draws on the methods used in the WaterTime project, a recent European study funded by the European Commission and undertaken by partners from institutions in Hungary, Spain, Finland, Germany and the UK (Juuti and Katko 2005). WaterTime examines the impact of long-term strategic decisions taken with respect to water supply and sanitation in 29 cities in 13 countries. In Table 1 we have listed some of the key strategic decisions in the history of the ACT that have particular relevance to water. Events in this policy history can be considered in two periods: • 1909-1988, when the Territory was under Commonwealth jurisdiction. It begins in
1909, when the NSW Government began to survey the area and to identify the water-supply catchments.
• From 1988, when the Territory gained self-government. Many of the decisions in Table 1 have set the development path of the ACT water system. In particular, it is clear that 1988 represents a crucial ‘bifurcation point’ in the ACT water system. That is, a point in time where the dynamical structure of the system suddenly changed significantly.
54

TABLE 1 Key Strategic Decisions in ACT History
Commonwealth Jurisdiction (1909-1988) Year Event Drivers Responsible Agency Outcomes Management Issues1909 Report of Surveyor
Scrivener
Requirement under the Australian Constitution to identify an area for the seat of government
Federal Govt NSW Govt
Recommendation to include Queanbeyan, Molonglo and Cotter water catchments
Creation of ACT and its water catchment
1911 2360 km2 land transferred NSW → ACT
As above Federal Govt NSW Govt
ACT, its borders and water catchments defined
As above
1911 Govt announced a competition for the design of the federal capital
Practical needs of establishing a national capital
Federal Govt board of experts
1912 May 23 —Walter Burley Griffin winner of competition
Urban planning and design
1912- 1915
Construction of Cotter Dam
Infrastructure needs of ACT water supply system
Federal Govt - Dept of Interior
Cotter pumping station, pipeline, reservoirs on Mt Stromlo & Mt Russell
Water supply
1914 Cotter River Ordinance [Cth] (now repealed)
Protection of water supply catchment
Dept of Interior Defined land-use practices that were permitted in catchment
Water supply
1914 Red Hill reservoir built Population growth in Acton/Duntroon
Dept of Interior Extension of infrastructure Water supply
1925 Federal CapitalCommission created
Need for an agency to assume responsibility for ACT administration
Federal Capital Commission
Creation of new administrative body Development of city as seat of government
55
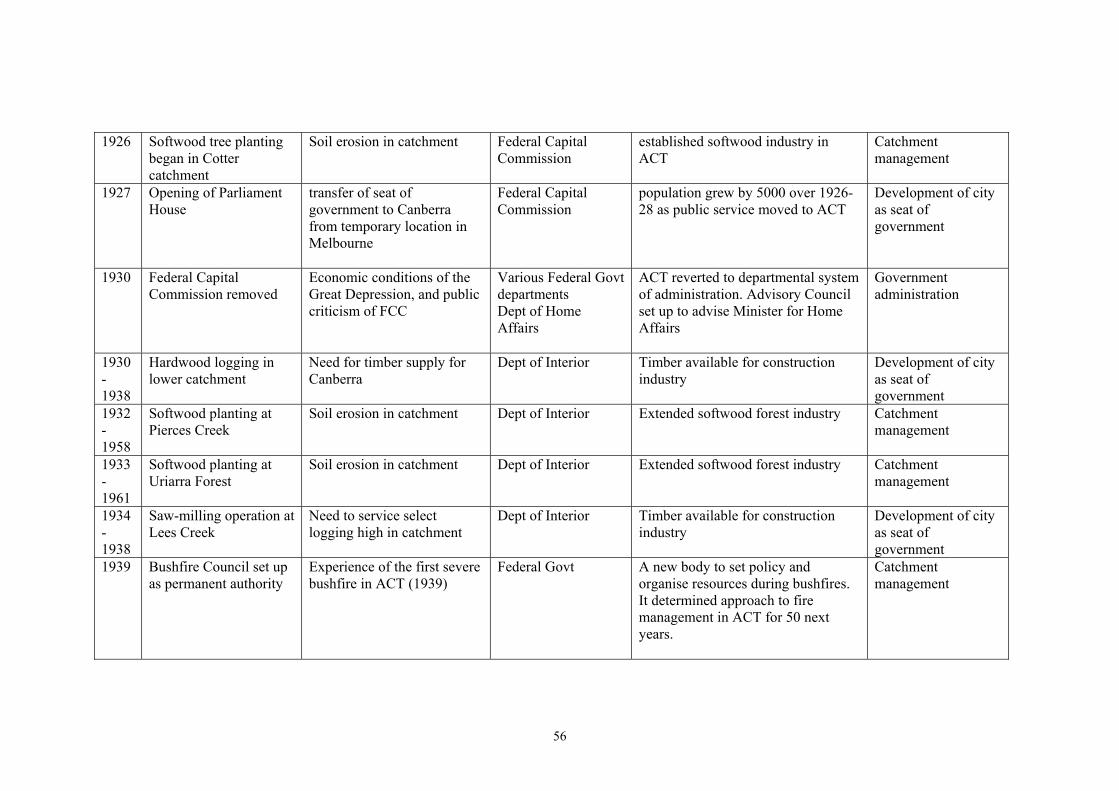
1926 Softwood tree planting began in Cotter catchment
Soil erosion in catchment
Federal Capital Commission
established softwood industry in ACT
Catchment management
1927 Opening of Parliament House
transfer of seat of government to Canberra from temporary location in Melbourne
Federal Capital Commission
population grew by 5000 over 1926-28 as public service moved to ACT
Development of city as seat of government
1930 Federal CapitalCommission removed
Economic conditions of the Great Depression, and public criticism of FCC
Various Federal Govt departments Dept of Home Affairs
ACT reverted to departmental system of administration. Advisory Council set up to advise Minister for Home Affairs
Government administration
1930-1938
Hardwood logging in lower catchment
Need for timber supply for Canberra
Dept of Interior Timber available for construction industry
Development of city as seat of government
1932-1958
Softwood planting at Pierces Creek
Soil erosion in catchment
Dept of Interior Extended softwood forest industry Catchment management
1933-1961
Softwood planting at Uriarra Forest
Soil erosion in catchment
Dept of Interior Extended softwood forest industry Catchment management
1934-1938
Saw-milling operation at Lees Creek
Need to service select logging high in catchment
Dept of Interior Timber available for construction industry
Development of city as seat of government
1939 Bushfire Council set up as permanent authority
Experience of the first severe bushfire in ACT (1939)
Federal Govt
A new body to set policy and organise resources during bushfires. It determined approach to fire management in ACT for 50 next years.
Catchment management
56
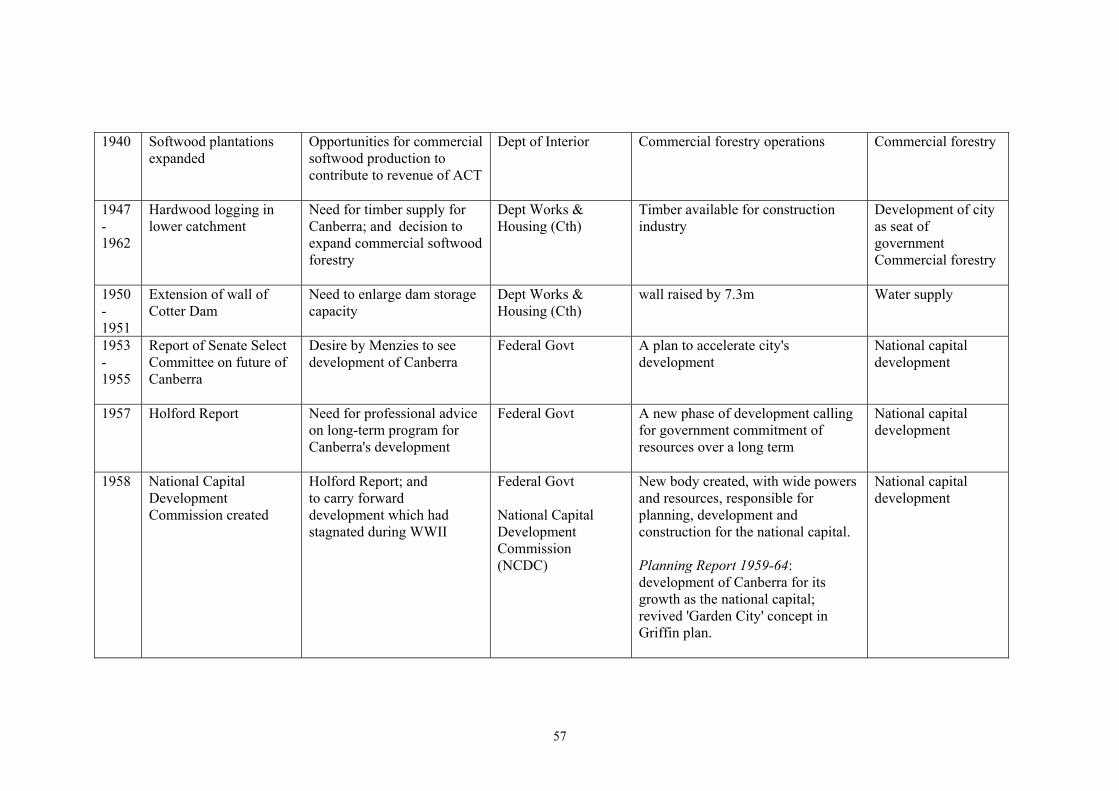
1940 Softwood plantationsexpanded
Opportunities for commercial softwood production to contribute to revenue of ACT
Dept of Interior Commercial forestry operations Commercial forestry
1947-1962
Hardwood logging in lower catchment
Need for timber supply for Canberra; and decision to expand commercial softwood forestry
Dept Works & Housing (Cth)
Timber available for construction industry
Development of city as seat of government Commercial forestry
1950-1951
Extension of wall of Cotter Dam
Need to enlarge dam storage capacity
Dept Works & Housing (Cth)
wall raised by 7.3m Water supply
1953-1955
Report of Senate Select Committee on future of Canberra
Desire by Menzies to see development of Canberra
Federal Govt
A plan to accelerate city's development
National capital development
1957 Holford Report
Need for professional advice on long-term program for Canberra's development
Federal Govt
A new phase of development calling for government commitment of resources over a long term
National capital development
1958 National CapitalDevelopment Commission created
Holford Report; and to carry forward development which had stagnated during WWII
Federal Govt National Capital Development Commission (NCDC)
New body created, with wide powers and resources, responsible for planning, development and construction for the national capital. Planning Report 1959-64: development of Canberra for its growth as the national capital; revived 'Garden City' concept in Griffin plan.
National capital development
57

1960 Scrivener Damconstruction began
Provisions in the Griffin Plan to create a lake
NCDC and Dept Works (Cth)
A dam wall 19.8m high x 235m long National capital development
1961
Bendora Dam commissioned
Need to expand ACT water storage system
NCDC and Dept Works (Cth)
development of storage in upper catchment
Water supply
1961 Expansion of softwood plantations ceased temporarily
Criticisms of apparent effects of forestry operations on water quality
Forestry and Timber Bureau (Cth)
Call for a study of effects on water quality
Catchment management
1962- 1965
Comprehensive study into problem of turbidity in lower Cotter River
Increasing concern over suspended sediment loads in lower Cotter River
3 Cth Depts: Health, Interior, Works; Forestry & Timber Bureau, CSIRO, ANU, Prof L. Teakle
A report (Dec 1965) that challenged ACT forestry to improve practices ― but effectively ignored
Catchment management Commercial forestry
1963 Proposal for a national park in the ACT
Desire to protect part of wilderness area of ACT
National Parks Association Dept Interior
First reserve gazetted 1979, Gudgenby Nature Reserve
National Parks Catchment management
1964 Completion of Lake Burley Griffin and bridges
Provisions in the Griffin Plan to create a lake
NCDC and Dept Works (Cth)
Beautification and unification of the city
Urban planning and design
1966-1968
Construction of settlement and water treatment plant at Mount Stromlo
Increasing concern over turbidity in lower Cotter
NCDC and Dept Works (Cth)
The 'settlement' feature was seldom used, as better quality water became available from upper catchment. Cotter Dam, formerly principal storage, became largely redundant.
Catchment management Water supply
58
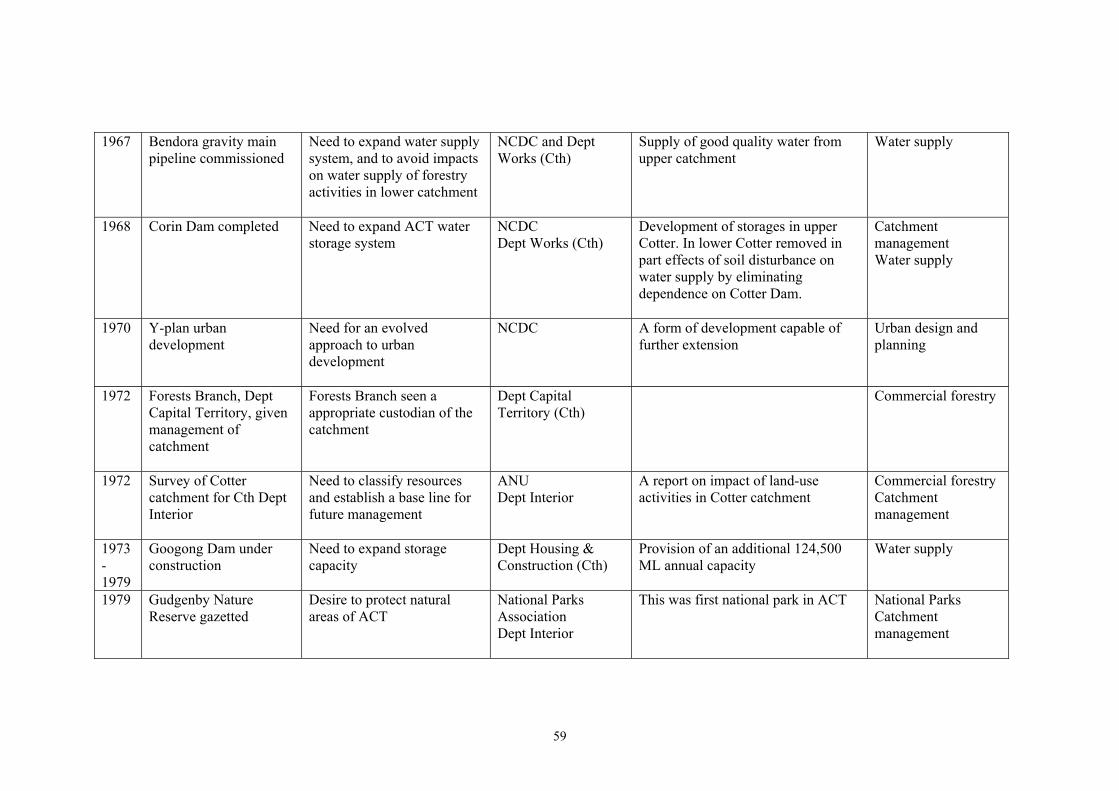
1967 Bendora gravity main pipeline commissioned
Need to expand water supply system, and to avoid impacts on water supply of forestry activities in lower catchment
NCDC and Dept Works (Cth)
Supply of good quality water from upper catchment
Water supply
1968
Corin Dam completed Need to expand ACT water storage system
NCDC Dept Works (Cth)
Development of storages in upper Cotter. In lower Cotter removed in part effects of soil disturbance on water supply by eliminating dependence on Cotter Dam.
Catchment management Water supply
1970 Y-plan urbandevelopment
Need for an evolved approach to urban development
NCDC A form of development capable of further extension
Urban design and planning
1972 Forests Branch, Dept Capital Territory, given management of catchment
Forests Branch seen a appropriate custodian of the catchment
Dept Capital Territory (Cth)
Commercial forestry
1972 Survey of Cotter catchment for Cth Dept Interior
Need to classify resources and establish a base line for future management
ANU Dept Interior
A report on impact of land-use activities in Cotter catchment
Commercial forestry Catchment management
1973-1979
Googong Dam under construction
Need to expand storage capacity
Dept Housing & Construction (Cth)
Provision of an additional 124,500 ML annual capacity
Water supply
1979 Gudgenby NatureReserve gazetted
Desire to protect natural areas of ACT
National Parks Association Dept Interior
This was first national park in ACT National Parks Catchment management
59

1984 Namadgi National Park gazetted
Desire to consolidate Gudgenby Nature Reserve and middle and upper Cotter catchments
Dept Interior Namadgi NP ACT Bushfire Council
The area protected enlarged to 96,000 ha; park managers responsible for fire protection; ACT Bushfire Council legal authority for fire suppression and control.
National Parks Catchment management
1986 Namadgi ManagementPlan
Desire for better management of the park
Dept Interior Namadgi NP ACT Bushfire Council
prepared but not proceeded with National Parks Catchment management
60

Self-Government (from 1988) Year Event Drivers Responsible Agency Outcomes Management Issues
1988 Australian Capital Territory (Self-Government) Act 1988 [Cth]
Cth desire to introduce self-government to ACT
Cth Govt ACT Govt
Created ACT Legislative Assembly, and shifted operations from Federal to Territory level.
ACT administration
1988 Australian Capital Territory (Planning and Land Management) Act 1988 [Cth]
Need to provide an overarching legal framework for all planning and land management in ACT
Cth Govt National Capital Authority (Cth)
NCA created as the body to prepare and administer the National Capital Plan (for Cth areas in parliamentary triangle); and for ACT Govt to set up planning authority to develop the Territory Plan
ACT administration
1988 ACT Electricity and Water created
Need to create a new agency responsible for electricity and water in ACT
ACT Govt Created a government business enterprise
ACT administration
1989 National CapitalPlanning Authority created
Need for an agency to manage ACT development
ACT Govt NCPA
New NCPA replaced old NCDC ACT administration
1989 Territory Plan Need for an instrument to guide land-use change and development
ACT Govt, Legislative Assembly and community
It provides policy framework for administration of planning in the ACT
Land management
1989 ACT Bushfire Office and Rural Fire Service created
Need for new planning and operational roles in event of bushfire
ACT Govt, ACT Bushfire Council, Rural Fire Service
Council took on policy setting Catchment management
61
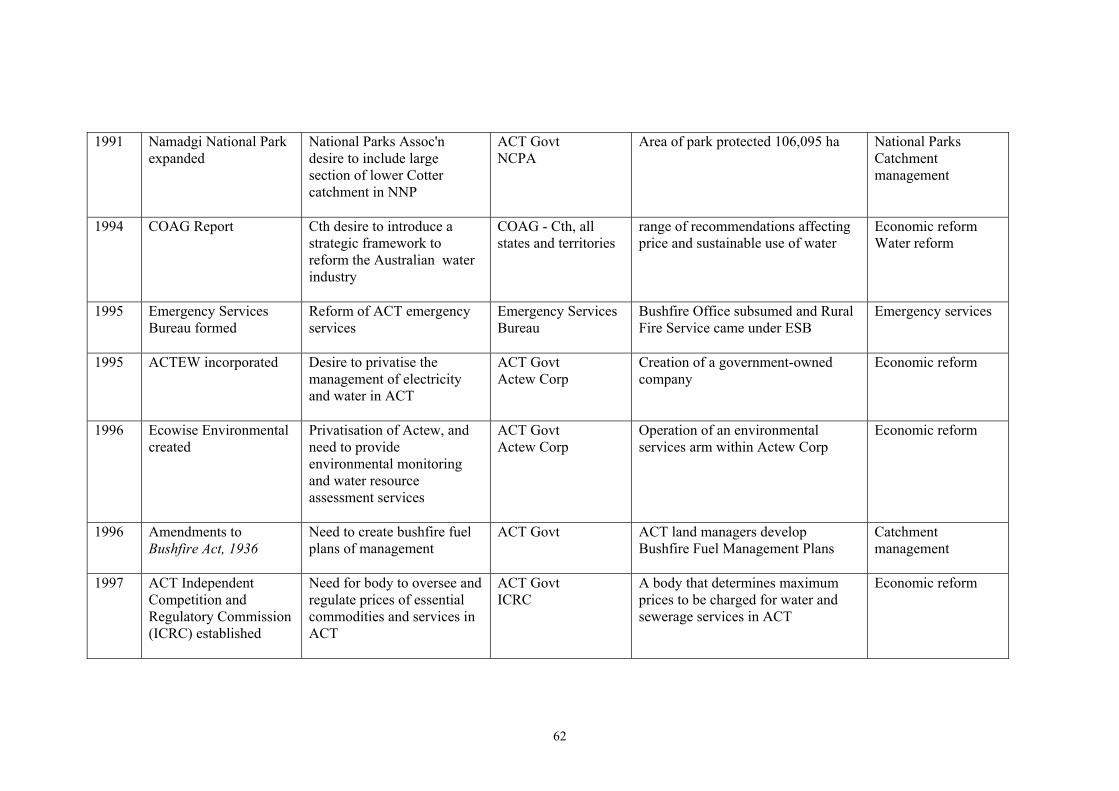
1991 Namadgi National Park expanded
National Parks Assoc'n desire to include large section of lower Cotter catchment in NNP
ACT Govt NCPA
Area of park protected 106,095 ha
National Parks Catchment management
1994 COAG Report Cth desire to introduce a strategic framework to reform the Australian water industry
COAG - Cth, all states and territories
range of recommendations affecting price and sustainable use of water
Economic reform Water reform
1995 Emergency ServicesBureau formed
Reform of ACT emergency services
Emergency Services Bureau
Bushfire Office subsumed and Rural Fire Service came under ESB
Emergency services
1995 ACTEW incorporated Desire to privatise the management of electricity and water in ACT
ACT Govt Actew Corp
Creation of a government-owned company
Economic reform
1996 Ecowise Environmentalcreated
Privatisation of Actew, and need to provide environmental monitoring and water resource assessment services
ACT Govt Actew Corp
Operation of an environmental services arm within Actew Corp
Economic reform
1996 Amendments toBushfire Act, 1936
Need to create bushfire fuel plans of management
ACT Govt ACT land managers develop Bushfire Fuel Management Plans
Catchment management
1997 ACT IndependentCompetition and Regulatory Commission (ICRC) established
Need for body to oversee and regulate prices of essential commodities and services in ACT
ACT Govt ICRC
A body that determines maximum prices to be charged for water and sewerage services in ACT
Economic reform
62
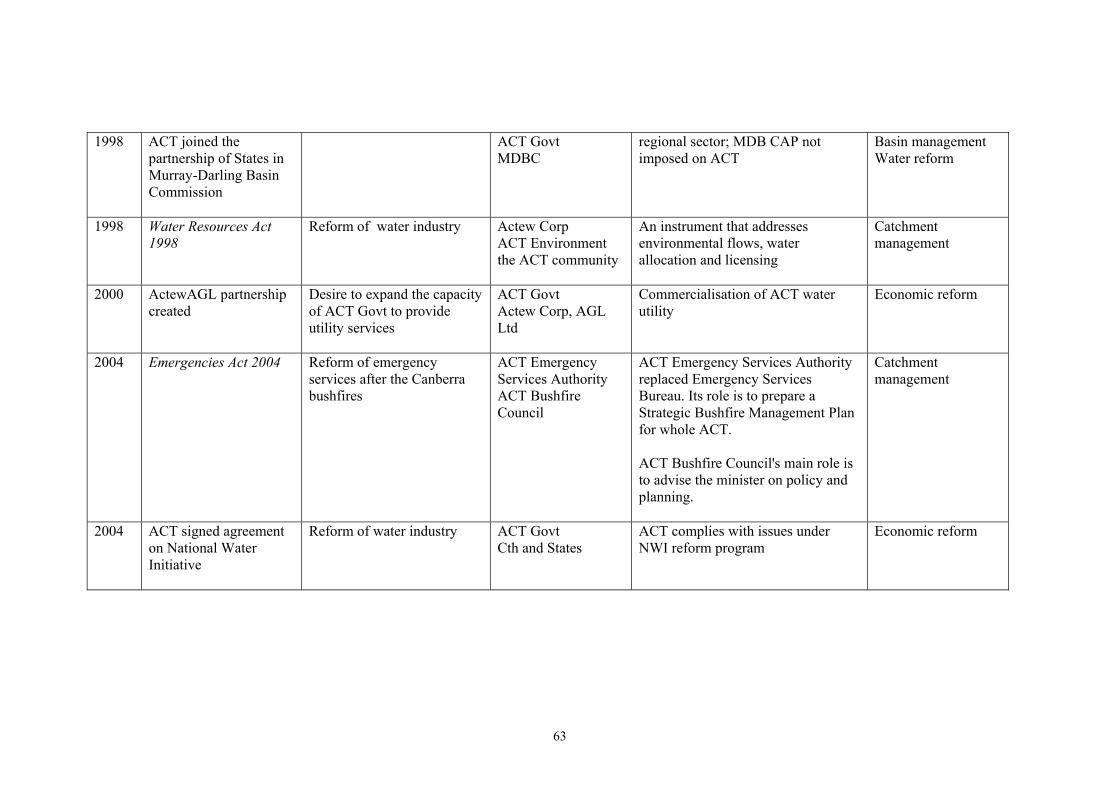
1998 ACT joined the partnership of States in Murray-Darling Basin Commission
ACT Govt regional sector; MDB CAP not imposed on ACT MDBC
Basin management Water reform
1998 Water Resources Act 1998
Reform of water industry Actew Corp ACT Environment the ACT community
An instrument that addresses environmental flows, water allocation and licensing
Catchment management
2000 ActewAGL partnershipcreated
Desire to expand the capacity of ACT Govt to provide utility services
ACT Govt Actew Corp, AGL Ltd
Commercialisation of ACT water utility
Economic reform
2004 Emergencies Act 2004 Reform of emergency services after the Canberra bushfires
ACT Emergency Services Authority ACT Bushfire Council
ACT Emergency Services Authority replaced Emergency Services Bureau. Its role is to prepare a Strategic Bushfire Management Plan for whole ACT. ACT Bushfire Council's main role is to advise the minister on policy and planning.
Catchment management
2004 ACT signed agreement on National Water Initiative
Reform of water industry
ACT Govt Cth and States
ACT complies with issues under NWI reform program
Economic reform
63