Embed Size (px)
Citation preview

Cathkin High School
National 5 Biology
Unit 3: Life on Earth
Homework Booklet
Biodiversity and the distribution of life
Homework Exercise 1
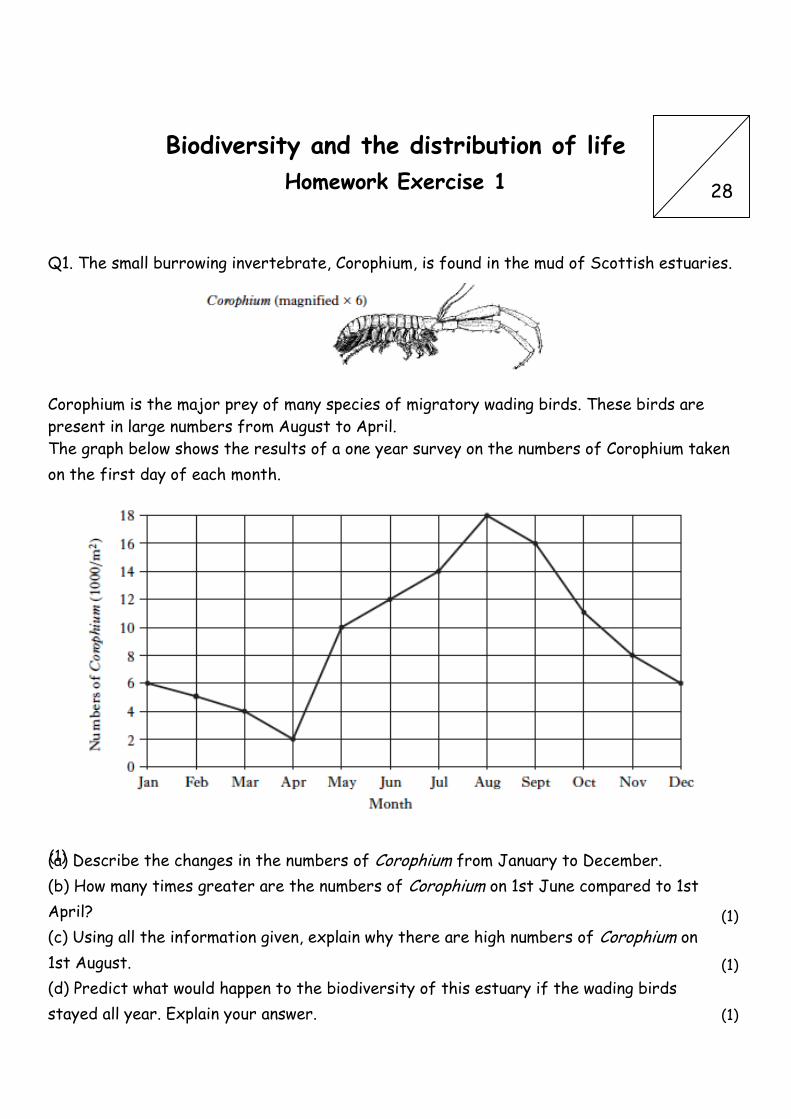
Q1. The small burrowing invertebrate, Corophium, is found in the mud of Scottish estuaries.
Corophium is the major prey of many species of migratory wading birds. These birds are
present in large numbers from August to April.
The graph below shows the results of a one year survey on the numbers of Corophium taken
on the first day of each month.
(a) Describe the changes in the numbers of Corophium from January to December.
(b) How many times greater are the numbers of Corophium on 1st June compared to 1st
April?
(c) Using all the information given, explain why there are high numbers of Corophium on
1st August.
(d) Predict what would happen to the biodiversity of this estuary if the wading birds
stayed all year. Explain your answer.
28
(1)
(1)
(1)
(1)
Q.2. The Treecreeper is a bird which feeds on small insects on the bark of trees during
the day. What is the correct description of the Treecreeper’s niche?
A The place where it lives
B The insects on which it feeds
C The plants and animals in the woodland environment
D Its role within the woodland ecosystem
Q.3. (a) Describe the difference between an ecosystem and a biome.
(b) Give four examples of biomes.
(c) State two factors which affect the distribution of biomes.
Q.4. (a) Describe what is meant by the term ‘biodiversity’.
(b) State the three main factors which can affect biodiversity.
Q.5. Copy and complete the following table to correctly name and describe the different
components of an ecosystem.
Component of
Ecosystem Description of Component
A place where plants and animals live
Population
Community
The communities of animals, plants and micro-organisms,
together with the habitat where they live.
Q.6. What is the term given to the role an organism plays within its ecosystem?
Q.7. (a) What is meant by a ‘parasite’?
(b) Give an example of (i) a plant parasite and (ii) an animal parasite.
(1)
(1)
(2)
(2)
(1)
(3)
(4)
(1)
(1)
(2)
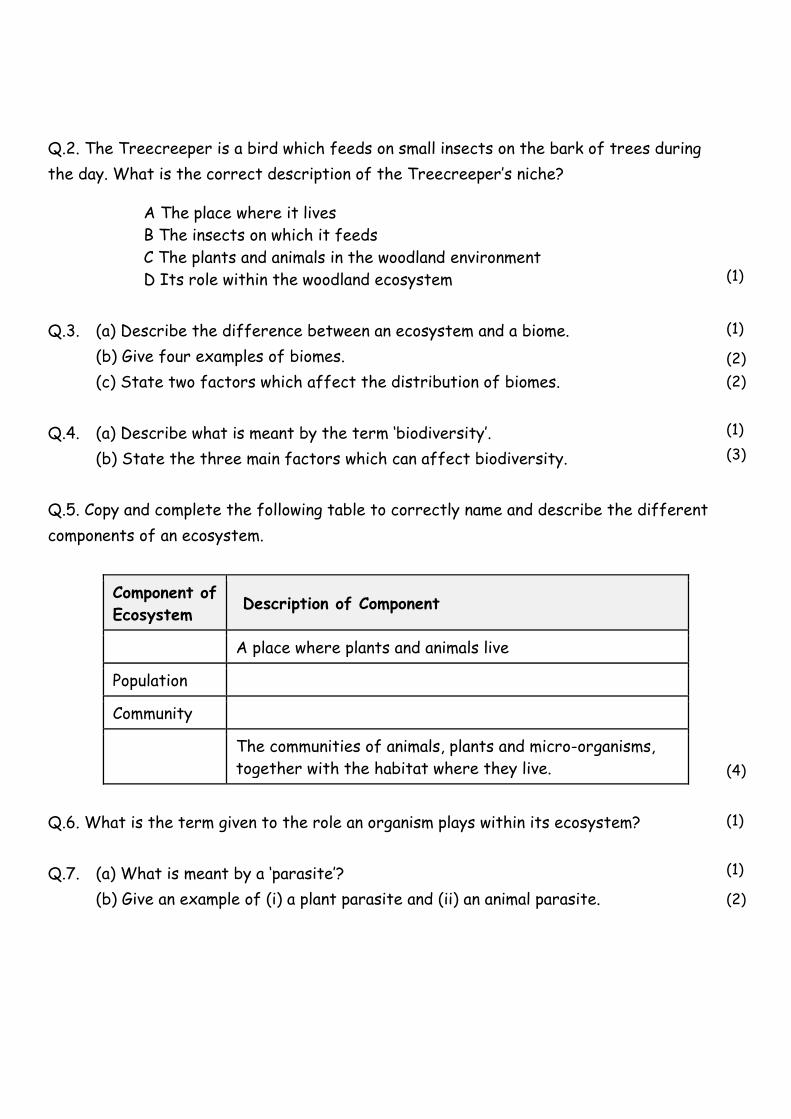
Q.8. An investigation was carried out to compare the rates of water loss from tree species
during winter when soil water availability is low.
The table shows information about the tree species involved.
Tree species Leaf type Leaves lost in winter cherry laurel broad no
white oak broad yes
loblolly pine needle-like no
One year old trees of each species were grown outside in identical environmental conditions
during winter. The average rate of water loss from each species was measured every tenth
day over a 70 day period.
The results are shown in the graph below.
(a) Use values from Graph 1 to describe the changes in rate of water loss from
loblolly pine over the 70 day period.
(b) Calculate the percentage decrease in rate of water loss from cherry laurel between
day 0 and day 50.
(c) From Graph 1 express, as the simplest whole number ratio, the rates of water loss
from white oak and cherry laurel on day 20.
(d) Using the information from the table and from Graph 1, suggest the advantage to
the white oak of losing its leaves in winter. Justify your answer.
(2)
(2)
(1)
(1)
Energy in Ecosystems
Homework Exercise 1
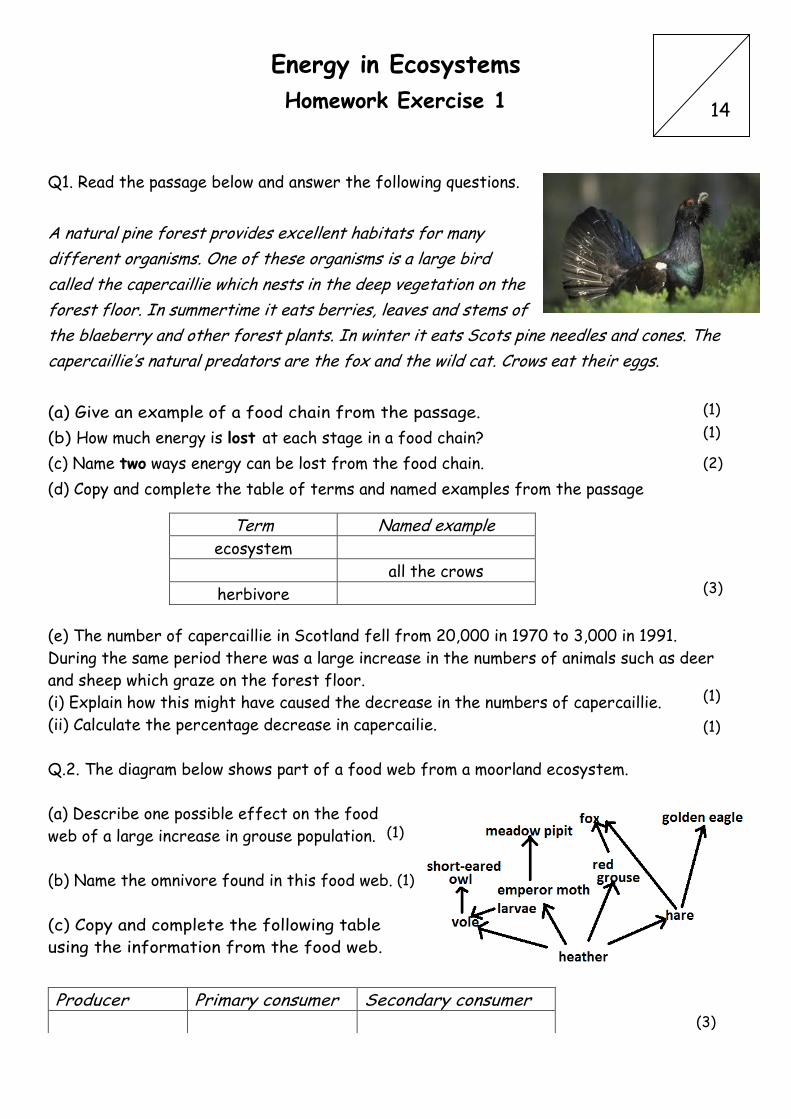
Q1. Read the passage below and answer the following questions.
A natural pine forest provides excellent habitats for many
different organisms. One of these organisms is a large bird
called the capercaillie which nests in the deep vegetation on the
forest floor. In summertime it eats berries, leaves and stems of
the blaeberry and other forest plants. In winter it eats Scots pine needles and cones. The
capercaillie’s natural predators are the fox and the wild cat. Crows eat their eggs.
(a) Give an example of a food chain from the passage.
(b) How much energy is lost at each stage in a food chain?
(c) Name two ways energy can be lost from the food chain.
(d) Copy and complete the table of terms and named examples from the passage
(e) The number of capercaillie in Scotland fell from 20,000 in 1970 to 3,000 in 1991.
During the same period there was a large increase in the numbers of animals such as deer
and sheep which graze on the forest floor.
(i) Explain how this might have caused the decrease in the numbers of capercaillie.
(ii) Calculate the percentage decrease in capercailie.
Q.2. The diagram below shows part of a food web from a moorland ecosystem.
(a) Describe one possible effect on the food
web of a large increase in grouse population.
(b) Name the omnivore found in this food web.
(c) Copy and complete the following table
using the information from the food web.
Term Named example
ecosystem
all the crows
herbivore
Producer Primary consumer Secondary consumer
14
(1)
(1)
(2)
(3)
(1)
(1)
(1)
(1)
(3)
Energy in Ecosystems
Homework Exercise 2
Q1. Copy and complete the passage using the word bank to fill in the blanks.
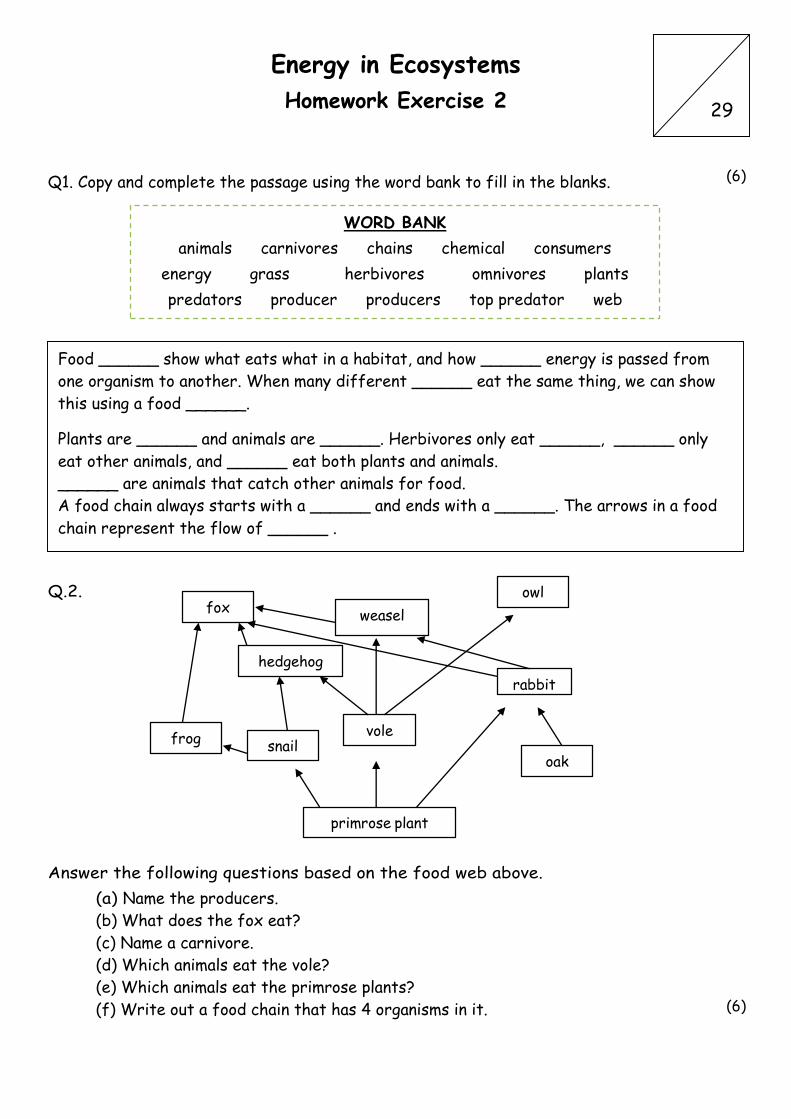
Q.2.
Answer the following questions based on the food web above.
(a) Name the producers.
(b) What does the fox eat?
(c) Name a carnivore.
(d) Which animals eat the vole?
(e) Which animals eat the primrose plants?
(f) Write out a food chain that has 4 organisms in it.
29
Food ______ show what eats what in a habitat, and how ______ energy is passed from
one organism to another. When many different ______ eat the same thing, we can show
this using a food ______.
Plants are ______ and animals are ______. Herbivores only eat ______, ______ only
eat other animals, and ______ eat both plants and animals.
______ are animals that catch other animals for food.
A food chain always starts with a ______ and ends with a ______. The arrows in a food
chain represent the flow of ______ .
WORD BANK
animals carnivores chains chemical consumers
energy grass herbivores omnivores plants
predators producer producers top predator web
fox
frog snail
hedgehog
weasel
vole
primrose plant
oak
rabbit
owl
(6)
(6)

Q.3. The diagram shows some of the stages in the nitrogen cycle.
(a) Copy and complete the table by giving a number from the diagram to match each of the
named stages.
(b) Name chemical X.
(c) Name the type of organism responsible for Stage 3.
Q.4. The diagram below shows a pyramid of biomass.
X represents the total mass of
A producers
B primary consumers
C predators
D secondary consumers.
Q.5. A species can be defined as a group of organisms which
A breed together to produce fertile offspring
B have the same phenotypes
C contain the same number of chromosomes
D contains identical genetic material
Q.6. The diagram below shows part of a food chain in the Arctic tundra.
Stage Number
Absorption
Death
Nitrification
Decomposition
(3) (1) (1)
(1)
(1)
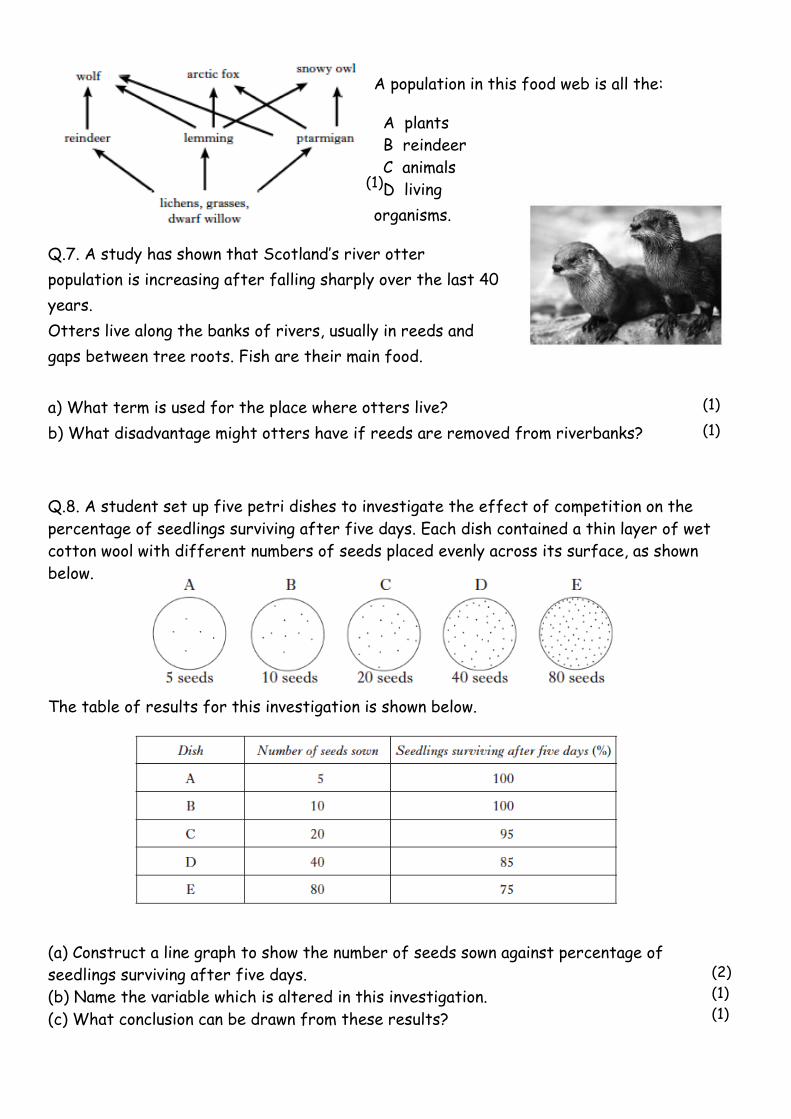
A population in this food web is all the:
A plants
B reindeer
C animals
D living
organisms.
Q.7. A study has shown that Scotland’s river otter
population is increasing after falling sharply over the last 40
years.
Otters live along the banks of rivers, usually in reeds and
gaps between tree roots. Fish are their main food.
a) What term is used for the place where otters live?
b) What disadvantage might otters have if reeds are removed from riverbanks?
Q.8. A student set up five petri dishes to investigate the effect of competition on the
percentage of seedlings surviving after five days. Each dish contained a thin layer of wet
cotton wool with different numbers of seeds placed evenly across its surface, as shown
below.
The table of results for this investigation is shown below.
(a) Construct a line graph to show the number of seeds sown against percentage of
seedlings surviving after five days.
(b) Name the variable which is altered in this investigation.
(c) What conclusion can be drawn from these results?
(1)
(1)
(1)
(2)
(1)
(1)

(d) Calculate the simple whole number ratio of the percentage of seedling surviving in
dish A compared to dish.
(e) Another dish was set up with 160 seeds and 88 seedlings survived for five days.
Calculate the percentage of seedlings surviving in this dish.
f) Name one requirement, other than food and water that an organism may compete for.
(1)
(1)
(1)

Sampling Techniques
Homework Exercise 1
Q1. The diagram shows the results of a survey of seaweeds on a rocky Scottish shore.
Starting at the highest tide level, square quadrats were placed every 5 metres in a line down
the shore. Four species of seaweed were rated as absent, scarce or abundant in each
quadrat.
(a) (i) How many species of seaweed were found in quadrat number 9?
(ii) How many of the quadrats contained more than one species of seaweed?
(iii) Which species of seaweed spends least time covered by water?
(iv) What percentage of all the quadrats included egg wrack?
(b) Suggest one abiotic factor that might affect the distribution of the seaweed
species on the shore.
(c) Suggest one possible source of error in the sampling procedure and explain how it
might be minimized.
13
(1)
(1)
(1)
(1)
(1)
(1)

Q2. The light intensity inside and outside a woodland was measured over a year.
The table below shows the results.
(a) On graph paper, construct a line graph to show the results for both inside and outside
the woodland.
(b) Explain why the difference between the light intensities inside and outside the
woodland is much greater from June to October.
Average daily light intensity (units)
Month Outside woodland Inside woodland
January 10 8
February 13 10
March 15 12
April 19 16
May 24 22
June 28 15
July 30 5
August 25 5
September 20 5
October 15 5
November 12 10
December 10 8
(2)
(1)

Q3. A grass area is used as a short cut by pupils leaving a school.
An investigation was carried out on the effect this has on the distribution of three types of
plants.
The diagram shows the five quadrat positions.
The number of plants found in each quadrat is shown in the table below.
(a) Calculate the average number of buttercups found per quadrat.
(b) Use information from the table to describe the effect of using the shortcut on the
number of (i) daisies and (ii) plantains.
(c) The investigation was repeated several times. Give a reason why this would improve the
results.
Quadrat number
Number of plants
Daisies Plantains Buttercups
1 30 23 18
2 10 22 8
3 3 23 1
4 8 20 9
5 65 21 24
(1)
(2)
(1)
Sampling Techniques
Homework Exercise 2
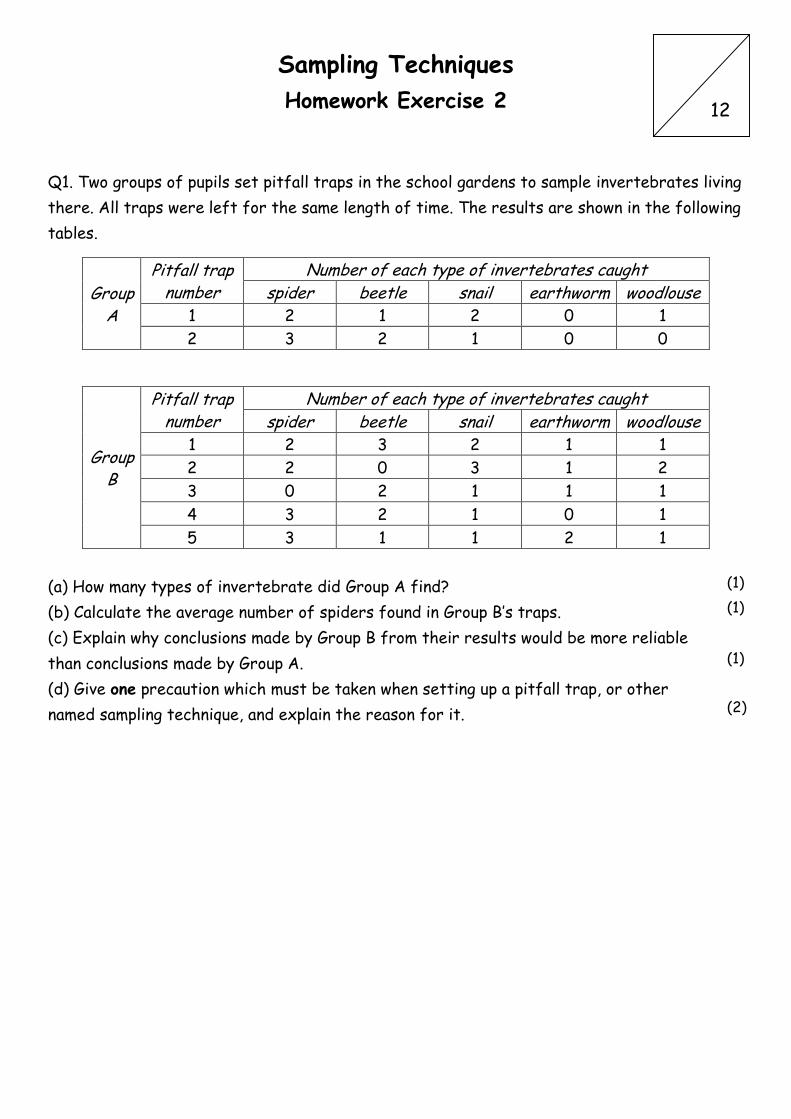
Q1. Two groups of pupils set pitfall traps in the school gardens to sample invertebrates living
there. All traps were left for the same length of time. The results are shown in the following
tables.
(a) How many types of invertebrate did Group A find?
(b) Calculate the average number of spiders found in Group B’s traps.
(c) Explain why conclusions made by Group B from their results would be more reliable
than conclusions made by Group A.
(d) Give one precaution which must be taken when setting up a pitfall trap, or other
named sampling technique, and explain the reason for it.
Group A
Pitfall trap number
Number of each type of invertebrates caught
spider beetle snail earthworm woodlouse 1 2 1 2 0 1
2 3 2 1 0 0
Group B
Pitfall trap number
Number of each type of invertebrates caught
spider beetle snail earthworm woodlouse 1 2 3 2 1 1
2 2 0 3 1 2
3 0 2 1 1 1
4 3 2 1 0 1
5 3 1 1 2 1
12
(1)
(1)
(1)
(2)
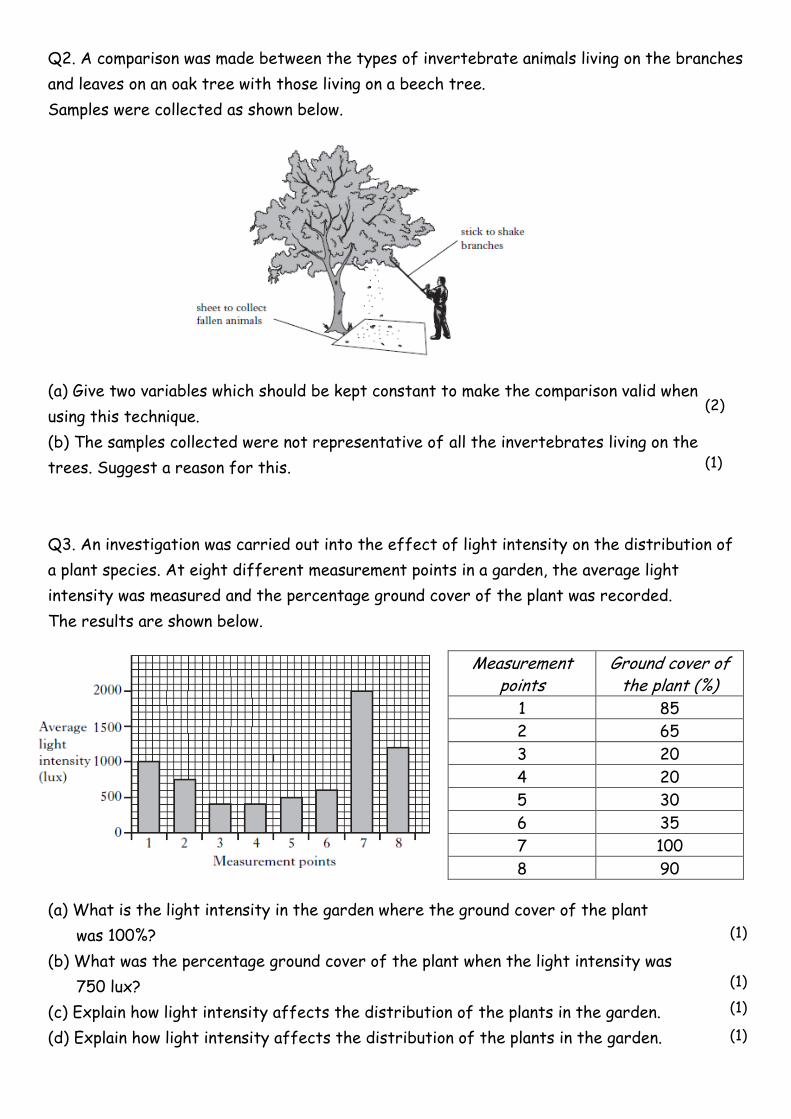
Q2. A comparison was made between the types of invertebrate animals living on the branches
and leaves on an oak tree with those living on a beech tree.
Samples were collected as shown below.
(a) Give two variables which should be kept constant to make the comparison valid when
using this technique.
(b) The samples collected were not representative of all the invertebrates living on the
trees. Suggest a reason for this.
Q3. An investigation was carried out into the effect of light intensity on the distribution of
a plant species. At eight different measurement points in a garden, the average light
intensity was measured and the percentage ground cover of the plant was recorded.
The results are shown below.
(a) What is the light intensity in the garden where the ground cover of the plant
was 100%?
(b) What was the percentage ground cover of the plant when the light intensity was
750 lux?
(c) Explain how light intensity affects the distribution of the plants in the garden.
(d) Explain how light intensity affects the distribution of the plants in the garden.
Measurement points
Ground cover of the plant (%)
1 85
2 65
3 20
4 20
5 30
6 35
7 100
8 90
(2)
(1)
(1)
(1)
(1)
(1)
Sampling Techniques
Homework Exercise 3
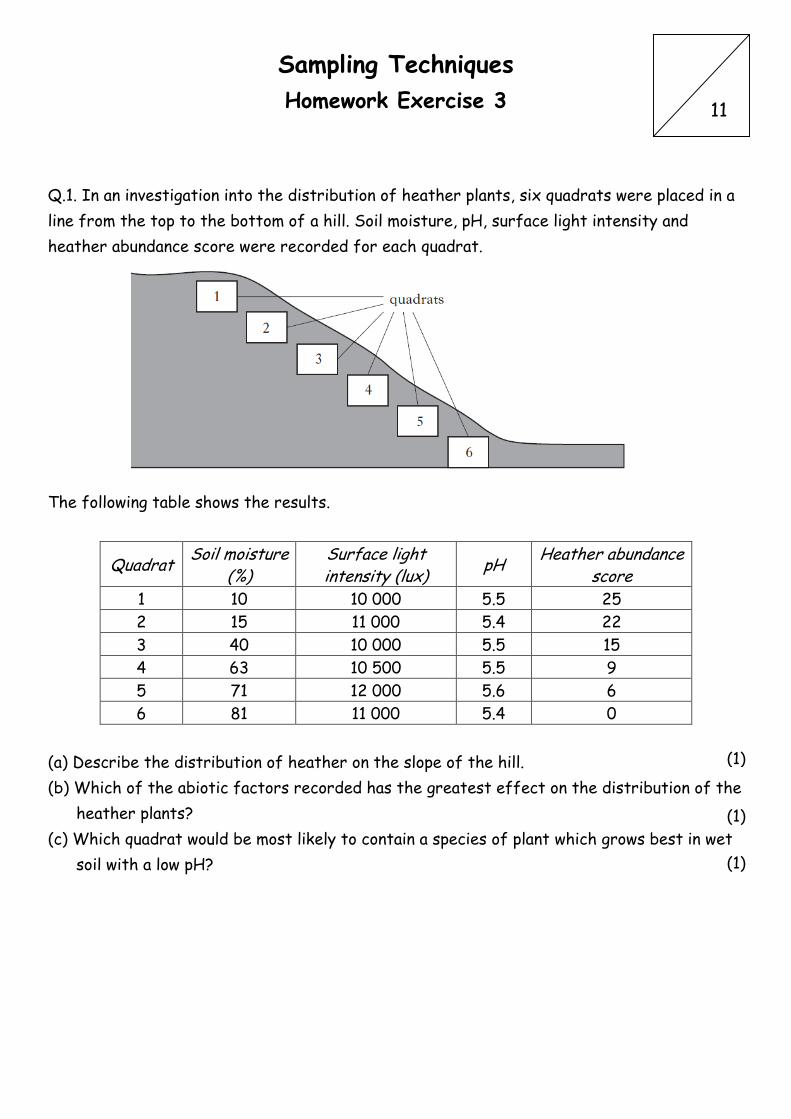
Q.1. In an investigation into the distribution of heather plants, six quadrats were placed in a
line from the top to the bottom of a hill. Soil moisture, pH, surface light intensity and
heather abundance score were recorded for each quadrat.
The following table shows the results.
Quadrat Soil moisture
(%) Surface light intensity (lux)
pH Heather abundance
score
1 10 10 000 5.5 25
2 15 11 000 5.4 22
3 40 10 000 5.5 15
4 63 10 500 5.5 9
5 71 12 000 5.6 6
6 81 11 000 5.4 0
(a) Describe the distribution of heather on the slope of the hill.
(b) Which of the abiotic factors recorded has the greatest effect on the distribution of the
heather plants?
(c) Which quadrat would be most likely to contain a species of plant which grows best in wet
soil with a low pH?
11
(1)
(1)
(1)
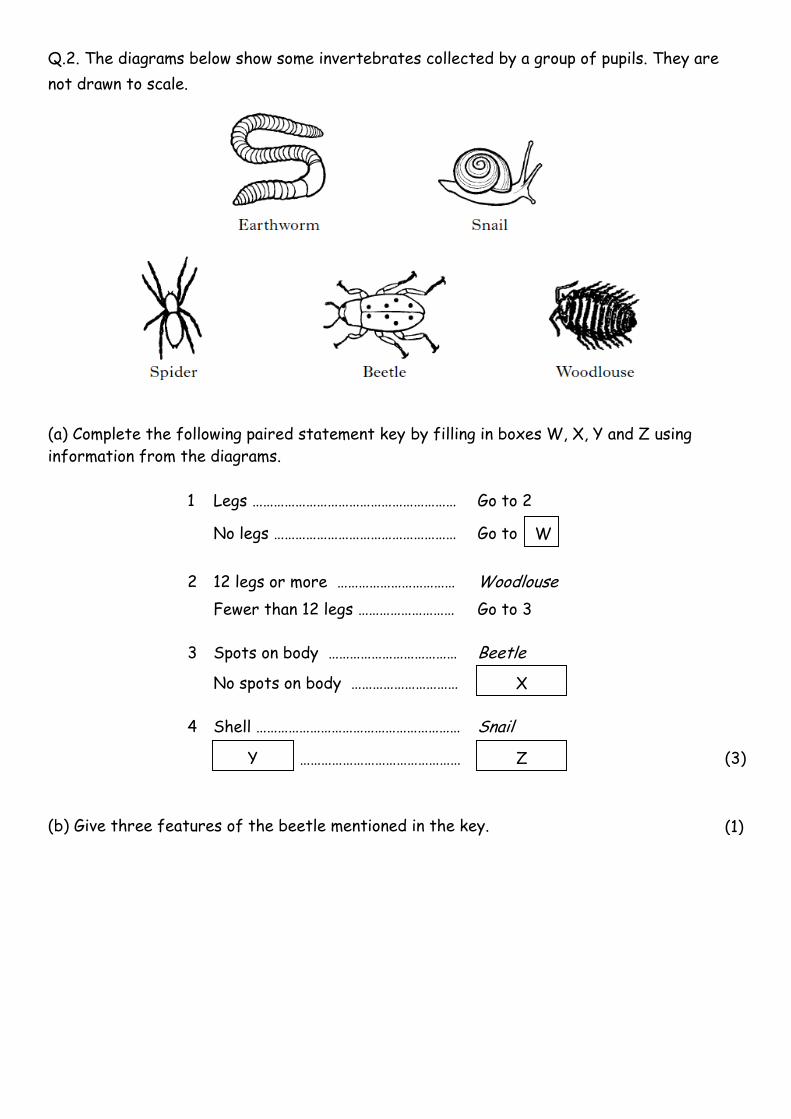
Q.2. The diagrams below show some invertebrates collected by a group of pupils. They are
not drawn to scale.
(a) Complete the following paired statement key by filling in boxes W, X, Y and Z using
information from the diagrams.
1 Legs ………………………………………………… Go to 2
No legs …………………………………………… Go to
2 12 legs or more …………………………… Woodlouse
Fewer than 12 legs ……………………… Go to 3
3 Spots on body ……………………………… Beetle
No spots on body …………………………
4 Shell ………………………………………………… Snail
………………………………………
(b) Give three features of the beetle mentioned in the key.
W
X
Y Z (3)
(1)

Q.3. The table below shows some features of five British butterflies.
Butterfly species Wing shading Wing tip Wing spots Large White pale black yes
Orange Tip pale orange no
Peacock dark blue yes
Red Admiral dark white yes
Wood White pale black no
(a) Complete the key using the information given in the table.
1 Pale wing shading ………………………… Go to 2
Dark wing shading …………………………
2 ……………………………
Orange wing tip …………………………… Orange Tip
3 Spots on wings ……………………………… Large White
No spots on wings …………………………
4 Blue wing tip …………………………………… Peacock
……………………………
(b) The earliest sightings of these butterflies in Britain was recorded in 1956 and again in
2006. The information is shown in the table below.
Earliest sighting Butterfly species 1956 2006
Large White mid June early June
Orange Tip late May mid May
Peacock mid March early March
Red Admiral early June late May
Wood White mid May early May
What evidence suggests that the average temperatures in 2006 were higher than in 1956?
A
D
E F
C B
(3)
(1)
Variation and Adaptations
Homework Exercise 1
1. Define the meaning of an adaptation
2. Why do variations occur in a population and why can they be advantageous.
3. Give an example of an advantageous adaptation in plants and state how it is important
for the survival of the species.
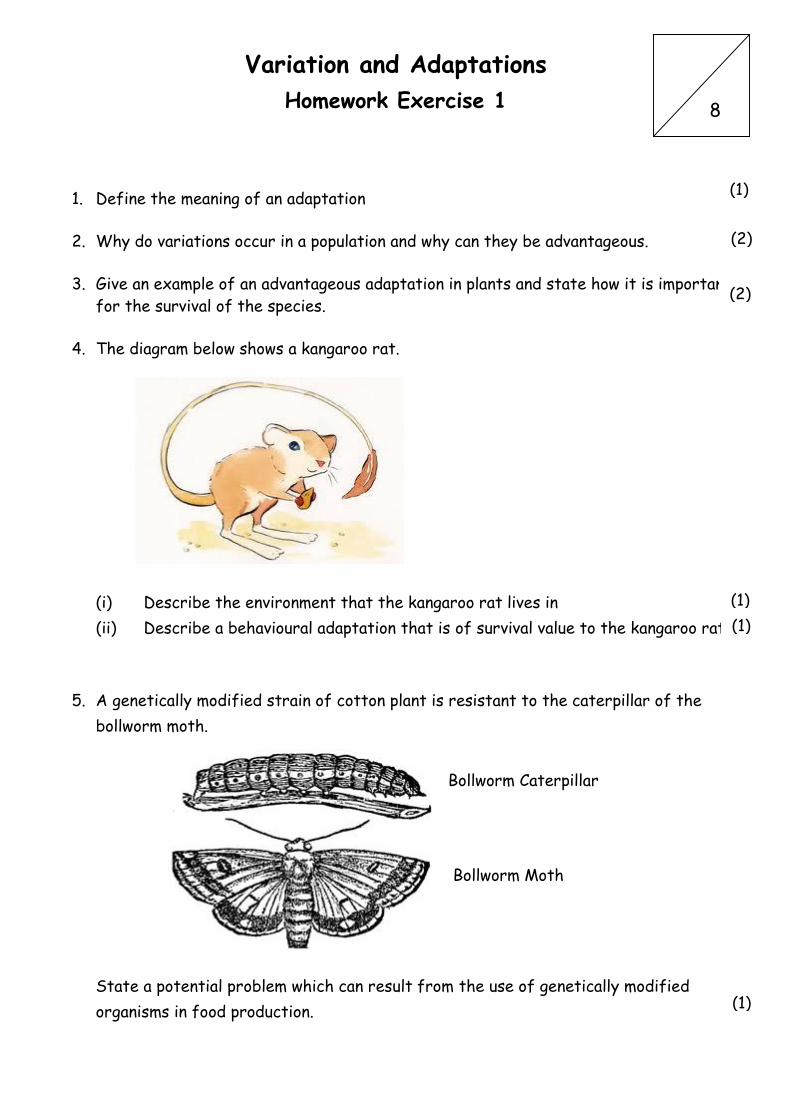
4. The diagram below shows a kangaroo rat.
(i) Describe the environment that the kangaroo rat lives in
(ii) Describe a behavioural adaptation that is of survival value to the kangaroo rat.
5. A genetically modified strain of cotton plant is resistant to the caterpillar of the
bollworm moth.
State a potential problem which can result from the use of genetically modified
organisms in food production.
8
Bollworm Caterpillar
Bollworm Moth
(1)
(2)
(2)
(1)
(1)
(1)
Natural Selection and Speciation
Homework Exercise 1
Q1. Explain what is meant by the term ‘species’.
Q.2. Name the type of competition which occurs as a result of a species producing more
offspring than their environment can support.
Q.3. Which term is given to the process by which organisms that are better adapted to
their environment survive and breed?
Q.4. Using a named example, describe the process of natural selection.
Q.5. Copy and complete the following table by deciding if each of the following statements is
True or False, then tick () the appropriate box.
If the statement is False, write the correct word(s) in the Correction box to replace the
word(s) underlined in the statement.
Statement True False Correction
Natural selection is the term used to
describe the formation of two new species
from one ancestor species.
The first stage in the formation of a new
species is mutation.
Populations of a species are split due to
isolation barriers.
Q.6. (a) Describe what is meant by an isolation barrier.
(b) Name the three types of isolation barrier.
18
(1)
(1)
(1)
(3)
(3)
(1)
(2)

Q.7. The diagram below shows 4 different species of Galapagos finch.
a. Describe why each species possessing a different beak shape is of benefit to the birds.
b. The Galapagos finches after a long period of isolation on the Galapagos Islands.
How is it possible to tell that finches 1-4 are different species?
c. These finches have evolved due to differing selection pressures. What is meant by a
‘selection pressure’ and give an example of a selection pressure which the finches might
have experienced.
Q.8. The diagram shows the light and dark forms of the
Peppered moth.
An investigation was carried out in which both forms of the
moth were marked, released and recaptured in the countryside.
The results of the investigation are shown in the table below.
Variety Number marked and
released Number recaptured
Percentage recaptured (%)
Light colour 400 240
Dark colour 400 30
a. Copy and complete the table by calculating the percentage of light moths recaptured
and the number of dark moths recaptured.
b. From the results, can you conclude which form of moth can be described as having
the selective advantage?
(1)
(1)
(1)
(2)
(1)
Human impact on the environment
Homework Exercise 1
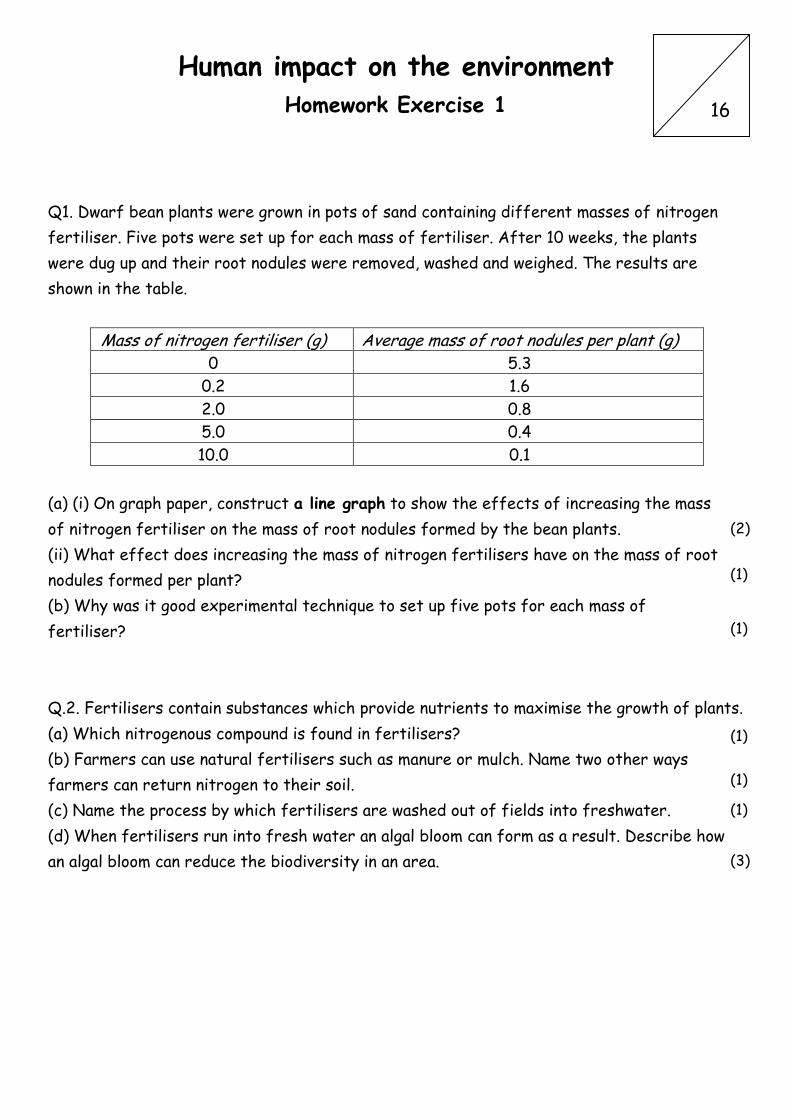
Q1. Dwarf bean plants were grown in pots of sand containing different masses of nitrogen
fertiliser. Five pots were set up for each mass of fertiliser. After 10 weeks, the plants
were dug up and their root nodules were removed, washed and weighed. The results are
shown in the table.
Mass of nitrogen fertiliser (g) Average mass of root nodules per plant (g)
0 5.3
0.2 1.6
2.0 0.8
5.0 0.4
10.0 0.1
(a) (i) On graph paper, construct a line graph to show the effects of increasing the mass
of nitrogen fertiliser on the mass of root nodules formed by the bean plants.
(ii) What effect does increasing the mass of nitrogen fertilisers have on the mass of root
nodules formed per plant?
(b) Why was it good experimental technique to set up five pots for each mass of
fertiliser?
Q.2. Fertilisers contain substances which provide nutrients to maximise the growth of plants.
(a) Which nitrogenous compound is found in fertilisers?
(b) Farmers can use natural fertilisers such as manure or mulch. Name two other ways
farmers can return nitrogen to their soil.
(c) Name the process by which fertilisers are washed out of fields into freshwater.
(d) When fertilisers run into fresh water an algal bloom can form as a result. Describe how
an algal bloom can reduce the biodiversity in an area.
16
(2)
(1)
(1)
(1)
(1)
(1)
(3)

Q.3. The water quality at beaches is tested to check that it is not affected by any
untreated sewage. The table gives information about the number of beaches which were
tested in one particular year and the number passed as suitable for swimming.
Country Number of beaches tested
Number of beaches suitable for swimming
Percentage of beaches suitable for swimming
England 271 239 88.2
Scotland 93 68
Wales 128 102 79.7
Northern
Ireland
17 16 94.1
(a) Calculate the percentage of beaches suitable for swimming in Scotland.
(b) Why should the percentage of beaches which passed be used when comparing the
results from the four countries, rather than the actual number?
(c) The samples of water from the beaches can be examined for the presence of certain
species. This technique gives information about water pollution. What name is given to such
species?
Q.4. Pesticides are chemical which farmers spray onto crops to kill pests which destroy
crops.
(a) Describe how pesticides can lead to the death of organisms.
(b) Name a natural method which can be used by farmers as an alternative to pesticides.
(1)
(1)
(1)
(2)
(1)
Human impact on the environment
Homework Exercise 2
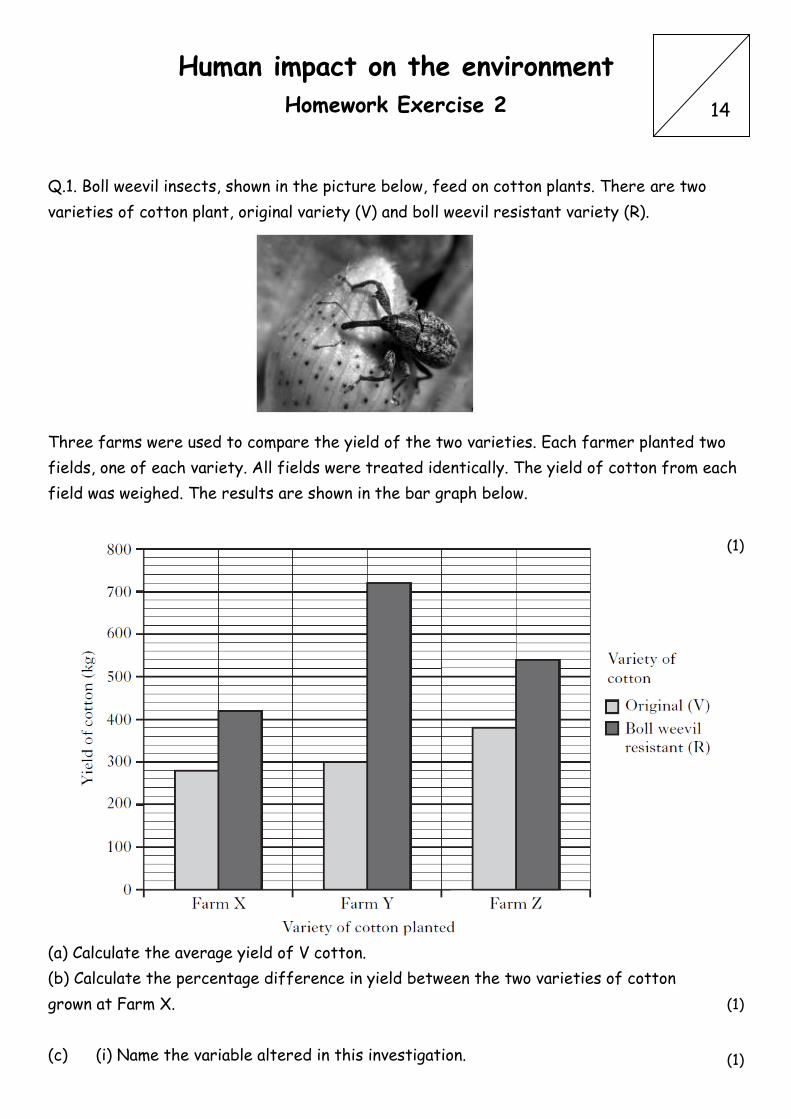
Q.1. Boll weevil insects, shown in the picture below, feed on cotton plants. There are two
varieties of cotton plant, original variety (V) and boll weevil resistant variety (R).
Three farms were used to compare the yield of the two varieties. Each farmer planted two
fields, one of each variety. All fields were treated identically. The yield of cotton from each
field was weighed. The results are shown in the bar graph below.
(a) Calculate the average yield of V cotton.
(b) Calculate the percentage difference in yield between the two varieties of cotton
grown at Farm X.
(c) (i) Name the variable altered in this investigation.
14
(1)
(1)
(1)

(ii) The fields planted with V cotton were used as a control. Give a reason for using
this control.
(iii) Explain why using ten farms instead of three would have improved this
investigation.
(d) What conclusion can be drawn from these results?
(e) The farmers use pesticides to kill insects which damage their crops.
(i) Explain why less pesticide is needing when growing R cotton.
(ii) Explain why growing R cotton is less likely to affect insect biodiversity.
Q.2. (a) The diagram below shows a section of a river.
The table below shows the results of a survey into the oxygen content of the river at
different sample points.
Distance of sample point from X (m)
Oxygen content (units)
0 1.20
200 0.04
500 0.20
800 0.40
1000 1.00
(i) On a piece of graph paper, construct a line graph of the results.
(ii) From the table calculate how many times greater the oxygen content is at 0m than at
200m.
(iii) Use data from the table to describe the relationship between oxygen content and
distance of the sample point from X.
(iv) The numbers of micro-organisms were counted at each sample point and found to be
highest 200m from X. Account for the oxygen content of the river at 200m.
(b) State the effect of an increase in pollution on species diversity.
(1)
(1)
(1)
(1)
(1)
(2)
(1)
(1)
(1)
(1)