Embed Size (px)
Citation preview

Materials Science and Engineering B 108 (2004) 241–252
Cathode and interdigitated air distributor geometry optimizationin polymer electrolyte membrane (PEM) fuel cells
M. Grujicic∗, C.L. Zhao, K.M. Chittajallu, J.M. Ochterbeck
Department of Mechanical Engineering, Clemson University, Clemson, SC 29634-0921, USA
Received 31 May 2003; accepted 5 January 2004
Abstract
A steady-state single-phase three-dimensional electro-chemical model is combined with a nonlinear constrained optimization procedureto maximize the performance of the cathode and the interdigitated air distributor in a polymer electrolyte membrane (PEM) fuel cell. Thecathode and the interdigitated air distributor design parameters considered include: the cathode thickness, the thickness of the interdigitated airdistributor channels and the width of the interdigitated air distributor channels. A statistical sensitivity analysis is used to determine robustnessof the optimal PEM fuel cell design. The results of the optimization analysis show that higher current densities at the membrane/cathodeinterface are obtained in the PEM cathode and the interdigitated air distributor geometries that promote convective oxygen transport to themembrane/cathode interface and reduce the thickness of the boundary diffusion layer at the same interface. The statistical sensitivity analysisresults show that, while the predicted average current density at the membrane/cathode interface is affected by uncertainties in a number ofmodel parameters, the optimal designs of the PEM cathode and the interdigitated air distributor are quite robust.© 2004 Elsevier B.V. All rights reserved.
Keywords:Polymer electrolyte membrane (PEM) fuel cells; Design; Optimization; Robustness
1. Introduction
Due to their potential for reducing the environmental im-pact and the dependence on fossil fuels, fuel cells haveemerged as an attractive alternative to the internal combus-tion engines. In a fuel cell, fuel (e.g. hydrogen gas) and anoxidant (e.g. oxygen gas from the air) are used to generateelectricity, while heat and water are typical byproducts. Asthe hydrogen gas flows into the fuel cell on the anode side,a platinum catalyst facilitates fuel oxidation which producesprotons (hydrogen ions) and electrons,Fig. 1. Protons dif-fuse through a membrane (the center of the fuel cell whichseparates the anode and the cathode) and, with the help ofa platinum catalyst, combine with oxygen and electrons onthe cathode side, producing water. The electrons produced atthe anode side cannot pass through the membrane and flowfrom the anode to the cathode through an external circuitcontaining an electrical motor. The resulting voltage fromone single fuel cell is typically around 1.0 V. This voltage
∗ Corresponding author. Tel.:+1-864-656-5639;fax: +1-864-656-4435.
E-mail address:[email protected] (M. Grujicic).
is generally increased by stacking the fuel cells in series,in which case the operating voltage of the stack is simplyequal to the product of the operating voltage of a single celland the number of cells in the stack.
Fuel cells are typically classified according to the type ofmembrane (polymer electrolyte membrane fuel cells, solidoxide fuel cells, molten carbonate fuel cells, etc.) they use.One of the most promising fuel cells are the so-called poly-mer electrolytic membrane or proton exchange membranefuel cells (PEMFCs). The polymer electrolyte membrane is asolid, organic polymer, usually poly[perfluorosulfonic] acid.The most frequently used PEM is made of NafionTM pro-duced by DuPont, which consists of Teflon-like chains witha fluorocarbon backbone and sulfonic acid ions, SO3
−, per-manently attached to the side chains. When the membrane ishydrated by absorbing water, protons attached to the SO3
−ions combine with water molecules to form hydronium ions.Hydronium ions are quite mobile and hop from one SO3
−site to another within the membrane making the hydratedsolid electrolytes like NafionTM excellent conductors of thehydrogen ions.
The anode and the cathode (the electrodes) in a PEM fuelcell are made of an electrically conductive porous mate-
0921-5107/$ – see front matter © 2004 Elsevier B.V. All rights reserved.doi:10.1016/j.mseb.2004.01.005

242 M. Grujicic et al. / Materials Science and Engineering B 108 (2004) 241–252
Nomenclature
Ni molar flux of species (kg/m2/s)p pressure (Pa)u gas velocity (m/s)w mass fractionφ potential (V)ρ density (kg/m3)
SubscriptsH2O water-related quantityO2 oxygen-related quantity
Superscriptseff effective quantitysym symmetryx molar fraction
rial, typically carbon. The faces of the electrodes in contactwith the membrane (generally referred to as the active lay-ers) contain, in addition to carbon, polymer electrolyte anda platinum-based catalyst. Each active layer is denoted by athick vertical line inFig. 1. As also indicated inFig. 1, oxi-dation and reduction fuel-cell half reactions take place in theanode and the cathode active layers, respectively. The PEMelectrodes are of gas-diffusion type and generally designedfor maximum surface area per unit material volume (the spe-cific surface area) available for the reactions, for minimumtransport resistance of the hydrogen and the oxygen to theactive layers, for an easy removal of the water from the ca-thodic active layer and for the minimum transport resistance
Fig. 1. A schematic of a polymer electrolyte membrane (PEM) fuel cell.
of the protons from the active sites in the anodic layer to theactive sites in the cathodic active layer.
As shown inFig. 1, a PEM fuel cell also typically con-tains an interdigitated fuel distributor on the anode side andan interdigitated air distributor on the cathode side. The useof the interdigitated fuel/air distributors imposes a pressuregradient between the inlet and the outlet channels, forcingthe convective flow of the gaseous species through the elec-trodes. Consequently, a 50–100% increase in the fuel-cellperformance is typically obtained as a result of the use of in-terdigitated fuel/air distributors. The regions of the interdig-itated fuel/air distributors separating the inlet and the outletchannels, generally referred to as the shoulders, serve as theanode and cathode electric current collectors.
Due to their high-energy efficiency, a low temperature(333–353 K) operation, a pollution-free character, and a rel-atively simple design, PEM fuel cells are currently beingconsidered as an alternative source of power in the electricvehicles. However, further improvements in the efficiencyand the cost are needed before the PEM fuel cells can be-gin to successfully compete with the internal combustionengines. The development of the PEM fuel cells is gener-ally quite costly and the use of mathematical modeling andsimulations has become an important tool in the fuel-celldevelopment. Over the last decades a number of fuel-cellmodels have been developed. Some of these models aresingle-phase (e.g.[1,2]) while the others are two-phase (e.g.[3]), i.e., they consider the effect of the liquid water sup-plied to the anode and the one formed in the cathodic activelayer. Due to the slow kinetics of oxygen reduction, someof these models focus only on the cathode side of the fuelcell (e.g.[1,3]) while the others deal with the entire fuel cell(e.g.[2]). Most of the models like the ones cited above areused to carry out parametric studies of the effect of variousfuel-cell design parameters (such as the cathodic and anodicthicknesses, the geometrical parameters of the interdigitatedfuel/air distributors, etc.). However, a comprehensive opti-mization analysis of the PEM fuel cell design is still lacking.Hence, the objective of the present work is to modify thesteady-state single-phase three-dimensional PEM fuel-cellcathode model associated with a U-shaped air distributionsystem[4] to include the effect of the interdigitated air dis-tributor and to combine it with an optimization procedureand a statistical sensitivity analysis in order to identify theoptimum geometry of the PEMFC cathode and the interdig-itated air distributor.
The organization of the paper is as following: inSection 2,the modification of the steady-state single-phase three-dimensional model for a PEM fuel-cell cathode presentedin [4] and a solution method for the resulting set of partialdifferential equations are briefly discussed. An overviewof the optimization and the statistical sensitivity methodsis presented inSection 3. The main results obtained inthe present work are presented and discussed inSection 4.The main conclusions resulting from the present work aresummarized inSection 5.

M. Grujicic et al. / Materials Science and Engineering B 108 (2004) 241–252 243
2. The model
As indicated inFig. 1, the PEM fuel cell works on theprinciple of separation of the oxidation of hydrogen (takingplace in the anodic active layer) and the reduction of oxygen(taking place in the cathodic active layer). The oxidation andthe reduction half-reactions are given inFig. 1. Electronsliberated in the anodic active layer via the oxidation half-reaction travel through the anode, an anodic current collec-tor, an outer circuit (containing an external load, typicallya power conditioner connected to an electric motor), a ca-thodic current collector and the cathode until they reach thecathodic active layer. Simultaneously, protons (H+) gener-ated in the anodic active layer diffuse through the polymerelectrolyte membrane until they reach the cathodic activelayer, where the oxygen reduction half-reaction takes place.Due to a relatively slow rate of the oxygen reduction reac-tion, the design of the fuel-cell cathode and the associatedinterdigitated air distributor are considered as critical forachieving a high performance of the PEMFCs. Therefore,the work presented here focused on the cathode side of thefuel cell.
2.1. Assumptions and simplifications
In this section, a simple steady-state single-phase three-dimensional model for a PEM fuel-cell cathode developedin [4] is modified to include the effect of an interdigitatedair distributor. The model is developed under the followingsimplifications and assumptions:
• The computational domain, denoted with dashed lines inFig. 1, consists of a porous cathode which is in con-tact with an interdigitated air distributor. A three-dimen-sional view of the computational domain is shown inFig. 2.
• The membrane/cathode interface is considered as a zero-thickness cathodic active layer.
• The portions of the cathode surface which are not in con-tact with the interdigitated air distributor are designatedas the current collector surface.
• Humidified air of fixed composition and pressure is sup-plied at the cathode inlet.
• Liquid water entering the cathode from the membrane sideand the one generated during the oxygen reduction reac-tion in the cathodic active layer are assumed to be of anegligible volume (i.e., no two-phase flow in the cathodeis considered). It should be noted that this simplificationcould be critical since liquid water residing in pores of thecathode can significantly reduces its effective permeabil-ity. In fact, when the liquid water saturation level reaches100% (the phenomenon known as “cathode flooding”),the cathode becomes impervious to the gases.
• The inlet/outlet pressure difference specified inTable 1has been selected in such a way that a compromise isachieved between an effective removal of water droplets
Fig. 2. Schematic of the cathode and interdigitated air distributor in aPEM fuel cell.
Table 1General parameters and reference-case cathode and interdigitated airdistributors’ parameters used for 3D modeling the PEM fuel cell
Parameter Symbol SI units Value
Faraday’s constant F A s/mol 96,487Universal gas constant R J/mol K 8.314Temperature T K 353Atmospheric (reference)
pressurep0 Pa 1.013× 10⁵
Gas viscosity µ kg/m s 2.0× 10⁻⁵
Pressure differential �p Pa p0 × 2.5 ×10−1
Activation overpotential η V 0.5Molecular weight of oxygen MO2 kg/mol 32× 10−3
Molecular weight of water MH2O kg/mol 18× 10−3
Molecular weight ofnitrogen
MN2 kg/mol 28× 10−3
Molar diffusion volume ofoxygen
vO2 m3/mol 16.6× 10⁻⁶
Molar diffusion volume ofwater
vH2O m3/mol 12.7× 10⁻⁶
Molar diffusion volume ofnitrogen
vN2 m3/mol 17.9× 10⁻⁶
Porosity of cathode ε No units 0.5Inlet mass fraction of oxygen wO2,0 No units 0.1447Inlet mass fraction of oxygen wH2O,0 No units 0.3789Inlet mass fraction of oxygen wN2,0 No units 0.4764Empirical value kMS Nm2 kg1/2/
K1.75 mol7/699.9 × 10−8
Specific surface area Sa m2/m3 1.0 × 10⁸
Thickness of the activelayer
δ m 1.0 × 10⁻⁵
Number of electrons n No units 4.0Exchange current density i0 A/m2 4.0 × 10⁻³
Cathode conductivity k S/m 1.0× 10⁵
244 M. Grujicic et al. / Materials Science and Engineering B 108 (2004) 241–252
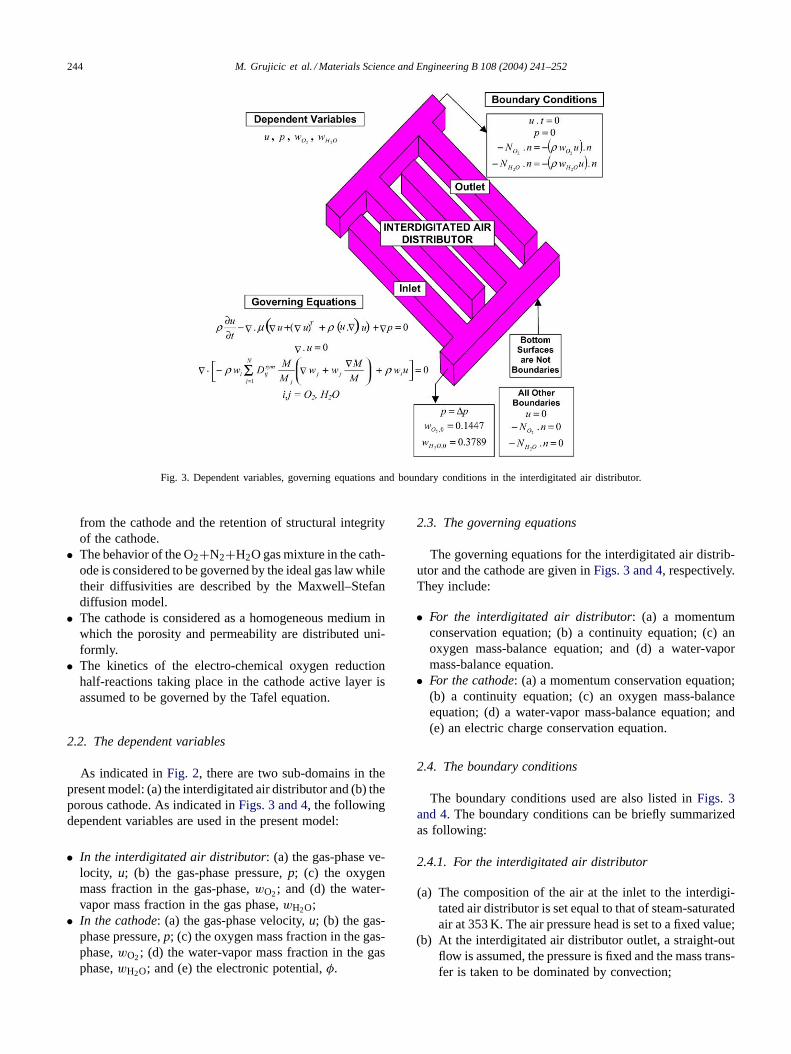
Fig. 3. Dependent variables, governing equations and boundary conditions in the interdigitated air distributor.
from the cathode and the retention of structural integrityof the cathode.
• The behavior of the O2+N2+H2O gas mixture in the cath-ode is considered to be governed by the ideal gas law whiletheir diffusivities are described by the Maxwell–Stefandiffusion model.
• The cathode is considered as a homogeneous medium inwhich the porosity and permeability are distributed uni-formly.
• The kinetics of the electro-chemical oxygen reductionhalf-reactions taking place in the cathode active layer isassumed to be governed by the Tafel equation.
2.2. The dependent variables
As indicated inFig. 2, there are two sub-domains in thepresent model: (a) the interdigitated air distributor and (b) theporous cathode. As indicated inFigs. 3 and 4, the followingdependent variables are used in the present model:
• In the interdigitated air distributor: (a) the gas-phase ve-locity, u; (b) the gas-phase pressure,p; (c) the oxygenmass fraction in the gas-phase,wO2; and (d) the water-vapor mass fraction in the gas phase,wH2O;
• In the cathode: (a) the gas-phase velocity,u; (b) the gas-phase pressure,p; (c) the oxygen mass fraction in the gas-phase,wO2; (d) the water-vapor mass fraction in the gasphase,wH2O; and (e) the electronic potential,φ.
2.3. The governing equations
The governing equations for the interdigitated air distrib-utor and the cathode are given inFigs. 3 and 4, respectively.They include:
• For the interdigitated air distributor: (a) a momentumconservation equation; (b) a continuity equation; (c) anoxygen mass-balance equation; and (d) a water-vapormass-balance equation.
• For the cathode: (a) a momentum conservation equation;(b) a continuity equation; (c) an oxygen mass-balanceequation; (d) a water-vapor mass-balance equation; and(e) an electric charge conservation equation.
2.4. The boundary conditions
The boundary conditions used are also listed inFigs. 3and 4. The boundary conditions can be briefly summarizedas following:
2.4.1. For the interdigitated air distributor
(a) The composition of the air at the inlet to the interdigi-tated air distributor is set equal to that of steam-saturatedair at 353 K. The air pressure head is set to a fixed value;
(b) At the interdigitated air distributor outlet, a straight-outflow is assumed, the pressure is fixed and the mass trans-fer is taken to be dominated by convection;
M. Grujicic et al. / Materials Science and Engineering B 108 (2004) 241–252 245
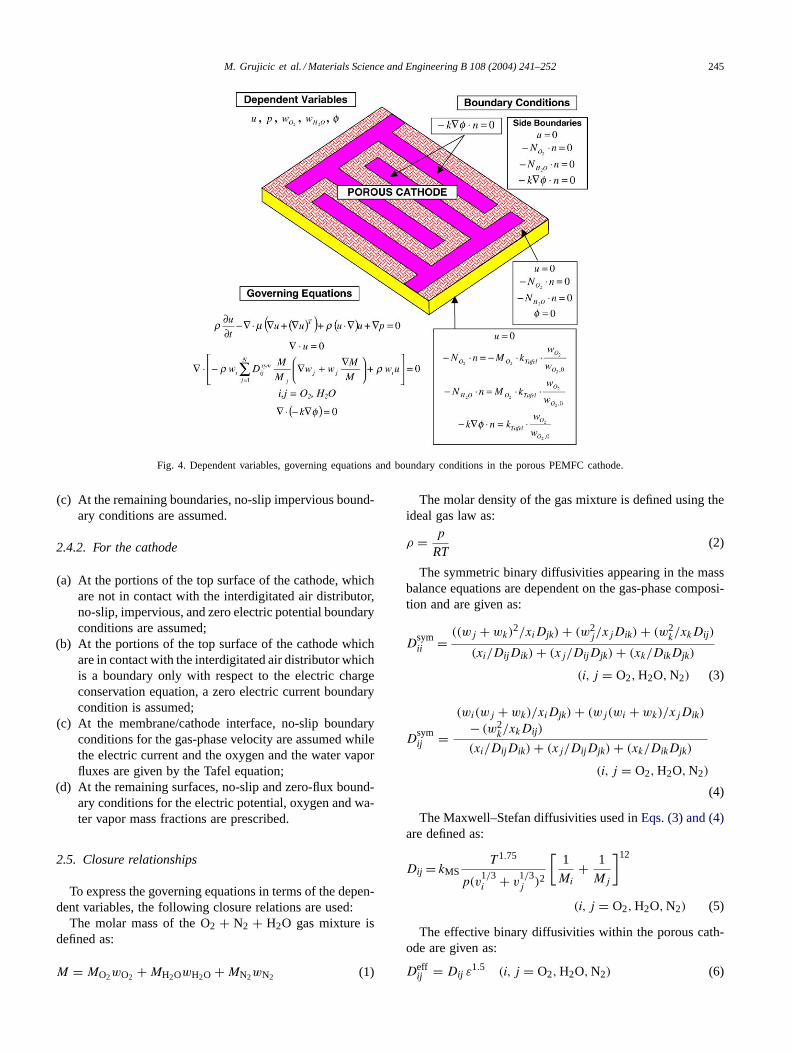
Fig. 4. Dependent variables, governing equations and boundary conditions in the porous PEMFC cathode.
(c) At the remaining boundaries, no-slip impervious bound-ary conditions are assumed.
2.4.2. For the cathode
(a) At the portions of the top surface of the cathode, whichare not in contact with the interdigitated air distributor,no-slip, impervious, and zero electric potential boundaryconditions are assumed;
(b) At the portions of the top surface of the cathode whichare in contact with the interdigitated air distributor whichis a boundary only with respect to the electric chargeconservation equation, a zero electric current boundarycondition is assumed;
(c) At the membrane/cathode interface, no-slip boundaryconditions for the gas-phase velocity are assumed whilethe electric current and the oxygen and the water vaporfluxes are given by the Tafel equation;
(d) At the remaining surfaces, no-slip and zero-flux bound-ary conditions for the electric potential, oxygen and wa-ter vapor mass fractions are prescribed.
2.5. Closure relationships
To express the governing equations in terms of the depen-dent variables, the following closure relations are used:
The molar mass of the O2 + N2 + H2O gas mixture isdefined as:
M = MO2wO2 + MH2OwH2O + MN2wN2 (1)
The molar density of the gas mixture is defined using theideal gas law as:
ρ = p
RT(2)
The symmetric binary diffusivities appearing in the massbalance equations are dependent on the gas-phase composi-tion and are given as:
Dsymii =
((wj + wk)2/xiDjk) + (w2
j/xjDik) + (w2k/xkDij )
(xi/DijDik) + (xj/DijDjk) + (xk/DikDjk)
(i, j = O2, H2O, N2) (3)
Dsymij =
(wi(wj + wk)/xiDjk) + (wj(wi + wk)/xjDik)
− (w2k/xkDij )
(xi/DijDik) + (xj/DijDjk) + (xk/DikDjk)
(i, j = O2, H2O, N2)
(4)
The Maxwell–Stefan diffusivities used inEqs. (3) and (4)are defined as:
Dij = kMST 1.75
p(v1/3i + v
1/3j )2
[1
Mi
+ 1
Mj
]12
(i, j = O2, H2O, N2) (5)
The effective binary diffusivities within the porous cath-ode are given as:
Deffij = Dij ε1.5 (i, j = O2, H2O, N2) (6)

246 M. Grujicic et al. / Materials Science and Engineering B 108 (2004) 241–252
The Tafel coefficient which relates the oxygen and thewater vapor fluxes with the local current density at the mem-brane/cathode interface is defined as:
kTafel = Saδ i0
nFexp
(0.5Fη
RT
)(i, j = O2, H2O, N2) (7)
2.6. Computational method
The steady-state, nonlinear three-dimensional system ofgoverning partial differential equations (discussed inSection2.3 and inFigs. 3 and 4) subjected to the boundary condi-tions (discussed inSection 2.4and inFigs. 3 and 4) are im-plemented in the commercial mathematical package FEM-LAB [5] and solved (for the dependent variables discussedin Section 2.2and inFigs. 3 and 4) using the finite elementmethod. The FEMLAB provides a powerful interactive en-vironment for modeling various scientific and engineeringproblems and for obtaining the solution for the associated(stationary and transient, both linear and nonlinear) systemsof governing partial differential equations. The FEMLAB isfully integrated with the MATLAB, a commercial mathemat-ical and visualization package[6]. As a result, the modelsdeveloped in the FEMLAB can be saved as MATLAB pro-grams for parametric studies or iterative design optimization.
3. Design optimization and robustness
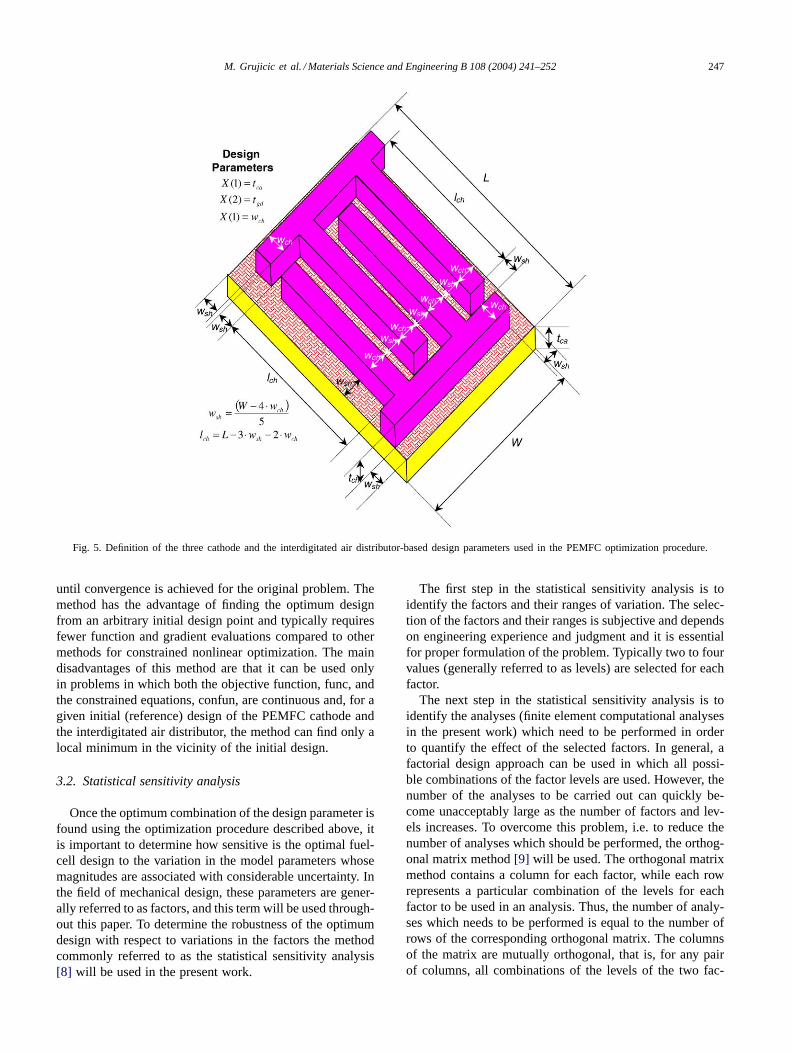
There are many PEMFC cathode and the interdigitatedgas distributor parameters which affect the performance of aPEM fuel cell. Some of these parameters such as the cathodepermeability and porosity are controlled by the microstruc-ture of the cathode porous material. Since these microstruc-ture sensitive parameters are mutually interdependent in acomplex and currently not well-understood way, they willnot be treated as design parameters within the PEMFC cath-ode optimization procedure described below. Instead, geo-metrical parameters (e.g. the cathode thickness, the widthof the interdigitated air distributor channels, etc.) will beconsidered. As explained earlier, the kinetics of reductionhalf-reaction in the cathodic active layer is very slow and,it is generally recognized that significant improvements inthe fuel cell performance can be obtained by optimizing thedesign of its cathode side. This approach is adopted in thepresent work and, consequently, the following three cath-ode and interdigitated air distributor design parameters havebeen identified as the most important:
• the cathode thickness (0.0001 m);• the thickness of the interdigitated air distributor channels
(0.0001 m); and• the width of the interdigitated air distributor channels
(0.0001 m).
The numbers given within the parentheses correspond tothe values of the three design parameters in the initial (ref-
erence) design of the PEMFC cathode and the interdigitatedair distributor. A schematic of the cathode is given inFig. 5to explain the three design parameters (denoted asx(i), i =1–3) defined above. The width and the length of the cathodeare kept constant at 0.0009 and 0.0013 m, respectively.
The objective functionf[x(1), x(2), x(3)] is next definedas the average electric current density at a typical value ofthe cell voltage of 0.7 V. The average electric current densitycan be considered as a measure of the degree of utilization ofthe expensive Pt-based catalyst in the cathode active layer.
Thus, the fuel-cell design optimization problem can bedefined as: minimize 1/f[x(1),x(2),x(3)] with respect tox(1),x(2), andx(3) subject to:
0.00002 m≤ x(1) ≤ 0.0005 m
0.00002 m≤ x(2) ≤ 0.005m, and
0.000025 m≤ x(3) ≤ 0.000175 m
The upper limits for the three design parameters are cho-sen based on considerations of the size constraints for aPEMFC stack. The lower limits for the three design param-eters, on the other hand, are selected based on the considera-tion of minimal feature sizes which can be attained using thecurrent PEMFC cathode and the interdigitated air-distributormanufacturing processes.
3.1. Optimization
The optimization problem formulated above is solved us-ing the MATLAB optimization toolbox[6] which containsan extensive library of computational algorithms for solv-ing different optimization problems such as: unconstrainedand constrained nonlinear minimization, quadratic and lin-ear programming and the constrained linear least-squaresmethod. The problem under consideration in the presentwork belongs to the class of multidimensional constrainednonlinear minimization problems which can be solved us-ing the MATLAB fmincon() optimization function of thefollowing syntax:
fmincon(fun, x0, A, B, Aeq, Beq, LB, UB, confun, options);(8)
where fun denotes the scalar objective function of a multidi-mensional design vectorx, while confun contains nonlinearnon-equality (c(x) ≤ 0) and equality (ceq(x) = 0) con-strained functions. The matrixA and the vectorb are usedto define linear non-equality constrains of the typeAx ≤ b,while the matrixAeq and the vectorbeq are used to define lin-ear equality constraining equations of the typeAeqx = beq.LB and UB are vectors containing the lower and the upperbounds of the design valuables andx0 is the initial designpoint. The MATLAB fmincon() function implements thesequential quadratic programming (SQP) method[7] withinwhich the original problem is approximated with a quadraticprogramming subproblem which is then solved successively
M. Grujicic et al. / Materials Science and Engineering B 108 (2004) 241–252 247
Fig. 5. Definition of the three cathode and the interdigitated air distributor-based design parameters used in the PEMFC optimization procedure.
until convergence is achieved for the original problem. Themethod has the advantage of finding the optimum designfrom an arbitrary initial design point and typically requiresfewer function and gradient evaluations compared to othermethods for constrained nonlinear optimization. The maindisadvantages of this method are that it can be used onlyin problems in which both the objective function, func, andthe constrained equations, confun, are continuous and, for agiven initial (reference) design of the PEMFC cathode andthe interdigitated air distributor, the method can find only alocal minimum in the vicinity of the initial design.
3.2. Statistical sensitivity analysis
Once the optimum combination of the design parameter isfound using the optimization procedure described above, itis important to determine how sensitive is the optimal fuel-cell design to the variation in the model parameters whosemagnitudes are associated with considerable uncertainty. Inthe field of mechanical design, these parameters are gener-ally referred to as factors, and this term will be used through-out this paper. To determine the robustness of the optimumdesign with respect to variations in the factors the methodcommonly referred to as the statistical sensitivity analysis[8] will be used in the present work.
The first step in the statistical sensitivity analysis is toidentify the factors and their ranges of variation. The selec-tion of the factors and their ranges is subjective and dependson engineering experience and judgment and it is essentialfor proper formulation of the problem. Typically two to fourvalues (generally referred to as levels) are selected for eachfactor.
The next step in the statistical sensitivity analysis is toidentify the analyses (finite element computational analysesin the present work) which need to be performed in orderto quantify the effect of the selected factors. In general, afactorial design approach can be used in which all possi-ble combinations of the factor levels are used. However, thenumber of the analyses to be carried out can quickly be-come unacceptably large as the number of factors and lev-els increases. To overcome this problem, i.e. to reduce thenumber of analyses which should be performed, the orthog-onal matrix method[9] will be used. The orthogonal matrixmethod contains a column for each factor, while each rowrepresents a particular combination of the levels for eachfactor to be used in an analysis. Thus, the number of analy-ses which needs to be performed is equal to the number ofrows of the corresponding orthogonal matrix. The columnsof the matrix are mutually orthogonal, that is, for any pairof columns, all combinations of the levels of the two fac-

248 M. Grujicic et al. / Materials Science and Engineering B 108 (2004) 241–252
tors appear and each combination appear an equal numberof times. A limited number of standard orthogonal matri-ces[9] is available to accommodate specific numbers of thefactors with various number of levels per factor.
A computational finite element analysis is next performedfor each combination of the factor levels as defined in theappropriate row of the orthogonal matrix. The results of allthe analyses are next tabulated and the overall mean valueof the objective function calculated. The mean values of theobjective function associated with each level of each factorare also calculated. As discussed earlier, each level of a fac-tor appears an equal number of times within its column inthe orthogonal matrix. The objective function results asso-ciated with each level of a factor are averaged to obtain theassociated mean values. The effect of a level of a factor isthen defined as the deviation it causes from the overall meanvalue and is thus obtained by subtracting the overall meanvalue from the mean value associated with the particularlevel of that factor. This process of estimating the effect offactor levels is generally referred to as the analysis of means(ANOM). The ANOM allows determination of the main ef-fect of each factor. However using this procedure it is notpossible to identify possible interactions between the fac-tors. In other words, the ANOM is based on the principle oflinear superposition according to which the system responseη (the objective function in the present case) is given by:
h = overall mean+∑
(factor effect) + error (9)
where error denotes the error associated with the linear su-perposition approximation.
To obtain a more accurate indication of the relative im-portance of the factors and their interactions, the analysisof variance (ANOVA) can be used. The ANOVA allows de-termination of the contribution of each factor to the totalvariation from the overall mean value. This contribution iscomputed in the following way: first, the sum of squares ofthe differences from the mean value for all the levels of eachfactor is calculated. The percentage that this sum for a givenfactor contributes to the cumulative sum for all factors is ameasure of the relative importance of that factor.
The ANOVA also allows estimation of the error associatedwith the linear superposition assumption. The method usedfor the error estimation generally depends on the numberof factors and factor levels as well as on the type of theorthogonal matrix used in the statistical sensitivity analysis.The method described below is generally referred to as thesum of squares method.
The sum of squares due to the error, SSerror, can be cal-culated using the following relationship:
SSerror = SSgrand− SSmean− SSfactors (10)
where SSgrand is the sum of the squares of the results ofall the analyses, SSmean value is equal to the overall meansquared multiplied by the number of analyses and SSfactorsis equal to the sum of squares of all the factor effects. Each
quantity inEq. (10)is associated with a specific number ofdegrees of freedom. The number of degrees of freedom forthe grand total sum of squares, DOFgrand, is equal to thenumber of analysis (i.e. the number of rows in the orthogonalmatrix). The number of degrees of freedom associated withthe mean value, DOFmean, is one. The number of degreesof freedom for each factor, DOFfactor, is one less than thenumber of levels for that factor. The number of degrees offreedom for the error can hence be calculated as:
DOFerror = DOFgrand− 1 −∑
(DOFfactor) (11)
For Eq. (10)to be applicable, the number of degrees offreedom for the error must be greater than zero. If the num-ber of degrees of freedom for the error is zero, a differentmethod must be used to estimate the linear superposition er-ror. An approximate estimate of the sum of the squares dueto the error can be obtained using the sum of squares andthe corresponding number of degrees of freedom associatedwith the half of the factors with the lowest mean square.
Once the sum of squares due to the error and the corre-sponding number of degrees of freedom for the error havebeen calculated, the error variance, VARerror, and the vari-ance ratio,F, can be computed as:
VARerror = SSerror
DOFerror, and (12)
F = (MEANfactor)2
VARerror(13)
where MEANfactor is a mean value of the objective functionfor a given factor. The varaince ratio,F, is used to quantifythe relative magnitude of the effect of each factor. A valueof F less than one normally implies that the effect of thecorresponding given factor is smaller than the error associ-ated with the linear superposition approximation and hencecan be ignored. A value ofF above four, on the other hand,generally suggests that the effect of the factor at hand issignificant.
4. Results and discussion
4.1. The reference case
Contour plots of the current density and the oxygen molefraction at the membrane/cathode interface in the case of thereference design of the PEMFC cathode and the interdigi-tated air distributor are shown inFig. 6a and b, respectively.Based on the results displayed inFig. 6a and b, the follow-ing main observations can be made:
• The variation of the current density over the mem-brane/cathode interface is significant (∼50%) and thelargest values of the current density are found in the re-gion adjacent to the inlet of the interdigitated air distribu-tor. The average current density at the membrane/cathodeinterface is∼10,600 A/m2.

M. Grujicic et al. / Materials Science and Engineering B 108 (2004) 241–252 249
Fig. 6. Variations of: (a) the current density and (b) the oxygen mole fraction over the membrane/cathode interface in the reference design of the PEMFCcathode and the interdigitated air distributor.
• The variation of the oxygen mole fraction over the mem-brane/cathode interface is also significant (∼50%) and thelargest values of the oxygen mole fraction are also foundin the region adjacent to the inlet of the interdigitated airdistributor. However, the lowest levels of the oxygen molefraction are not found in the region adjacent to the outletof the interdigitated air distributor but further away fromit. A careful examination of the diffusion flux fields re-vealed oxygen back-diffusion at the outlet of the interdig-itated air distributor which results in higher oxygen molefractions in this region.
• There is a clear correlation between the current den-sity and the local oxygen mole fraction at the mem-brane/cathode interface.
The variations of the oxygen mole fraction over threeplanes normal to the membrane/cathode interface andparallel with the fuel-cell width are shown inFig. 7a-c.In the first plane which bisects the inlet channel of theinterdigitated air distributor,Fig. 7a, the values of theoxygen mole fraction are the highest and the peak val-
Fig. 7. Variations of the oxygen mole fraction throughout the PEMFC cathode thickness at three different locations relative to the fuel cell front. Pleasesee text for details.
ues are found in the vicinity of the air entrance. In thethird plane which bisects the outlet channel of the inter-digitated air distributor,Fig. 7c, the oxygen mole frac-tions are the lowest. However, due to the effect of oxygenback-diffusion, the oxygen mole fractions are slightly in-creased in the region near the air exit. In the second planewhich is located halfway between the other two planes,Fig. 7b, intermediate values of the oxygen mole fractionare found.
4.2. Fuel-cell design optimization
The optimization procedure described inSection 3.1yielded the following optimal PEMFC cathode and theinterdigitated air distributor geometric parameters:
• the cathode thickness: 0.000037 m;• the channel thickness of the interdigitated air distributor:
0.0005 m (the upper bound); and• the channel width of the interdigitated air distributor:
0.000175 m (the upper bound).

250 M. Grujicic et al. / Materials Science and Engineering B 108 (2004) 241–252
The results of the optimization analysis presented aboveshow that the optimal design of the cathode side of a PEMfuel cell is associated with the upper bounds of the inter-digitated air distributor channel thickness and the channelwidth. The optimal value of the cathode thickness, on theother hand, is quite low but larger than its lower bound. Abrief explanation of these findings is given below.
As the cathode thickness increases, the air begins to takethe shortest route between the inlet and the outlet and toflow mainly near the cathode/current-collector interface.This causes the thickness of the diffusion boundary layeradjacent to the membrane/cathode interface to increase and,in turn, gives rise to a decrease in the rate of oxygen trans-port to the cathodic active layer. This causes a decrease inthe local current density at the membrane/cathode interface.It is hence justified that the optimal PEMFC cathode designis associated with a low value of the cathode thickness.However, if the gas flow through the cathode is analyzedusing an analogy with the gas flow through a pipe, then adecrease in the cathode thickness is equivalent to a decreasein the pipe diameter. Since as the pipe diameter decreases,the resistance to the gas flow increases, one should expectthat below a critical cathode thickness, the electric currentwould begin to decrease with a further decrease in the cath-ode thickness. Hence, the intermediate optimal value of thecathode thickness (∼0.000037 m) found in the present work,is justified. A similar finding was obtained in our recenttwo-dimensional analysis of the effect of cathode thicknesson the average current density on the membrane/cathodeinterface[2].
The effect of the interdigitated air distributor channelthickness can also be explained using the analogy with gasflow through a pipe. The pressure drop between the inter-digitated air distributor inlet and the outlet is fixed and equalto �p. As the channel cross section area increases with anincrease in the channel thickness, the pressure drop insidethe channel decreases. Consequently, a larger pressure dif-ference exists between the surfaces at which the air entersthe cathode and the surfaces at which the air leaves the cath-ode. The resulting higher air velocity promotes convectiveoxygen transport to the membrane/cathode interface. How-ever, the effect of the interdigitated air distributor channelwidth is found to be quite small and if the channel width ischanged from the optimal (upper bound) value to the lower
Table 2PEM fuel cell factors and levels used in the statistical sensitivity analysis
Factor Symbol Units Designation Levels
1 2 3
Empirical value kMS Nm2 kg1/2/K1.75 mol7/6 A 89.9 × 10⁻⁸ 99.9 × 10⁻⁸ 109.9× 10⁻⁸
Thickness of the active layer δ m B 0.9 × 10⁻⁵ 1.0 × 10⁻⁵ 1.1 × 10⁻⁵
Molar diffusion volume of oxygen vO2 m3/mol C 14.9× 10⁻⁶ 16.6 × 10⁻⁶ 18.3 × 10⁻⁶
Molar diffusion volume of water vH2O m3/mol D 11.4× 10⁻⁶ 12.7 × 10⁻⁶ 14.0 × 10⁻⁶
Molar diffusion volume of nitrogen vN2 m3/mol E 16.1× 10⁻⁶ 17.9 × 10⁻⁶ 19.7 × 10⁻⁶
Porosity of cathode ε No units F 0.45 0.50 0.55
bound value the magnitude of the average current density isdecreased by only 0.8%.
The effect of the interdigitated air distributor channelwidth can be explained using the same argument as the oneused to explain the effect of the interdigitated air distribu-tor channel thickness. However, as discussed above, this ef-fect is found to be relatively small. A careful examinationof the oxygen mole fraction and the air velocity fields re-vealed that as the interdigitated air distributor channel widthincreases, a larger fraction of the membrane/cathode inter-face is benefiting from the convective oxygen transport andthis is believed to represent the major contribution that theair distributor channel width has on the average current den-sity. This is consistent with the fact that the effect of the airdistributor channel width is substantially larger than that as-sociated with the air distributor channel thickness. In fact,changing the air distributor channel width from its upperbound to its lower bound value causes the average currentdensity to decrease by 4.7%.
4.3. Statistical sensitivity analysis
Six model parameters (the factors) whose values are as-sociated with the largest uncertainty along with their threelevels (one of which corresponds to the reference value) arelisted inTable 2. The non-reference levels are arbitrarily se-lected to be 10% below and 10% above their correspondingreference values.
TheL18 (36) orthogonal matrix[9] whose rows define the18 finite element computational analyses which are carriedout as a part of the statistical sensitivity analysis is givenin Table 3. The values 1, 2 or 3 in this table correspondrespectively to the three levels of the corresponding factoras defined inTable 2. It should be noted that the referencecase corresponds to the analysis 2 inTable 3. The valuesof the objective function (the averaged current density atthe membrane/cathode interface in A/m2) obtained in the 18analyses are given in the last column inTable 3.
The results of the statistical sensitivity analysis are dis-played in Table 4. The results presented in this table areobtained in the following way. In the first column, the fac-tors are listed in the decreasing order of the variance ratio,F, (given in the last column of the same table). The dif-ference from the mean of the objective function associated

M. Grujicic et al. / Materials Science and Engineering B 108 (2004) 241–252 251
Table 3L18 (36) Orthogonal matrix used in the statistical sensitivity analysis
Analysisnumber
Factors Average currentdensity (A/m2)
A B C D E F
1 1 1 1 1 1 1 11,0932 2 2 2 2 2 2 11,8803 3 3 3 3 3 3 13,0844 1 1 2 2 3 3 11,1855 2 2 3 3 1 1 11,9336 3 3 1 1 2 2 12,7777 1 2 1 3 2 3 11,9358 2 3 2 1 3 1 12,8119 3 1 3 2 1 2 11,135
10 1 3 3 2 2 1 13,12311 2 1 1 3 3 2 11,08712 3 2 2 1 1 3 11,89713 1 2 3 1 3 2 11,96114 2 3 1 2 1 3 13,04315 3 1 2 3 2 1 11,06816 1 3 2 3 1 2 13,21117 2 1 3 1 2 3 11,18918 3 2 1 2 3 1 11,664
Overall mean of the average current density (A/m2) 12,004
factor B and its level 1 is obtained by first calculating themean of the objective function obtained in the analyses 1,4, 9, 11, 15 and 17 in which the level 1 of factor B is used.The overall mean of the objective function (12,004 A/m2,the bottom row, the rightmost column inTable 3) is nextsubtracted from the mean associated with the level 1 of fac-tor B to yield the value−0.8781 A/m2. The same procedureis next used to obtain the remaining values in columns 2–4,Table 4.
The sums of squares associated with each factor are listedin column 5,Table 4. They are obtained by first squaringthe difference from the mean for each level of each factor(columns 2–4,Table 4) and then by multiplying these with6 (the number of times each level appears in each columnof the orthogonal matrix). The values obtained for differentlevels of the same factor are next summed to obtain the sumof squares associated with that factor.
The number of degrees of freedom associated with eachfactor (column 7,Table 4) is one less than the number oflevels of that factor. The number of degrees of freedom
Table 4Statistical sensitivity analysis of the optimal design of the PEM fuel cell
Factor Difference from mean (A/m2) Sum of squares(A/m2)2
Percent of sumof squares
Numberof DOF
Mean sum ofsquares (A/m2)2
Varianceratio F
Level 1 Level 2 Level 3
A 804 −137 −667 0.0667 0.6064 2 0.0333 10.37B −8781 −1259 10,039 10.7684 97.9406 2 0.5384 167.55C −711 44 666 0.0570 0.5187 2 0.0285 8.87D −496 8 488 0.0290 0.2639 2 0.0145 4.51E 478 −89 −389 0.0232 0.2114 2 0.0116 3.62F −556 43 513 0.0344 0.3129 2 0.0172 5.35Error 0.0161 0.1461 5 0.0032
Total 10.9948 100.00
associated with the error is obtained usingEq. (11)to yield:18− 1 − 6(2) = 5.
Since the number of degrees of freedom associated withthe error is nonzero, the sum of squares associated with theerror is calculated usingEq. (10), where the SSgrand termis obtained by summing the squares of the values given inthe last column ofTable 3, the SSmeanterm is computed as18 × (12,004 A/m2)2 and the SSfactor term is obtained bysumming the sum of squares values associated with the sixfactors (column 5,Table 4).
The percent contribution of each factor and the error tothe total sum of the sum of squares is next calculated andlisted in column 6,Table 4.
The mean sum of squares given in column 8,Table 4isobtained by dividing the values given in column 5,Table 4with the number of degrees of freedom, column 7,Table 4.Finally, the variance ratio,F, for each factor (column 9,Table 4) is obtained by dividing its mean sum of squares(column 8,Table 4) by the mean sum of squares associatedwith the error (=0.0032 A2/m4, Table 4).
The results displayed in the last column inTable 3showthat an uncertainty in the value of the thickness of the activelayer has by far the largest effect on the predicted averagecurrent density at the membrane/cathode interface. The ef-fect of other factors is comparably smaller, but since theirvalues of the variance ratio,F, are either above or near 4,the effect of these factors is also significant.
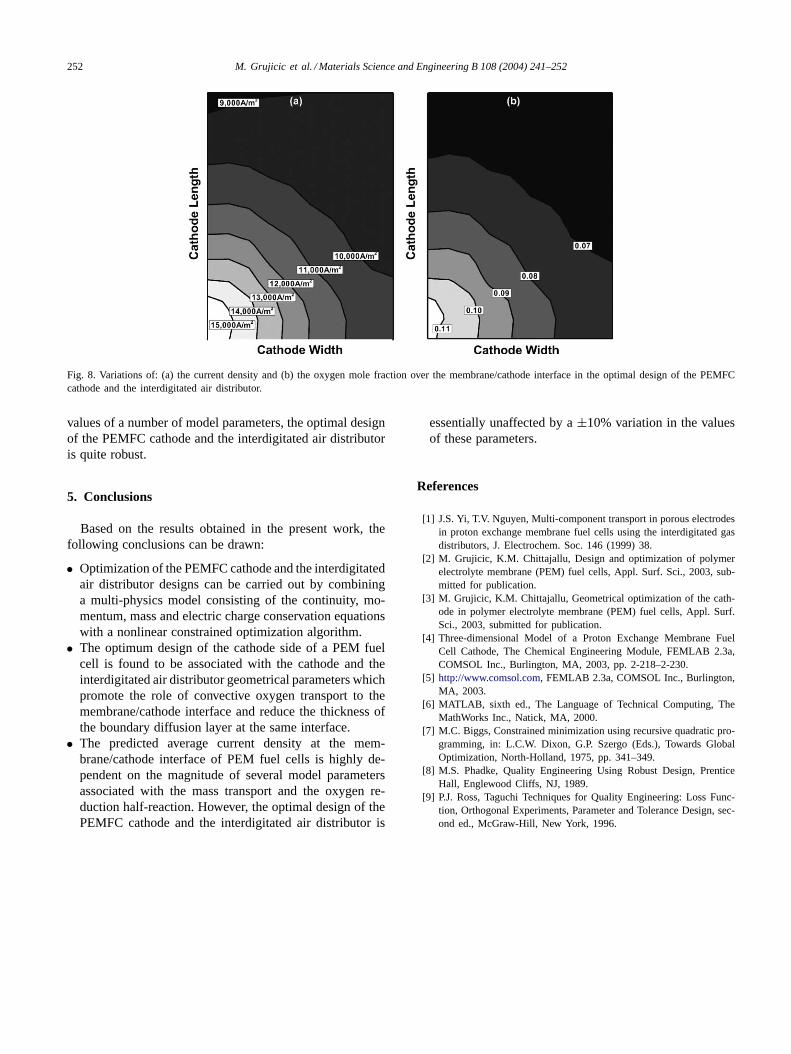
The results displayed inTable 4show that the levels ofthe six factors associated with analysis 16 gives rise to thelargest deviation from the reference case, analysis 2. To testthe robustness of the optimal design of the PEMFC cathodeand the interdigitated air distributor discussed in the previ-ous section, the optimization procedure is repeated but forthe factor levels corresponding to analysis 16. The optimiza-tion results obtained show that the optimal values of thethree fuel-cell design parameters are almost identical to theones for the reference case. This finding suggest that whileuncertainties in the values of various model parameters canhave a major effect on the predicted average current densityat the membrane/cathode interface, the optimal design of aPEM fuel-cell is not significantly affected by such uncer-tainties (Fig. 8). Therefore, despite some uncertainties in the
252 M. Grujicic et al. / Materials Science and Engineering B 108 (2004) 241–252
Fig. 8. Variations of: (a) the current density and (b) the oxygen mole fraction over the membrane/cathode interface in the optimal design of the PEMFCcathode and the interdigitated air distributor.
values of a number of model parameters, the optimal designof the PEMFC cathode and the interdigitated air distributoris quite robust.
5. Conclusions
Based on the results obtained in the present work, thefollowing conclusions can be drawn:
• Optimization of the PEMFC cathode and the interdigitatedair distributor designs can be carried out by combininga multi-physics model consisting of the continuity, mo-mentum, mass and electric charge conservation equationswith a nonlinear constrained optimization algorithm.
• The optimum design of the cathode side of a PEM fuelcell is found to be associated with the cathode and theinterdigitated air distributor geometrical parameters whichpromote the role of convective oxygen transport to themembrane/cathode interface and reduce the thickness ofthe boundary diffusion layer at the same interface.
• The predicted average current density at the mem-brane/cathode interface of PEM fuel cells is highly de-pendent on the magnitude of several model parametersassociated with the mass transport and the oxygen re-duction half-reaction. However, the optimal design of thePEMFC cathode and the interdigitated air distributor is
essentially unaffected by a±10% variation in the valuesof these parameters.
References
[1] J.S. Yi, T.V. Nguyen, Multi-component transport in porous electrodesin proton exchange membrane fuel cells using the interdigitated gasdistributors, J. Electrochem. Soc. 146 (1999) 38.
[2] M. Grujicic, K.M. Chittajallu, Design and optimization of polymerelectrolyte membrane (PEM) fuel cells, Appl. Surf. Sci., 2003, sub-mitted for publication.
[3] M. Grujicic, K.M. Chittajallu, Geometrical optimization of the cath-ode in polymer electrolyte membrane (PEM) fuel cells, Appl. Surf.Sci., 2003, submitted for publication.
[4] Three-dimensional Model of a Proton Exchange Membrane FuelCell Cathode, The Chemical Engineering Module, FEMLAB 2.3a,COMSOL Inc., Burlington, MA, 2003, pp. 2-218–2-230.
[5] http://www.comsol.com, FEMLAB 2.3a, COMSOL Inc., Burlington,MA, 2003.
[6] MATLAB, sixth ed., The Language of Technical Computing, TheMathWorks Inc., Natick, MA, 2000.
[7] M.C. Biggs, Constrained minimization using recursive quadratic pro-gramming, in: L.C.W. Dixon, G.P. Szergo (Eds.), Towards GlobalOptimization, North-Holland, 1975, pp. 341–349.
[8] M.S. Phadke, Quality Engineering Using Robust Design, PrenticeHall, Englewood Cliffs, NJ, 1989.
[9] P.J. Ross, Taguchi Techniques for Quality Engineering: Loss Func-tion, Orthogonal Experiments, Parameter and Tolerance Design, sec-ond ed., McGraw-Hill, New York, 1996.