Embed Size (px)
Citation preview
Causes of excessmortality in cerebralpalsy
David Strauss* PhD FASA, Department of Statistics,
University of California, Riverside;
William Cable MD, Fairview Developmental Center, Costa
Mesa;
Robert Shavelle PhD, Department of Statistics, University of
California, Riverside, CA 92521-0138, USA.
*Correspondence to first author at above address.
It is well known that individuals with cerebral palsy (CP) aresubject to higher mortality than the general population butthe causes of this have not been systematically analysed. Thisstudy investigates mortality in a Californian population of45 292 individuals with CP, 4028 of whom died during the1986 to 1995 study period. The aims of this study were toidentify diseases that may be causally linked with CP, anddiseases whose diagnosis and/or treatment needimprovement. Overall, the standardized mortality ratio(SMR) was 8.4. Mortality from breast cancer was three timesthat of the general population, suggesting poorer detectionand/or treatment. The dramatic elevation of mortality due tobrain cancer, especially in children (SMR=24), raises thepossibility of a link between this and CP. Cause of death wasnon-specific in some individuals. Therefore, these SMRs areconservative. As expected, SMRs due to respiratory diseaseswere very high but, contrary to anecdotal reports, suchdiseases did not account for most deaths. High SMRs werealso found for diseases of the circulatory and digestivesystems. Finally, a marked elevation of deaths was due toexternal causes, including drowning and being hit by motorvehicles.
Cerebral palsy (CP) has been described as ‘... a term of conve-
nience applied to a group of motor disorders of central ori-
gin... As generally understood there must be motor
impairment, and this impairment must stem from a malfunc-
tion of the brain (rather than spinal cord or muscles) .... [the
brain malfunction] must be non-progressive and it must be
manifest early in life’ (p 520) (Badawi et al. 1998). There is
substantial literature on mortality and life expectancy of indi-
viduals with CP (see Evans et al. 1990, Hutton et al. 1994,
Chrichton et al. 1995, Strauss 1997, Strauss and Shavelle
1998a, Strauss et al. 1998a). Life expectancy is shorter than in
the general population, especially when the CP is accompa-
nied by severe disabilities. Respiratory diseases are often
considered the main cause of death in CP, but there have
been few studies of cause-specific mortality.
In a recent investigation of individuals with developmental
disability in London, Hollins and coworkers (1998) reported
that 52% of the deaths were due to respiratory disease.
Plioplys and coworkers (1998) found 77% of the deaths to be
due to pneumonia in their population (mostly children) with
very severe neurological disabilities. Jancar and Speller (1994)
observed high death rates due to intestinal obstruction, espe-
cially volvulus. A study in California, USA of externally caused
deaths among individuals with developmental disabilities
found elevated mortality due to drowning and pedestrian ver-
sus motor-vehicle accidents (Strauss et al. 1998b).
The present study was undertaken to compare mortality
rates in CP with those in the general population. The large data-
base available (45292 subjects, 4028 of whom died, with infor-
mation on the cause of death on a computerized database)
permitted detailed cause-specific comparisons. The aims were
as follows: to identify diseases for further investigation that
may be causally linked with CP; to quantify cause-specific mor-
tality rates so that the effect on life expectancy of eliminating
certain avoidable causes may be assessed; and to identify caus-
es of death whose elevated rates relative to the general popula-
tion may reflect the need for better diagnosis and/or treatment.
Our approach was epidemiological rather than clinical,
and the work should be viewed as a stimulus and guide to
more in-depth investigations.
MethodSUBJECTS
Our base population comprised 182 263 individuals with
developmental disability who received services from the State
of California, USA between January 1980 and December
1995. Services include medical treatment, occupational or
physical therapy, and accommodation and care. All such indi-
viduals are evaluated approximately annually, using the
Client Development Evaluation Report (CDER; California
Department of Developmental Services 1986). This instru-
ment contains some 200 psychological, medical, functional,
behavioral, and cognitive items. The reliability of the func-
tional items has been assessed previously and judged satisfac-
tory (Harris et al. 1982, Arias et al. 1983, Widaman 1984,
Widaman et al. 1985, Citygate 1998). Interrater reliabilities
(Agresti 1990) of the motoric and feeding variables described
in the present study exceeded 0.85.
The study period was the 10-year interval 1986 to 1995. For
the purposes of this study, individuals with CP were consid-
ered at risk from the date of the first CDER evaluation or 1
January 1986, whichever came later, until the earliest of the
580 Developmental Medicine & Child Neurology 1999, 41: 580–585
following: the date of death, the end of the study period (31
December 1995), or 3 years after the date of the subject’s last
CDER evaluation. This last condition was included to mini-
mize the potential bias due to subjects who left California.
Deaths of such individuals would not be in our records, but
because of the last condition these subjects would also not be
counted as being at risk for more than a fairly short period.
Migration from California is generally believed to be uncom-
mon because California is the only US state providing services
to individuals with developmental disability as an entitlement.
CP was assessed by an evaluation team contracted by the
California Department of Developmental Services as part of
the initial work-up for receiving services. We used three
CDER items to identify subjects with CP: severity, type, and
location of CP. Definitions are given below. A CDER evalua-
tion was defined as being one of CP if all three items indicat-
ed presence of CP. All three interitem reliabilities exceeded
0.99. We identified 45 292 individuals with CP.
It seems likely that only a small proportion of individuals in
the study acquired their disability in the postneonatal period.
For example, of the subjects who were born after 1980, so that
they could have had an evaluation of CP in infancy, 84% did in
fact have such an evaluation before the age of 3 years, and pre-
sumably almost all of these children had congenital or neonatal
defects. Of the others, some origins are doubtless congenital
but their families moved into California later, perhaps to take
advantage of the state’s entitlement to services for CP, and some
entered the California system only after attending school,
when their condition became a disability. Nevertheless, some
children undoubtedly had insults after the neonatal condition,
and their recorded cause of death is sometimes also the etiolo-
gy of the dysfunction. Unfortunately, we can only identify the
etiology (near-drowning, motor-vehicle accidents and so on)
for a very small proportion of the subjects.
Mortality information was obtained from annual computer
tapes from the California Department of Health Services, and
matched against the subjects with CP on the basis of name,
date of birth, and social-security number when available. We
identified 4028 subjects who died during the study period.
Causes of death are given on the computer tapes in the form of
ICD-9 codes (Context Software Systems, Inc., 1995).
Data are available only on individuals receiving services
from the state, therefore, the sample is weighted towards the
more severely involved subjects. There is, for example, a
higher proportion of individuals with quadriplegia and a
lower proportion with hemiplegia than in many studies. This
underscores the need to take account of functional level
when making comparisons.
For each cause of death we computed the age- and sex-
specific mortality rates (deaths per 100 000 person-years of
exposure) in the general Californian population, using the
mortality tapes. We then applied these rates to the age- and
sex-specific exposure times for individuals with CP. This
yielded an expected number of deaths due to each cause, on
the basis of the general population. Each ratio of observed to
expected numbers of deaths gives the standardized mortality
ratio (SMR) (Kahn and Sempos 1989). By using the same
source of mortality information when comparing the group
with CP with the general Californian population we attempt-
ed to minimize various sources of reporting bias. Further, by
using the midpoint of the study period (the year 1990) for
calculating the age-, sex-, and cause-specific mortality rates in
the general population, our comparisons relate to approxi-
mately the same calendar years. This should minimize bias
due to various cause-specific secular trends.
Results were subsequently stratified into five age groups:
<5 years, 5 to 14 years, 15 to 34 years, 35 to 54 years, and ≥ 55
years. After some preliminary analysis we also chose to stratify
subjects into two groups on the basis of the severity of impact
of CP: severe and not severe. Severe CP is defined as a ‘condi-
tion so substantial that it is exceedingly difficult to find an
appropriate placement for the client and/or constant
care/supervision is required’ (CDER 1986). Our results on
cause-specific mortality are broken down into 10 (5 × 2) cate-
gories. In the tables that follow, the results of significance tests
of the SMRs are reported (against the null hypothesis that the
death rate is the same as in the general population). It was
considered inappropriate to carry out such tests separately for
each age group. For brevity, age groups were combined when
numbers were judged to be too small to be informative.
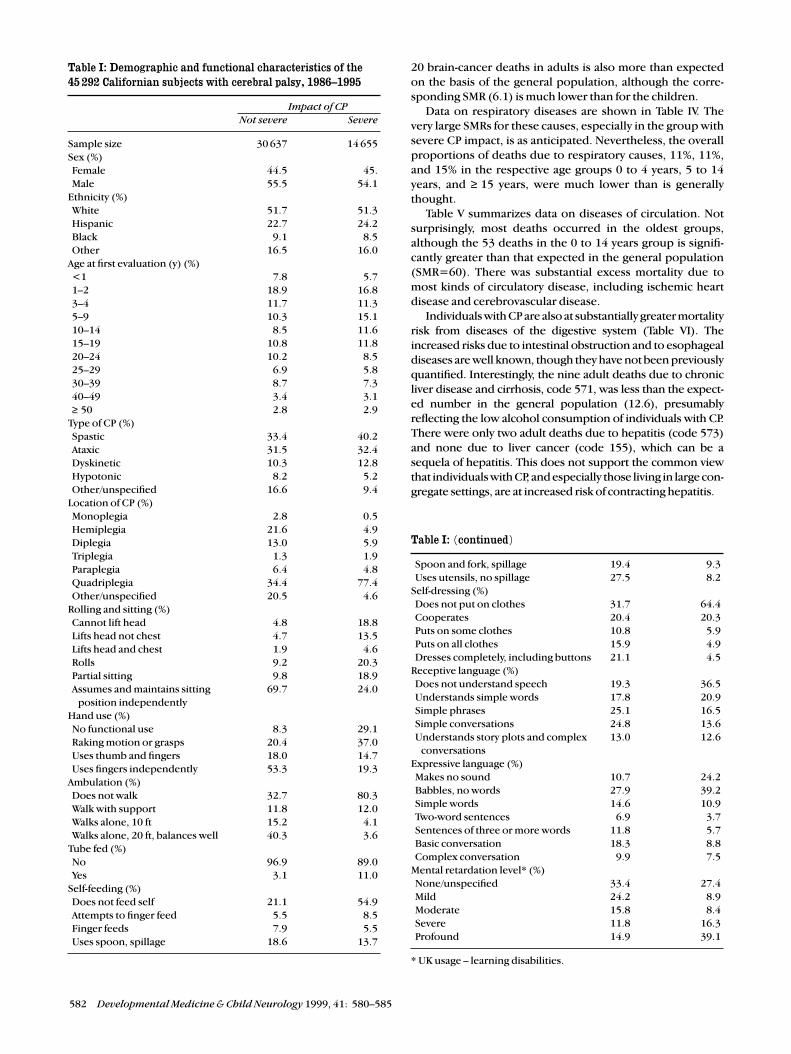
ResultsTable I shows the demographics and functional characteris-
tics of the 45 292 subjects with CP. The impact of CP was
reported as ‘severe’ for 14 655 subjects (32%). The other cat-
egories (mild, 22%; moderate, 33%; unspecified, 13%) were
combined into a ‘not severe’ group.
Table I shows the usual excess of males. Regarding age dis-
tribution, it should be noted that many subjects enter the
study long after they are identified as having CP. For example,
subjects born before 1986, the beginning of the study peri-
od, could not contribute to the study until at least 1986. Not
surprisingly, most (77%) of the subjects with severe CP
impact had quadriplegia. The corresponding figure for those
not severely impacted was 34%.
The instrument (CDER 1986) also includes functional
items, some of which are shown in Table I. Each item is scaled
from low to high level of skill, and the subjects’ highest level is
reported. The table shows, for example, that only 24% of the
severe group, compared with 70% of those not severely affect-
ed, could assume and maintain a sitting position independent-
ly. A similar pattern may be seen in the other functional items.
Table II presents the aggregated mortality statistics (i.e.
not broken down by cause of death). As expected, the SMRs
for the severe group are much larger than those for the not
severe group in every age category. The decrease in SMRs
with age reflects both a healthy survivor effect and the
increased mortality risk with age in the general population.
Even in the oldest group, however, mortality was more than
double that of the general population.
Table III shows the causes of death due to various cancers.
In each age group the total number of cancer deaths is sub-
stantially higher than expected in the general population, as
indicated by the significantly large SMRs. Cancers of the
digestive system are elevated in both groups. The very small
SMR (0.2; P<0.001) for lung cancer is noteworthy; this pre-
sumably reflects the low rate of smoking among individuals
with CP, and thus represents one more piece of evidence on
the effect of smoking. By contrast, breast cancer deaths were
three times higher than expected.
Eighteen children aged under 15 years died from brain
cancer, compared with 0.68 expected in the general popula-
tion (SMR=26). These 18 deaths account for 44% of all cancer
deaths in children under the age of 15 years in this study. The
Excess Mortality in Cerebral Palsy David Strauss et al. 581
20 brain-cancer deaths in adults is also more than expected
on the basis of the general population, although the corre-
sponding SMR (6.1) is much lower than for the children.
Data on respiratory diseases are shown in Table IV. The
very large SMRs for these causes, especially in the group with
severe CP impact, is as anticipated. Nevertheless, the overall
proportions of deaths due to respiratory causes, 11%, 11%,
and 15% in the respective age groups 0 to 4 years, 5 to 14
years, and ≥ 15 years, were much lower than is generally
thought.
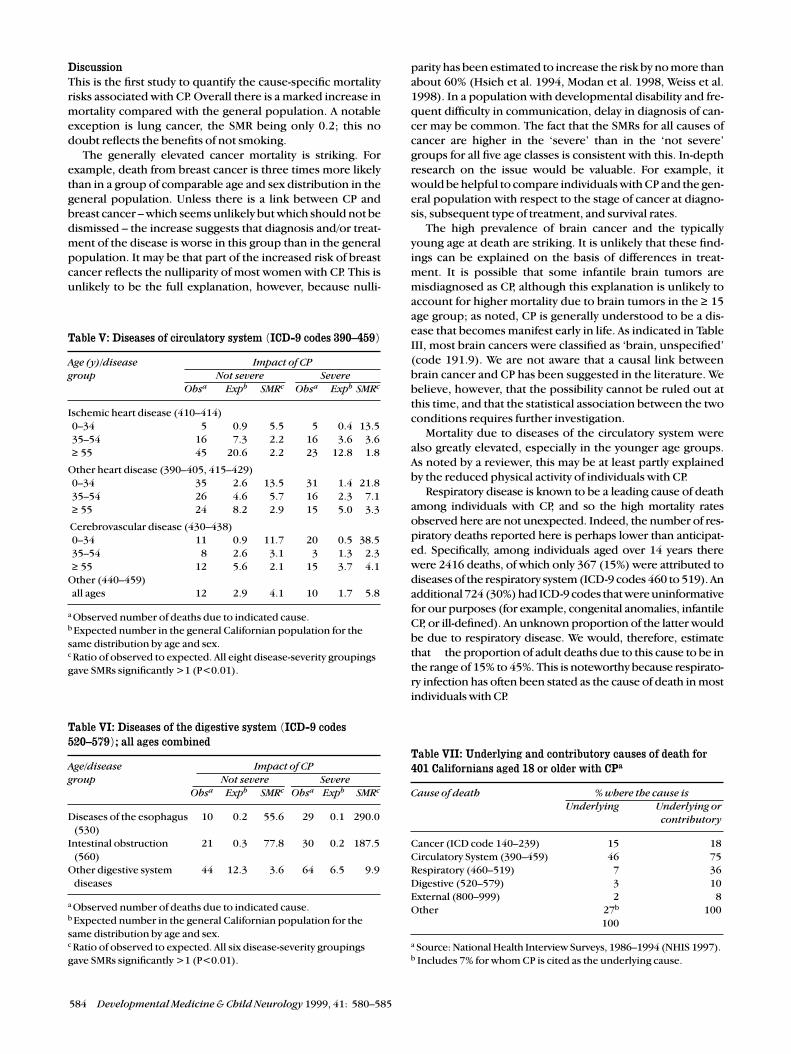
Table V summarizes data on diseases of circulation. Not
surprisingly, most deaths occurred in the oldest groups,
although the 53 deaths in the 0 to 14 years group is signifi-
cantly greater than that expected in the general population
(SMR=60). There was substantial excess mortality due to
most kinds of circulatory disease, including ischemic heart
disease and cerebrovascular disease.
Individuals with CP are also at substantially greater mortality
risk from diseases of the digestive system (Table VI). The
increased risks due to intestinal obstruction and to esophageal
diseases are well known, though they have not been previously
quantified. Interestingly, the nine adult deaths due to chronic
liver disease and cirrhosis, code 571, was less than the expect-
ed number in the general population (12.6), presumably
reflecting the low alcohol consumption of individuals with CP.
There were only two adult deaths due to hepatitis (code 573)
and none due to liver cancer (code 155), which can be a
sequela of hepatitis. This does not support the common view
that individuals with CP, and especially those living in large con-
gregate settings, are at increased risk of contracting hepatitis.
582 Developmental Medicine & Child Neurology 1999, 41: 580–585
Table I: Demographic and functional characteristics of the45 292 Californian subjects with cerebral palsy, 1986–1995
Impact of CPNot severe Severe
Sample size 30 637 14 655
Sex (%)
Female 44.5 45.
Male 55.5 54.1
Ethnicity (%)
White 51.7 51.3
Hispanic 22.7 24.2
Black 9.1 8.5
Other 16.5 16.0
Age at first evaluation (y) (%)
<1 7.8 5.7
1–2 18.9 16.8
3–4 11.7 11.3
5–9 10.3 15.1
10–14 8.5 11.6
15–19 10.8 11.8
20–24 10.2 8.5
25–29 6.9 5.8
30–39 8.7 7.3
40–49 3.4 3.1
≥ 50 2.8 2.9
Type of CP (%)
Spastic 33.4 40.2
Ataxic 31.5 32.4
Dyskinetic 10.3 12.8
Hypotonic 8.2 5.2
Other/unspecified 16.6 9.4
Location of CP (%)
Monoplegia 2.8 0.5
Hemiplegia 21.6 4.9
Diplegia 13.0 5.9
Triplegia 1.3 1.9
Paraplegia 6.4 4.8
Quadriplegia 34.4 77.4
Other/unspecified 20.5 4.6
Rolling and sitting (%)
Cannot lift head 4.8 18.8
Lifts head not chest 4.7 13.5
Lifts head and chest 1.9 4.6
Rolls 9.2 20.3
Partial sitting 9.8 18.9
Assumes and maintains sitting 69.7 24.0
position independently
Hand use (%)
No functional use 8.3 29.1
Raking motion or grasps 20.4 37.0
Uses thumb and fingers 18.0 14.7
Uses fingers independently 53.3 19.3
Ambulation (%)
Does not walk 32.7 80.3
Walk with support 11.8 12.0
Walks alone, 10 ft 15.2 4.1
Walks alone, 20 ft, balances well 40.3 3.6
Tube fed (%)
No 96.9 89.0
Yes 3.1 11.0
Self-feeding (%)
Does not feed self 21.1 54.9
Attempts to finger feed 5.5 8.5
Finger feeds 7.9 5.5
Uses spoon, spillage 18.6 13.7
Table I: (continued)
Spoon and fork, spillage 19.4 9.3
Uses utensils, no spillage 27.5 8.2
Self-dressing (%)
Does not put on clothes 31.7 64.4
Cooperates 20.4 20.3
Puts on some clothes 10.8 5.9
Puts on all clothes 15.9 4.9
Dresses completely, including buttons 21.1 4.5
Receptive language (%)
Does not understand speech 19.3 36.5
Understands simple words 17.8 20.9
Simple phrases 25.1 16.5
Simple conversations 24.8 13.6
Understands story plots and complex 13.0 12.6
conversations
Expressive language (%)
Makes no sound 10.7 24.2
Babbles, no words 27.9 39.2
Simple words 14.6 10.9
Two-word sentences 6.9 3.7
Sentences of three or more words 11.8 5.7
Basic conversation 18.3 8.8
Complex conversation 9.9 7.5
Mental retardation level* (%)
None/unspecified 33.4 27.4
Mild 24.2 8.9
Moderate 15.8 8.4
Severe 11.8 16.3
Profound 14.9 39.1
* UK usage – learning disabilities.
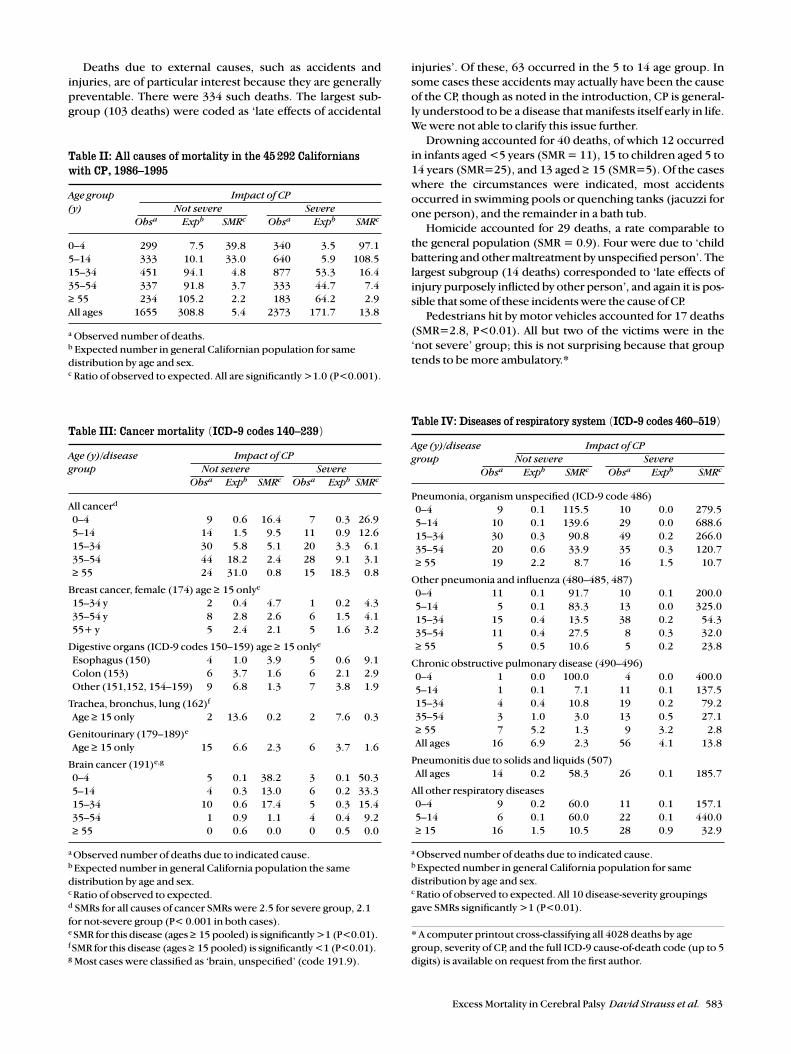
Deaths due to external causes, such as accidents and
injuries, are of particular interest because they are generally
preventable. There were 334 such deaths. The largest sub-
group (103 deaths) were coded as ‘late effects of accidental
injuries’. Of these, 63 occurred in the 5 to 14 age group. In
some cases these accidents may actually have been the cause
of the CP, though as noted in the introduction, CP is general-
ly understood to be a disease that manifests itself early in life.
We were not able to clarify this issue further.
Drowning accounted for 40 deaths, of which 12 occurred
in infants aged <5 years (SMR = 11), 15 to children aged 5 to
14 years (SMR=25), and 13 aged ≥ 15 (SMR=5). Of the cases
where the circumstances were indicated, most accidents
occurred in swimming pools or quenching tanks (jacuzzi for
one person), and the remainder in a bath tub.
Homicide accounted for 29 deaths, a rate comparable to
the general population (SMR = 0.9). Four were due to ‘child
battering and other maltreatment by unspecified person’. The
largest subgroup (14 deaths) corresponded to ‘late effects of
injury purposely inflicted by other person’, and again it is pos-
sible that some of these incidents were the cause of CP.
Pedestrians hit by motor vehicles accounted for 17 deaths
(SMR=2.8, P<0.01). All but two of the victims were in the
‘not severe’ group; this is not surprising because that group
tends to be more ambulatory.*
Excess Mortality in Cerebral Palsy David Strauss et al. 583
Table II: All causes of mortality in the 45 292 Californianswith CP, 1986–1995
Age group Impact of CP (y) Not severe Severe
Obsa Expb SMRc Obsa Expb SMRc
0–4 299 7.5 39.8 340 3.5 97.1
5–14 333 10.1 33.0 640 5.9 108.5
15–34 451 94.1 4.8 877 53.3 16.4
35–54 337 91.8 3.7 333 44.7 7.4
≥ 55 234 105.2 2.2 183 64.2 2.9
All ages 1655 308.8 5.4 2373 171.7 13.8
a Observed number of deaths.b Expected number in general Californian population for same
distribution by age and sex.c Ratio of observed to expected. All are significantly >1.0 (P<0.001).
Table III: Cancer mortality (ICD-9 codes 140–239)
Age (y)/disease Impact of CPgroup Not severe Severe
Obsa Expb SMRc Obsa Expb SMRc
All cancerd
0–4 9 0.6 16.4 7 0.3 26.9
5–14 14 1.5 9.5 11 0.9 12.6
15–34 30 5.8 5.1 20 3.3 6.1
35–54 44 18.2 2.4 28 9.1 3.1
≥ 55 24 31.0 0.8 15 18.3 0.8
Breast cancer, female (174) age ≥ 15 onlye
15–34 y 2 0.4 4.7 1 0.2 4.3
35–54 y 8 2.8 2.6 6 1.5 4.1
55+ y 5 2.4 2.1 5 1.6 3.2
Digestive organs (ICD-9 codes 150–159) age ≥ 15 onlye
Esophagus (150) 4 1.0 3.9 5 0.6 9.1
Colon (153) 6 3.7 1.6 6 2.1 2.9
Other (151,152, 154–159) 9 6.8 1.3 7 3.8 1.9
Trachea, bronchus, lung (162)f
Age ≥ 15 only 2 13.6 0.2 2 7.6 0.3
Genitourinary (179–189)e
Age ≥ 15 only 15 6.6 2.3 6 3.7 1.6
Brain cancer (191)e,g
0–4 5 0.1 38.2 3 0.1 50.3
5–14 4 0.3 13.0 6 0.2 33.3
15–34 10 0.6 17.4 5 0.3 15.4
35–54 1 0.9 1.1 4 0.4 9.2
≥ 55 0 0.6 0.0 0 0.5 0.0
a Observed number of deaths due to indicated cause.b Expected number in general California population the same
distribution by age and sex.c Ratio of observed to expected.d SMRs for all causes of cancer SMRs were 2.5 for severe group, 2.1
for not-severe group (P< 0.001 in both cases).e SMR for this disease (ages ≥ 15 pooled) is significantly >1 (P<0.01). f SMR for this disease (ages ≥ 15 pooled) is significantly <1 (P<0.01).g Most cases were classified as ‘brain, unspecified’ (code 191.9).
Table IV: Diseases of respiratory system (ICD-9 codes 460–519)
Age (y)/disease Impact of CP group Not severe Severe
Obsa Expb SMRc Obsa Expb SMRc
Pneumonia, organism unspecified (ICD-9 code 486)
0–4 9 0.1 115.5 10 0.0 279.5
5–14 10 0.1 139.6 29 0.0 688.6
15–34 30 0.3 90.8 49 0.2 266.0
35–54 20 0.6 33.9 35 0.3 120.7
≥ 55 19 2.2 8.7 16 1.5 10.7
Other pneumonia and influenza (480–485, 487)
0–4 11 0.1 91.7 10 0.1 200.0
5–14 5 0.1 83.3 13 0.0 325.0
15–34 15 0.4 13.5 38 0.2 54.3
35–54 11 0.4 27.5 8 0.3 32.0
≥ 55 5 0.5 10.6 5 0.2 23.8
Chronic obstructive pulmonary disease (490–496)
0–4 1 0.0 100.0 4 0.0 400.0
5–14 1 0.1 7.1 11 0.1 137.5
15–34 4 0.4 10.8 19 0.2 79.2
35–54 3 1.0 3.0 13 0.5 27.1
≥ 55 7 5.2 1.3 9 3.2 2.8
All ages 16 6.9 2.3 56 4.1 13.8
Pneumonitis due to solids and liquids (507)
All ages 14 0.2 58.3 26 0.1 185.7
All other respiratory diseases
0–4 9 0.2 60.0 11 0.1 157.1
5–14 6 0.1 60.0 22 0.1 440.0
≥ 15 16 1.5 10.5 28 0.9 32.9
a Observed number of deaths due to indicated cause.b Expected number in general California population for same
distribution by age and sex.c Ratio of observed to expected. All 10 disease-severity groupings
gave SMRs significantly >1 (P<0.01).
* A computer printout cross-classifying all 4028 deaths by age
group, severity of CP, and the full ICD-9 cause-of-death code (up to 5
digits) is available on request from the first author.
DiscussionThis is the first study to quantify the cause-specific mortality
risks associated with CP. Overall there is a marked increase in
mortality compared with the general population. A notable
exception is lung cancer, the SMR being only 0.2; this no
doubt reflects the benefits of not smoking.
The generally elevated cancer mortality is striking. For
example, death from breast cancer is three times more likely
than in a group of comparable age and sex distribution in the
general population. Unless there is a link between CP and
breast cancer – which seems unlikely but which should not be
dismissed – the increase suggests that diagnosis and/or treat-
ment of the disease is worse in this group than in the general
population. It may be that part of the increased risk of breast
cancer reflects the nulliparity of most women with CP. This is
unlikely to be the full explanation, however, because nulli-
parity has been estimated to increase the risk by no more than
about 60% (Hsieh et al. 1994, Modan et al. 1998, Weiss et al.
1998). In a population with developmental disability and fre-
quent difficulty in communication, delay in diagnosis of can-
cer may be common. The fact that the SMRs for all causes of
cancer are higher in the ‘severe’ than in the ‘not severe’
groups for all five age classes is consistent with this. In-depth
research on the issue would be valuable. For example, it
would be helpful to compare individuals with CP and the gen-
eral population with respect to the stage of cancer at diagno-
sis, subsequent type of treatment, and survival rates.
The high prevalence of brain cancer and the typically
young age at death are striking. It is unlikely that these find-
ings can be explained on the basis of differences in treat-
ment. It is possible that some infantile brain tumors are
misdiagnosed as CP, although this explanation is unlikely to
account for higher mortality due to brain tumors in the ≥ 15
age group; as noted, CP is generally understood to be a dis-
ease that becomes manifest early in life. As indicated in Table
III, most brain cancers were classified as ‘brain, unspecified’
(code 191.9). We are not aware that a causal link between
brain cancer and CP has been suggested in the literature. We
believe, however, that the possibility cannot be ruled out at
this time, and that the statistical association between the two
conditions requires further investigation.
Mortality due to diseases of the circulatory system were
also greatly elevated, especially in the younger age groups.
As noted by a reviewer, this may be at least partly explained
by the reduced physical activity of individuals with CP.
Respiratory disease is known to be a leading cause of death
among individuals with CP, and so the high mortality rates
observed here are not unexpected. Indeed, the number of res-
piratory deaths reported here is perhaps lower than anticipat-
ed. Specifically, among individuals aged over 14 years there
were 2416 deaths, of which only 367 (15%) were attributed to
diseases of the respiratory system (ICD-9 codes 460 to 519). An
additional 724 (30%) had ICD-9 codes that were uninformative
for our purposes (for example, congenital anomalies, infantile
CP, or ill-defined). An unknown proportion of the latter would
be due to respiratory disease. We would, therefore, estimate
that the proportion of adult deaths due to this cause to be in
the range of 15% to 45%. This is noteworthy because respirato-
ry infection has often been stated as the cause of death in most
individuals with CP.
584 Developmental Medicine & Child Neurology 1999, 41: 580–585
Table V: Diseases of circulatory system (ICD-9 codes 390–459)
Age (y)/disease Impact of CP group Not severe Severe
Obsa Expb SMRc Obsa Expb SMRc
Ischemic heart disease (410–414)
0–34 5 0.9 5.5 5 0.4 13.5
35–54 16 7.3 2.2 16 3.6 3.6
≥ 55 45 20.6 2.2 23 12.8 1.8
Other heart disease (390–405, 415–429)
0–34 35 2.6 13.5 31 1.4 21.8
35–54 26 4.6 5.7 16 2.3 7.1
≥ 55 24 8.2 2.9 15 5.0 3.3
Cerebrovascular disease (430–438)
0–34 11 0.9 11.7 20 0.5 38.5
35–54 8 2.6 3.1 3 1.3 2.3
≥ 55 12 5.6 2.1 15 3.7 4.1
Other (440–459)
all ages 12 2.9 4.1 10 1.7 5.8
a Observed number of deaths due to indicated cause.b Expected number in the general Californian population for the
same distribution by age and sex.c Ratio of observed to expected. All eight disease-severity groupings
gave SMRs significantly >1 (P<0.01).
Table VI: Diseases of the digestive system (ICD-9 codes520–579); all ages combined
Age/disease Impact of CP group Not severe Severe
Obsa Expb SMRc Obsa Expb SMRc
Diseases of the esophagus 10 0.2 55.6 29 0.1 290.0
(530)
Intestinal obstruction 21 0.3 77.8 30 0.2 187.5
(560)
Other digestive system 44 12.3 3.6 64 6.5 9.9
diseases
a Observed number of deaths due to indicated cause.b Expected number in the general Californian population for the
same distribution by age and sex.c Ratio of observed to expected. All six disease-severity groupings
gave SMRs significantly >1 (P<0.01).
Table VII: Underlying and contributory causes of death for401 Californians aged 18 or older with CPa
Cause of death % where the cause isUnderlying Underlying or
contributory
Cancer (ICD code 140–239) 15 18
Circulatory System (390–459) 46 75
Respiratory (460–519) 7 36
Digestive (520–579) 3 10
External (800–999) 2 8
Other 27b 100
100
a Source: National Health Interview Surveys, 1986–1994 (NHIS 1997).b Includes 7% for whom CP is cited as the underlying cause.
We also found excess mortality due to certain external caus-
es, such as pedestrian accidents and drowning. Similar results
have been reported for other individuals with developmental
disabilities (Strauss et al. 1998b). In a supposedly protected
group of vulnerable individuals, such incidents ought be a rari-
ty, and parents/caregivers should be aware of the elevated risks.
The results reported here can be used to adjust life
expectancy estimates to reflect reductions in cause-specific
mortality rates. Such reductions may be appropriate for a
patient with exceptionally good medical care. As an example,
we show the effect of halving the mortality risk due to respi-
ratory disease for a 15-year-old male with CP and quadripleg-
ia. Before reduction the life expectancy is 34.3 additional
years, according to an actuarial analysis (Strauss and Shavelle
1998b). If we assume that 45% of all mortality in such
patients is respiratory-related we have a 22.5% reduction in
overall mortality. This leads to a revised life expectancy of
38.1 additional years, an increase of 3.8 years.
The SMRs reported here are actually likely to be conserva-
tive (i.e. underestimates). This is because a substantial num-
ber of deaths with uninformative codes, such as ‘congenital
anomalies’, should really be ascribed to specific causes.
Unfortunately we do not have access to multiple-cause-of-
death data which can be linked to our own. Multiple-cause-
of-death data without personal identifiers were, however,
available from the 1986 to 1994 National Health Interview
Surveys (NHIS 1997).
Using the operational definition of CP of Boyle and col-
leagues (1994), namely ICD-9 codes 333.2, 333.7, and 342 to
344, we identified the 401 individuals whose death certificate
included a reference to CP. Table VII shows the prevalence of
some of the principal diseases on the death certificates, and
the frequency with which they were listed as the underlying
cause. The table confirms, for example, that respiratory infec-
tion is by no means the most common cause in this popula-
tion. The most common cause is disease of the circulatory
system, just as in the general population. The data here, how-
ever, were derived only from adults; presumably the contri-
bution of respiratory disease to infant mortality is greater.
Necessarily, large epidemiological studies such as this
deal only with gross patterns, and leave many questions
unanswered. They complement in-depth clinical observa-
tion rather than serve as a substitute for it. It is hoped that the
findings will stimulate more focused research on the reasons
for excess mortality in CP.
Accepted for publication 31st March 1999.
AcknowledgementProvision of data from the California Departments of DevelopmentalServices and Health Services is gratefully acknowledged. The viewsexpressed are those of the authors, and do not necessarily reflectthose of the State of California or its agencies. The authors also thankDr Eva Alberman and an anonymous reviewer for helpful suggestions.
ReferencesAgresti A. (1990) Categorical Data Analysis. New York: Wiley. Arias M, Ito E, Takagi N. (1983) Concurrent validity of the client
development and evaluation report. In: Silverstein AB, FluhartyAL, editors. Pacific State Archives VIII. Pomona, CA: University ofCalifornia at Los Angeles, Developmental Disabilities ImmersionProgram. p 28–33.
Badawi N, Watson L, Petterson B, Blair E, Slee J, Haan E, Stanley F.(1998) What constitutes cerebral palsy? Developmental Medicine& Child Neurology 40: 520–7.
Boyle CA, Decoufle P, Holmgreen P. (1994) Contribution ofdevelopmental disabilities to childhood mortality in the UnitedStates: a multiple-cause-of-death analysis. Pediatric andPerinatal Epidemiology 8: 411–22.
California Department of Developmental Services. (1986) ClientDevelopment Evaluation Report (CDER). Sacramento, CA:California Department of Developmental Services.
Chrichton JU, Mackinnon M, White CP. (1995) The life expectancy ofpersons with cerebral palsy. Developmental Medicine & ChildNeurology 37: 567–76.
Citygate Associates. (1998) Independent Evaluation of theDepartment of Developmental Services’ Community PlacementProgram: Final Technical Report. Sacramento, CA: CitygateAssociates.
Context Software Systems. (1995) The International Classificationof Diseases, 9th Revision, Clinical Modification, 4th Edition.New York: McGraw-Hill.
Evans PM, Evans SJW, Alberman E. (1990) Cerebral palsy: why we mustplan for survival. Archives of Diseases in Childhood 65: 1329–33.
Harris CW, Eyman RK, Mayeda T. (1982) An interrater reliabilitystudy of the Client Development Evaluation Report: Final Reportto the California Department of Developmental Services. LosAngeles: UCLA Mental Retardation Research Center, LantermanState Hospital.
Hollins S, Attard MT, von Fraunhofer N, McGuigan S, Sedgwick P.(1998) Mortality in people with learning disability: risks, causes,and death certification findings in London. DevelopmentalMedicine & Child Neurology 40: 50–6.
Hsieh C, Pavia M, Lambe M, Lan SJ, Colditz GA, Ekbom A, Adami HO,Trichopoulos D, Willett WC. (1994) Dual effect of parity on breastcancer risk. European Journal of Cancer 30: 969–73.
Hutton JL, Cooke T, Pharoah POD. (1994) Life expectancy inchildren with cerebral palsy. British Medical Journal 309: 431–5.
Jancar J, Speller CJ. (1994) Fatal intestinal obstruction in thementally handicapped. Journal of Intellectual DisabilityResearch 38: 413–22.
Kahn HA, Sempos CT. (1989) Statistical Methods in Epidemiology.Oxford: Oxford University Press.
Modan B, Ron E, Lerner-Geva L, Blumstein T, Menczer J, RabinoviciJ, Oelsner G, Freedman L, Mashiach S, Lunenfeld B. (1998)Cancer incidence in a cohort of infertile women. AmericanJournal of Epidemiology 147: 1038–42.
Plioplys AV, Kasnicka I, Lewis S, Moller D. (1998) Survival ratesamong children with severe neurologic disabilities. SouthernMedical Journal 91: 161–72.
National Health Information System (1997) 1986–1994 MultipleCause of Death Computer Tape. Washington DC: US Departmentof Health and Human Services and National Center for HealthStatistics.
Strauss DJ. (1997) Life expectancy of children with cerebral palsy.Lancet 349: 263–4.
— Shavelle RM. (1998a) Life expectancy of adults with cerebralpalsy. Developmental Medicine & Child Neurology 40: 369–75.
— — (1998b) Life expectancy of persons with chronic disabilities.Journal of Insurance Medicine 30: 96–108.
— — Anderson TW. (1998a) Life expectancy of children withcerebral palsy. Pediatric Neurology 18: 143–9.
— — Anderson TW, Baumeister AA. (1998b) Externally-causeddeaths in persons with developmental disability. AmericanJournal of Epidemiology 147: 855–62.
Widaman KF. (1984) Interrater reliability of adaptive behaviorassessments: Item and factor levels. Paper presented at the 92ndannual meeting of the American Psychological Association,August 25, 1984. Ontario, Canada.
— Stacy AW, Borthwick SA. (1985) Multitrait-multimethod ofevaluating adaptive and maladaptive behavior of mentallyretarded people. Paper presented at the 109th annual meeting,American Association on Mental Deficiency, May 29, 1985.Philadelphia, PA, USA.
Weiss HA, Troisi R, Rossing MA, Brogan D, Coates RJ, Gammon MD,Potischman N, Swanson CA, Brinton LA. (1998) Fertilityproblems and breast cancer risk in young women: a case-controlstudy in the United States. Cancer Causes and Control 9: 331–9.
Excess Mortality in Cerebral Palsy David Strauss et al. 585