Embed Size (px)
Citation preview
Causes of Haze Assessment
Dave DuBois
Desert Research Institute
Causes of Haze Assessment Goals & Objectives
Assess causes of haze for all WRAP Federal Class I Areas on a periodic basis – every five years
Encourage broad-based stakeholder participation throughout the assessment process
Enhance the utility and accessibility of the results for SIP & TIP development, Regional air quality model evaluation & interpretation, Identification of monitoring gaps, Improved methodology for setting natural haze levels, & Tracking effectiveness of emission control programs
Causes of Haze AssessmentApproach
Data analysis methods are selected to respond to a series of questions concerning the causes of haze
Will require numerous methods applied to ambient monitoring data, but not regional air quality models
As they become available, AMRF reviews draft responses to each question & posts final responses to a web site
Results are designed for computer searches, with internal links and directories for an easily navigated virtual report
#S
#S
#S
#S
#S
#S
#S
#S
#S
#S
#S
#S
#S
#S
#S
#S
#S#S#S#S
#S
#S
#S
#S #S
#S
#S
#S#S#S #S
#S
#S#S
#S
#S
#S
#S
#S#S#S
#S
#S
#S
#S
#S
#S
#S
#S
#S
#S#S
#S
#S#S
#S
#S
#S
#S
#S
#S
#S
#S
#S
#S
#S
#S#S
#S
#S
#S
#S
#S
#S
#S
#S
#S
#S
#S
#S
#S
#S
#S
#S
#S
#S
#S#S
#S
#S
#S#S
#S
#S
#S
#S
#S
#S
#S
#S
#S
#S
#S
#S
#S
#S
#S
#S
#S
#S
#S#S
#S
#S
#S
#S
#S#S
#S
#S
#S
#S
#S
#S
#S
#S
#S
#S
#S#S
#S
#S
Washington
Montana North Dakota
South Dakota
Wyoming
IdahoOregon
Nevada Utah
California
Colorado
Arizona
New Mexico
Minnesota
Iowa
Nebraska
Kansas Missouri
Oklahoma
Texas
Arkansas
Louisiana
500 0 500 Kilometers
N
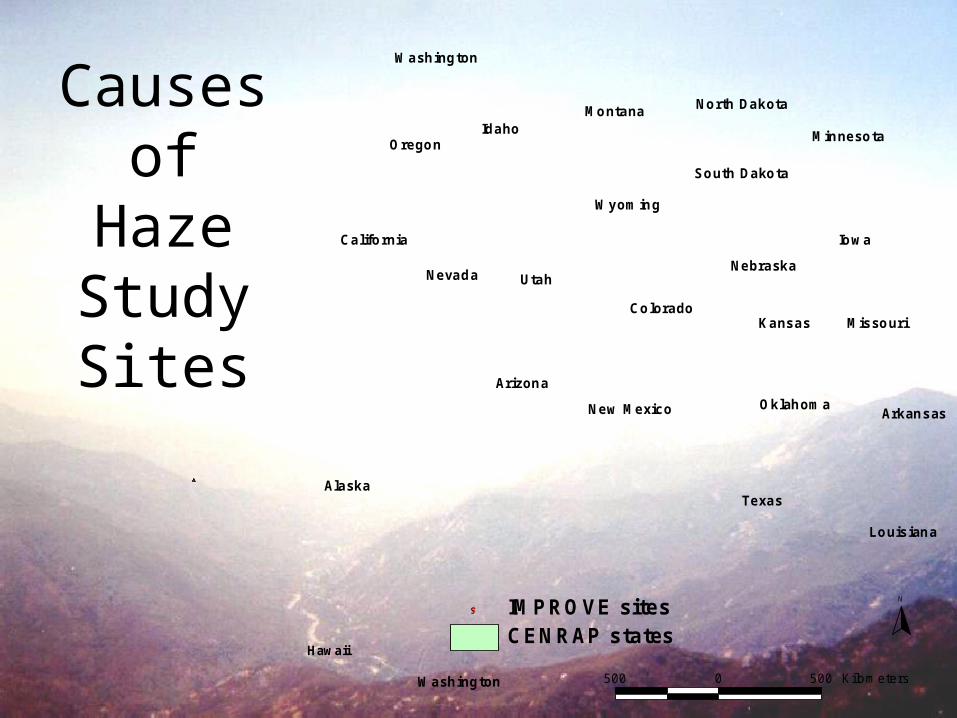
CENRAP states#S IMPROVE sites
#S
#S
#S#S
Alaska
Washington
#S
#S#S#S#S#S
Hawaii
Causes of Haze Study Sites
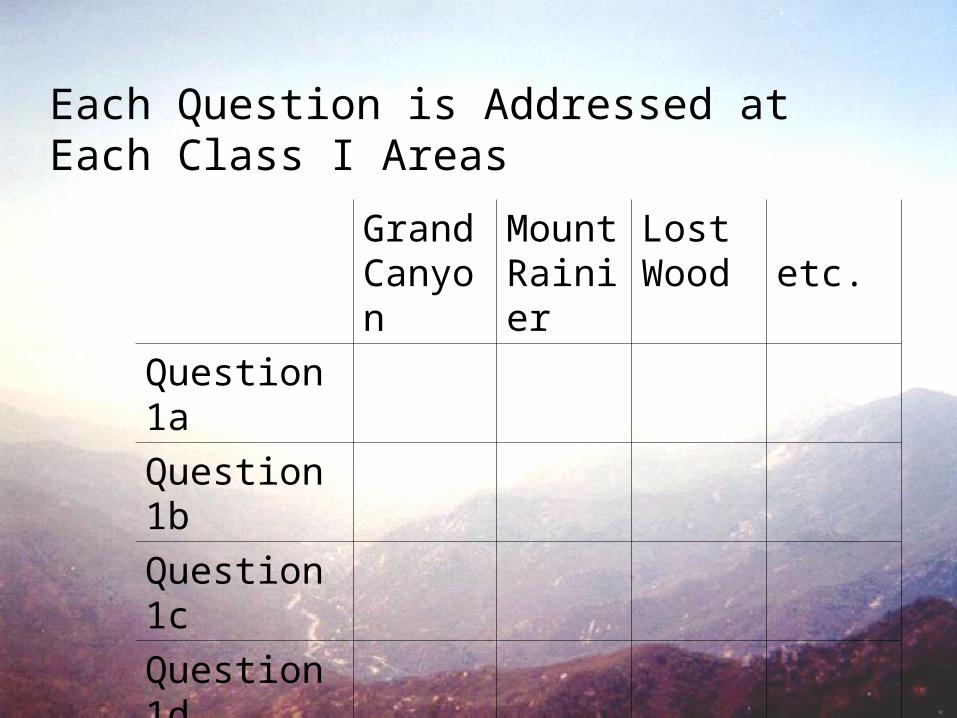
Grand Canyon
Mount Rainier
Lost Wood
etc.
Question 1a
Question 1b
Question 1c
Question 1d
Question 2a
etc.
Each Question is Addressed at Each Class I Areas
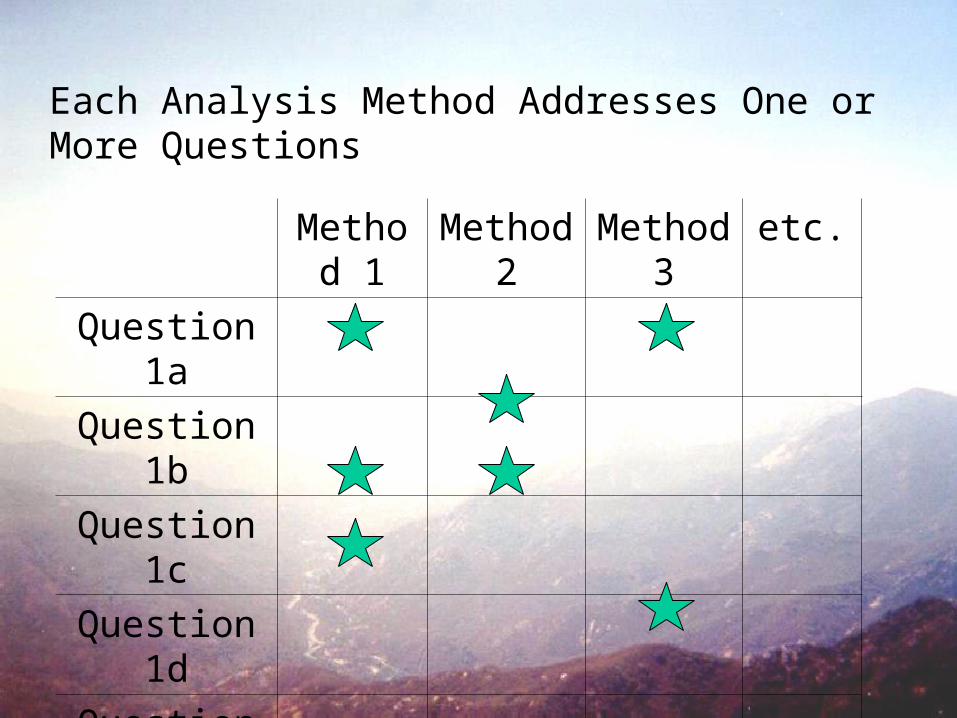
Method 1
Method 2
Method 3
etc.
Question 1a
Question 1b
Question 1c
Question 1d
Question 2a
etc.
Each Analysis Method Addresses One or More Questions
Causes of Haze AssessmentQuestions
What aerosol components are responsible for haze? What are the major components for best, worst & average
days & how do they compare? How variable are they episodically, seasonally,
interannually? What site characteristics best group sites with similar
patterns of major components? How do the relative concentration of the major components
compare with the relative emission rates nearby & regionally?
Causes of Haze AssessmentQuestions - continued
What is meteorology’s role in the causes of haze? How do meteorological conditions differ for best, worst and
typical haze conditions? What empirical relationships are their between meteorological
conditions and haziness? How well can haze conditions be predicted solely using
meteorological factors? What site characteristics best group sites with similar
relationships between meteorological conditions and haze? How well can interannual variations in haze be accounted for
by variations in meteorological conditions?
Causes of Haze AssessmentQuestions - continued
What are the emission sources responsible for haze? What geographic areas are associated with transported air that
arrives at sites on best, typical & worst haze days? Are the emission characteristics of the transport areas
consistent with the aerosol components responsible for haze? What do the aerosol characteristics on best, typical and worst
days indicate about the sources? What does the spatial & temporal pattern analysis indicate
about the locations and time periods associated with sources responsible for haze?
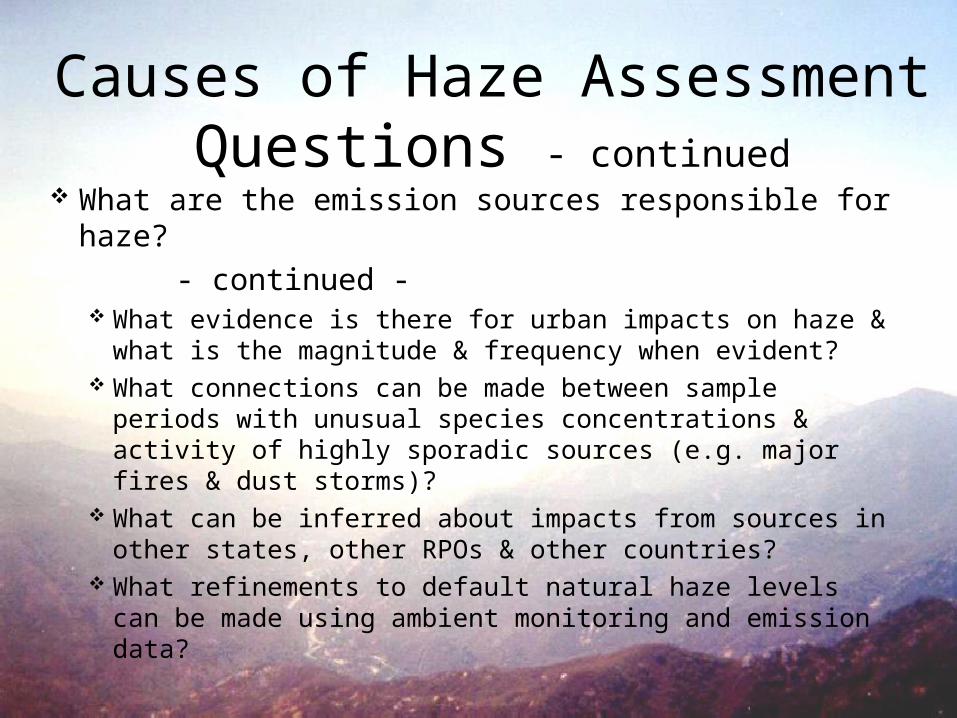
Causes of Haze AssessmentQuestions - continued
What are the emission sources responsible for haze?
- continued - What evidence is there for urban impacts on haze & what is
the magnitude & frequency when evident? What connections can be made between sample periods
with unusual species concentrations & activity of highly sporadic sources (e.g. major fires & dust storms)?
What can be inferred about impacts from sources in other states, other RPOs & other countries?
What refinements to default natural haze levels can be made using ambient monitoring and emission data?
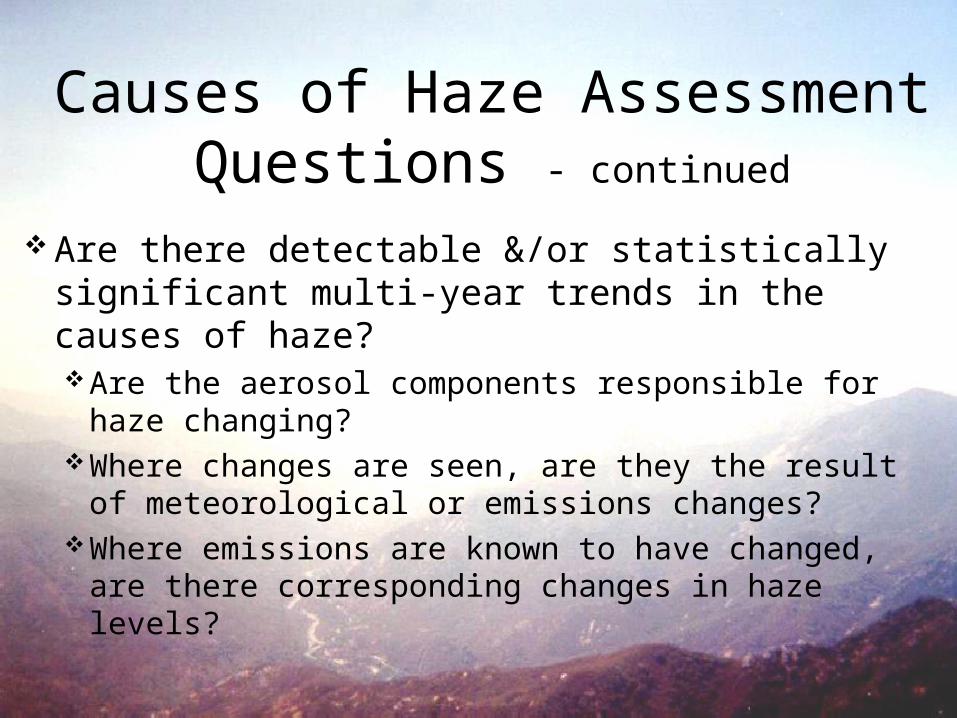
Causes of Haze AssessmentQuestions - continued
Are there detectable &/or statistically significant multi-year trends in the causes of haze?Are the aerosol components responsible for haze
changing?Where changes are seen, are they the result of
meteorological or emissions changes?Where emissions are known to have changed, are there
corresponding changes in haze levels?
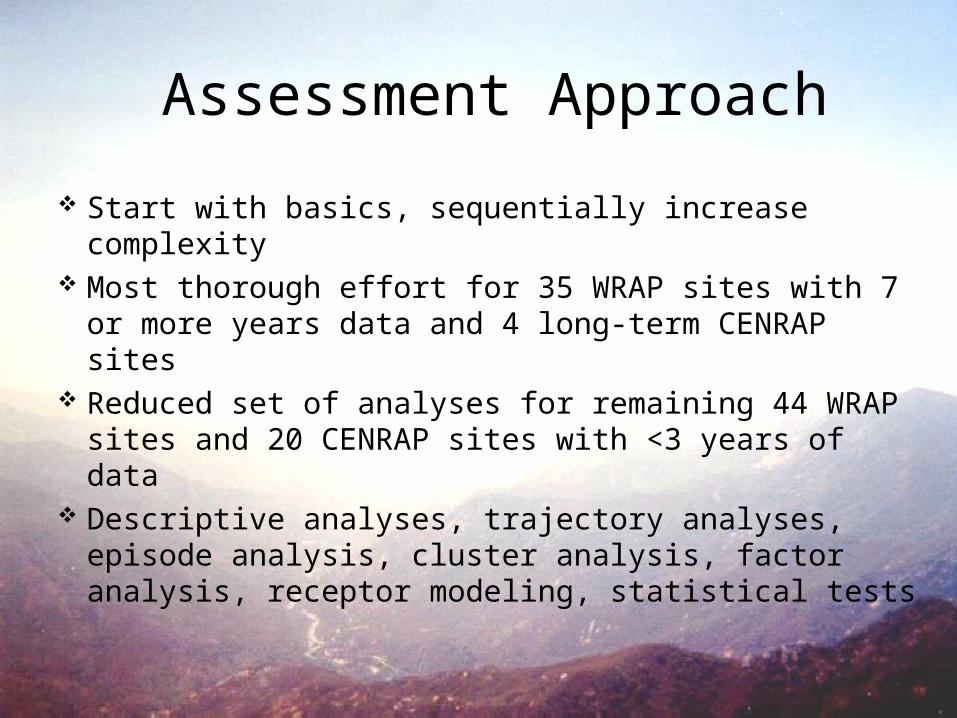
Assessment Approach
Start with basics, sequentially increase complexity Most thorough effort for 35 WRAP sites with 7 or
more years data and 4 long-term CENRAP sites Reduced set of analyses for remaining 44 WRAP sites
and 20 CENRAP sites with <3 years of data Descriptive analyses, trajectory analyses, episode
analysis, cluster analysis, factor analysis, receptor modeling, statistical tests
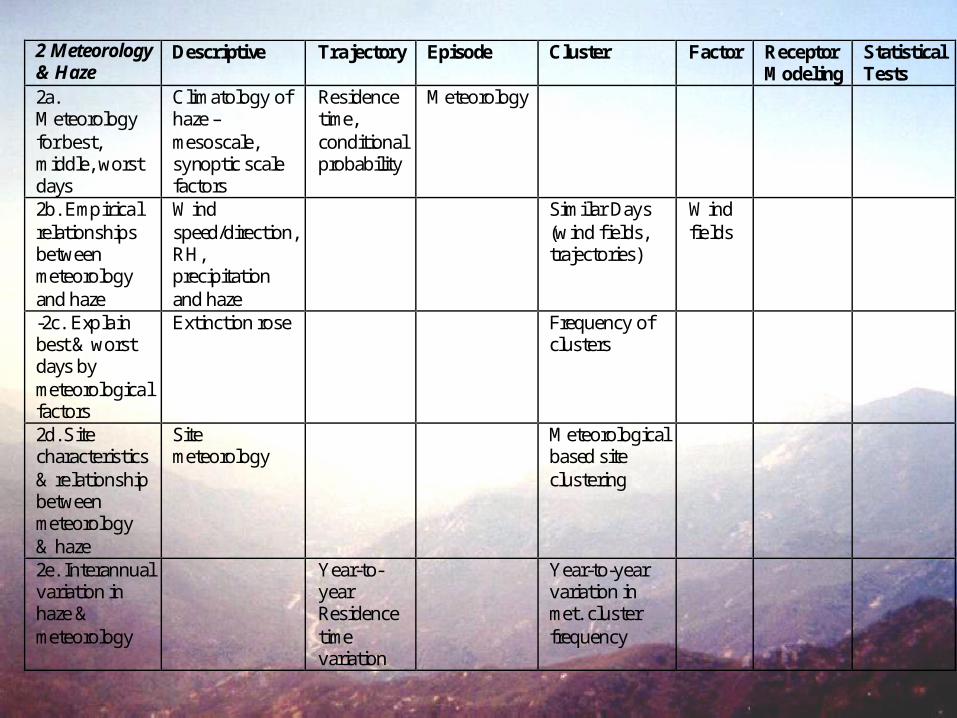
2 Meteorology & Haze
Descriptive Trajectory Episode Cluster Factor Receptor Modeling
Statistical Tests
2a. Meteorology for best, middle, worst days
Climatology of haze – mesoscale, synoptic scale factors
Residence time, conditional probability
Meteorology
2b. Empirical relationships between meteorology and haze
Wind speed/direction, RH, precipitation and haze
Similar Days (wind fields, trajectories)
Wind fields
-2c. Exp lain best & worst days by meteorological factors
Extinction rose Frequency of clusters
2d. Site characteristics & relationship between meteorology & haze
Site meteorology
Meteorological based site clustering
2e. Interannual variation in haze & meteorology
Year-to-year Residence time variation
Year-to-year variation in met. cluster frequency
Prepare emissions density maps Help in interpreting the aerosol component data; Determine relationship of sources to the Class I areas; Interpreting results of backtrajectory analysis; To examine relationships between mesoscale
meteorological transport and efforts of the sources upon Class I areas
For CENRAP, need to include emissions east of CENRAP (Midwest RPO, VISTAS)
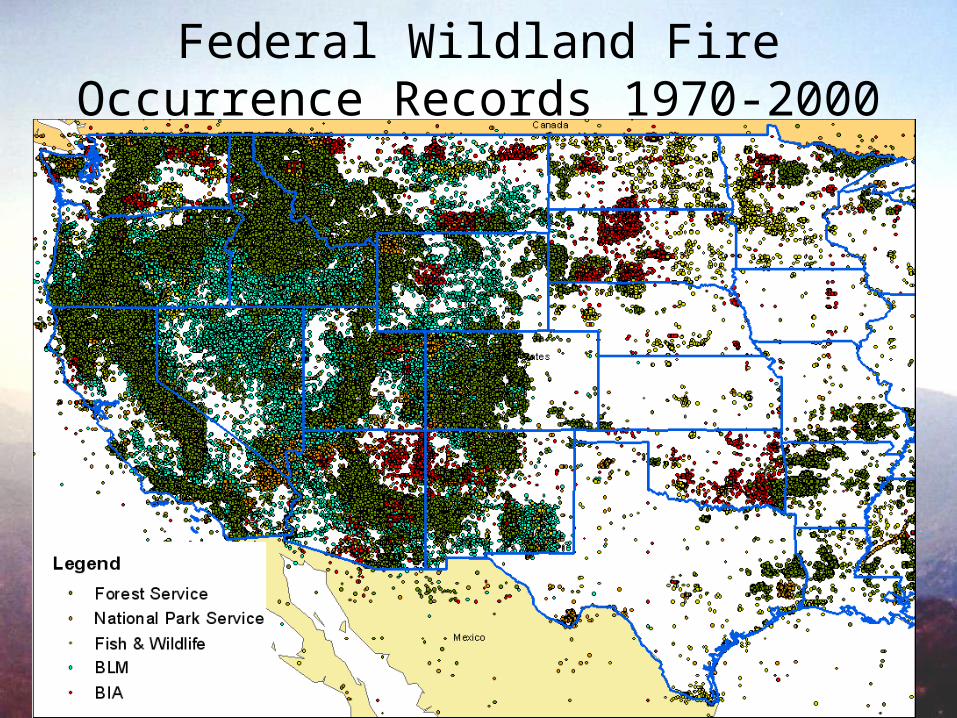
Federal Wildland Fire Occurrence Records 1970-2000
Describe monitoring sites Their representation of the Class I area and
nearby Class I areas; Relationship to terrain features, bodies of
water, etc.; Proximity to major point sources, cities, etc.
Information from the emissions compilation described above will be quite useful.
Assess meteorological setting of sites
Expected mesoscale flow patterns of interest (sea/land breeze, mountain/valley winds, convergence zones, nocturnal jets, etc.);
Orographic precipitation patterns (i.e. favored for precipitation, or in rain-shadow);
Inversion layers; Potential for transport from cities and other
significant sources/source areas.
Aerosol data analysis Descriptive statistics and interpretation for aerosol data-
individual components and reconstructed extinction Document, interpret component spatial and seasonal
patterns- Best 20%, middle 60%, worst 20% reconstructed extinction days and seasonal patterns by site
Compile, describe spatial and seasonal patterns of aerosol components frequency distributions.
Interpret aerosol component data in light of emissions sources, monitoring site settings, backtrajectories
Cluster analysis to group sites with similar patterns in aerosol component contributions to haze
Backtrajectory analysis Gather backtrajectory endpoint data Compute and map backtrajectory summary
statistics residence time by season, best 20% and worst 20% reconstructed extinction and aerosol components for all sites with 5 years or more of data.
Prepare conditional probability maps for high and low extinction and aerosol components.
Interpret maps using emissions density, location information, site setting information
Mesoscale meteorological analysis needed for many sites –backtrajectories will be misleading
Phase 1 conceptual model and virtual report
Develop preliminary conceptual models regarding the sources of haze at every Class I area in the WRAP and CENRAP regions + 14 additional sites in CENRAP;
Note uncertainties and limitations of the conceptual models;
Suggest methodologies to refine conceptual models in next phase of study
Make information available over Internet as “virtual report”
Subsequent phases Compile additional meteorological, gaseous, aerosol,
emissions, and source profile data as needed to complete remaining tasks
Episode analysis -Use combination of backtrajectory, synoptic, mesoscale meteorological analysis, aerosol and emissions data to conceptually understand regional or sub-regional episodes of high aerosol component concentrations
In-depth meteorological analysis
Mesoscale flow patterns affecting sites Cluster analysis to group days with similar patterns
and examine aerosol components for each cluster Interannual variability of meteorological patterns Diurnal variations in flow patterns, comparison
with diurnal variation in optical data.
Emissions changes and receptor modeling
Evaluation of changes in emissions since 1988 and relationship to aerosol component concentration changes
Source profile analysis- compile source profiles- note changes over time since 1988
Establish chemical abundances against which enrichment factors can be evaluated
Use carbon fractions from TOR analysis –can contributions of different carbon sources be distinguished?
Emissions changes and receptor modeling -continued
Apply Chemical Mass Balance (CMB) model Apply Positive Matrix Factorization (PMF) at sites
with sufficient periods of record of aerosol data Apply UnMix model to aerosol data for each site
with sufficient data
Trends and comprehensive assessment
Statistical significance tests to determine significance of trends in component concentrations
Interpret trends in light of trends in emissions and interannual variability of meteorological patterns- Trend due to emissions or meteorological changes?
Comprehensive assessment of causes of haze- all Class I areas + 14 additional CENRAP areas-formulation of refined conceptual models applicable to all areas
Web-based virtual report