Embed Size (px)
Citation preview

ENMAX Corporation
CAUTION TO READER
This document contains statements about future events and financial and operating results of ENMAX Corporation and its subsidiaries (ENMAX or the Corporation) that are forward looking. By their nature, forward-looking statements require the Corporation to make assumptions and are subject to inherent risks and uncertainties. There is significant risk that predictions and other forward-looking statements will not prove to be accurate. Readers are cautioned not to place undue reliance on forward-looking statements as a number of factors could cause actual future results, conditions, actions or events to differ materially from financial and operating targets, expectations, estimates or intentions expressed in the forward-looking statements.
When used in this Financial Report, the words “may,” “would,” “could,” “will,” “intend,” “plan,” “anticipate,” “believe,” “seek,” “propose,” “estimate,” “expect” and similar expressions, as they relate to the Corporation or an affiliate of the Corporation, are intended to identify forward-looking statements. Such statements reflect the Corporation’s current views with respect to future events and are subject to certain risks, uncertainties and assumptions. Many factors could cause the Corporation’s actual results, performance or achievements to vary from those described in this Financial Report. Should one or more of these risks or uncertainties materialize, or should assumptions underlying forward-looking statements prove incorrect, actual results may vary materially from those described in this Financial Report. Intended, planned, anticipated, believed, estimated or expected and other forward-looking statements included in this Financial Report herein should not be unduly relied upon. These statements speak only as of the date of this Financial Report. The Corporation does not intend, and does not assume any obligation, to update these forward-looking statements except as required by law, and reserves the right to change, at any time at its sole discretion, the practice of updating annual targets and guidance.
2016 | Q3 INTERIM REPORT ENMAX Corporation |
ENMAX | Q3 2016 Financial Report Management’s Discussion & Analysis 1

BUSINESS OVERVIEW
ENMAX is a wholly owned subsidiary of The City of Calgary (The City), headquartered in Calgary, Alberta, Canada. ENMAX’s vision is to be Canada’s leader in the electricity industry through its mission of powering the potential of people, businesses and communities by safely and responsibly providing electricity and energy services in a way that matters to them now and in the future. ENMAX has a proud history of providing Albertans with electricity for over 100 years, and continues to explore ways to improve the province’s electricity system and provides progressive solutions for its customers.
In order to support the execution of the strategy in serving its customers, its shareholder and stakeholders, ENMAX took steps to streamline its organization in January 2016. ENMAX’s core operations include the competitive generation and sale of electricity across Alberta through an operating segment named ENMAX Competitive Energy, and the regulated transmission and distribution of electricity in the City through an operating segment named ENMAX Power Delivery:
• ENMAX Competitive Energy carries out competitive energy supply and retail functions through various legal entities and affiliated companies. ENMAX Competitive Energy controls its physical electricity supply through owned generation capacity. It purchases electricity and natural gas on the wholesale market to meet the sales commitments of its retail marketing operations and for the operational requirements of its natural-gas-fuelled generating facilities. ENMAX Competitive Energy now also includes ENMAX Power Services (previously under ENMAX Power) as well as Customer Care (previously under ENMAX Corporate).
• ENMAX Power Delivery owns and operates electricity transmission and distribution assets in the Calgary service area. In addition, it has the legislated responsibility to provide electricity for customers who elect to stay with the Regulated Rate Option (RRO). The RRO is the default rate established by regulation and is automatically provided to all eligible customers who have not entered into a contract with a competitive electricity retailer. ENMAX Power Delivery’s objective is to safely maintain the high reliability of its transmission and distribution system while meeting Calgary’s infrastructure needs.
ENMAX Corporate, both directly or indirectly through its subsidiaries, provides shared services and financing to ENMAX Competitive Energy and ENMAX Power Delivery.
Certain comparative figures have been reclassified to conform to the current period’s presentation. The three and nine months ended September 30, 2016 financial results include results from the Keephills Power Purchase Arrangement (PPA) up to May 5, 2016, when ENMAX notified the Balancing Pool of the decision to terminate the PPA.
ENMAX | Q3 2016 Financial Report Management’s Discussion & Analysis 2

MARKET CONDITIONS
The business environment in the energy industry continues to be challenging as lower gas prices and low demand in 2016 continue to put downward pressure on power prices. Low demand growth is related to the general economic conditions in Alberta, which has been impacted by depressed oil prices. As power prices are influenced by gas prices, the wholesale price for power reflects the lower generation costs. The Alberta power market continues to be in a state of uncertainty. The Government of Alberta recently introduced Bill 27, the Renewable Electricity Act, which provides some detail regarding implementation of its Climate Leadership Plan; however, details regarding potential online dates of new generation and particulars of the procurement program, expected to be launched next year, are not yet certain.
Market uncertainty is further heightened by the Government of Alberta filing an application with the Court of Queen’s Bench on July 25, 2016 seeking (1) judicial review of the Balancing Pool’s decision to accept the Battle River 5 PPA termination and (2) declaratory relief regarding the validity and interpretation of certain terms within the PPAs and related regulations (Alberta Application). ENMAX is named as a respondent in the Alberta Application.
All of the PPA buyers, including ENMAX, have notified the Balancing Pool of termination of the PPAs; however, the Balancing Pool has only confirmed the termination of, and assumed offer control for, ENMAX’s Battle River 5 PPA. The Balancing Pool has not confirmed any of the other PPA terminations, including that of the Keephills PPA. In addition, on September 16, 2016, the Balancing Pool notified ENMAX that it would not be completing its investigation of the Keephills PPA until a decision has been made by the Court on the Alberta Application. This situation has created additional downward pressure on electricity market prices.
OVERALL FINANCIAL PERFORMANCE
SELECTED CONSOLIDATED FINANCIAL INFORMATION
Three Months Ended September 30
Nine Months Ended September 30
(millions of dollars) 2016 2015 2016 2015
Total Revenue 670.2 715.7 2,077.8 2,341.2
Adjusted EBITDA (1) 98.3 134.8 344.5 359.5 EBIT (1) 45.6 73.5 132.5 192.1 Comparable Net Earnings (1) 27.9 49.6 81.4 140.3 Net Earnings 27.9 49.6 30.0 140.3 (1) Non-IFRS financial measure. See discussion that follows in Non-IFRS Financial Measures section.
ENMAX’s net earnings for the three and nine months ended September 30, 2016 decreased $21.7 million and $110.3 million from the same periods in 2015, respectively. The primary drivers of net earnings results were as follows:
• ENMAX Competitive Energy – significant decrease in earnings due to a one-time Keephills PPA impairment of $51.4 million and de-recognition of tax deferred assets (partially offset by the reversal of a provision related to tax litigation) in Q2 2016. Also impacting earnings were changes in the fair value of commodity and other derivatives that unfavorably impact margin and foreign exchange expense in 2016. The decrease in earnings was partially offset by lower generation costs and lower depreciation as a result of the Battle River 5 and Keephills terminations.
ENMAX | Q3 2016 Financial Report Management’s Discussion & Analysis 3

• ENMAX Power Delivery – slight increase in earnings was due to higher interim rates for Distribution Access Service and increased use of internal staff on projects, reducing contractor expense and increasing labor recovery.
• ENMAX Corporate – slight decrease in earnings due to a non-capital IT Software as a Service (SaaS) project executed during 2016.
Additional details on the financial performance of the Corporation are discussed in the ENMAX Financial Results section.
Results of operations are not necessarily indicative of future performance due to fluctuating commodity prices, timing of receipt of regulatory decisions, the performance and retirement of existing generation facilities and the addition of new generation facilities.
ENMAX strongly believes in its legal position to turn back both its Battle River 5 PPA and its Keephills PPAs with respect to the Alberta Application. As noted above, the Balancing Pool accepted the termination of the Battle River 5 PPA, though that acceptance is the subject of the Alberta Application, and the Balancing Pool has not yet made a decision on the Keephills PPA and has indicated it will not do so until a decision has been made by the Court on the Alberta Application. ENMAX will continue to monitor and review the situation, and will take all steps necessary to defend its positon, but at this time no financial impacts have been ascribed to this legal action.
ENMAX COMPETITIVE ENERGY BUSINESS AND UPDATE
Effective January 1, 2016, ENMAX Competitive Energy terminated its Battle River 5 PPA, in accordance with the terms of the PPA with respect to a change in law that makes the PPA unprofitable or more unprofitable. As noted above, the Balancing Pool accepted the termination; however, the Balancing Pool and the Corporation differ in opinion as to the effective date of termination. Although there can be no assurance that this dispute will be resolved in the Corporation’s favor, the Corporation does not believe that the outcome of this dispute will have a material adverse effect on its financial position. Up until July 12, 2016, ENMAX had been dispatching power from the facility on behalf of the Balancing Pool. Effective July 13, 2016, the Balancing Pool took over the dispatching, settlement and control of the Battle River 5. See Note 15 of the Q3 2016 Condensed Consolidated Interim Financial Statements.
Effective May 5, 2016, ENMAX Competitive Energy terminated its Keephills PPA, in accordance with the terms of the PPA with respect to a change in law that makes the PPA unprofitable or more unprofitable. ENMAX is waiting for the Balancing Pool to confirm acceptance of the termination. As noted above, the Balancing Pool has indicated it will not do so until a decision has been made by the Court on the Alberta Application. See Note 15 of the Q3 2016 Condensed Consolidated Interim Financial Statements.
As at September 30, 2016, ENMAX Competitive Energy’s capacity ownership interest was 1,614 megawatts (MW) of electricity generation to supply customer demands (down from 2,380 MW as at January 1, 2016, reflecting the termination of the PPAs). The remaining power and natural gas required to meet ENMAX Competitive Energy’s consumer electricity and natural gas demand is acquired through the competitive wholesale power and natural gas markets. ENMAX Competitive Energy actively manages its portfolio to ensure it has contracted retail and wholesale sales for its anticipated generation capacity. During times when ENMAX Competitive Energy has excess generation capacity, it sells the energy to the market; when it requires power to meet its retail or wholesale customer needs, it purchases the energy from the market.
ENMAX | Q3 2016 Financial Report Management’s Discussion & Analysis 4

ENMAX Competitive Energy continues its focus on maintaining a high level of reliability at its power generation assets that now consist of wind and natural-gas-fuelled generation.
KEY BUSINESS STATISTICS Three Months Ended
September 30 Nine Months Ended
September 30 (millions of dollars) 2016 2015 2016 2015
Plant availability (%) (1) 98.71 98.72 91.96 91.02
Average flat pool price ($/MWh) 17.93 26.04 17.00 37.48 (1) Plant availability includes planned maintenance and forced outages. Without incorporating the Shepard heat recovery steam generator (HRSG) outage, plant availability for the
three and nine months ended September 30, 2015, was 98.72 per cent and 96.12 per cent.
Plant availability was consistent in both the three months and the nine months ended September 30, 2016 as compared with the same period in 2015.
For the three and nine months ended September 30, 2016, the average flat pool power price decreased significantly from 2015 levels. All of the Alberta PPAs have now been turned back to the Balancing Pool by the respective PPA buyers. The PPA supply is being offered at marginal cost, driving down the price in the market. In addition, the economic downturn in the Alberta economy combined with lower demand due to warmer weather and lower gas prices (which drove down generation costs), are factors leading to lower realized power prices in the Alberta power market.
ENMAX POWER DELIVERY BUSINESS AND UPDATE
ENMAX Power Delivery submits applications to the Alberta Utilities Commission (AUC) to request the approval for the need to construct or replace utility related facilities, to set rates, or to allocate costs related to the operation of providing energy-related services to Albertans.
On April 30, 2015, the AUC initiated the 2016–2017 Generic Cost of Capital proceeding. In this proceeding, the AUC determined a generic return on equity (ROE) value and deemed capital structures for regulated utilities in Alberta for the years 2016 and 2017 that will be used to determine the return ENMAX Power Delivery can recover from customers for its capital investments. On October 7, 2016, the AUC released Decision 20622-D01-2016 with respect to the 2016 Generic Cost of Capital proceeding increasing the 2017 ROE to 8.5 per cent (from 8.3 per cent in 2015 and 2016). ENMAX Power Delivery’s 2016-2017 equity ratio of 37.0 per cent was approved as a placeholder. The previously approved equity ratios for ENMAX Power Delivery’s transmission and distribution were 36.0 and 40.0 per cent, respectively. In other words, the AUC approved equity ratio increased by 100 basis points (bps) for transmission and decreased 300 bps for distribution. As a result of the decision, ENMAX Power Delivery’s earnings are expected to decrease for distribution with a partially offsetting increase for transmission. The total overall expected earnings reduction is approximately $1.0 million over the two-year period (2016 and 2017). ENMAX Power Delivery’s distribution is subject to Performance-Based Rates (PBR) such that only incremental capital expenditures to be recovered through the capital tracker mechanism are impacted by the decision, which results in less of an overall negative earnings impact. The AUC directed ENMAX Power Delivery to file a compliance filing before December 1, 2016 to determine the final distribution and transmission capital structures for 2016 and 2017.
On May 8, 2015, the AUC initiated a generic proceeding on the parameters to be considered with respect to PBR plans for Alberta distribution system utilities, including ENMAX Power Delivery, commencing 2018. A decision is expected to be issued in December 2016.
ENMAX | Q3 2016 Financial Report Management’s Discussion & Analysis 5

In September 2016, ENMAX Power Delivery filed a Capital Tracker application seeking approval for a 2015-2017 distribution capital program that will recover capital related costs (interest, depreciation and return) on distribution capital (referred to as a “K” factor) for 2015-2017. If successful, ENMAX Power Delivery would receive approval to collect approximately $50.0 million of capital-related costs over the three-year period. In a separate application, the interim rate application, ENMAX Power Delivery is seeking approval to collect 60.0 per cent of the forecast K factor amount of approximately $30.0 million commencing in 2017.
Once the AUC renders decisions on the above proceedings, the distribution rates that ENMAX Power Delivery will be able to charge customers from 2017 onward will be determined. The approved PBR rates and billing determinants (the measures of consumption used to calculate customers’ bills) will ultimately determine ENMAX Power Delivery’s distribution revenue.
By the end of 2016, ENMAX Power Delivery expects to file an application to set its transmission revenue requirements for 2016 and 2017. The transmission revenue requirement is the amount of revenue that ENMAX Power Delivery will collect from the Alberta Electric System Operator (AESO) to cover its costs, operating expenses, interest paid on debt, and a reasonable return (profit).
KEY BUSINESS STATISTICS
Three Months Ended September 30
Nine Months Ended September 30
(millions of dollars) 2016 2015 2016 2015
Distribution volumes (GWh) 2,306 2,417 6,919 7,075
System average interruption duration index (SAIDI) (1) 0.31 0.41
System average interruption frequency index (SAIFI) (2) 0.49 0.49 (1) SAIDI equals the total duration of a sustained interruption per average customer during a predefined period of time. A sustained interruption has a duration greater than or equal
to one minute. (2) SAIFI equals how often the average customer experiences a sustained interruption over a predefined period of time. A sustained interruption has a duration greater than or equal
to one minute.
Total electricity delivered in the Calgary service area in the three months ended September 30, 2016 was 2,306 gigawatt hours (GWh) as compared with 2,417 GWh during the same period in 2015. The 2016 year-to-date distribution volumes of 6,919 GWh were slightly lower, compared to 7,075 GWh in the same period in 2015. Distribution volumes for both periods decreased as a result of a relatively warmer winter and the state of the economy in Calgary.
ENMAX is one of the most reliable transmission and distribution utilities in Canada. ENMAX’s system average interruption frequency index (SAIFI) results for the nine months ended September 30, 2016 was consistent with the same period in 2015. ENMAX’s system average interruption duration index (SAIDI) improved over the same period in the prior year.
ENMAX | Q3 2016 Financial Report Management’s Discussion & Analysis 6

ENMAX FINANCIAL RESULTS
EARNINGS BEFORE INTEREST AND INCOME TAXES (EBIT) COMPARED WITH THE SAME PERIOD IN 2015 For the three months ended September 30 (millions of dollars)
ENMAX Competitive
Energy
ENMAX Power
Delivery ENMAX
Corporate Consolidated
EBIT(1) for the three months ended September 30, 2015 50.9 21.5 1.1 73.5
Increased (decreased) margins attributable to:
Electricity (13.9) 0.6 (0.1) (13.4)
Unrealized mark-to-market loss(2) (20.2) - - (20.2)
Natural gas 0.9 - (0.1) 0.8
Transmission and distribution - (1.2) - (1.2)
Contractual services and other (3.9) 1.7 0.1 (2.1)
Decreased (increased) expenses:
Operation, maintenance & administration(3) 1.9 4.8 0.5 7.2
Foreign exchange (7.8) 0.1 0.1 (7.6)
Amortization 10.1 (1.4) (0.1) 8.6
EBIT for the three months ended September 30, 2016 18.0 26.1 1.5 45.6
EARNINGS BEFORE INTEREST AND INCOME TAXES (EBIT) COMPARED WITH THE SAME PERIOD IN 2015
For the nine months ended September 30 (millions of dollars)
ENMAX Competitive
Energy
ENMAX Power
Delivery ENMAX
Corporate Consolidated
EBIT(1) for the nine months ended September 30, 2015 130.8 60.1 1.2 192.1
Increased (decreased) margins attributable to:
Electricity 3.4 0.9 0.7 5.0
Unrealized mark-to-market loss(2) (10.9) - - (10.9)
Natural gas 0.1 - (0.1) -
Transmission and distribution - 3.2 - 3.2
Contractual services and other 1.1 2.5 1.8 5.4
Decreased (increased) expenses:
Operation, maintenance & administration(3) (5.0) 8.8 0.2 4.0
Foreign exchange (21.5) 0.1 (0.3) (21.7)
Amortization 12.5 (5.3) (0.4) 6.8
Impairment (51.4) (51.4)
EBIT for the nine months ended September 30, 2016 59.1 70.3 3.1 132.5 (1) EBIT is a Non-IFRS measure see Non-IFRS Financial Measures. (2) Mark-to-market gains (unrealized) on non-hedged derivatives primarily used as economic hedges for the costs of electricity. (3) Normalized to exclude impact of intercompany transactions with no consolidated impact.
ENMAX | Q3 2016 Financial Report Management’s Discussion & Analysis 7

Electricity margins for the three months ended September 30, 2016, decreased $13.4 million or 11.6 per cent. The decrease was due to lower consumption volumes on retail contracts as a result of lower economic activity, as well as the impact of contract renewals at lower prices influenced by lower forward power pool prices. For the nine months ended September 30, 2016, electricity margins increased $5.0 million or 1.7 per cent from the same periods in 2015. The increase was due to a decrease in portfolio supply costs as a result of lower natural gas prices and the terminations of the Battle River 5 and Keephills PPAs.
Unrealized mark-to-market losses increased $20.2 million and $10.9 million for the three and nine months ended September 30, 2016 from the same periods in 2015. These unrealized mark-to-market losses relate to fair value revaluation of derivatives used as economic hedges for the costs of electricity. The unfavorable variances for both periods are primarily related to a decrease in long-term forward prices on forward gas hedge contracts entered into by the Corporation.
Natural gas margins for the three and nine months ended September 30, 2016 did not change materially from the prior year, increasing by $0.8 million or 12.1 per cent, and no change from the same periods in 2015, respectively.
For the three months ended September 30, 2016, transmission and distribution margins decreased $1.2 million or 1.7 per cent from the same period in 2015. The decrease was due to a non-recurring adjustment which increased revenue in Q3 2015. For the nine months ended September 30, 2016, transmission and distribution margins increased $3.2 million or 1.6 per cent from the same period in 2015. The increase was due to higher interim rates for Distribution Access Service and a non-recurring revenue reduction adjustment related to a regulatory decision received in Q1 2015.
For the three months ended September 30, 2016, contractual services and other revenue margins decreased $2.1 million or 10.9 per cent compared to the same period in 2015. The lower margin in the current quarter was related to a higher proportion of lower margin contracts. For the nine months ended September 30, 2016, it increased $5.4 million or 9.8 per cent compared to the same period in 2015. The year-to-date higher margin was primarily due to a one-time construction performance incentive received.
Operation, maintenance and administration (OM&A) costs for the three months ended September 30, 2016 decreased $7.2 million or 8.3 per cent from the same period in 2015. The decrease in the OM&A in the quarter was related to higher internal labour recoveries on projects (capital and billable) and reductions in contractor expense due to an increased use of internal staff on projects rather than contractors. For the nine months ended September 30, 2016, OM&A costs decreased $4.0 million or 1.5 per cent from the same period in 2015. The higher internal labor recoveries was partially offset by an increase in IT SaaS project costs incurred during the year, the costs for which cannot be capitalized under International Financial Reporting Standards (IFRS).
Foreign exchange (FX) gains and losses are primarily related to realized and unrealized FX gains and losses on derivatives used to manage the Corporation’s exposure associated with certain long-term service agreements and purchases denominated in foreign currencies. These derivatives help stabilize foreign exchange impact to capital and earnings.
Amortization expense for the three months ended September 30, 2016 was $52.7 million compared with $61.3 million in the same period in 2015 primarily due to Battle River 5 and Keephills PPAs terminations in 2016. Amortization expense for the nine months ended September 30, 2016 was $160.6 million compared with $167.4 million in the same period in 2015 due to the reduction in PPA amortization offset by Shepard becoming operational in March 2015.
ENMAX | Q3 2016 Financial Report Management’s Discussion & Analysis 8

OTHER NET EARNINGS ITEMS
Finance charges for the three months ended September 30, 2016 were slightly lower than the same period in 2015 due to lower long-term debt. Finance charges for the nine months ended September 30, 2016 were $7.3 million higher than the same period in 2015 due to a decrease in capitalized interest costs as Shepard became operational in March 2015.
Current and deferred income tax decreased $5.4 million for the three months ended September 30, 2016 compared to the same period in 2015 mainly due to lower taxable income. Current and deferred income tax increased $43.4 million for the nine months ended September 30, 2016 compared to the same period in 2015. The increase in the nine months was mainly driven by the de-recognition of deferred tax assets, partially offset by the reversal of a provision related to tax litigation.
The calculation of the Corporation’s current and deferred income taxes involves a degree of estimation and judgment. The carrying value of deferred income tax assets are reviewed at the end of each reporting period. For the three and nine months ended September 30, 2016, management adjusted the income tax provision utilizing its best estimate with considerations including management’s expectation of future operating results, interpretation of applicable tax regulations positions, allowances where uncertainty surrounding the realization of the tax benefit exists, and the settlement of the various tax disputes.
OTHER COMPREHENSIVE INCOME
Other comprehensive income (OCI) illustrates earnings under the assumption of full income recognition of gains and losses on the market value of securities and derivatives otherwise treated as hedges of future period revenues and expenses. ENMAX uses derivatives to hedge electricity, natural gas and foreign exchange exposures. For the three months ended September 30, 2016, OCI losses totalled $65.4 million compared with losses of $30.4 million in the same period in 2015. For the nine months ended September 30, 2016, OCI losses totalled $45.9 million compared with gains of $10.8 million in the same period in 2015. The increase in OCI losses for both periods primarily reflects the unfavorable fair value changes in electricity and commodity positions.
NON-IFRS FINANCIAL MEASURES
The Corporation uses adjusted earnings before impairment, interest, income taxes, depreciation and amortization (adjusted EBITDA); earnings before interest and income taxes (EBIT); and, funds from operations (FFO) as financial performance measures. These measures do not have any standard meaning prescribed by IFRS and may not be comparable to similar measures presented by other companies. The purpose of these financial measures and their reconciliation to IFRS financial measures are shown below. These non-IFRS measures are consistently applied in the previous period.
ENMAX | Q3 2016 Financial Report Management’s Discussion & Analysis 9

ADJUSTED EBITDA
Three Months Ended
September 30 Nine Months Ended
September 30
(millions of dollars) 2016 2015 2016 2015
Adjusted EBITDA (non-IFRS financial measure) 98.3 134.8 344.5 359.5 Deduct:
Depreciation and amortization 52.7 61.3 160.6 167.4
Finance charges 18.7 19.5 57.1 49.8
Income tax (recovery) expense (1.0) 4.4 45.4 2.0
Comparable Net Earnings (non-IFRS financial measure) 27.9 49.6 81.4 140.3
Impairment - - 51.4 -
Net Earnings (IFRS financial measure) 27.9 49.6 30.0 140.3
EBITDA is a useful measure of business performance as it provides an indication of the cash flow results generated by primary business activities without consideration as to how those activities are financed and amortized, or how the results are taxed in various business jurisdictions. EBITDA is also used to evaluate certain debt coverage ratios.
EBIT
Three Months Ended
September 30 Nine Months Ended
September 30
(millions of dollars) 2016 2015 2016 2015
Operating profit (IFRS financial measure) 38.6 75.8 131.0 231.4
Net movement in regulatory deferral account 7.0 (2.3) 1.5 (39.3)
EBIT (non-IFRS financial measure) 45.6 73.5 132.5 192.1 Deduct:
Finance charges 18.7 19.5 57.1 49.8
Income tax (recovery) expense (1.0) 4.4 45.4 2.0
Net Earnings (IFRS financial measure) 27.9 49.6 30.0 140.3
EBIT is a useful measure of business performance as it provides an indication of the operating results generated by primary business activities, including the cost of amortization. It does not consider how those activities are financed or how the results are taxed.
FUNDS FROM OPERATIONS
Three Months Ended
September 30 Nine Months Ended
September 30
(millions of dollars) 2016 2015 2016 2015
Cash flow from operations (IFRS financial measure) 87.5 61.7 293.8 410.2
Changes in non-cash working capital 41.8 88.0 79.4 (40.7)
Post-employment benefits (1.0) (0.7) - (0.7)
Contributions in aid of construction (16.6) (13.0) (43.8) (22.7)
Funds from operations (non-IFRS financial measure) 111.7 136.0 329.4 346.1
Funds from operations are used as an additional metric of cash flow without regard to changes in the Corporation’s non-cash working capital and adjusted for contributions in aid of construction.
ENMAX | Q3 2016 Financial Report Management’s Discussion & Analysis 10

FINANCIAL CONDITION
SIGNIFICANT CHANGES IN THE CORPORATION’S FINANCIAL CONDITION
(millions of dollars, except % change)
September 30, 2016
December 31, 2015 $ Change % Change Explanation for Change
ASSETS Cash and cash equivalents 128.0 143.7 (15.7) (11%) Primarily due to cash used in
purchase of property, plant and equipment, repayment of long-term debt and dividend payment which more than offset the cash flow from operating activities.
Accounts receivable 475.5 504.7 (29.2) (6%) Decrease due to timing of receipts, decreased electricity sales on commercial fixed-price contracts and lower natural gas sales volumes.
Property, plant and equipment (PPE) 4,012.6 3,960.9 51.7 1% General capital additions partially offset by amortization.
LIABILITIES AND SHAREHOLDER’S EQUITY
Accounts payable 330.1 367.6 (37.5) (10%) Mainly attributable to lower gas volumes and lower capital accruals.
Dividend payable 11.8 - 11.8 100% Dividend declared in March 2016 to be paid in equal quarterly instalments during 2016.
Financial (assets) liabilities (1) 99.0 39.6 59.4 150% Change in fair value of hedged and non-hedged derivatives.
(1) Net current and long-term financial asset and liability positions.
ENMAX | Q3 2016 Financial Report Management’s Discussion & Analysis 11

CONDENSED CONSOLIDATED INTERIM FINANCIAL STATEMENTS
Contents CONDENSED CONSOLIDATED INTERIM STATEMENTS OF FINANCIAL POSITION ...................................13 CONDENSED CONSOLIDATED INTERIM STATEMENTS OF EARNINGS ...................................................14 CONDENSED CONSOLIDATED INTERIM STATEMENTS OF COMPREHENSIVE INCOME ..........................15 CONDENSED CONSOLIDATED INTERIM STATEMENTS OF CHANGES IN SHAREHOLDER’S EQUITY .........16 CONDENSED CONSOLIDATED INTERIM STATEMENTS OF CASH FLOWS ...............................................17 NOTES TO THE CONDENSED CONSOLIDATED INTERIM FINANCIAL STATEMENTS ................................18
1. DESCRIPTION OF THE BUSINESS .............................................................................................18
2. BASIS OF PRESENTATION .......................................................................................................18
3. SEGMENT INFORMATION.......................................................................................................18
4. FINANCIAL INSTRUMENTS, HEDGES AND RISK MANAGEMENT ..............................................22
5. REGULATORY DEFERRAL BALANCES .......................................................................................23
6. OTHER ASSETS AND LIABILITIES .............................................................................................25
7. ASSET RETIREMENT OBLIGATIONS AND OTHER PROVISIONS .................................................25
8. POWER PURCHASE ARRANGEMENTS (PPA) IMPAIRMENT .....................................................26
9. INCOME TAXES ......................................................................................................................26
10. ACCUMULATED OTHER COMPREHENSIVE LOSS .....................................................................26
11. OTHER REVENUE AND EXPENSES ...........................................................................................26
12. DIVIDEND...............................................................................................................................27
13. CHANGE IN NON-CASH WORKING CAPITAL ............................................................................27
14. RELATED-PARTY TRANSACTIONS............................................................................................27
15. COMMITMENTS AND CONTINGENCIES ..................................................................................28
16. COMPARATIVE FIGURES .........................................................................................................29
ENMAX | Q3 2016 Financial Report Condensed Consolidated Interim Financial Statements 12
CONDENSED CONSOLIDATED INTERIM STATEMENTS OF FINANCIAL POSITION
As at (unaudited) (millions of Canadian dollars)
September 30, 2016
December 31, 2015
ASSETS
Cash and cash equivalents $ 128.0 $ 143.7 Accounts receivable 475.5 504.7 Income taxes receivable 129.6 118.8 Current portion of financial assets (Note 4) 49.9 34.6 Other current assets (Note 6) 89.0 44.2 872.0 846.0 Property, plant and equipment (Note 7) 4,012.6 3,960.9 Power purchase arrangements (Note 8) - 55.1 Intangible assets 154.5 145.8 Deferred income tax assets (Note 9) 65.7 93.9 Financial assets (Note 4) 60.4 40.7 Other long-term assets (Note 6) 27.8 21.2 TOTAL ASSETS 5,193.0 5,163.6 REGULATORY DEFERRAL ACCOUNT DEBIT BALANCES (Note 5)
28.8
34.5
TOTAL ASSETS AND REGULATORY DEFERRAL ACCOUNT DEBIT BALANCES $ 5,221.8 $ 5,198.1 LIABILITIES Short-term debt $ 10.0 $ - Accounts payable and accrued liabilities 330.1 367.6 Dividend payable (Note 12) 11.8 - Current portion of long-term debt (Note 4) 67.7 66.2 Current portion of financial liabilities (Note 4) 88.0 61.8 Current portion of deferred revenue 8.2 7.7 Current portion of asset retirement obligations and other provisions 1.8 2.7 Other current liabilities (Note 6) 36.1 39.7 553.7 545.7 Long-term debt (Note 4) 1,605.0 1,646.6 Deferred income tax liabilities (Note 9) 92.8 83.1 Post-employment benefits 40.8 39.9 Financial liabilities (Note 4) 121.3 53.1 Deferred revenue 428.3 395.3 Other long-term liabilities (Note 6) 15.2 16.8 Asset retirement obligations and other provisions (Note 7) 122.1 104.9 TOTAL LIABILITIES 2,979.2 2,885.4 REGULATORY DEFERRAL ACCOUNT CREDIT BALANCES (Note 5)
6.3
13.5
SHAREHOLDER'S EQUITY Share capital 280.1 280.1 Retained earnings 2,025.9 2,042.9 Accumulated other comprehensive loss (Note 10) (69.7) (23.8) 2,236.3 2,299.2 TOTAL LIABILITIES, REGULATORY DEFERRAL ACCOUNT CREDIT BALANCES AND SHAREHOLDER'S EQUITY $ 5,221.8 $ 5,198.1
Commitments and contingencies (Note 15) See accompanying Notes to Condensed Consolidated Interim Financial Statements.
ENMAX | Q3 2016 Financial Report Condensed Consolidated Interim Financial Statements 13

CONDENSED CONSOLIDATED INTERIM STATEMENTS OF EARNINGS
Three Months Ended September 30
Nine Months Ended September 30
(unaudited) (millions of Canadian dollars)
2016
2015
2016
2015
REVENUE (Note 3) Electricity $ 420.8 $ 465.9 $ 1,248.3 $ 1,480.5 Natural gas 52.1 49.3 237.5 258.3 Transmission and distribution 139.2 131.6 416.0 420.5 Local access fees 22.8 32.5 67.5 86.5 Other revenue (Note 11) 35.3 36.4 108.5 95.4 TOTAL REVENUE 670.2 715.7 2,077.8 2,341.2 OPERATING EXPENSES (Note 3) Electricity and fuel purchases 337.0 348.7 942.3 1,168.2 Natural gas and delivery 44.7 42.7 204.9 225.7 Transmission and distribution 78.0 59.2 208.5 179.2 Local access fees and grid charges 22.8 32.5 67.5 86.5 Depreciation and amortization 52.7 61.3 160.6 167.4 Impairment (Note 8) - - 51.4 - Other expenses (Note 11) 96.4 95.5 311.6 282.8 TOTAL OPERATING EXPENSES 631.6 639.9 1,946.8 2,109.8 OPERATING PROFIT 38.6 75.8 131.0 231.4 Finance charges 18.7 19.5 57.1 49.8 NET EARNINGS BEFORE TAX 19.9 56.3 73.9 181.6 Current income tax recovery (Note 9) (5.7) (11.9) (16.2) (13.8) Deferred income tax expense (Note 9) 4.7 16.3 61.6 15.8 NET EARNINGS—BEFORE NET MOVEMENT IN REGULATORY DEFERRAL ACCOUNT BALANCES
20.9 51.9 28.5 179.6
NET MOVEMENT IN REGULATORY DEFERRAL ACCOUNT BALANCES (Notes 3 and 5)
7.0 (2.3) 1.5 (39.3)
NET EARNINGS $ 27.9 $ 49.6 $ 30.0 $ 140.3
See accompanying Notes to the Condensed Consolidated Interim Financial Statements.
ENMAX | Q3 2016 Financial Report Condensed Consolidated Interim Financial Statements 14

CONDENSED CONSOLIDATED INTERIM STATEMENTS OF COMPREHENSIVE INCOME
Three Months Ended
September 30 Nine Months Ended
September 30 (unaudited) (millions of Canadian dollars)
2016
2015
2016
2015
NET EARNINGS $ 27.9 $ 49.6 $ 30.0 $ 140.3 OTHER COMPREHENSIVE INCOME (LOSS), NET OF INCOME TAX Items that will be reclassified subsequently to statement of earnings Cash flow hedges:
Unrealized (losses) gains on derivatives instruments (1) (78.0) (26.4) (75.8) 0.2 Reclassification of losses (gains) on derivatives instruments to net earnings in the period (2) 12.6 (4.0) 29.9 10.6
Other comprehensive income (loss), net of income tax (65.4) (30.4) (45.9) 10.8 TOTAL COMPREHENSIVE INCOME (LOSS) $ (37.5) $ 19.2 $ (15.9) $ 151.1
(1) Net deferred income tax recovery of $28.4 million and $26.4 million for the three and nine months ended September 30, 2016, respectively (2015—$8.2 million tax recovery and $2.2 million tax expense).
(2) Net deferred income tax recovery of $4.4 million and $8.0 million for the three and nine months ended September 30, 2016, respectively (2015—$1.6 million tax expense and $0.7 million tax recovery).
See accompanying Notes to the Condensed Consolidated Interim Financial Statements.
ENMAX | Q3 2016 Financial Report Condensed Consolidated Interim Financial Statements 15

CONDENSED CONSOLIDATED INTERIM STATEMENTS OF CHANGES IN SHAREHOLDER’S EQUITY
(unaudited) (millions of Canadian dollars) Share Capital Retained Earnings
Accumulated Other
Comprehensive Income (Loss)
Total As at January 1, 2016 $ 280.1 $ 2,042.9 $ (23.8) $ 2,299.2
Net earnings - 34.5 - 34.5
Other comprehensive (loss), net of income tax - - (13.5) (13.5)
Total comprehensive income - 34.5 (13.5) 21.0
Dividends (Note 12) - (47.0) - (47.0)
As at March 31, 2016 280.1 2,030.4 (37.3) 2,273.2
Net (loss) - (32.4) - (32.4)
Other comprehensive income, net of income tax - - 33.0 33.0
Total comprehensive income - (32.4) 33.0 0.6
As at June 30, 2016 $ 280.1 $ 1,998.0 $ (4.3) $ 2,273.8
Net earnings - 27.9 - 27.9
Other comprehensive (loss), net of income tax - - (65.4) (65.4)
Total comprehensive loss - 27.9 (65.4) (37.5)
As at September 30, 2016 $ 280.1 $ 2,025.9 $ (69.7) $ 2,236.3
As at January 1, 2015 $ 280.1 $ 2,050.2 $ (49.2) $ 2,281.1
Net earnings - 70.4 - 70.4
Other comprehensive income, net of income tax - - 11.7 11.7
Total comprehensive income - 70.4 11.7 82.1
Dividends (Note 12) - (56.0) - (56.0)
As at March 31, 2015 $ 280.1 $ 2,064.6 $ (37.5) $ 2,307.2
Net earnings - 20.3 - 20.3
Other comprehensive income, net of income tax - - 29.5 29.5
Total comprehensive income - 20.3 29.5 49.8
As at June 30, 2015 $ 280.1 $ 2,084.9 $ (8.0) $ 2,357.0
Net earnings - 49.6 - 49.6
Other comprehensive (loss), net of income tax - - (30.4) (30.4)
Total comprehensive income - 49.6 (30.4) 19.2
As at September 30, 2015 $ 280.1 $ 2,134.5 $ (38.4) $ 2,376.2
See accompanying Notes to the Condensed Consolidated Interim Financial Statements.
ENMAX | Q3 2016 Financial Report Condensed Consolidated Interim Financial Statements 16

CONDENSED CONSOLIDATED INTERIM STATEMENTS OF CASH FLOWS
Three Months Ended
September 30 Nine Months Ended
September 30 (unaudited) (millions of Canadian dollars)
2016
2015 2016 2015
CASH PROVIDED BY (USED IN): OPERATING ACTIVITIES
Net earnings $ 27.9 $ 49.6 $ 30.0 $ 140.3
Contributions in aid of construction 16.6 13.0 43.8 22.7
Amortization of customer contributions (3.5) (2.6) (10.3) (9.2)
Depreciation and amortization 52.7 61.3 160.6 167.4
Impairment (Note 8) - - 51.4 -
Finance charges 18.7 19.5 57.1 49.8
Income tax expense (recovery) (Note 9) (1.0) 4.4 45.4 2.0
Change in unrealized market value of financial contracts 16.9 3.8 (4.8) (4.2)
Post-employment benefits 1.0 0.7 - 0.7
Change in non-cash working capital (Note 13) (41.8) (88.0) (79.4) 40.7
Cash flow from operations 87.5 61.7 293.8 410.2
Interest paid (1) (1.5) (1.6) (37.7) (28.1)
Income taxes received (paid) - 2.9 - (1.9)
Net cash flow from operating activities 86.0 63.0 256.1 380.2
INVESTING ACTIVITIES
Purchase of property, plant and equipment and intangibles (1) (80.8) (81.5) (206.1) (252.5)
Cash flow (used in) investing activities (80.8) (81.5) (206.1) (252.5)
FINANCING ACTIVITIES
Repayment of short-term debt (40.0) - (70.0) (247.2)
Proceeds of short-term debt 50.0 - 80.0 219.9
Proceeds of long-term debt - - - 189.2
Repayment of long-term debt (7.7) (7.8) (40.5) (59.3)
Dividend paid (11.7) (14.0) (35.2) (42.0)
Cash flow (used in) from financing activities (9.4) (21.8) (65.7) 60.6
(Decrease) increase in cash and cash equivalents (4.2) (40.3) (15.7) 188.3
Cash and cash equivalents, beginning of period 132.2 245.3 143.7 16.7
CASH AND CASH EQUIVALENTS, END OF PERIOD $ 128.0 $ 205.0 $ 128.0 $ 205.0
Cash and cash equivalents consist of:
Cash 37.2 68.3 37.2 68.3 Short-term investments 90.8 136.7 90.8 136.7
(1) Total interest paid for the three and nine months ended September 30, 2016 were $2.7 million and $40.8 million, respectively (2015–$3.1 million and $40.9 million). Purchase of property, plant and equipment and intangibles includes $1.2 million and $3.1 million of capitalized borrowing costs for the three and nine months ended September 30, 2016 respectively (2015–$1.5 million and $12.8 million).
See accompanying Notes to Condensed Consolidated Interim Financial Statements.
ENMAX | Q3 2016 Financial Report Condensed Consolidated Interim Financial Statements 17

NOTES TO THE CONDENSED CONSOLIDATED INTERIM FINANCIAL STATEMENTS (UNAUDITED)
1. DESCRIPTION OF THE BUSINESS
ENMAX Corporation (ENMAX or the Corporation), a wholly owned subsidiary of The City of Calgary (The City), was incorporated under the Business Corporations Act (Alberta) in July 1997 to carry on the electric utility transmission and distribution operations previously carried on by the Calgary Electric System (CES), a former department of The City. Operations of the Corporation began on January 1, 1998, with the transfer of substantially all of the assets and liabilities of the CES by The City into the Corporation at net book value for consideration of one common share issued to The City. Since 1998, the Corporation has grown from its transmission and distribution wires roots to include electricity generation, commercial and residential solar and electricity and natural gas retail businesses.
The Corporation’s registered and head office is at 141 - 50 Ave SE, Calgary, AB, T2G 4S7. The Corporation’s principal place of business is Alberta.
2. BASIS OF PRESENTATION
These condensed consolidated interim financial statements (the “financial statements”) have been prepared by management in accordance with International Accounting Standards (IAS) 34, Interim Financial Reporting. These financial statements have been prepared following the same accounting policies and methods as those used in preparing the most recent consolidated financial statements for the year ended December 31, 2015, and have been prepared under the historical cost basis, except for the revaluation of financial derivative instruments to fair value and to reflect asset impairment (if any). The financial statements do not include all disclosures required for the preparation of the annual consolidated financial statements. Accordingly, the financial statements should be read in conjunction with the 2015 annual consolidated financial statements prepared in accordance with International Financial Reporting Standards (IFRS), which are available on ENMAX’s website at www.enmax.com.
These financial statements were authorized for issuance by the Board of Directors on November 24, 2016.
3. SEGMENT INFORMATION
Effective January 1, 2016, the Corporation has reorganized its structure to enhance its competitiveness and execution of its strategy. ENMAX’s core operations include the competitive generation and sale of electricity and natural gas across Alberta through ENMAX Competitive Energy, and the regulated transmission and distribution of electricity in the City through ENMAX Power Delivery.
The Corporation uses a shared service allocation model to allocate cost between segments.
ENMAX COMPETITIVE ENERGY
ENMAX Competitive Energy is an operating segment established to carry out competitive energy supply and retail functions through various legal entities and affiliated companies. ENMAX Competitive Energy also includes ENMAX Power Services as well as Customer Care.
ENMAX | Q3 2016 Financial Report Condensed Consolidated Interim Financial Statements 18

ENMAX POWER DELIVERY
ENMAX Power Delivery is a regulated operating segment established to carry out electricity transmission and distribution service functions and the Regulated Rate Option (RRO) retail function through various legal entities and affiliated companies.
SEGMENTED TOTAL ASSETS AND REGULATORY DEFERRAL ACCOUNT BALANCES
As at (millions of dollars)
September 30, 2016
December 31, 2015
ENMAX Competitive Energy 2,853.4 2,905.0
ENMAX Power Delivery 2,179.8 2,103.0 Corporate and Intersegment Eliminations 159.8 155.6
Total Assets 5,193.0 5,163.6 Regulatory Deferral Account Debit Balances 28.8 34.5
Total Assets and Regulatory Deferral Account Debit Balances 5,221.8 5,198.1 Three months ended September 30, 2016 (millions of dollars) ENMAX
Competitive Energy
ENMAX Power
Delivery
Corporate and Intersegment Eliminations
Adjusted Consolidated
Totals
Movement in Regulatory Deferral
Account Consolidated
Totals
REVENUE
Electricity 496.8 18.3 (94.3) 420.8 - 420.8 Natural gas 52.2 - (0.1) 52.1 - 52.1 Transmission and distribution - 141.4 - 141.4 (2.2) 139.2 Local access fees - 22.8 - 22.8 - 22.8 Other revenue 36.0 8.1 (4.5) 39.6 (4.3) 35.3 TOTAL REVENUE 585.0 190.6 (98.9) 676.7 (6.5) 670.2 OPERATING EXPENSES Electricity and fuel purchases 418.1 12.9 (93.9) 337.1 (0.1) 337.0 Natural gas and delivery 44.7 - - 44.7 - 44.7 Transmission and distribution - 73.3 - 73.3 4.7 78.0 Local access fees and grid charges - 22.8 - 22.8 - 22.8 Depreciation and amortization 28.3 22.1 2.3 52.7 - 52.7 Impairment - - - - - - Other expenses 75.9 33.4 (8.8) 100.5 (4.1) 96.4 TOTAL OPERATING EXPENSES 567.0 164.5 (100.4) 631.1 0.5 631.6 OPERATING PROFIT 18.0 26.1 1.5 45.6 (7.0) 38.6 Finance charges 18.7 - 18.7 NET EARNINGS BEFORE TAX 26.9 (7.0) 19.9 Current income tax recovery (5.7) - (5.7) Deferred income tax expense 4.7 - 4.7 NET EARNINGS BEFORE NET MOVEMENT IN REGULATORY DEFERRAL BALANCES
27.9 (7.0) 20.9 NET MOVEMENT IN REGULATORY DEFERRAL ACCOUNT BALANCES - 7.0 7.0 NET EARNINGS 27.9 - 27.9
ENMAX | Q3 2016 Financial Report Condensed Consolidated Interim Financial Statements 19

Three months ended September 30, 2015 (millions of dollars)
ENMAX Competitive
Energy
ENMAX Power
Delivery
Corporate and Intersegment Eliminations
Adjusted Consolidated
Totals
Movement in Regulatory Deferral
Account Consolidated
Totals
REVENUE Electricity 526.2 28.4 (88.8) 465.8 0.1 465.9
Natural gas 49.3 - - 49.3 - 49.3 Transmission and distribution - 124.9 - 124.9 6.7 131.6 Local access fees - 32.5 - 32.5 - 32.5 Other revenue 38.6 7.0 (4.9) 40.7 (4.3) 36.4 TOTAL REVENUE 614.1 192.8 (93.7) 713.2 2.5 715.7 OPERATING EXPENSES Electricity and fuel purchases 413.4 23.6 (88.5) 348.5 0.2 348.7 Natural gas and delivery 42.7 - - 42.7 - 42.7 Transmission and distribution - 55.6 - 55.6 3.6 59.2 Local access fees and grid charges - 32.5 - 32.5 - 32.5 Depreciation and amortization 38.4 20.7 2.2 61.3 - 61.3 Other expenses 68.7 38.9 (8.5) 99.1 (3.6) 95.5 TOTAL OPERATING EXPENSES 563.2 171.3 (94.8) 639.7 0.2 639.9 OPERATING PROFIT 50.9 21.5 1.1 73.5 2.3 75.8 Finance charges 19.5 - 19.5 NET EARNINGS BEFORE TAX 54.0 2.3 56.3 Current income tax recovery (11.9) - (11.9) Deferred income tax expense 16.3 - 16.3 NET EARNINGS BEFORE NET MOVEMENT IN REGULATORY DEFERRAL BALANCES 49.6 2.3 51.9 NET MOVEMENT IN REGULATORY DEFERRAL ACCOUNT BALANCES
- (2.3) (2.3) NET EARNINGS 49.6 - 49.6 Nine months ended September 30, 2016 (millions of dollars)
ENMAX Competitive
Energy
ENMAX Power
Delivery
Corporate and Intersegment Eliminations
Adjusted Consolidated
Totals
Movement in Regulatory Deferral
Account Consolidated
Totals
REVENUE
Electricity 1,472.8 53.6 (278.1) 1,248.3 - 1,248.3 Natural gas 238.1 - (0.6) 237.5 - 237.5 Transmission and distribution - 417.7 - 417.7 (1.7) 416.0 Local access fees - 67.5 - 67.5 - 67.5 Other revenue 115.6 22.0 (13.9) 123.7 (15.2) 108.5 TOTAL REVENUE 1,826.5 560.8 (292.6) 2,094.7 (16.9) 2,077.8 OPERATING EXPENSES Electricity and fuel purchases 1,182.9 36.9 (277.4) 942.4 (0.1) 942.3 Natural gas and delivery 204.9 - - 204.9 - 204.9 Transmission and distribution - 214.2 - 214.2 (5.7) 208.5 Local access fees and grid charges - 67.5 - 67.5 - 67.5 Depreciation and amortization 88.4 65.1 7.1 160.6 - 160.6 Impairment 51.4 - - 51.4 - 51.4 Other expenses 239.8 106.8 (25.4) 321.2 (9.6) 311.6 TOTAL OPERATING EXPENSES 1,767.4 490.5 (295.7) 1,962.2 (15.4) 1,946.8 OPERATING PROFIT 59.1 70.3 3.1 132.5 (1.5) 131.0 Finance charges 57.1 - 57.1 NET EARNINGS BEFORE TAX 75.4 (1.5) 73.9 Current income tax recovery (16.2) - (16.2) Deferred income tax expense 61.6 - 61.6 NET EARNINGS BEFORE NET MOVEMENT IN REGULATORY DEFERRAL BALANCES
30.0 (1.5) 28.5 NET MOVEMENT IN REGULATORY DEFERRAL ACCOUNT BALANCES - 1.5 1.5 NET EARNINGS 30.0 - 30.0
ENMAX | Q3 2016 Financial Report Condensed Consolidated Interim Financial Statements 20

Nine months ended September 30, 2015 (millions of dollars) ENMAX
Competitive Energy
ENMAX Power
Delivery
Corporate and Intersegment Eliminations
Adjusted Consolidated
Totals
Movement in Regulatory Deferral
Account Consolidated
Totals
REVENUE Electricity 1,655.3 75.9 (251.4) 1,479.8 0.7 1,480.5 Natural gas 258.8 - (0.5) 258.3 - 258.3 Transmission and distribution - 374.4 - 374.4 46.1 420.5 Local access fees - 86.5 - 86.5 - 86.5 Other revenue 110.0 21.4 (15.8) 115.6 (20.2) 95.4 TOTAL REVENUE 2,024.1 558.2 (267.7) 2,314.6 26.6 2,341.2 OPERATING EXPENSES Electricity and fuel purchases 1,357.9 60.1 (250.0) 1,168.0 0.2 1,168.2 Natural gas and delivery 225.7 - - 225.7 - 225.7 Transmission and distribution - 174.1 - 174.1 5.1 179.2 Local access fees and grid charges - 86.5 - 86.5 - 86.5 Depreciation and amortization 100.9 59.8 6.7 167.4 - 167.4 Other expenses 208.8 117.6 (25.6) 300.8 (18.0) 282.8 TOTAL OPERATING EXPENSES 1,893.3 498.1 (268.9) 2,122.5 (12.7) 2,109.8 OPERATING PROFIT 130.8 60.1 1.2 192.1 39.3 231.4 Finance charges 49.8 - 49.8 NET EARNINGS BEFORE TAX 142.3 39.3 181.6 Current income tax recovery (13.8) - (13.8) Deferred income tax expense 15.8 - 15.8 NET EARNINGS BEFORE NET MOVEMENT IN REGULATORY DEFERRAL BALANCES 140.3 39.3 179.6 NET MOVEMENT IN REGULATORY DEFERRAL ACCOUNT BALANCES
- (39.3) (39.3) NET EARNINGS 140.3 - 140.3 COMPARATIVE SEGMENT INFORMATION
Organization structure changes
Segment information has been retroactively reclassified to reflect the changes in the organization structure effective January 1, 2016. These changes had no impact on reported consolidated net earnings.
Net movement in regulatory deferral account
IFRS 14 Regulatory Deferral Accounts requires the separation of the net movement in the regulatory deferral account in the statement of earnings onto its own line. For the three and nine months ended September 30, 2015, net movement in regulatory deferral account has been reclassified to conform to the accounting policy in the 2015 annual consolidated financial statements, the Corporation’s first IFRS financial statements. For the three months ended September 30, 2015, the reclassification adjustments resulted in an increase in transmission and distribution revenue of $33.1, a decrease in other revenue of $8.6 million, an increase in electricity costs of $0.2 million, and a decrease in other expenses of $8.5 million, offset by a change in net movement in regulatory deferral account of $32.8 million. For the nine months ended September 30, 2015, the reclassification adjustments resulted in an increase in electricity revenue of $0.1 million, an increase in transmission and distribution revenue of $130.5, a decrease in other revenue of $0.5 million, an increase in electricity costs of $0.2 million, and an increase in other expenses of $0.7 million, offset by a change in net movement in regulatory deferral account of $129.2 million. These reclassification changes had no impact on reported consolidated net earnings.
ENMAX | Q3 2016 Financial Report Condensed Consolidated Interim Financial Statements 21

4. FINANCIAL INSTRUMENTS, HEDGES AND RISK MANAGEMENT
The Corporation manages its exposure to market risk (interest rate risk, foreign currency exchange risk, commodity price risk and equity price risk) on a portfolio basis. This includes managing its positions arising from its interests in generation facilities, liability positions arising from its commitments to its customers and transacting positions arising from its hedging activities.
VALUATION OF DERIVATIVE ASSETS AND LIABILITIES
Financial derivative instruments are recorded on the statement of financial position at fair value. As at September 30, 2016, the fair value of these contracts were as follows: As at (millions of dollars) September 30, 2016 December 31, 2015
Hedge
Instruments Non-Hedge Derivatives
Hedge Instruments
Non-Hedge Derivatives
Assets Current 32.2 17.7 26.9 7.7 Non-current 50.9 9.5 38.7 2.0
Liabilities Current 70.3 17.7 49.3 12.5 Non-current 105.7 15.6 45.0 8.1
Cash flow hedges are used to manage the variability of cash flows resulting from the purchase and sale of electricity and natural gas, and from foreign exchange exposure. For cash flow hedges, changes in the fair value of the effective portion of the hedging derivative are accumulated in other comprehensive income (OCI) and recognized in net earnings during the periods when the variability in cash flows of the hedged item is realized. During the three and nine months ended September 30, 2016, there was no ineffectiveness in the cash flow hedges recognized in electricity and fuel purchases (2015–nil). Gains and losses on cash flow hedges are reclassified immediately to net earnings when an anticipated hedged transaction is no longer likely to occur. During the three and nine months ended September 30, 2016, there was no impact to earnings (2015–nil) related to hedges that no longer qualified for hedge accounting.
Non-hedge derivatives are classified at fair value through profit and loss and recognized at fair market value with changes in fair market value being recognized in earnings. In the three and nine months ended September 30, 2016, there were losses of $16.9 million and gains of $4.8 million respectively (2015–$3.8 million loss and $4.2 million gain) recorded in net earnings.
NON-DERIVATIVE FINANCIAL ASSETS AND LIABILITIES
Fair values for cash and cash equivalents, accounts receivable, short-term debt, accounts payable and accrued liabilities are not materially different from their carrying amounts due to their short-term nature.
The Corporation estimated the fair value of its long-term debt based on quoted market prices for the same or similar debt instruments. When such information was not available, future payments of interest and principal were discounted at estimated interest rates for comparable entities.
ENMAX | Q3 2016 Financial Report Condensed Consolidated Interim Financial Statements 22

CARRYING AMOUNTS AND FAIR VALUES OF LONG-TERM DEBT As at (millions of dollars) September 30, 2016 December 31, 2015 Carrying
Amount Fair
Value Carrying Amount
Fair Value
Long-term debt (1) consisting of: Debentures, with remaining terms of
Less than 5 years 106.1 112.0 62.8 64.6 5–10 years 10.8 11.2 76.7 83.5 10–15 years 49.0 57.0 31.1 36.0 15–20 years 463.9 553.6 387.1 450.4 20–25 years 541.0 584.0 653.4 683.3
Private debentures Series 1 (6.15%) 299.2 327.3 298.9 333.2 Series 3 (3.81%) 198.7 211.9 198.6 206.6
Promissory note 4.0 4.3 4.2 4.5
1,672.7 1,861.3 1,712.8 1,862.1
(1) Includes current portion of $67.7 million (December 31, 2015–$66.2 million). Maturity dates range from September 2016 to June 2040.
5. REGULATORY DEFERRAL BALANCES
The timing of recognition of certain regulatory debits, credits, revenues and expenses may differ from what is otherwise expected under IFRS for non-regulated operations. The Corporation has recorded the following regulatory deferral debit and credit balances:
As at (millions of dollars)
January 1,
2016
Balances Arising in
the Period1
Recovery
(Reversal) 2
March 31,
2016
Balances Arising in
the Period1
Recovery
(Reversal) 2
June 30,
2016
Balances Arising in
the Period1
Recovery
(Reversal) 2
September 30,
2016
Expected Recovery/Reversal period
(months)
Regulatory deferral account debit balances
Accounts receivable (a) 19.8 32.4 (44.2) 8.0 39.2 (37.8) 9.4 41.1 (40.6) 9.9 2 Mo Un-eliminated inter-company profit on underground residential development (b) 2.0 0.5 - 2.5 1.6 - 4.1 0.4 - 4.5 Other regulatory debits (c) 12.7 - (0.3) 12.4 0.2 1.2 13.8 - 0.6 14.4 12 Mo
Total regulatory deferral account debit balances
34.5
32.9
(44.5)
22.9
41.0
(36.6)
27.3
41.5
(40.0)
28.8
Regulatory deferral account credit balances
Other regulatory credits (d) 13.5 0.6 (1.5) 12.6 - (0.8) 11.8 - (5.5) 6.3 12 Mo Total regulatory deferral account credit balances
13.5
0.6
(1.5)
12.6
-
(0.8)
11.8
-
(5.5)
6.3
ENMAX | Q3 2016 Financial Report Condensed Consolidated Interim Financial Statements 23

As at (millions of dollars)
January 1,
2015
Balances Arising in
the Period1
Recovery
(Reversal) 2
March 31,
2015
Balances Arising in
the Period1
Recovery
(Reversal) 2
June 30,
2015
Balances Arising in
the Period1
Recovery
(Reversal) 2
September 30,
2015
Expected Recovery/ Reversal period
(months)
Regulatory deferral account debit balances
Accounts receivable (a) 18.5 26.3 (32.5) 12.3 37.9 (30.4) 19.8 30.5 (26.9) 23.4 2 Mo
Un-eliminated inter-company profit on underground residential development (b)
1.5 (0.2) - 1.3 0.8 - 2.1
0.4
-
2.5 Other regulatory debits (c) 46.6 1.0 (33.5) 14.1 0.5 2.5 17.1 - (5.6) 11.5 6 Mo
Total regulatory deferral account debit balances 66.6 27.1 (66.0) 27.7 39.2 (27.9) 39.0 30.9 (32.5) 37.4
Regulatory deferral account credit balances
Other regulatory credits (d) 2.5 7.6 (0.7) 9.4 2.5 - 11.9 1.0 (0.3) 12.6 12 Mo
Total regulatory deferral account credit balances 2.5 7.6 (0.7) 9.4 2.5 - 11.9 1.0 (0.3) 12.6
1 “Balances Arising in the Period” column consists of new additions to regulatory deferral debits and credit balances. 2 “Recovery(reversal)” column consists amounts collected through rate riders or transactions reversing existing regulatory balances.
The following describes each of the circumstances in which rate regulation affects the accounting for a transaction or event. Regulatory deferral debit balances represent costs incurred in the current period or in prior periods which are expected to be recovered from customers in future periods through the rate-setting process. Regulatory deferral credit balances represent future reductions or limitations of increases in revenues associated with amounts that are expected to be returned to customers as a result of the rate-setting process.
(a) Accounts receivable
Accounts receivable represent a price-only deferral account for transmission charges from the Alberta Electric System Operator (AESO). In the absence of rate regulation and the interim standard, IFRS would require that actual costs be recognized as an expense when incurred.
(b) Inter-company profit on underground residential development
A subsidiary of the Corporation performs construction work for the regulated operations of ENMAX Power Delivery at a profit. Such profit is deemed for regulatory purposes to be realized to the extent that the transfer price is recognized for rate-making purposes by the regulator and is included in the capital cost of distribution assets. In the absence of rate regulation and the interim standard, IFRS would require that intercompany profits be eliminated upon consolidation.
(c) Other regulatory debits
Other regulatory debits primarily relate to the Alberta Utilities Commission (AUC) flow-through items and other costs that will be collected from customers via future rates such as access service charges. Timing of the decision on collection of these items can result in significant fluctuation in balances from year to year.
ENMAX | Q3 2016 Financial Report Condensed Consolidated Interim Financial Statements 24
(d) Other regulatory credits
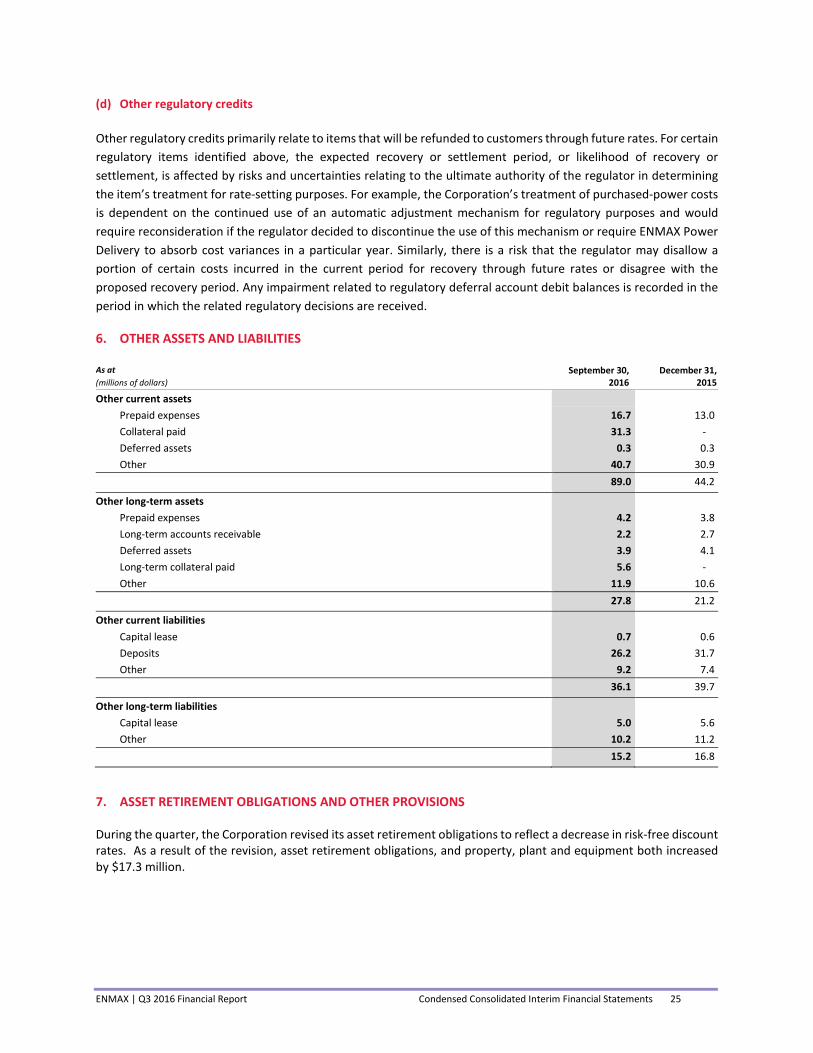
Other regulatory credits primarily relate to items that will be refunded to customers through future rates. For certain regulatory items identified above, the expected recovery or settlement period, or likelihood of recovery or settlement, is affected by risks and uncertainties relating to the ultimate authority of the regulator in determining the item’s treatment for rate-setting purposes. For example, the Corporation’s treatment of purchased-power costs is dependent on the continued use of an automatic adjustment mechanism for regulatory purposes and would require reconsideration if the regulator decided to discontinue the use of this mechanism or require ENMAX Power Delivery to absorb cost variances in a particular year. Similarly, there is a risk that the regulator may disallow a portion of certain costs incurred in the current period for recovery through future rates or disagree with the proposed recovery period. Any impairment related to regulatory deferral account debit balances is recorded in the period in which the related regulatory decisions are received.
6. OTHER ASSETS AND LIABILITIES
As at (millions of dollars)
September 30, 2016
December 31, 2015
Other current assets Prepaid expenses 16.7 13.0 Collateral paid 31.3 - Deferred assets 0.3 0.3 Other 40.7 30.9
89.0 44.2
Other long-term assets Prepaid expenses 4.2 3.8 Long-term accounts receivable 2.2 2.7 Deferred assets 3.9 4.1 Long-term collateral paid 5.6 - Other 11.9 10.6
27.8 21.2
Other current liabilities Capital lease 0.7 0.6 Deposits 26.2 31.7 Other 9.2 7.4
36.1 39.7
Other long-term liabilities Capital lease 5.0 5.6 Other 10.2 11.2
15.2 16.8
7. ASSET RETIREMENT OBLIGATIONS AND OTHER PROVISIONS
During the quarter, the Corporation revised its asset retirement obligations to reflect a decrease in risk-free discount rates. As a result of the revision, asset retirement obligations, and property, plant and equipment both increased by $17.3 million.
ENMAX | Q3 2016 Financial Report Condensed Consolidated Interim Financial Statements 25

8. POWER PURCHASE ARRANGEMENTS (PPA) IMPAIRMENT
On May 5, 2016, the Corporation issued a notice to the Balancing Pool of its decision to terminate the Keephills PPA effective May 5, 2016. The termination is pursuant to the change in law provisions of the PPA. As a result of the decision, the Corporation recorded a non-cash impairment of $51.4 million in the second quarter of 2016.
9. INCOME TAXES
The calculation of the Corporation’s current and deferred income taxes involves a degree of estimation and judgment. The carrying value of deferred income tax assets are reviewed at the end of each reporting period. For the three and nine months ended September 30, 2016, management adjusted the income tax provision utilizing its best estimate with considerations including management’s expectation of future operating results, interpretation of applicable tax regulations positions, allowances where uncertainty surrounding the realization of the tax benefit exists, and the settlement of the various tax disputes.
10. ACCUMULATED OTHER COMPREHENSIVE LOSS
As at (millions of dollars)
September 30, 2016
December 31, 2015
Net unrealized (losses) on available-for-sale financial assets - (0.1) Net unrealized (losses) on derivatives designated as cash flow hedges, including deferred income tax recovery of $19.3 million (December 31, 2015–recovery of $0.9 million)
(73.7) (27.8)
Net actuarial gains on defined benefit plans, including deferred income tax recovery of $0.1 million (December 31, 2015–recovery of $0.2 million)
4.0 4.1
Accumulated other comprehensive (loss), including deferred income tax recovery $19.4 million (December 31, 2015–recovery of $1.1 million) (69.7) (23.8)
11. OTHER REVENUE AND EXPENSES
OTHER REVENUE
Three Months Ended September 30
Nine Months Ended September 30
(millions of dollars) 2016 2015 2016 2015
Contractual services 28.1 29.4 81.1 72.1 Interest and penalty revenue 2.5 2.7 7.5 8.0 Amortization of contributions in aid of construction (CIAC) 3.5 2.6 10.3 9.2 Miscellaneous 1.2 1.7 9.6 6.1
35.3 36.4 108.5 95.4 OTHER EXPENSES
Three Months Ended September 30
Nine Months Ended September 30
(millions of dollars) 2016 2015 2016 2015
Salaries and wages 51.6 56.7 165.3 179.4 Materials and supplies 8.1 5.9 21.0 15.1 Goods and services 21.6 20.5 65.3 55.8 Administrative and office expenses 2.6 2.8 7.9 6.0 Building expense 12.8 10.9 38.9 33.7 Vehicles and other 1.6 8.2 12.1 13.4 Foreign exchange losses (gains) (1.9) (9.5) 1.1 (20.6)
96.4 95.5 311.6 282.8
ENMAX | Q3 2016 Financial Report Condensed Consolidated Interim Financial Statements 26

12. DIVIDEND
On March 16, 2016, the Corporation declared a dividend of $47.0 million to The City (2015–$56.0 million). The dividend will be paid in equal quarterly instalments during 2016.
13. CHANGE IN NON-CASH WORKING CAPITAL
14. RELATED PARTY TRANSACTIONS
The City is the sole shareholder of the Corporation. The following tables summarize the related party transactions between the Corporation and The City.
Statements of earnings
Three Months Ended
September 30 Nine Months Ended
September 30 (millions of dollars) 2016 2015 2016 2015
Revenue (1) 28.8 26.7 91.5 83.1 Local access fees and other expenses (2) 24.9 34.4 72.0 91.1
(1) The significant components include contract sales of electricity, construction of infrastructure, provision of non-regulated power distribution services, and billing and customer care services relating to The City’s utilities departments.
(2) This cost is passed through the Corporation directly to transmission and distribution customers.
Statements of financial position As at (millions of dollars)
September 30, 2016
December 31, 2015
Accounts receivable 19.2 22.8 Other long-term assets 1.4 1.9 Property, plant and equipment (1) 3.8 3.9 Accounts payable and accrued liabilities 7.5 9.7 Long-term debt (2) 1,170.8 1,211.1 Other long-term liabilities (3) 5.1 5.1
(1) Assets under lease. (2) Interest paid for the three and nine months ended September 30, 2016, were $1.7 million and $24.5 million (2015— $2.0 million and $23.5 million) respectively. Principal payments made
for the three and nine months ended September 30, 2016, were $7.6 million and $40.3 million (2015 —$7.3 million and $37.5 million) respectively. In addition, the Corporation paid a management fee of $0.7 million and $2.1 million (2015 - $0.8 million and $2.2 million) to The City for the three and nine months ended September 30, 2016, respectively.
(3) Finance lease obligation and other.
Transactions between the Corporation and The City have been recorded at the exchange amounts. Exchange amounts are the amounts as outlined by the contracts in effect between the Corporation and The City.
The Corporation has committed to a water supply agreement, whereby The City supplies a specified amount of water annually to facilitate Shepard operations.
Three Months Ended September 30
Nine Months Ended September 30
(millions of dollars) 2016 2015 2016 2015
Accounts receivable (6.4) 24.7 29.2 61.4 Regulatory deferral account debit balance (1.5) 1.6 5.7 29.2 Other assets (20.9) 1.0 (51.4) (11.0) Accounts payable and accrued liabilities (0.9) (86.7) (48.0) (59.2) Regulatory deferral account credit balances (5.5) 0.8 (7.2) 10.1 Other liabilities (6.1) (28.7) (5.4) 11.3 Provisions (0.5) (0.7) (2.3) (1.1) Change in non-cash working capital (41.8) (88.0) (79.4) 40.7
ENMAX | Q3 2016 Financial Report Condensed Consolidated Interim Financial Statements 27

15. COMMITMENTS AND CONTINGENCIES
The Corporation has commitments, including property, plant and equipment capital expenditures and obligations under various agreements. The Corporation assesses for potential contingencies for regulatory requirements, legal claims, PPA, income tax, environmental liabilities, letters of credit, director/officer indemnifications and other indemnifications. A detailed description of the Corporation’s commitments and contingencies was provided in Note 28 of the 2015 Consolidated Financial Statements.
The Corporation notified the Balancing Pool of the decisions to terminate the Battle River 5 PPA and the Keephills PPA effective January 1, 2016 and May 5, 2016, respectively.
The Balancing Pool confirmed the Corporation’s termination of the Battle River 5 PPA on January 27, 2016 and assumed full and final operational control of the PPA on July 13, 2016. The Balancing Pool and the Corporation differ in opinion as to the effective date of the termination; the Corporation’s position is that the effective date is January 1, 2016, whereas the Balancing Pool’s position is that the effective date is July 13, 2016. In the event that the termination date is determined to be later than January 1, 2016 (up to July 13, 2016), the Corporation may be exposed to an estimated loss of up to $45.0 million.
The Balancing Pool has communicated to the Corporation that it has not finalized its assessment of the Keephills PPA termination. In addition, on September 16, 2016, the Balancing Pool notified the Corporation that it would not be completing its investigation of the Keephills PPA until a decision has been made by the Court on the Alberta Application (defined below). If the Balancing Pool confirms the Corporation’s right to terminate the Keephills PPA, the Balancing Pool may challenge the effective date of termination. If the effective date of that termination is determined to be later than May 5, 2016, the Corporation may be exposed to an estimated loss of up to $32.0 million (up to September 30, 2016).
The Government of Alberta filed an application with the Court of Queen’s Bench on July 25, 2016 seeking (1) judicial review of the Balancing Pool’s decision to accept the Battle River 5 PPA termination and (2) declaratory relief regarding the validity and interpretation of certain terms within the PPAs and related regulations (Alberta Application). An affiliate of the Corporation (ENMAX PPA Management Inc.) is named as a respondent in the Alberta Application. If the Government of Alberta is successful in the Alberta Application, the Corporation may be required to refund the Balancing Pool for its share of the net PPA costs incurred from the notice dates to when the matter is resolved.
No provisions have been recognized with respect to the above matters as the Corporation believes the terminations were exercised in accordance with the provisions of the PPAs.
REGULATORY
The Corporation, along with other electrical generation, transmission and distribution utilities in the province of Alberta, is subject to regulatory reviews and decisions. The impact of reviews and decisions is reflected in the consolidated financial statements when the amount can be reasonably estimated.
The Corporation is participating in AUC Line Loss Rule Proceeding (LLR Proceeding) relating to loss factors that form the basis for certain transmission charges paid by Alberta generators, including ENMAX. The LLR Proceeding is divided into three modules that will address replacement of the current Line Loss Rule (LLR) and the possible correction of line loss charges and credits for years retroactive to 2006. Module A covers the AUC’s authority to
ENMAX | Q3 2016 Financial Report Condensed Consolidated Interim Financial Statements 28

order retroactive adjustments. Module B covers the proposed methodology. Module C covers who owes what to whom back to January 2006.
In January 2015, the AUC concluded in its Module A decision that it has the authority to retroactively adjust line loss charges and credits. The Module A decision was subsequently appealed by several parties, including ENMAX. By court order, the consideration of those appeals has been deferred until after the completion of Module C.
In November 2015, the AUC approved principles for the new LLR in Module B. In June 2016, the AUC rejected applications for review and variance of the Module B decision that had been submitted by ENMAX and another party, ruling that it would be premature to review the decision prior to completing Module C. The AUC also ruled, however, that the parties could resubmit Module B review applications upon completion of Module C.
In January 2016, the AUC initiated Module C, which will address issues relating to what retrospective adjustments, if any, are to be paid to or received by the various parties. On September 28, 2016, the AUC released a decision regarding certain Module C preliminary matters. The Commission noted in the Module C Preliminary Matters decision that the magnitude of any reissued bills that result in charges or reimbursements remains unknown.
As at November 24, 2016, the AUC has not established the timeline for consideration of the remaining Module C issues, and the AESO expects to produce prospective loss factors in January 2017 and retrospective loss factors 12 to 18 months later. The Corporation has appealed the Module A decision, currently deferred by the AUC, which may overturn AUC’s authority to retroactively adjust line loss charges and credits. The Corporation may incur material additional transmission charges on a go-forward basis. No provision has been recognized related to potential retroactive adjustments since the outcomes of the LLR Proceeding and the associated appeals in process remain uncertain and unquantifiable at this time and are not expected to be resolved in 2016.
LEGAL CLAIMS
In the normal course of business, the Corporation is named as a defendant in lawsuits related to various matters. Based on the Corporation’s assessments of the outstanding lawsuits, the Corporation does not believe the outcome of these lawsuits will have a material impact on the operating results or financial position of the Corporation.
16. COMPARATIVE FIGURES
Certain comparative figures have been reclassified to conform to the current period’s presentation. Refer to Note 3 for further information.
ENMAX | Q3 2016 Financial Report Condensed Consolidated Interim Financial Statements 29

ADDITIONAL INFORMATION Additional information relating to ENMAX can be found at enmax.com.
ENMAX welcomes questions from stakeholders.
Please direct financial inquiries to:
Gianna Manes President and Chief Executive Officer 403.514.3000
Helen Wesley Executive Vice President and Chief Financial Officer 403.514.3000
Please direct media inquiries to:
Doris Kaufmann Woodcock Senior Media Relations Advisor 403.689.6150 Email: [email protected]
ENMAX | Q3 2016 Financial Report Condensed Consolidated Interim Financial Statements 30