Embed Size (px)
Citation preview
REVIEW OF SCIENTIFIC INSTRUMENTS 86, 123305 (2015)
Cavity design for high-frequency axion dark matter detectorsI. Stern,1 A. A. Chisholm,1 J. Hoskins,1 P. Sikivie,1 N. S. Sullivan,1 D. B. Tanner,1G. Carosi,2 and K. van Bibber31Department of Physics, University of Florida, Gainesville, Florida 32611, USA2Lawrence Livermore National Laboratory, Livermore, California 94550, USA3Department of Nuclear Engineering, University of California, Berkeley, California 94720, USA
(Received 7 October 2015; accepted 6 December 2015; published online 30 December 2015)
In an effort to extend the usefulness of microwave cavity detectors to higher axion masses, above∼8 µeV (∼2 GHz), a numerical trade study of cavities was conducted to investigate the meritof using variable periodic post arrays and regulating vane designs for higher-frequency searches.The results show that both designs could be used to develop resonant cavities for high-mass axionsearches. Multiple configurations of both methods obtained the scanning sensitivity equivalent toapproximately 4 coherently coupled cavities with a single tuning rod. C 2015 AIP PublishingLLC. [http://dx.doi.org/10.1063/1.4938164]
I. BACKGROUND
The detection of the axion is of significant interestto particle physics and to cosmology. The axion is ahypothetical pseudoscalar particle which was originallypostulated to explain, within the framework of the standardmodel of particle interactions, why P (parity) and CP(charge conjugation times parity) are conserved by the stronginteractions.1–3 If the axion mass were in the range of10−6–10−3 eV, the axion is a natural cold dark matter (CDM)candidate.4 With recent diminutions of the available parameterspace for the weakly interacting massive particle (WIMP),5
the axion is now by far the most promising candidate forthe constitution of cold dark matter and this has generateda proliferation of searches around the world. String theoryfurther suggests the simultaneous presence of many ultra-lightaxion-like particles, possibly populating each decade of massdown to the Hubble scale of 10−33 eV.6
Axion detection has proven to be extremely challenging.CDM axions have a lifetime vastly greater than the age of theuniverse,5 have exceptionally weak interactions with matterand radiation, and were originally thought to be “invisible” toall detection techniques. However, in 1983, Sikivie7 proposeda method by which these axions plausibly could be detected.He showed the decay rate of axions to photons can be greatlyincreased within a strong magnetic field, through the inversePrimakoff8 effect.
The Lagrangian for the axion-photon interaction is givenby
Laγγ = gaγγa E · B, (1)
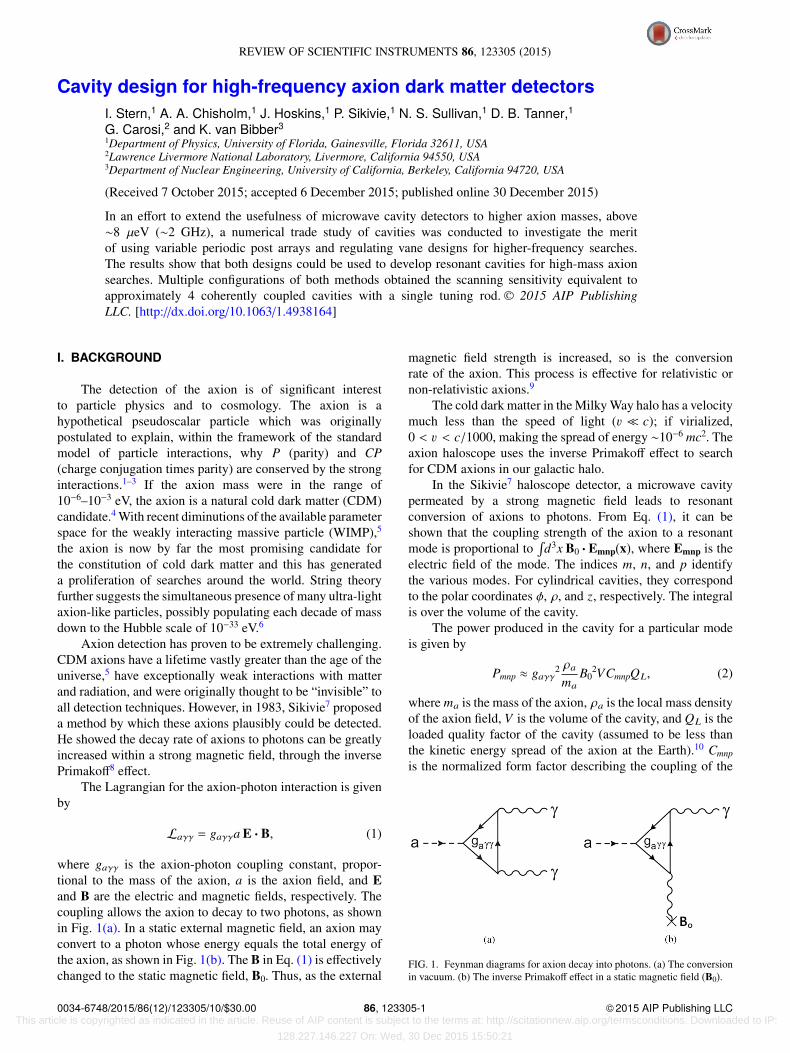
where gaγγ is the axion-photon coupling constant, propor-tional to the mass of the axion, a is the axion field, and Eand B are the electric and magnetic fields, respectively. Thecoupling allows the axion to decay to two photons, as shownin Fig. 1(a). In a static external magnetic field, an axion mayconvert to a photon whose energy equals the total energy ofthe axion, as shown in Fig. 1(b). The B in Eq. (1) is effectivelychanged to the static magnetic field, B0. Thus, as the external
magnetic field strength is increased, so is the conversionrate of the axion. This process is effective for relativistic ornon-relativistic axions.9
The cold dark matter in the Milky Way halo has a velocitymuch less than the speed of light (v ≪ c); if virialized,0 < v < c/1000, making the spread of energy ∼10−6 mc2. Theaxion haloscope uses the inverse Primakoff effect to searchfor CDM axions in our galactic halo.
In the Sikivie7 haloscope detector, a microwave cavitypermeated by a strong magnetic field leads to resonantconversion of axions to photons. From Eq. (1), it can beshown that the coupling strength of the axion to a resonantmode is proportional to
d3x B0 · Emnp(x), where Emnp is the
electric field of the mode. The indices m, n, and p identifythe various modes. For cylindrical cavities, they correspondto the polar coordinates φ, ρ, and z, respectively. The integralis over the volume of the cavity.
The power produced in the cavity for a particular modeis given by
Pmnp ≈ gaγγ2 ρama
B02VCmnpQL, (2)
where ma is the mass of the axion, ρa is the local mass densityof the axion field, V is the volume of the cavity, and QL is theloaded quality factor of the cavity (assumed to be less thanthe kinetic energy spread of the axion at the Earth).10 Cmnp
is the normalized form factor describing the coupling of the
FIG. 1. Feynman diagrams for axion decay into photons. (a) The conversionin vacuum. (b) The inverse Primakoff effect in a static magnetic field (B0).
0034-6748/2015/86(12)/123305/10/$30.00 86, 123305-1 © 2015 AIP Publishing LLC This article is copyrighted as indicated in the article. Reuse of AIP content is subject to the terms at: http://scitationnew.aip.org/termsconditions. Downloaded to IP:
128.227.146.227 On: Wed, 30 Dec 2015 15:50:21

123305-2 Stern et al. Rev. Sci. Instrum. 86, 123305 (2015)
axion to a specific mode. It is given by
Cmnp ≡�
d3x B0 · Emnp(x)�2B0
2V
d3x ε (x) �Emnp(x)�2, (3)
where ε(x) is the permittivity within the cavity normalized tovacuum.
The mass of CDM axions is constrained by cosmol-ogy (ma & µeV)11–13 and astronomical observations (ma .30 meV).14 The axion-photon coupling is model-dependent. Inthe KSVZ (Kim-Shifman-Vainshtein-Zakharov)15,16 model,the coupling is
gKSVZaγγ = 0.38
ma
GeV2 . (4)
In the DFSZ (Dine-Fischler-Srednicki-Zhitnitsky)17,18 model,
gDFSZaγγ = 0.14
ma
GeV2 . (5)
In all models, including the two above, the coupling isproportional to the axion mass but the numerical constantthat appears generally differs by similar factors among themodels. In all models where the Standard Model gauge groupis grand-unified into a simple gauge group, the coupling isthe same as in the DFSZ model.
II. AXION DARK MATTER EXPERIMENT (ADMX)
The largest and most sensitive microwave cavity axionsearch to date is the ADMX. ADMX searches for CDMaxions using a 7.6 T superconducting solenoid and a ∼0.15 m3
cylindrical microwave resonator.19 The magnetic field of thesolenoid is aligned with the cylinder axis of the cavity (definedas the z-axis).
From Eq. (3), it can be seen that a signal will be producedonly when the resonant mode’s electric field integrates toa total nonzero z-component. Thus, all transverse electricmodes (TE and TEM) will yield no detectable signal; onlyTM0n0 modes will couple to axions. Further, the TM010 modehas the largest form factor, with higher mode (TM020, TM030,TM040, etc.) form factors decreasing as ∼1/ f 2 for a simplecylindrical cavity, with f being the resonant frequency ofthe mode.20 For ADMX, the empty-cavity frequency ( f0) forthe TM010 mode is ∼550 MHz, and the theoretical unloadedquality factor Q0 ≈ 500 000 at 4 K.
The frequency of the mode excited by the axion-to-photonconversion is f ≈ mac2/h, where h is Planck’s constant. Sincethe axion mass is unknown, ADMX must tune the cavityresonant frequency to carry out its search. ADMX adjuststhe frequency of the modes using two conducting rods thatrun parallel to the longitudinal axis of the cavity.20 The rodsare independently repositioned to various radial distancesfrom the centerline of the resonator, altering the boundaryconditions and changing the electromagnetic field solutions.This tuning can be shown by solving the two-dimensionalwave equation of a resonant cavity
�∇2t + γ
2�ψ = 0. (6)
For TM0n0 modes, ψ = Ez and
γ2 = 4π2µ0ε f 2, (7)
FIG. 2. Schematic of ADMX microwave cavity. The tuning rods are shownin the outmost configuration and move along the circular arcs. R is the radiusof the cavity and d is the height.
where µ0 and ε are the permeability and permittivity withinthe cavity, respectively. Because the Laplacian is a measureof scalar curvature and the additional boundary conditionsincrease the curvature of Ez, adding the conducting rodsincreases the frequency.
The frequency of the TM010 mode increases as the rodsapproach the center of the cavity. The mechanical systemmoves the rods in a circular arc from near the wall to nearthe center. The experiment continually tunes the resonator infrequency steps of ∼ f /5Q. Figure 2 shows a schematic of thecavity.
ADMX has conducted searches for a number of years,successfully excluding axions with KSVZ coupling strength inthe mass range of 1.9–3.5 µeV (460–860 MHz).21–24 Figure 3shows the published limits for the program. ADMX begansearching the TM020 mode range in the year 2014, extendingthe search up to approximately 6.2 µeV (1.5 GHz). However,the cavity design using two tuning rods does not provide forsuccessful scanning above ∼1.5 GHz. Increasing the diameterof the tuning rods can drive the TM0n0 frequencies above1.5 GHz, but the form factor (C) of the modes and scanningrange of the cavity decrease significantly. New resonant cavitytechnologies need to be developed to enable searching foraxions of greater mass.
The ADMX High-Frequency (ADMX-HF) is a similarbut separate detector program that began operation in 2015.It uses a cavity with a volume of ∼2 × 10⁻³ m3, and asingle tuning rod with a radius of r = R/2. The detectorsearches for axions at frequencies approximately one orderof magnitude higher than ADMX. The TM010 empty-cavityfrequency for ADMX-HF is ∼2.3 GHz and the theoreticalunloaded Q0 ≈ 200 000 at 4 K.
III. CAVITY DESIGN STUDY
The following relationships illustrate the dilemma facedby the axion search. The frequency of the exited mode scalesapproximately as the axion mass. The TM010 frequency scales
This article is copyrighted as indicated in the article. Reuse of AIP content is subject to the terms at: http://scitationnew.aip.org/termsconditions. Downloaded to IP:
128.227.146.227 On: Wed, 30 Dec 2015 15:50:21
123305-3 Stern et al. Rev. Sci. Instrum. 86, 123305 (2015)
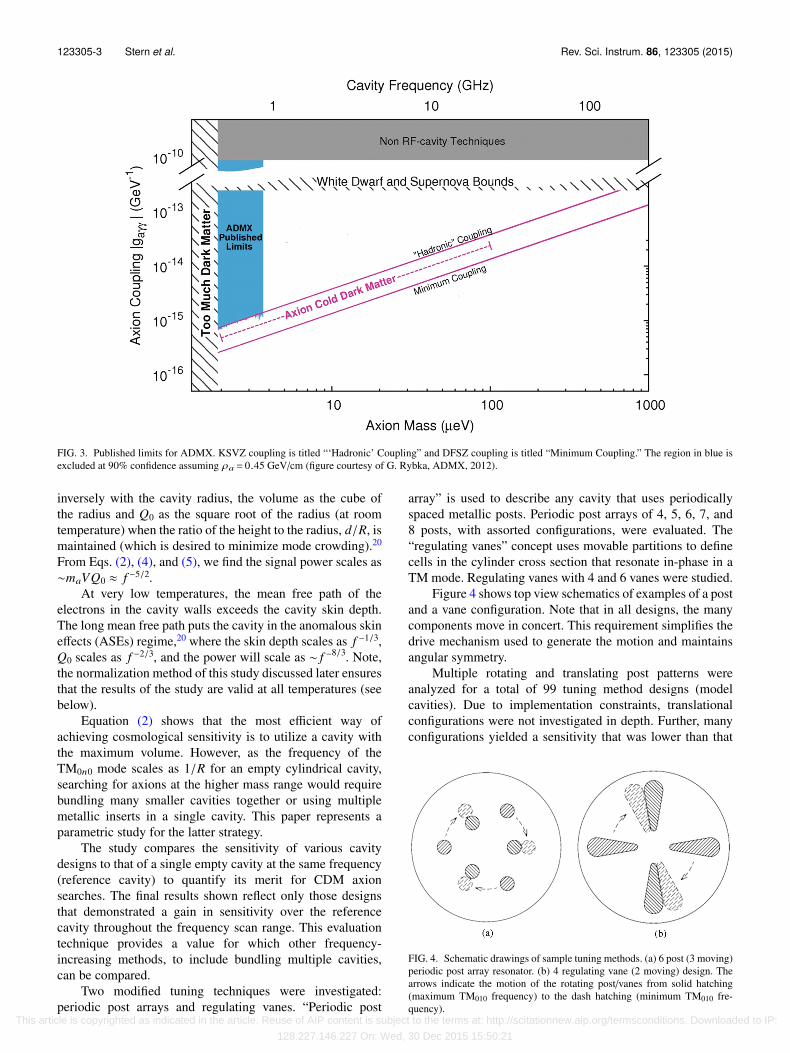
FIG. 3. Published limits for ADMX. KSVZ coupling is titled “‘Hadronic’ Coupling” and DFSZ coupling is titled “Minimum Coupling.” The region in blue isexcluded at 90% confidence assuming ρa = 0.45 GeV/cm (figure courtesy of G. Rybka, ADMX, 2012).
inversely with the cavity radius, the volume as the cube ofthe radius and Q0 as the square root of the radius (at roomtemperature) when the ratio of the height to the radius, d/R, ismaintained (which is desired to minimize mode crowding).20
From Eqs. (2), (4), and (5), we find the signal power scales as∼maVQ0 ≈ f −5/2.
At very low temperatures, the mean free path of theelectrons in the cavity walls exceeds the cavity skin depth.The long mean free path puts the cavity in the anomalous skineffects (ASEs) regime,20 where the skin depth scales as f −1/3,Q0 scales as f −2/3, and the power will scale as ∼ f −8/3. Note,the normalization method of this study discussed later ensuresthat the results of the study are valid at all temperatures (seebelow).
Equation (2) shows that the most efficient way ofachieving cosmological sensitivity is to utilize a cavity withthe maximum volume. However, as the frequency of theTM0n0 mode scales as 1/R for an empty cylindrical cavity,searching for axions at the higher mass range would requirebundling many smaller cavities together or using multiplemetallic inserts in a single cavity. This paper represents aparametric study for the latter strategy.
The study compares the sensitivity of various cavitydesigns to that of a single empty cavity at the same frequency(reference cavity) to quantify its merit for CDM axionsearches. The final results shown reflect only those designsthat demonstrated a gain in sensitivity over the referencecavity throughout the frequency scan range. This evaluationtechnique provides a value for which other frequency-increasing methods, to include bundling multiple cavities,can be compared.
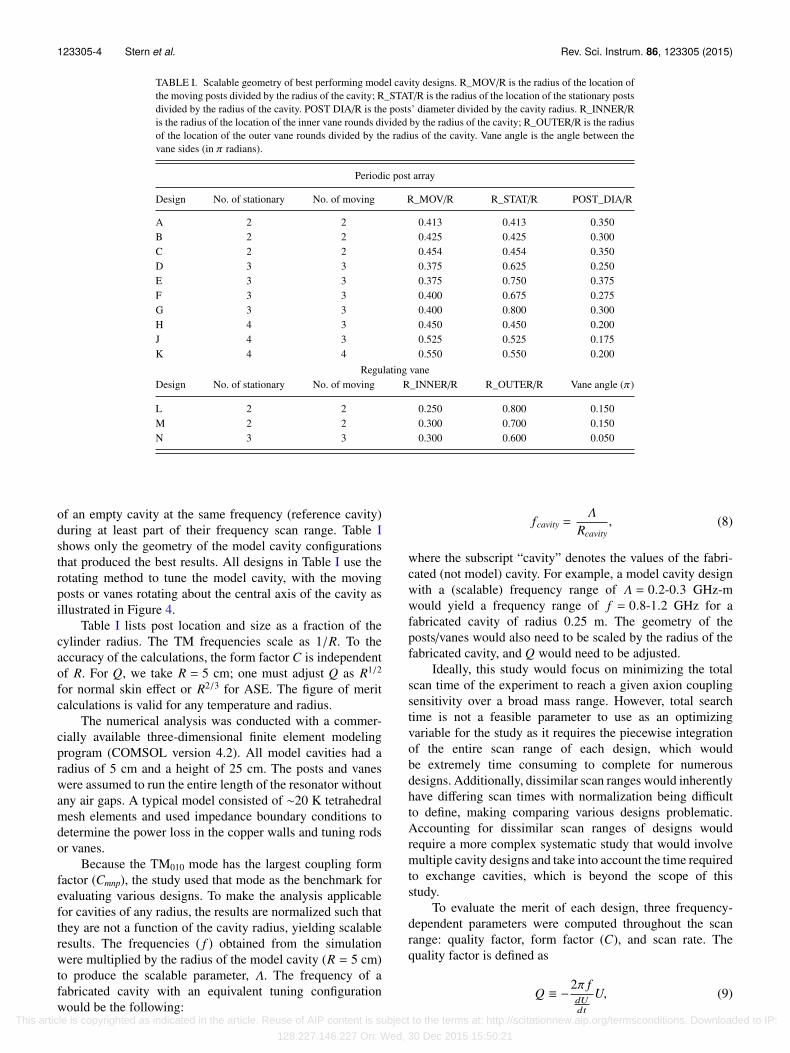
Two modified tuning techniques were investigated:periodic post arrays and regulating vanes. “Periodic post
array” is used to describe any cavity that uses periodicallyspaced metallic posts. Periodic post arrays of 4, 5, 6, 7, and8 posts, with assorted configurations, were evaluated. The“regulating vanes” concept uses movable partitions to definecells in the cylinder cross section that resonate in-phase in aTM mode. Regulating vanes with 4 and 6 vanes were studied.
Figure 4 shows top view schematics of examples of a postand a vane configuration. Note that in all designs, the manycomponents move in concert. This requirement simplifies thedrive mechanism used to generate the motion and maintainsangular symmetry.
Multiple rotating and translating post patterns wereanalyzed for a total of 99 tuning method designs (modelcavities). Due to implementation constraints, translationalconfigurations were not investigated in depth. Further, manyconfigurations yielded a sensitivity that was lower than that
FIG. 4. Schematic drawings of sample tuning methods. (a) 6 post (3 moving)periodic post array resonator. (b) 4 regulating vane (2 moving) design. Thearrows indicate the motion of the rotating post/vanes from solid hatching(maximum TM010 frequency) to the dash hatching (minimum TM010 fre-quency).
This article is copyrighted as indicated in the article. Reuse of AIP content is subject to the terms at: http://scitationnew.aip.org/termsconditions. Downloaded to IP:
128.227.146.227 On: Wed, 30 Dec 2015 15:50:21
123305-4 Stern et al. Rev. Sci. Instrum. 86, 123305 (2015)
TABLE I. Scalable geometry of best performing model cavity designs. R_MOV/R is the radius of the location ofthe moving posts divided by the radius of the cavity; R_STAT/R is the radius of the location of the stationary postsdivided by the radius of the cavity. POST DIA/R is the posts’ diameter divided by the cavity radius. R_INNER/Ris the radius of the location of the inner vane rounds divided by the radius of the cavity; R_OUTER/R is the radiusof the location of the outer vane rounds divided by the radius of the cavity. Vane angle is the angle between thevane sides (in π radians).
Periodic post array
Design No. of stationary No. of moving R_MOV/R R_STAT/R POST_DIA/R
A 2 2 0.413 0.413 0.350B 2 2 0.425 0.425 0.300C 2 2 0.454 0.454 0.350D 3 3 0.375 0.625 0.250E 3 3 0.375 0.750 0.375F 3 3 0.400 0.675 0.275G 3 3 0.400 0.800 0.300H 4 3 0.450 0.450 0.200J 4 3 0.525 0.525 0.175K 4 4 0.550 0.550 0.200
Regulating vaneDesign No. of stationary No. of moving R_INNER/R R_OUTER/R Vane angle (π)
L 2 2 0.250 0.800 0.150M 2 2 0.300 0.700 0.150N 3 3 0.300 0.600 0.050
of an empty cavity at the same frequency (reference cavity)during at least part of their frequency scan range. Table Ishows only the geometry of the model cavity configurationsthat produced the best results. All designs in Table I use therotating method to tune the model cavity, with the movingposts or vanes rotating about the central axis of the cavity asillustrated in Figure 4.
Table I lists post location and size as a fraction of thecylinder radius. The TM frequencies scale as 1/R. To theaccuracy of the calculations, the form factor C is independentof R. For Q, we take R = 5 cm; one must adjust Q as R1/2
for normal skin effect or R2/3 for ASE. The figure of meritcalculations is valid for any temperature and radius.
The numerical analysis was conducted with a commer-cially available three-dimensional finite element modelingprogram (COMSOL version 4.2). All model cavities had aradius of 5 cm and a height of 25 cm. The posts and vaneswere assumed to run the entire length of the resonator withoutany air gaps. A typical model consisted of ∼20 K tetrahedralmesh elements and used impedance boundary conditions todetermine the power loss in the copper walls and tuning rodsor vanes.
Because the TM010 mode has the largest coupling formfactor (Cmnp), the study used that mode as the benchmark forevaluating various designs. To make the analysis applicablefor cavities of any radius, the results are normalized such thatthey are not a function of the cavity radius, yielding scalableresults. The frequencies ( f ) obtained from the simulationwere multiplied by the radius of the model cavity (R = 5 cm)to produce the scalable parameter, Λ. The frequency of afabricated cavity with an equivalent tuning configurationwould be the following:
fcavity =Λ
Rcavity, (8)
where the subscript “cavity” denotes the values of the fabri-cated (not model) cavity. For example, a model cavity designwith a (scalable) frequency range of Λ = 0.2-0.3 GHz-mwould yield a frequency range of f = 0.8-1.2 GHz for afabricated cavity of radius 0.25 m. The geometry of theposts/vanes would also need to be scaled by the radius of thefabricated cavity, and Q would need to be adjusted.
Ideally, this study would focus on minimizing the totalscan time of the experiment to reach a given axion couplingsensitivity over a broad mass range. However, total searchtime is not a feasible parameter to use as an optimizingvariable for the study as it requires the piecewise integrationof the entire scan range of each design, which wouldbe extremely time consuming to complete for numerousdesigns. Additionally, dissimilar scan ranges would inherentlyhave differing scan times with normalization being difficultto define, making comparing various designs problematic.Accounting for dissimilar scan ranges of designs wouldrequire a more complex systematic study that would involvemultiple cavity designs and take into account the time requiredto exchange cavities, which is beyond the scope of thisstudy.
To evaluate the merit of each design, three frequency-dependent parameters were computed throughout the scanrange: quality factor, form factor (C), and scan rate. Thequality factor is defined as
Q ≡ −2π fdUdt
U, (9)
This article is copyrighted as indicated in the article. Reuse of AIP content is subject to the terms at: http://scitationnew.aip.org/termsconditions. Downloaded to IP:
128.227.146.227 On: Wed, 30 Dec 2015 15:50:21

123305-5 Stern et al. Rev. Sci. Instrum. 86, 123305 (2015)
where U is the energy stored in the cavity.25 The scan rate,among other parameters, determines the maximum speed atwhich the search can be conducted for a given signal-to-noiseratio (s/n).
The Dicke radiometer equation relates the signal-to-noiseratio to power,
sn=
PkBTn
tb, (10)
where Tn is the system noise temperature, kB is theBoltzmann’s constant, t is the integration time, and b isthe signal bandwidth.26 For axion searches, typically s/n > 5.The signal bandwidth for a CDM axion detector comes fromthe velocity dispersion of the axion,
b =ma
Qa, (11)
where Qa ≈ c2/v∆v is the “quality factor” of axions, such thatv and ∆v are the velocity and velocity dispersion, respectively,of the axions on earth. Combining Eqs. (10) and (11) andsolving for t yield
t =( s
n
)2 k2BT2
n
P2
ma
Qa. (12)
If the quality factor of the cavity (Q) is assumed to be lessthan the quality factor of the axion (Qa), then the number ofsignal bandwidths that can be scanned simultaneously by acavity is
N =Qa
QL, (13)
where QL is the loaded quality factor of the cavity (assumedcritically coupled). The time (∆t) required to scan over a smallfrequency range (∆ f ) is
∆t =∆ fNb
( sn
)2 k2BT2
n
P2
ma
Qa. (14)
Combining Eq. (2) with Eq. (14) and rearranging yield thescan rate20,27
dfdt≈
( sn
)−2(
1kBTn
)2gaγγ4ρ2
a
m2a
B40V 2C2QLQa. (15)
The scan rate provides a measure of the sensitivity of theexperiment, defined by the weakest axion-photon couplingfor which the experiment can detect a signal in a given time.From Eq. (15), the sensitivity of a detector at a specifiedconfidence level is found to be
gaγγ ( f ) ∝(
dfdt
) 14
. (16)
Equation (16) indicates that doubling the sensitivity ofthe detector is equivalent to reducing the minimum scanningtime at a given frequency by a factor of 16, and illustrates thedifficulty of detecting CDM axions at the DFSZ limit. Thecoupling sensitivity as a function of frequency was selectedfor the basis of comparing model cavity designs because theparameter directly correlates to the published limits for axionsearches (see y-axis of Fig. 3).
When evaluating different model cavities within the samemagnetic field at a given frequency, only the form factor
and quality factor vary in Eq. (15). To establish a non-dimensional figure of merit, the results of each model cavitysimulation were normalized with equivalent results of anempty cylindrical cavity with the identical TM010 frequency.The TM010 frequency of the reference cavity is a function ofits radius only, given by
f0 =x01c2πR0
= 0.115GHz(
1mR0
), (17)
where R0 is the radius of the reference cavity and x01 is thefirst root of the zeroth order Bessel function (J0).25 The heightof the reference cavities was kept the same as the modelcavities (d = 25 cm). Note that the aspect ratio (ratio of theheight to the radius) of the reference cavities (d/R0) changesas a function of frequency, while the aspect ratio for the modelcavities in this study is held constant (d/R = 5).
The resulting figure of merit used to evaluate all modelcavity configurations was
F ( f ) ≡
V 2(C010)2QV 2
0 C20Q0
14
, (18)
where the numerator uses the volume, form factor, and qualityfactor of the model cavity, and the denominator uses thevolume, form factor, and quality factor of the reference cavity(denoted by the subscript 0). For the TM010 mode of thereference cavity, C0 = 0.692. The figure of merit for a cavityis a function of frequency because the form factor and qualityfactor of the model cavity, and the volume and quality factorof the reference cavity vary with frequency.
The figure of merit is dominated by the volume ratioV/V0 = (Λ/Λ0)2, where Λ0 = 0.115 GHz-m for the TM010mode. This effect captures the intent of the study to producelarge-volume cavities with higher TM mode frequencies.Note that V and C0 are constants, and V0 and Q0 are computeddirectly from the frequency. Only C and Q of the model cavityare obtained from the FEM simulation.
The normalization of F maintains scalability of theresults as long as the aspect ratio of a fabricated cavity is thesame as the model cavity. From Eq. (17), the radius of thereference cavity (R0) can be written as a function of the modelcavity radius (R),
R0 =RΛ
x01c2π
. (19)
Using Eq. (19), the ratio of volumes can be rewritten as thescalable function
VV0=
(2πΛx01c
)2
. (20)
The form factor, Cmnp, is a scalable parameter by definition.The quality factor for the TM010 mode of a circular
cylinder cavity is25
Q =dδ
11 + ξ01
Sd2A
, (21)
where δ is the skin depth, and S and A are the cross-sectionalcircumference (2πR) and area (πR2) of the cavity, respectively.The variable ξ01 is a dimensionless number of order unity,
This article is copyrighted as indicated in the article. Reuse of AIP content is subject to the terms at: http://scitationnew.aip.org/termsconditions. Downloaded to IP:
128.227.146.227 On: Wed, 30 Dec 2015 15:50:21
123305-6 Stern et al. Rev. Sci. Instrum. 86, 123305 (2015)
defined by
ξmn ≡AR2
0
x2mnS
S
dl���
δψmnδn
���2
da|ψmn|2
, (22)
where ψmn is the TMnm0 solution to the field equations.δψmn/δn is the normal derivative of the field at the cavitysurface. The closed line integral in the numerator is aroundeach cavity surface, and the summation is over all internalcavity surfaces except the ends. Note that the ends areaccounted for by the 1 in the denominator of Eq. (21).ξ01 = 1 for an empty cavity.
Because the model and reference cavities are operatingat the same frequency and temperature, their skin depth isidentical. Noting S/2A = 1/R for a circular cross section, theratio of quality factors can be expressed as
QQ0=
1 + αRR0
1 + ξ01α, (23)
where α = d/R is the aspect ratio of the model cavity (seeFig. 2). ξ01 in the denominator is that of the model cavity,which can be rewritten using Eq. (19) as
ξ01 =c2R3
8π2Λ2
S
dl���
δψ01δn
���2
da |ψ01|2
. (24)
The field solution is always scalable, so the integrals in thenumerator are proportional to 1/R and the integral in thedenominator is proportional to R2. ξ01 is therefore observedto be a scalable value, with the numerator and denominator
both proportional to R2. Utilizing Eq. (19), we can rewrite Eq.(23) as a scalable equation (except for the aspect ratio),
QQ0=
1 + α ΛK01
1 + ξ01α, (25)
with
K01 ≡x01c2π
. (26)
Equations (19)–(26) show that the figure of merit (F ) isa scalable value except for the cavity aspect ratio (α). Theresults of this study are valid for any cavity with an aspectratio of d/R ≈ 5. From Eq. (25), we derive the result for thefigure of merit due to varying the aspect ratio as
F2 = F1
(K01Λ+ α2
)(1 + α2ξ01)
(1 + α1ξ01)(K01Λ+ α1
) 14
, (27)
where αi is the aspect ratio of the respective cavities. Toconvert the figures of merit from this study to that of a cavitywith a differing aspect ratio, α1 = 5, α2 is the aspect ratioof the fabricated cavity, F1 is the figure of merit at a givefrequency from the study, and 3 . ξ01 . 7.
The normalization also accounts for modifications of Qdue to temperature. At low temperatures, the conductivity ofcopper improves which increases Q, and the copper surfacesenter the anomalous skin depth regime which eventually stopsQ from further increasing.28 The Q of both the model cavityand the reference cavity (Q0) would change proportionately,keeping their ratio a constant. The antenna coupling is also
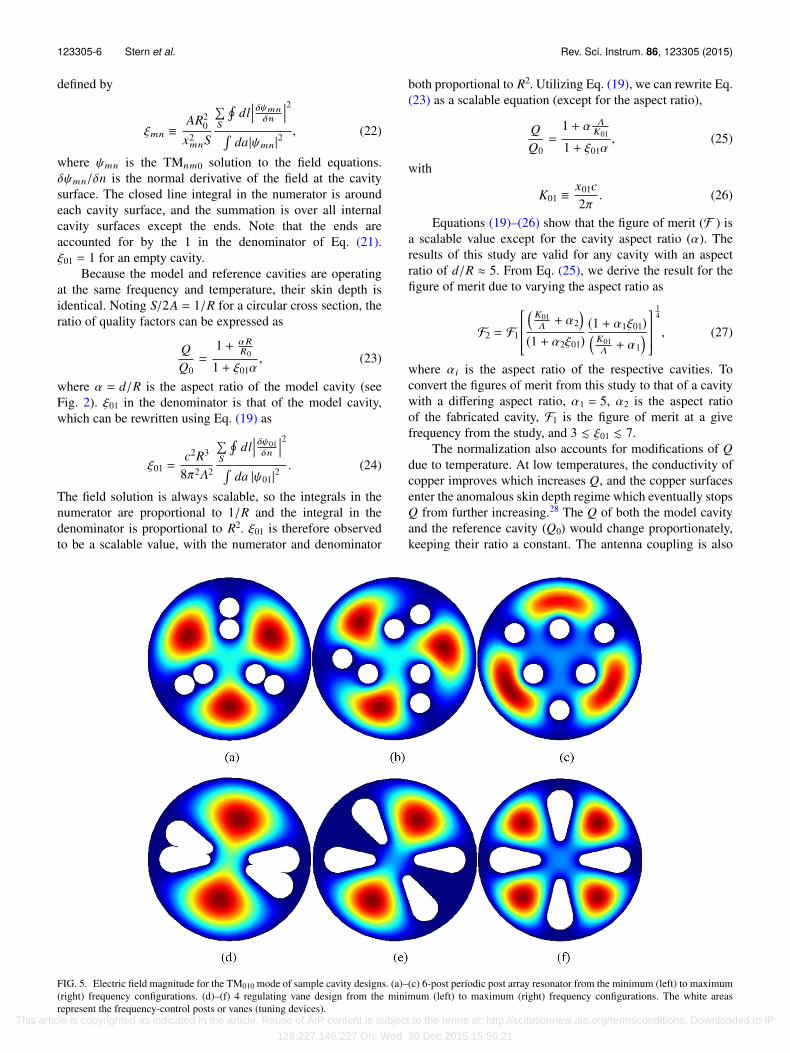
FIG. 5. Electric field magnitude for the TM010 mode of sample cavity designs. (a)–(c) 6-post periodic post array resonator from the minimum (left) to maximum(right) frequency configurations. (d)–(f) 4 regulating vane design from the minimum (left) to maximum (right) frequency configurations. The white areasrepresent the frequency-control posts or vanes (tuning devices).
This article is copyrighted as indicated in the article. Reuse of AIP content is subject to the terms at: http://scitationnew.aip.org/termsconditions. Downloaded to IP:
128.227.146.227 On: Wed, 30 Dec 2015 15:50:21
123305-7 Stern et al. Rev. Sci. Instrum. 86, 123305 (2015)
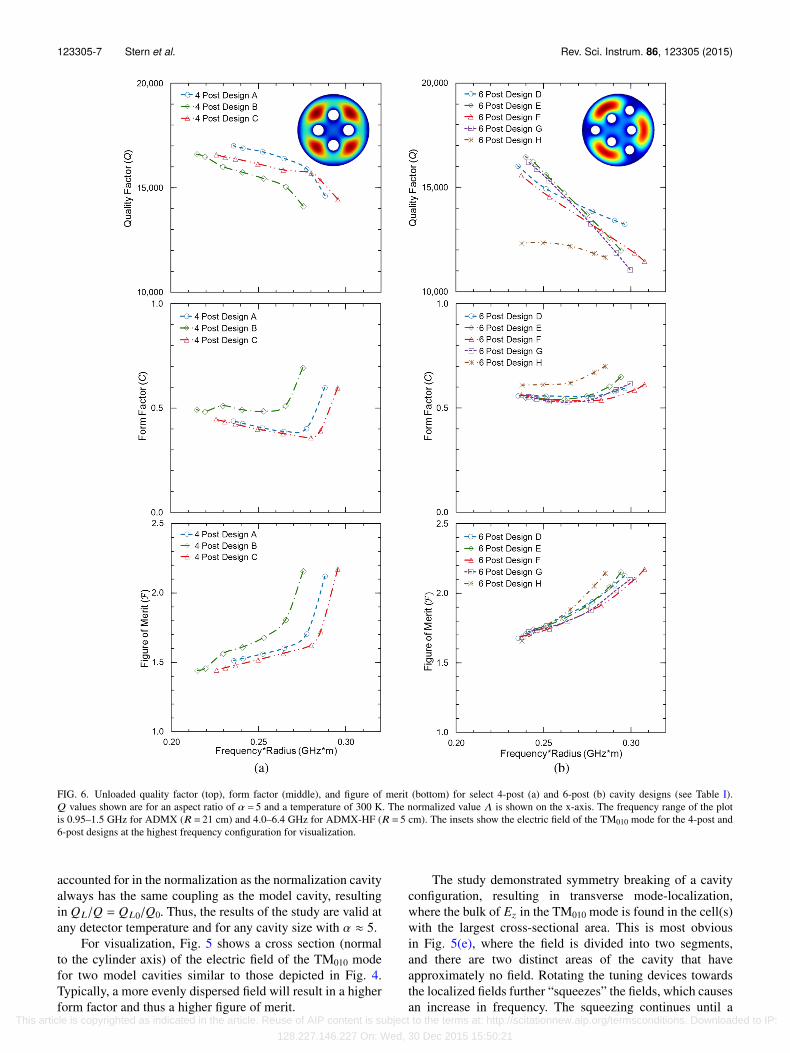
FIG. 6. Unloaded quality factor (top), form factor (middle), and figure of merit (bottom) for select 4-post (a) and 6-post (b) cavity designs (see Table I).Q values shown are for an aspect ratio of α = 5 and a temperature of 300 K. The normalized value Λ is shown on the x-axis. The frequency range of the plotis 0.95–1.5 GHz for ADMX (R = 21 cm) and 4.0–6.4 GHz for ADMX-HF (R = 5 cm). The insets show the electric field of the TM010 mode for the 4-post and6-post designs at the highest frequency configuration for visualization.
accounted for in the normalization as the normalization cavityalways has the same coupling as the model cavity, resultingin QL/Q = QL0/Q0. Thus, the results of the study are valid atany detector temperature and for any cavity size with α ≈ 5.
For visualization, Fig. 5 shows a cross section (normalto the cylinder axis) of the electric field of the TM010 modefor two model cavities similar to those depicted in Fig. 4.Typically, a more evenly dispersed field will result in a higherform factor and thus a higher figure of merit.
The study demonstrated symmetry breaking of a cavityconfiguration, resulting in transverse mode-localization,where the bulk of Ez in the TM010 mode is found in the cell(s)with the largest cross-sectional area. This is most obviousin Fig. 5(e), where the field is divided into two segments,and there are two distinct areas of the cavity that haveapproximately no field. Rotating the tuning devices towardsthe localized fields further “squeezes” the fields, which causesan increase in frequency. The squeezing continues until a
This article is copyrighted as indicated in the article. Reuse of AIP content is subject to the terms at: http://scitationnew.aip.org/termsconditions. Downloaded to IP:
128.227.146.227 On: Wed, 30 Dec 2015 15:50:21
123305-8 Stern et al. Rev. Sci. Instrum. 86, 123305 (2015)
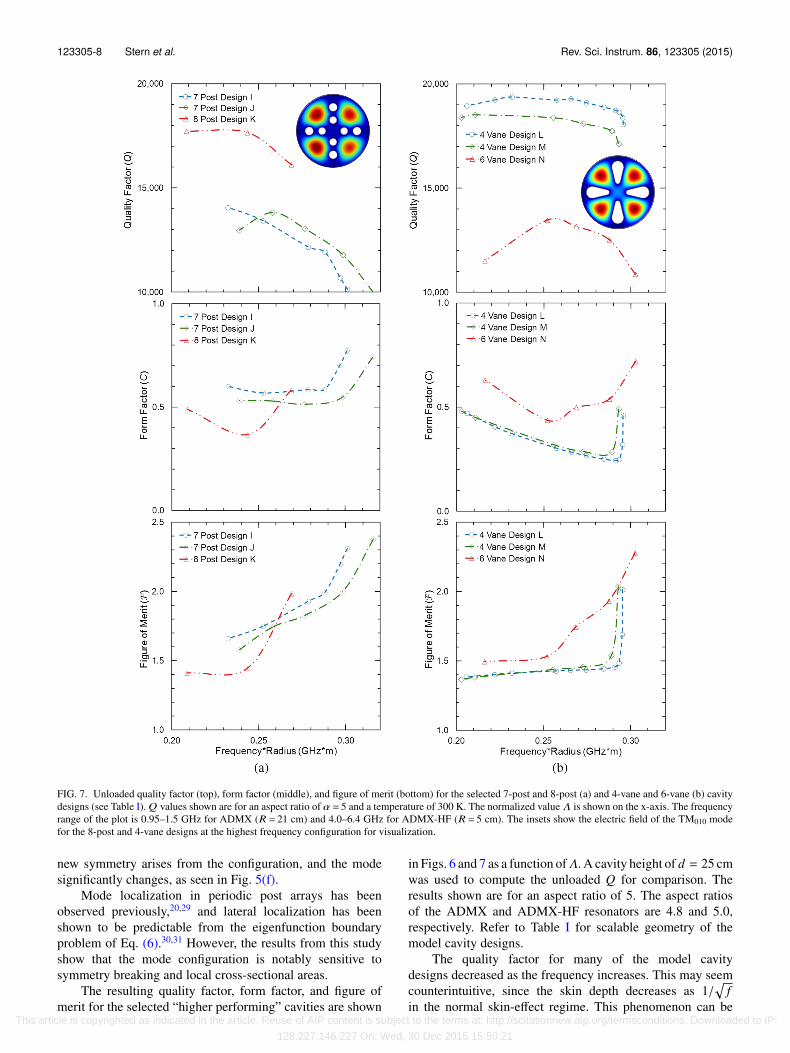
FIG. 7. Unloaded quality factor (top), form factor (middle), and figure of merit (bottom) for the selected 7-post and 8-post (a) and 4-vane and 6-vane (b) cavitydesigns (see Table I). Q values shown are for an aspect ratio of α = 5 and a temperature of 300 K. The normalized value Λ is shown on the x-axis. The frequencyrange of the plot is 0.95–1.5 GHz for ADMX (R = 21 cm) and 4.0–6.4 GHz for ADMX-HF (R = 5 cm). The insets show the electric field of the TM010 modefor the 8-post and 4-vane designs at the highest frequency configuration for visualization.
new symmetry arises from the configuration, and the modesignificantly changes, as seen in Fig. 5(f).
Mode localization in periodic post arrays has beenobserved previously,20,29 and lateral localization has beenshown to be predictable from the eigenfunction boundaryproblem of Eq. (6).30,31 However, the results from this studyshow that the mode configuration is notably sensitive tosymmetry breaking and local cross-sectional areas.
The resulting quality factor, form factor, and figure ofmerit for the selected “higher performing” cavities are shown
in Figs. 6 and 7 as a function of Λ. A cavity height of d = 25 cmwas used to compute the unloaded Q for comparison. Theresults shown are for an aspect ratio of 5. The aspect ratiosof the ADMX and ADMX-HF resonators are 4.8 and 5.0,respectively. Refer to Table I for scalable geometry of themodel cavity designs.
The quality factor for many of the model cavitydesigns decreased as the frequency increases. This may seemcounterintuitive, since the skin depth decreases as 1/
f
in the normal skin-effect regime. This phenomenon can be This article is copyrighted as indicated in the article. Reuse of AIP content is subject to the terms at: http://scitationnew.aip.org/termsconditions. Downloaded to IP:
128.227.146.227 On: Wed, 30 Dec 2015 15:50:21
123305-9 Stern et al. Rev. Sci. Instrum. 86, 123305 (2015)
explained using Eq. (24). The tuning devices squeeze Ez
as the mode frequency increases, as discussed above. Thesqueezing decreases
da |ψ01|2 while increasing δψ01/δn,
which increases ξ01. This effect dominates the gain fromthe reduction in skin depth, resulting in lowering of Q asthe frequency increases. The squeezing effect can also beinterpreted a change to the effective volume to surface arearatio. Note that Q for an empty cavity is proportional to f −2/3
in ASE.The loss in Q with frequency is most noticeable in the
6-post designs, where the squeezing of the electric field ismost visible (see Figs. 5(a)–5(c)). Q is almost constant withfrequency for the 4-vane designs, and the squeezing of the fieldis less obvious. The rapid drop in the Q of the 4-vane cavitynear the highest frequency is due to the field configurationchanging from two cells (see Fig. 5(e)) to four cells (seeFig. 5(f)), which causes a rapid increase in the summation ofδψ01/δn with a small increase in frequency.
In general, the form factor of a cavity grows as Ez
fills a larger area of the cross section. This often occurredat the frequency extremes of the cavities because, at theextremes, the field would maximize its area in differingconfigurations (see Fig. 5). During the frequency transitions,the field occupies a smaller area, causing C to be smaller atthe mid-frequency configurations.
The phenomenon is most noticeable in the 4-vane designs.In the minimum frequency configuration (Fig. 5(d)), Ez isseparated into 2 cells and occupies most of the cavity volumearound the vanes. During the frequency transition (Fig. 5(e)),the two cells are squeezed and there are noticeable locationswhere no field is present. The unfilled sections cause the formfactor to decrease. Near the maximum frequency configuration(Fig. 5(f)), the field separates into 4 cells, filling the volume ofthe cavity rapidly with the configuration change. This causesthe sharp increase in C at the high-frequency end of the 4-vanecavities.
The 4-post, 7-post, 8-post, and 6-vane designs alsodemonstrate the phenomenon to varying amounts, but the6-post design does not. This is because the Ez field of the6-post cavity maintains 3 sections throughout the frequencyrange, avoiding any sudden change in field area. The studyshowed that the highest F most commonly resulted in cavitydesigns that maximized C at the frequency extremes. Notethat many of the designs that were not selected as the “best”did not have high fill volumes at the extremes, resulting in aless-than-optimum design.
Small local increases in the Q and C curves are typicallya result of a field transition. However, transition points can bechallenging for field simulations and convergence difficultiesmay exaggerate the bumps to some extent.
The figure of merit is derived directly from the computedQ and C values using Eq. (18). Because F is proportionalto C1/2 and Q1/4, the form factor dominates F . The figureof merit also increases with frequency because the volumeof the reference cavity, V0, is proportional to 1/ f 2. Thiseffect mirrors the scan rate proportionality of gaγγ4/m2
a inEq. (15).
Combining the power from multiple, equivalent cavitiesin-phase increases the signal power by the number of cavities.
The number of identical empty cavities needed to equal thesearching capability of the model cavities in the study wouldbe F 2 when combined coherently (frequency locked), and F 4
when combined incoherently. So, with a figure of merit of 2,a multi-post/vane cavity has the equivalent searching abilityof 4 empty cavities with equivalent height combined in phase,not accounting for any broadening of the bandwidth due tofrequency mismatch or power loss due to phase incoherence.Conducting a search with multiple empty cavities is notpractical, as they cannot be tuned, but this comparison isuseful to show equivalency.
The results show that both tuning methods significantlyincreased the TM010 frequency while maintaining reasonableF values. In general, the periodic post array designsperformed moderately better than the regulating vanes. Whilethe number of posts has a noticeable impact on performance,there was marginal gain recovered by optimizing the geometryof a specific design. No single point design showed a distinctimprovement in sensitivity. Cavities with the most evenlydistributed electric field throughout the frequency tuning rangemaintained the highest F .
IV. CONCLUSION
This cavity design study showed that a significantincrease in tuning range with acceptable detection parameterswas achievable with periodic post array resonators andregulating vanes. While there were notable differencesamong the configurations simulated, modest improvements insensitivity could be obtained from many designs. Both designconfigurations (posts or vanes) could be used to developmicrowave cavities for dark matter axion searches with ahaloscope detector.
Several designs demonstrated a sensitivity gain ofapproximately 1.5-2.0 over that of a single empty cavity,which translates into a factor of 5-16 improvement in thescan rate. To match the searching capabilities of the higher-performing cavities depicted in the results, an axion scanwould need to combine the power from approximately fourcavities of equivalent length with one small tuning rodwhen frequency locked or approximately eight such cavitiesincoherently.
No single design proved far superior to all others. Choicesthen fall back on cost of fabrication, and sensitivity offrequency range and F to misalignments. Typically, posts areless expensive to fabricate than vanes due to their simplisticdesign. Vanes also have an orientation requirement that postsdo not, increasing the sensitivity and complexity of assemblyof the regulating vanes over that of the periodic post arrayresonators.
ACKNOWLEDGMENTS
I.S. acknowledges support by the U.S. Departmentof Defense through the National Defense Science andEngineering Graduate Fellowship Program and the NationalAeronautics and Space Administration through the FloridaSpace Research Program. This work was supported in part by
This article is copyrighted as indicated in the article. Reuse of AIP content is subject to the terms at: http://scitationnew.aip.org/termsconditions. Downloaded to IP:
128.227.146.227 On: Wed, 30 Dec 2015 15:50:21
123305-10 Stern et al. Rev. Sci. Instrum. 86, 123305 (2015)
the Department of Energy under Grant No. DE-SC0010280at the University of Florida and under Contract No. DEAC52-07NA27344 at Lawrence Livermore National Laboratory, andin part by the National Science Foundation under Grant No.PHY-1306729 at the University of California Berkeley.
1R. Peccei and H. Quinn, Phys. Rev. Lett. 38, 1440 (1977).2S. Weinberg, Phys. Rev. Lett. 40, 223 (1978).3F. Wilczek, Phys. Rev. Lett. 40, 279 (1978).4J. Ipser and P. Sikivie, Phys. Rev. Lett. 50, 925 (1983).5J. Beringer et al., (Particle Data Group), Phys. Rev. D 86, 010001(2012).
6A. Arvanitaki, S. Dimopoulos, S. Dubovsky, N. Kaloper, and J. March-Russell, Phys. Rev. D 81, 123530 (2010).
7P. Sikivie, Phys. Rev. Lett. 51, 1415 (1983).8H. Primakoff, Phys. Rev. 81, 899 (1951).9The CERN Axion Solar Telescope (CAST) uses the inverse Primakoffeffect in a helioscope to search for relativistic axions that emerge fromthe S. M. Arik et al., (CAST Collaboration), Phys. Rev. Lett. 107, 261302(2011).
10P. Sikivie, Phys. Rev. D 32, 2988 (1985).11J. Preskill, M. B. Wise, and F. Wilczek, Phys. Lett. B 120, 127 (1983).12L. Abbott and P. Sikivie, Phys. Lett. B 120, 133 (1983).13M. Dine and W. Fischler, Phys. Lett. B 120, 137 (1983).14M. S. Turner, Phys. Rep. 197, 67 (1990).15J. E. Kim, Phys. Rev. Lett. 43, 103 (1979).16M. A. Shifman, A. I. Vainshtein, and V. I. Zakharov, Nucl. Phys. B 166, 493
(1980).
17A. R. Zhitnitsky, Sov. J. Nucl. Phys. 31, 260 (1980).18M. Dine, W. Fischler, and M. Srednicki, Phys. Lett. B 104, 199 (1981).19L. J. Rosenberg and K. A. van bibber, Phys. Rep. 325, 1 (2000).20C. Hagmann, P. Sikivie, N. S. Sullivan, D. B. Tanner, and S. I. Cho, Rev.
Sci. Instrum. 61, 1076 (1990).21C. Hagmann, D. Kinion, W. Stoeffl, K. van bibber, E. J. Daw, H. Peng, L.
J. Rosenberg, J. Laveigne, P. Sikivie, N. S. Sullivan, D. B. Tanner, F. A.Nezrick, M. S. Turner, D. M. Moltz, J. Powell, and N. A. Golubev, Phys.Rev. Lett. 80, 2043 (1998).
22S. Asztalos, E. J. Daw, H. Peng, L. J. Rosenberg, C. Hagmann, D. Kinion, W.Stoeffl, K. van bibber, J. Laveigne, P. Sikivie, N. S. Sullivan, D. B. Tanner, F.A. Nezrick, M. S. Turner, and D. M. Moltz, Astrophys. J. 571, L27 (2002).
23S. J. Asztalos, G. Carosi, C. Hagmann, D. Kinion, K. van bibber, M. Hotz,L. J. Rosenberg, G. Rybka, J. Hoskins, J. Hwang, P. Sikivie, D. B. Tanner,R. Bradley, and J. Clarke, Phys. Rev. Lett. 104, 041301 (2010).
24J. Hoskins, J. Hwang, C. Martin, P. Sikivie, N. S. Sullivan, D. B. Tanner, M.Hotz, L. J. Rosenberg, G. Rybka, A. Wagner, S. J. Asztalos, G. Carosi, C.Hagmann, D. Kinion, K. van bibber, R. Bradley, and J. Clarke, Phys. Rev.D 84, 121302(R) (2011).
25J. Jackson, Classical Electrodynamics, 3rd ed. (John Wiley & Sons, NewJersey, 1999), pp. 363–374.
26R. H. Dicke, Rev. Sci. Instrum. 17, 268 (1946).27L. Krauss, J. Moody, F. Wilczek, and D. E. Morris, Phys. Rev. Lett. 55, 1797
(1985).28A. B. Pippard, Proc. R. Soc. A 191, 385 (1947).29M. Bayindir et al., Phys. Rev. B 64, 195113 (2001).30S. A. Nazarov, Math. Bohemica 127, 283 (2002).31G. Cardone, T. Durante, and S. A. Nazarov, SIAM J. Math. Anal. 42, 2581
(2010).
This article is copyrighted as indicated in the article. Reuse of AIP content is subject to the terms at: http://scitationnew.aip.org/termsconditions. Downloaded to IP:
128.227.146.227 On: Wed, 30 Dec 2015 15:50:21


![[Axion]Research Poster](https://img.pdfslide.net/doc/110x75/587b76431a28abc62f8b6693/axionresearch-poster.jpg)